1. Introduction
Within the broader context of Earth observation, optical remote sensing change detection (CD) has emerged as a vital analytical tool. By analyzing multi-temporal remote sensing imagery to identify dynamic variations in land surface features, CD plays an indispensable role and offers substantial practical value in environmental monitoring, disaster assessment, urban planning, and cropland protection. Multi-temporal data, characterized by rich time-series information, long-term monitoring suitability, and strong data fusion capabilities, provide sophisticated information layers for CD. However, leveraging such data also entails critical challenges, including high processing complexity, difficulties in multi-scale information fusion, and inadequate algorithmic adaptability. Specifically, achieving a balance between global change trends and local structural details during multi-scale feature integration remains a primary bottleneck restricting detection accuracy [
1,
2].
Traditional machine learning methods represent early research directions in optical CD, primarily categorized into pixel-based and object-based approaches. Early analytical paradigms often evaluate pixel-to-pixel variations to isolate dynamic areas, leveraging techniques like Slow Feature Analysis (SFA) [
3], Principal Component Analysis (PCA) [
4], and Change Vector Analysis (CVA) [
5]. Conversely, entity-centric strategies focus on the structural and spectral properties of grouped geographical targets, utilizing metrics such as image correlation [
6] and KL divergence [
7]. Alongside these approaches, various probabilistic frameworks and classification algorithms—ranging from Decision Trees (DTs) [
8] and Support Vector Machines (SVMs) [
9,
10] to Conditional Random Fields (CRF) [
11] and Markov Random Fields (MRF) [
12]—have seen widespread adoption. However, these methods rely heavily on handcrafted features, rendering the management of complicated multi-temporal and multi-source datasets highly challenging. Moreover, their inherent inadequacy in capturing multi-scale characteristics and resolving intricate spatial geometries acts as a major bottleneck for high-resolution (HR) remote sensing CD applications [
13].
Driven by the rapid evolution of deep learning, data-driven frameworks have fundamentally superseded conventional heuristic techniques in optical change detection (CD). Deep architectures, encompassing Convolutional Neural Networks (CNNs) [
14,
15,
16], Generative Adversarial Networks (GANs) [
17], and Recurrent Neural Networks (RNNs) [
18], have revolutionized the domain by enabling automated, end-to-end representation learning with significantly enhanced detection efficacy. Among these, convolutional paradigms possess an inherent superiority in distilling fine-grained spatial characteristics, effectively isolating critical local cues such as structural boundaries and textural variations [
19,
20,
21]. Building upon this localized perception, researchers have continuously diversified network configurations to handle bi-temporal inputs more adaptively. For instance, Siamese-based topological designs have been utilized to tackle unsupervised CD scenarios [
22], while semi-supervised paradigms like SemiCDNet were formulated to mitigate the heavy reliance on extensive annotations [
23]. To further enrich feature discriminability, subsequent studies have successfully integrated cross-axis attention mechanisms with multi-layer perceptrons [
24] and deployed 3D-convolutional structures to process spatiotemporal contextual data seamlessly [
25]. Moreover, the formulation of sophisticated dual-branch processing pipelines [
26] and multi-level semantic learning strategies [
27] has established a crucial theoretical foundation for accurately aligning cross-temporal dynamics. Alternatively, to overcome the constraints of restricted local receptive fields, Transformer-based frameworks have introduced a paradigm shift. By capitalizing on self-attention mechanisms, these architectures exhibit exceptional proficiency in establishing long-range dependencies and comprehensively perceiving global contextual representations [
28,
29]. This global modeling capability has been extensively exploited to decode the intricate heterogeneous correlations inherent in remote sensing image pairs [
30]. Consequently, a variety of attention-driven networks have emerged, ranging from Siamese Transformers tailored for dynamic scene analysis [
31] to dedicated visual change frameworks like VcT [
32]. Researchers have also sought to enhance these visual transformers by embedding modules such as CBAM to facilitate hierarchical attentive fusion [
33] or designing advanced architectures like GCFormer to better encapsulate holistic semantics [
34]. Recognizing the complementary strengths of these approaches, recent advancements have increasingly focused on the synergistic integration of convolutional and Transformer paradigms to push the boundaries of detection performance. Concurrently, to overcome the representational bottlenecks inherent in single-scale extraction mechanisms, sophisticated multi-scale feature aggregation strategies have been meticulously investigated, ensuring a more resilient and comprehensive perception of dynamic variations across complex environments. Specifically, a hybrid architecture combining convolutional and self-attention mechanisms at multiple scales was introduced by Jiang et al. [
35]. In a related context, Feng et al. [
36] facilitated feature refinement through both intra-level communication and cross-level aggregation. Furthermore, the synthesis of hierarchical difference representations was highlighted in the work of Luo et al. [
37]. Guo et al. [
38] proposed a Multi-scale Spatial-Frequency Fusion Network (MSFNet). Additionally, Huang et al. [
39] adopted a hierarchical fusion strategy combined with a spatiotemporal enhancement mechanism. By integrating multi-scale features to correlate global context with local edge details, these methods have significantly enhanced accuracy and robustness, becoming a focal point of current research.
Recently, the Mamba architecture has been widely applied in the field of remote sensing change detection due to its efficient state-space modeling capability and linear computational complexity, providing a new paradigm for processing complex multi-temporal remote sensing data [
40,
41]. Mamba is built upon selective state-space models, which encode long-range dependencies through input-dependent state transitions with linear computational complexity. Compared with self-attention, this mechanism avoids quadratic token interactions and is therefore suitable for high-resolution remote sensing images [
42]. However, existing Mamba-based remote sensing change detection methods still face critical limitations. However, existing Mamba-based remote sensing change detection methods still face critical limitations. First, single architectures (CNNs, Transformers, or Mamba) struggle to balance local detail preservation, global context modeling, and computational efficiency. Second, conventional bi-temporal differencing strategies are often noise-sensitive or fail to effectively highlight changed regions. Third, simple upsampling in multi-scale fusion causes spatial detail degradation due to hierarchical semantic gaps. Moreover, existing global scanning mechanisms often blend local change features with background noise, restricting fine-grained perception and falling short of the refined requirements for high-resolution imagery.
In recent years, sophisticated feature augmentation techniques have emerged for analyzing hyperspectral and multimodal earth observation data. To illustrate, the SFIEET framework [
43] dynamically sharpens boundary details utilizing spectral-frequency enrichment. Concurrently, Sun et al. [
44] introduced an innovative reconstruction framework that embeds dynamic convolutional operations and tensor decomposition within a spectral-aware self-attention mechanism. This design offers profound methodological inspiration for bi-temporal analysis, thereby elevating the algorithmic capability to discriminate subtle, fine-grained variations within hyperspectral data cubes. Furthermore, to address highly heterogeneous environments, another recent investigation [
45] demonstrated the efficacy of multimodal synergy. By coupling hierarchical convolutional extractors with a cross-attention-modulated Mamba module, their approach systematically aligns hyperspectral profiles with LiDAR topographic features. Consequently, this tailored architecture ensures a highly efficient aggregation of localized geometric traits and broader contextual dependencies. Collectively, such technological strides indicate that harmonizing linear-complexity state-space models, global-receptive Transformers, and refined multi-scale or frequency-domain augmentations fundamentally fortifies perceptual acuity and resilience in complicated detection tasks. Ultimately, seamlessly integrating these diverse architectural strengths establishes an exceptionally viable and forward-looking pathway for executing intricate earth monitoring missions at fine spatial resolutions.
Motivated by the previously identified limitations, this research formulates an advanced analytical framework termed LADENet for tracking surface dynamics in bi-temporal optical imagery. This methodology is specifically engineered to overcome existing bottlenecks by synergizing a customized local adaptive state-space mechanism with hierarchical representation refinement. By integrating CNN, Transformer, and Mamba, we construct a multi-level CD framework comprising a hierarchical Transformer encoder, a State-Space Scanning (SSS)-based Dual Spatio-Temporal Adaptive Local Token (DS-TALT) module, a Dual-Branch Difference Enhancement (DBDE) module, and a Global Cross-Scale Feature Fusion (GCSFF) decoder. This builds a comprehensive technical pipeline spanning multi-scale feature extraction, adaptive region selection, differential enhancement and cross-level fusion, effectively solving the problems of existing methods, such as insufficient collaborative modeling of local details and global context, single bi-temporal differencing method, and lack of effective interaction in multi-scale feature fusion. Extensive experiments on four benchmark datasets verify that LADENet achieves advanced performance with a satisfactory efficiency-accuracy trade-off on four benchmark datasets. The primary innovations of this research are outlined as follows:
- (1)
We formulate a hierarchical bi-temporal analysis architecture that synergistically integrates convolutional, attention-based, and state-space (Mamba) paradigms. To navigate the inherent trade-offs between holistic spatial perception and computational overhead, the encoding module incorporates a dedicated sequence contraction strategy. This design facilitates the extraction of multi-level representations while substantially curtailing resource consumption, thereby ensuring an optimal equilibrium between long-range dependency modeling and the execution efficiency required for high-resolution imagery.
- (2)
We design a Dual Spatio-Temporal Adaptive Local Token module based on state-space scanning. It employs a sliding score window to filter the K highest-scoring regions for precise localization and enhancement. A sliding window boundary calibration mechanism is introduced using diagonal cyclic shifting to alleviate spatial information loss caused by window partitioning. Furthermore, cross-temporal state-space scanning is integrated to achieve spatio-temporal fusion with linear complexity under pixel-level temporal alignment.
- (3)
We construct a Dual-Branch Difference Enhancement module that captures global-local change information through the synergy of attention and multi-scale convolutions. Additionally, a Global Cross-Scale Decoder is designed to realize refined feature fusion and resolution restoration through the dual paths of Visual State-Space (VSS) and spatial attention.
- (4)
Comprehensive empirical validations executed across four established benchmark archives (LEVIR-CD, WHU-CD, CLCD-CD, and GVLM-CD) verify that the formulated architecture delivers exceptional dynamic variation identification and segmentation precision within intricate environments, successfully establishing new performance baselines that surpass contemporary cutting-edge approaches.
2. Materials and Methods
2.1. Overall Framework
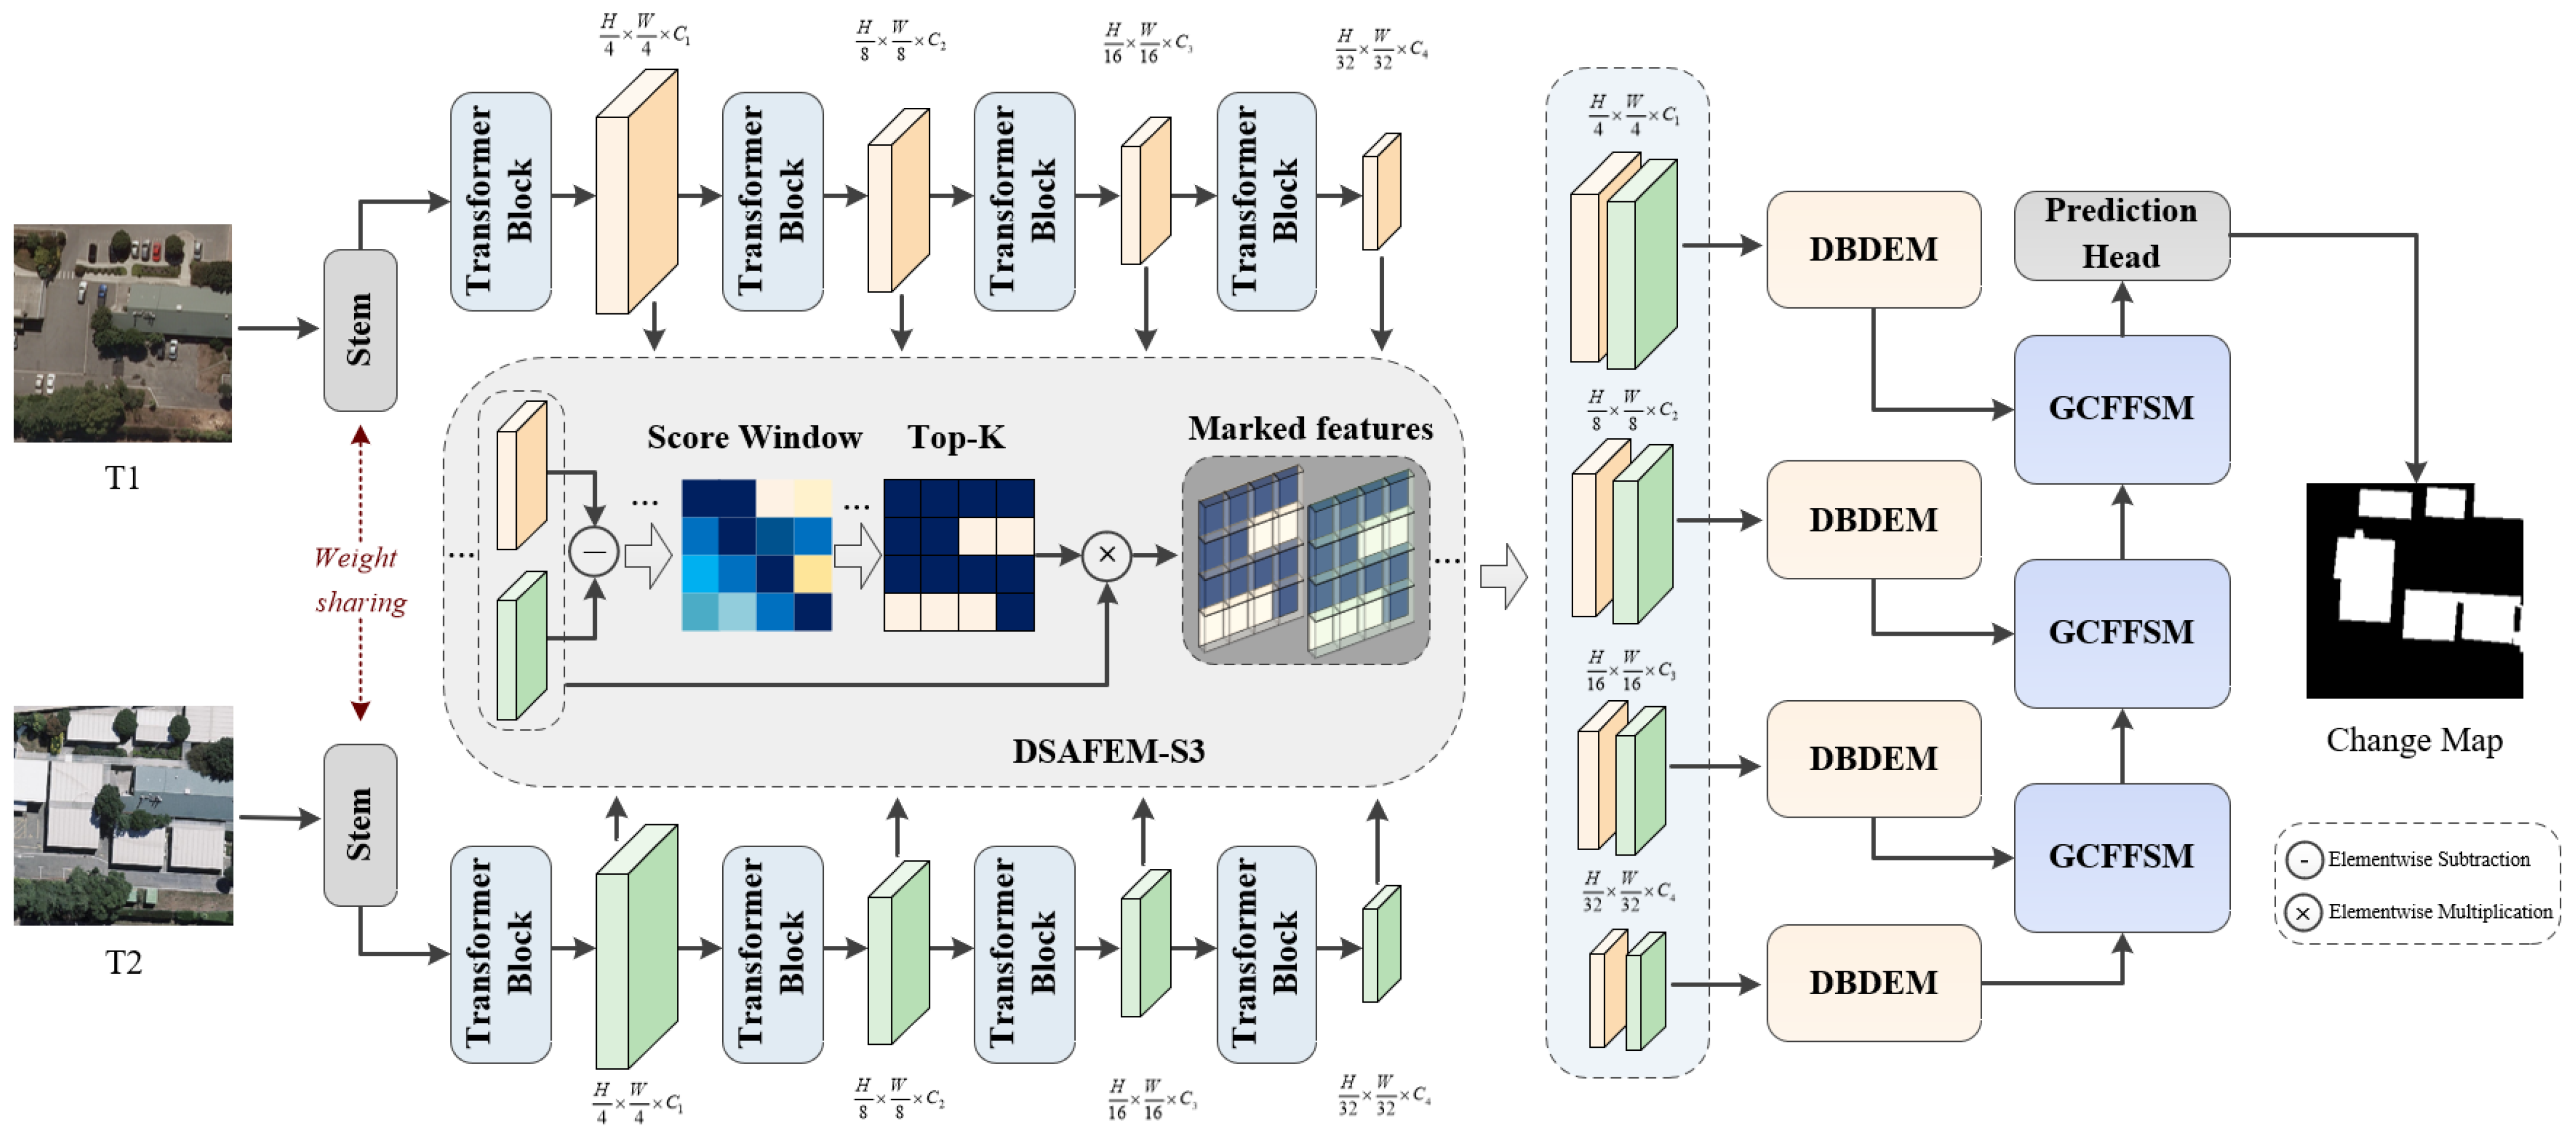
This section proposes a change detection framework that integrates CNNs, Transformers, Mamba, and attention mechanisms. The overall framework is illustrated in
Figure 1. The framework takes remote sensing images at times
and
as inputs. These images sequentially undergo feature extraction and enhancement operations. A weight-sharing feature extraction network is employed to ensure consistency in the modeling of the bi-temporal features. Specifically, the shared network adopts Transformer blocks as its foundational encoding units, given that their self-attention mechanism outperforms the Mamba model in global context modeling and bi-temporal feature alignment. After obtaining the bi-temporal global features across different scales, they are fed into the State-Space Scanning-based Dual Spatio-Temporal Adaptive Local Token module. This module performs a region-wise importance evaluation on the feature maps using a sliding score window, selectively filtering the top-
K highest-scoring regions to generate tokenized feature representations. This design enables the network to effectively focus on local regions with significant changes, thereby enhancing the adaptive perception of land-cover dynamics. Subsequently, the tokenized features at various scales are forwarded to the Dual-Branch Difference Enhancement module. By contrasting the tokenized representations from
and
, this module significantly amplifies the discriminative expression of the changed regions. Proceeding this, the Global Cross-Scale Feature Fusion decoder orchestrates the interplay among multi-level representations. By synthesizing contextual cues drawn from diverse receptive fields, this decoding mechanism substantially fortifies the discriminative power of the extracted patterns associated with dynamic regions. These synthesized hierarchical descriptors are subsequently routed into the prediction head to yield the ultimate classification maps. Ultimately, by seamlessly coupling hierarchical feature encoding, dynamic regional selection, differential augmentation, and inter-scale aggregation, the formulated architecture provides an exceptionally resilient and computationally viable solution for identifying surface transitions within bi-temporal Earth observation data.
2.2. Multi-Level Transformer Encoder
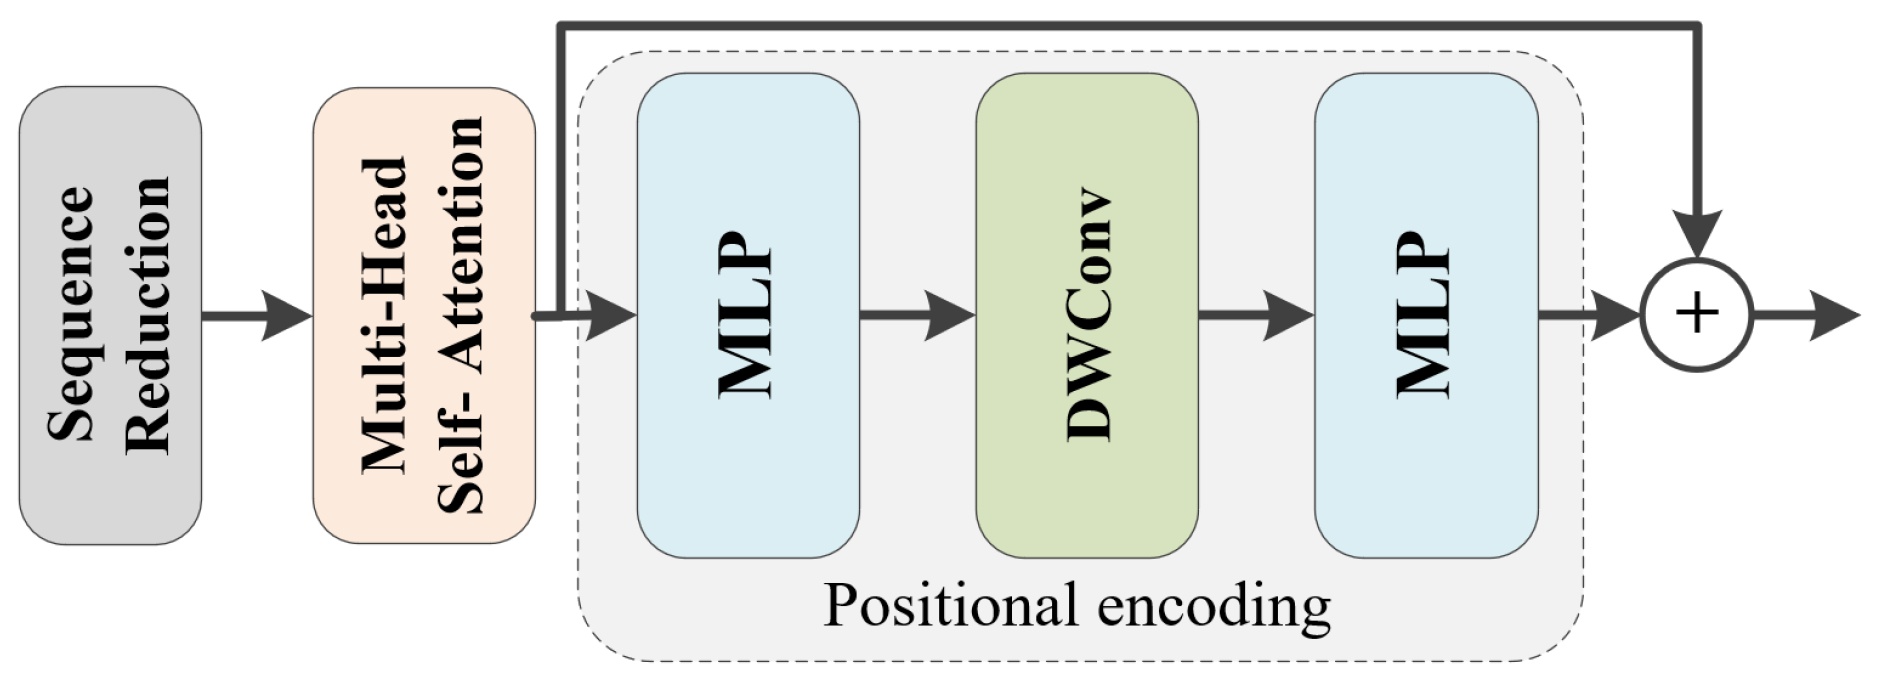
Given the input bi-temporal images, the multi-level Transformer encoder generates multi-level features in a manner analogous to CNNs, extracting both the global high-resolution coarse features and the global low-resolution fine features requisite for change detection. The Transformer module is shown in
Figure 2. Specifically, given a pre-change or post-change image with a spatial resolution of
, the Transformer encoder outputs feature maps
, where
and
. Subsequently, these multi-scale features are further processed by a difference module and then fed into an MLP decoder to yield the final change map.
In this mathematical formulation,
Q,
K, and
V represent the query, key, and value components, respectively, all constrained to a uniform dimensional shape of
. Nonetheless, calculating Equation (
1) imposes a quadratic algorithmic cost of
. Such massive overhead makes it exceptionally impractical to directly process high-resolution visual inputs. To mitigate this computational burden, the proposed model adopts the sequence reduction process introduced in PVT [
46], utilizing a reduction ratio
R to condense the sequence length
. The specific operations are detailed as follows:
In these expressions, the generalized variable
S represents any of the input sequences (
Q,
K, or
V) targeted for length contraction. The transformation relies on
to reconfigure the tensor geometry into a specified spatial layout of
, alongside
, which executes a linear mapping to project
channels into
dimensions. Upon completing these operations, the network produces a compacted set of
Q,
K, and
V descriptors with an updated size of
. Ultimately, this downsampling mechanism successfully curtails the overall execution cost associated with Equation (
1) to
.
To provide positional information for the Transformer, the proposed model employs two MLP layers coupled with a 3 × 3 depthwise separable convolution, formulated as follows:
where
is the feature obtained by the self-attention mechanism and GELU denotes the Gaussian Error Linear Units activation function.
Regarding the downsampling process, given an input feature patch from the i-th Transformer layer with a resolution of , the downsampling layer scales it down to generate with a reduced resolution of . This subsequently serves as the input for the -th Transformer layer. To accomplish this spatial resolution contraction, the architecture integrates a targeted convolutional operation parameterized by a filter scale of , a stepping interval of , alongside a padding margin of .
2.3. Dual Spatio-Temporal Adaptive Local Token Module Based on State-Space Scanning
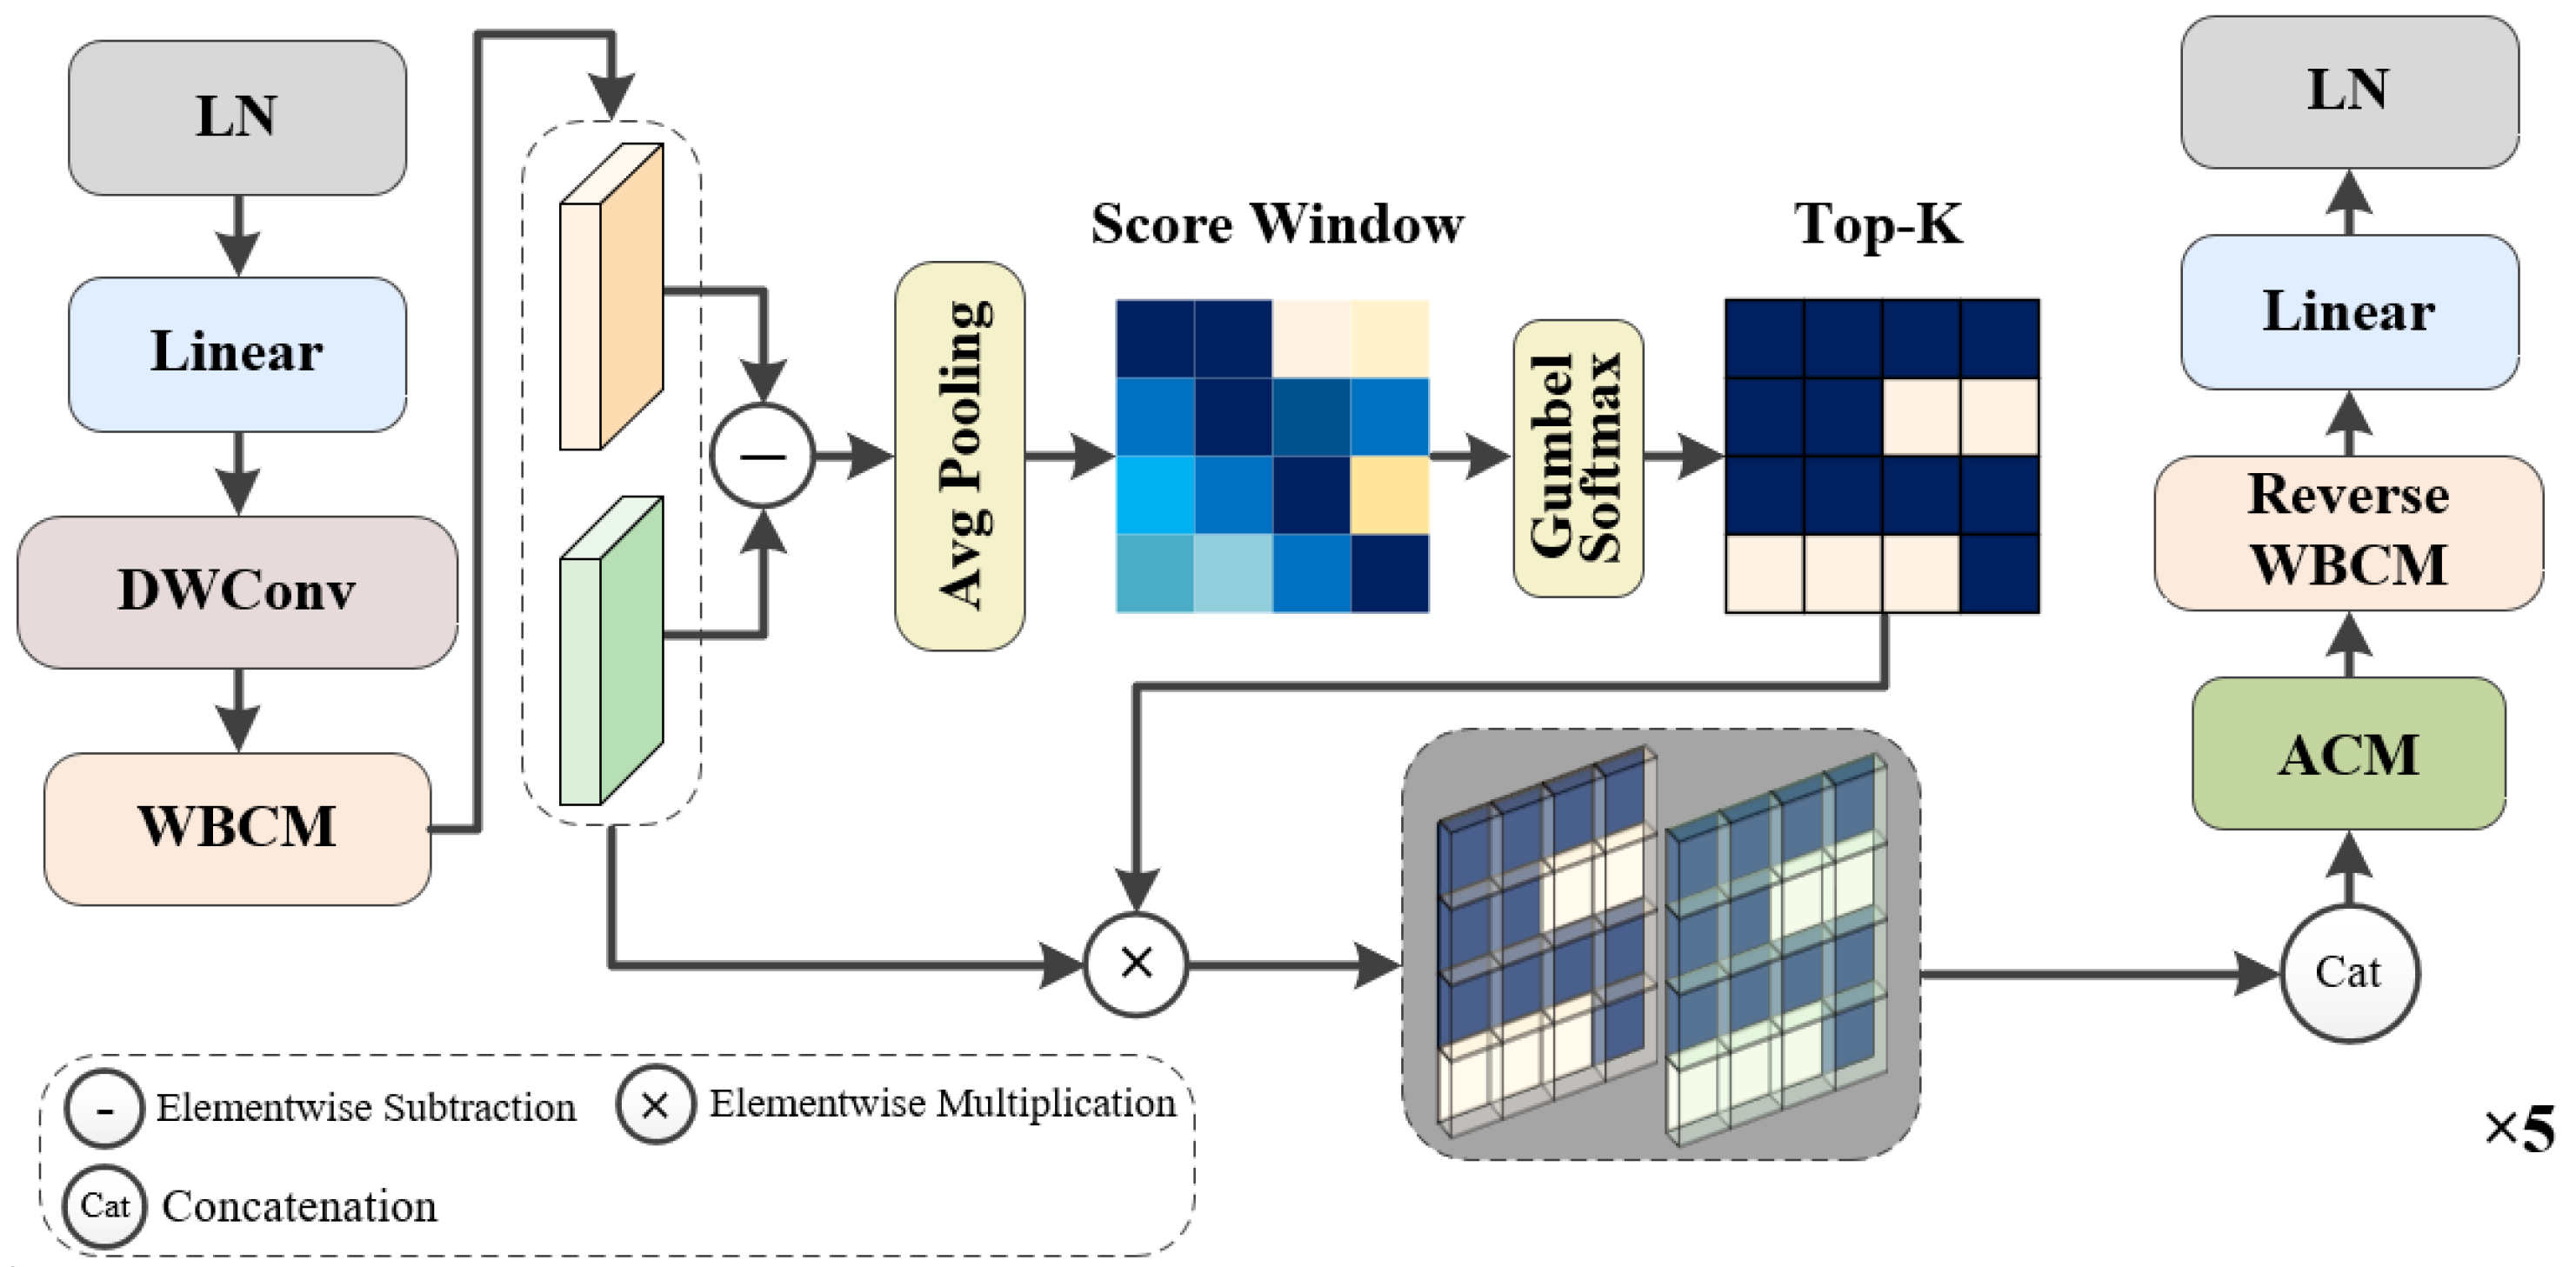
In this subsection, leveraging the robust feature extraction capabilities of Mamba and CNN for imagery, we design a Dual Spatio-Temporal Adaptive Local Token Module Based on State-Space Scanning. This module incorporates a sliding window boundary calibration mechanism alongside an adaptive scanning strategy, as illustrated in
Figure 3,
Figure 4 and
Figure 5.
2.3.1. Adaptive Scanning Strategy
To address the difficulties encountered by existing State-Space Model (SSM)-based RSCD methods in simultaneously preserving the local and global features of remote sensing images, the AS strategy is proposed. As illustrated in
Figure 4, the AS strategy primarily consists of two key steps. First, to coarsely identify regions rich in local details within the feature maps
, the proposed model applies a
average pooling operation to construct score windows. Subsequently, when identifying the top-
k highest-scoring windows, the Gumbel-Softmax function is applied to introduce a differentiable approximation for the discrete selection process:
where
denotes the Gumbel-Softmax operation.
Figure 3.
Framework Diagram of the Dual Spatiotemporal Adaptive Feature Extraction Module Based on State-Space Scanning.
Figure 3.
Framework Diagram of the Dual Spatiotemporal Adaptive Feature Extraction Module Based on State-Space Scanning.
The 4 × 4 score window is adopted as a trade-off between local detail preservation and computational efficiency. A smaller window, such as 2 × 2, can preserve finer spatial details but tends to generate fragmented and noise-sensitive local tokens, whereas a larger window, such as 8 × 8, may cover excessive background pixels and weaken the localization of small changed regions. Therefore, the 4 × 4 setting provides a moderate receptive field for identifying salient local changes while keeping the selected token sequence compact. This setting is used as the default configuration in all experiments.
Second, the model identifies and merges the connected components within these top-k scoring windows to accommodate the varying shapes and sizes of local change regions:
where
denotes the operation of aggregating the connected components into
k connected windows, subsequently followed by an upsampling process. The matrix
comprises the top-
k highest-scoring windows. These windows are re-labeled according to their connected regions, with indices drawn from the set
, whereas the remaining non-top-
k score windows are assigned a fixed value of 0.
Figure 4.
Schematic Diagram of the Adaptive Scanning Strategy.
Figure 4.
Schematic Diagram of the Adaptive Scanning Strategy.
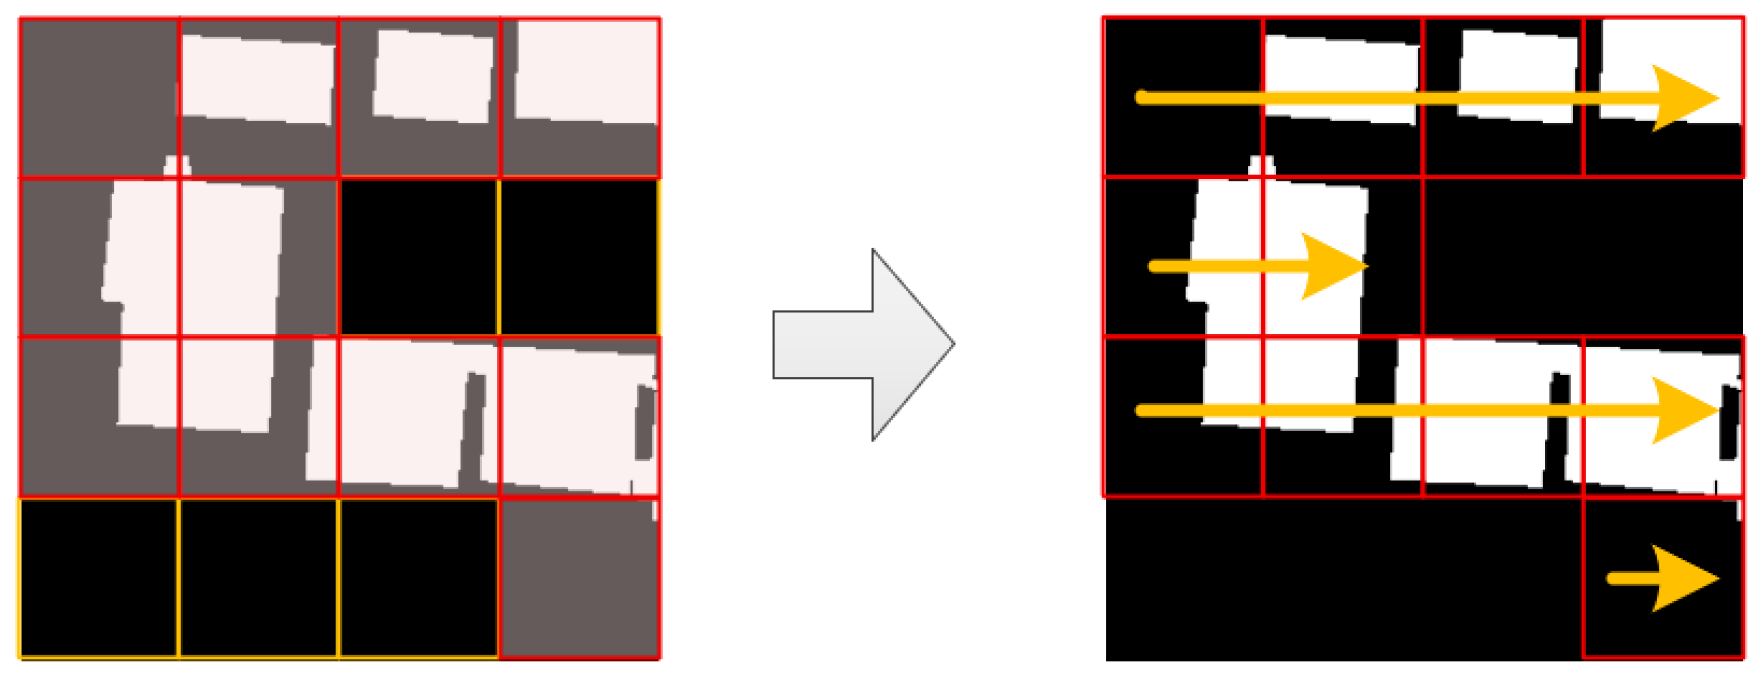
The objective of the final step is to enhance local perception while preserving global awareness. Specifically, the non-top-
k scoring windows are disregarded. Concurrently, the top-
k highest-scoring windows are individually flattened and scanned sequentially (represented by the sequences
, labeled as “1”, “2”, “3” and “4” in
Figure 4). Finally, these individual sequences are concatenated into a unified sequence
S (i.e., in the order of “1-2-3-4”) and subsequently fed into the selective State-Space Model to learn intrinsic relationships. This procedure can be formulated as
where
represents the region assigned with index
, ⊙ denotes element-wise multiplication, and ⨁ indicates sequence concatenation.
2.3.2. Cross-Temporal State-Space Scanning
Inspired by ChangeMamba [
40], the proposed model applies the AS strategy to the bi-temporal inputs (i.e., pre-change and post-change images) of the RSCD task by incorporating it into the Cross-Temporal State-Space Scanning module. For each pair of feature windows
, the model initially flattens them into sequences with a length of
.
To guarantee pixel-level temporal alignment, the CTSS module performs cross-temporal interleaving by alternately arranging the tokens from the two time steps:
This operation ensures that each spatial location
provides a consecutive token pair
, thereby maintaining exact pixel-level correspondence within the 1D sequence. Subsequently, the resulting sequence
is processed by a 1D SSM:
where
represent the learnable parameters. The output tokens are reshaped back into the original
window for each temporal branch:
In this manner, the CTSS module simultaneously encodes spatial contextual information and cross-temporal interaction along a single 1D scan. This mechanism maintains a linear computational complexity of with respect to the number of pixels, while achieving fine-grained pixel alignment without incurring additional memory overhead.
2.3.3. Sliding Window Boundary Calibration Mechanism
Since the AS strategy partitions the feature map into
windows, information loss is inevitable at the boundaries of these partitioned feature windows. To mitigate and compensate for this degradation, we propose the SWBC mechanism, as illustrated in
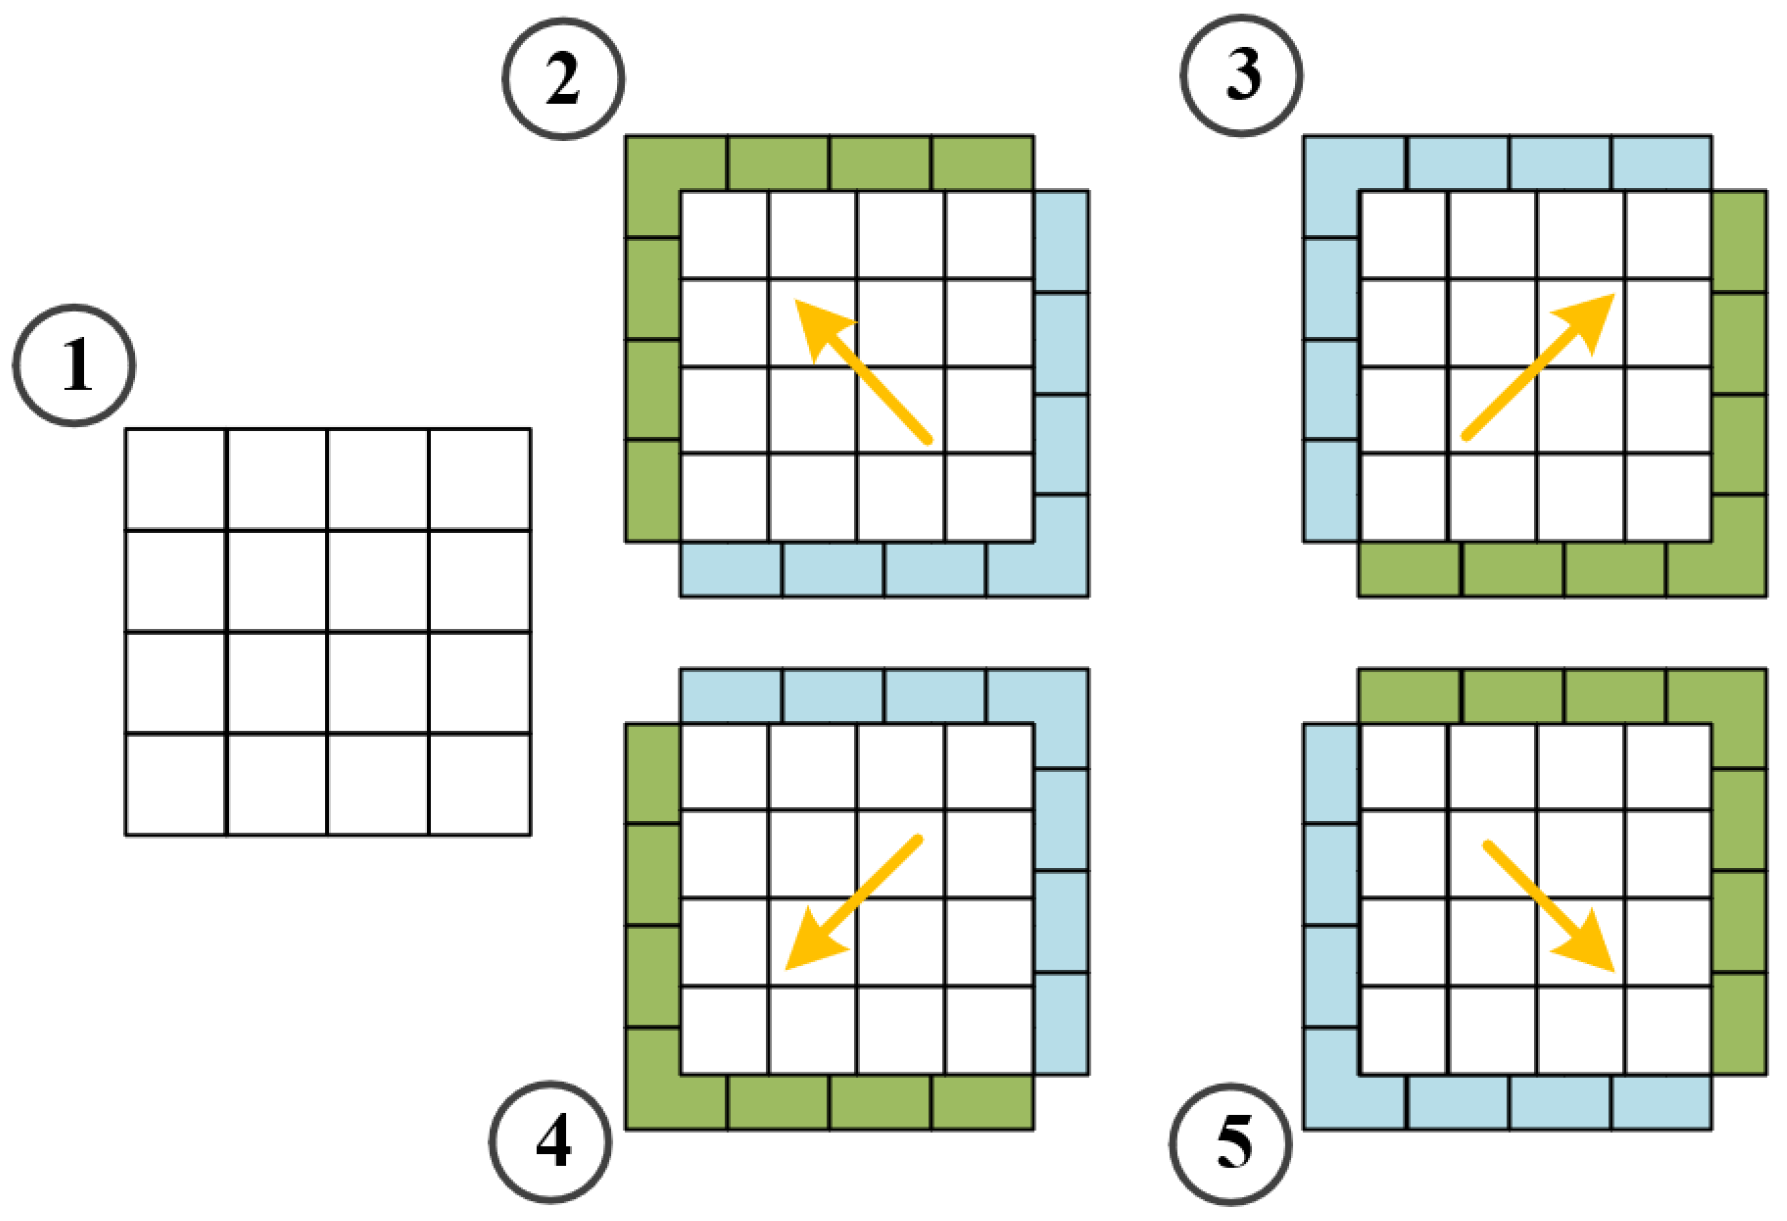
Figure 5. Specifically, we apply the AS operation five times at each spatial scale. The initial AS operation is executed directly on the original feature map. The subsequent four operations cyclically shift the feature map along the diagonal directions of 45°, 135°, 225° and 315° respectively. The displacement magnitude for each shift is set to
of the spatial length of the feature map. Here,
denotes the stage index of the hierarchical Transformer encoder (as detailed in
Section 2.2) that generates the corresponding feature map
.
The five AS operations consist of one original scan and four diagonal shifted scans. The original scan preserves the native spatial layout, while the four diagonal shifts compensate for boundary discontinuities from different directions. Compared with horizontal or vertical shifts alone, diagonal shifts simultaneously change both row and column offsets, enabling more effective coverage of window-boundary pixels. Additional shifts would further increase computational cost and introduce redundant overlapping regions, but provide limited extra boundary compensation. Therefore, the five-scan design offers a practical balance between boundary calibration and efficiency.
Figure 5.
Schematic Diagram of the Sliding Window Boundary Calibration Mechanism.
Figure 5.
Schematic Diagram of the Sliding Window Boundary Calibration Mechanism.
2.4. Dual-Branch Difference Enhancement Module
Currently, conventional methods for generating bi-temporal image difference maps mainly include direct subtraction, addition, concatenation, and various enhancement mechanisms, each of which has inherent limitations. Direct subtraction is susceptible to introducing noise and obscuring subtle variations, which frequently leads to missed detections and false alarms. Conversely, while concatenation preserves channel information, it suffers from poor interpretability and relies heavily on annotated data. To circumvent these formidable constraints, the proposed DBDE mechanism is structured around a bifurcated topology. This dual-branch architecture essentially facilitates the decoupled extraction of holistic macroscopic transitions alongside intricate localized spatial dependencies inherent in the paired observation inputs.
where
denotes the absolute value operation. CBAM represents the Convolutional Block Attention Module (encompassing both spatial and channel attention).
signifies the element-wise addition of the outputs from the three multi-scale convolutions (
,
and
convolutions), and BN stands for Batch Normalization.
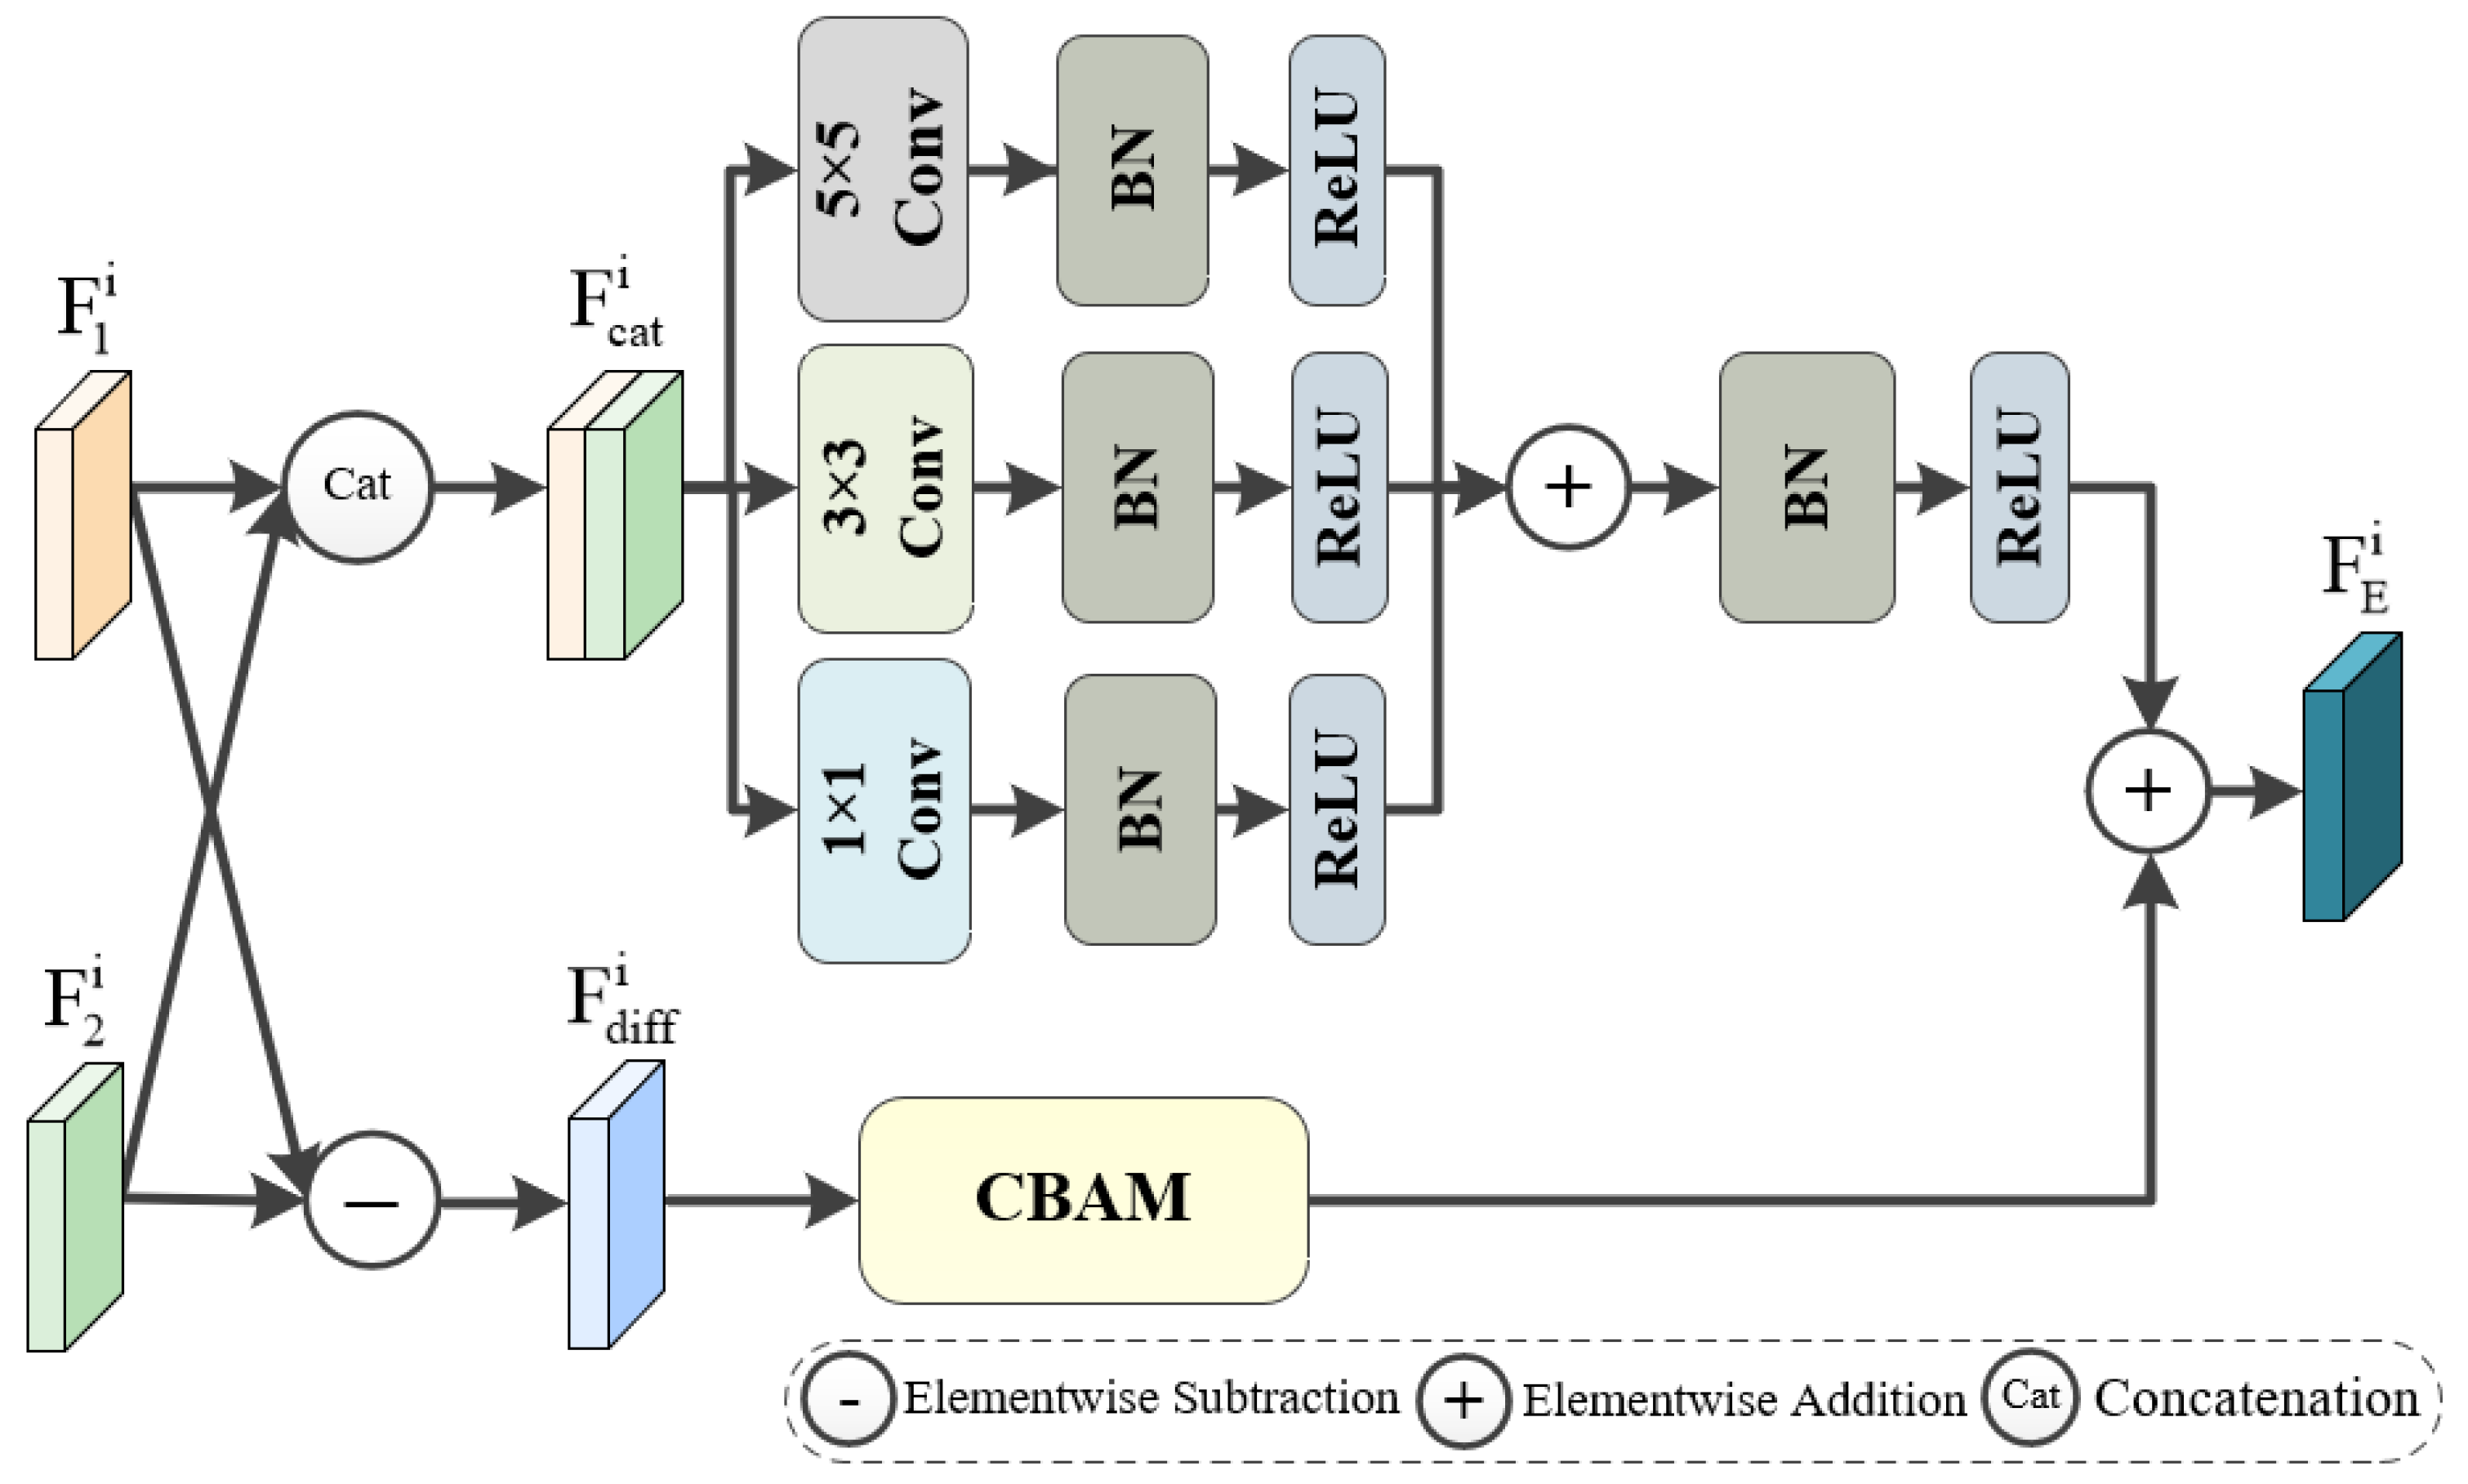
As depicted in
Figure 6, the DBDE mechanism is structurally partitioned into two parallel pathways: a differential stream and a stacking stream. The primary objective of this architecture is to amplify the discriminative signatures of dynamic areas while concurrently filtering out irrelevant contextual distractors. Within the stacking pathway, paired representations from both time steps (
and
) are initially merged across the channel axis to generate a fused tensor
. This composite tensor is subsequently routed through a multi-scale convolutional block comprising three parallel filters with spatial dimensions of
,
, and
. Each independent filter branch applies a sequence of Batch Normalization (BN) and ReLU non-linearities prior to executing specific weighting calculations. The aggregated responses from these hierarchical scales are ultimately refined by a terminal BN and ReLU sequence, yielding the final output of the stacking stream. Parallel to this, the differential stream leverages an attention-guided strategy to decouple comprehensive and fine-grained patterns. Specifically, it computes the absolute pixel-wise discrepancy between the initial inputs
and
to produce a residual map
. To further accentuate the semantic prominence of surface transitions, this residual map is projected into a joint spatial-channel attention block. Mathematically, the complete forward propagation of this module is expressed as:
Ultimately, an element-level summation is executed to aggregate and , yielding the augmented differential representation (). As a composite tensor that seamlessly couples extended spatiotemporal dependencies with fine-grained regional semantics, this output is subsequently routed to the decoding network.
2.5. Global Cross-Scale Spatial Feature Fusion Decoder
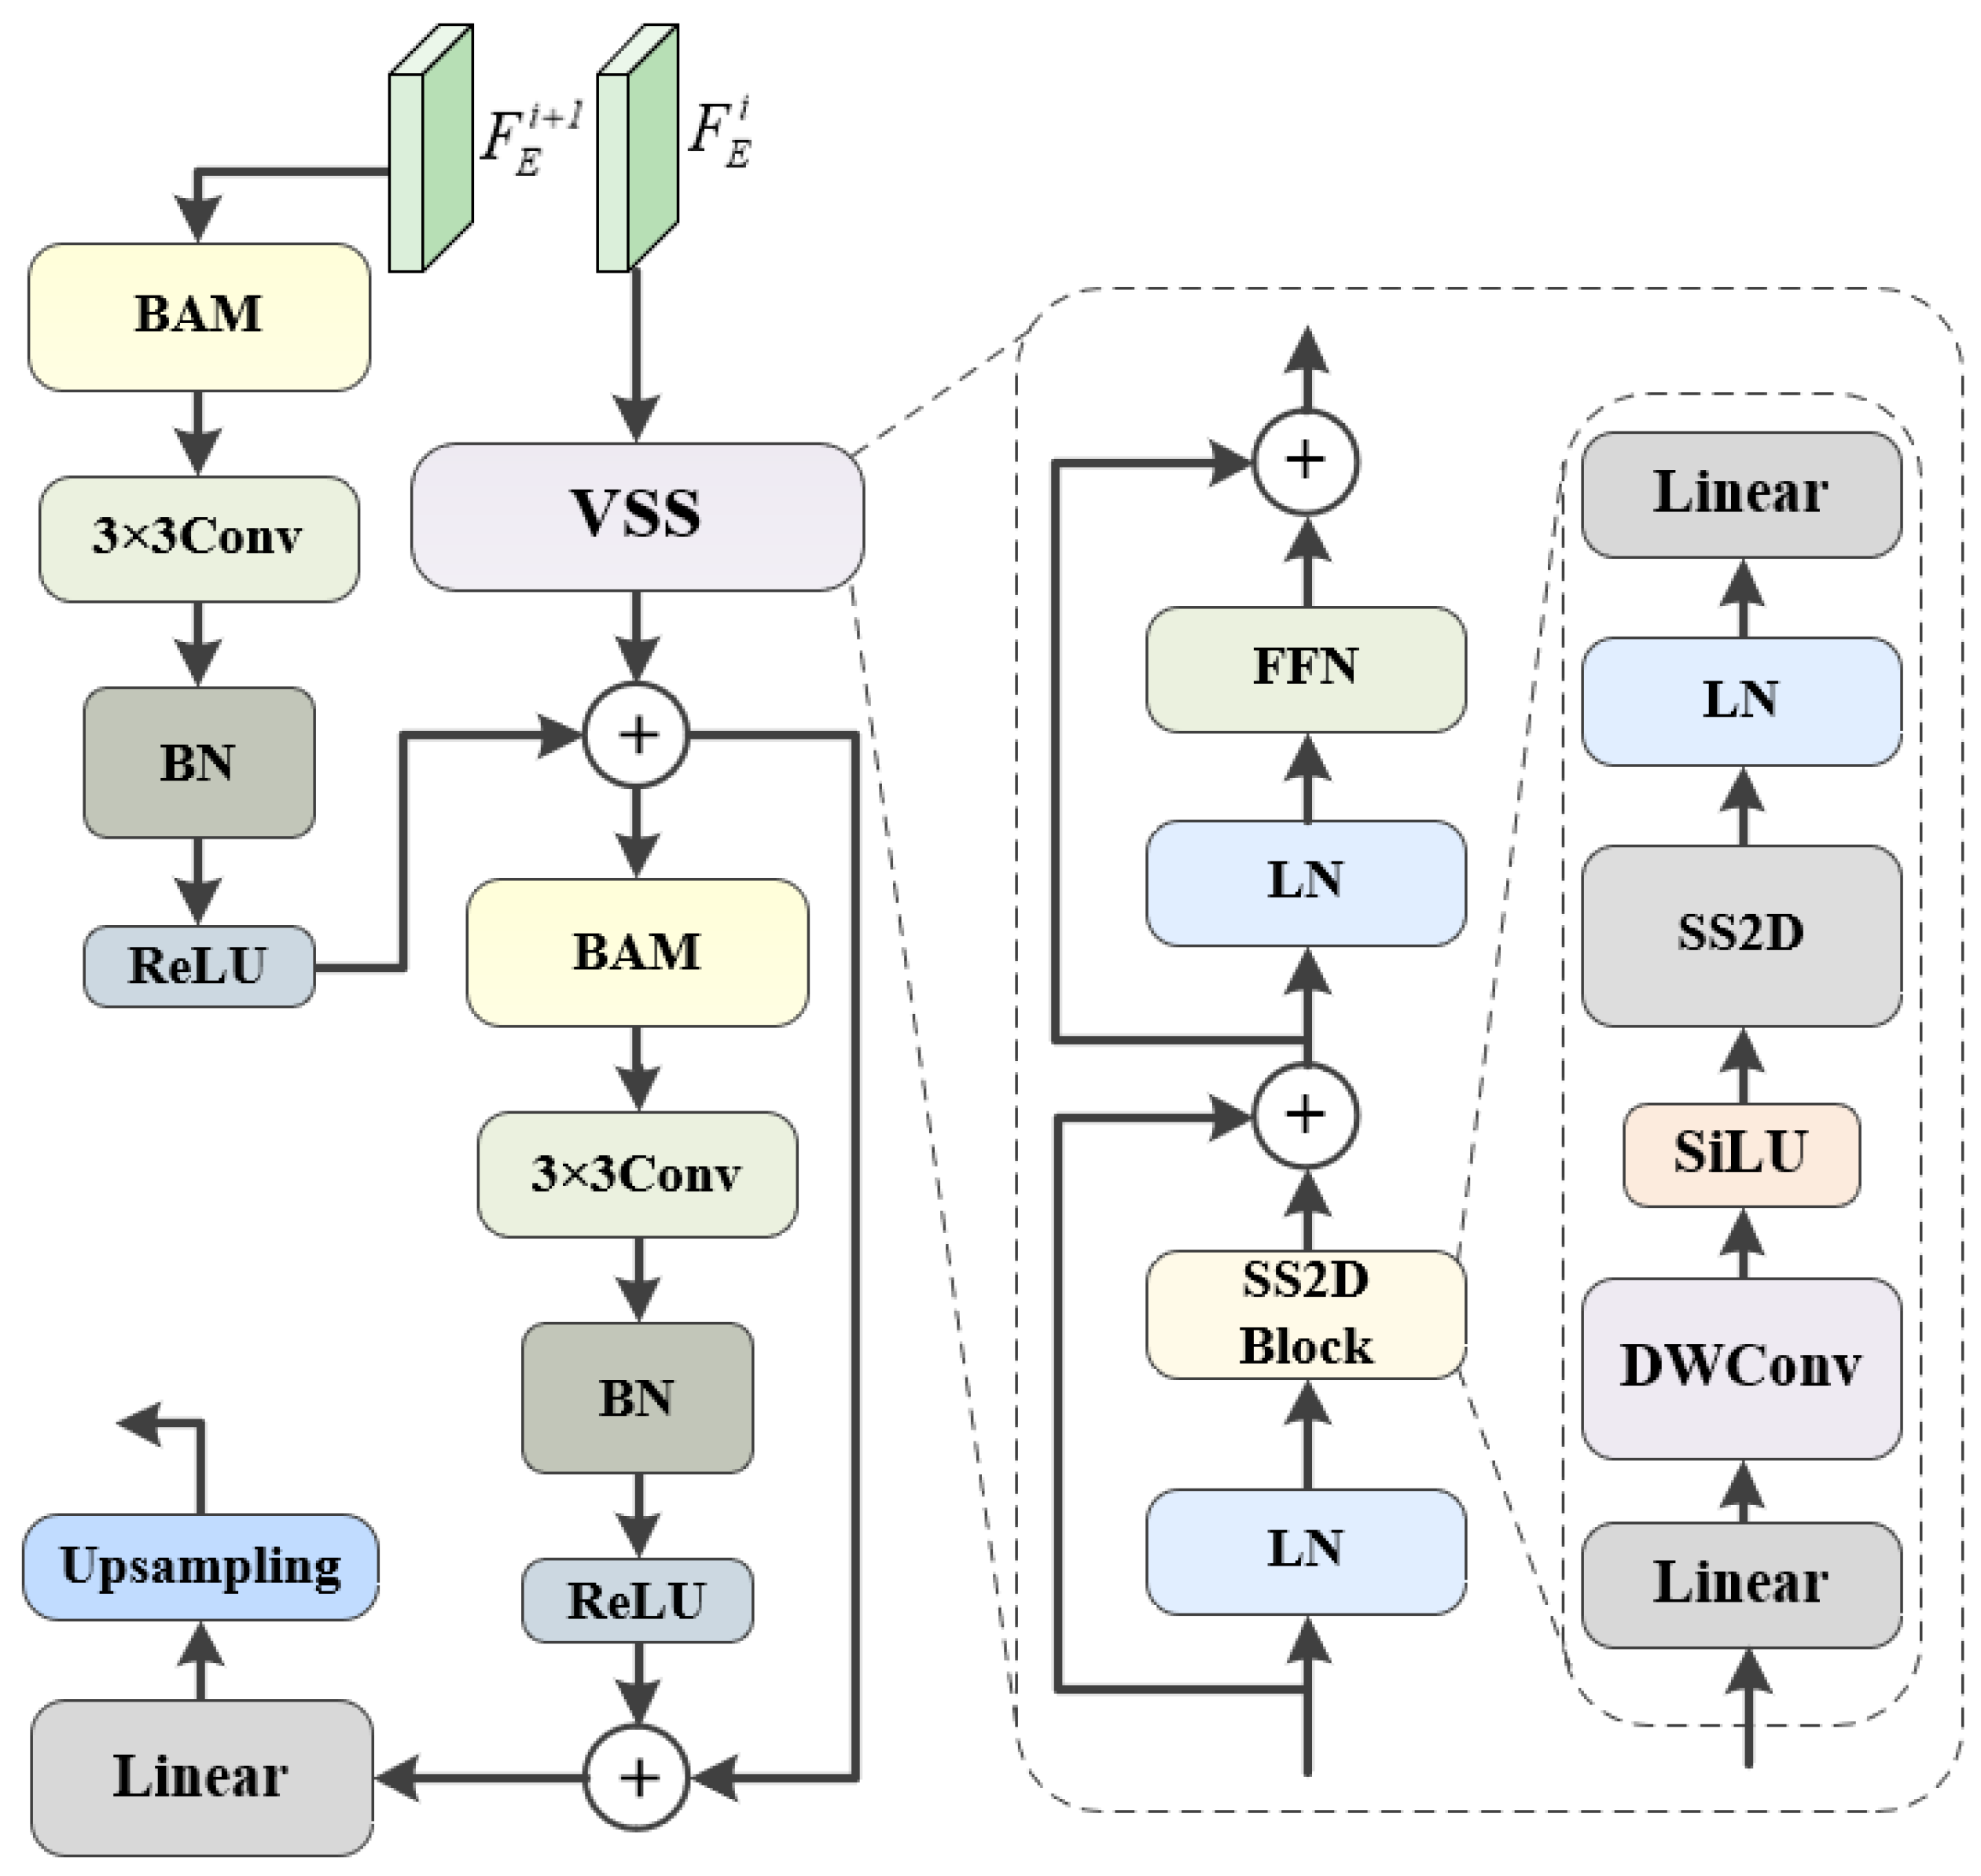
Within the overall architecture, the decoding phase holds an importance equal to that of the encoding stage, particularly for reconstructing hierarchical targets. While traditional networks commonly resort to naive upsampling for cross-scale aggregation, this practice frequently incurs severe losses in spatial precision due to the inherent semantic disparities across varying network depths. To explicitly overcome this structural degradation, we introduce the GCSSFF module, which is dedicated to seamlessly synthesizing adjacent inter-stage representations (
and
). The precise topological configuration of this fusion mechanism is illustrated in
Figure 7.
The upsampled feature
from the preceding layer is first fed into a spatial attention module. Subsequently, local spatial features are extracted via
convolution, followed by Batch Normalization and ReLU activation function, preparing it for addition with the current-level feature
. The input feature
of the current layer is initially routed into the Visual State-Space (VSS) module. Within this module, the feature sequentially undergoes layer normalization and 2D Selective Scan (SS2D), utilizing the State-Space Model (SSM) for sequential modeling to capture long-range dependencies. Following this, the feature passes through a linear projection, depthwise separable convolution, BN, and a SiLU activation function. It then undergoes another round of SS2D, layer normalization, and linear projection, thereby completing the non-linear transformation within the VSS path. Simultaneously, the cross-layer features
and
are aggregated and forwarded to the spatial attention path. This aggregated representation first undergoes global context modeling via the spatial attention module, followed by a
convolution to extract local spatial features, and is then processed by BN and ReLU to obtain the enhanced feature representation of the current level. Finally, the feature outputted by the VSS path and the feature enhanced by the spatial attention path are combined via element-wise addition to accomplish the fusion of dual-path information. The fused feature is subjected to a linear projection and an upsampling operation to restore spatial resolution and align its dimensions with the feature of the subsequent level. Through the synergistic effect of spatial attention and state-space scanning, the entire module achieves efficient modeling of visual features, striking an optimal balance between local detail preservation and global context perception. The specific procedure can be formulated as follows:
where CBAM represents the spatial-channel attention, BN denotes Batch Normalization,
indicates a linear projection layer.
denotes a convolution operation with a kernel size of 3, and UP stands for the upsampling operation.
Ultimately, the prediction head progressively restores the feature maps to their original spatial dimensions via upsampling operations. Through a final linear projection, the ultimate result for change detection is generated.
2.6. Loss Function
Within bi-temporal analysis scenarios, static background areas generally dominate the visual scene, whereas dynamic transitions constitute a disproportionately small fraction. Such severe quantitative asymmetry between the changed and unchanged categories frequently biases the network toward the overwhelming background patterns, severely degrading the identification of crucial transitional areas. To counteract this optimization bottleneck, our architecture integrates a Dice penalty alongside the standard Binary Cross-Entropy (BCE) criterion, synthesizing a compound optimization objective. Mathematically, these two cost components (
and
) are defined as
In these equations,
y signifies the ground-truth annotation, while
stands for the spatial probability distribution inferred by the network. The target matrix
y strictly contains discrete binary indicators (0 or 1), whereas the elements within
span a continuous interval from 0 to 1, reflecting the classification confidence for regional dynamics. Building upon these prerequisite formulations, the ultimate aggregate training loss is established as
where the hyperparameter
balances the contributions of
and
. This composite loss leverages
to facilitate stable model convergence and utilizes
to mitigate the class imbalance problem.
2.7. Dataset Description
The empirical evaluations detailed herein are executed across four well-established open-access archives: the LEVIR-CD, WHU-CD, CLCD-CD, and GVLM-CD datasets.
- (1)
LEVIR-CD Dataset: This collection encompasses 637 dual-temporal observation pairs, each featuring a spatial footprint of pixels alongside a 0.5 m/pixel spatial resolution. It was explicitly constructed to benchmark building transition identification across diverse environmental contexts. To meet the requirements of network optimization and quantitative assessment, these original large-scale scenes are systematically cropped into sub-regions. Consequently, this operation generates a final distribution of 7120, 1024, and 2048 paired samples allocated to the training, validation, and testing phases, respectively.
- (2)
WHU-CD Dataset: This archive encompasses an exclusive pair of high-fidelity airborne observations spanning a vast spatial footprint of 32,507 × 15,354 pixels. Characterized by an ultra-fine spatial resolution of 0.075 m, this collection is specifically tailored for evaluating architectural transitions. To accommodate the input constraints of deep architectures during the data preparation stage, the expansive bi-temporal scene is systematically fragmented into discrete sub-grids. Following this segmentation, a stochastic allocation strategy is applied to distribute these generated patches, ultimately yielding 6096, 762, and 762 paired samples designated for the network optimization, validation, and final evaluation phases, respectively.
- (3)
CLCD-CD Dataset: Comprising 600 dual-temporal observation sets, this archive features spatial dimensions of pixels at a fine resolution ranging from 0.5 to 2 m/pixel. These remote sensing records were captured over Guangdong Province, China, utilizing the Gaofen-2 (GF-2) sensor. The primary objective of this collection is to track agricultural field dynamics spanning the period from 2017 to 2019. Furthermore, it encompasses a diverse array of surface transitions, including urban structures, infrastructural growth, aquatic environments, and exposed terrain. To facilitate robust network optimization and rigorous assessment, the original scenes undergo a systematic cropping process into discrete grids. This procedural step ultimately yields a structured data split consisting of 1440, 480, and 480 paired instances allocated to the training, validation, and testing stages, respectively.
- (4)
GVLM-CD Dataset: Sourced directly from the Google Earth platform, this repository compiles 17 fine-resolution dual-temporal observation pairs, encompassing an expansive geographical footprint of 163.77 square kilometers. The primary analytical objective of this collection centers on the precise delineation of landslides across varying geological and environmental settings. To formulate viable inputs for algorithmic optimization and assessment, every primary scene undergoes a systematic subdivision into discrete spatial grids. Applying a proportional distribution strategy of 7:1.5:1.5, the generated samples are subsequently divided, resulting in roughly 4480 training instances, alongside 960 validation and 960 testing pairs.
2.8. Experimental Setup
To guarantee an unbiased benchmark, the entire suite of comparative baselines alongside our formulated architecture is deployed strictly within a standardized computational environment. Specifically, algorithmic development and network optimization are driven by the PyTorch 2.11 library, utilizing an individual NVIDIA RTX 5090 D accelerator equipped with 24 GB of VRAM. For the refinement of network parameters, we adopt the Stochastic Gradient Descent (SGD) algorithm, configuring the base learning rate, momentum coefficient, and weight decay penalty to 0.01, 0.9, and 0.0005, respectively. The complete optimization cycle is scheduled for 200 epochs, operating with a mini-batch capacity of 8. Furthermore, to mitigate overfitting and fortify algorithmic resilience, spatial and morphological perturbations—encompassing stochastic flipping, structural cropping, and image blurring—are dynamically introduced during the training phase. Ultimately, this rigorous environmental and hyperparameter standardization ensures a completely equitable quantitative assessment for all involved models.
2.9. Evaluation Indicators
To rigorously evaluate the predictive performance of the proposed network, the inferred transition maps are systematically compared with the ground-truth annotations utilizing five prevalent quantitative criteria: Precision (
Pre), Recall (
Rec), F1-score (
F1), Intersection over Union (
IoU), and Overall Accuracy (
OA). The computation of these assessment metrics relies on the following defined mathematical operations:
Within the context of these calculations, the variables , , , and correspond to the respective pixel-wise accumulations for true-positive, true-negative, false-positive, and false-negative inferences. The resultant values for all aforementioned indices are strictly bounded within the numerical continuous interval of [0, 1], wherein scores approaching the upper limit of 1 characterize an optimal pixel-level identification ability. Moving beyond spatial segmentation fidelity, the inherent resource efficiency of the model is independently quantified by documenting the aggregate number of learnable parameters (Params) as well as the overall floating-point operations (FLOPs).
3. Result
To thoroughly validate the efficacy of the formulated architecture in identifying surface variations, extensive empirical evaluations are carried out across four demanding benchmark archives: LEVIR-CD, WHU-CD, CLCD-CD, and GVLM-CD. Within each data environment, a selection of state-of-the-art change detection paradigms serves as a comparative baseline to facilitate a rigorous quantitative assessment. These baselines encompass Convolutional Neural Network (CNN)-based methods (e.g., FC-EF [
19], SNUNet [
21]), Transformer-based architectures (e.g., BIT [
30], ChangeFormer [
31]), hybrid models integrating the strengths of both (e.g., SEIFNet [
39], MCECF [
47], EIMDGNet [
48]) and recent State-Space Models (e.g., ChangeMamba [
40], CDMamba [
41]). By systematically comparing our model against these mainstream methods across four remote sensing datasets characterized by varying spatial scales, diverse land-cover categories, and heterogeneous change targets, we aim to comprehensively assess the robustness and generalization capability of the proposed method from multiple dimensions, thereby ensuring a comprehensive and equitable experimental evaluation.
3.1. Quantitative Results and Analysis
The numerical outcomes and comparative assessments involving our formulated architecture and established baseline paradigms are detailed in
Table 1. To provide a clear visual distinction, optimal and sub-optimal performance scores for each evaluation criterion are marked in red and blue boldface, respectively. By conducting rigorous benchmarks across diverse earth observation datasets—which encompass fluctuating spatial resolutions, multifaceted land-cover distributions, and non-uniform transition categories—we thoroughly substantiate the adaptability and structural resilience of the introduced model.
On the LEVIR-CD dataset, the proposed model exhibits exceptional change detection performance. Specifically, our method obtains the best performance on two key metrics: Recall (91.07%) and IoU (85.28%). It yields improvements of 0.33% and 2.35% compared to the respective metrics of the sub-optimal EIMDGNet (90.74%, 82.93%) and SEIFNet (90.49%, 83.40%). This observation further highlights the advantages of the proposed model in mitigating missed detections and ensuring the completeness of the segmentation in changed regions. Notably, the IoU score of 85.28% establishes a substantial margin over other baseline methods. This success can be attributed to the meticulous design in feature fusion and boundary refinement, which empowers the model to delineate the edge contours of changed regions more precisely. Although the proposed model slightly trails EIMDGNet (92.91%, 91.49%, 99.17%) in terms of Precision (92.16%), F1-score (91.06%), and OA (99.12%), it consistently maintains the second-best position across these metrics, thereby demonstrating a highly balanced and outstanding overall detection capability.
On the WHU-CD dataset, the formulated architecture exhibits a more holistic competitive edge across multiple evaluation dimensions. This overarching efficacy underscores the model’s capacity to maintain robust detection capabilities while adapting to the specific spatial characteristics and spectral properties inherent in this dataset. Experimental data indicates that the model ranks first across four metrics—Precision (94.88%), F1-score (90.51%), IoU (82.45%), and OA (99.16%)—establishing a dominant superiority over the baseline methods. Specifically, in terms of Precision and F1-score, the proposed model with its outstanding scores of 94.88% and 90.51% significantly surpasses CDMamba (94.26%, 90.22%) and ChangeMamba (92.94%, 90.08%), yielding respective improvements of 0.62% and 0.43%. This verifies that while ensuring detection accuracy, the model can effectively balance the trade-off between precision and recall. It is worth emphasizing that although the proposed model slightly trails MCECF (88.14%) in the Recall metric (86.78%), it compensates for this discrepancy with a higher Precision. Ultimately, this indicates that the model achieves a better trade-off between false alarm suppression and detection completeness, yielding optimal results on the comprehensive evaluation metrics (F1 and IoU).
Regarding the more demanding CLCD-CD benchmark, the introduced architecture exhibits particularly salient competitive advantages. Due to the inherent diversity in the dimensions of dynamic targets and the intricate nature of land-cover interference, this dataset necessitates exceptional multi-scale perceptual acuity from detection algorithms. Empirical evidence confirms that the formulated model establishes new performance ceilings across four key evaluation criteria, specifically yielding a Precision of 80.98%, an F1-score of 82.15%, an IoU of 72.83%, and an OA of 96.21%. Particularly in the comprehensive metrics of F1-score and IoU, the proposed model (82.15% and 72.83%) substantially outperforms MCECF (80.46%, 72.44%) and EIMDGNet (80.65%, 69.91%) by margins of 1.69% and 2.92%, respectively. This fully validates the model’s holistic perception and segmentation capabilities for changed regions within complex scenes. Notably, by leveraging the highest Precision score to effectively curb the generation of false alarms, the proposed model achieves a substantial leap over existing methods in comprehensive metrics. This embodies a design philosophy that prioritizes detection reliability when confronted with intricate land-cover backgrounds.
On the GVLM-CD dataset, the proposed model once again reaffirms its outstanding cross-scene generalization capability. Experimental results indicate that the model ranks first across three metrics—Precision (90.72%), F1-score (89.12%), and OA (98.79%)—while securing the second-best score in the IoU metric (77.78%). Particularly in terms of Precision and F1-score, the proposed model, with its remarkable scores of 90.72% and 89.12%, outperforms both CDMamba (90.18%, 88.10%) and ChangeMamba (89.23%, 87.96%). This demonstrates its robust capability in precisely identifying changed regions within complex land-cover environments. Although the Recall score (82.75%) is slightly lower than that of ChangeMamba (87.05%), the proposed model effectively suppresses false alarms through a significantly enhanced Precision (90.72% vs. 89.23%), thereby enabling the comprehensive F1-score to reach the optimal level. These results fully elucidate that when confronted with diverse data distributions and heterogeneous land-cover characteristics, the proposed model consistently maintains excellent detection stability and generalization capability, providing solid support for multi-scenario deployment in practical applications.
3.2. Visual Comparison of Change Detection Results
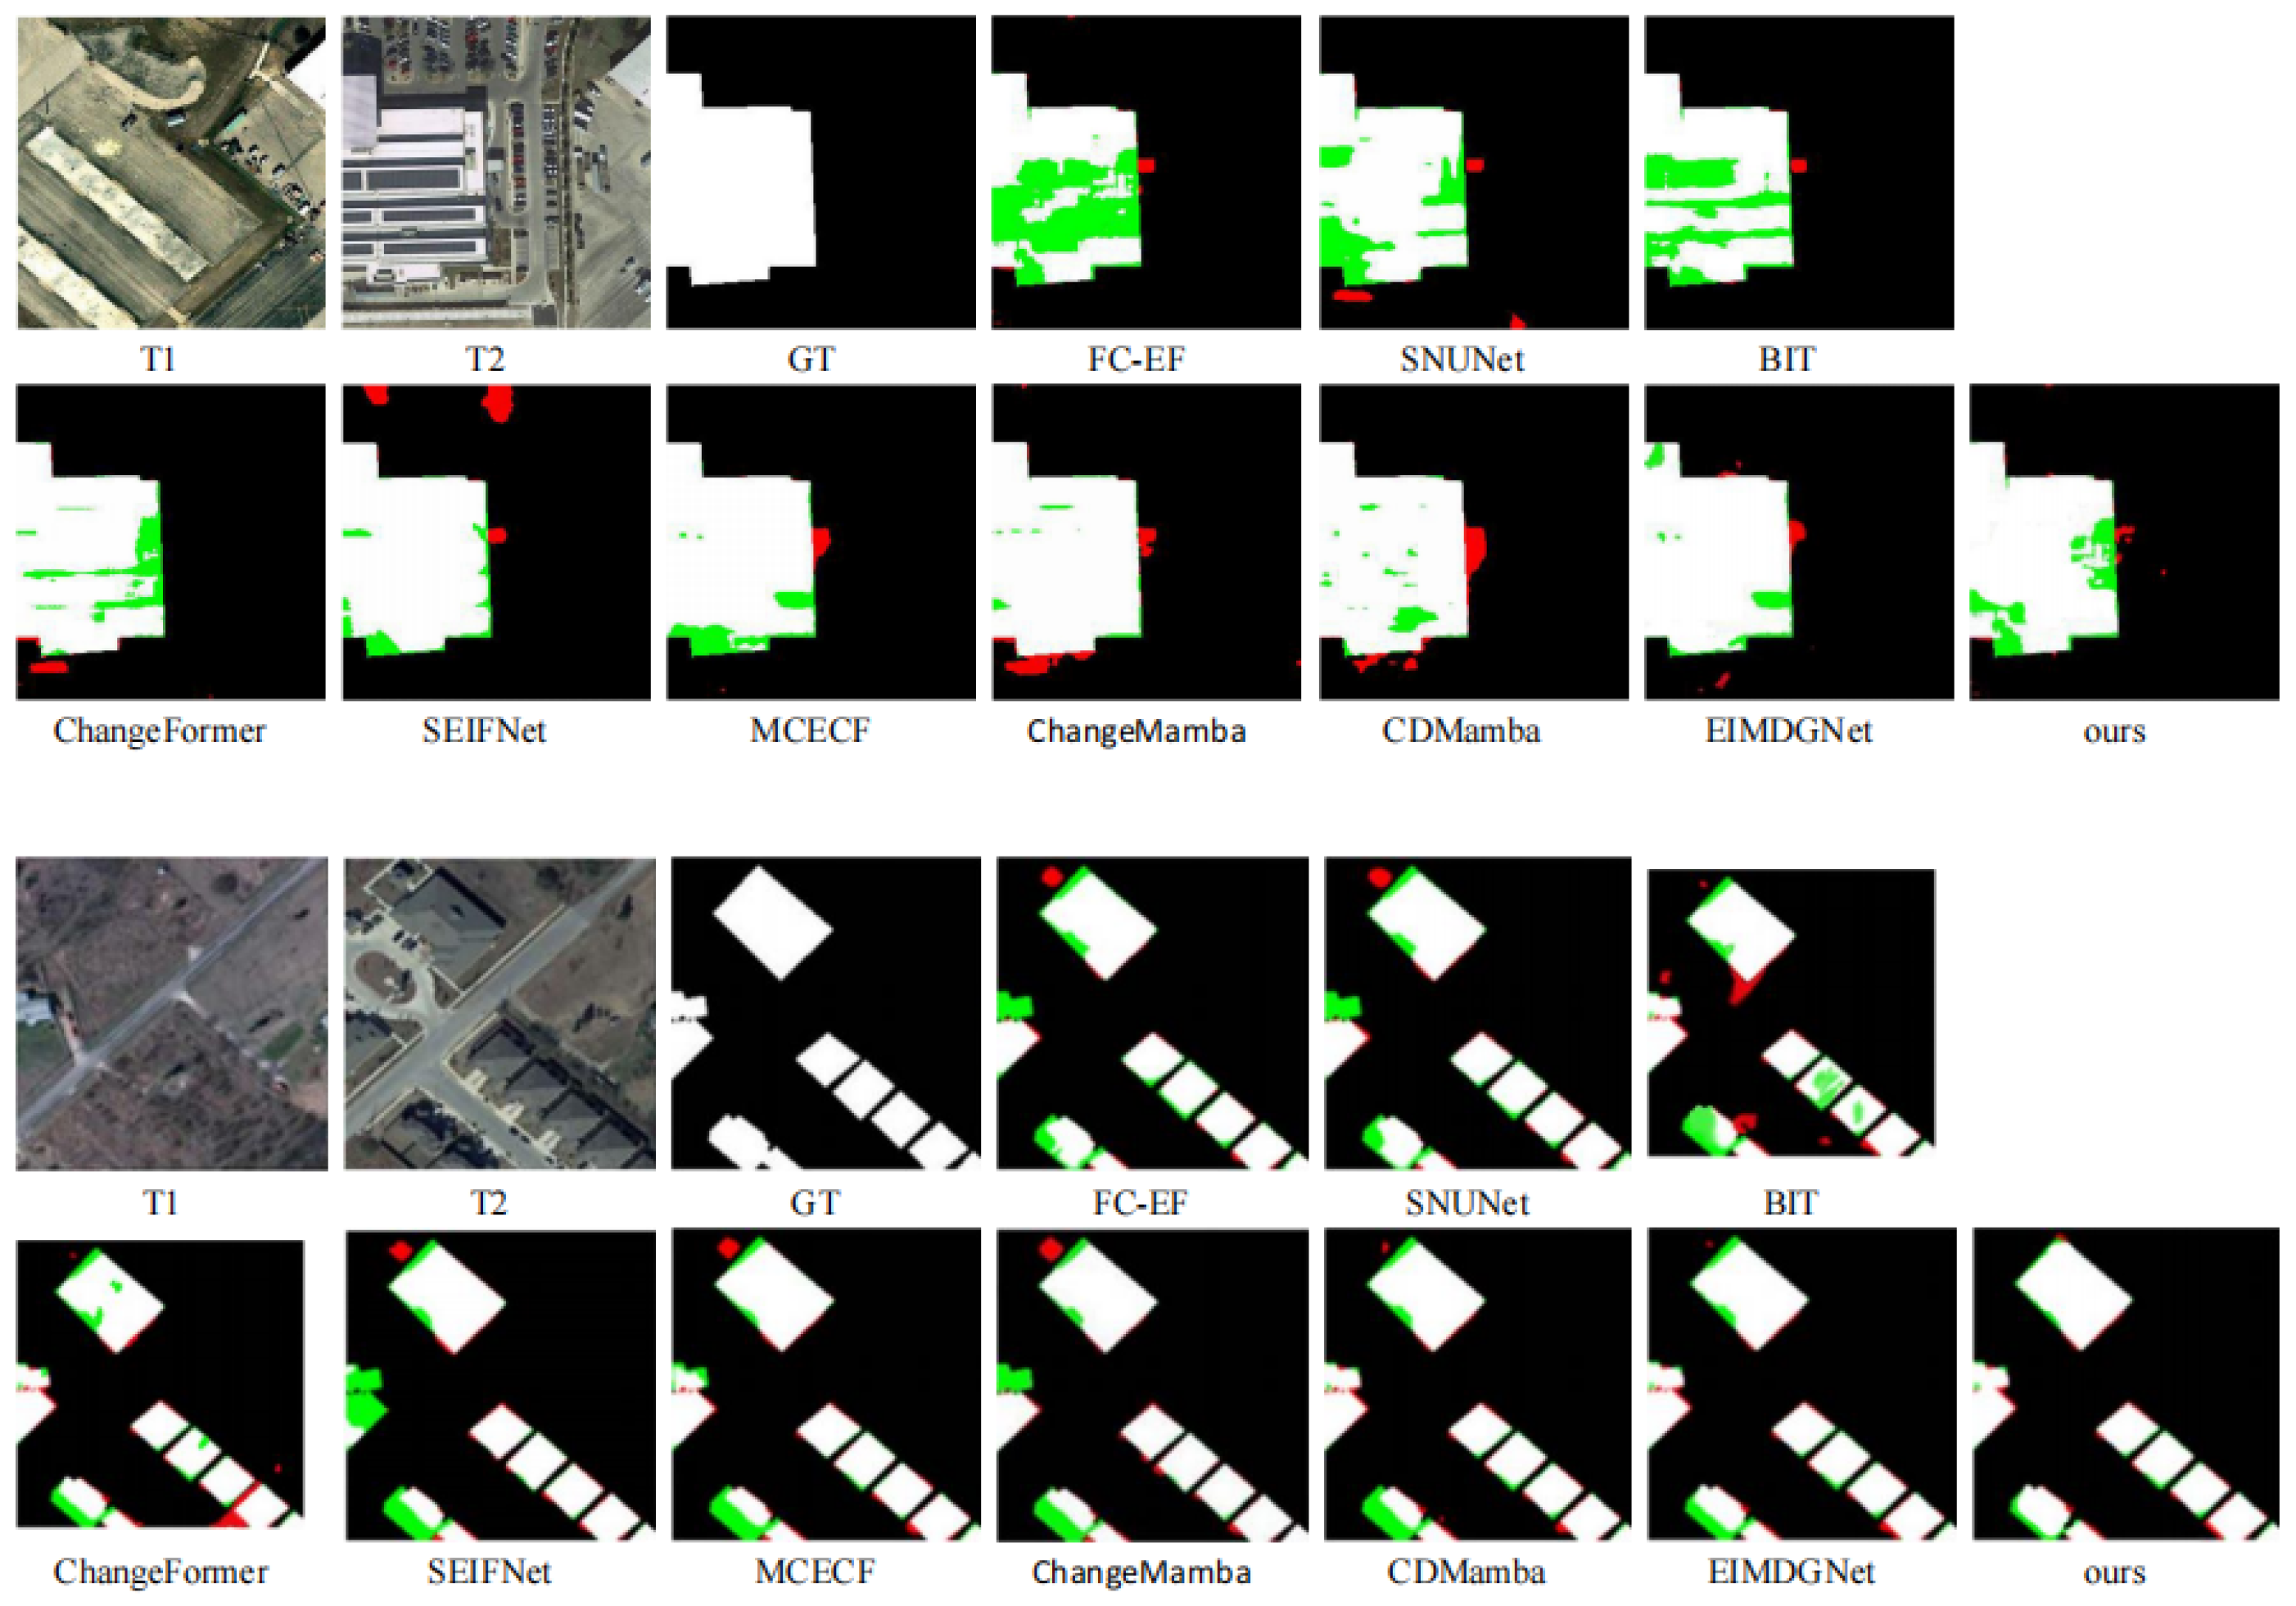
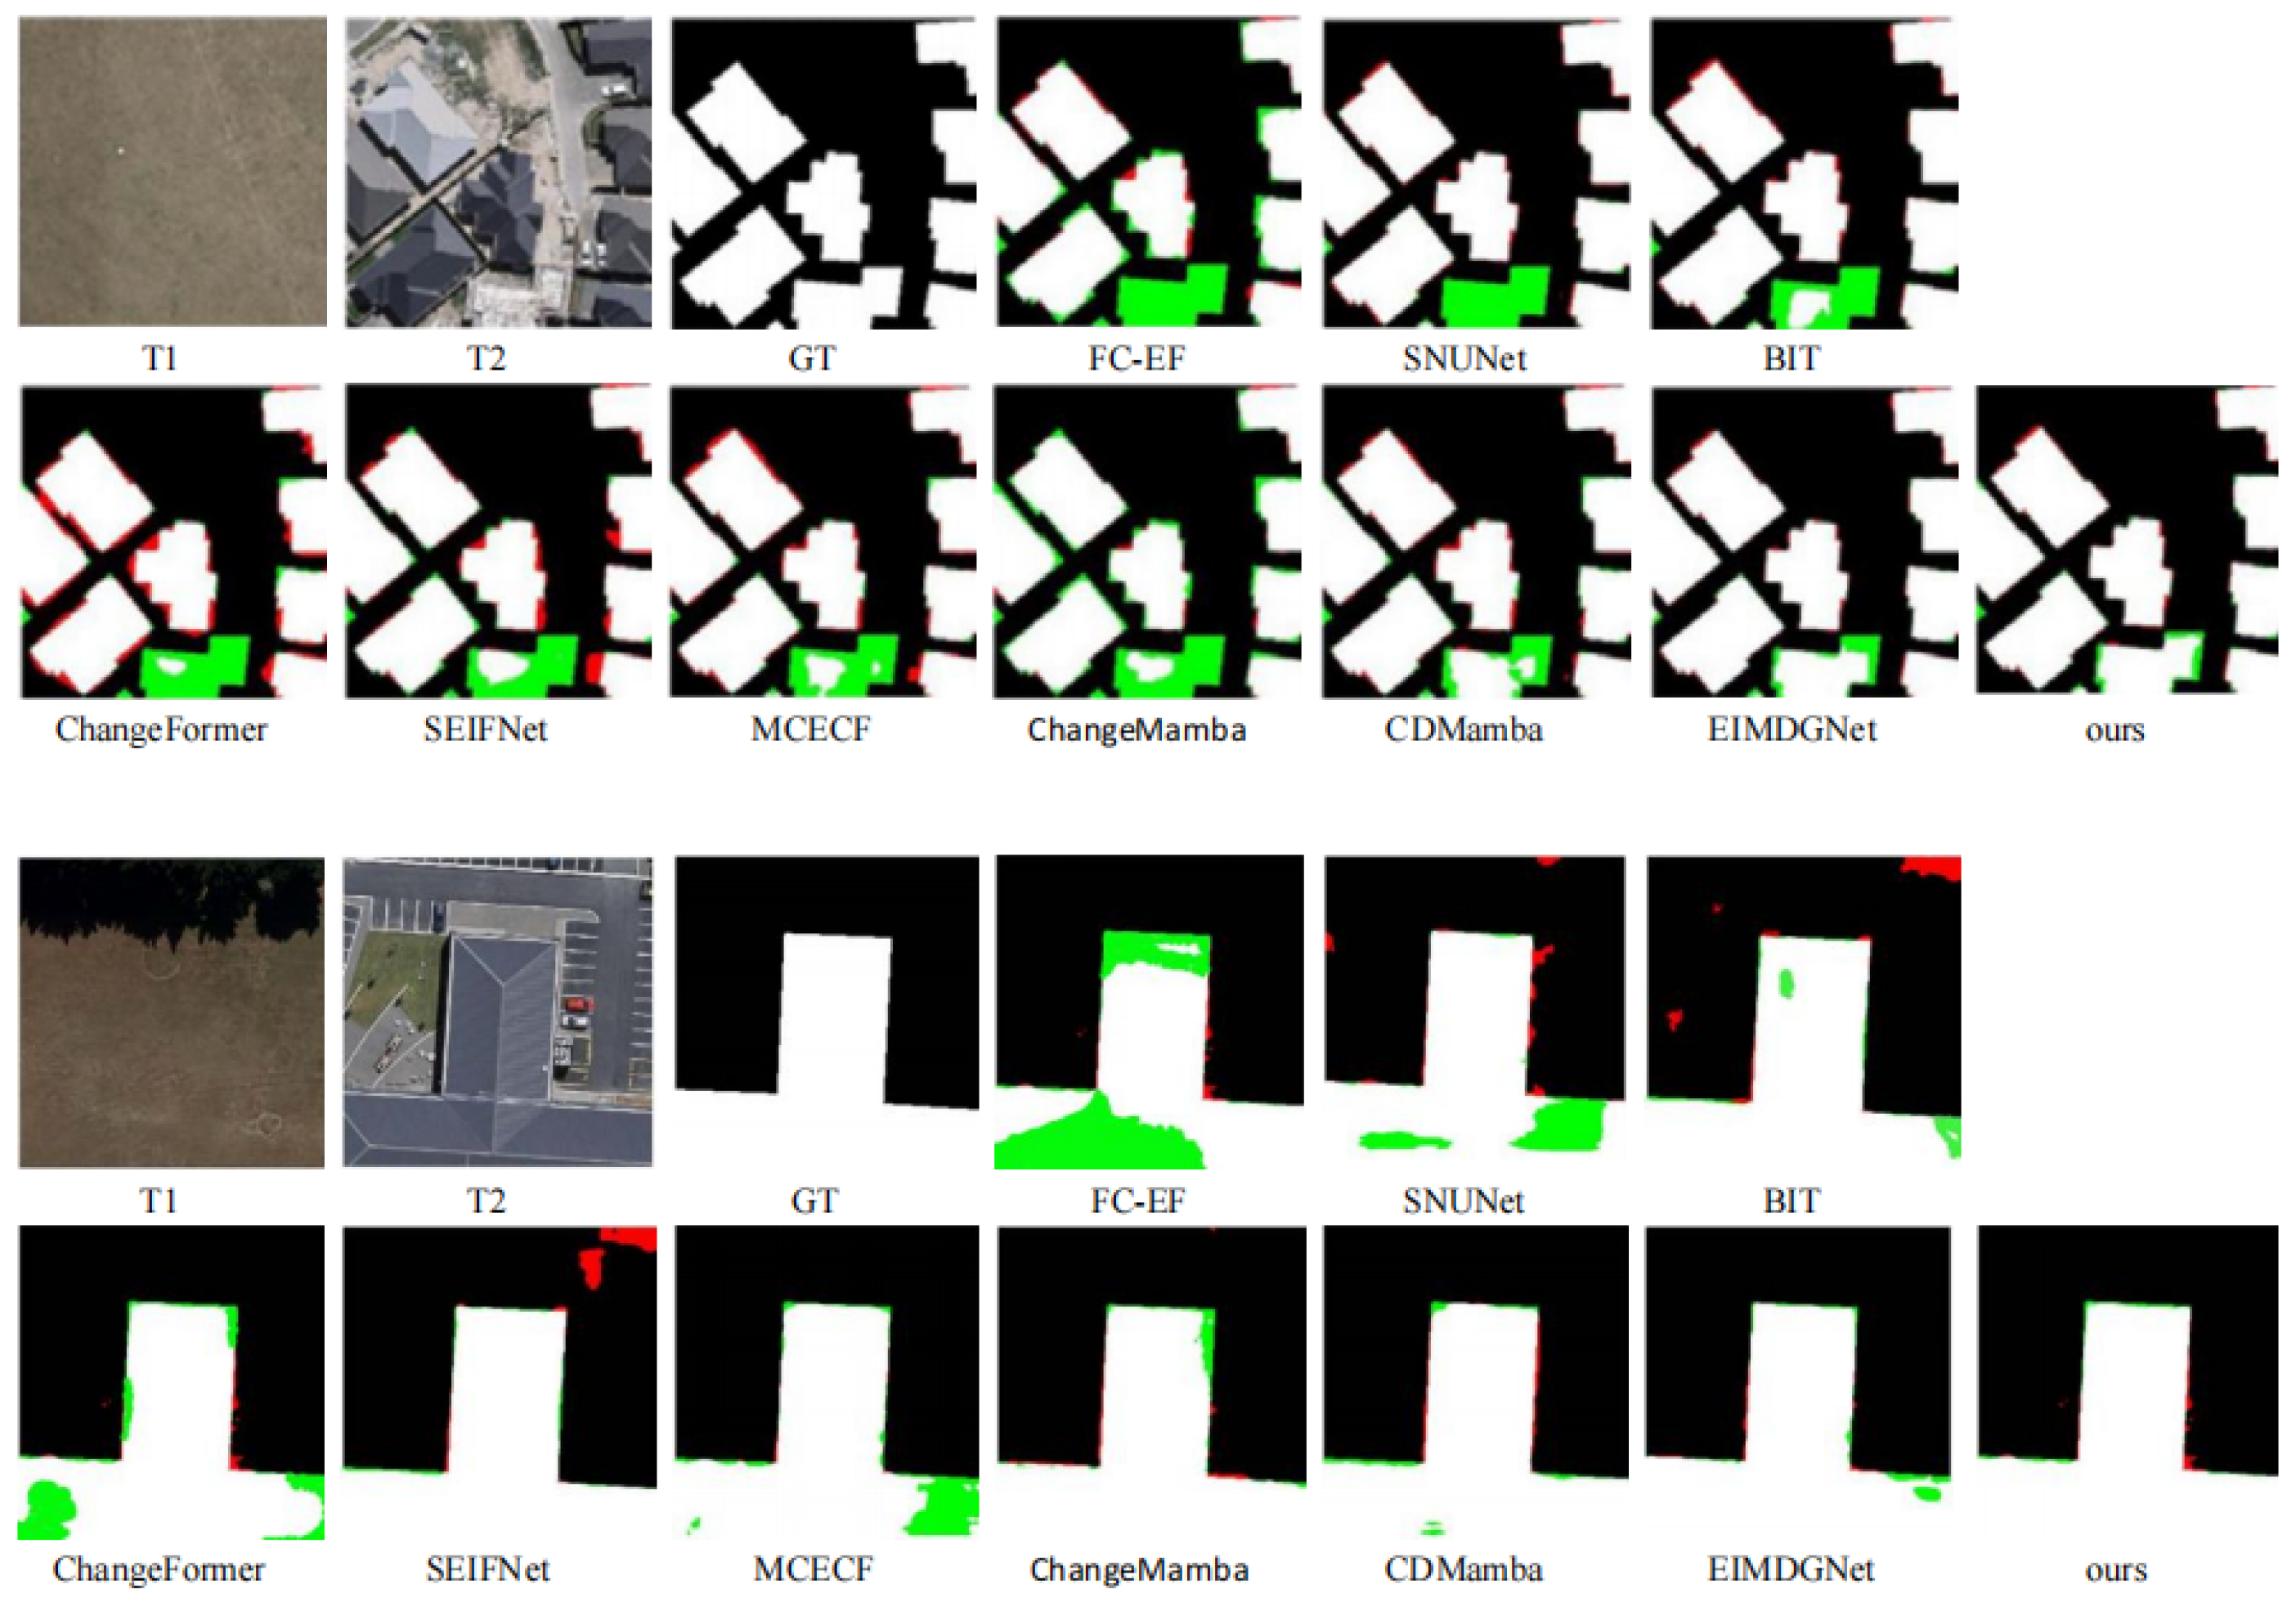
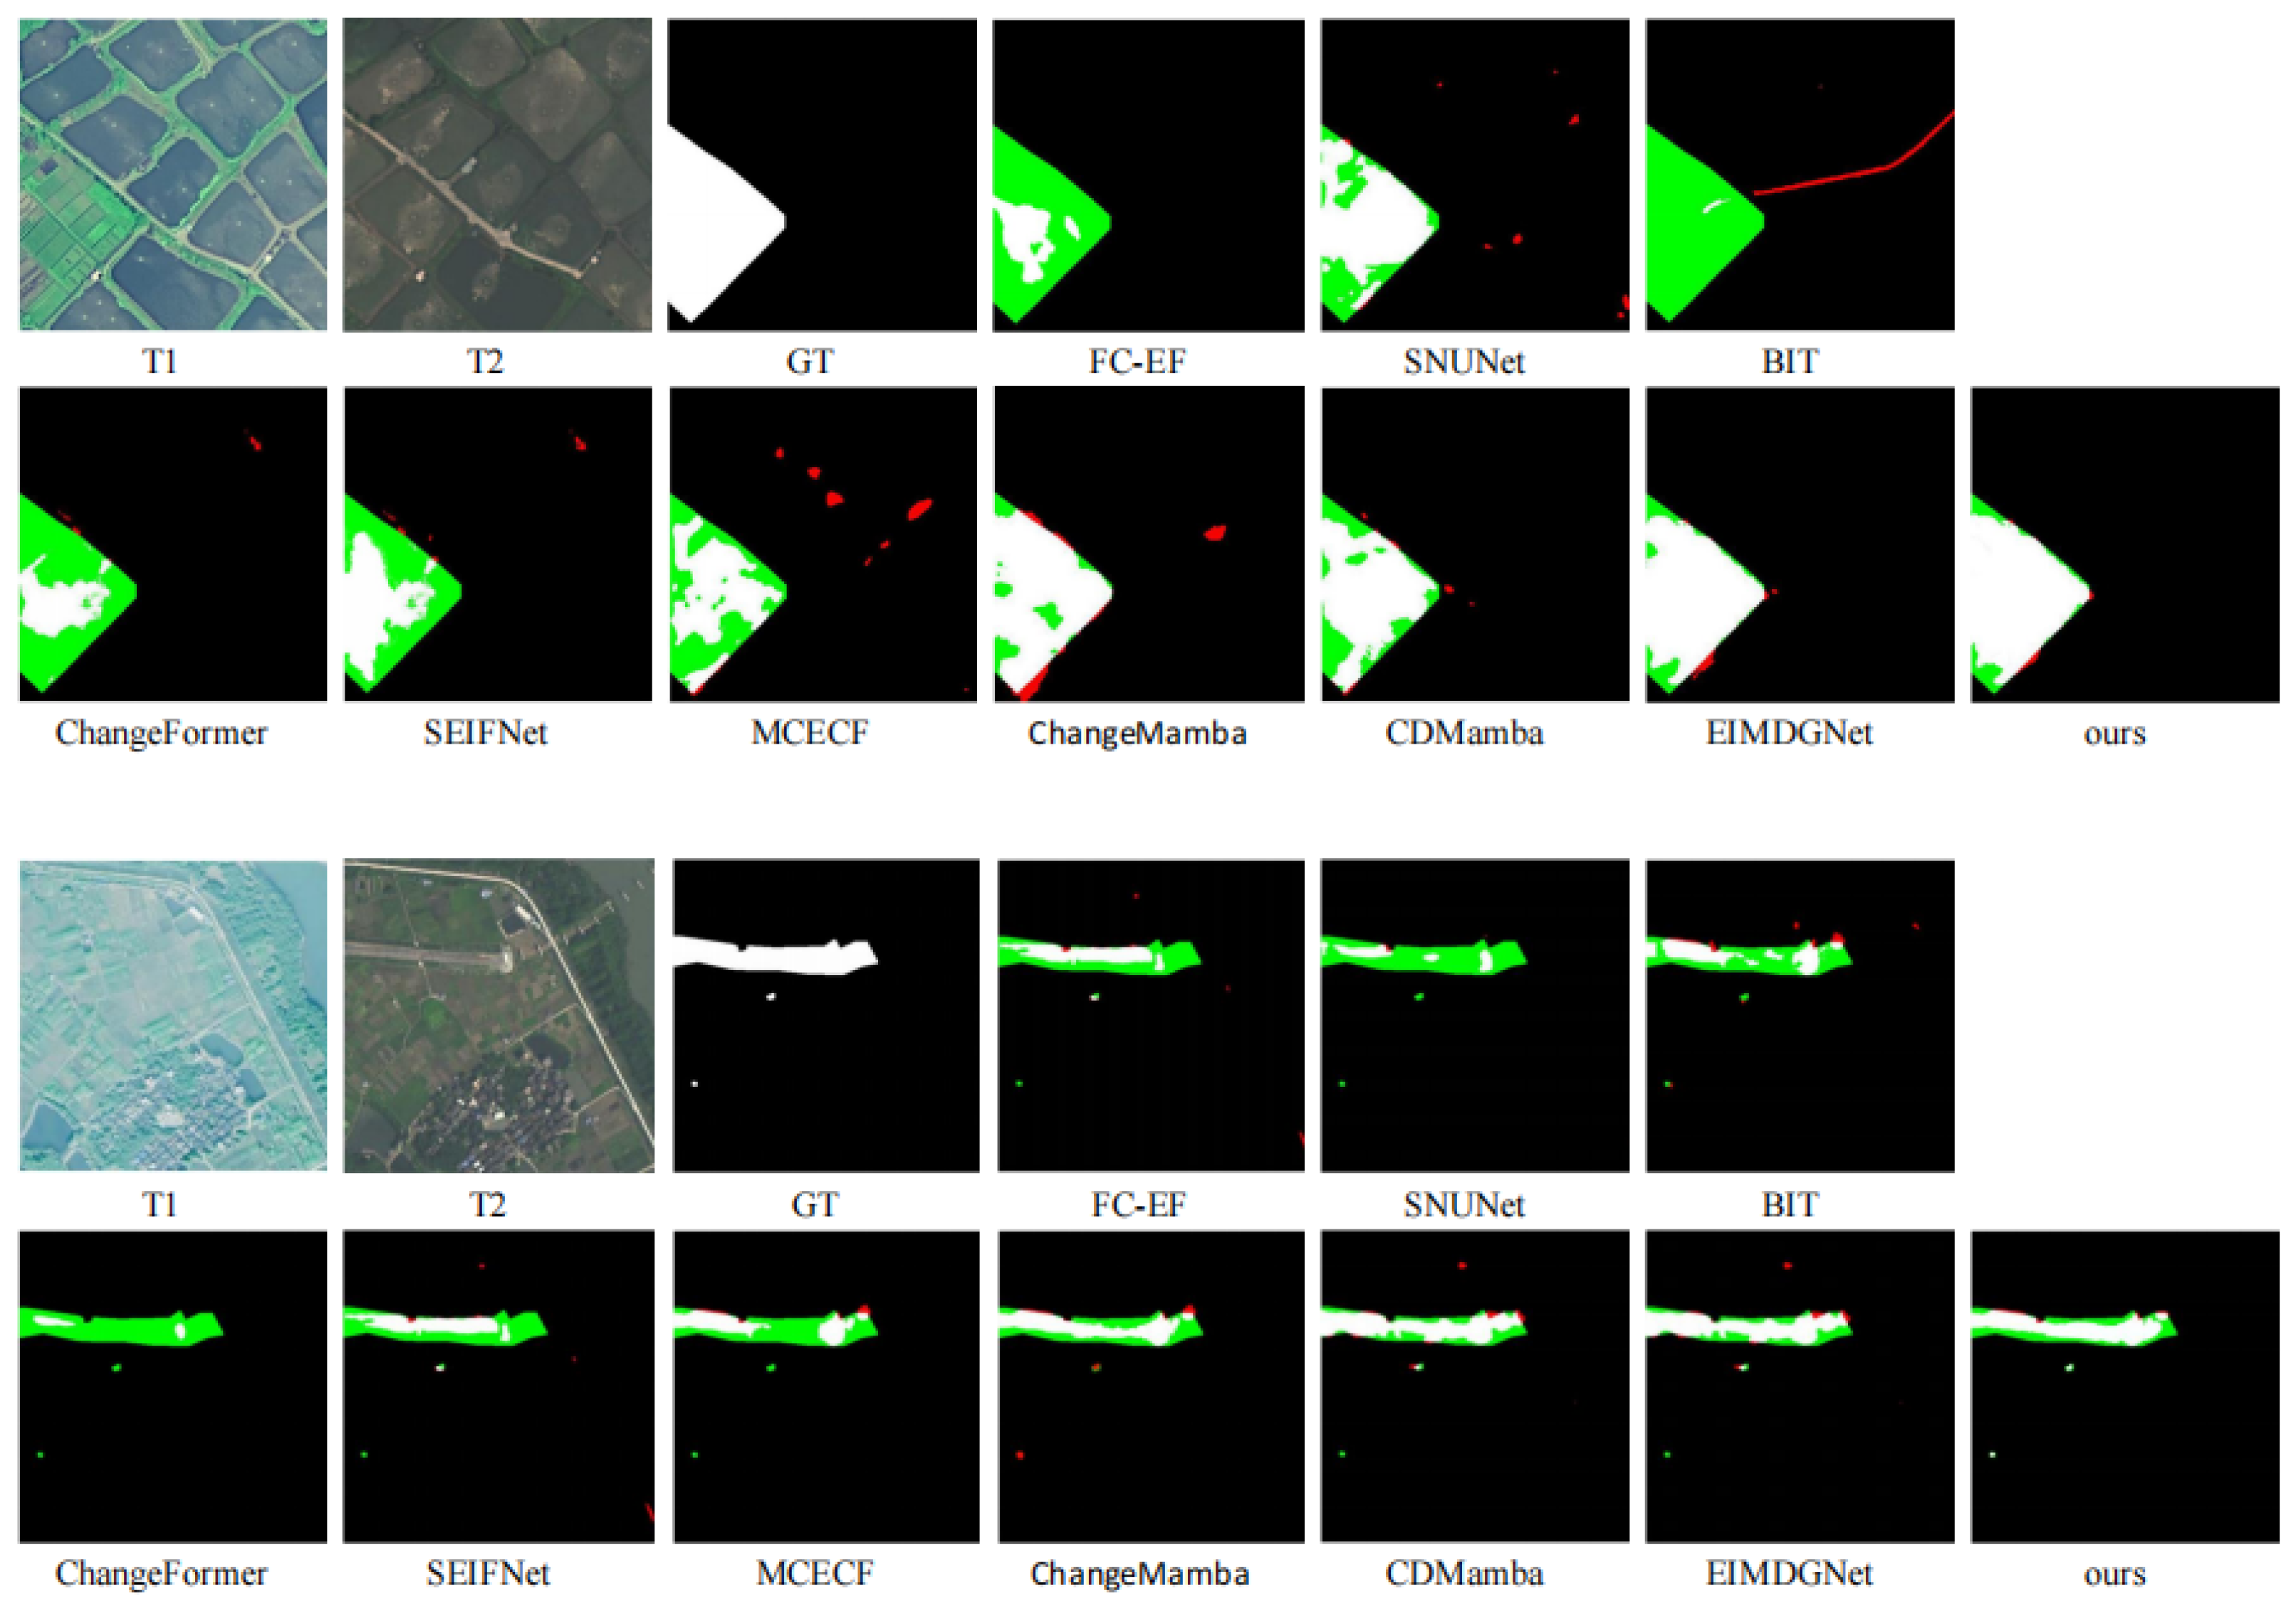
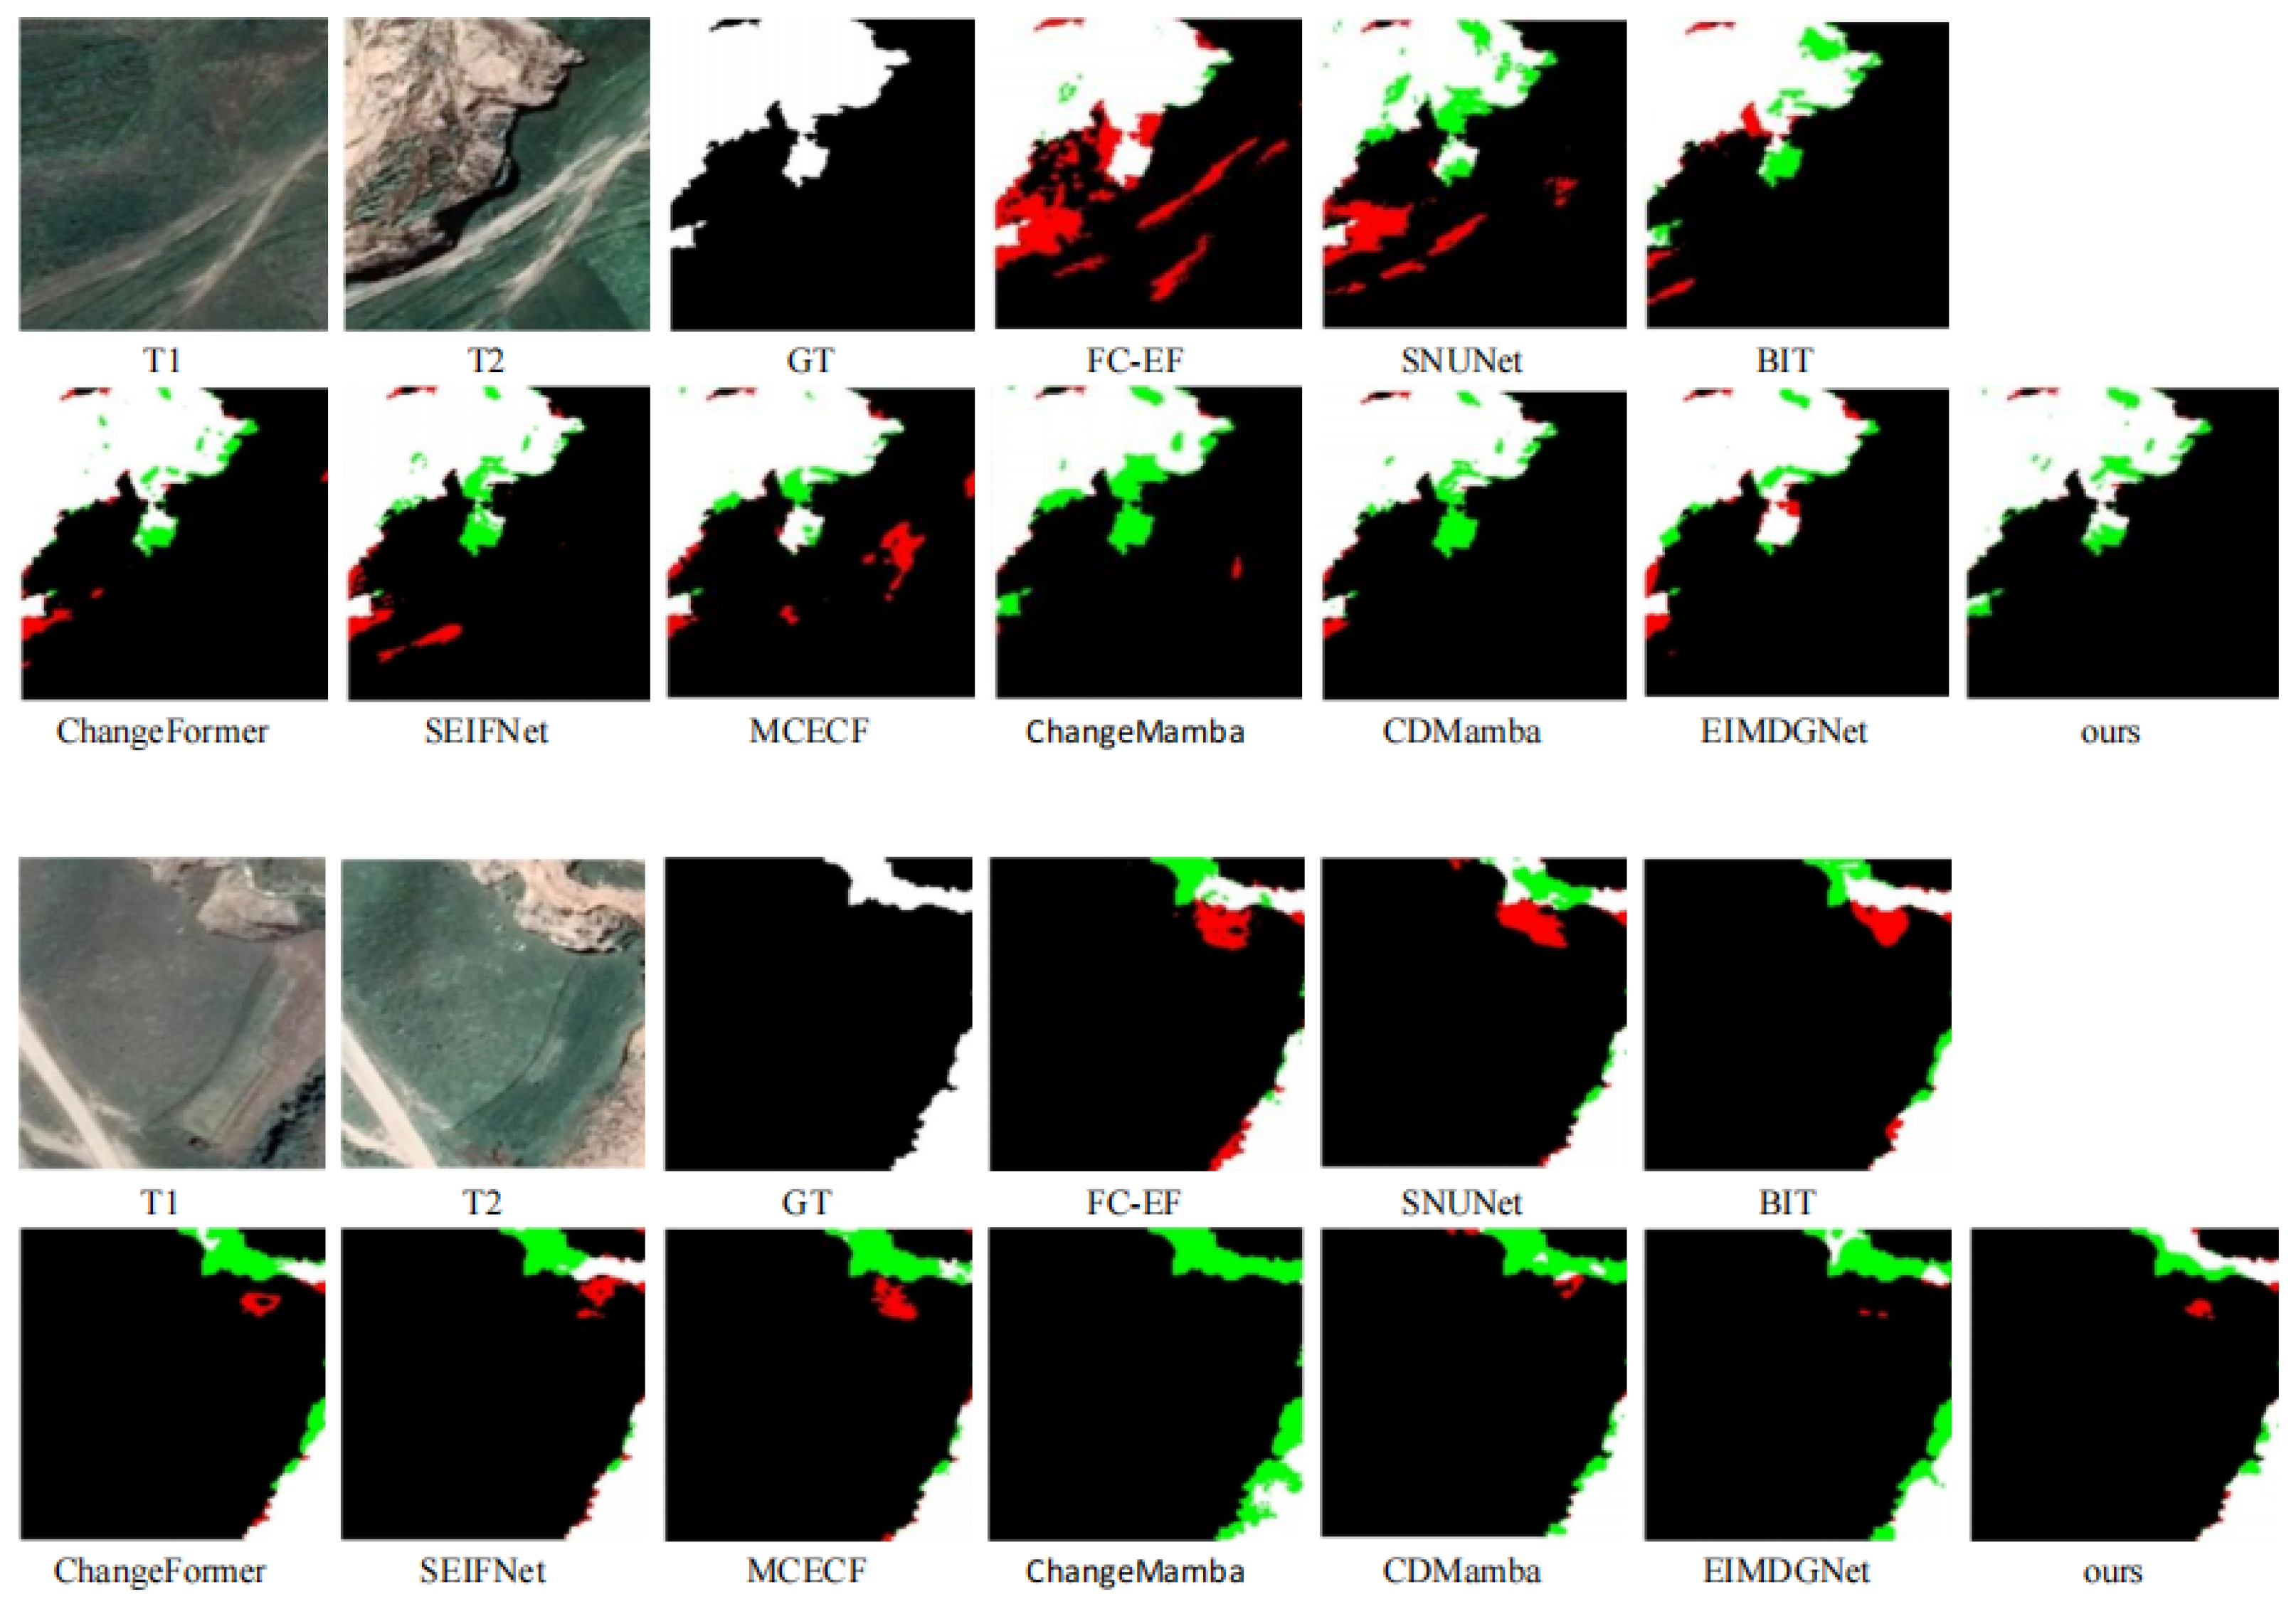
Figure 8,
Figure 9,
Figure 10 and
Figure 11 illustrate the visual comparisons of the change detection results for all evaluated models across the four distinct types of datasets. To facilitate an intuitive comparison, different land-cover categories or changed regions are distinguished by various colors, with the ground truth provided as the reference baseline.
Visual comparisons indicate that the change maps produced by the proposed model contain less noise than those generated by competing methods, while the changed regions are filled more completely and consistently. In terms of boundary delineation, the detected contours are clearer and show stronger agreement with the ground truth, thereby effectively reducing the boundary ambiguity, class confusion, and fragmented detections commonly observed in baseline approaches.
Through cross-dataset comparisons, it is evident that: in the densely built LEVIR-CD and WHU-CD datasets, the model extracts contours of regular man-made objects more neatly; in the CLCD-CD dataset, it sensitively perceives subtle targets while achieving more complete segmentation of large-scale changes amidst complex backgrounds; under the complex GVLM-CD dataset environment, its capability to suppress false alarms is prominent, yielding cleaner and more reliable detection results.
Overall, considering noise suppression, boundary accuracy, detail retention, and adaptability to diverse scenes, the visualization results further demonstrate the robustness and generalization ability of the proposed model in complex surface environments. The generated change maps comprehensively surpass those of existing methods in terms of visual quality, appearing the closest to the ground truth.
4. Discussion
4.1. Ablation Analysis
To verify the contribution of each component in the proposed model, we conduct a systematic ablation study focusing on its key modules. Specifically, the model primarily comprises the following three key components: the hierarchical Transformer encoder (denoted as Component 1), the bi-temporal adaptive local feature tokenization module based on state-space scanning (denoted as Component 2), and the dual-branch difference enhancement and global cross-scale feature fusion decoder (denoted as Component 3). As shown in
Table 2, seven model variants are constructed and tested on four datasets, namely LEVIR-CD, WHU-CD, CLCD-CD, and GVLM-CD. The Baseline corresponds to the basic network after removing the three principal modules. LADENet-1 to LADENet-6 denote configurations formed by introducing different combinations of these modules, whereas LADENet represents the full version of the proposed framework.
The ablation results show that the individual components are all beneficial to model performance, and their integration further strengthens the overall effectiveness through complementary effects. Taking the LEVIR-CD dataset as an example, incorporating Component 1 individually (LADENet-1) improves the F1-score from the Baseline’s 90.22% to 90.43%. When Component 2 is introduced independently, LADENet-2 improves the F1-score and IoU to 90.63% and 82.77%, respectively. Incorporating only Component 3, namely LADENet-3, leads to more substantial performance gains, with the F1-score and IoU reaching 90.82% and 83.54%. These findings provide preliminary evidence that each module can contribute effectively even when deployed separately.
When the components are combined in pairs, the detection performance is further enhanced. Specifically, LADENet-4, which incorporates Components 1 and 2, obtains an F1-score of 90.97% and an IoU of 84.49% on LEVIR-CD. LADENet-5, integrating Components 2 and 3, reaches 91.01% F1 and 84.63% IoU, while LADENet-6, composed of Components 1 and 3, achieves 91.05% F1 and 85.04% IoU. With all three components jointly embedded, the complete LADENet framework delivers the best overall results on the four datasets, yielding 91.06% F1 and 85.28% IoU on LEVIR-CD, 90.51% F1 and 82.45% IoU on WHU-CD, 82.15% F1 and 72.83% IoU on CLCD-CD, and 89.12% F1 and 77.78% IoU on GVLM-CD.
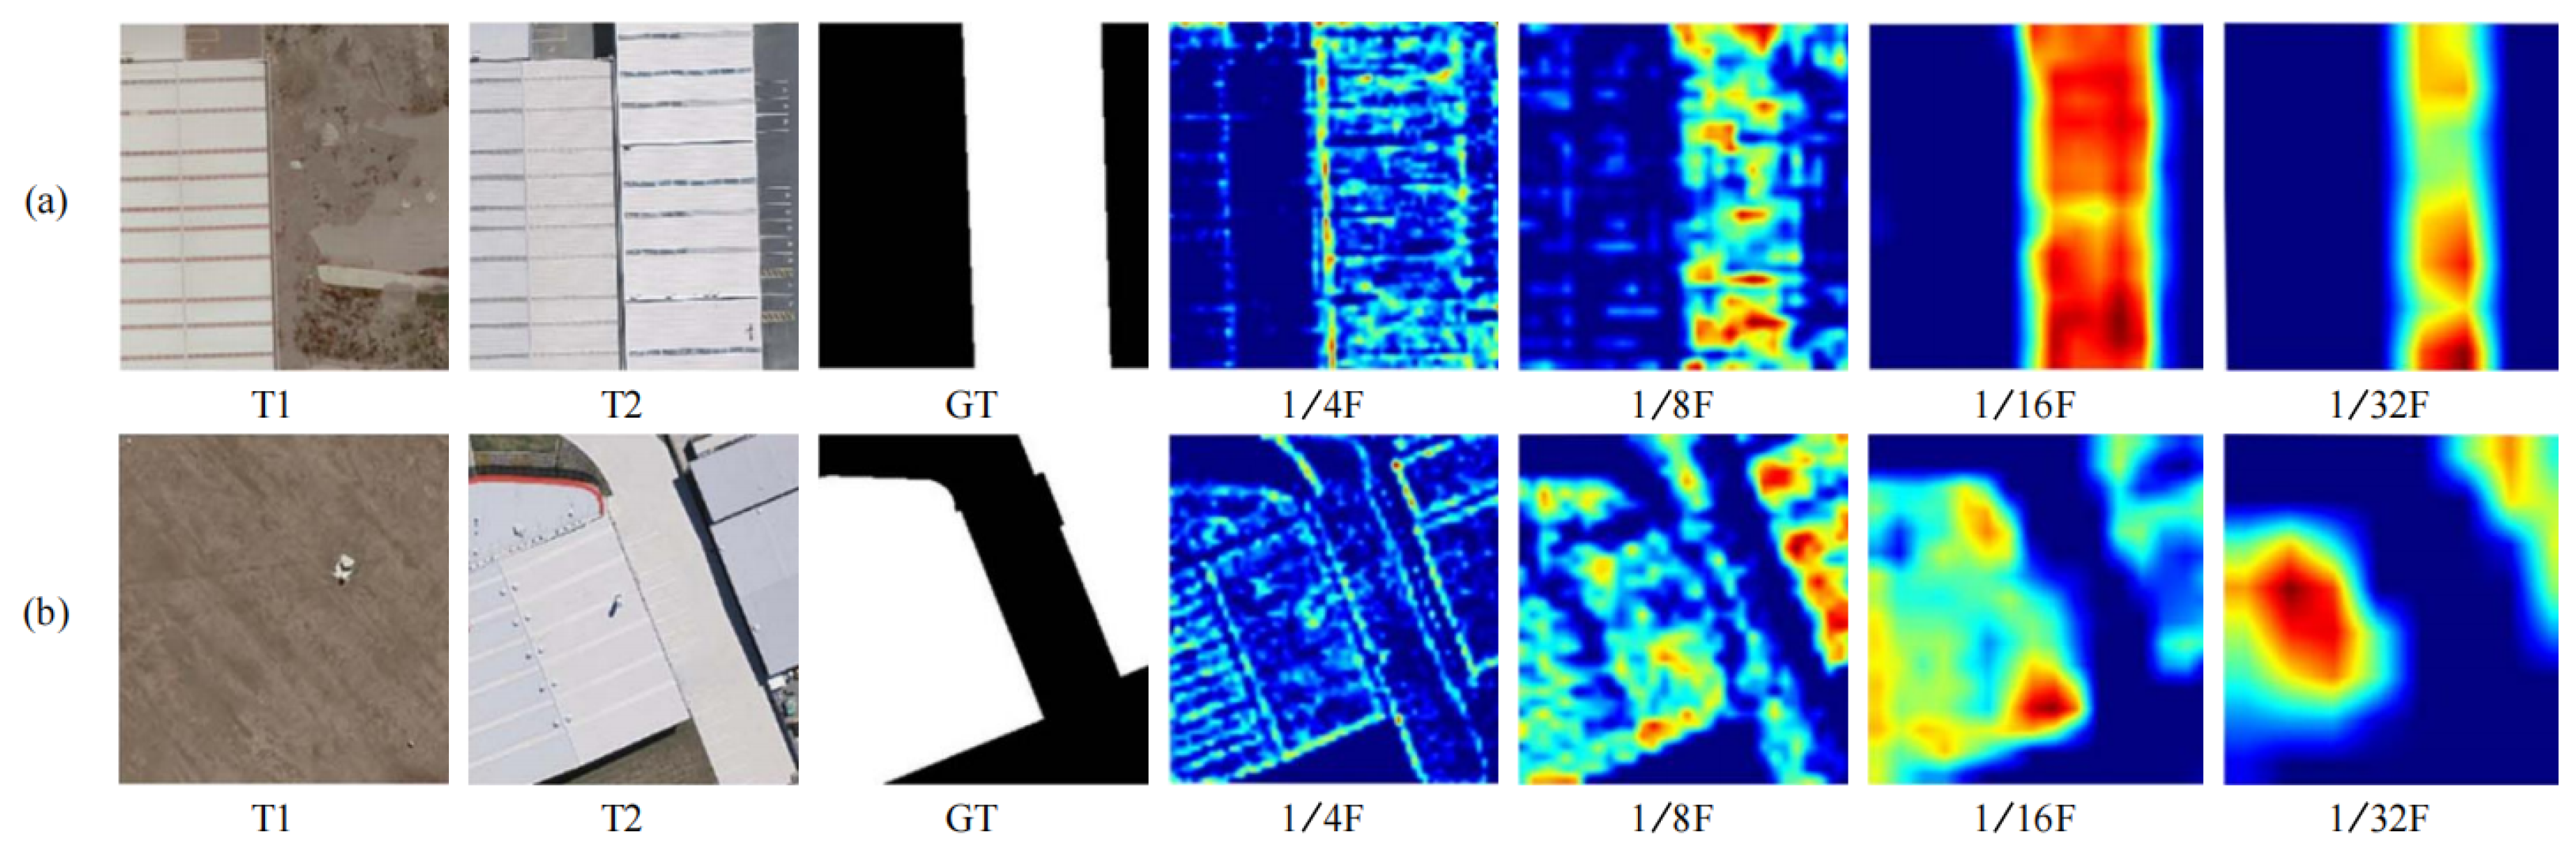
Figure 12 illustrates the feature response maps of the changed regions at different hierarchical levels of the proposed model. It is evident that the shallow features preserve abundant texture and edge information, making them highly suitable for the precise localization of fine-grained changed regions. The middle-level features strike a favorable balance between semantic abstraction and spatial structure, effectively highlighting the overall contours of the changed areas. Conversely, the deep features concentrate on semantically salient regions, capturing the global structure of large-scale changes. These three hierarchical levels are mutually complementary, fully demonstrating the synergistic enhancement effect of multi-level features in the change detection task. Furthermore, this indirectly corroborates the rationality and effectiveness of the proposed modules during the feature extraction and fusion processes.
This systematic ablation analysis fully substantiates the rationality of the proposed model and the efficacy of each core component. As evidenced by the progressive accumulation of performance gains, the hierarchical Transformer encoder lays a robust foundation of rich multi-scale feature representations. The bi-temporal adaptive local feature tokenization module based on state-space scanning effectively bolsters the precise localization capability for changed regions. Furthermore, the dual-branch difference enhancement and global cross-scale feature fusion decoder plays a pivotal role in difference feature enhancement and fine-grained boundary segmentation. Working synergistically, these three components forge a comprehensive technical pipeline—spanning feature extraction, adaptive region filtering, difference enhancement, and cross-scale fusion—which collectively underpins the model’s superior detection performance in complex scenarios.
4.2. Analysis of Model Parameters
Table 3 reports the quantitative comparison between the proposed method and representative change detection approaches on four public benchmarks, including LEVIR-CD, WHU-CD, CLCD-CD, and GVLM-CD. To provide a comprehensive assessment of model performance and efficiency, this subsection considers F1-score, IoU, parameter size (Params), and computational cost (FLOPs). The experimental results show that, with a moderate model scale of 23.4 M parameters and a computational burden of 43.28 G FLOPs, the proposed method achieves highly competitive detection accuracy on all four datasets. In particular, its superior IoU performance, which reflects the completeness of changed-region segmentation, further confirms that the model effectively balances detection capability and computational efficiency.
On the LEVIR-CD dataset, the proposed model achieves the highest IoU of 85.28%, surpassing the second-best SEIFNet (83.40%) by 1.88% and CDMamba (83.07%) by 2.21%. Although its F1-score (91.06%) is slightly lower than that of EIMDGNet (91.49%), the evident advantage in IoU sufficiently demonstrates its stronger capability in fine-grained segmentation and precise boundary delineation of changed regions. On the WHU-CD dataset, the proposed model ranks first in both F1-score and IoU, reaching 90.51% and 82.45%, respectively, thereby achieving consistent improvements over CDMamba on these two key metrics. Furthermore, utilizing merely 52% of ChangeMamba’s parameters (48.56 M), it secures a 0.43% F1-score improvement, vigorously validating its parameter efficiency. On the challenging CLCD-CD dataset, it substantially leads existing methods with an 82.15% F1-score and 72.83% IoU, yielding improvements of 1.69% over MCECF (80.46% F1) and 2.92% over EIMDGNet (69.91% IoU). This fully validates its holistic perception and segmentation capabilities within complex scenes. On the GVLM-CD dataset, the model achieves the optimal 89.12% F1-score, surpassing CDMamba (88.10%) by 1.02% and demonstrating excellent cross-scene generalization. In summary, averaging a 79.59% IoU across all four datasets, the observed equilibrium between accuracy and resource consumption renders it a superior solution possessing theoretical significance and practical potential for high-resolution remote sensing change detection.
4.3. Analysis of Loss Function Coefficients
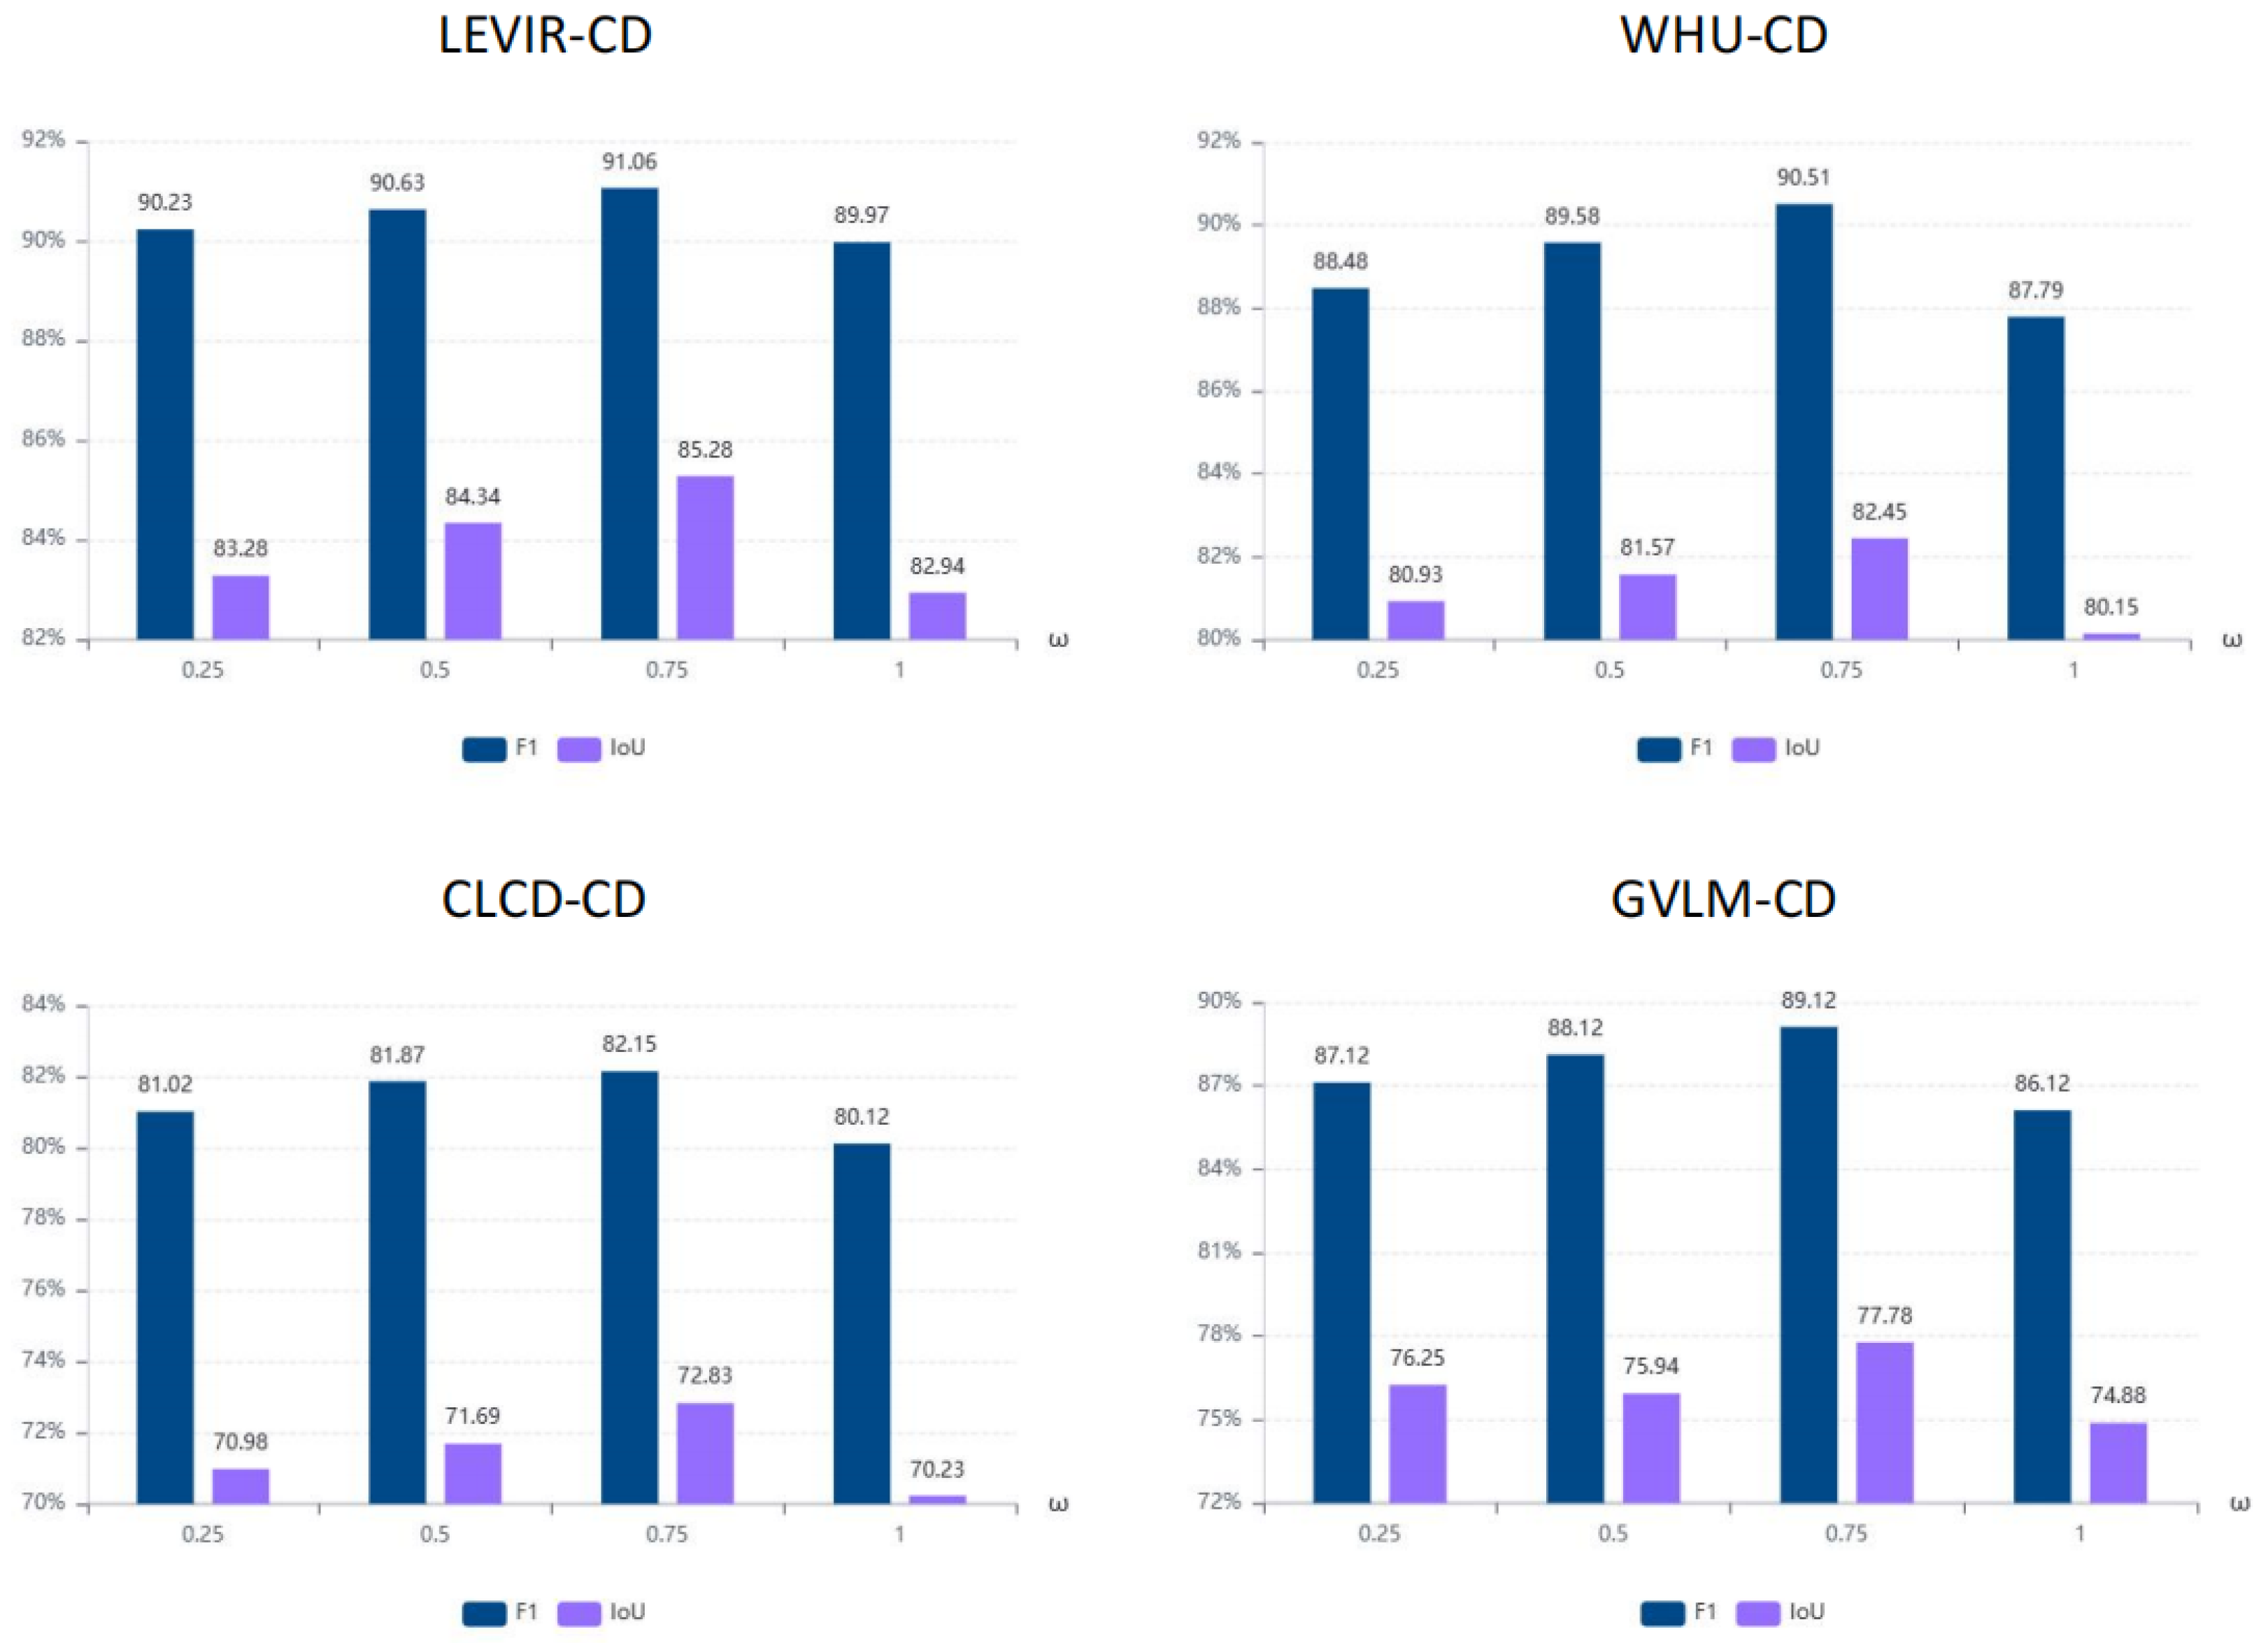
To investigate how the loss-weighting coefficient affects the balance between different supervisory objectives, this subsection keeps all remaining experimental configurations unchanged and varies the trade-off parameter
between BCE loss and Dice loss from 0 to 1 at an interval of 0.25. As illustrated in
Figure 13, the proposed method maintains relatively stable performance within this range, suggesting that moderate changes in the loss-weighting strategy do not cause significant fluctuations in overall accuracy. Across the LEVIR-CD, WHU-CD, CLCD-CD, and GVLM-CD datasets, the best results are consistently obtained when
, which highlights the necessity of assigning an appropriate balance between the two loss terms. This configuration enables the model to simultaneously consider pixel-level classification reliability and region-level structural integrity. Therefore, to reduce the complexity of parameter selection while maintaining detection performance,
is empirically set to 0.75 during model selection.
5. Conclusions
In this article, we propose a bi-temporal remote sensing image change detection framework that integrates Convolutional Neural Networks (CNNs), Transformers, State-Space Models (SSMs), and attention mechanisms. This framework ensures the consistency of bi-temporal features by utilizing a shared-weight feature extraction network and generates multi-level features—encompassing high-resolution coarse features and low-resolution fine-grained features—through a hierarchical Transformer encoder. To alleviate the computational burden of self-attention on high-resolution images, a sequence reduction strategy is introduced to decrease complexity. During the feature enhancement stage, a bi-temporal adaptive local feature tokenization module based on state-space scanning is designed. Via an adaptive scanning strategy, this module conducts a region-wise importance evaluation on the feature maps, screens out local regions with salient changes, and integrates cross-temporal state-space scanning to accomplish pixel-aligned spatio-temporal context modeling. To tackle the information loss induced by window partitioning, a sliding window boundary calibration mechanism is incorporated, which compensates for boundary deficits through multi-directional cyclic shifts. To fully exploit bi-temporal difference information, a dual-branch difference enhancement module is constructed. This module integrates the attention-refined differential features produced by the subtraction branch with the multi-scale contextual representations extracted from the concatenation branch, thereby strengthening the discriminative expression of changed regions while reducing the influence of irrelevant background interference. During the decoding phase, the global cross-scale spatial feature fusion decoder exploits the complementary roles of spatial attention and 2D Selective Scan (SS2D), enabling an effective balance between the retention of local details and the perception of global context, and thus facilitating more refined multi-scale feature integration. Finally, considering the intrinsic class imbalance in change detection tasks, Binary Cross-Entropy (BCE) loss and Dice loss are jointly employed to construct a hybrid optimization objective, which contributes to coordinating model convergence with the learning of positive and negative samples. Experimental results on four public datasets show that the proposed framework achieves superior performance in both quantitative evaluation and visual comparison, further confirming its robustness and generalization ability under complex land-cover scenarios.
Despite its effectiveness, LADENet still has several limitations. First, the adaptive local token selection and repeated shifted scanning operations introduce additional computational overhead compared with simpler encoder–decoder frameworks. Second, the current model mainly focuses on optical remote sensing image pairs, and its robustness under severe seasonal variations, radiometric inconsistency, and cross-sensor scenarios still requires further investigation. In future work, we will explore more lightweight adaptive scanning strategies, automatic hyperparameter selection, and extensions to multi-modal or cross-sensor change detection tasks.