Article

Spatiotemporal Evolution of Ecological Environment Quality and Driving Factors in the Loess Plateau of Northern Shaanxi

College of Geological Engineering and Geomatics, Chang’an University, Xi’an 710054, China
*
Author to whom correspondence should be addressed.
Remote Sens. 2026, 18(13), 2219; https://doi.org/10.3390/rs18132219
Submission received: 2 June 2026 / Revised: 2 July 2026 / Accepted: 3 July 2026 / Published: 6 July 2026

Highlights

What are the main findings?
  • Between 2000 and 2024, the ecological environment quality of the Loess Plateau in northern Shaanxi showed a fluctuating upward trend; the mean RSEI rose from 0.376 in 2000 to 0.545 in 2024, with its quality grade improving from “poor” to “moderate.”
  • Geomorphological type was introduced as a driving factor to explore the spatial distribution of RSEI; its multi-year average q-value reached 0.701, indicating that it significantly shapes the spatial distribution of RSEI.
What are the implications of the main findings?
  • The results offer a scientific foundation and decision-making support for regional ecological conservation.
  • Assessment of the spatiotemporal dynamics of ecological environment quality on the Northern Shaanxi Loess Plateau is key to reinforcing the Yellow River Basin’s ecological security barrier.

Abstract

Accurately assessing the spatiotemporal evolution of ecological environment quality (EEQ) on the Loess Plateau of Northern Shaanxi is of great significance for consolidating the ecological security barrier of the Yellow River Basin. Most of the existing research focuses on a single ecological theme, which does not reflect the overall ecological status of the region. In this study, a remote sensing ecological index (RSEI) model was constructed to systematically assess the EEQ from 2000 to 2024. The Theil–Sen estimator, Mann–Kendall test, and Hurst exponent were jointly employed to detect change significance and predict future trends, while the Geodetector model was applied to explore driving factors. The results were as follows: (1) EEQ exhibited a fluctuating but overall upward trend, with the mean RSEI rising from 0.376 in 2000 to 0.545 in 2024—an average annual increase of approximately 0.00569. (2) Spatially, a distinct pattern of “higher in the south, lower in the north and the lowest in the northwest” was observed. Over the 25-year period, the combined proportion of “excellent” and “good” grades increased by roughly 20 percentage points, and the “moderate” grade expanded from 13.61% to 47.12%. (3) Areas showing an improving trend accounted for 91.21% of the total area and highly overlapped with those projected to improve in the future. (4) Single-factor detection revealed that geomorphological type exerted the greatest influence on the spatial heterogeneity of EEQ, with a multi-year mean q-value of 0.701. Interaction detection further indicates that the geomorphology–land use interaction may continue to shape the regional EEQ’s spatial distribution. These findings provide a scientific basis for precise ecological restoration planning and spatial optimization on the Loess Plateau of Northern Shaanxi.

1. Introduction

The EEQ refers to the virtues or defect degree of an ecological environment, which is directly linked to the sustainability of regional economic development and to human welfare [1,2,3]. Under the dual pressures of intensifying global climate change and frequent human activities, global terrestrial ecosystems are undergoing profound and complex transformations [4]. The Loess Plateau of Northern Shaanxi is located in the core area of the Loess Plateau in China, which belongs to the typical agro-pastoral ecotone and arid and semi-arid transition region. Characterized by extreme ecological sensitivity, the region has historically suffered from severe environmental degradation, particularly soil erosion, desertification, and vegetation loss [5,6]. As a crucial ecological security barrier and an energy and chemical industry base in China, this region has implemented a series of large-scale ecological restoration projects since 1999, such as the Grain for Green program and gully land consolidation, as a result, these efforts have substantially increased regional vegetation cover, contributing significantly to global greening trends [7,8,9]. However, some studies have pointed out that the large-scale vegetation restoration in this area has approached the limit of regional water resources carrying capacity, and the potential ecological degradation risk cannot be ignored [10,11]. Concurrently, with the rapid advancement of intensive coal resource exploitation and new-type urbanization, human–land conflicts within the region remain prominent [12]. Consequently, continuous and systematic monitoring of EEQ dynamics in this region, alongside a rigorous investigation of the underlying driving mechanisms, is essential for advancing ecological conservation and sustainable development strategies in the Yellow River Basin.
Accurate assessment of EEQ is a prerequisite for regional ecological protection and restoration. Traditional ecological environment evaluations have largely relied on single remote sensing indicators, such as the Normalized Difference Vegetation Index (NDVI), Land Surface Temperature (LST), and Net Primary Productivity (NPP) [13,14]. However, ecosystems are complex systems composed of multiple interacting elements, and a single indicator is often insufficient to comprehensively and objectively characterize the overall state and spatiotemporal heterogeneity of the ecological environment. Consequently, multi-indicator comprehensive evaluation systems have become the standard approach. The RSEI is an indicator that comprehensively reflects the overall condition of regional EEQ by integrating greenness, wetness, heat, and dryness, by employing Principal Component Analysis (PCA) to determine indicator weights objectively, the RSEI avoids the biases inherent in subjective weighting methods [15,16]. This model not only captures regional ecological characteristics comprehensively but also provides robust spatial visualization. It has been widely validated as a reliable tool for assessing complex surface ecologies across various scales, including urban areas, watersheds, mining sites, and nature reserves globally [17,18,19,20]. In the context of large-scale and long-term dynamic monitoring of the ecological environment and driving force analysis, the Google Earth Engine (GEE) cloud computing platform has resolved the computational bottlenecks associated with traditional local processing, significantly enhancing the efficiency and spatiotemporal continuity of remote sensing assessments [21,22]. Furthermore, integrating the Theil-Sen median, Mann–Kendall test, and Hurst exponent allows researchers to mitigate the interference of outliers and accurately characterize the spatiotemporal change trends of EEQ and the sustainability of its future evolution [2,23,24]. Regarding the exploration of driving mechanisms, the evolution of regional ecological environments is typically the combined result of natural climate fluctuations and human activity disturbances [25,26]. The Geodetector model as a statistical method for detecting spatial heterogeneity and revealing the driving forces behind it, has become a mainstream and authoritative tool for identifying the compound driving mechanisms of the ecological environment, owing to its ability to effectively quantify the explanatory power of individual factors and precisely reveal the interactive synergistic effects among multiple factors [27,28,29].
Recent studies have explored long-term environmental changes on the Loess Plateau of Northern Shaanxi. For instance, Xue Zhou and Yang Zhou [30] investigated land use changes in the region from 1980 to 2020, finding that the Grain for Green program and precipitation had significant impacts on land use. Zhuo et al. [31], utilizing the Sensitivity–Resilience–Pressure model, indicated that ecological restoration projects were the main driving force behind the substantial improvement of the ecological vulnerability on the Loess Plateau of Northern Shaanxi. Bai et al. [32] employed MODIS remote sensing vegetation indices and the Vegetation Interface Process (VIP) model to study the water–carbon balance, revealing that human activities are the dominant driving factor in the evolution of the water–carbon balance in the region. Zhang et al. [33] used methods such as the random forest model to investigate the dynamic response of vegetation under the dual effects of climate change and human activities, showing that climate change is closely related to vegetation changes in Northern Shaanxi. Although recent studies have explored long-term environmental changes on the Loess Plateau of Northern Shaanxi, they have predominantly focused on single aspects such as land use change, ecological vulnerability, water–carbon balance, or vegetation dynamics. A long-term assessment of the overall ecological environment status of this region has not yet been conducted.
Taking the Loess Plateau of Northern Shaanxi as the study area, this study constructed a RSEI based on the Google Earth Engine (GEE) cloud computing platform and multi-source remote sensing data spanning 2000 to 2024 to assess the regional EEQ. The Theil–Sen median trend analysis, the Mann–Kendall test, and the Hurst exponent are integrated to comprehensively and dynamically monitor the spatiotemporal evolution patterns and future persistence of EEQ in the region over this period. On this basis, the Geodetector is further applied to quantitatively dissect the key driving factors behind the spatial differentiation of EEQ and their complex interactive synergistic mechanisms from the multiple dimensions of natural climate, topography, and human activities. This study will provide theoretical support and scientific guidance for the implementation of ecological restoration projects on the Loess Plateau of Northern Shaanxi.

2. Materials and Methods

2.1. Study Area

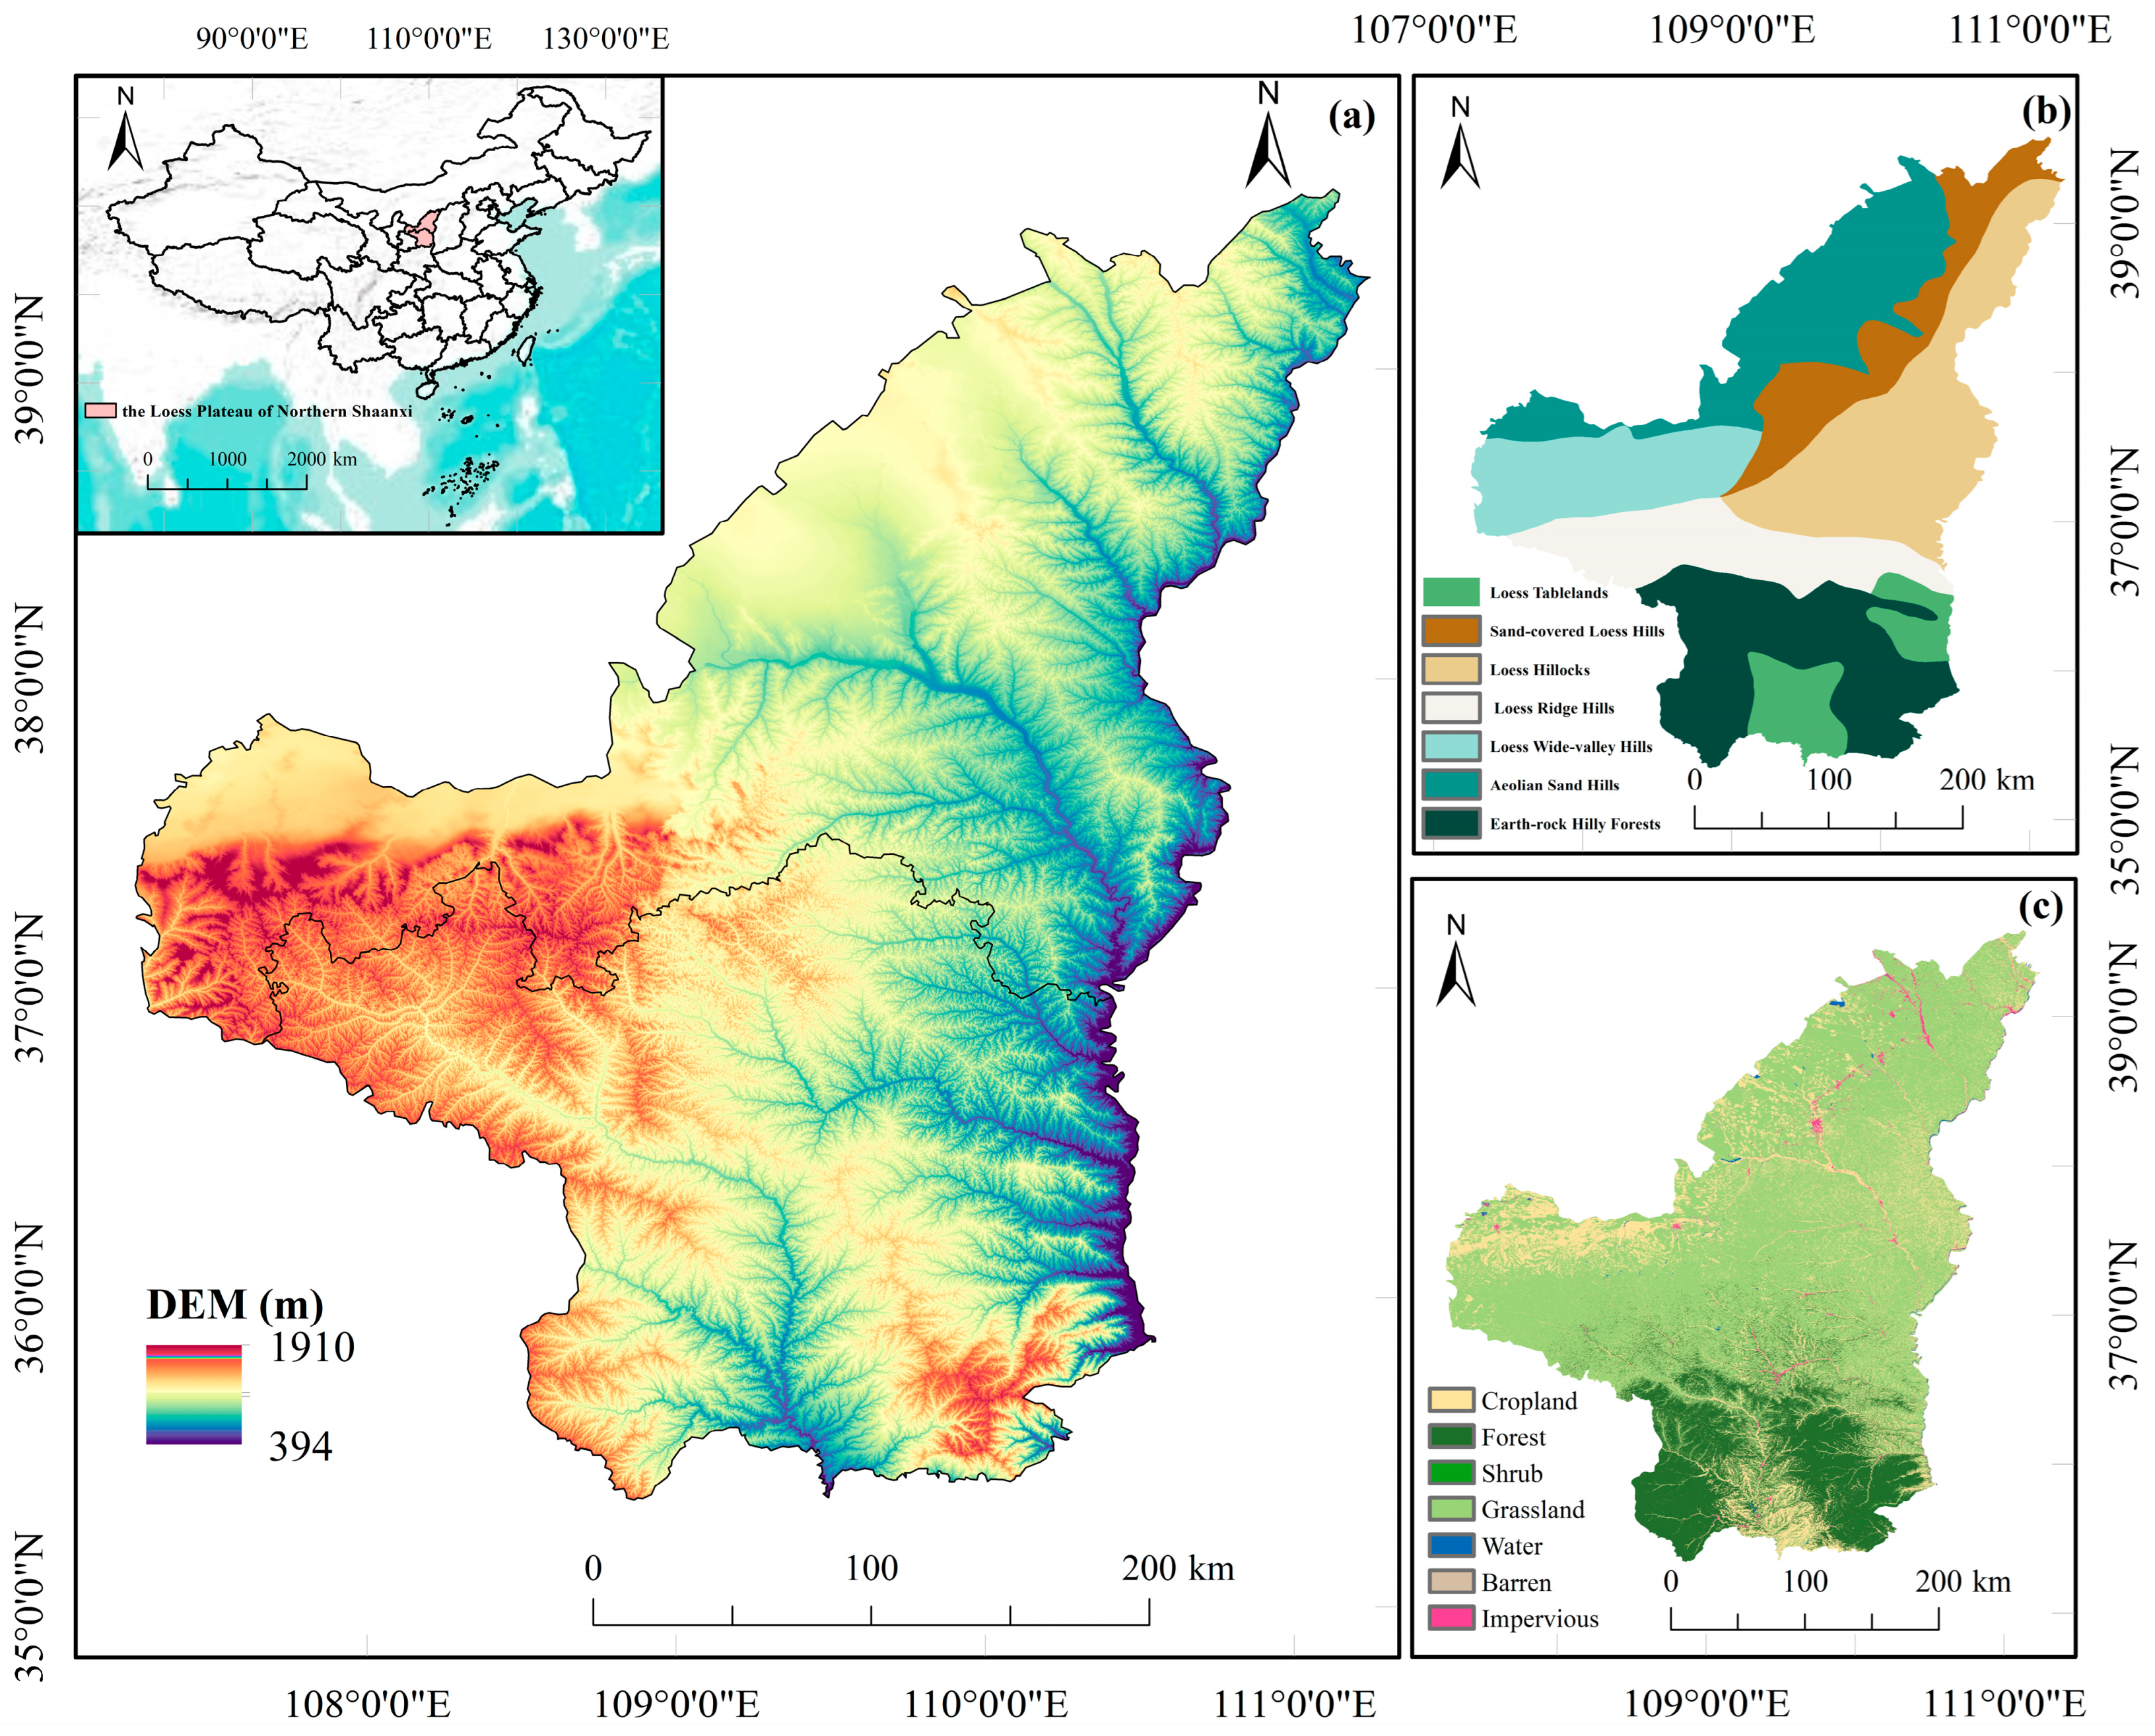
The Loess Plateau of Northern Shaanxi (34°49′–39°35′N, 107°10′–111°14′E) is located in the northern part of Shaanxi Province, China, encompassing the municipalities of Yulin and Yan’an, with a total area of approximately 8.0 × 10⁴ km2 (Figure 1a) [34]. The study area lies within a transitional zone from a warm–temperate continental monsoon climate to a temperate semi–arid climate, with a mean annual temperature ranging from about 7 to 11 °C and mean annual precipitation of approximately 450 mm [35]. Precipitation exhibits strong seasonal unevenness, concentrating primarily in summer, and spatially decreases from southeast to northwest. Topographically, the elevation ranges from approximately 400 to 1900 m, gradually descending from northwest to southeast. The predominant geomorphological types include aeolian sand hills, sand-covered loess hills, loess tablelands, loess ridge hills, loess hillocks, loess wide-valley hills, and earth-rock hilly forests (Figure 1b). The region is characterized by a highly fragmented land surface crisscrossed by numerous gullies, where the soil is loose and exhibits poor erosion resistance. Vegetation exhibits distinct spatial zonation: deciduous broadleaf forests occur in the southeast, a forest-steppe transition zone occupies the central part, and typical steppe and desert steppe dominate the northwest [36] (Figure 1c). Due to its extreme ecological fragility and severe historical soil erosion, the region serves as a core implementation area for national ecological restoration initiatives, including the Grain for Green Program and the Three-North Shelterbelt Forest Program [37,38].

2.2. Data Sources

This study selected MOD09A1, MOD11A2, and MOD13A1 remote sensing imagery from the GEE. To capture peak vegetation growth, images acquired between July and September from 2000 to 2024 were selected and standardized to a 500 m spatial resolution. Cloud masking was performed using the C Function of Mask (CFMASK) algorithm on the GEE platform, and water bodies within the study area were masked with the Modified Normalized Difference Water Index (MNDWI) to improve the accuracy of the wetness indicator [40].
The land cover data (30 m) adopted in this study were sourced from the China Land Cover Dataset (CLCD) provided by Wuhan University. Nighttime light data (1000 m) were obtained from the National Tibetan Plateau Data Center (https://data.tpdc.ac.cn, accessed on 3 March 2026). Annual mean temperature and annual precipitation data (1000 m) were acquired from the National Earth System Science Data Center (http://www.geodata.cn, accessed on 1 March 2026). Root-Zone Soil Moisture data (0.1°) were derived from the GLEAM dataset (https://www.gleam.eu, accessed on 31 March 2026). Topographic variables including elevation and slope were extracted from a 30 m DEM provided by the Geospatial Data Cloud (https://www.gscloud.cn, accessed on 4 March 2026). Geographical zoning data were supplied by the Loess Plateau SubCenter of the National Earth System Science Data Center (http://loess.geodata.cn, accessed on 30 March 2026). The coordinate system was unified to WGS_1984 using ArcGIS (10.8.1).
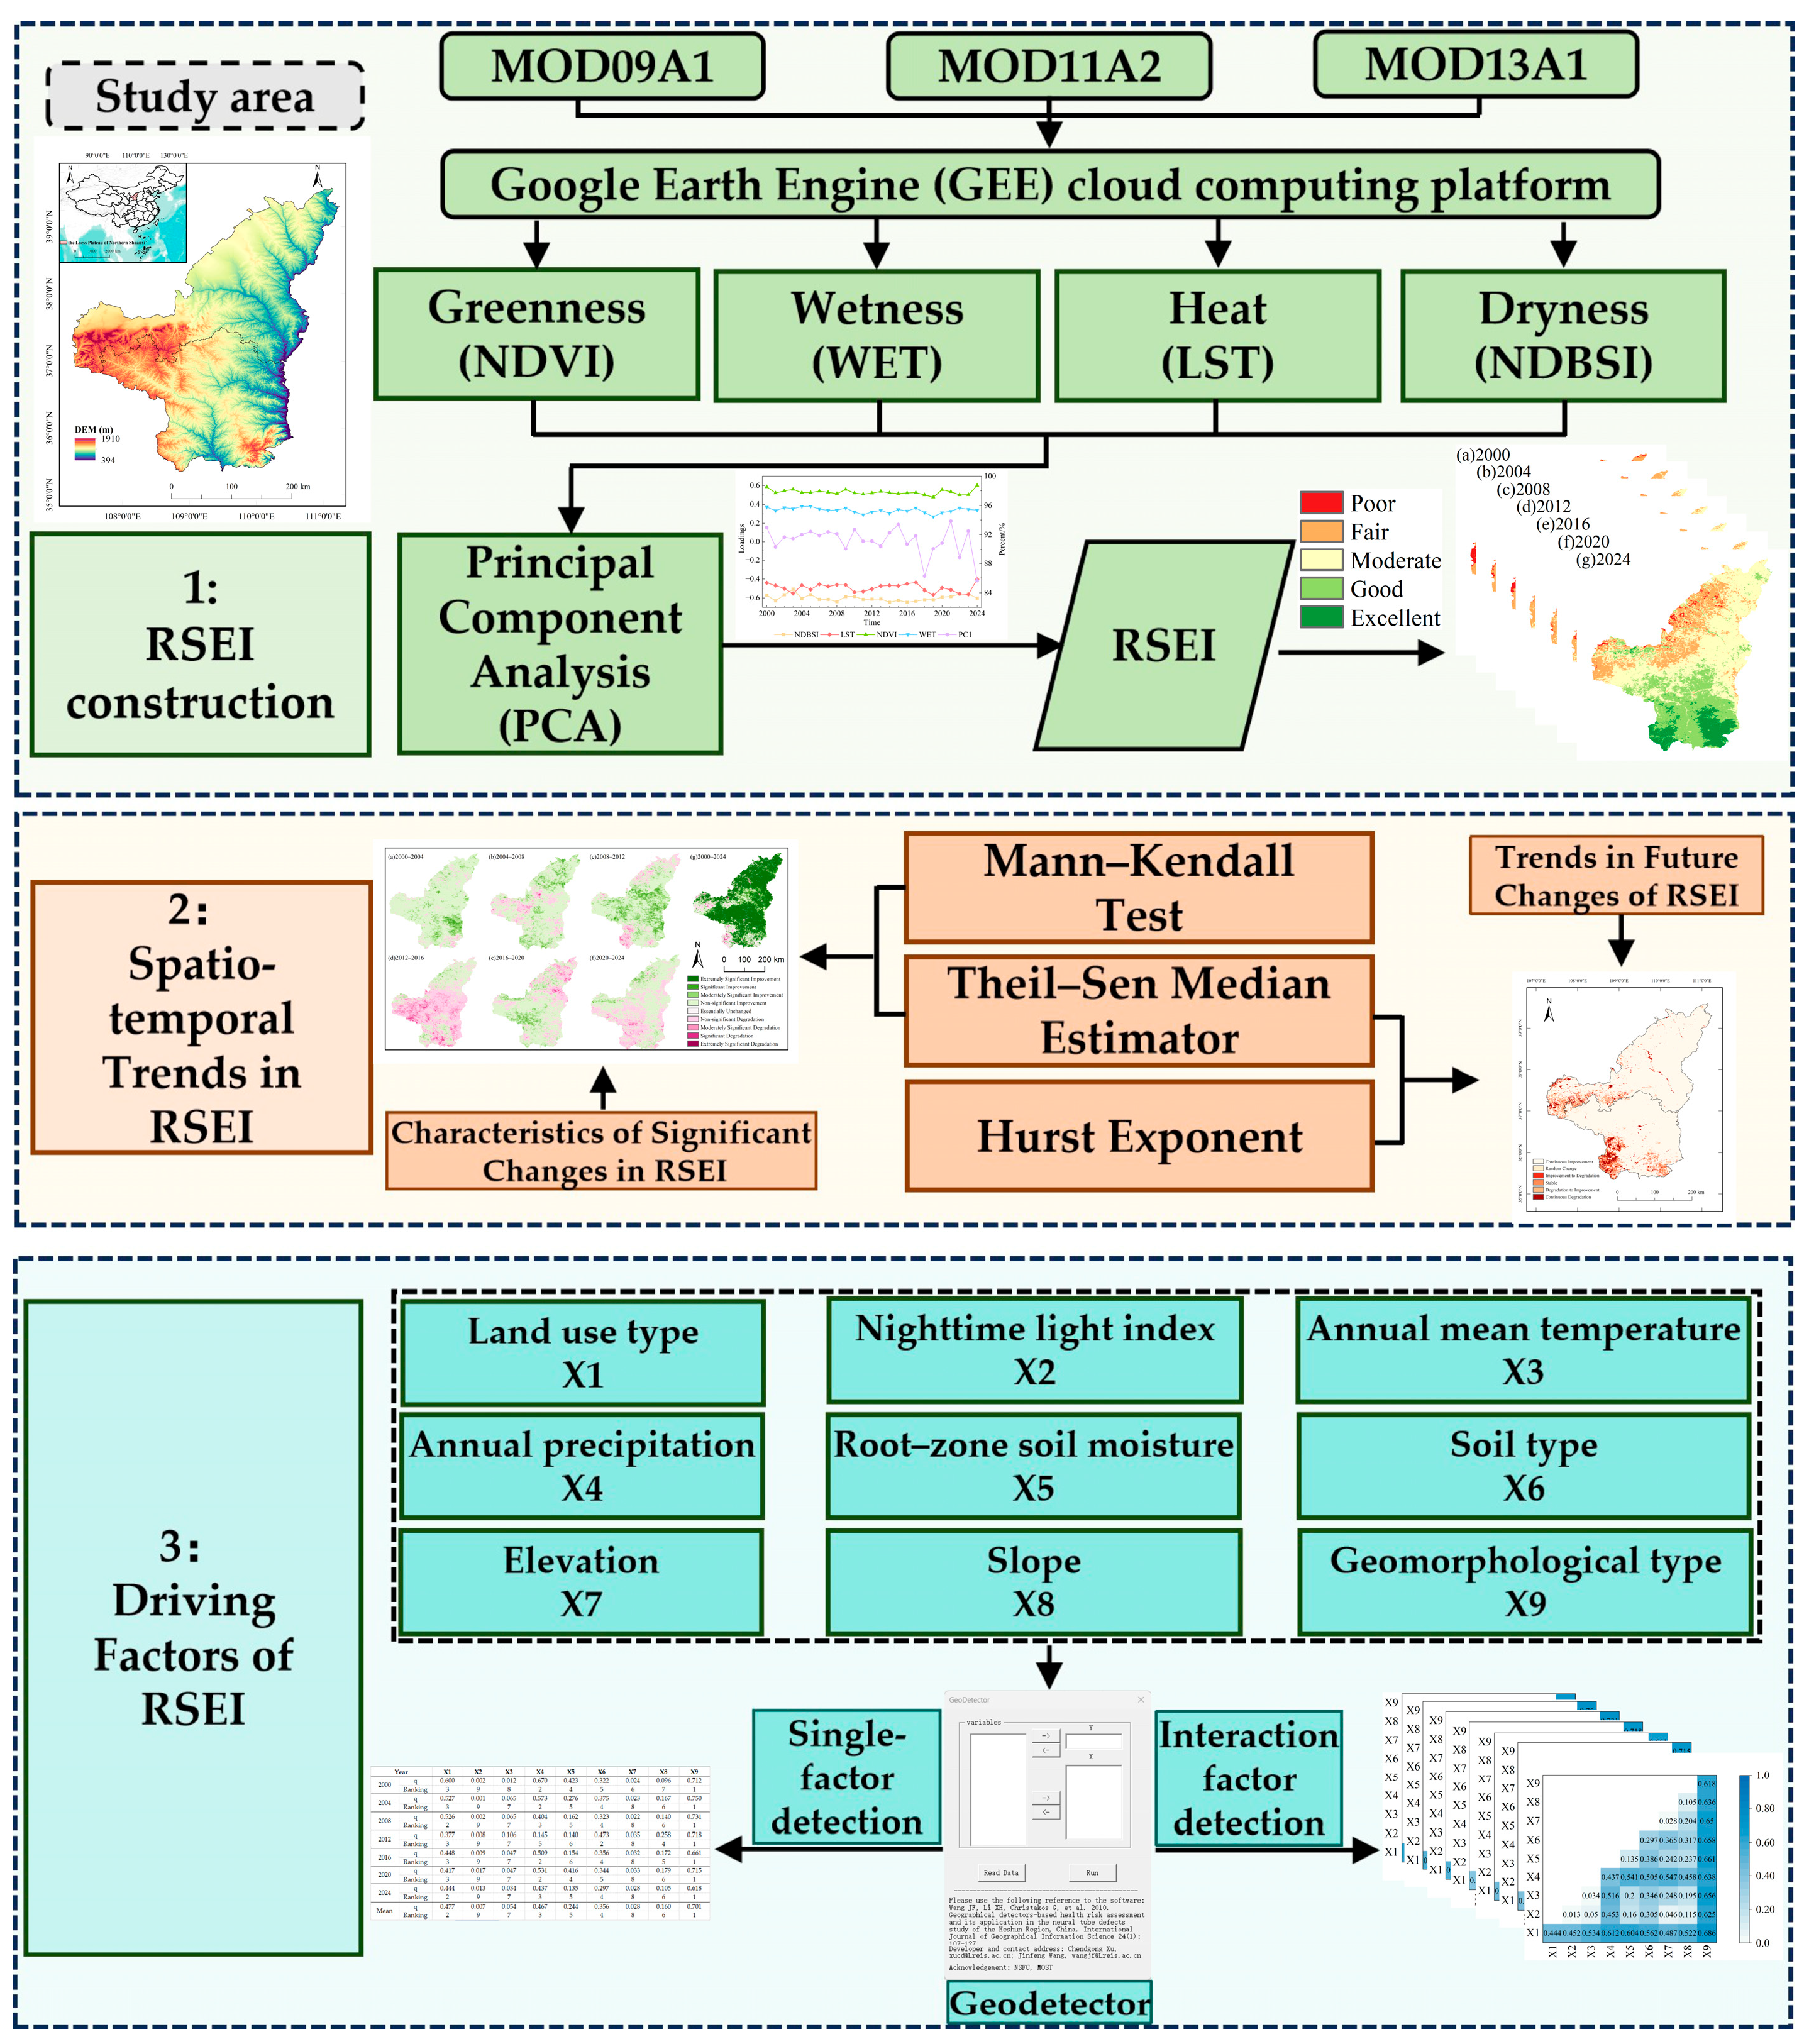
Figure 2 presents the three-phase methodological framework. Phase one constructs the RSEI via PCA on the Google Earth Engine, synthesizing four indices: Greenness (NDVI), Wetness, Heat (LST), and Dryness (NDBSI). Phase two evaluates historical spatiotemporal variations and future trends using the Mann–Kendall test, Theil-Sen median, and Hurst exponent. Phase three applies the Geodetector to perform single-factor and interaction detection across nine driving factors, including climate, soil, and land use, to reveal the underlying drivers of RSEI changes.

2.3. Research Methods

2.3.1. RSEI Model

The RSEI integrates four ecological indicators: greenness, wetness, heat, and dryness. PCA was employed to reduce the dimensionality of these indicators, synthesizing their core features into the PC1. Specifically, greenness, represented by the NDVI, reflects vegetation cover and growth vigor. Wetness characterizes the moisture of soil and vegetation, serving as a reliable proxy for regional ecological conditions. Dryness, synthesized from the Index-based Built-up Index (IBI) and the Soil Index (SI), indicates the desiccation level of impervious surfaces and bare soil. Heat is represented by the LST, retrieved via the atmospheric correction method [41,42].
The four ecological indicators were first normalized and then subjected to PCA. The initial RSEI0 was determined according to the signs of the loading values of the greenness and wetness components. Subsequently, RSEI0 was normalized to yield the RSEI [43]. The detailed calculation formulas are as follows:
RSEI 0 = PC 1 ( f ( NDVI , WET , NDBSI , LST ) ) , V NDVI , V WET > 0 1 PC 1 ( f ( NDVI , WET , NDBSI , LST ) ) , V NDVI , V WET < 0
RSEI = RSEI 0 RSEI 0 , min RSEI 0 , max RSEI 0 , min
where RSEI0 represents the initial remote sensing ecological index, f refers to the normalization process applied to each of the four indicators. VNDVI and VWET represent the eigenvectors of the PC1 corresponding to NDVI and WET.
Refer to previous study [44], the RSEI values are classified into five EEQ grades: poor [0, 0.2], fair (0.2, 0.4], moderate (0.4, 0.6], good (0.6, 0.8], and excellent (0.8, 1.0].

2.3.2. Theil–Sen Median Estimator and Mann Kendall Test

The Theil–Sen Median trend analysis is a non-parametric statistical method for estimating the trend slope, which is suitable for trend detection in time series data [45]. The formula for Sen’s slope is as follows:
Q RSEI = Median RSEI j RSEI i j i
where QRSEI represents the trend of data change over the time series; Median is the median function; RSEIi and RSEIj are the RSEI values at times i and j (j > i). A positive QRSEI indicates an increasing trend, whereas a negative value signifies a decreasing trend.
The Mann–Kendall test is used to indicate the statistical significance of the trend [46]. The test statistic S is calculated as follows:
S = i = 1 n 1 j = i + 1 n sgn ( RSEI j RSEI i )
sgn ( RSEI j RSEI i ) = 1 , RSEI j > RSEI i , 0 , RSEI j = RSEI i , 1 , RSEI j < RSEI i .
Var ( S ) = 1 18 n ( n 1 ) ( 2 n + 5 ) k = 1 p q k ( q k 1 ) ( 2 q k + 5 )
Z = S 1 Var ( S ) , S > 0 , 0 , S = 0 , S + 1 Var ( S ) , S < 0 .
where Var(S) denotes the variance, n is the number of data points, and Z represents the standardized test statistic, p is the number of tied groups, and qk is the number of data points in the k-th tied group.
To eliminate the confounding effects of temporal autocorrelation (serial correlation) in long-term annual time series, which can inflate the variance of the standard Mann–Kendall test statistic and lead to spurious significance, this study implemented the Modified Mann–Kendall test based on a variance correction approach [47].
First, the lag-1 autocorrelation coefficient (r1) of the detrended RSEI series was calculated at the 95% confidence level. For pixels exhibiting no significant serial correlation, the standard Mann–Kendall test was retained. For pixels where serial correlation was statistically significant ( | r 1 | > 1.96 / n , where n is the sequence length), a variance correction factor ( n / n * ) was computed to adjust the variance of the test statistic S. The corrected variance, V a r * ( S ) , is expressed as:
V a r * ( S ) = V a r ( S ) n n *
The correction factor is formulated as:
n n * = 1 + 2 n ( n 1 ) ( n 2 )   i = 1 n 1 ( n i ) ( n i 1 ) ( n i 2 ) ρ s ( i )
where ρ s ( i ) represents the autocorrelation function of the ranks of the observations. The standardized test statistic Z * was then calculated by substituting V a r S with V a r * ( S ) in Equation (7). This modification robustly suppresses the influence of temporal dependency, ensuring that the detected ecological trends are statistically rigorous.
In this study, the Theil–Sen median trend analysis was employed in conjunction with the Mann–Kendall test for trend significance testing.

2.3.3. Hurst Exponent

In this study, the Hurst exponent was employed to characterize the trend persistence, using the R/S analysis method [48]. The Hurst exponent ranges from 0 to 1. When the H value is around 0.5, the data exhibit a lack of persistence. When H lies between 0 and 0.5, the data display pronounced anti-persistence. When H falls within the range of 0.5 to 1, the time series is characterized by persistent behavior [49].

2.3.4. Geodetector Model

The Geodetector model is a spatial statistical analysis model that is suitable for detecting spatial heterogeneity and the degree of interaction between influencing factors [50]. The factor detector is employed to quantify the influence of each driving factor on EEQ. The q-value, as a quantitative metric, increases with the explanatory power of the factor on RSEI. The formula for calculating the q-value is as follows:
q = 1 h = 1 L N h δ h 2 N δ 2
where q represents the degree of influence of the driving factor on RSEI; h = 1, 2, … L, where L is the number of strata of the RSEI and the independent variable; Nh and N denote the number of sample units in stratum h and the entire region, respectively; and δh2 and δ2 represent the variance of RSEI in stratum h and the entire region, respectively.
The interaction detector is employed to identify the interactions between different driving factors, as well as the direction and strength of their influence on the spatial differentiation of the dependent variable. Specifically, it determines whether the interaction between factors enhances or weakens the explanatory power regarding the spatial pattern of the dependent variable. Based on different ranges of q-values, the interactions can be classified into five types, as presented in Table 1.

3. Results

3.1. Principal Component Analysis Results

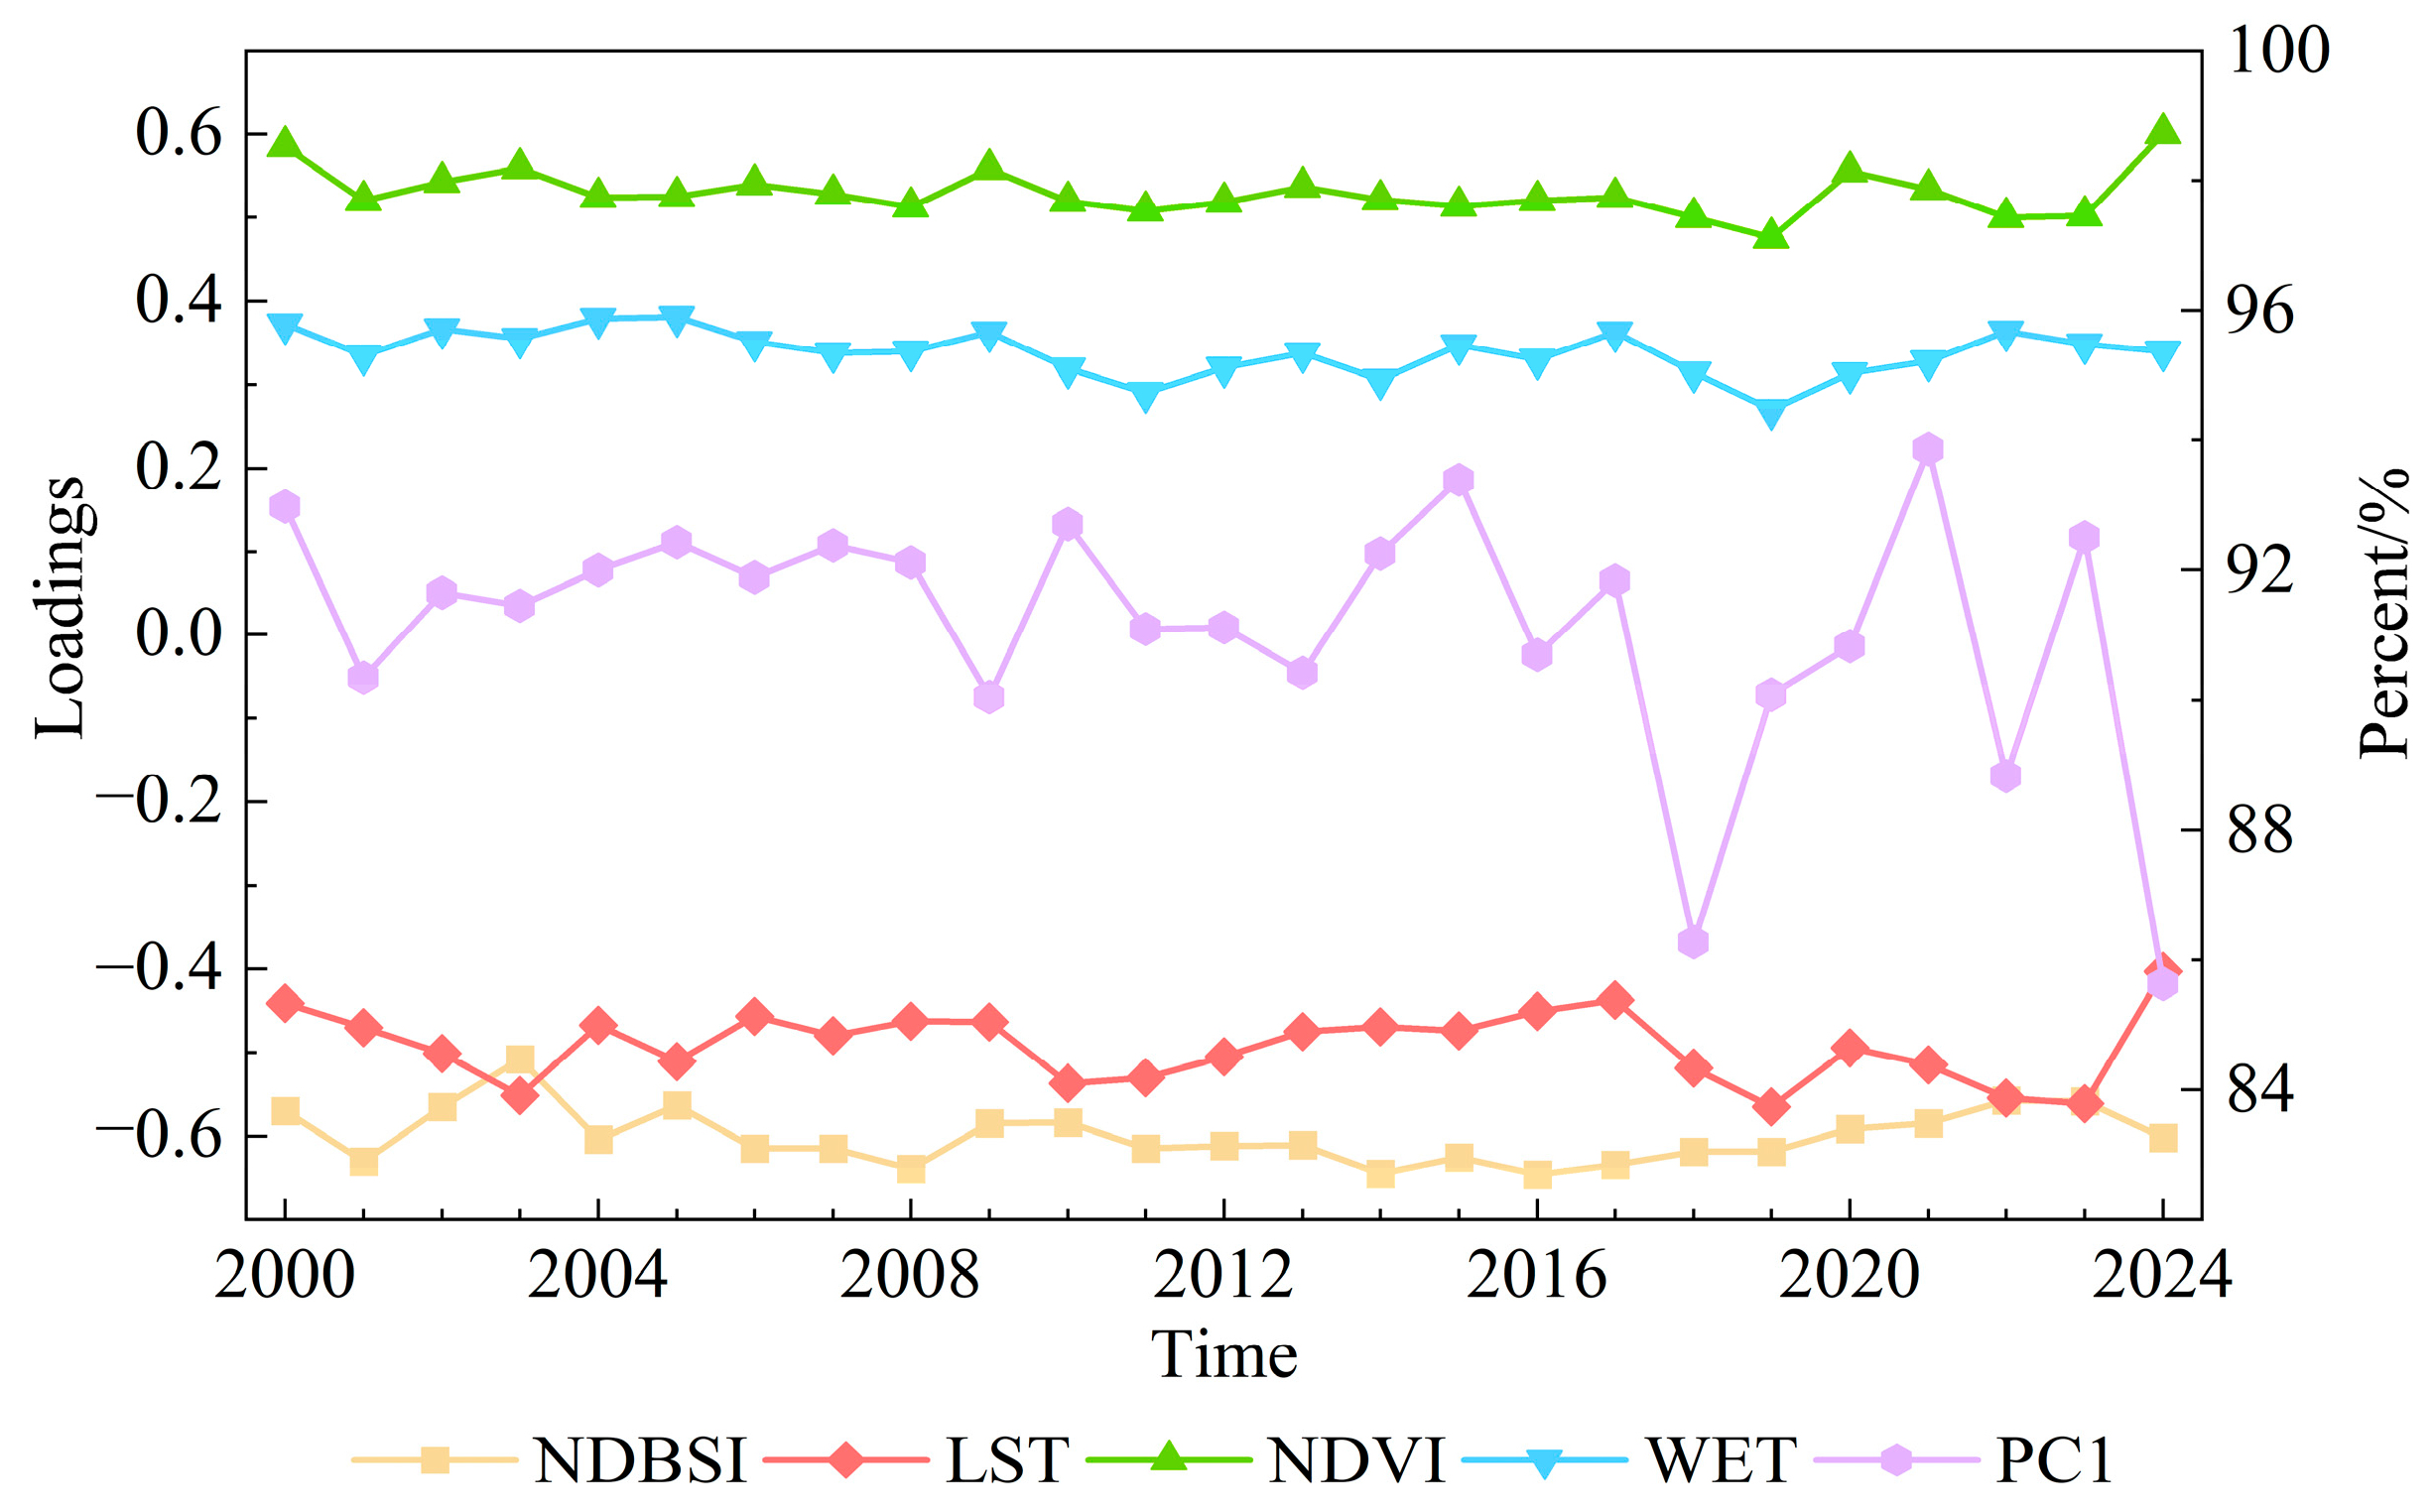
The contribution rate of the PC1 and the loading values of each component for the RSEI were derived through PCA (Figure 3). The variance explained by PC1 ranged from 85.64% in 2024 to 93.87% in 2021, averaging 89.96% over the study period. This high contribution rate confirms that PC1 successfully captures the core characteristics of the four ecological dimensions. The fluctuations of PC1 during this period occur because the covariance structure among the four indicators-greenness, wetness, heat, and dryness-varies across years in response to actual ecological changes and other conditions, preventing the first principal component from remaining constant. Nevertheless, the coefficient of variation (CVPC1 = 2.10%) demonstrates that PC1 is relatively stable.
As shown in Figure 3, the loading values for both the greenness and wetness indicators over the years were positive, suggesting that these two indicators are positively correlated with RSEI. Conversely, the loading value for greenness was consistently higher than that for wetness, implying that an increase in greenness is more likely to promote improvement in EEQ. In contrast, the loading values for the dryness and heat indicators over the years were both negative, indicating that these two indicators are negatively correlated with RSEI. Among the four indicators, the absolute loading value of the dryness indicator was the highest, demonstrating that variations in the degree of dryness exerted the most significant influence on regional EEQ. To verify the stability of the loading values over the years, the cosine similarity between the yearly loadings and the multi-year average loadings was calculated, yielding a multi-year mean cosine similarity of 0.9979. This result indicates that the loading directions of the first principal component remain highly consistent across years, and its ecological interpretation remains temporally stable, thereby effectively ensuring the temporal comparability of the RSEI.

3.2. Spatiotemporal Distribution and Change Characteristics of EEQ

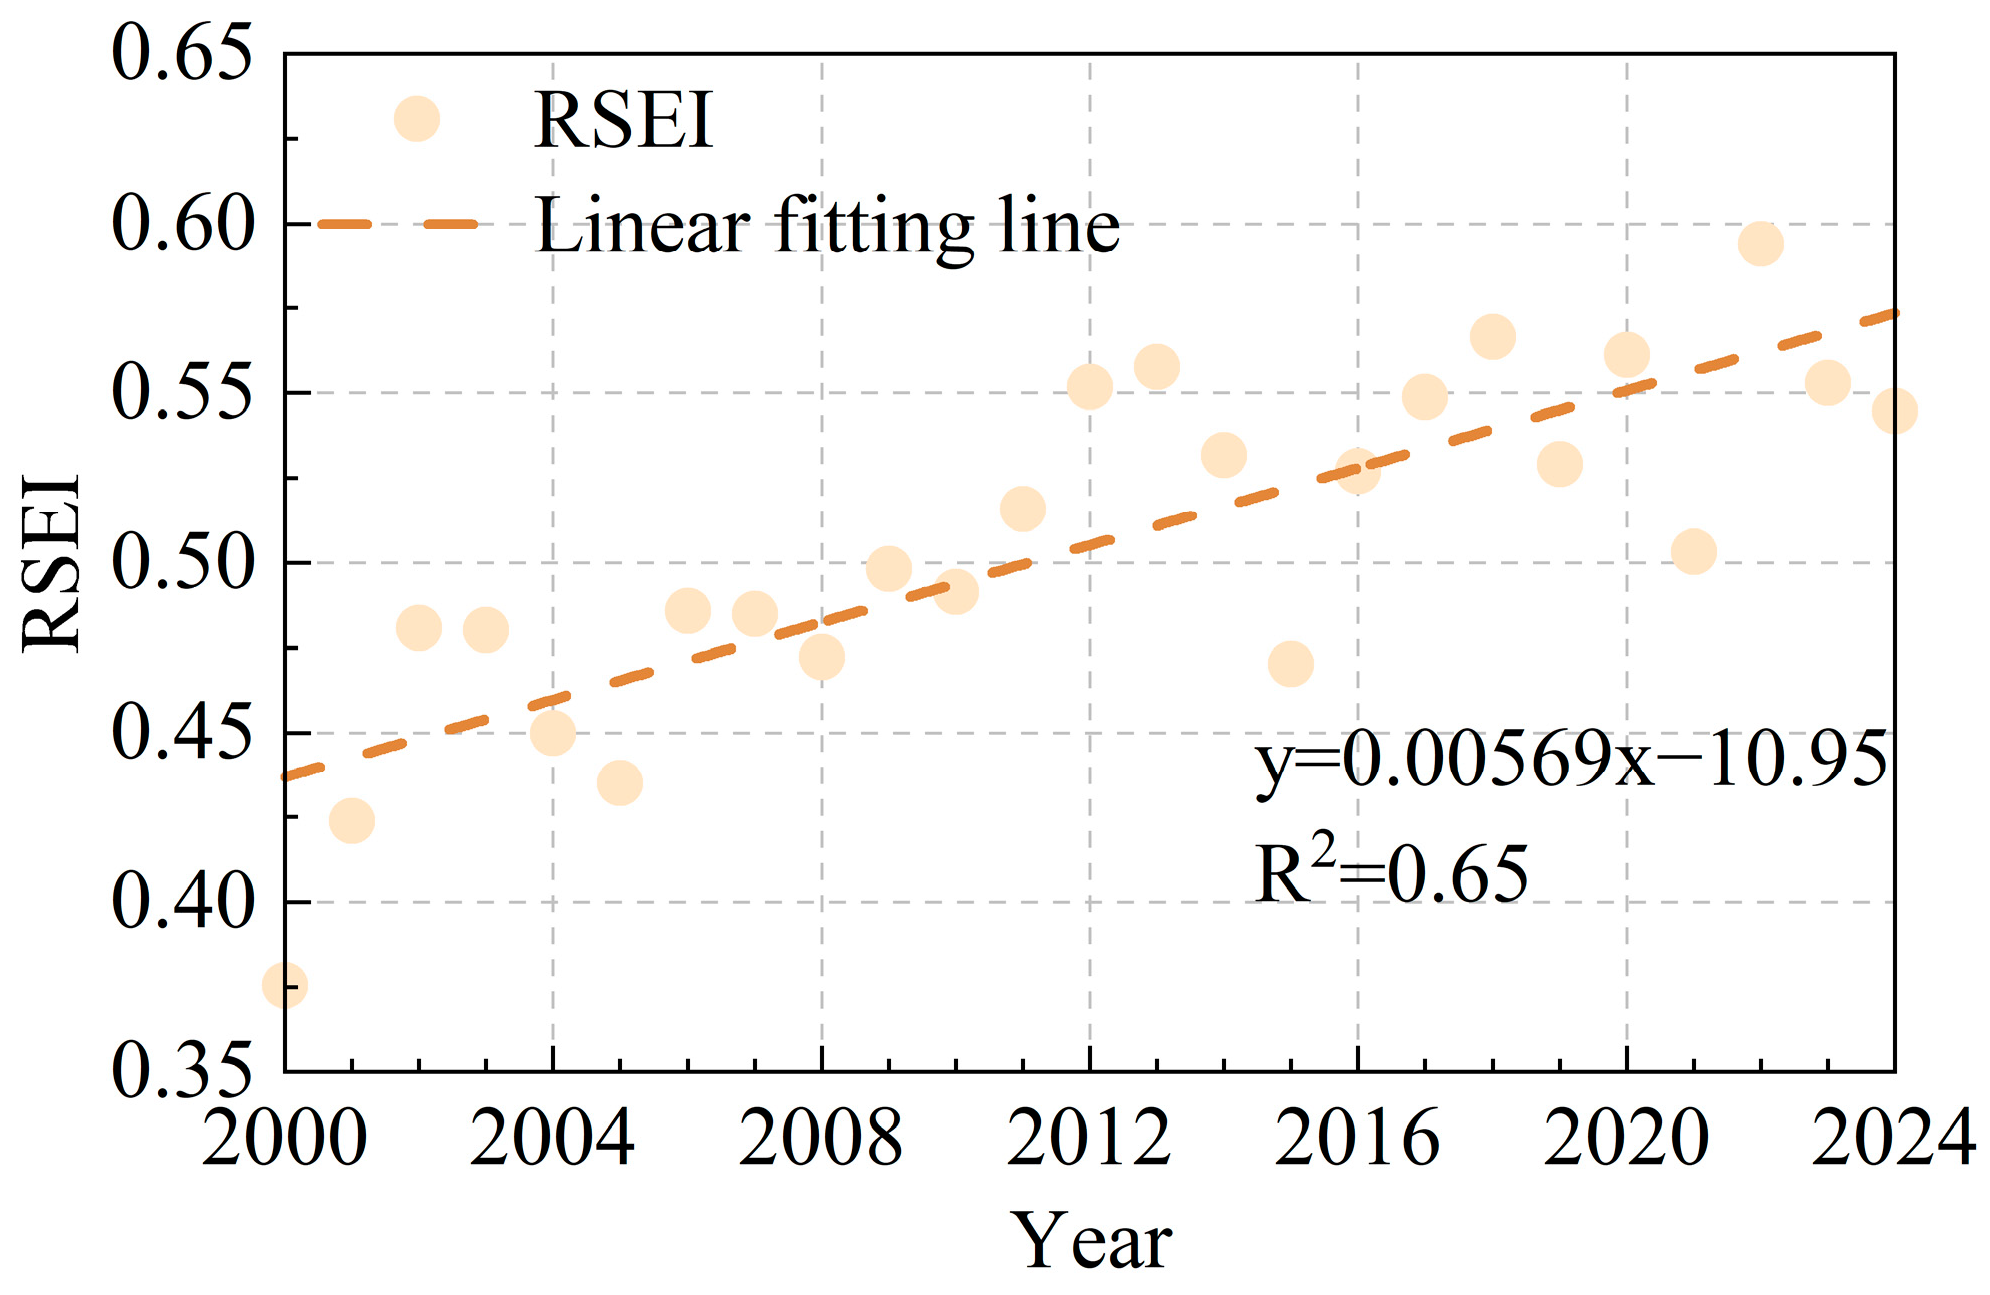
Figure 4 presents the annual mean RSEI values and their linear regression fit for the Loess Plateau of Northern Shaanxi from 2000 to 2024. Regional EEQ exhibited a fluctuating yet rising trend since 2000, with a linear fit yielding an average annual increase in the mean RSEI of approximately 0.00569. During the study period, the mean value of RSEI did not show a long-term growth or downward trend, but the peak value of the successive growth stage rose stage by stage, which promoted the overall evolution of the regional EEQ to show a fluctuating upward trend. The mean value of RSEI on the Loess Plateau of Northern Shaanxi was only 0.376 in 2000. With the implementation of ecological restoration projects such as the Grain for Green Program in the region, the mean value of RSEI fluctuated and increased, reaching 0.545 in 2024. Compared with 2000, it increased by about 45%, and the regional ecological environment was effectively improved.
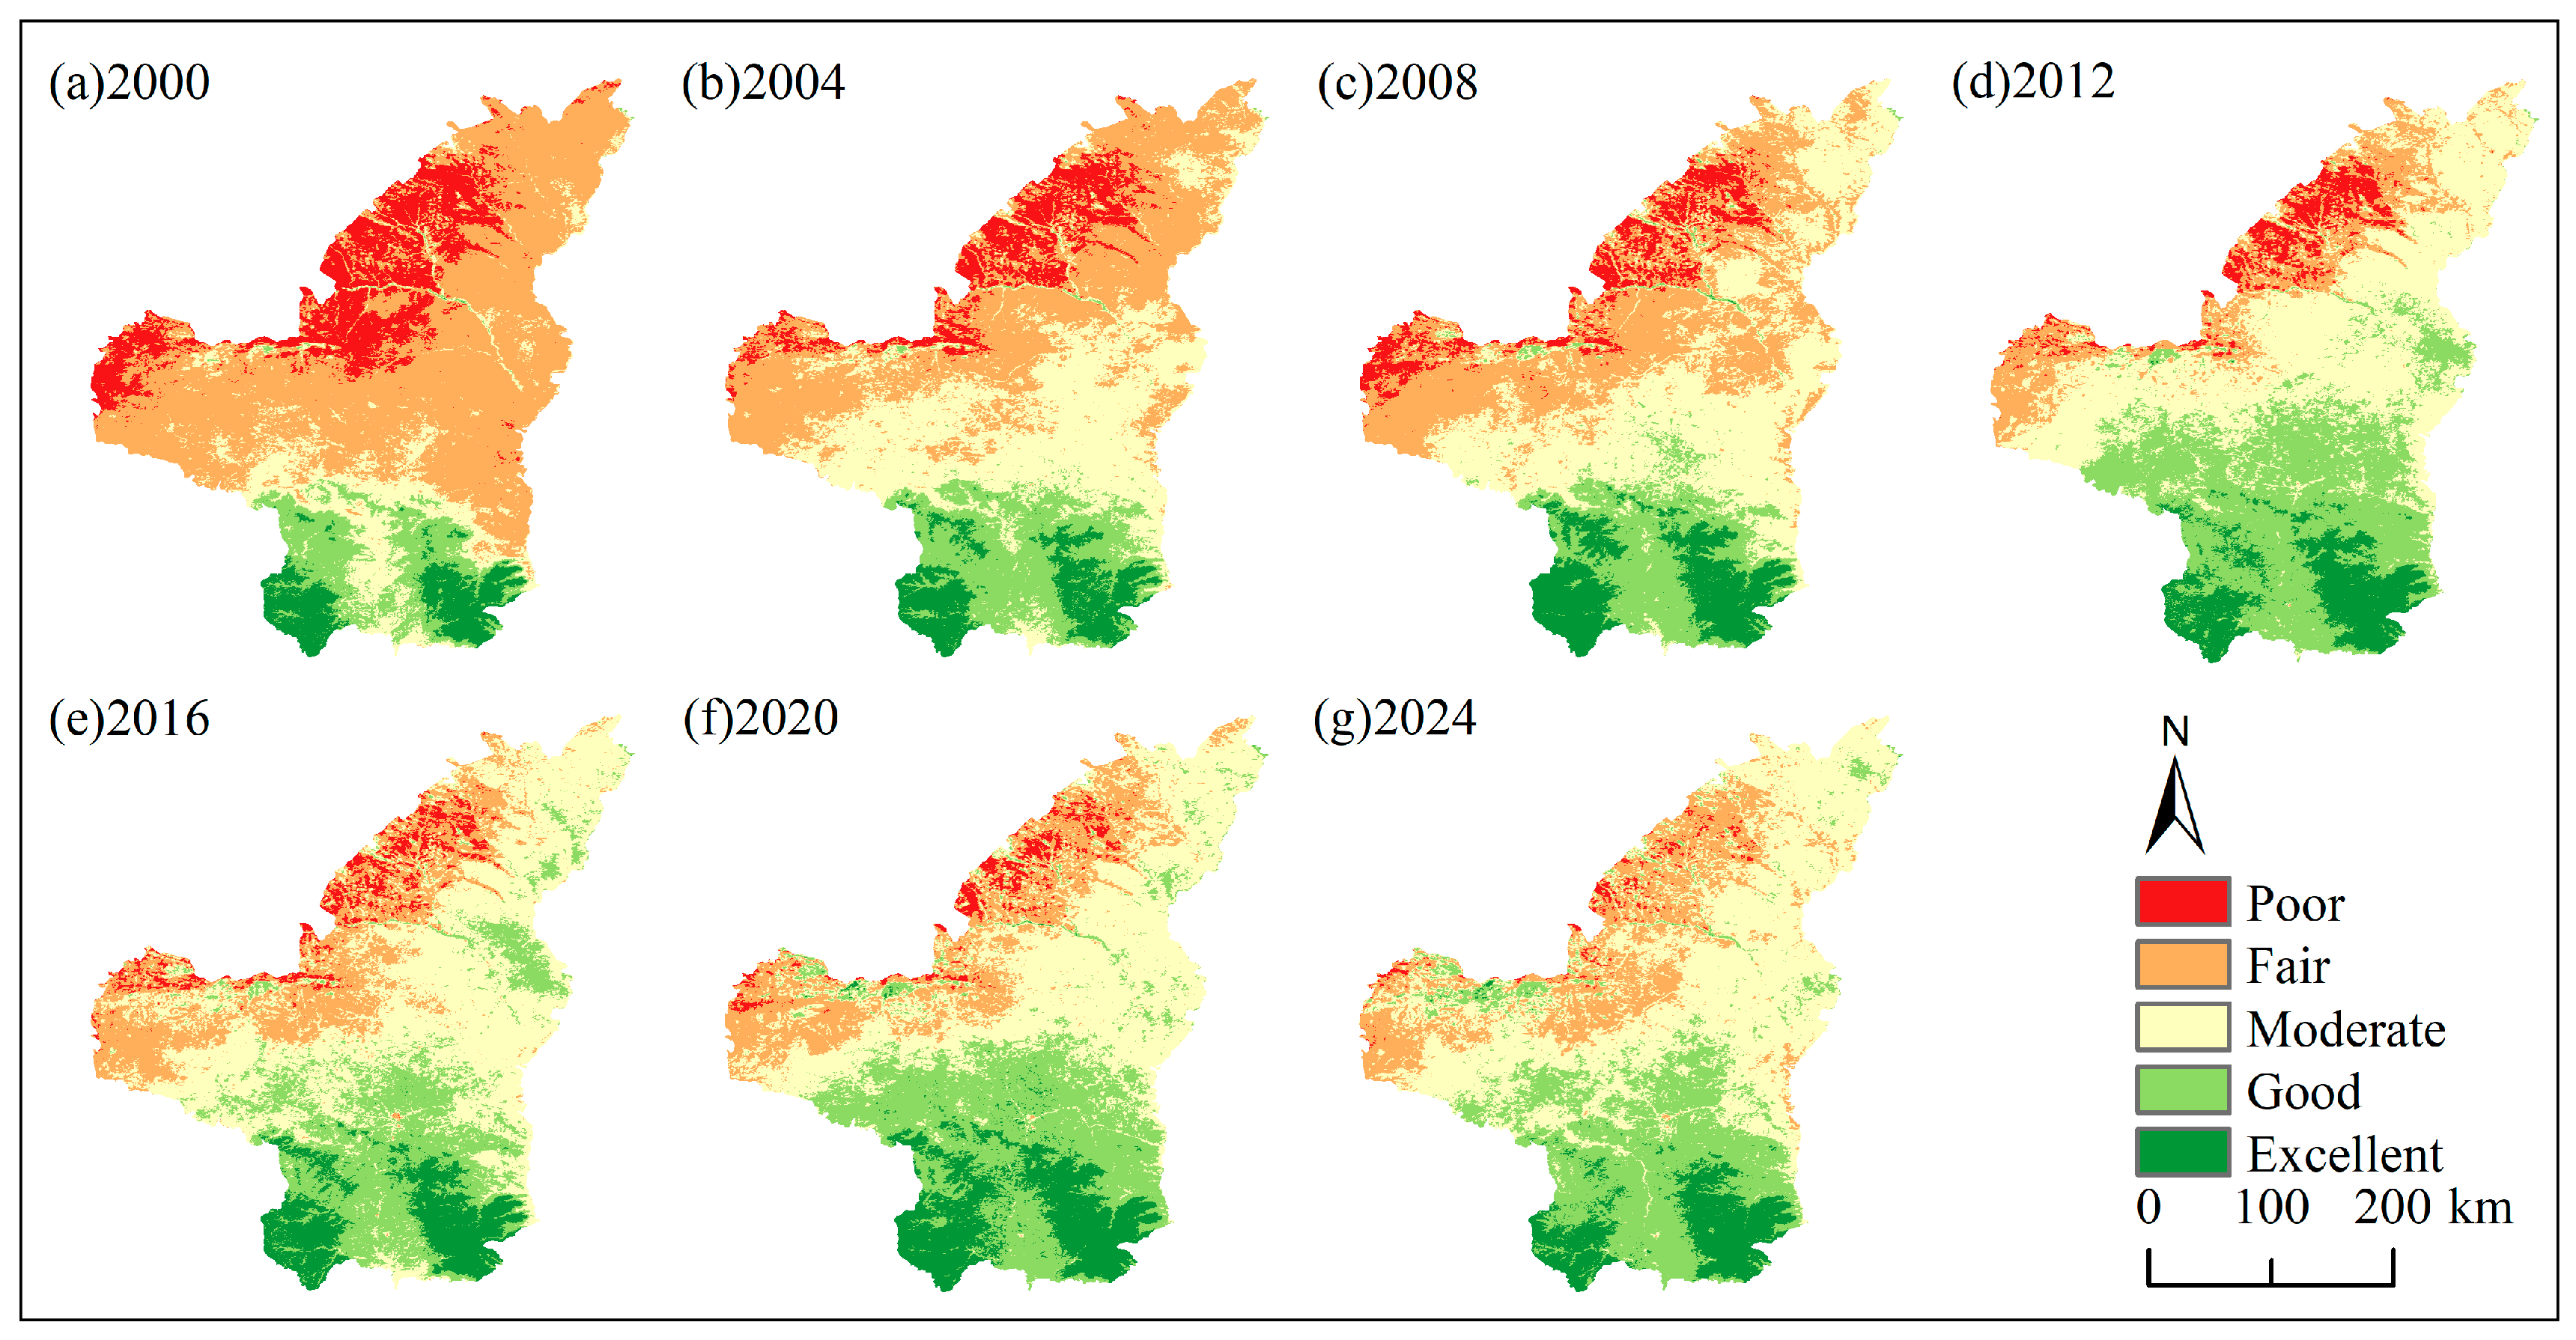
This study analyzed the spatial distribution and temporal changes in the RSEI on the Loess Plateau of Northern Shaanxi from 2000 to 2024 at four-year intervals (Figure 5). Spatially, the EEQ of the Loess Plateau in Northern Shaanxi is characterized by “higher in the south and lower in the north and the lowest in the northwest” in the spatial distribution. “Excellent” and “good” areas were predominantly concentrated in the south of Yan’an City. In the earth-rock hilly zones, steep slopes restrict intense human activities, thereby preserving high vegetation coverage and robust natural baselines. The loess tablelands, characterized by flat terrain and abundant sunlight, are extensively utilized for cash crop cultivation; consequently, the EEQ here is slightly lower, predominantly classifying as “good.” Located in the middle of the study area, the loess ridge and hillocks are characterized by high gully density, severe surface fragmentation, and historical soil erosion. After years of ecological management, the ecological quality has gradually improved from “poor” to “moderate”. The northwestern region comprises aeolian sand hills and sand-covered loess hills, encompassing the Mu Us Sandy Land. This area inherently suffers from weak soil water retention, high surface instability, and intense wind erosion, resulting in a highly fragile ecological baseline. Nevertheless, ecological restoration has progressively elevated the EEQ in this region from “poor” to “fair”.
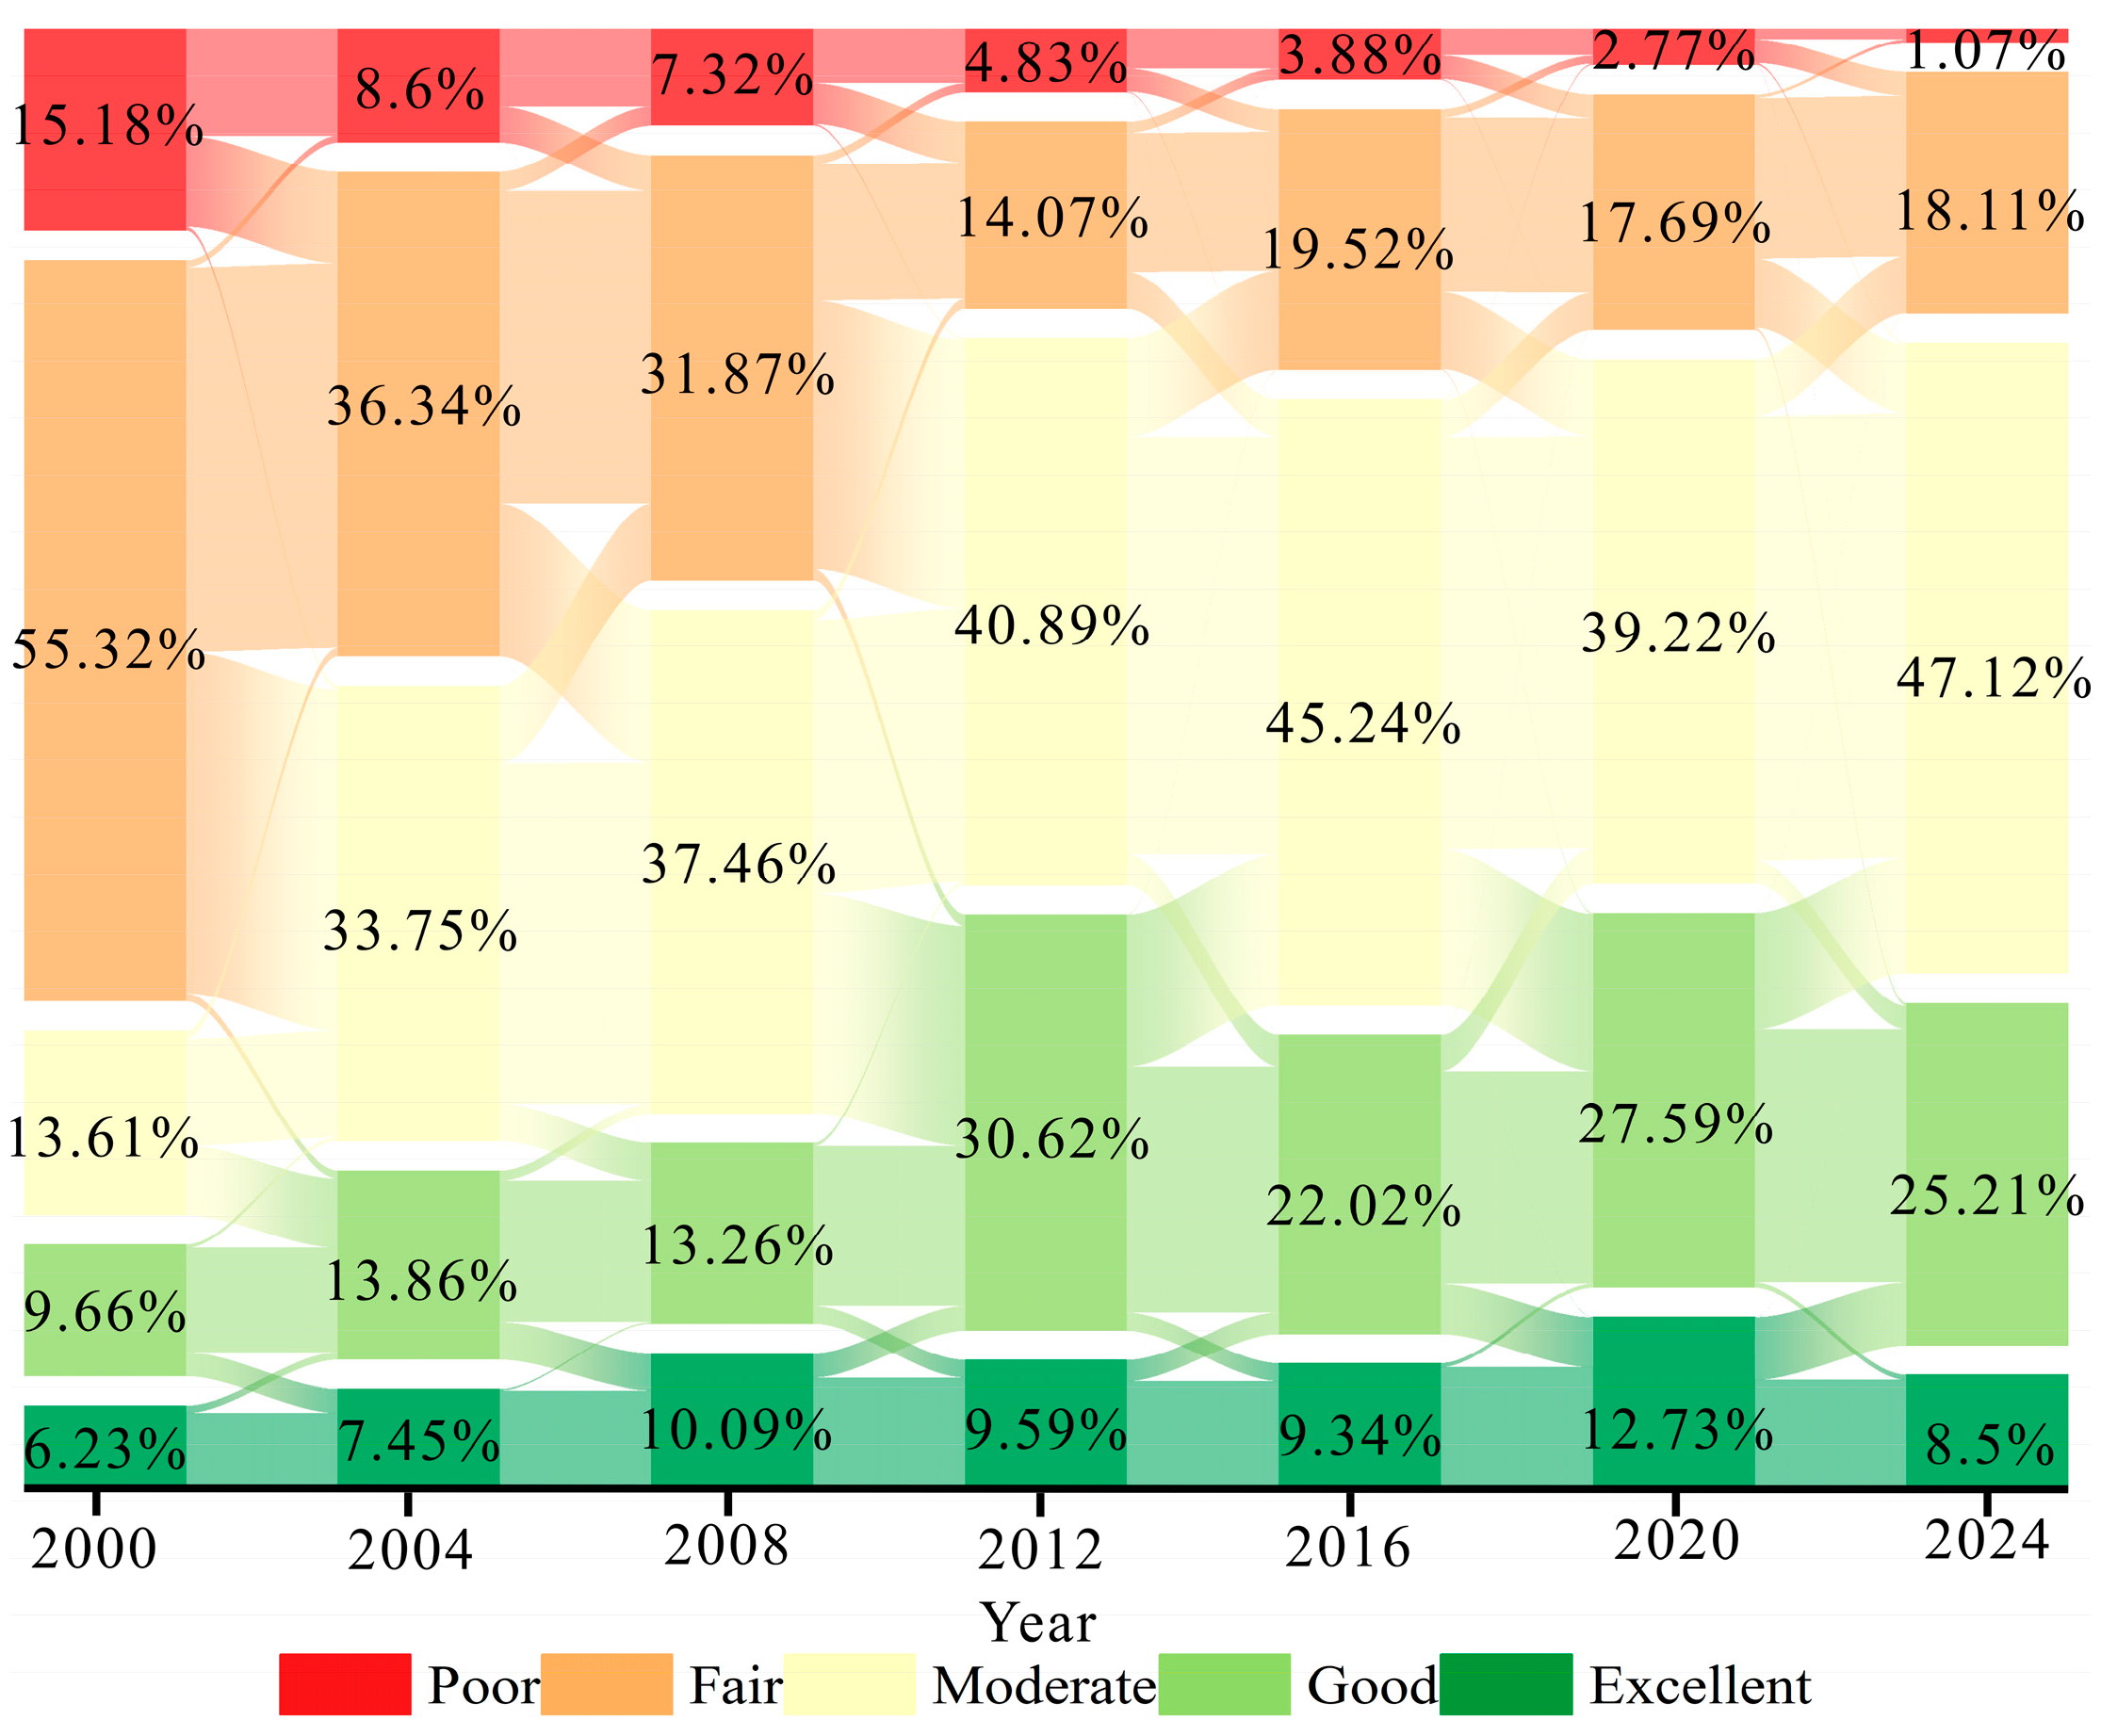
Figure 6 illustrates the proportions of each RSEI grade on the Loess Plateau of Northern Shaanxi from 2000 to 2024, revealing a pronounced structural evolution. In terms of the composition of EEQ grades, the proportion of the “excellent” grade gradually increased from 6.23% in 2000 to 12.73% in 2020, and then declined to 8.5% in 2024. This is likely attributable to the fact that the ecological quality grades in certain areas were already at a critical threshold. In 2024, influenced by fluctuations in climatic factors such as temperature and precipitation, even slight variations in the ecological indicators triggered a downgrade that crossed adjacent quality thresholds. The “good” grade rose from 9.66% to approximately 25%. The “moderate” grade expanded substantially over the 25-year period, increasing from 13.61% to 47.12%, serving as the primary driving force behind the sustained improvement of EEQ in the study area. Meanwhile, the “fair” and “poor” grades stabilized at 18.11% and 1.07% respectively. These transitions highlight a fundamental structural upgrade, characterized by the large-scale conversion of lower-grade ecological spaces into higher-grade categories.

3.3. Characteristics of Significant Changes in RSEI

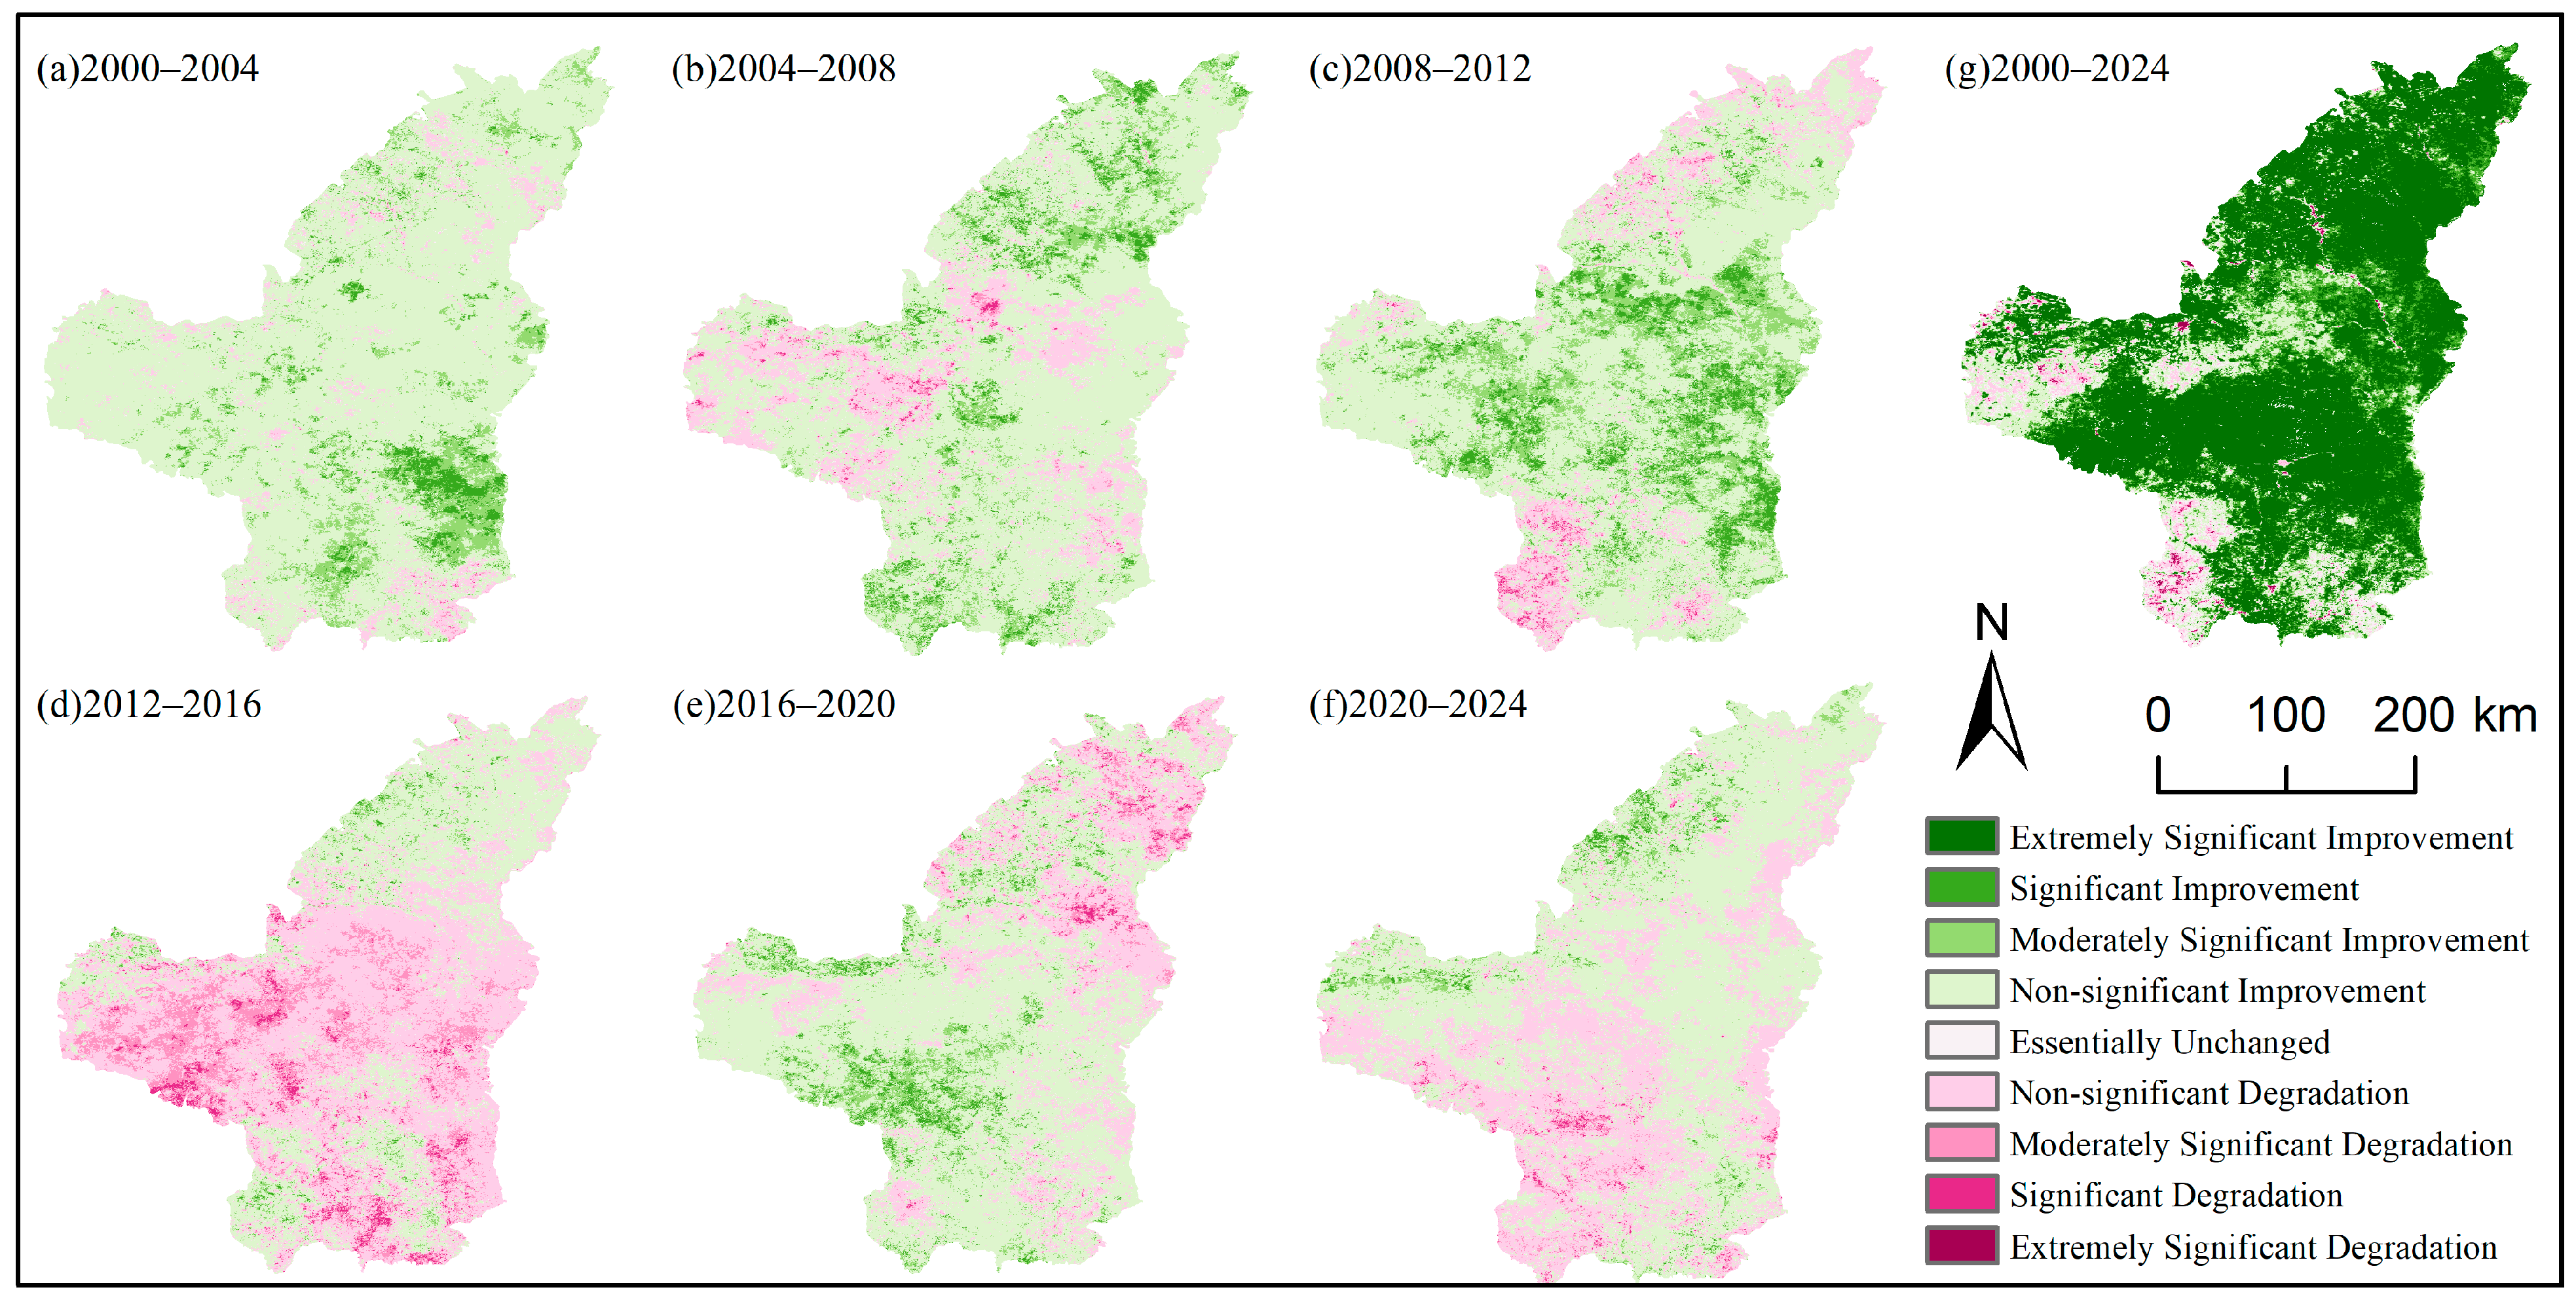
The Theil–Sen median estimator, coupled with the Mann–Kendall test, was applied to detect significant changes in EEQ across the study area. Figure 7 illustrates the significant change trends of RSEI between successive year pairs: 2000–2004, 2004–2008, 2008–2012, 2012–2016, 2016–2020, and 2020–2024, as well as over the entire study period from 2000 to 2024. Based on previous studies, the significant change trends were classified into nine categories: extremely significant improvement, significant improvement, moderately significant improvement, non-significant improvement, essentially unchanged, non-significant degradation, moderately significant degradation, significant degradation, and extremely significant degradation [51]. The proportions of each change type over the period 2000–2024 are presented in Table 2.
During the initial 2000–2004 period, the regional ecological environment showed widespread improvement (Figure 7a), with the area exhibiting “improvement” accounting for 92.19% of the total. From 2004 to 2012, certain areas experienced a decline in EEQ. Specifically, the degraded areas were mainly concentrated in the central region during 2004–2008 (Figure 7b), representing 18.45% of the total area. In contrast, the degraded areas were primarily located in the southwestern part and portions of the northern region during 2008–2012, dominated by a “non-significant degradation” trend (Figure 7c), and accounted for 12.22% of the total area. During 2012–2016, the EEQ substantially declined in the southern part of the study area (Figure 7d). The proportion of “improvement” was only 32.39%, while that of “degradation” reached as high as 65.5%, with “essentially unchanged” accounting for merely 2.11%. This change may be attributed to the uneven rainfall distribution in 2016: Yulin experienced frequent rainfall, whereas Yan’an suffered from high temperatures and low rainfall, leading to concurrent droughts and floods across Northern Shaanxi. The persistent high temperatures and low rainfall adversely affected vegetation growth and development, causing a decline in the greenness component, and also directly reduced the wetness component, thereby resulting in a decrease in RSEI in the southern part of Northern Shaanxi. During 2016–2020, the ecological environment exhibited an east–west differentiation, with the eastern part showing “degradation” and the western part showing “improvement” (Figure 7e). During 2020–2024, nearly 40% of the region experienced a “degradation” in EEQ, mainly clustered in the southern area (Figure 7f).
Despite these short-term regional fluctuations, the overall EEQ of the Loess Plateau over the entire 25-year period (2000–2024) demonstrated a massive and sustained improvement. Areas exhibiting overall improvement accounted for 91.21% of the total region, with 61.94% classified as “extremely significant improvement” (Figure 7g). The drivers of this change encompass both the implementation of ecological restoration projects and the contribution of natural regeneration. In reality, most secondary succession classified as natural regeneration is also contingent upon the initial conditions created by management interventions, such as cropland conversion and grazing prohibition. Therefore, in the Loess Plateau of northern Shaanxi, the improvement in EEQ can likely be attributed to the implementation of ecological restoration projects; however, the synergistic effect between the two should not be overlooked.

3.4. Trends in Future Changes in RSEI

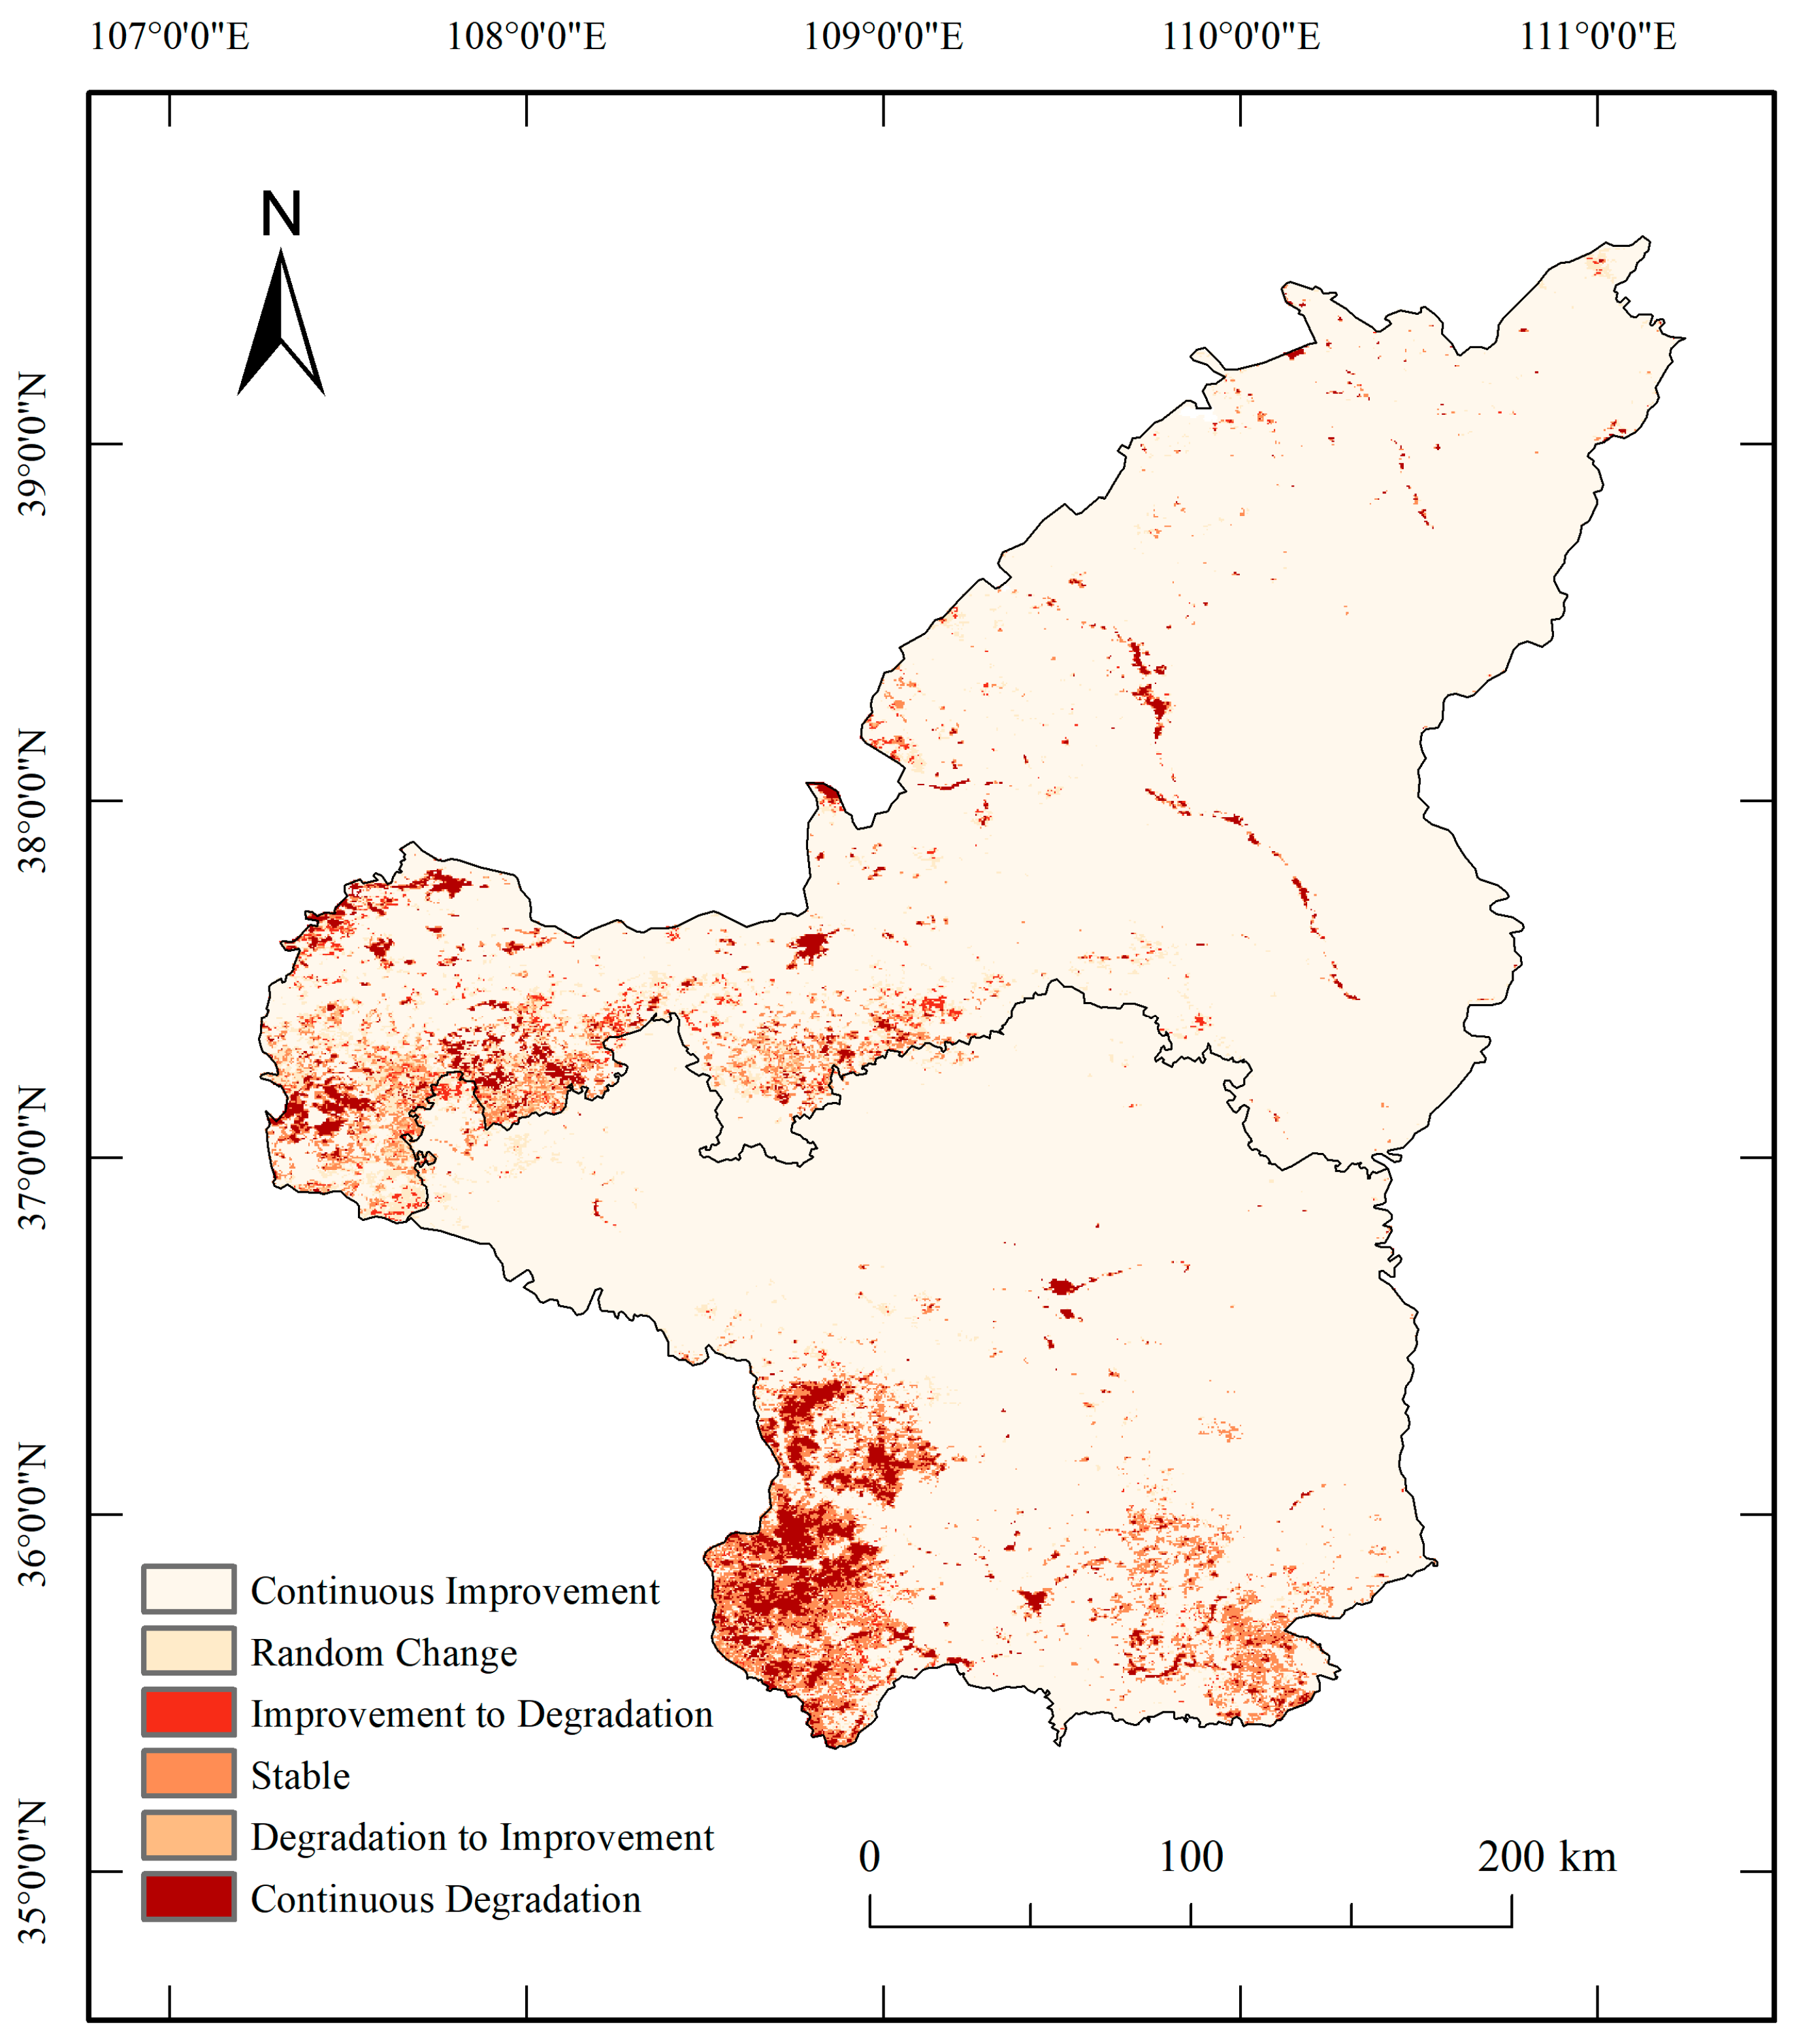
To project future EEQ dynamics, the Hurst exponent was integrated with Sen’s trend analysis. The change trends were classified into six categories: continuous improvement, random change, improvement to degradation, stable, degradation to improvement, and continuous degradation [52] (Figure 8), with the corresponding area proportions provided in Table 3. As illustrated in Figure 8, areas exhibiting a strong persistence of the historical improvement trend (H ≥ 0.55) were the most widespread, suggesting a high likelihood of continued improvement under current conditions, accounting for as much as 87.5% of the total region, indicating that the overall ecological restoration and management efforts have achieved remarkable success. Areas likely to shift from degradation to improvement were predominantly scattered across the southern and northwestern parts of the region, suggesting that site-specific ecological management measures have begun to yield initial positive effects. The proportions of areas likely to shift from improvement to degradation and to exhibit continuous degradation were only 0.71% and 2.98%, respectively, reflecting that certain pressures on regional ecological governance still persist. Notably, the region exhibits certain anti-persistent characteristics, meaning that previously improved areas could face the risk of reversal due to the combined pressures of land-use changes and climatic fluctuations. Furthermore, 3.70% of the area displays random variation, indicating high future uncertainty. Consequently, strengthening dynamic monitoring and adaptive management of ecologically restored areas is imperative, particularly in zones undergoing a transition from improvement to degradation, so as to curb potential ecological decline and facilitate the healthy and sustainable development of the region.

3.5. Analysis of Driving Factors of RSEI Spatial Heterogeneity

To investigate the driving factors underlying the spatial heterogeneity of EEQ on the Loess Plateau of Northern Shaanxi, this study selected nine potential determinants spanning both human and natural dimensions—land use type, nighttime light index, annual mean temperature, annual precipitation, root-zone soil moisture, soil type, elevation, slope, and geomorphological type. The Geodetector model was applied based on the Natural Breaks classification method. Among the human factors, land use type reflects the pattern of land resource exploitation and utilization, and the nighttime light index serves as a proxy for the intensity of human activities and the level of socioeconomic development. With respect to the natural factors, annual mean temperature regulates surface thermal conditions and thereby influences vegetation growth; annual precipitation and root-zone soil moisture jointly determine regional water availability, directly constraining vegetation community development and ecosystem stability; different soil types, owing to their distinct physical and chemical properties, modulate water infiltration, soil water retention, and root development; and elevation, slope, and geomorphological type collectively capture the topographic features and spatial heterogeneity of the region. These three topographic and geographic factors exert direct or indirect influences on the formation of surface ecological environment patterns by modulating the redistribution of heat and moisture, erosion intensity, and material transport processes. Elevation and slope are commonly used as topographic driving factors, and previous studies have also shown that geomorphological type significantly affects the spatial distribution of EEQ [53]. Accordingly, this study further introduces geomorphological type as a driving factor to quantitatively assess the influence of landforms on the EEQ distribution in the Loess Plateau of northern Shaanxi.
The results of the single-factor analysis (Table 4) revealed that X9 (geomorphological type) exercised the most substantial influence on the spatial heterogeneity of EEQ on the Loess Plateau of Northern Shaanxi, with a multi-year mean q-value of 0.701. In fact, X9 integrates topography and lithology, encapsulating the region’s complex physiographic conditions and geological substrate. It governs not only the scope and type of human activities but also the distribution of vegetation. As the primary driving factor, X9 demonstrates that the macro-scale differentiation of topography and geomorphology exerts a substantial influence on the spatial distribution of EEQ across the Loess Plateau of Northern Shaanxi. This was followed by X1 (land use type), X4 (annual precipitation), X6 (soil type), X5 (root-zone soil moisture), and X8 (slope), which yielded mean q-values of 0.477, 0.467, 0.356, 0.244, and 0.160. These five factors exerted relatively pronounced influences on the spatial heterogeneity of EEQ. In contrast, the multi-year mean q-values for X3 (annual mean temperature), X7 (elevation), and X2 (nighttime light index) were merely 0.054, 0.028, and 0.007, suggesting that these factors played a relatively weak role. X2 exerts negligible influence, indicating that the spatial differentiation of EEQ currently observed in the study area is only weakly and directly governed by the distribution of urbanization and industrialization.
Temporally, X9 maintained a consistently high explanatory power throughout 2000–2024, with its q-value fluctuating between 0.618 and 0.750. The influence of X1 slightly declined after 2000 but subsequently stabilized at approximately 0.440. This may be attributed to the progressive stabilization of ecological benefits derived from land use structure, as ecological restoration initiatives such as the Grain for Green Program continue to advance, causing their spatial explanatory power to approach saturation. The q-value of X4 peaked at 0.670 in 2000 and dropped to a minimum of 0.145 in 2012, indicating a progressive weakening of its influence on the spatial distribution of EEQ. The abrupt decline in the q-value of X4 in 2012 likely resulted from an unprecedented heavy rainfall event in the Yulin area—a 200-year return period storm of broad spatial extent and high intensity. Such extreme precipitation led to uniformly high rainfall across the study area, thereby attenuating spatial differentiation and substantially lowering the q-value. Both X6 and X8 exerted significant effects on soil erodibility, and their influences intensified markedly in 2012, suggesting that under heavy rainfall conditions, their constraining effects on the spatial differentiation of EEQ are further amplified. The q-values of X5 remained elevated in 2000, 2004, and 2020, reaching 0.423, 0.276, and 0.416, respectively, while hovering around 0.15 in the remaining years, exhibiting marked temporal heterogeneity. The driving role of X5 is predominantly manifested in the long-term water balance regime, rather than in individual extreme precipitation events.
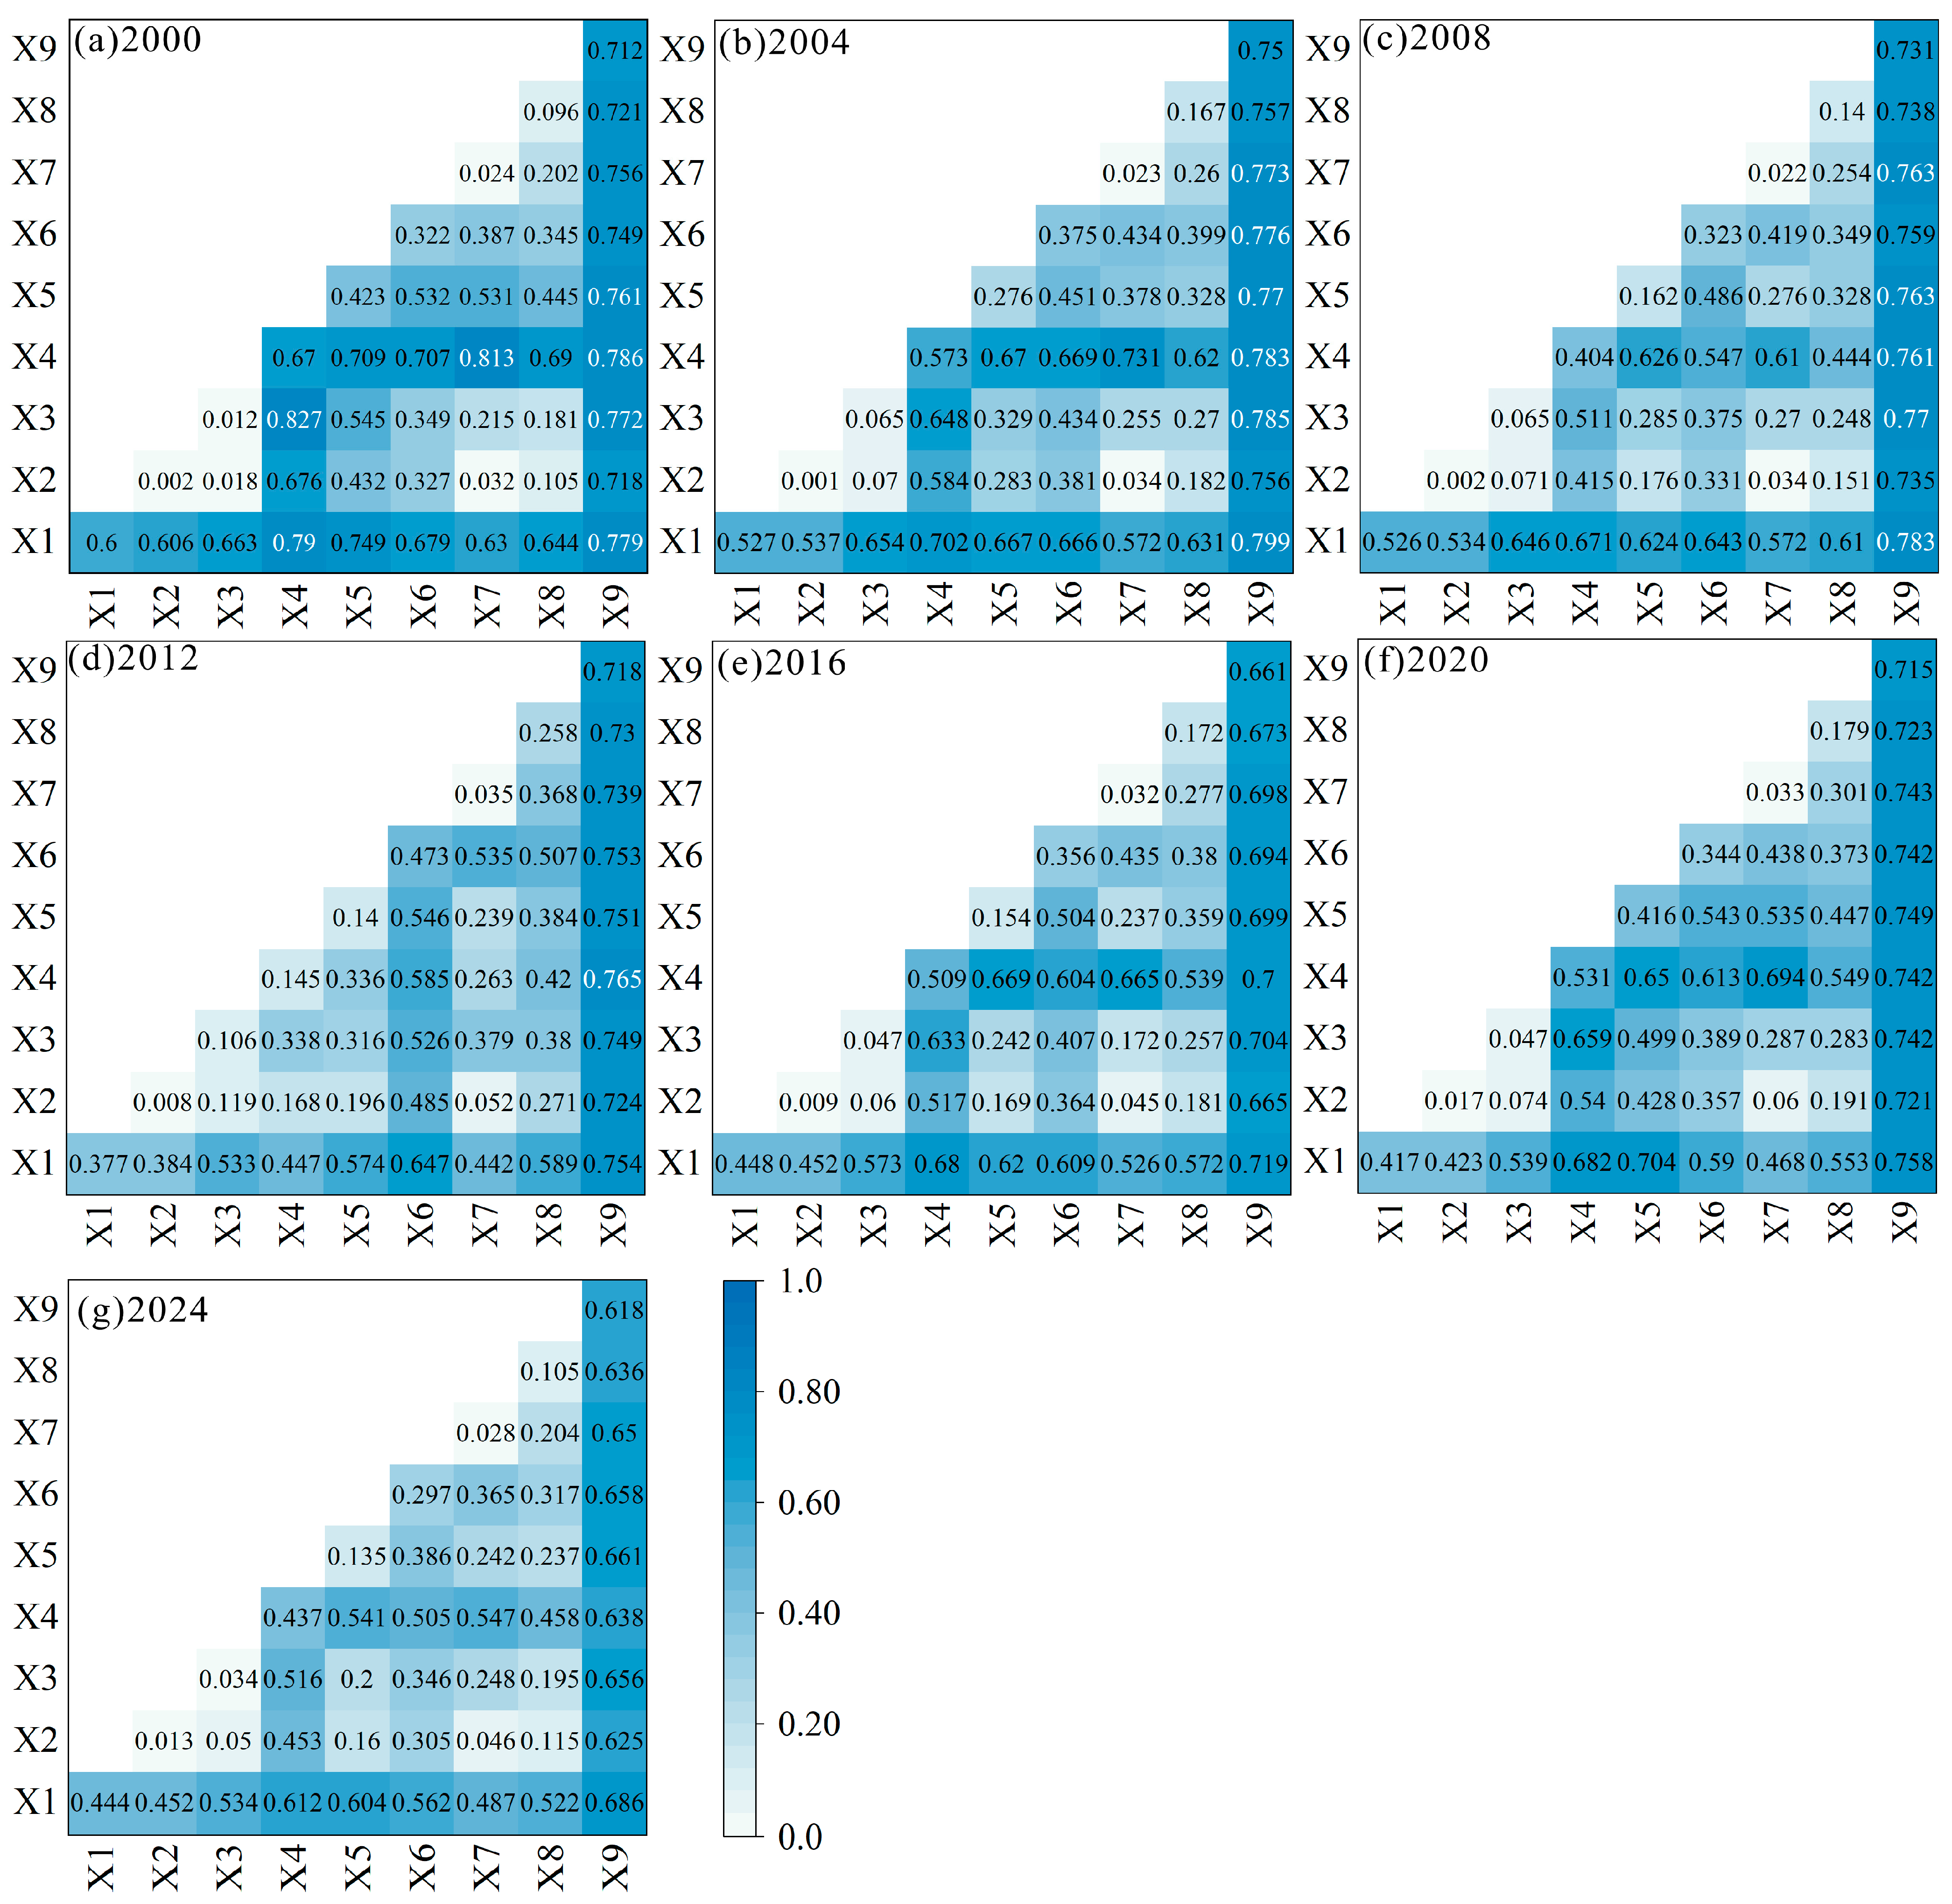
Figure 9 presents the factor interaction detection results. Among the high-value interaction pairs, X3 ∩ X4 (q = 0.827) dominated in 2000, highlighting that the interplay between climatic factors was the primary driver of the spatial configuration of EEQ in that year. In subsequent years, however, the interaction X1 ∩ X9 became progressively more prominent, ranking first in q-value in 2004, 2008, 2016, 2020, and 2024. The average relative enhancement of the interaction q-value for X1 ∩ X9 over the single-factor q-value of X9 was calculated to be 7.10%. Although X1 contributed the largest relative enhancement, this value remained relatively low, implying that the spatial heterogeneity of EEQ on the Loess Plateau of Northern Shaanxi is largely shaped by geomorphological constraints, which act as a fundamental template upon which other factors exert their influence. X2 exhibited extremely low single-factor explanatory power (q < 0.02), yet its interaction q-values with X1, X4, and X9 were markedly strengthened, indicating that the intensity of human activity influences the eco-environment indirectly, mainly through alterations in land use and the superimposition onto natural conditions. Overall, the pairwise interactions among X1, X4, and X9, as well as their combined interactions with the other individual factors, consistently maintained q-values within a high range of 0.6–0.8 across different periods, demonstrating a robust and significant synergistic driving characteristic. This driving pattern profoundly reveals the underlying forces shaping the spatial differentiation of EEQ on the Loess Plateau of Northern Shaanxi. X9, as the macro-scale geomorphological differentiation background, establishes the baseline constraints for spatial heterogeneity. X4, as a key regulating variable of regional hydrothermal conditions, supplies the essential substances that drive regional ecological development. X1 constitutes the direct feedback interface coupling anthropogenic activities with the natural background. Together, these three factors form the most fundamental, stable driving architecture governing the spatial differentiation of regional EEQ.

4. Discussion

4.1. Spatiotemporal Evolution and Spatial Pattern Characteristics of EEQ on the Loess Plateau of Northern Shaanxi

In this study, the RSEI was constructed to quantitatively assess the EEQ of the Loess Plateau of Northern Shaanxi from 2000 to 2024. The results reveal that the EEQ in the region exhibited a fluctuating yet overall upward trend during the study period, with the mean RSEI increasing from 0.376 in 2000 to 0.545 in 2024, indicating a distinct improvement in ecological grade. This result is consistent with the relevant research conclusions of Shanxi Province in the eastern part of the region and the northern foot of the Qinling Mountains in the southern part of the region [23,52]. As one of the most ecologically fragile regions in China, the Loess Plateau of Northern Shaanxi has undergone long-term ecological restoration implemented by the Chinese government. Since the “Three North Shelterbelt Project” was launched in Northern Shaanxi in 1978, the area of shifting sandy land in the region has been greatly reduced, and the sandy area of the Mu Us Desert in Northern Shaanxi has been basically controlled [54]. Meanwhile, as one of the earliest regions to implement the Grain for Green Program, the cumulative area of converted farmland and grassland reached 4538.25 km2 by 2020, accounting for 5.69% of the total study area. Furthermore, gully land consolidation projects generated newly cultivated land, functioning simultaneously as agricultural reserves and ecological buffers [55]. These interventions have fundamentally augmented vegetation cover, serving as the catalyst for regional EEQ improvement [56].
This improvement is attributable not only to the expansion of vegetation coverage but also to the comprehensive optimization of multiple ecological indicators. The Grain for Green Program and the Three-North Shelterbelt Project have systematically enhanced the greenness component of the RSEI by converting land into forests and grasslands, thereby increasing aboveground biomass and leaf area index. Simultaneously, vegetation restoration has improved the wetness component by strengthening soil water retention and reducing surface runoff, an effect particularly pronounced in the severely eroded gully and hilly areas. The increase in vegetation cover has also mitigated surface heat through enhanced evapotranspiration and shading, leading to lower land surface temperatures during the growing season. Furthermore, the reduction in bare soil and the stabilization of sandy lands have significantly diminished the dryness component of the RSEI. Evidently, the ecological restoration projects implemented by the Chinese government in recent years have played a facilitating role in improving the EEQ of the Loess Plateau of Northern Shaanxi. Meanwhile, the region’s average annual precipitation has exhibited a slowly increasing trend [57], which has, to some extent, alleviated aridity, promoted vegetation growth, and contributed to the enhancement of both greenness and wetness indicators, thereby partially driving the improvement of regional EEQ.

4.2. Spatiotemporal Trends in RSEI

The results of the significance trend test demonstrated that the EEQ of the Loess Plateau of Northern Shaanxi displayed a marked overall improvement from 2000 to 2024. Areas where EEQ underwent improvement (Figure 7g) and areas where the historical improvement trend is likely to persist (Figure 8) exhibited a high degree of spatial consistency, accounting for 91.21% and 87.5% of the total area, respectively. This data is significantly higher than that of China’s Shanxi Province (64.59%, 0.15%) [23] and the northern foot of the Qinling Mountains (76.56%, 65.53%) [52] in the same period, which may be related to the long-term and large-scale ecological restoration projects implemented in the Loess Plateau of northern Shaanxi. With the progressive implementation of various ecological restoration projects, the ecological vulnerability of the region has been moderately alleviated [31]. However, Figure 7d demonstrates that in 2016, the Yan’an area was subjected to severe high-temperature conditions, which precipitated a widespread degradation of EEQ, suggesting that regional ecological protection remains highly susceptible to extreme weather events, this fact indicates that the current ecosystem remains relatively fragile in its stability, and against the backdrop of intensifying climatic fluctuations, localized EEQ may still face the risk of abrupt reversal. In recent years, ecological engineering measures such as check dams in Northern Shaanxi have played a pivotal role in regional soil and water conservation, contributing to ecological improvement. The potential failure of these infrastructures under extreme hydrological stress could trigger catastrophic secondary ecological degradation and threaten local communities [58].
The future trend projection (Figure 8) further corroborates this finding. Although the “continuous improvement” areas that highly overlap with historically improved regions account for 87.5% of the total area, 0.71% of the region shows a potential shift from “improvement to degradation”, and 3.70% exhibits “random change” characteristics, reflecting the possible presence of anti-persistence behavior in some restored ecosystems, that is, areas that have previously experienced improvement may undergo degradation in the future due to factors such as land use change or climatic disturbances. For those sporadic plaques that may transition from “improvement to degradation” in the future, it is essential to strengthen dynamic monitoring and adaptive management in order to consolidate the restoration gains already achieved. Meanwhile, against the backdrop of increasing climatic complexity and the frequent occurrence of extreme weather events, enhancing the stability of ecological restoration projects and strengthening the resilience of regional ecosystems, so as to achieve long-term and sustained improvement of regional EEQ, has become a new round of challenges confronting ecological restoration in the Loess Plateau of Northern Shaanxi.

4.3. Driving Factors of RSEI

Through the application of the Geodetector to analyze nine driving factors, the results demonstrated that X9 consistently exhibited the highest explanatory power across all years, yielding a multi-year mean q-value of 0.701, and this factor significantly influenced the spatial heterogeneity of EEQ on the Loess Plateau of Northern Shaanxi. Moreover, the spatial distribution pattern of EEQ, characterized by a distinct “higher in the south, lower in the north, and lowest in the northwest” gradient as illustrated in Figure 5, aligns closely with the geomorphological type of the region depicted in Figure 1b, further corroborating this finding. Within the factor interaction detection framework, the q-value of the interaction pair X1 ∩ X9 has ranked first for multiple years and has remained the highest since 2016, suggesting that the spatial distribution of regional EEQ may continue to be influenced by the combined effect of land use type changes and geological background in the future.
Both X4 and X5 fulfill critical roles in sustaining vegetation growth and development. X4 ranked third in single-factor explanatory power based on its multi-year mean q-value; however, this explanatory power has exhibited a progressive decline. This attenuation is partly attributable to the impact of extreme rainfall events in Northern Shaanxi, where high-intensity precipitation surpasses the soil’s infiltration and retention capacity. Consequently, although total annual precipitation has increased over the years, the proportion of effective rainfall modulated by topographic and geomorphological heterogeneity displays a more fragmented spatial pattern and exhibits lower spatial congruence with the overarching “higher in the south, lower in the north” distribution of RSEI, resulting in a comparatively modest q-value. Nonetheless, the influence of root-zone soil moisture on regional EEQ should not be underestimated, as its magnitude directly and sensitively governs vegetation productivity. Cheng et al. [23] pointed out that land use type, annual average temperature, annual precipitation, elevation and slope were the five dominant factors affecting the spatial distribution of RSEI in Shanxi Province. Li et al. [52] showed that annual average temperature, land use type and elevation were the core driving factors for the spatial differentiation of RSEI in the northern foot of Qinling Mountains, and the geological conditions significantly influence the spatial variation in EEQ. As the dominant factor shared by the above three places, land use type confirms the general shaping effect of human activities on the ecological pattern of the Yellow River Basin. At the same time, the significant high value of X9 in factor detection further validates the impact of geological driving factors on the spatial variation in EEQ.

4.4. Study Limitations and Future Prospects

Despite the progress made in assessing the EEQ in the Loess Plateau of Northern Shaanxi, this study still has certain limitations. First, constrained by the availability of the MOD09A1 remote sensing product and meteorological data, the temporal scope of this study is confined to the period 2000–2024, thereby excluding the initial implementation phase of the Grain for Green Program launched in 1999. Given the lagged nature of ecological restoration benefits [59], selecting the year 2000 as the starting point is reasonably justified. As data continue to be updated, future studies could supplement RSEI assessments for 2025–2026 to enhance timeliness. Second, although this study has identified that ecological restoration projects have contributed to regional EEQ improvement, it was unable to quantitatively separate the relative contributions of anthropogenic engineering interventions and natural climatic fluctuations to the increase in RSEI, which, to some extent, weakens the precision of the attribution analysis. Subsequent research could introduce quantitative separation methods and conduct factor detection across different geomorphological zones, so as to deeply investigate the magnitude and the primary–secondary relationships of the driving forces exerted by climatic factors and human activities within each zone. This would reveal the heterogeneity of driving mechanisms under different geomorphological settings and provide a more robust scientific basis for formulating differentiated ecological management strategies.

5. Conclusions

In this study, the comprehensive RSEI was employed, which combines multiple ecological indicators to provide an objective and holistic evaluation of long-term ecological environment quality in the Loess Plateau of Northern Shaanxi. The major findings are summarized as follows:
(1)
Throughout the period 2000–2024, the EEQ in the region displayed a fluctuating yet overall upward trend. The mean RSEI rose from 0.376 in 2000 to 0.545 in 2024, with an average annual growth of 0.00569.
(2)
Spatially, EEQ was distributed in a pattern of “higher in the south, lower in the north, and the lowest in the northwest.” Over the 25 years, the combined proportion of “excellent” and “good” grades expanded by roughly 20 percentage points, and the “moderate” grade grew from 13.61% to 47.12%, serving as the principal force driving the overall improvement in regional EEQ.
(3)
The significance trend test shows that the proportion of areas with an “improvement” trend in EEQ between 2000 and 2024 is 91.21%, which is highly consistent with the spatial distribution of areas with an “improvement” trend in EEQ in the future.
(4)
Single-factor detection identified X9 as the most influential factor in the spatial differentiation of EEQ, with a multi-year mean q-value of 0.701. The factor interaction detection further indicates that the interaction between X9 and X1 may continue to affect the spatial distribution of regional EEQ.
This study can provide a solid scientific basis and decision-making support for the precise implementation of ecological policies, soil and water conservation management, and high-quality sustainable socio-economic development in the Loess Plateau of Northern Shaanxi.

Author Contributions

Conceptualization, R.T., Z.L. and J.X.; methodology, R.T.; software, R.T.; validation, R.T., Z.L. and S.Z.; formal analysis, Z.L. and J.X.; investigation, R.T.; resources, S.Z.; data curation, R.T. and J.G.; writing—original draft preparation, R.T.; writing—review and editing, Z.L.; visualization, R.T.; supervision, Z.L.; project administration, J.G.; funding acquisition, J.G. All authors have read and agreed to the published version of the manuscript.

Funding

This research was supported by the Major Program of the National Natural Science Foundation of China (Grant Nos. 42293350, 42293355), the Special Funds of the National Natural Science Foundation of China (Grant No. 42341101) and Fundamental Research Funds for the Central Universities of Ministry of Education of China (Grant No. 300102264917).

Data Availability Statement

Data supporting the findings of this study are available from the corresponding author upon request.

Conflicts of Interest

The authors declare no conflicts of interest.

Abbreviations

The following abbreviations are used in this manuscript:
EEQecological environment quality
RSEIremote sensing ecological index
NDVINormalized Difference Vegetation Index
LSTLand Surface Temperature
NPPNet Primary Productivity
PCAPrincipal Component Analysis
GEEGoogle Earth Engine
VIPVegetation Interface Process
CFMASKC Function of Mask
MNDWIModified Normalized Difference Water Index
CLCDChina Land Cover Dataset
IBIIndex-based Built-up Index
SISoil Index

References

  1. Zhang, Y.; She, J.; Long, X.; Zhang, M. Spatio–temporal evolution and driving factors of eco–environmental quality based on RSEI in Chang–Zhu–Tan metropolitan circle, central China. Ecol. Indic. 2022, 144, 12. [Google Scholar] [CrossRef]
  2. Hu, Y.; Yang, X.; Gao, X.; Zhang, J.; Kang, L. Analysis of Spatio–Temporal Evolution and Driving Factors of Eco–Environmental Quality during Highway Construction Based on RSEI. Land 2024, 13, 504. [Google Scholar] [CrossRef]
  3. Xu, Z.; Ke, F.; Yu, J.; Zhang, H. Spatio–Temporal Evolution and Driving Factors of Eco–Environmental Response to Land Use Transformation in China’s Southern Hilly Area During 2000–2020. Land 2025, 14, 1766. [Google Scholar] [CrossRef]
  4. Chen, C.; Park, T.; Wang, X.; Piao, S.; Xu, B.; Chaturvedi, R.; Fuchs, R.; Brovkin, V.; Ciais, P.; Fensholt, R.; et al. China and India lead in greening of the world through land–use management. Nat. Sustain. 2019, 2, 122–129. [Google Scholar] [CrossRef] [PubMed]
  5. Sun, W.; Song, X.; Mu, X.; Gao, P.; Wang, F.; Zhao, G. Spatiotemporal vegetation cover variations associated with climate change and ecological restoration in the Loess Plateau. Agric. For. Meteorol. 2015, 209, 87–99. [Google Scholar] [CrossRef]
  6. Sang, M.; Yuan, X.; Li, L.; Liu, L. Unraveling the spatiotemporal dynamics and driving mechanisms of soil conservation service flows in the Loess Plateau via XGBoost–SHAP. Ecol. Inform. 2026, 96, 13. [Google Scholar] [CrossRef]
  7. Xian, J.; Xia, C.; Cao, S. Cost–benefit analysis for China’s Grain for Green Program. Ecol. Eng. 2020, 151, 10. [Google Scholar] [CrossRef]
  8. Geng, Q.; Ren, Q.; Yan, H.; Li, L.; Zhao, X.; Mu, X.; Wu, P.; Yu, Q. Target areas for harmonizing the Grain for Green Programme in Chinas Loess Plateau. Land Degrad. Dev. 2020, 31, 325–333. [Google Scholar] [CrossRef]
  9. Chen, W.; Xu, Q.; Zhao, K.; Zhou, X.; Li, S.; Wang, J.; Wang, X.; Xu, J. Spatial analysis of land–use management for gully land consolidation on the Loess Plateau in China. Ecol. Indic. 2020, 117, 17. [Google Scholar] [CrossRef]
  10. Feng, X.; Fu, B.; Piao, S.; Wang, S.; Ciais, P.; Zeng, Z.; Lü, Y.; Zeng, Y.; Li, Y.; Jiang, X.; et al. Revegetation in China’s Loess Plateau is approaching sustainable water resource limits. Nat. Clim. Chang. 2016, 6, 1019–1022. [Google Scholar] [CrossRef]
  11. Xiao, G.; Xin, L.; Wang, X.; Li, X.; Tan, M. Climate Regulates the Effects of Abrupt Vegetation Shifts on Soil Moisture in the Loess Plateau, China. Land Degrad. Dev. 2025, 36, 507–520. [Google Scholar] [CrossRef]
  12. Nie, X.; Hu, Z.; Zhu, Q.; Ruan, M. Research on Temporal and Spatial Resolution and the Driving Forces of Ecological Environment Quality in Coal Mining Areas Considering Topographic Correction. Remote Sens. 2021, 13, 2815. [Google Scholar] [CrossRef]
  13. Pan, N.; Wang, S.; Wei, F.; Shen, M.; Fu, B. Inconsistent changes in NPP and LAI determined from the parabolic LAI versus NPP relationship. Ecol. Indic. 2021, 131, 9. [Google Scholar] [CrossRef]
  14. Li, S.; Xu, L.; Jing, Y.; Yin, H.; Li, X.; Guan, X. High–quality vegetation index product generation: A review of NDVI time series reconstruction techniques. Int. J. Appl. Earth Obs. Geoinf. 2021, 105, 18. [Google Scholar] [CrossRef]
  15. Xu, H. A remote sensing index for assessment of regional ecological changes. China Environ. Sci. 2013, 33, 889–897. [Google Scholar]
  16. Xu, H.; Lin, M.; Wang, Y.; Guan, H.; Tang, F. Quantitatively exploring the influence of geographical conditions on ecological quality using a novel remote sensing model: A comparison between two geographical disparity regions in China. Geo–Spat. Inf. Sci. 2025, 28, 849–866. [Google Scholar] [CrossRef]
  17. Geng, J.; Yu, K.; Xie, Z.; Zhao, G.; Ai, J.; Yang, L.; Yang, H.; Liu, J. Analysis of Spatiotemporal Variation and Drivers of Ecological Quality in Fuzhou Based on RSEI. Remote Sens. 2022, 14, 4900. [Google Scholar] [CrossRef]
  18. Xiong, Y.; Xu, W.; Lu, N.; Huang, S.; Wu, C.; Wang, L.; Dai, F.; Kou, W. Assessment of spatial-temporal changes of ecological environment quality based on RSEI and GEE: A case study in Erhai Lake Basin, Yunnan province, China. Ecol. Indic. 2021, 125, 10. [Google Scholar] [CrossRef]
  19. Tang, H.; Fang, J.; Xie, R.; Ji, X.; Li, D.; Yuan, J. Impact of Land Cover Change on a Typical Mining Region and Its Ecological Environment Quality Evaluation Using Remote Sensing Based Ecological Index (RSEI). Sustainability 2022, 14, 12694. [Google Scholar] [CrossRef]
  20. Wang, X.; Nian, Y.; Wang, H.; Chen, J.; Li, K.; Hu, T.; Li, Z. Monitoring of ecological environment changes in open–pit mines on the Loess Plateau from 1990 to 2023 based on RSEI. Ecol. Indic. 2025, 170, 10. [Google Scholar] [CrossRef]
  21. Airiken, M.; Li, S. The Dynamic Monitoring and Driving Forces Analysis of Ecological Environment Quality in the Tibetan Plateau Based on the Google Earth Engine. Remote Sens. 2024, 16, 682. [Google Scholar] [CrossRef]
  22. Ma, H.; Wang, Y.; Guo, E.; Yin, S.; Kang, Y.; Wang, Y.; Zhao, J.; Wu, J.; Mu, Q.; Zhou, D. Unstable changes in ecological quality of the four major sandy lands in northern China based on Google Earth Engine. Ecol. Indic. 2025, 171, 14. [Google Scholar] [CrossRef]
  23. Cheng, C.; Wang, Y. Spatiotemporal Changes and the Drivers of Ecological Environmental Quality Based on the Remote Sensing Ecological Index: A Case Study of Shanxi Province, China. Land 2025, 14, 952. [Google Scholar] [CrossRef]
  24. Aydin, N.; Balcik, F. Assessing long–term eco–environmental quality dynamics in Akarçay River Basin (1985–2020) using Remote Sensing Ecological Index (RSEI). Environ. Earth Sci. 2025, 84, 703. [Google Scholar] [CrossRef]
  25. Yang, H.; Hou, S.; Yan, K.; Qiu, J.; Wang, D. Assessment of Ecological Environment Quality in the Yellow River Basin Based on the Improved Remote Sensing Ecological Index. Remote Sens. 2026, 18, 617. [Google Scholar] [CrossRef]
  26. Wang, T.; Chen, B.; Wang, X.; Wang, H.; Song, Z.; Cheng, M. Analysis of Spatiotemporal Changes and Driving Forces of Ecological Environment Quality in the Chang–Zhu–Tan Metropolitan Area Based on the Modified Remote Sensing Ecological Index. Land 2025, 15, 79. [Google Scholar] [CrossRef]
  27. Li, C.; Mu, W.; Qin, F.; Fan, H.; Zhang, H.; Zai, K.; Zhang, X.; Du, J.; Liu, Z. Spatiotemporal coupling assessment of human–nature relationships in ecologically sensitive areas under intensive anthropogenic activities. Ecol. Indic. 2025, 179, 16. [Google Scholar] [CrossRef]
  28. Chen, Z.; Gao, X.; Liu, Z.; Sun, Y.; Chen, K. Spatiotemporal Evolution and Driving Mechanisms of Eco–Environmental Quality in a Typical Inland Lake Basin of the Northeastern Tibetan Plateau: A Case Study of the Qinghai Lake Basin. Land 2025, 14, 1955. [Google Scholar] [CrossRef]
  29. Wang, H.; Li, C.; Li, M.; Zhan, Y.; Liu, K.; Li, J. The Analysis of Spatial and Temporal Changes in Ecological Quality and Its Drivers in the Baiyangdian Watershed. Remote Sens. 2025, 17, 3017. [Google Scholar] [CrossRef]
  30. Zhou, X.; Zhou, Y. Spatio–Temporal Variation and Driving Forces of Land–Use Change from 1980 to 2020 in Loess Plateau of Northern Shaanxi, China. Land 2021, 10, 982. [Google Scholar] [CrossRef]
  31. Zhuo, J.; Hu, H.; He, H.; Wang, Z.; Yang, C. Spatiotemporal variation and driving factors of ecological vulnerability in the Loess Plateau of northern Shaanxi. Arid Land Geogr. 2023, 46, 1768–1777. [Google Scholar] [CrossRef]
  32. Bai, M.; Mo, X.; Mo, S.; Guo, L.; Liu, Y.; Yang, J. Spatiotemporal evolution and driving mechanisms of water-carbon balance in the Loess Plateau of northern Shaanxi underecological restoration. Geogr. Res. 2025, 44, 3180–3200. [Google Scholar] [CrossRef]
  33. Zhang, Y.; Li, P.; Zhang, M.; Yang, F. Response of Vegetation Dynamics to Climate Change and Human Activities in Shaanxi Province from 2000 to 2020. Environ. Sci. 2025, 46, 3619–3631. [Google Scholar] [CrossRef] [PubMed]
  34. Han, L.; Cao, X.; Zhu, H.; Chen, R.; Zhao, Y.; Liu, Z.; Zhao, Z.; Chang, Y.; Yang, M.; Gao, Y. Change of vegetation coverage and driving factor in the North Shaanxi Loess Plateau based on characteristic zoning. Acta Ecol. Sin. 2023, 43, 8564–8577. [Google Scholar] [CrossRef]
  35. Sun, Y.; Ren, Y.; Liu, S.; Chen, W.; Xu, Y.; Xu, J.; Dang, P.; Niu, Z.; Xu, X.; Cheng, F. Identification and Optimization of Ecological Restoration Areas Coupled with Ecosystem Service Supply and Demand in the Northern Shaanxi Loess Plateau. Land 2025, 14, 287. [Google Scholar] [CrossRef]
  36. Han, L.; Ren, Y.; Tuo, F.; Gan, S.; Liu, Z.; Miao, Z.; Hu, G.; Zhang, H. Esimating above-ground biomass of vegetation in the Loess Plateau of northern Shaanxi using improved gray wolf optimizer of XGBoost. Trans. Chin. Soc. Agric. Eng. 2025, 41, 182–192. [Google Scholar] [CrossRef]
  37. Bai, R.; Zhao, X.; Wang, X.; Lv, W.; Li, J.; Yang, F.; Shangguan, Z.; Deng, L. SOC erosion reduction of the “Grain for green” program on the Loess Plateau, China. Soil Tillage Res. 2026, 256, 12. [Google Scholar] [CrossRef]
  38. Guan, X.; Wang, S.; Xu, M.; Ji, J.; Cao, C. Long–term ecological effectiveness of the Three–North shelterbelt program assessed by changes in ecosystem services. Sci. Rep. 2026, 16, 15. [Google Scholar] [CrossRef] [PubMed]
  39. Yang, J.; Huang, X. The 30 m annual land cover dataset and its dynamics in China from 1990 to 2019. Earth Syst. Sci. Data 2021, 13, 3907–3925. [Google Scholar] [CrossRef]
  40. Xu, H. A Study on Infomation Extraction of Water Body with the Modified Normalized Difference Water Index (MNDWI). J. Remote Sens. 2005, 5, 589–595. [Google Scholar] [CrossRef]
  41. Lobser, S.E.; Cohen, W.B. MODIS tasselled cap: Land cover characteristics expressed through transformed MODIS data. Int. J. Remote Sens. 2007, 28, 5079–5101. [Google Scholar] [CrossRef]
  42. Xu, H.; Wang, Y.; Guan, H.; Shi, T.; Hu, X. Detecting Ecological Changes with a Remote Sensing Based Ecological Index (RSEI) Produced Time Series and Change Vector Analysis. Remote Sens. 2019, 11, 2345. [Google Scholar] [CrossRef]
  43. Xia, J.; Zhang, G.; Ma, S.; Pan, Y. Spatial Heterogeneity of Driving Factors in Multi–Vegetation Indices RSEI Based on the XGBoost–SHAP Model: A Case Study of the Jinsha River Basin, Yunnan. Land 2025, 14, 925. [Google Scholar] [CrossRef]
  44. Hasan, M.M.; Ferdous, M.T.; Talha, M.; Mojumder, P.; Roy, S.K.; Zim, M.N.F.; Akter, M.M.; Nasher, N.M.R.; Ben Hasher, F.F.; Boltižiar, M.; et al. Analyzing Ecological Environmental Quality Trends in Dhaka Through Remote Sensing Based Ecological Index (RSEI). Land 2025, 14, 1258. [Google Scholar] [CrossRef]
  45. Sen, P.K. Estimates of the Regression Coefficient Based on Kendall’s Tau. J. Am. Stat. Assoc. 1968, 63, 1379–1389. [Google Scholar] [CrossRef]
  46. Ma, C.; Zhang, C.; Chen, H.; Ma, M.; Wang, S. Spatiotemporal dynamics and drivers of ecological quality in Shaanxi (Yellow River Basin, China) based on optimized RSEI and SHAP. Front Environ. Sci. 2026, 14, 1721306. [Google Scholar] [CrossRef]
  47. Hamed, K.H.; Rao, A.R. A modified Mann-Kendall trend test for autocorrelated data. J. Hydrol.-Amst. 1998, 204, 182–196. [Google Scholar] [CrossRef]
  48. Mandelbrot, B.B.; Wallis, J.R. Robustness of the rescaled range R/S in the measurement of noncyclic long run statistical dependence. Water Resour. Res. 1969, 5, 967–988. [Google Scholar] [CrossRef]
  49. Zhang, J.; Gu, Y.; Shen, J.; Zhang, M.; Cong, M.; Sun, Y.; He, J.-J.; Yang, L.-W. Analysis of Spatiotemporal Changes and Driving Factors of Ecological Environment Quality in the Yellow River Basin. Environ. Sci. 2025, 46, 956–971. [Google Scholar] [CrossRef] [PubMed]
  50. Wang, J.; Xu, C. Geodetector: Principle and prospective. Acta Geogr. Sin. 2017, 72, 116–134. [Google Scholar] [CrossRef]
  51. Luo, X.; Wang, L.; Zhang, J.; Yang, Y.; Liu, Z. Spatio-temporal Dynamic and Driving Factor Analysis of Ecological Environment Quality in Qinling Mountains. Environ. Sci. 2025, 46, 3720–3729. [Google Scholar] [CrossRef] [PubMed]
  52. Li, Z.; Tang, R.; He, Y.; Xiao, J.; Zhang, S.; Gu, J.; Yang, W. Spatio-temporal Evolution and Driving Factors of Ecological Environment Quality in the Northern Foothills of the Qinling Mountains Based on RSEI. Earth Sci. 2026, 1–21. [Google Scholar] [CrossRef]
  53. Shi, S.; Peng, S.; Lin, Z.; Zhu, Z.; Ma, D.; Yin, Y.; Lu, X.; Li, T.; Gong, L. Analysis of ecological environment quality heterogeneity across different landform types in Myanmar and its driving forces. Ecol. Indic. 2024, 168, 11. [Google Scholar] [CrossRef]
  54. Lin, J.; Bo, W.; Dong, X.; Zhang, R.; Yan, J.; Chen, T. Evolution of vegetation cover and impacts of climate change and human activities in arid regions of Northwest China: A Mu Us Sandy Land case. Environ. Dev. Sustain. 2025, 27, 18977–18996. [Google Scholar] [CrossRef]
  55. Zheng, H.; Bai, J.; Niu, P.; Peng, T.; Jin, Z.; Bao, H.; Naqvi, S.A.F.; Guan, Y. Soil water balance in response to rainfall variability over a dammed valley farmland in the Chinese Loess Plateau. Ecol. Indic. 2025, 175, 14. [Google Scholar] [CrossRef]
  56. Zhang, P.; Xia, L.; Lei, N. Nutrient assessment and land reclamation in the Loess hills and Gulch region in the context of gully control. Open Geosci. 2023, 15, 11. [Google Scholar] [CrossRef]
  57. Han, H.; Liu, Y.; Zhao, T.; Ji, J.; Yuan, Y. Spatiotemporal Variation in Precipitation in Different Topographic Regions against the Background of Climate Change. Contemp. Probl. Ecol. 2025, 18, 578–588. [Google Scholar] [CrossRef]
  58. Gao, Z.; Shi, P.; Li, Z.; Li, P.; Bai, L.; Jia, Y.; Cui, L. Flood risk assessment of check dams in the Wangmaogou watershed on the Loess Plateau of China. J. Mt. Sci. 2023, 20, 3631–3647. [Google Scholar] [CrossRef]
  59. Lyu, F.; Tang, J.; Olhnuud, A.; Hao, F.; Gong, C. The impact of large-scale ecological restoration projects on trade-offs/synergies and clusters of ecosystem services. J. Environ. Manag. 2024, 365, 121591. [Google Scholar] [CrossRef] [PubMed]
Figure 1. The location of the study area. (a) Shows the DEM map of the study area, (b) shows the geographical zoning map of the study area, (c) shows the land use types of the study area in 2024 (Modified from [39]).
Remotesensing 18 02219 g001
Figure 2. Technique flowchart.
Remotesensing 18 02219 g002
Figure 3. Diagram of RSEI principal component analysis.
Remotesensing 18 02219 g003
Figure 4. Diagram of annual mean RSEI and linear fit.
Remotesensing 18 02219 g004
Figure 5. Diagram of spatiotemporal distribution of EEQ on the Loess Plateau of Northern Shaanxi from 2000 to 2024.
Remotesensing 18 02219 g005
Figure 6. Diagram of RSEI ecological grade transfer matrix and grade proportion on the Loess Plateau of Northern Shaanxi.
Remotesensing 18 02219 g006
Figure 7. Diagram of RSEI change characteristics on the Loess Plateau of Northern Shaanxi.
Remotesensing 18 02219 g007
Figure 8. Diagram of future trends of RSEI on the Loess Plateau of Northern Shaanxi.
Remotesensing 18 02219 g008
Figure 9. Diagram of interaction detection results of RSEI driving factors on the Loess Plateau of Northern Shaanxi from 2000 to 2024.
Remotesensing 18 02219 g009
Table 1. Factor interaction detection results.
InteractionThe Mode of Judgment
Nonlinear Weakening q ( X 1 X 2 ) < min q ( X 1 ) , q ( X 2 )
Single-Factor Nonlinear Weakening min q ( X 1 ) , q ( X 2 ) < q ( X 1 X 2 ) < max q ( X 1 ) , q ( X 2 )
Bivariate Enhancement q ( X 1 X 2 ) > max q ( X 1 ) , q ( X 2 )
Independence q ( X 1 X 2 ) = q ( X 1 ) + q ( X 2 )
Nonlinear Enhancement q ( X 1 X 2 ) > q ( X 1 ) + q ( X 2 )
Table 2. RSEI change significance status statistics from 2000 to 2024.
QRSEI|Z|ChangesProportion/%
>0.0005|Z| ≥ 2.58Extremely Significant Improvement61.94
1.96 < |Z| < 2.58Significant Improvement12.05
1.65 < |Z| < 1.96Moderately Significant Improvement4.95
|Z| < 1.65Non-significant Improvement12.27
–0.0005–0.0005 Essentially Unchanged4.88
<–0.0005|Z| < 1.65Non-significant Degradation3.07
1.65 < |Z| < 1.96Moderately Significant Degradation0.27
1.96 < |Z| < 2.58Significant Degradation0.29
|Z| ≥ 2.58Extremely Significant Degradation0.28
Table 3. Statistics on the future trend of RSEI.
QRSEIHChangesProportion/%
>0.0005H ≥ 0.55Continuous Improvement87.50
<–0.0005 or >0.00050.45 < H < 0.55Random Change3.70
>0.00050 < H < 0.45Improvement to Degradation0.71
–0.0005–0.0005 Stable4.88
<–0.00050 < H < 0.45Degradation to Improvement0.22
<–0.0005H ≥ 0.55Continuous Degradation2.98
Table 4. The effect size of the driving forces on the Loess Plateau of Northern Shaanxi’s EEQ from 2000 to 2024.
YearX1X2X3X4X5X6X7X8X9
2000q0.6000.0020.0120.6700.4230.3220.0240.0960.712
Ranking398245671
2004q0.5270.0010.0650.5730.2760.3750.0230.1670.750
Ranking397254861
2008q0.5260.0020.0650.4040.1620.3230.0220.1400.731
Ranking297354861
2012q0.3770.0080.1060.1450.1400.4730.0350.2580.718
Ranking397562841
2016q0.4480.0090.0470.5090.1540.3560.0320.1720.661
Ranking397264851
2020q0.4170.0170.0470.5310.4160.3440.0330.1790.715
Ranking397245861
2024q0.4440.0130.0340.4370.1350.2970.0280.1050.618
Ranking297354861
Meanq0.4770.0070.0540.4670.2440.3560.0280.1600.701
Ranking297354861
X1 land use type, X2 nighttime light index, X3 annual mean temperature, X4 annual precipitation, X5 root-zone soil moisture, X6 soil type, X7 elevation, X8 slope, X9 geomorphological type.
Disclaimer/Publisher’s Note: The statements, opinions and data contained in all publications are solely those of the individual author(s) and contributor(s) and not of MDPI and/or the editor(s). MDPI and/or the editor(s) disclaim responsibility for any injury to people or property resulting from any ideas, methods, instructions or products referred to in the content.