1. Introduction
Forests are the primary part of terrestrial ecosystems. They help maintain the global carbon balance, protect biodiversity, and regulating regional climate [
1,
2]. Tropical rainforests cover only about 6% of the Earth’s land area. Yet they contain more than half of all known species and hold roughly 25% of the carbon stored in terrestrial vegetation. This role makes them essential to global ecological security [
3]. Hainan Tropical Rainforest National Park is China’s most concentrated and best-preserved tropical rainforest region. It is both a global biodiversity hotspot [
4] and a strategic site for national ecological construction. The condition of its forest ecosystem directly affects water conservation and carbon storage. Fine-scale forest stand identification and mapping are therefore necessary for biodiversity monitoring, accurate carbon accounting, and sustainable ecosystem management [
5]. However, the tree species composition and spatial structure of Hainan’s tropical rainforest are complex. Native species such as Dacrydium pectinatum and Podocarpus imbricatus form multi-layered and uneven-aged stands. By contrast, plantation forests such as rubber and eucalyptus usually show a more uniform pattern. Secondary forests at different successional stages are also mixed across the landscape. This heterogeneity makes forest stand classification difficulty in this region.
Traditional forest resource inventories rely on manual ground surveys. Although accurate, they are inefficient, have limited coverage, and struggle to meet modern demands for large-scale, high-frequency, and fine-grained monitoring. Remote sensing is now the main approach for studying forest vegetation types. Remote sensing data acquired via airborne and satellite platforms provide an essential foundation for forest tree species classification research. Early studies primarily relied on medium-to-low-resolution imagery such as MODIS and Landsat. While offering broad coverage, these data are constrained by the mixed-pixel problem, making fine tree species identification difficult [
6]. Recent advances in remote sensing have improved both the efficiency and precision of forest tree species classification [
7,
8]. Remote sensing data commonly used in this field mainly include airborne LiDAR data, airborne hyperspectral data, and high-resolution multispectral data. Airborne LiDAR emits laser pulses and records reflected signals to generate point clouds. LiDAR data contain forest height and structural information, which are helpful for improving classification accuracy [
9]. Airborne hyperspectral data cover a broad spectral range from visible to thermal infrared. Their high spectral and spatial resolution can increase both the number of species that can be identified and the accuracy of classification. Still, LiDAR and airborne hyperspectral data are expensive to acquire, cover limited areas, and depend on flight plans and weather conditions, which restrict their use for large-scale, continuous monitoring needs [
10]. Satellite imagery has also improved in spatial resolution. For instance, the panchromatic resolution of WorldView-2/3 data can reach 0.46 m and 0.31 m, respectively, and high-resolution imagery on the Google Earth platform can reach up to 0.3 m. These data provide a practical basis for large-scale tree species classification. For example, Fang et al. used WorldView-3 imagery to classify street trees in Washington, achieving an accuracy of 73.7% [
11]; Sun et al. combined WorldView-2 data with LiDAR data for tree species classification in a wetland park, achieving an overall accuracy of 89% [
12]; Lei et al. used Google Earth imagery for individual tree species classification, achieving a maximum overall accuracy of 92.48% [
13].
The complex vegetation structure and high species diversity of tropical rainforests often cause different species to show similar spectral responses in remote sensing classification. This problem of “different objects with similar spectra” remains a major obstacle to accurate species identification. Heterogeneous canopy conditions can produce highly similar spectral signatures among different tree species, which makes discrimination from single-date remote sensing imagery difficult [
14]. Studies have shown that multi-temporal remote sensing imagery can reduce this difficulty and improve classification accuracy in complex forest environments [
15,
16]. Multi-temporal data capture spectral variation across different phenological stages and provide time-dependent information for species discrimination. Grabska et al. used Sentinel-2 time-series data from 2018 to classify tree species in the mixed forests of the Polish Carpathian Mountains. Their results showed that time-series imagery improved overall mapping accuracy by about 5% to 10% compared with single-date imagery [
17]. Hill et al. used five multi-temporal airborne multispectral images and found that the combination of growing-season and leaf-off imagery was the most effective for species discrimination [
18]. Fang et al. classified street trees with 12 WorldView-3 images acquired from April to November and achieved an overall accuracy of 73.7%. They also reported that the autumn senescence period provided the most useful phenological information for classification [
11].
Among the currently available satellite data sources, Sentinel-2 is well suited to large-scale forest tree species classification and mapping. The European Space Agency provides Sentinel-2 data free of charge, and its core spatial resolution is 10 m. Its revisit interval of 3 to 5 days allows repeated observation of vegetation across different phenological stages. Multi-temporal datasets built from key phenological periods can therefore reveal temporal patterns in vegetation spectra and provide strong support for tree species discrimination in tropical rainforests [
19,
20].
Existing studies have also shown that combining multi-temporal data with high-resolution imagery can further improve the accuracy of forest tree species classification. Neyns et al. used multi-temporal PlanetScope data together with high-resolution aerial imagery and found that this combination produced the best result, with an overall accuracy of 0.88 [
21]. Daryaei et al. reported that multi-temporal Sentinel-2 data significantly improved classification accuracy, and that the addition of 3 m PlanetScope imagery led to further gains [
22]. Eskandari et al. combined Sentinel-2 data, field samples, and 0.65 m Google Earth imagery for land cover classification, and their results showed the value of Sentinel-2 data and high-resolution Google Earth imagery for this task [
23]. Sub-meter Google Earth imagery can represent canopy texture, crown shape, and spatial pattern in fine detail [
24]. This complementarity suggests that combining time-series Sentinel-2 data with sub-meter Google Earth imagery may improve tree species identification in complex tropical forest scenes.
Classification performance also depends on the analytical method. Traditional machine learning methods such as Random Forest (RF) and Support Vector Machine (SVM) often show clear limits when they are applied to large, high-dimensional, and multi-source remote sensing datasets. These methods usually depend on manually designed features. Their level of automation and adaptability is therefore limited, which can restrict further gains in classification performance. Since 2015, deep learning methods, especially Convolutional Neural Networks (CNNs), have become a main approach in remote sensing image classification because they support automatic feature extraction and end-to-end learning [
25,
26]. Common CNN models used in tree species classification include VGG [
27], GoogLeNet [
28], ResNet [
29], and DenseNet [
30] (Huang et al., 2017). Guo et al. compared three CNN models with WorldView-3 and Google Earth imagery and found that DenseNet extracted features more effectively and achieved the best accuracy in individual tree species classification [
31]. Rezaee et al. used VGG-16 with WorldView-3 data and reported a classification accuracy of 92.13%, which was much higher than that of Random Forest and Gradient Boosting methods [
32]. Zou et al. combined LiDAR-derived three-dimensional tree information with a Deep Belief Network (DBN) and achieved a classification accuracy of 95.6% [
33]. Raczko et al. compared Artificial Neural Networks, SVM, and RF for tree species classification. Their results showed that the Artificial Neural Network performed best, with a classification accuracy of 77% [
34]. Chen et al. used Res-UNet for individual tree species classification on WorldView-3 imagery acquired in March 2019 in Huangshan, Anhui Province, China. They reported an overall accuracy of 94.29%, which was higher than that of U-Net and ResNet [
35]. More recent models, such as EfficientNet [
36], ConvNeXt [
37], and Vision Transformer [
38], have further improved image classification performance. Huang et al., in a study based on drone imagery from Dongtai Forest Farm, also pointed to the potential of ConvNeXt and Transformer models for forest tree species classification [
39]. These studies show that deep learning methods, especially CNN-based models, have made substantial progress in tree species classification.
As multi-source remote sensing data are used more widely in tree species classification, effective fusion of different image types has become a key issue for improving classification accuracy [
40,
41]. Existing studies that use high-resolution imagery together with multi-temporal spectral data still often rely on a single network for feature extraction or on simple fusion at the decision level [
42,
43]. In practice, a single network architecture often cannot extract and fuse these data effectively. High-resolution imagery mainly provides two-dimensional spatial structure, whereas multi-temporal spectral data mainly reflect one-dimensional temporal dynamics [
44,
45,
46]. These two data types differ substantially in the way that information is represented. A single network therefore has difficulty adapting to both. Simple concatenation or early fusion can also suppress important features or create an imbalance between modalities, which may reduce classification performance [
47]. To address this issue, dual-branch and multi-branch architectures have received increasing attention. Using the TreeSatAI dataset, Qin et al. proposed a multi-branch classification model for multi-source remote sensing data. Their model outperformed DenseNet121, ConvNeXt-Tiny, and ResNet-18 across performance metrics [
48]. Huang et al. [
49] proposed a Dual-Branch Attention-Aided Convolutional Neural Network (DBAA-CNN) for hyperspectral image classification. Their method outperformed 1D-CNN [
50], 2D-CNN [
51], 3D-CNN [
52], and 3D-2D mixed CNN [
53] in both classification accuracy and processing time. Zhu et al. proposed a dual-branch attention fusion network DBAF-Net with an adaptive sampling strategy to implement accurate multiresolution remote sensing image classification [
54]. These studies suggest that branch-based architectures are better suited to heterogeneous data because each branch can adapt to a specific data type. This design can make fuller use of complementarity across modalities and improve tree species classification.
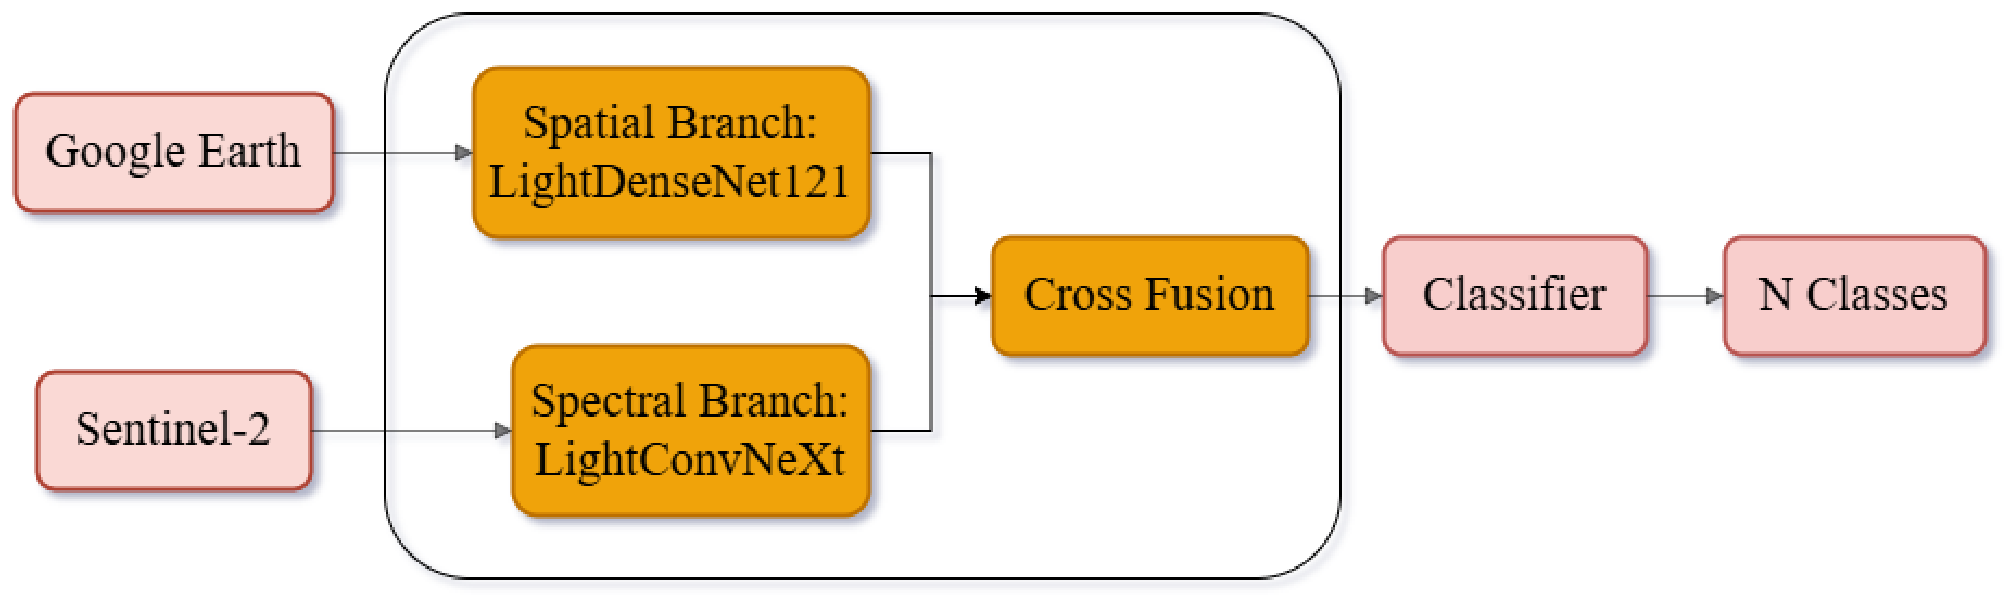
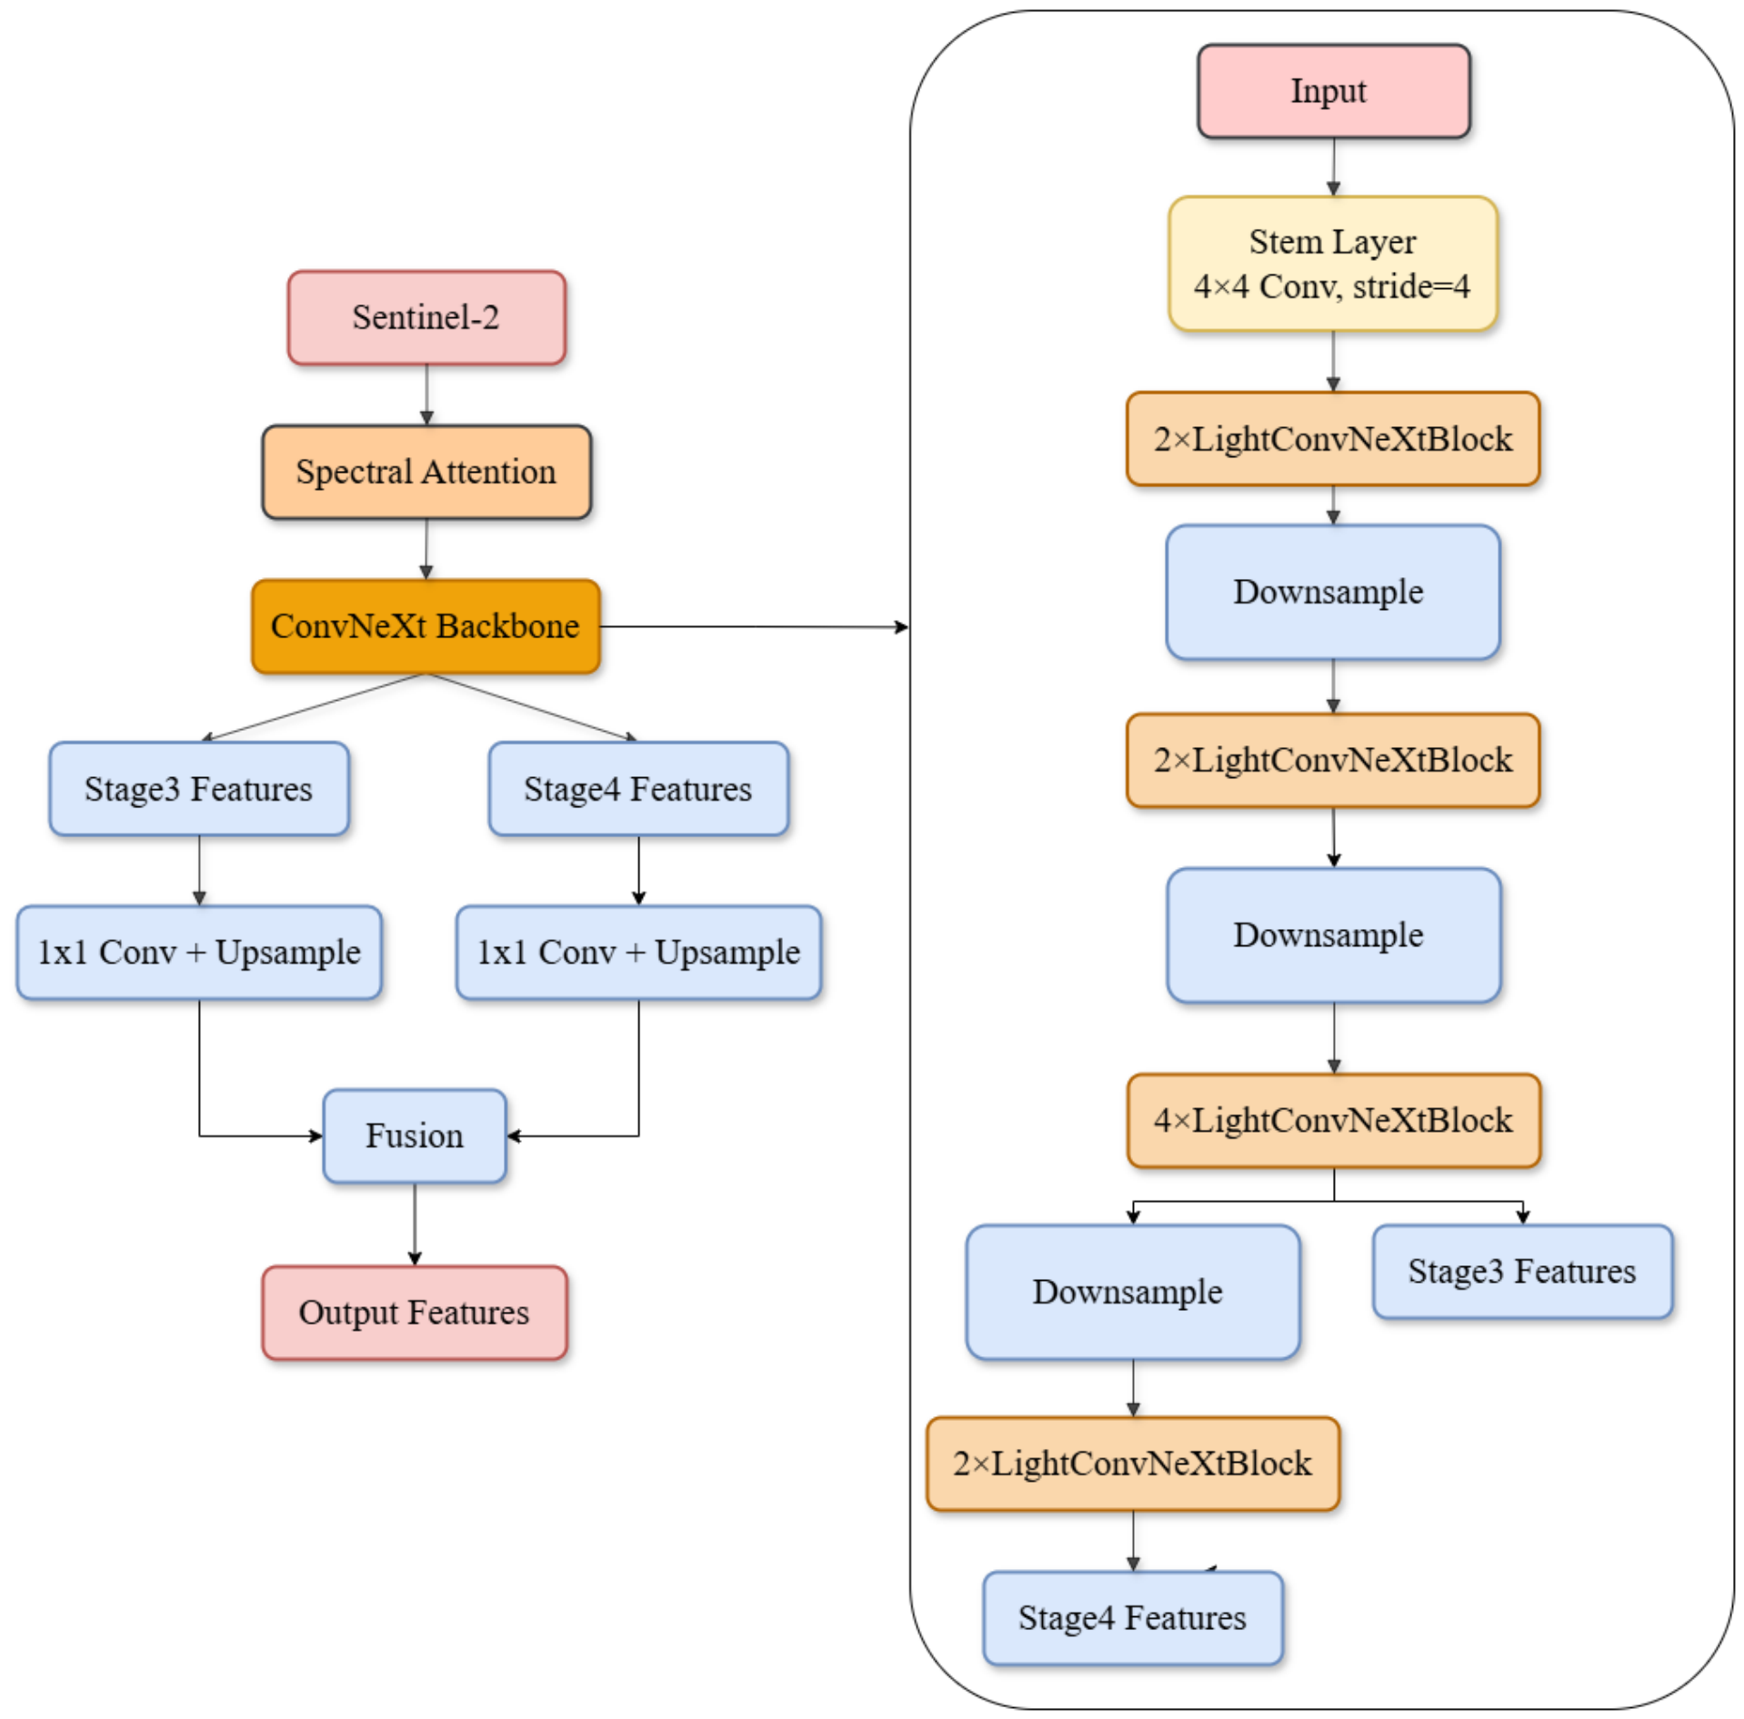
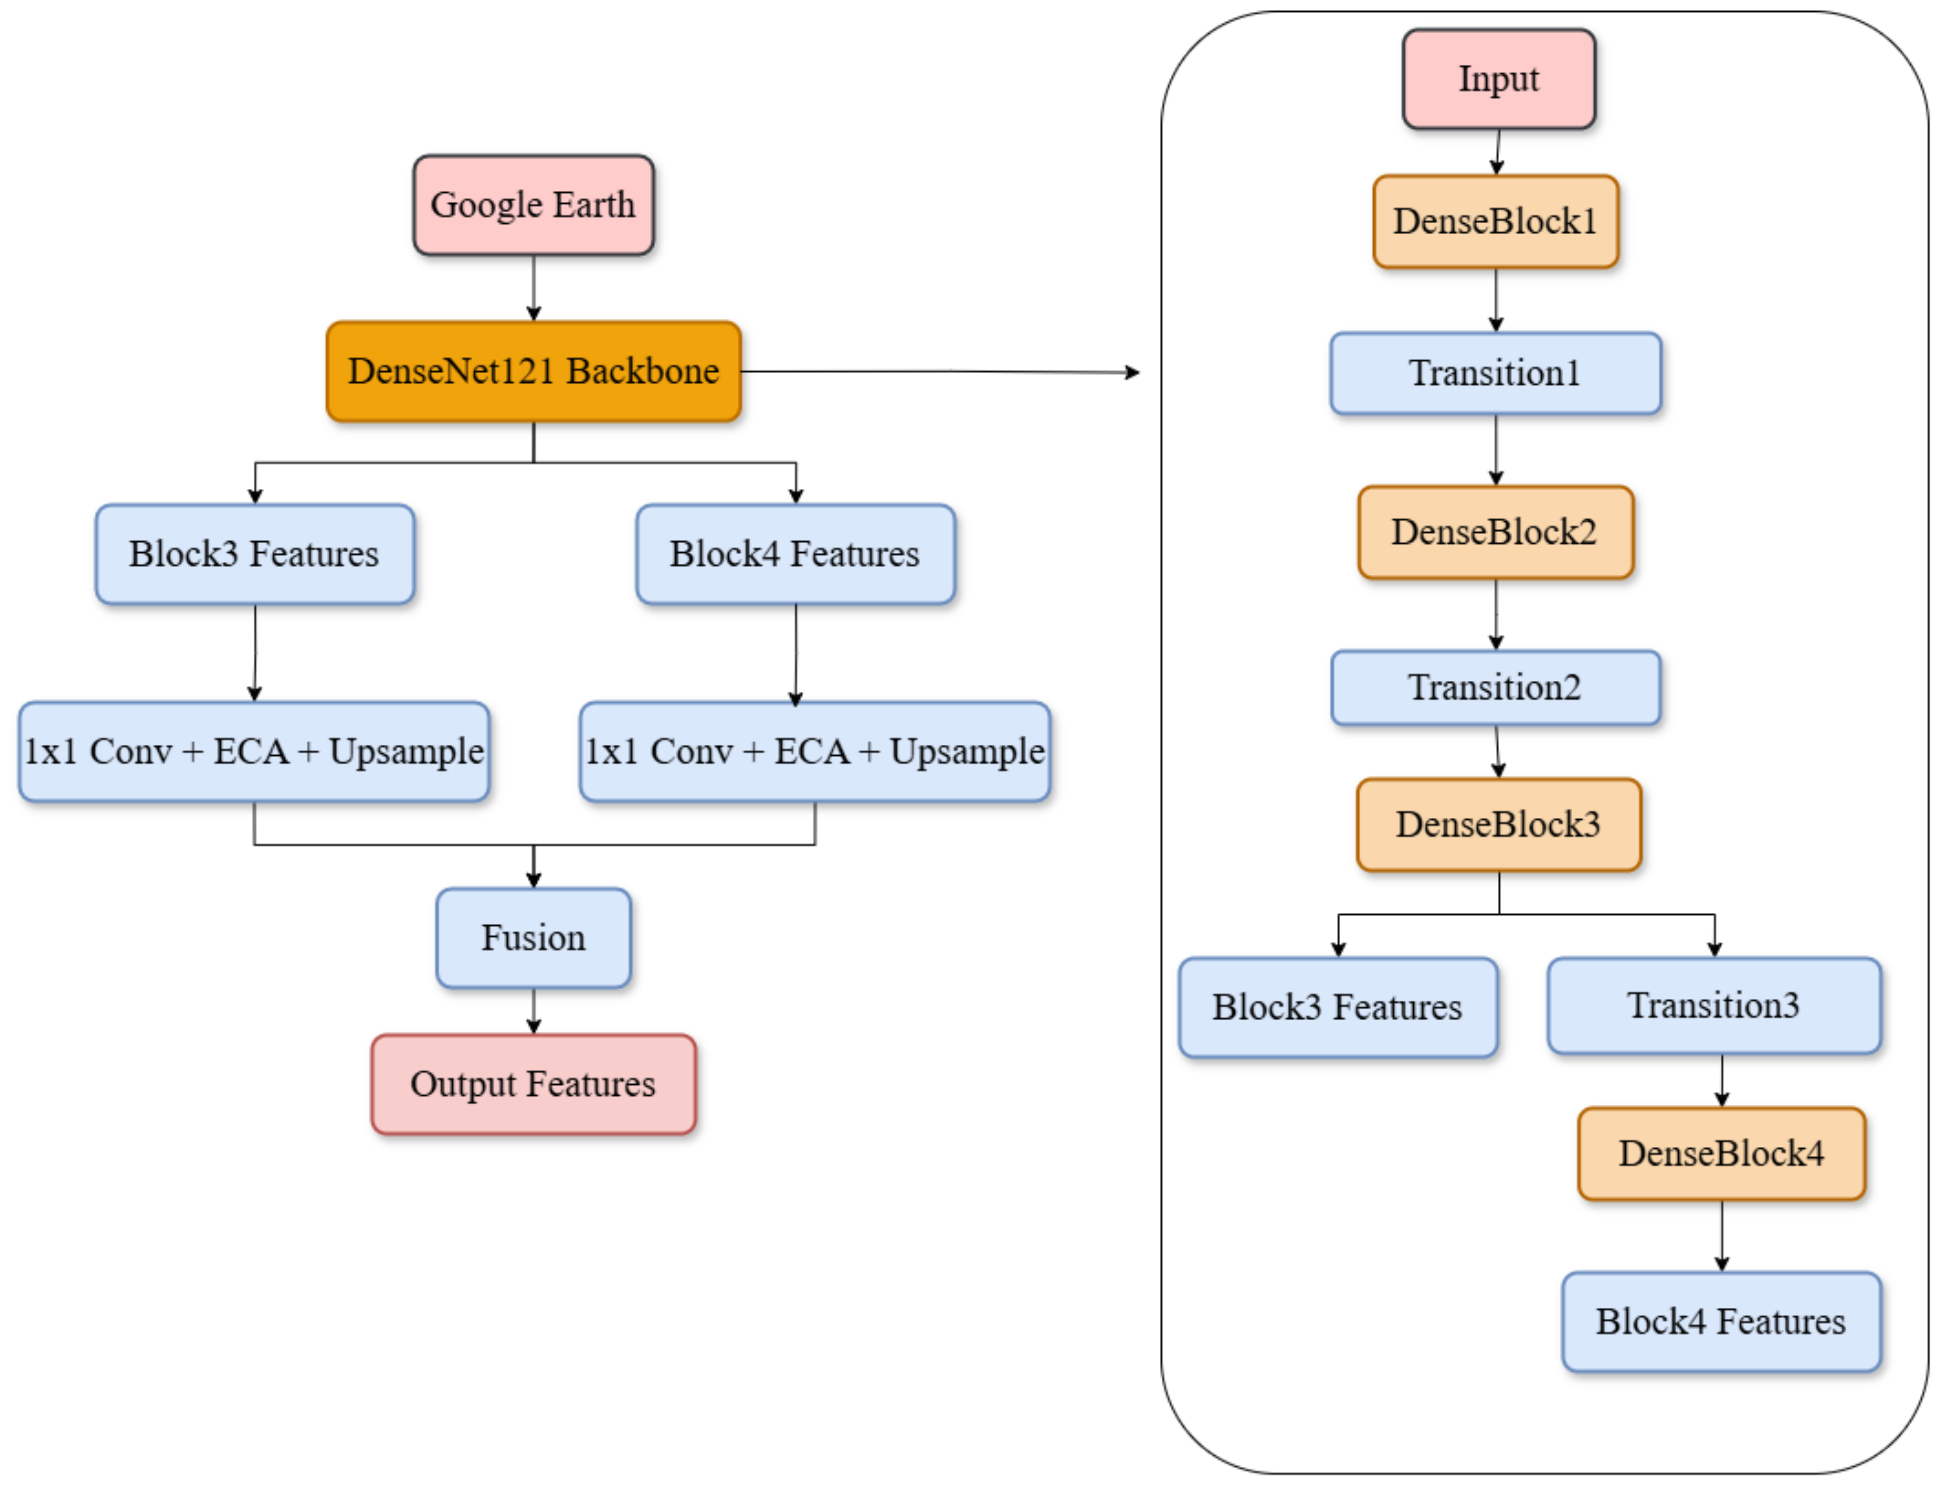
Against this background, this study focuses on the classification challenge created by complex species composition and the strong presence of “different objects with similar spectra” in the Hainan tropical rainforest. It uses sub-meter Google Earth imagery and multi-temporal Sentinel-2 imagery to examine whether the combination of high-resolution spatial information and multi-temporal spectral features can improve tropical rainforest tree species classification. To account for the difference between the two-dimensional spatial structure in high-resolution imagery and the one-dimensional temporal variation in multi-temporal spectra, this study develops a Dual-Branch Feature Fusion Network (DB-FFN). The spatial branch uses DenseNet-121 to learn the complex texture patterns in Google Earth imagery. The temporal branch uses ConvNeXt to extract long-range features from multi-temporal Sentinel-2 data. An adaptive fusion module is then used to integrate the two feature streams at a deeper level. The goal is to improve tree species classification accuracy under the complex conditions of the Hainan tropical rainforest and to provide technical support for biodiversity monitoring, carbon accounting, and sustainable ecosystem management.
3. Results
- (1)
The Comparative Experiment
Table 3,
Table 4,
Table 5 and
Table 6 report the classification results of DB-FFN and the six benchmark models (VGG-16, ResNet-18, GoogLeNet, DenseNet-121, ConvNeXt, DBAF-Net [
54]) under four data setting. This section analyzes the results based on five aspects. The first aspect compares single-date and multi-temporal Sentinel-2 data and assesses the contribution of phenological information. The second aspect evaluates the effect of combining high-resolution Google Earth imagery with multi-temporal Sentinel-2 data. The third aspect compares DB-FFN with the benchmark models under the fused data setting. Class-level accuracy and the final spatial classification map are also reported. The fourth aspect analyzes the accuracy of different tree species categories under the DB-FFN model to clarify the recognition accuracy of each tree species category. The fifth aspect presents the forest stand tree species classification map of the study area under the DB-FFN model to analyze the distribution of each forest stand type in the study area.
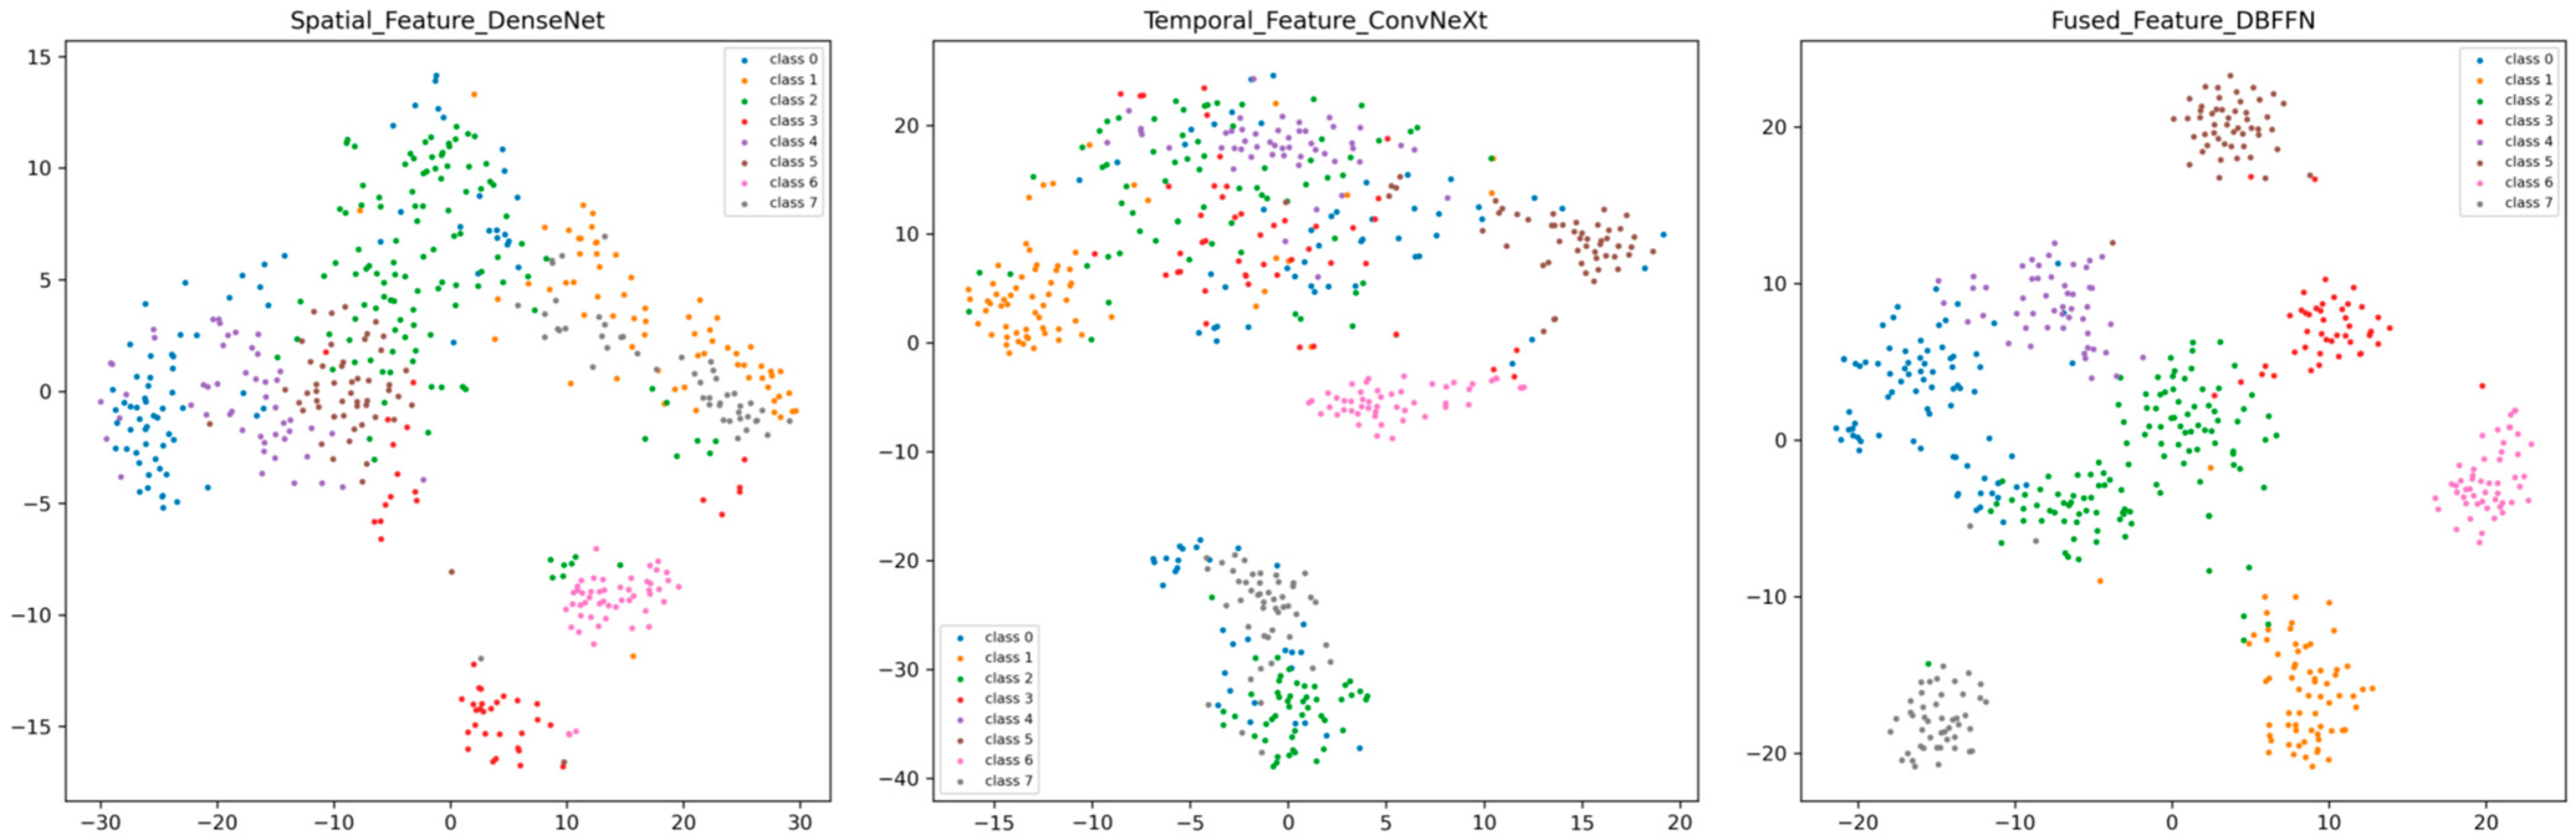
To understand what each branch had learned, we used t-SNE to reduce the feature dimensions and visualize their distribution as shown in
Figure 8 and
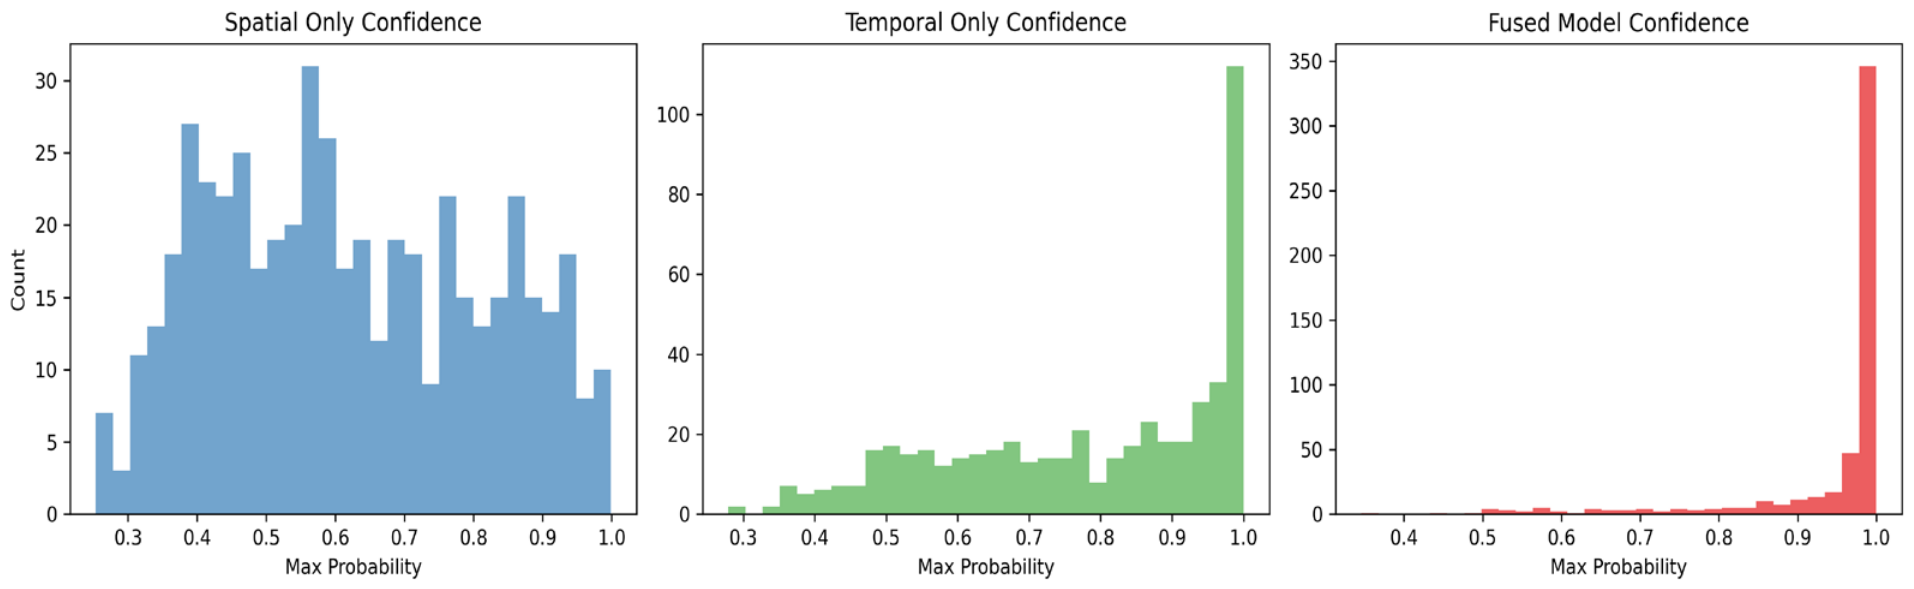
Figure 9. The spatial branch captured fine canopy texture and structural information. The temporal branch focused on seasonal spectral variation and phenological characteristics. When we looked at the plot, the two feature sets showed clearly different distributions. This separation suggests strong complementarity between the two types of features. We also looked at the posterior probability distributions from three prediction modes: spatial-only, spectral–temporal-only, and the fused dual-branch model. The single-modal outputs showed scattered confidence values. Many samples fell in the uncertain middle range. After fusion, the confidence values clustered at the high end. This shift tells us that fusing both modalities reduces uncertainty. The classification becomes more stable and reliable.
The computational complexity of DB-FFN primarily comes from two parts that perform feature extraction. One part is the spatial branch built on DenseNet121, and the other is the temporal branch built on ConvNeXt-Tiny. These two branches together take up most of the network’s computation cost. They carry out nearly all of the feature extraction and transformation work. In contrast, the gated fusion module only performs light feature interaction and adaptive weight adjustment. This module adds almost no computation. Thus, when the input spatial size grows, the model’s total computational complexity rises steadily.
For a more precise measure of the actual computation cost and running efficiency, three common indicators are used. These are FLOPs, Params, and inference time. FLOPs mean the total floating-point operations in the network. This number directly shows how much calculation is done. Params are the total number of trainable parameters. They reflect the model’s size, how much memory it needs, and the chance of overfitting. Inference time is the average time spent on processing one test sample. It directly tells us how fast the model makes predictions and how well it can be deployed in practice. Taken together, these three measures give a full and clear picture of the model’s computation cost and operating efficiency.
Looking at the number of parameters as shown in
Table 7, the DB-FFN model has 12.74 million parameters. This number is much smaller than that of VGG16 or ConvNeXt-Tiny. At the same time, it stays at a similar scale as ResNet18 and GoogLeNet. This shows that the better performance of the proposed model does not come from simply making the model bigger.
For computational complexity, DB-FFN has 1.56 GFLOPs. This value is lower than those of VGG16, ResNet18, DenseNet121, and GoogLeNet, and is only a bit higher than that of ConvNeXt-Tiny. For inference speed, ResNet18 has the lowest delay because its structure is simple. DB-FFN uses two branches for feature extraction and fusion. Because of this design, it takes a little more inference time than single-branch networks. Still, its inference efficiency is better than that of DenseNet121.
Taking everything together, the proposed DB-FFN gives better classification accuracy while keeping a moderate number of parameters, low computational complexity, and acceptable inference speed. This shows a good balance between classification performance and computational cost.
- (2)
The Multi-round Repeated Experiment
To remove the randomness caused by model initialization and data loading order, five independent runs with different random seeds were carried out for each of the compared models. All experiments shared hyperparameter settings, and hardware environment.
Table 8 reports the mean, standard deviation, maximum, and minimum values of overall accuracy (OA) and Kappa coefficient.
As shown in
Table 8, DB-FFN achieved the highest average OA (0.9315) and Kappa (0.9202) among all methods. It also obtained the best maximum values: an OA of 0.9449 and a Kappa of 0.9360. Although its standard deviation was slightly larger than that of some baseline models, its lowest OA and Kappa values were still higher than those of most other networks. The classic backbone networks exhibited relatively small standard deviations. This indicates stable performance across different runs. DenseNet121 and ConvNeXt achieved similar average accuracies, and both offered competitive classification capability. ResNet18 recorded the lowest average accuracy. VGG16 and GoogLeNet fell in the middle with moderate overall performance. Overall, the dual-branch fusion structure effectively extracts complementary spatial and spectral features. This design leads to a steady improvement in performance compared with single-branch mainstream models.
- (3)
The Ablation Experiment
Ablation experiments as shown in
Table 9 were conducted to quantify the contribution of each core module. The baseline dual-branch model, without the attention mechanism and gated fusion, obtained an overall accuracy of 92.41% and a Kappa of 0.91. The complete DB-FFN model reached an overall accuracy of 94.49% and a Kappa of 0.94, an increase of 2.08 percentage points. This result demonstrates the clear benefit of integrating all components.
Removing the ECA attention mechanism caused the accuracy to drop to 92.91% and the Kappa to 0.92. The numerical gap suggests that the attention module helps enhance effective feature weights and brings a tangible gain in performance.
When only a single branch was used, the classification ability dropped sharply. The RGB branch achieved an overall accuracy of 88.78% and a Kappa of 0.87, while the multispectral branch obtained only an overall accuracy of 82.68% and a Kappa of 0.80. The large difference between single-branch and dual-branch results indicates that neither modality alone can support high-accuracy classification. The two branches supply irreplaceable complementary information.
Removing the gated fusion module reduced the accuracy to 93.31% and the Kappa to 0.92, a drop of 1.18 percentage points compared with the full model. This confirms that the adaptive gated fusion mechanism can properly allocate feature weights and effectively improve classification performance. Overall, all components work together to achieve the best comprehensive result.
3.1. Effect of Multi-Temporal Information on Classification Accuracy
A comparison between
Table 3 and
Table 4 shows that all five benchmark models performed better with multi-temporal Sentinel-2 data than with single-data Sentinel-2 data. The overall accuracy (OA) of ConvNeXt increased from 62.40% to 83.07%, which corresponds to a gain of 20.67 percentage points. The OA of ResNet-18 increased from 58.86% to 80.12%, a gain of 21.26 percentage points. GoogLeNet increased from 61.81% to 83.27%, an increase of 21.46 percentage points. DenseNet-121 increased from 60.04% to 82.09%, a gain of 22.05 percentage points. VGG-16 increased from 58.86% to 74.02%, a gain of 15.16 percentage points. Among the five models DenseNet-121 showed the largest improvement, whereas VGG-16 showed the smallest gain.
The Kappa coefficient showed the same pattern. It increased from 0.52–0.56 in the single-date setting to 0.70–0.81 in the multi-temporal setting. These results suggest that the images acquired in January, March, August, and November provided useful phenological information for tree species discrimination. Relative to single-date imagery, the multi-temporal setting appears to reduce classification confusion caused by similar spectral responses among different classes. This pattern was observed across all tested models.
3.2. Effect of Multi-Source Data Fusion on Classification Accuracy
A comparison of
Table 4,
Table 5 and
Table 6 shows a consistent ranking across data setting. For all methods, the fused setting—that is, Google Earth imagery combined with multi-temporal Sentinel-2 data—produced the highest accuracy. The Google Earth-only setting ranked second, the multi-temporal Sentinel-2-only setting ranked third, and the single-date Sentinel-2 setting ranked last.
Relative to single-date Sentinel-2 baseline, the fused data setting improved OA by 30.91 percentage points for ConvNeXt, 34.05 percentage points for ResNet-18, 30.32 percentage points for GoogLeNet, 32.28 percentage points for DenseNet-121, and 32.28 percentage points for VGG-16. The Kappa coefficients followed the same trend and reached 0.90–0.92 in the fused setting, which was higher than the corresponding values in the single-source settings.
The gain from the multi-temporal Sentinel-2 setting to the fused setting was also clear. OA increased 10.24 percentage points for ConvNeXt, 12.79 percentage points for ResNet-18, 8.86 percentage points for GoogLeNet, 10.23 percentage points for DenseNet-121, and 17.12 percentage points for VGG-16. These results indicate that high-resolution spatial information and multi-temporal spectral information are complementary in this dataset. Google Earth imagery contributed fine canopy texture and spatial pattern, whereas multi-temporal Sentinel-2 data contributed seasonal spectral variation. Their joint use improved classification performance in complex tropical forest scenes.
3.3. Performance of DB-FFN Under the Fused Data Setting
Under the fused setting of Google Earth imagery and multi-temporal Sentinel-2 data, DB-FFN achieved the best overall performance among all evaluated models. Its OA reached 94.49%, and its Kappa coefficient reached 0.94. Under the same data setting, DB-FFN outperformed the best benchmark model, ConvNeXt, by 1.18 percentage points in OA. It also exceeded GoogLeNet, ResNet-18, DenseNet-121, and VGG-16by 2.36, 1.58, 2.17, and 3.35 percentage points, respectively.
The advantage of DB-FFN was also evident when it was compared with the best results obtained under each single-source setting. Its OA was 4.92 percentage points higher than the best Google-Earth-only result, which was achieved by DenseNet-121 at 89.57%. It was 11.22 percentage points higher than the best multi-temporal Sentinel-2-only result, which was achieved by GoogLeNet at 83.27%. It was also 32.09 percentage points higher than the best single-date Sentinel-2-only result, which was achieved by ConvNeXt at 62.40%. These results support the use of a dual-branch architecture for the joint use of spatial texture information and temporal spectral information.
3.4. Class-Level Accuracy of the DB-FFN Mode
Table 10 presents the confusion matrix of the DB-FFN model and the producer’s accuracy (PA), user’s accuracy (UA), and F1-Score for each forest stand type. Overall, the class-level results are high, but the performance varied across classes.
Among the plantation classes, Caribbean pine plantation and rubber plantation showed very high classification accuracy, with PA, UA, and F1-Score close to or at 100%. Pinus latteri plantation also showed stable performance, with an F1-Score of 97% and both PA and UA above 96%. Tropical montane rainforest primary forest reached a PA of 95% and a UA of 90%, which suggests limited but non-negligible confusion with other forest types.
Tropical deciduous/semi-deciduous rainforest achieved an F1-Score of 96%, with a UA of 100% and a PA of 92%. This pattern suggests that predictions assigned to this classes were highly reliable, although some reference samples of this classes were still assigned to other categories. Lowland rainforest secondary forest had the lowest F1-Score among the eight classes, at 91%, which indicates that it has remained the most difficult class to separate. It errors involved several other categories, including tropical deciduous/semi-deciduous rainforest and betel nut palm plantations. This result is consistent with the high heterogeneity of secondary forests in species composition, structure, and phenology.
Artificial plantations typically consist of a single tree species and have a uniform stand structure. In contrast, lowland rainforest secondary forest develops through natural succession and community recovery after disturbance. This forest contains a mixture of trees, shrubs, and herbaceous plants, which creates a highly complex species composition. Spatially, the canopy texture is irregular and fragmented. It lacks the regular crown shapes seen in artificial forests. Phenologically, the mixed tree species do not grow and shed leaves at the same time. This asynchronous rhythm leads to constantly changing seasonal spectral characteristics. The complex spatial texture and asynchronous phenology cause its spectral signature to overlap strongly with those of neighboring forest types. As a result, inter-class confusion is most severe and classification accuracy is the lowest.
Betel nut palm plantation also showed high class-level accuracy, with a UA of 98% and a PA of 96%, which indicates only limited confusion. Lowland rainforest showed a high PA of 98% but a lower UA of 88%. This pattern suggests that most reference samples of this class were identified correctly, but some reference samples were also predicted as other categories, such as tropical montane rainforest primary forest and Pinus latteri plantations. Overall, the remaining confusion appears to be associated with similarities in canopy structure, seasonal behavior, and community-level spectral response among different forest stand types.
3.5. Forest Stand Classification Map Produced by DB-FFN
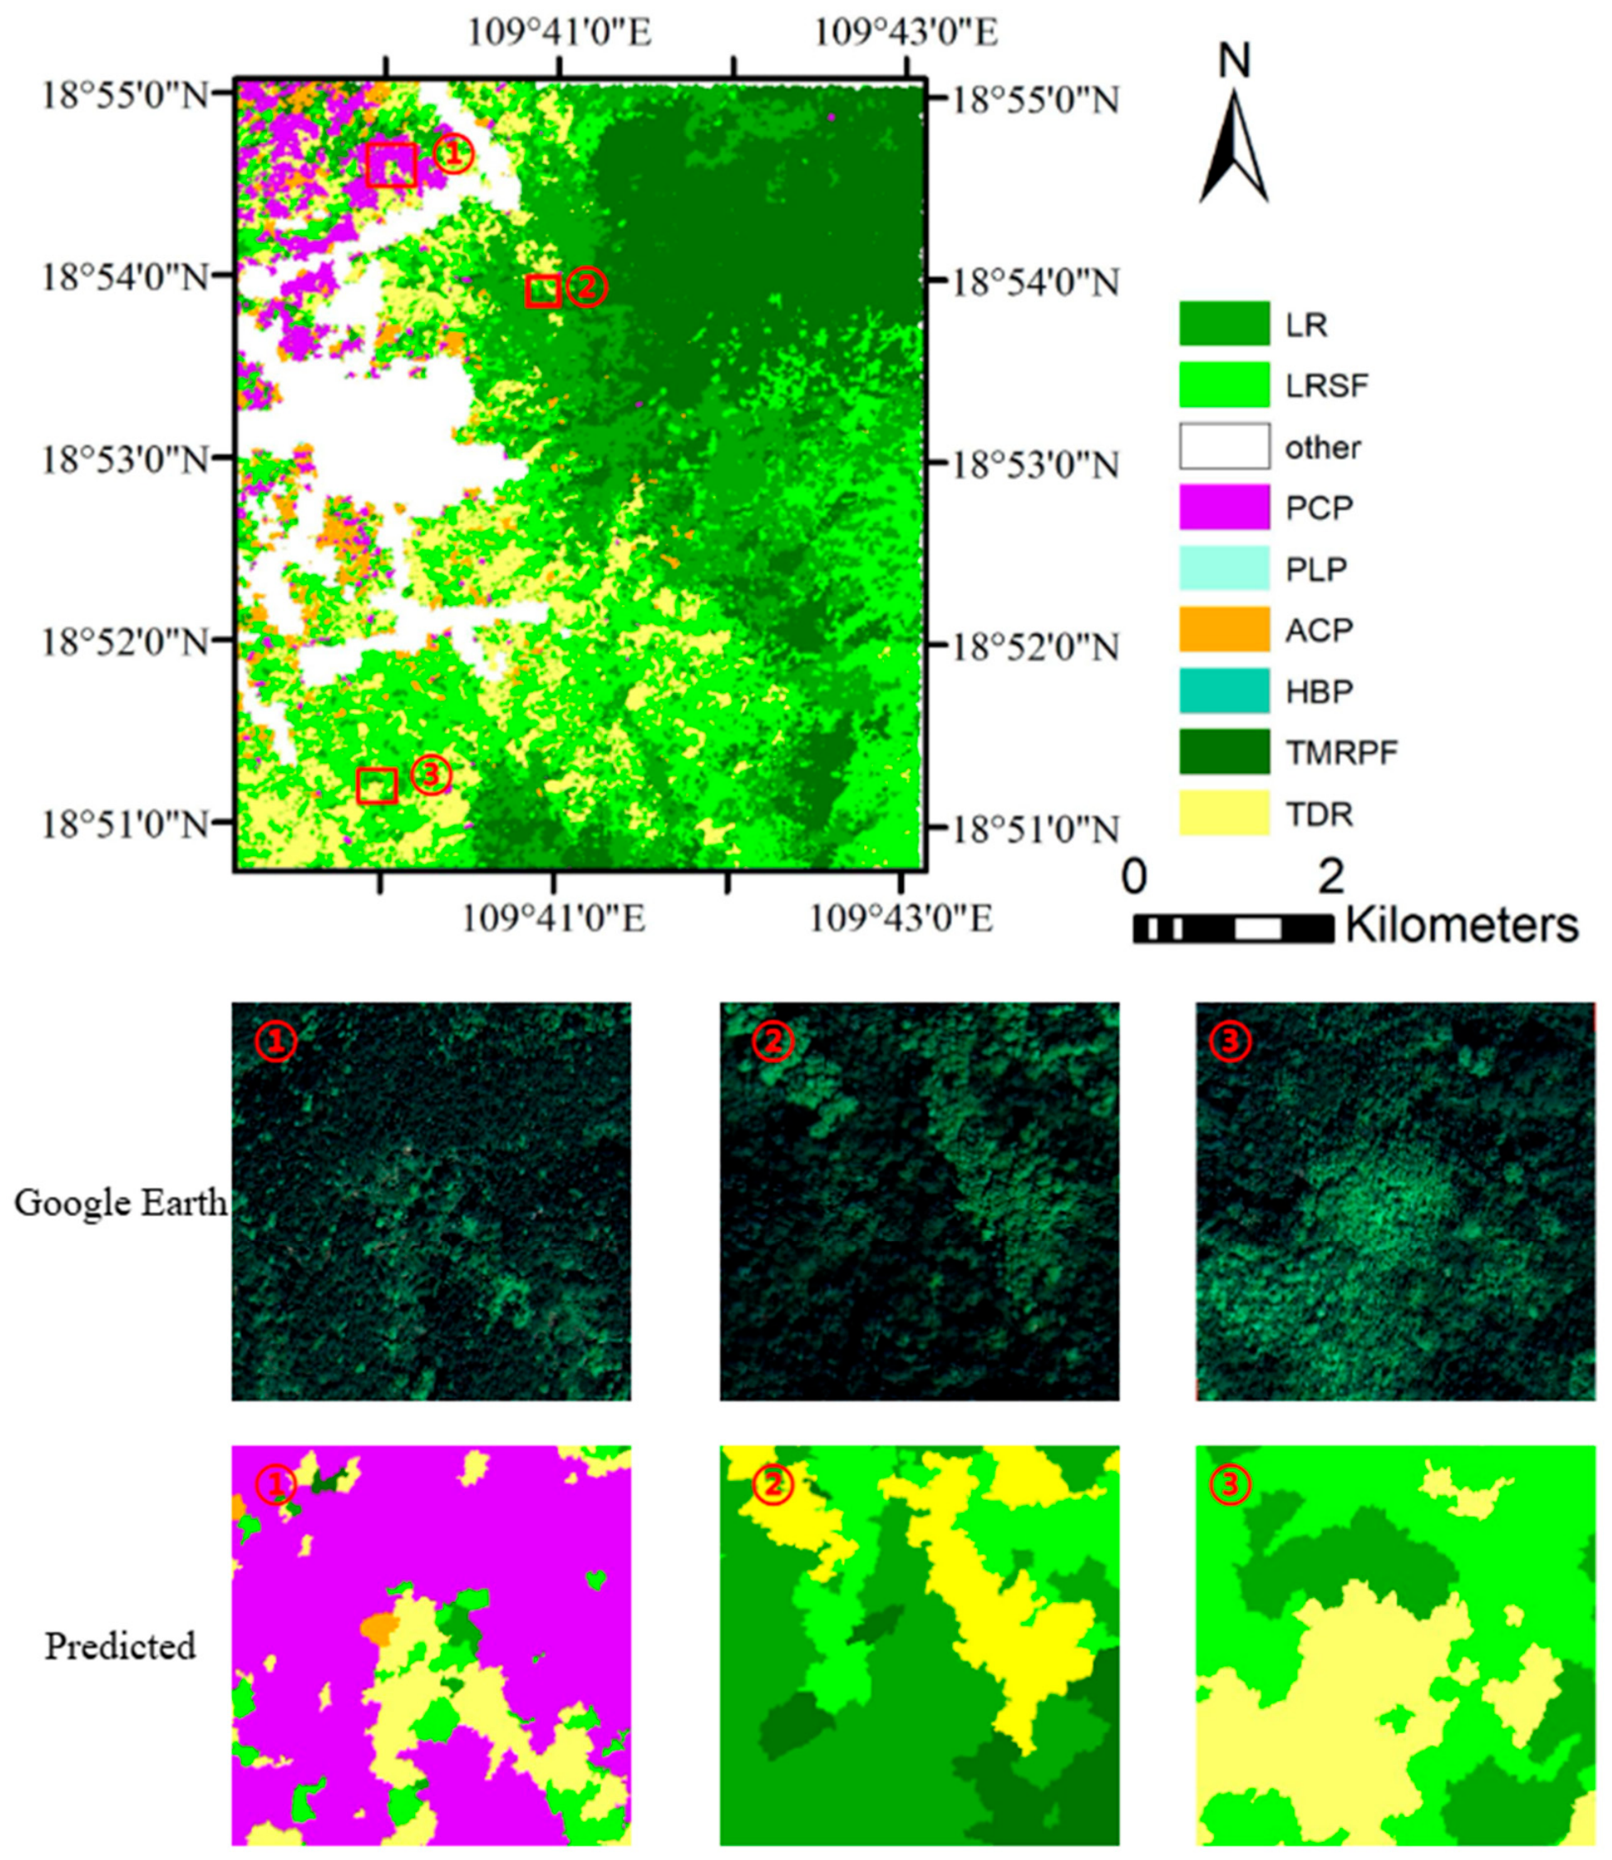
Figure 10 shows the forest stand classification map produced by DB-FFN. The map captures clear spatial heterogeneity and a mosaic distribution pattern across the study area.
Natural forest stands, including tropical montane rainforest primary forests and lowland rainforests, were concentrated mainly in topographically complex areas. Their patches exhibit irregular shapes and their boundaries were relatively complex. By contrast, managed plantation types, including Caribbean pine, rubber, and betel palm, showed more regular and concentrated patches. These patches are often located near roads or cultivation areas.
Lowland rainforest secondary forest and tropical deciduous/semi-deciduous rainforest were more scattered and were often interwoven spatially. This pattern may reflect differences in recovery stage and disturbance history. Overall, the map captured the main distribution patterns and patch boundaries of the major forest stand types. These findings suggest that the multi-source data fusion approach can support forest stand classification and spatial mapping in complex tropical environments. The resulting map can provide a spatial basis for subsequent analyses of biodiversity, forest succession, and ecosystem management.
4. Discussion
4.1. Role of Multi-Temporal and Multi-Source Data Fusion
This study indicates that multi-temporal phenological information made an important contribution to tropical rainforest tree species classification in this classification task. In single-date imagery, many tree species were difficult to distinguish because canopy spectral responses overlapped strongly. By using imagery from four time points, January, March, August, and November, the model was able to capture the seasonal spectral variation among species. This variation is related to changes in leaf pigments, water content, and phenological stage. It therefore provided additional information for separating classes with similar spectral responses. For example, the OA of ConvNeXt increased from 62.40% with single-date Sentinel-2 data to 83.07% with multi-temporal Sentinel-2 data, which represents a gain of 20.67 percentage points. In this dataset, temporal phenological information provided more discriminative information than single-data spectral features alone. It also reduced confusion associated with the problem of “different objects with similar spectra.”
A major cause of this confusion lies in the limited spectral information offered by high-resolution RGB imagery. Such data simply cannot capture enough spectral detail for accurate forest stand classification. Many distinct tree species look very similar in RGB images. Their colors and visual textures overlap heavily, which leads to serious spectral mixing and greater classification uncertainty. These inherent drawbacks restrict both the accuracy and the reliability of using RGB data alone. To address this problem, multisource remote sensing data and effective fusion strategies are needed. They can compensate for the weaknesses of each single data type.
High-resolution imagery, such as Google Earth imagery, captured canopy texture, crown form, and spatial patterns in fine detail, but it did not provide seasonal spectral variation. Multi-temporal spectral data recorded phenological change, but they contained less spatial detail. When these two resources were combined, they provided a more complete description of forest stands. This pattern can be seen in the DenseNet121 results. Under the fused setting, DenseNet121 reached an OA of 92.32%. Under the Google Earth-only setting, its OA was 89.57%. Under the multi-temporal Sentinel-2-only setting, its OA was 82.09%. These results suggest that the two data sources provided complementary information and helped reduce the limitations of single-source classification in complex forest scenes.
4.2. Role of Branch-Specific Feature Extraction and Adaptive Fusion in DB-FFN
DB-FFN differed from the benchmark models in the way that multi-source inputs were handled. Under the fused data setting, the benchmark models received the two data sources through direct concatenation of Google Earth imagery and multi-temporal Sentinel-2 data. By contrast, DB-FFN processed the two data sources through two dedicated branches before feature fusion.
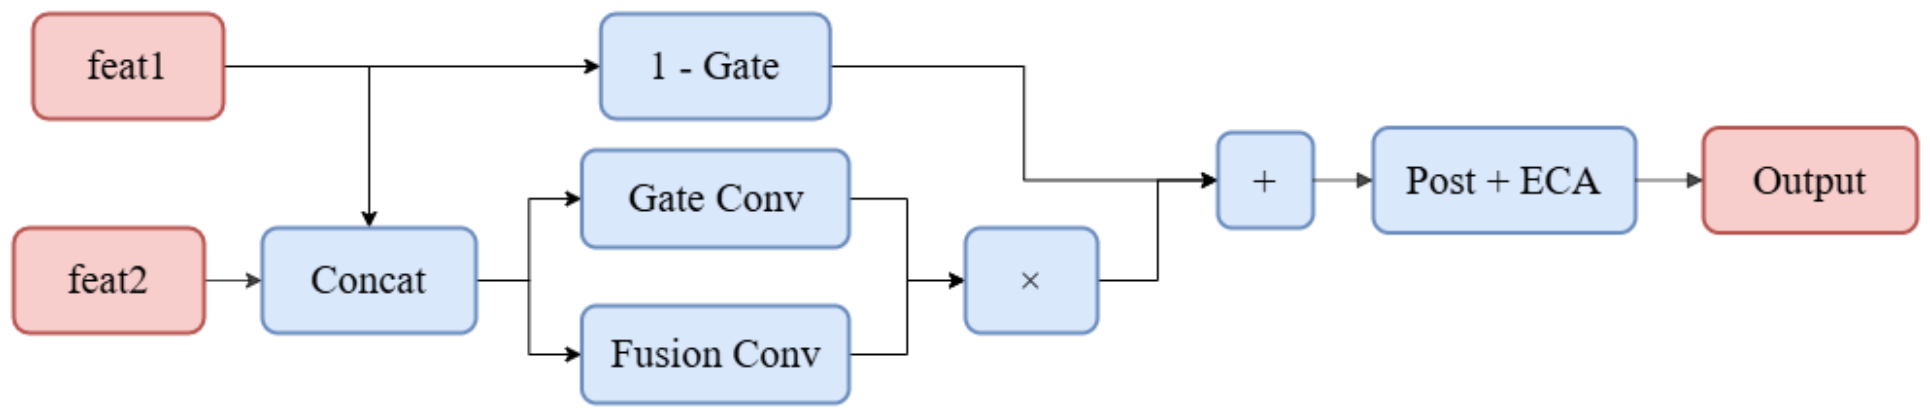
The performance of DB-FFN may be related to two parts of its design: branch-specific feature extraction and adaptive fusion. The DenseNet branch is used to extract spatial textural features from high-resolution imagery. These features may help represent canopy boundary, local pattern, and crown shape. The ConvNeXt branch is used to model temporal dependence in the multi-temporal spectral sequence. This branch may help represent seasonal variation among forest stand types. The gated attention module then combines the two feature streams. This design allows the model to place different emphasis on spatial and temporal information for different samples.
The experimental results suggest that this design was effective for the present task. Under the fused data setting, DB-FFN achieved an OA of 94.49%, which was 1.18 percentage points higher than the best benchmark model, ConvNeXt. Because the comparison models under the same setting used direct concatenation of the two data sources, this result suggests that simple concatenation was less effective than branch-specific feature extraction followed by adaptive fusion in this dataset. The result also indicates that, in complex tropical rainforest environments, heterogeneous data sources may be used more effectively when each source is modeled through a dedicated pathway before integration.
4.3. Limitations
The dataset used in this study has small problems with sample size and class distribution. These problems are common in remote sensing work on tropical forests. Collecting field samples in the Hainan tropical rainforest is difficult because of the complex terrain, dense plants, and limited access. This makes it hard to get enough labeled samples that are evenly spread across different classes. On top of that, different tree species naturally occur in different numbers. These sampling difficulties, together with natural differences in species abundance, cause small differences in the number of samples across forest stand classes. For classes that have a relatively sufficient number of samples, the model can learn stable feature representations. For classes with fewer samples, the model may not capture all the important features. This could have small negative effects on classification performance.
To make the training data more diverse, this study uses simple geometric augmentation methods. These include rotation and flipping. They are used to expand the training dataset. These simple transformations can increase sample variety. However, they only rearrange the pixel information that is already there. They do not create new spectral or spatial features. Because of this, such augmentation methods cannot add new useful feature information. They can only reduce the small differences in sample quantity and distribution across tropical forest classes, not completely fix them.
There are two main ways to expand training samples: data augmentation and data generation. Simple geometric augmentation has only a limited effect on improving the sample problem. Because of this, later studies can try using generative data generation methods. One example is the vMRF-based GANSO method [
58]. This method can improve sample quality and make the class distribution more balanced. Unlike geometric augmentation, which only changes the arrangement of pixels, the vMRF-constrained GANSO method can retain the spatial connections and structural features of the original remote sensing images when it creates new samples. This matches the real-scene properties that the augmentation method used in this study also tries to maintain. This type of generative method works well for datasets with a small class imbalance. It can also handle cases where there are not enough labeled samples. It provides a possible way to improve the generalization performance of tropical forest stand classification models in future work.
5. Conclusions
This study examined fine-grained tree species classification in tropical rainforests by combining high-resolution Google Earth imagery with multi-temporal Sentinel-2 data. Meanwhile, a dual-branch feature fusion network (DB-FFN) was developed to explore the value of independent feature learning and adaptive fusion for different data types. Classic benchmark models were compared under multiple experimental data settings.
Three main findings can be drawn from this study. First, multi-temporal phenological information improves class separability by capturing seasonal spectral variations that single-phase imagery cannot fully reflect. It relieves the problem of similar spectral features among different tree species in complex tropical environments. Second, high-resolution spatial information and multi-temporal spectral information are complementary: the former characterizes canopy texture and spatial structure, while the latter captures long-term phenological dynamics, and their integration achieves a more comprehensive representation of complex forest stand features. Third, the customized fusion design improves classification performance. The multi-source fused data outperforms single data sources, and the proposed DB-FFN achieves the optimal overall effect. This indicates that extracting spatial and spectral–temporal features through separate branches before adaptive fusion is well suited to make full use of heterogeneous remote sensing data.
This study suggests that phenology should be regarded as a core dimension in tropical rainforest tree species classification. It also proves that combining high-resolution texture data and multi-temporal satellite data can support accurate fine-scale mapping in complicated forest areas. From a methodological perspective, separate feature extraction for different data sources, followed by adaptive fusion, can enhance the utilization efficiency of multi-source heterogeneous information.
Future research can validate the generalizability of this framework across more tropical forest regions and diverse temporal scenarios. Additional data such as UAV hyperspectral imagery and LiDAR can be integrated to enrich multi-dimensional feature systems. Moreover, introducing cross-regional transfer learning will further strengthen the model’s practical adaptability in different tropical forest environments.