Article

DCA-UNet for Landslide Segmentation with Deformable Convolution and Aggregated Attention

1
School of Software, East China University of Technology, Nanchang 330013, China
2
Geophysical Exploration Brigade, Hubei Geological Bureau, Wuhan 430070, China
3
Faculty of Information Engineering, Xinjiang Institute of Engineering, Urumqi 830023, China
4
School of Information Engineering, East China University of Technology, Nanchang 330013, China
5
School of Earth Sciences, East China University of Technology, Nanchang 330013, China
6
School of Surveying and Geoinformation Engineering, East China University of Technology, Nanchang 330013, China
7
Hubei Key Laboratory of Resources and Eco-Environment Geology, Hubei Geological Bureau, Wuhan 430034, China
8
Geological Environmental Center of Hubei Province, Wuhan 430034, China
9
Wuhan Center, China Geological Survey (Central South China Innovation Center for Geosciences), Wuhan 430205, China
10
School of Information Engineering, Huzhou Normal University, Huzhou 313000, China
11
National Institute of Natural Hazards, Beijing 100085, China
12
School of Geophysics and Space Exploration, East China University of Technology, Nanchang 330013, China
*
Author to whom correspondence should be addressed.
Remote Sens. 2026, 18(12), 2000; https://doi.org/10.3390/rs18122000
Submission received: 6 May 2026 / Revised: 10 June 2026 / Accepted: 15 June 2026 / Published: 16 June 2026
(This article belongs to the Special Issue Landslide Detection Using Machine and Deep Learning)

Highlights

What are the main findings?
  • DCA-UNet combines deformable convolution and aggregated attention to improve landslide segmentation.
  • Across Landslide4Sense, HR-GLDD, and GDCLD, DCA-UNet achieves the strongest overall IoU/F1 ranking under a unified benchmark.
  • Ablation results show that deformable convolution and aggregated attention provide complementary performance gains.
What is the implication of the main finding?
  • DCA-UNet offers a practical accuracy–complexity trade-off, maintaining a moderate parameter budget relative to heavier transformer baselines.

Abstract

Accurate delineation of landslide boundaries from remote sensing imagery remains challenging because landslides exhibit irregular geometry, substantial scale variation, and strong background interference. We propose DCA-UNet, a U-Net-style segmentation network that integrates deformable convolution and aggregated attention to jointly improve geometric adaptation and local-global context modeling. Deformable convolution adjusts spatial sampling locations to irregular landslide boundaries, whereas aggregated attention enhances contextual discrimination in visually ambiguous terrain. We evaluate the method on three public benchmarks—Landslide4Sense, HR-GLDD, and GDCLD—under a controlled from-scratch benchmark with dataset-specific preprocessing and official data splits. DCA-UNet achieves the best overall IoU/F1 ranking across the three datasets, reaching 61.92%/76.48% on Landslide4Sense, 59.24%/74.41% on HR-GLDD, and 58.40%/73.74% on GDCLD. The model contains 29.50 million parameters, which is close to vanilla U-Net and substantially fewer than several transformer-based baselines, although its training-side runtime and memory consumption are not the lowest. These results show that combining adaptive spatial sampling with local-global contextual aggregation is effective for landslide segmentation in both multispectral and RGB remote sensing imagery.

1. Introduction

Landslides are a major geohazard that threatens infrastructure, settlements, transportation corridors, and mountain communities worldwide [1]. Rapid and reliable delineation of landslide boundaries from remote sensing imagery is therefore essential for emergency reconnaissance, event inventorying, recovery planning, and subsequent susceptibility or risk analysis [2,3]. With the increasing availability of high-resolution optical satellites, Unmanned Aerial Vehicle (UAV) imagery, dense image archives, and cloud-based geospatial computing environments, landslide mapping has progressively shifted from expert-only interpretation toward scalable data-driven analysis [4,5,6,7]. Recent studies also show that time-series optical imagery and SAR observations can enrich the inventorying workflow beyond single-scene mapping, especially for large-area or temporally evolving landslide activity [8,9]. At the same time, broader earth-observation workflows such as deformation monitoring and national inventory updating continue to emphasize that landslide recognition is not merely a classification problem, but a spatiotemporal decision process in which boundary quality and false-alarm control directly affect downstream hazard management [3,10].
From the perspective of methodological evolution, the literature has followed a fairly clear trajectory similar to that seen in other remote-sensing tasks: manual interpretation and photogrammetric analysis were followed by rule-based or object-based approaches, then by feature-engineered machine learning, and finally by deep semantic segmentation [2,6,11]. Earlier approaches often relied on spectral tone, texture, morphology, shadow, and topographic context, and they remain valuable when expert explainability is critical. However, their transferability across regions, seasons, sensors, and event types is limited. Even later machine-learning systems that improved automation still often depended on handcrafted descriptors or carefully tuned local training data, making generalization difficult in geographically heterogeneous terrain [4,12,13,14,15,16]. Recent explainable or attribution-oriented models further confirm that predictive performance alone is insufficient unless the learned representations remain interpretable and geographically stable [17,18]. This gap between local success and stable regional deployment remains one of the main practical constraints in operational landslide mapping.
The rise of deep learning substantially improved the situation by enabling end-to-end feature learning for dense prediction. General semantic-segmentation architectures such as FCN, U-Net, and DeepLab established strong foundations for pixel-level remote-sensing interpretation [19,20,21]. Landslide-oriented studies subsequently adapted these ideas to post-earthquake mapping, multisource optical imagery, high-resolution segmentation, and lightweight deployment settings [1,22,23,24,25,26,27,28,29,30,31,32]. These studies demonstrate that encoder–decoder networks can capture landslide extent effectively when the training and test domains are closely aligned. Nonetheless, the reported gains are often accompanied by nontrivial trade-offs among accuracy, model size, robustness to background clutter, and boundary sharpness.
Recent work has therefore moved in two complementary directions. The first direction focuses on richer benchmark resources and broader evaluation conditions. Public datasets such as Landslide4Sense, HR-GLDD, GDCLD, and CASLandslideDataset have improved the reproducibility of landslide-segmentation research and enabled more systematic comparisons across multispectral and RGB imagery [33,34,35,36,37]. The second direction targets cross-scene and cross-domain robustness, for example through transfer learning, feature enhancement, or morphology-aware domain adaptation [38,39]. Although these advances are important, they also make the central modeling problem more visible: benchmark performance is no longer determined only by whether a network can recognize landslide texture, but by whether it can preserve irregular boundaries, suppress look-alike backgrounds, and remain stable when image characteristics vary across datasets and events.
From an architectural standpoint, this problem reflects a tension between geometric adaptability and contextual modeling. Conventional CNNs offer strong locality and efficiency, but their fixed kernels are not naturally matched to landslides’ irregular, elongated, and fragmented boundaries [12]. Transformer-style and hybrid models improve long-range context aggregation through self-attention and hierarchical token interaction, as shown by Swin Transformer, Swin-Unet, Swin-Transformer-based remote-sensing UNets, and recent landslide-specific transformer variants [40,41,42,43,44]. At the same time, modern visual backbones such as ConvNeXt and Mamba-style state-space models further widen the design space for dense prediction [45,46,47]. Yet heavier global models may incur higher memory or latency costs, and they do not by themselves solve the local geometric-mismatch issue. This is precisely why deformable operators remain attractive: they offer an explicit mechanism for adaptive sampling and have continued to evolve from the original DCN formulation to more efficient large-scale variants such as InternImage/DCNv3-style designs and DCNv4 [48,49,50]. For landslide segmentation, a practical architecture should ideally combine the boundary sensitivity of adaptive local operators with the discrimination benefits of multi-scale contextual aggregation, while avoiding an excessive computational burden.
To address these limitations, this study proposes DCA-UNet, a landslide segmentation framework that combines Deformable Convolution (DCN) and Aggregated Attention (AA) within a U-Net-style encoder–decoder design. The DCN module adapts spatial sampling locations to irregular landslide boundaries, whereas the AA module improves multi-scale contextual aggregation in complex backgrounds such as vegetation, bare soil, and post-failure debris textures. We evaluate the model on three public benchmarks: Landslide4Sense [33], HR-GLDD [35], and GDCLD [36]. Within a controlled from-scratch benchmark with dataset-specific preprocessing, DCA-UNet achieves the strongest overall IoU/F1 ranking while maintaining a parameter count well below that of several transformer-based baselines.
The main contributions of this study are summarized as follows:
  • We develop a U-Net-style landslide segmentation architecture that combines deformable convolution for geometric adaptability with aggregated attention for joint local-global contextual modeling.
  • We evaluate the proposed method on three public benchmarks covering both multispectral and RGB-only imagery, thereby assessing the model under heterogeneous remote-sensing conditions rather than on a single dataset alone.
  • We provide ablation and efficiency analyses showing that deformable convolution and aggregated attention contribute complementary gains, while interpreting the observed improvements conservatively in light of training cost and benchmark scope.
The remainder of this paper is organized as follows: Section 2 presents the DCA-UNet architecture, datasets, and experimental protocol. Section 3 reports the quantitative and qualitative results. Section 4 discusses the implications of the findings, focusing on mechanism, robustness, and limitations. Section 5 concludes the study and outlines future research directions.

2. Materials and Methods

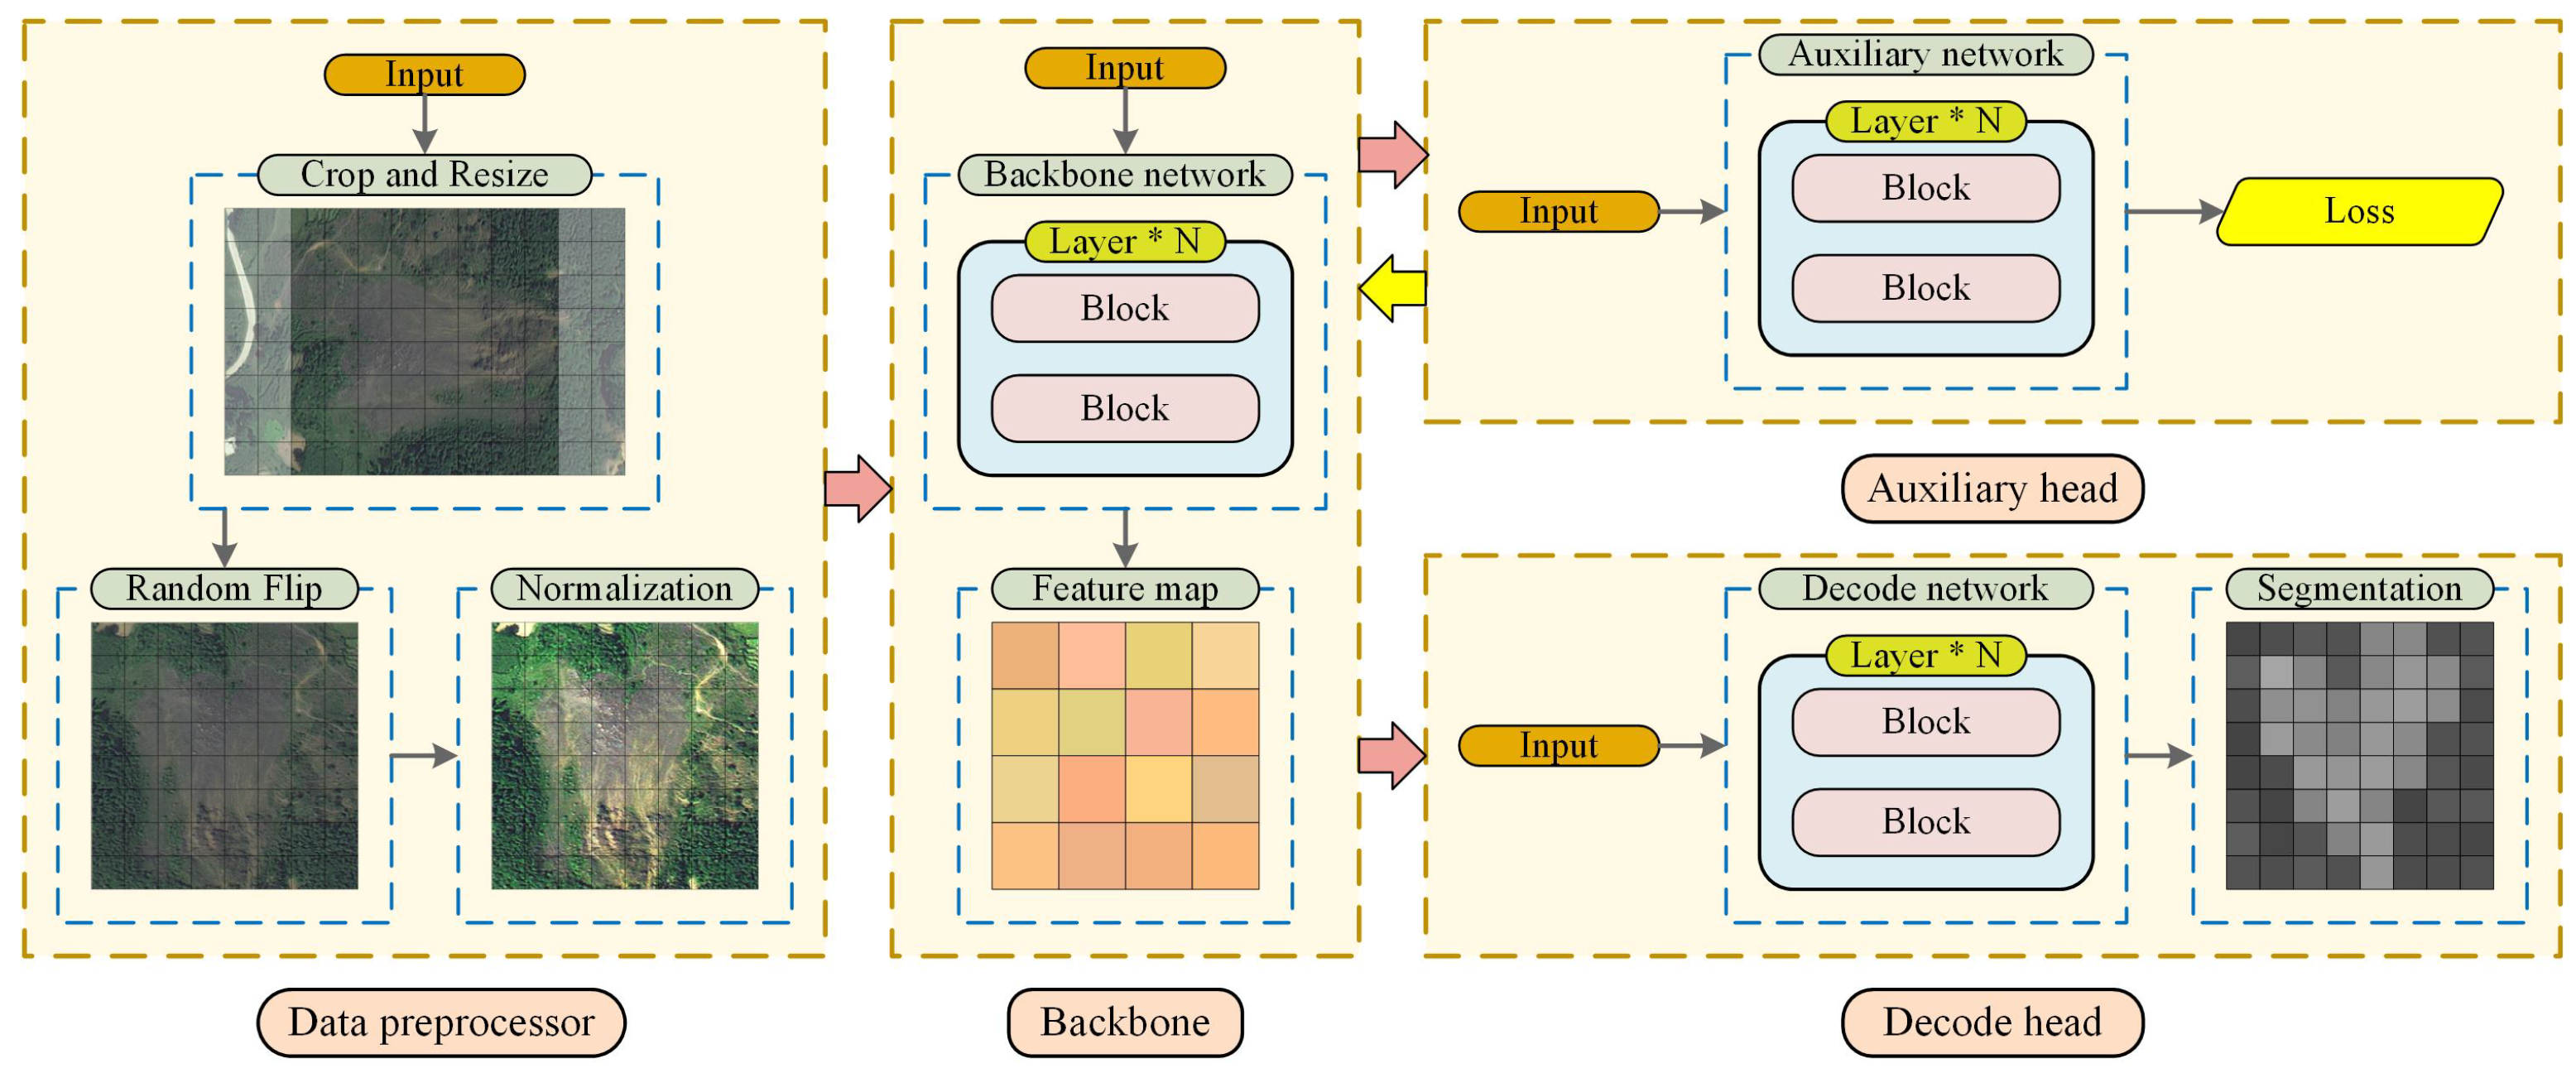
All semantic segmentation models in this study, including DCA-UNet and the compared baselines, are implemented within the same benchmark framework illustrated in Figure 1. At a high level, each method contains a data preprocessor, a feature extractor, a task head, and, when applicable, an auxiliary supervision branch. Conventional baselines such as DeepLabV3, UPerNet, and Mask2Former use standard decoder heads on top of their backbones, whereas DCA-UNet integrates dense prediction directly into a U-Net-style encoder–neck–decoder pathway and uses a lightweight terminal head only to interface with the training and evaluation framework.
Preprocessing is dataset-specific rather than globally fixed. For Landslide4Sense and HR-GLDD, the benchmark uses  128 × 128 patch inputs and dataset-specific channel-wise normalization. Landslide4Sense applies horizontal flipping with probability 0.5, whereas the HR-GLDD benchmark configuration uses no additional random flipping. For GDCLD, the benchmark follows a larger-scale pipeline: RGB images are randomly resized around a  1024 × 1024 reference scale with ratio range  [ 0.5 , 2.0 ] , randomly cropped to  512 × 512 , and horizontally flipped with probability 0.5 during training. At test time, GDCLD uses sliding-window inference with crop size  512 × 512 and stride  ( 256 , 256 ) . Unless otherwise noted, no manual relabeling or hand-crafted sample filtering is applied to the public datasets.
An auxiliary branch is used when the architecture supports it. In DCA-UNet, auxiliary supervision is applied to the penultimate decoder feature map through a one-layer FCN head, which improves optimization stability while leaving the final dense prediction path inside the backbone-decoder structure itself.

2.1. DCA-UNet Architecture

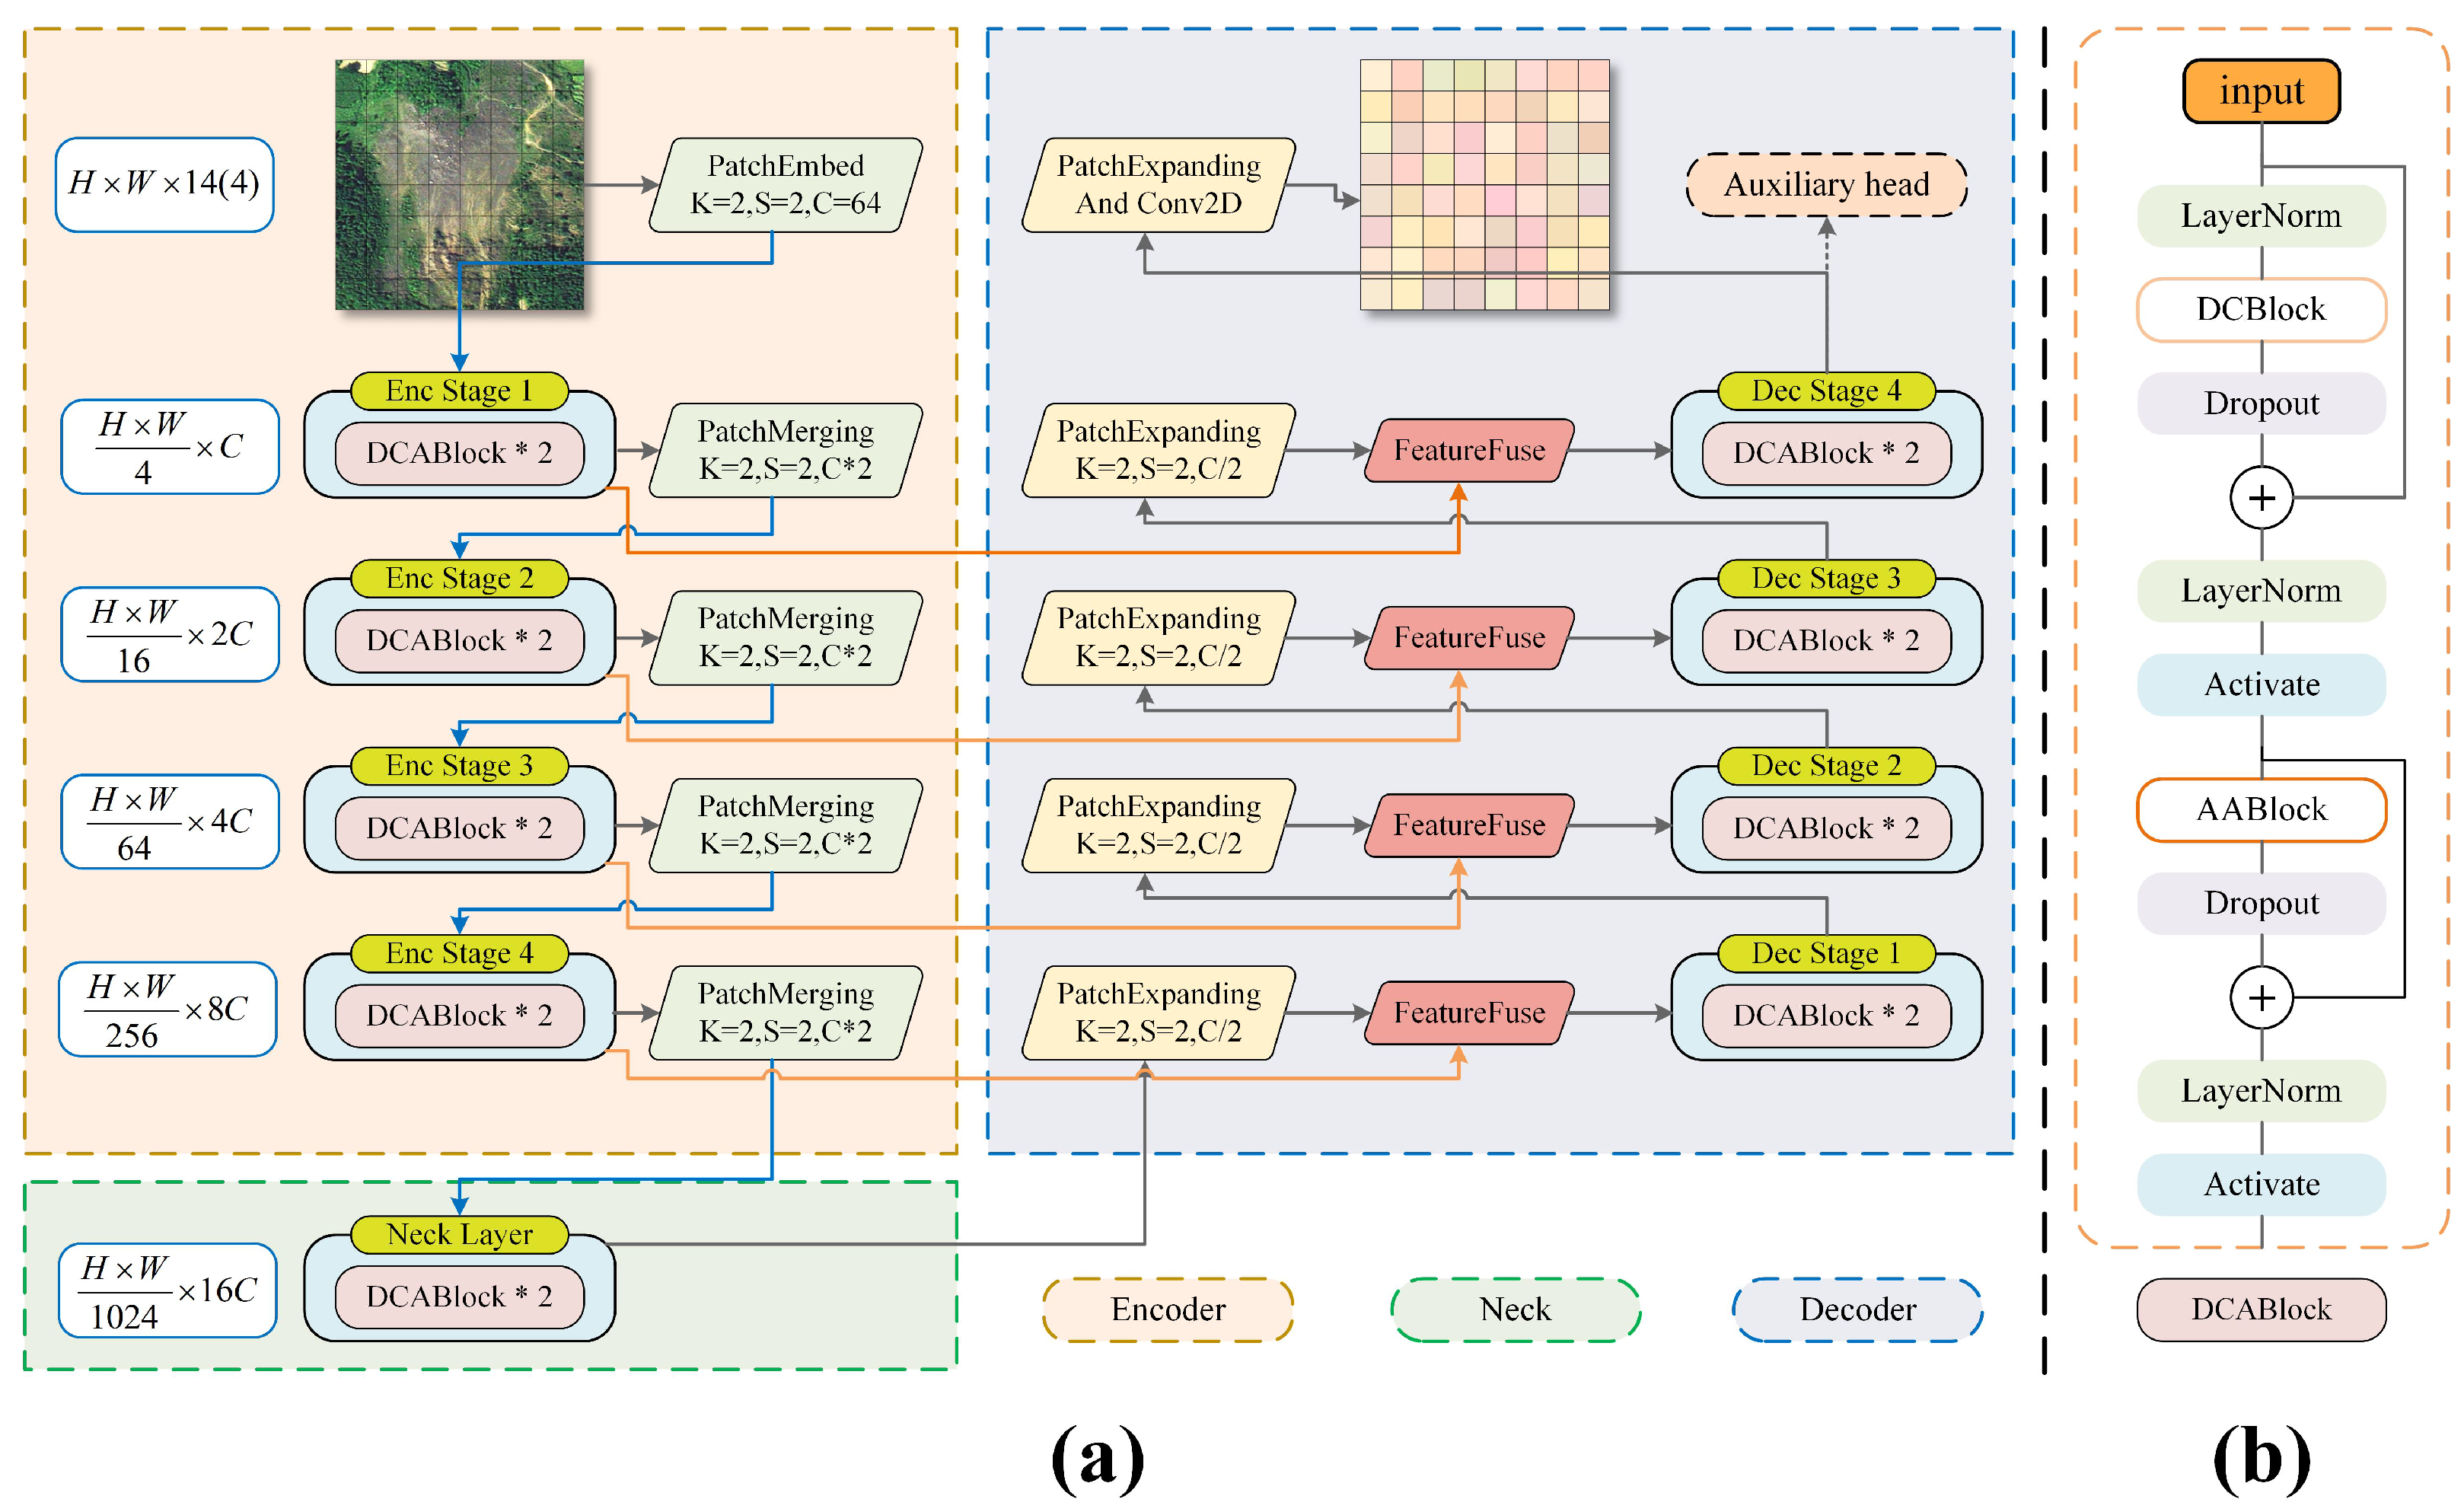
As illustrated in Figure 2a, DCA-UNet consists of a four-stage encoder, a bottleneck neck, and a mirrored four-stage decoder. The network accepts dataset-specific multisource inputs, namely 14-band Landslide4Sense imagery, 4-band HR-GLDD imagery, and 3-band GDCLD imagery. In the benchmark configurations used for this study, the backbone starts from an embedding width of 64 channels, uses encoder depths  ( 2 , 2 , 2 , 2 ) , a two-block neck, and symmetric decoder depths inherited from the encoder. Non-overlapping patch embedding first converts the input image into tokens, patch merging reduces spatial resolution between encoder stages, and patch expanding reconstructs spatial detail in the decoder. Skip connections fuse encoder features with decoder features at matched scales to preserve fine boundary information.
In the reported DCA-UNet configurations, deformable convolution and attention are both enabled in all encoder stages and in the neck. The final decoder output is passed through a  1 × 1 convolution to produce the binary landslide mask, while the auxiliary FCN head provides deep supervision from the penultimate decoder level during training. For DCA-UNet, the main prediction branch is optimized with Focal Loss, and the auxiliary branch uses the same loss form with weight 0.4.

2.2. DCA Block

The DCA block (Figure 2b) is the basic feature-transformation unit used throughout DCA-UNet. Given an input token sequence, the block first applies Layer Normalization and then performs deformable convolution. The resulting feature update is merged with the input through a residual connection and DropPath regularization. A second normalization and GELU activation prepare the features for the attention stage.
The attention stage is likewise residual. After normalization, the block applies either Aggregated Attention or full attention, depending on the stage resolution ratio used in the benchmark configuration. The attention output is added back to the running features, followed by a final normalization and activation. This DCN-then-attention ordering lets the block first adapt to irregular local geometry and then aggregate multi-scale contextual information, while the residual formulation stabilizes optimization across encoder, neck, and decoder stages.

2.2.1. Deformable Convolutional Networks

Deformable Convolutional Networks (DCN) were introduced in 2017 [48] to improve the ability of convolutional neural networks to model geometric transformations through deformable convolution and deformable RoI pooling. The version used in this work is DCNv4 [50], which extends DCNv3 [49] with a more efficient operator design and improved memory access behavior.
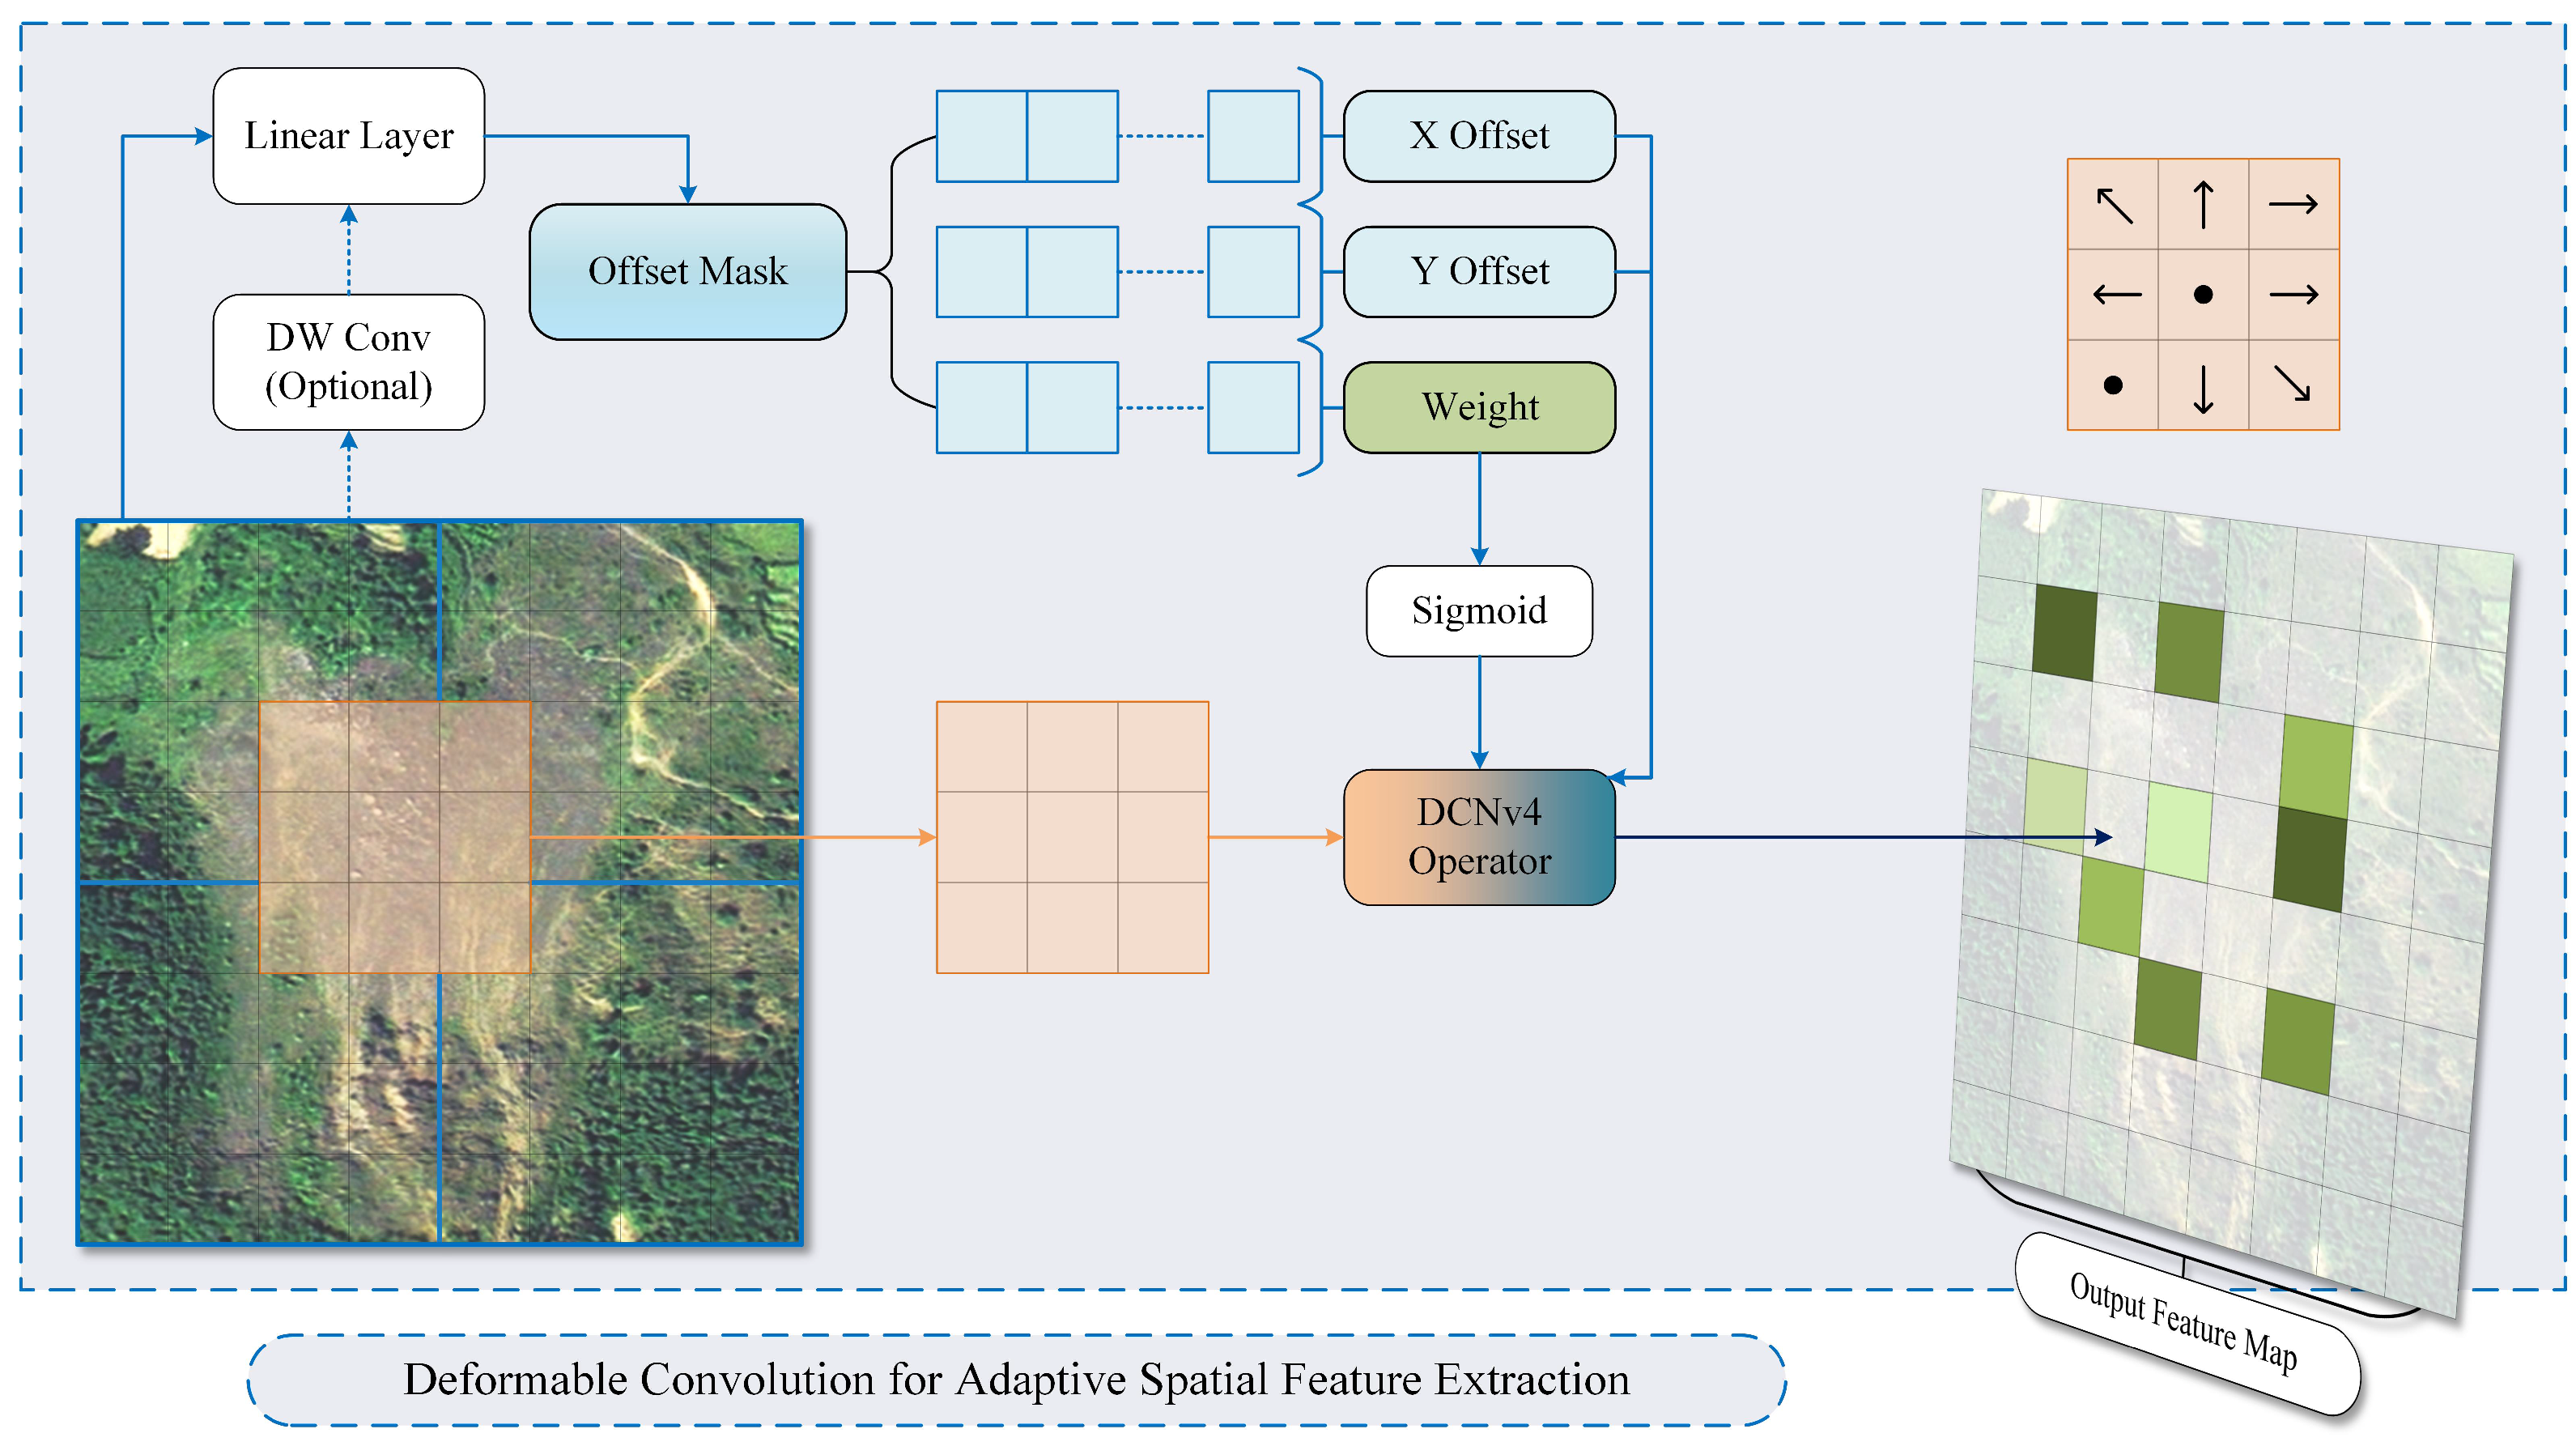
In DCNv4, the input features are divided into groups along the channel dimension, with each group containing a specified number of channels. For each group, as shown in Figure 3, a lightweight subnetwork (e.g., a linear layer) predicts dynamic offsets and aggregation weights from the input features. Depthwise convolution (DW Conv) can be inserted before offset and mask prediction to better capture local spatial variation.
For each output position, input features are sampled according to predefined sampling locations and the dynamic offsets. The sampled features are then weighted and summed using the dynamic aggregation weights to produce the output features. The output features from all groups are concatenated along the channel dimension to obtain the final output. This structure allows DCNv4 to significantly improve computational efficiency while maintaining the model’s expressive power. Additionally, the removal of softmax normalization enhances the convergence speed during training.

2.2.2. Aggregated Attention Block (AABLOCK)

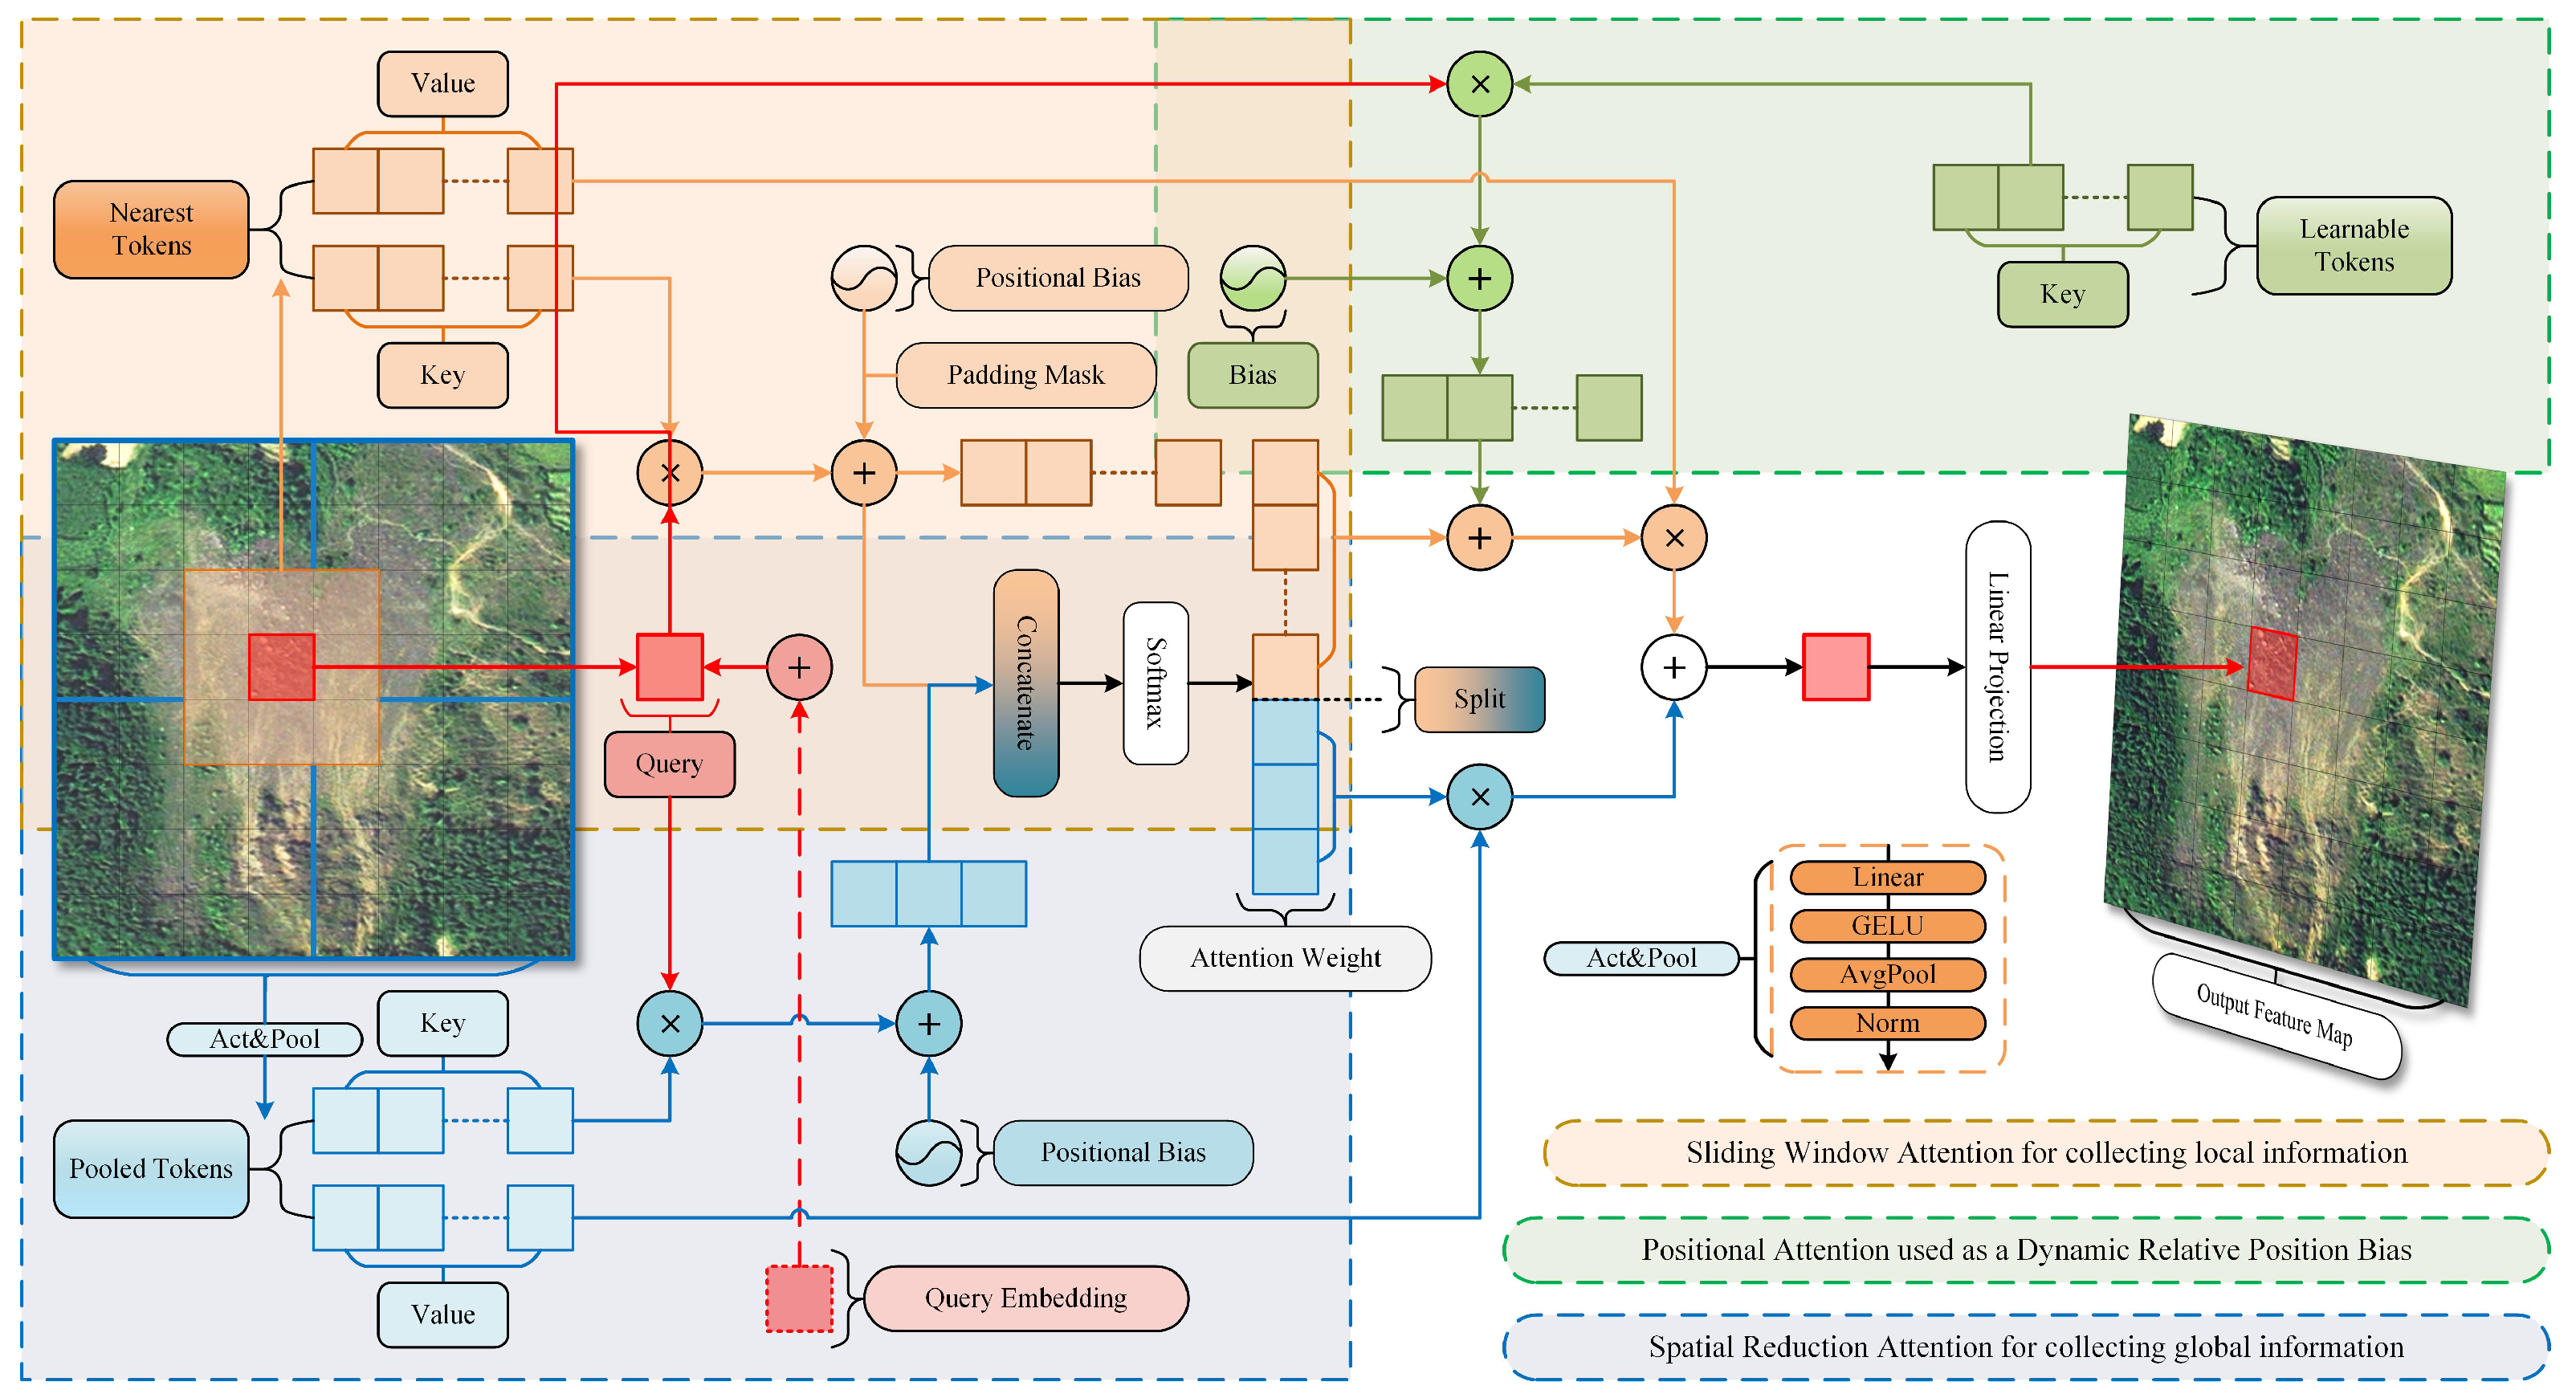
To address scale inconsistency and background ambiguity in landslide feature extraction, we incorporate Aggregated Attention (AA) as the attention component of the DCA block. AA follows a local–global design: a sliding-window path preserves fine local structure around each query, while a pooled path supplies broader contextual cues. It also uses query embeddings and positional bias terms to improve query-specific feature aggregation. This design is suitable for landslide segmentation because landslide objects can be small, elongated, fragmented, or embedded in visually similar bare-soil and vegetation backgrounds.
The Aggregated Attention module is adopted and adapted from TransNeXt-style local–global attention [51]. We do not claim AA itself as a newly invented attention operator; rather, the contribution here is to integrate this local–global attention mechanism with DCNv4 inside a compact U-Net-style landslide segmentation network and to evaluate its complementarity with deformable convolution under heterogeneous landslide benchmarks. In DCA-UNet, the attention switch is deterministic and depends only on the spatial-reduction ratio r in the benchmark configuration. When  r > 1 , the network uses Aggregated Attention as shown in Figure 4; when  r = 1 , it falls back to full attention without pooled reduction. In the reported configurations, encoder stages use  r = ( 8 , 4 , 2 , 1 ) and the neck uses  r = 1 . Thus, the first three encoder stages use pooled local–global attention, whereas the fourth encoder stage and neck use full attention. This rule is fixed before training and is not data-dependent.
The process begins by projecting the input feature map into query, key, and value tokens. In the implemented module, queries and keys are first L2-normalized. The query branch then adds a learnable query embedding and applies a positive temperature scaling term, while the value branch is split into a local sliding-window path and a pooled global path. Relative positional information is injected through a learned local bias and a continuous pooled bias generated from relative coordinates. The two similarity matrices are concatenated and normalized with a shared softmax, after which the local branch receives an additional learnable dynamic bias before value aggregation.
Let  X R C × H × W denote an input feature map, and let  ( i , j ) index a query location. For clarity, the following equations summarize the implemented computation up to branch-specific learnable bias terms. After projection and normalization, the scaled query is
q ˜ i j = Norm ( q i j ) + e τ s ,
where  Norm ( · ) denotes L2 normalization, e is the learnable query embedding,  τ = softplus ( t ) is the positive temperature term, and s is the sequence-length scale factor used by the implementation.
Given a local window  Ω i j of size  k × k , local keys  K i j loc and pooled keys  K pool are also L2-normalized. The local and pooled logits are written as
z i j loc = q ˜ i j Norm K i j loc T + b loc ,
z i j pool = q ˜ i j Norm K pool T + b i j pool ,
where  b loc is the learned local relative-position bias and  b i j pool is the pooled positional bias generated by an MLP from relative coordinates and interpolated when needed.
The two branches share one normalization:
α i j = softmax Concat z i j loc , z i j pool .
After splitting  α i j into local and pooled components, the implemented local branch further adds a query-dependent learnable bias term before aggregating local values. The output is therefore summarized as
y i j = α ^ i j loc V i j loc + α i j pool V pool ,
where  α ^ i j loc denotes the post-bias local weights used by the CUDA sliding-window aggregation. In this formulation, the local branch preserves boundary detail while the pooled branch supplies long-range context, allowing the encoder to model irregular landslide morphology across scales.

2.3. Evaluation Metrics

Let  T P F P , and  F N denote true-positive, false-positive, and false-negative pixels for the landslide class. We report five segmentation metrics: Intersection over Union (IoU), Precision, Recall, F1-score, and mean F1-score (mF1-score). Unless otherwise stated, IoU, Precision, Recall, and F1-score are reported for the landslide class, whereas mF1-score is the class-wise average over the background and landslide categories.
IoU = T P T P + F P + F N
Precision = T P T P + F P
Recall = T P T P + F N
F 1 - score = 2 · Precision · Recall Precision + Recall
mF 1 - score = 1 N i = 1 N F 1 i
Here, N is the number of classes. In this binary setting,  N = 2 and mF1-score summarizes how well each model balances foreground delineation against background consistency. These metrics are region-overlap and pixel-classification measures; they do not directly quantify boundary distance, contour continuity, or thin-channel preservation. We therefore treat visual boundary comparisons as complementary evidence rather than as a substitute for dedicated boundary metrics such as boundary F1 or Hausdorff-distance-style measures. In addition, we report the number of parameters (Params, M), training memory (GB), and per-iteration training time (min/iter) to characterize implementation-side computational cost under the same software and hardware environment.

2.4. Datasets and Experimental Protocol

We evaluate DCA-UNet on three public datasets: Landslide4Sense, HR-GLDD, and GDCLD. Landslide4Sense and HR-GLDD provide multispectral imagery, whereas GDCLD is RGB-only. These benchmarks complement recent public dataset construction efforts in landslide remote sensing, including the CAS Landslide Dataset [37], and together reflect the field’s shift toward larger and more diverse evaluation resources.

2.4.1. Landslide4Sense

Landslide4Sense is a multi-source benchmark comprising annotated landslide scenes from four geographically diverse regions [33,34]. It integrates Sentinel-2 and ALOS PALSAR imagery with expert-labeled masks, enabling robust training under varied terrain and triggering conditions.

2.4.2. HR-GLDD

HR-GLDD is a high-resolution (3 m) satellite dataset from PlanetScope, covering ten global landslide events caused by rainfall and earthquakes across diverse terrains [35]. It includes 1758 image tiles ( 128 × 128 pixels) split into training, validation, and test sets (6.4:1.6:2 ratio), with associated binary landslide masks.

2.4.3. GDCLD

The Globally Distributed Coseismic Landslide Dataset (GDCLD) comprises 16,712 high-resolution image tiles ( 1024 × 1024 RGB) annotated with  1.39 × 10 9 labeled pixels from nine major earthquake-triggered landslide events [36]. It integrates UAV, Map World, Gaofen-6, and PlanetScope imagery, with expert-verified masks across varied geological settings.
All reported experiments are implemented in PyTorch (PyTorch Foundation, San Francisco, CA, USA; https://pytorch.org, accessed on 10 June 2026), MMEngine (OpenMMLab; https://github.com/open-mmlab/mmengine, accessed on 10 June 2026), and MMSegmentation (OpenMMLab; https://github.com/open-mmlab/mmsegmentation, accessed on 10 June 2026). The runs were executed on a server with an Intel Xeon(R) Platinum 8481C CPU (Intel Corporation, Santa Clara, CA, USA) and an NVIDIA GeForce RTX 4090D GPU with 24 GB memory (NVIDIA Corporation, Santa Clara, CA, USA). The benchmark uses the official dataset partitions provided by each processed dataset configuration and trains all compared models from scratch through configurations in which pretrained initialization is disabled. This choice was made to avoid architecture-dependent initialization advantages and to keep the multispectral settings comparable, because pretrained weights are not consistently available for 14-band Landslide4Sense, 4-band HR-GLDD, and 3-band GDCLD inputs. The benchmark is controlled at the dataset level: within each dataset, all models share the same train/validation/test partition, input modality, and evaluation metrics, while preprocessing follows the dataset-specific protocol described above. However, disabling pretraining may underestimate backbones that are normally deployed with large-scale pretrained initialization; therefore, the reported results should be interpreted as from-scratch benchmark results rather than as a complete ranking of all possible pretrained variants.
For DCA-UNet, Landslide4Sense, and HR-GLDD, the backbone uses patch size 2 and image size 128; for GDCLD it uses patch size 4 and image size 512 to match the larger crop setting. DCA-UNet is optimized with AdamW using learning rate  6 × 10 5 , betas  ( 0.9 , 0.999 ) , and weight decay 0.01. Training runs for 40,000 iterations, uses batch size 4 for training and 1 for validation/testing, and adopts a linear warmup of 1500 iterations followed by polynomial decay. The main and auxiliary branches use Focal Loss with class weights  [ 0.1 , 1 ] , and the auxiliary loss weight is 0.4. Most compared baselines in the released benchmark also follow the same dataset split, iteration budget, and batch-size regime, while model-family-specific heads, loss settings, and optimizer details remain those defined by their corresponding benchmark configuration files (e.g., Mask2Former- and ConvNeXt-based recipes). Accordingly, the reported comparison should be understood as a controlled codebase benchmark with harmonized data protocol and training horizon, rather than as a claim that every baseline was re-tuned under an identical hyperparameter template. This protocol may favor some architectures over others because optimizer and loss recipes are not fully unified; we therefore emphasize cross-dataset consistency, ablation trends, and conservative effect sizes rather than presenting the comparison as an exhaustive hyperparameter search.

3. Results

3.1. Quantitative Comparison Across Benchmarks

We compared DCA-UNet with standard U-Net, UNet-DeepLabV3, ResNet50-DeepLabV3, ResNet50-DeepLabV3+, Swin-Tiny (with UPerNet or Mask2Former), SwinUNet-Tiny, ConvNeXt-Tiny, and MambaUNet. Table 1 and Table 2 show that, within the controlled from-scratch benchmark described in Section 2, DCA-UNet attains the highest overall IoU/F1 performance on both HR-GLDD and Landslide4Sense. Specifically, DCA-UNet reaches 59.24% IoU and 74.41% F1-score on HR-GLDD, and 61.92% IoU and 76.48% F1-score on Landslide4Sense. Relative to the strongest competing baselines, the IoU improvements are 2.43 percentage points on HR-GLDD and 0.55 percentage points on Landslide4Sense. The gains are therefore moderate rather than overwhelming, but they are consistent with the qualitative comparison in Figure 5.
In landslide detection, the ability to recover landslide pixels is especially important because missed detections can directly reduce the utility of a method for hazard assessment [14]. From this perspective, the combination of competitive IoU and strong recall is practically relevant. At the same time, the best overall IoU/F1 ranking does not coincide with the highest precision on every dataset. We therefore avoid over-interpreting isolated pairwise gaps against any single baseline and instead emphasize the combined evidence from cross-benchmark ranking, ablation results, and qualitative boundary behavior.
Table 3 shows that DCA-UNet also achieves the strongest overall IoU/F1 ranking on GDCLD, with the highest IoU, Recall, F1-score, and mF1-score among the compared models. Relative to the strongest competing baseline, the IoU gain is 0.56 percentage points. The highest precision on this benchmark is obtained by Swin-Tiny (Mask2Former), again indicating that the advantage of DCA-UNet comes from balanced segmentation performance rather than from a single metric alone. Because GDCLD is an RGB-only benchmark, these results suggest that the proposed architecture remains effective even when multispectral information is unavailable.
Table 4 presents the results of the ablation study conducted to evaluate the impact of each component on landslide extraction performance. Four model variants are compared: the baseline UNet, UNet-DC (with deformable convolution), UNet-AA (with aggregated attention), and the proposed DCA-UNet (combining both DCN and AA). For each model, we report the IoU, Precision, Recall, and F1-score for both background and landslide classes, as well as the mean F1-score (mF1-score).
Taken together, Table 1, Table 2 and Table 3 show a consistent pattern: while the identity of the strongest competing baseline changes from one benchmark to another, DCA-UNet remains the best-ranked model in overall IoU/F1 terms across all three datasets within this benchmark. This cross-benchmark stability strengthens the interpretation that the observed gains are not tied to a single dataset configuration or sensing modality, although the margins should still be read in light of the single-benchmark training protocol discussed in Section 4.
The ablation results show that both deformable convolution and aggregated attention independently improve landslide segmentation relative to the baseline UNet. The trend is monotonic: adding DCN or AA separately improves over UNet, and combining both modules yields the highest landslide-class IoU, Recall, and F1-score. This pattern suggests that the full model does not rely on a single opportunistic gain from one component alone; instead, the two modules provide complementary benefits. The mean F1-score (mF1-score) of DCA-UNet is also the highest among all variants, indicating improved class-balanced segmentation quality.
Bold values in the tables indicate the best performance for each metric.

3.2. Efficiency Comparison

Table 5 compares the parameter count, memory consumption, and per-iteration time of the evaluated models on Landslide4Sense. We report these values as local implementation-side profiling observations collected under one training environment, not as standardized cross-platform efficiency benchmarks. The measurements were obtained on the hardware described in Section 2.4, using the same software stack and dataset configuration for the compared models. They are intended to position DCA-UNet in terms of relative resource demand within one unified software and hardware stack.
IoU is emphasized here as the primary overlap-based metric. DCA-UNet achieves the highest IoU on both Landslide4Sense (61.92%) and HR-GLDD (59.24%), indicating that the proposed architecture provides the strongest overall delineation accuracy among the compared models in this controlled setting.
From the resource perspective, DCA-UNet uses 29.50 million parameters, which is close to the vanilla U-Net baseline and substantially smaller than transformer-style models such as SwinUNet-Tiny (117.06 M). This supports the claim that the method is parameter-efficient relative to heavier baselines. At the same time, Table 5 shows that deformable operators and attention introduce nontrivial training cost: DCA-UNet is neither the fastest model in per-iteration time nor the most memory-efficient one under our implementation. Accordingly, we interpret its advantage cautiously: the model achieves the best benchmark accuracy while maintaining a moderate parameter budget, rather than uniformly dominating every efficiency metric.
Overall, the results indicate that DCA-UNet offers a favorable accuracy–parameter trade-off within this benchmark. In particular, it improves benchmark performance without incurring the very large parameter budgets required by several transformer-based alternatives. Future work should further report dedicated inference latency, throughput, and FLOPs to support a more complete deployment-oriented efficiency analysis.

3.3. Qualitative Comparison

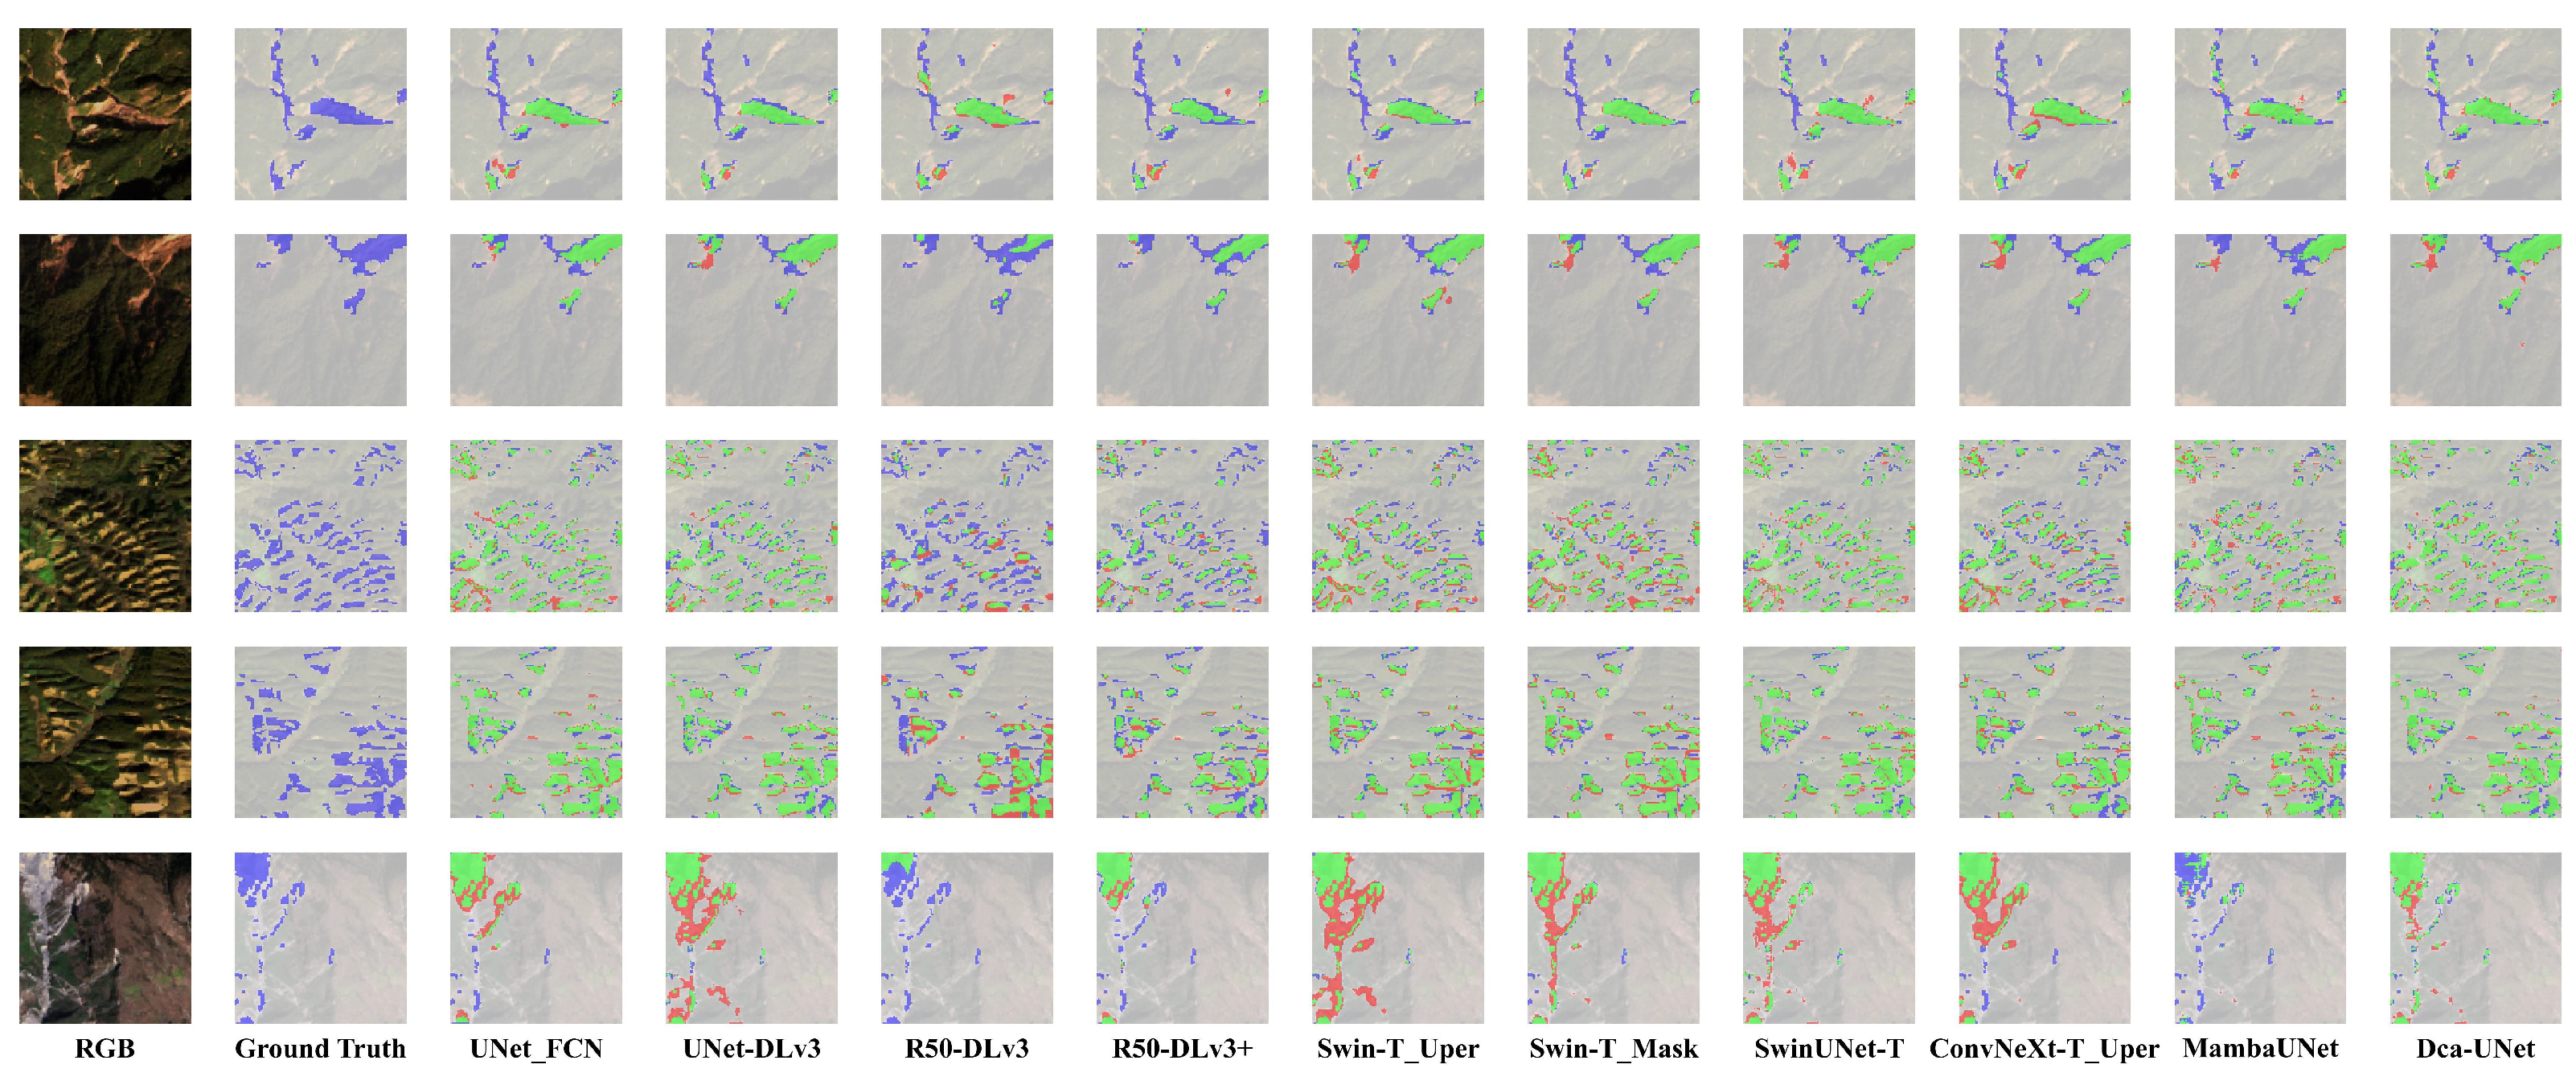
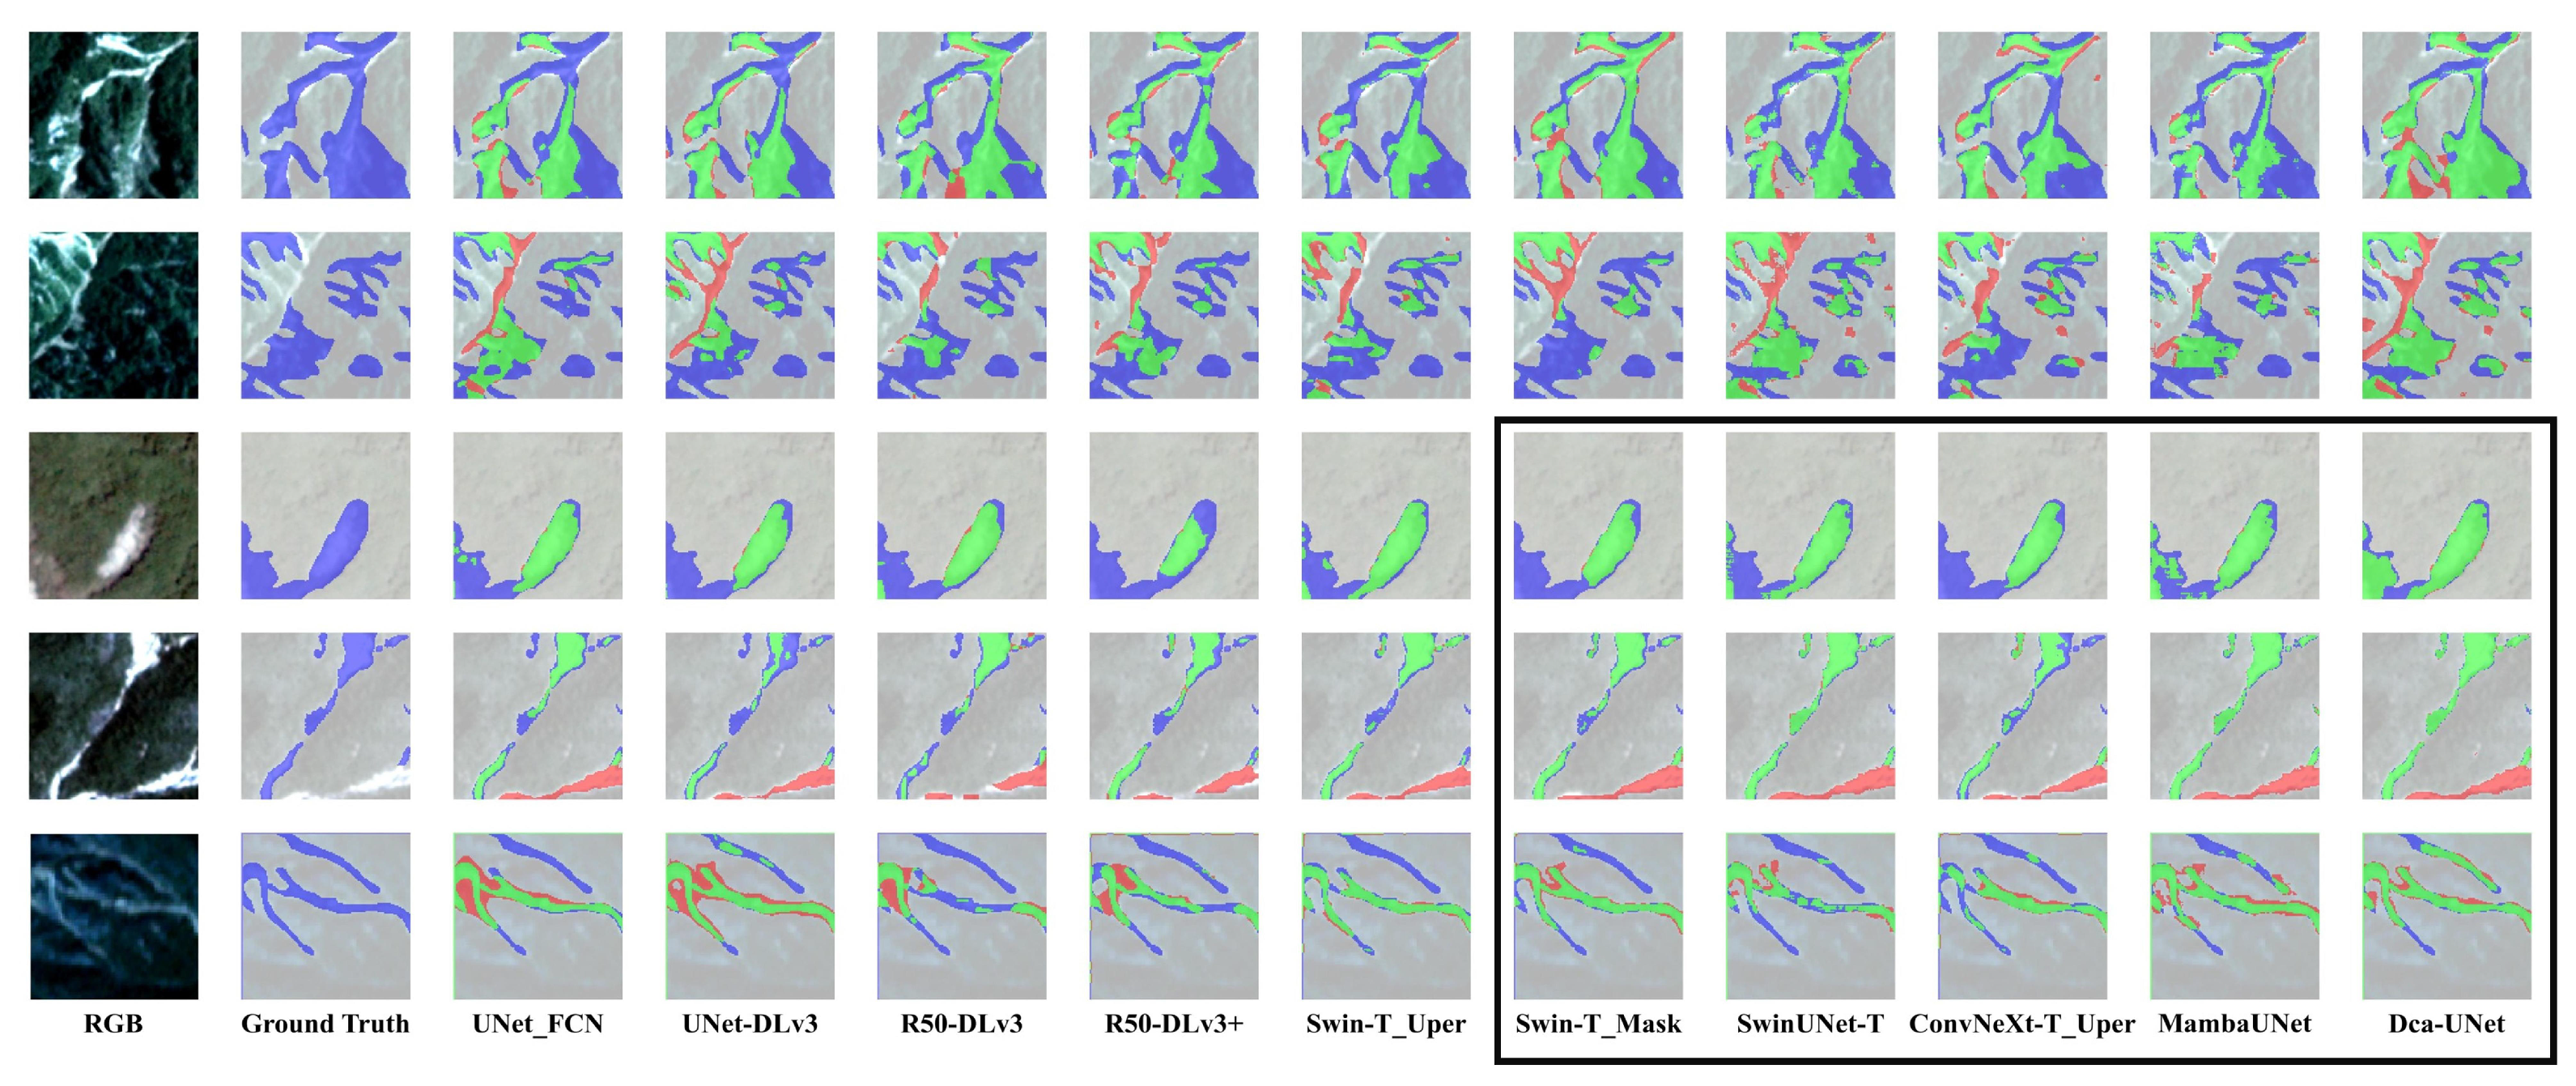
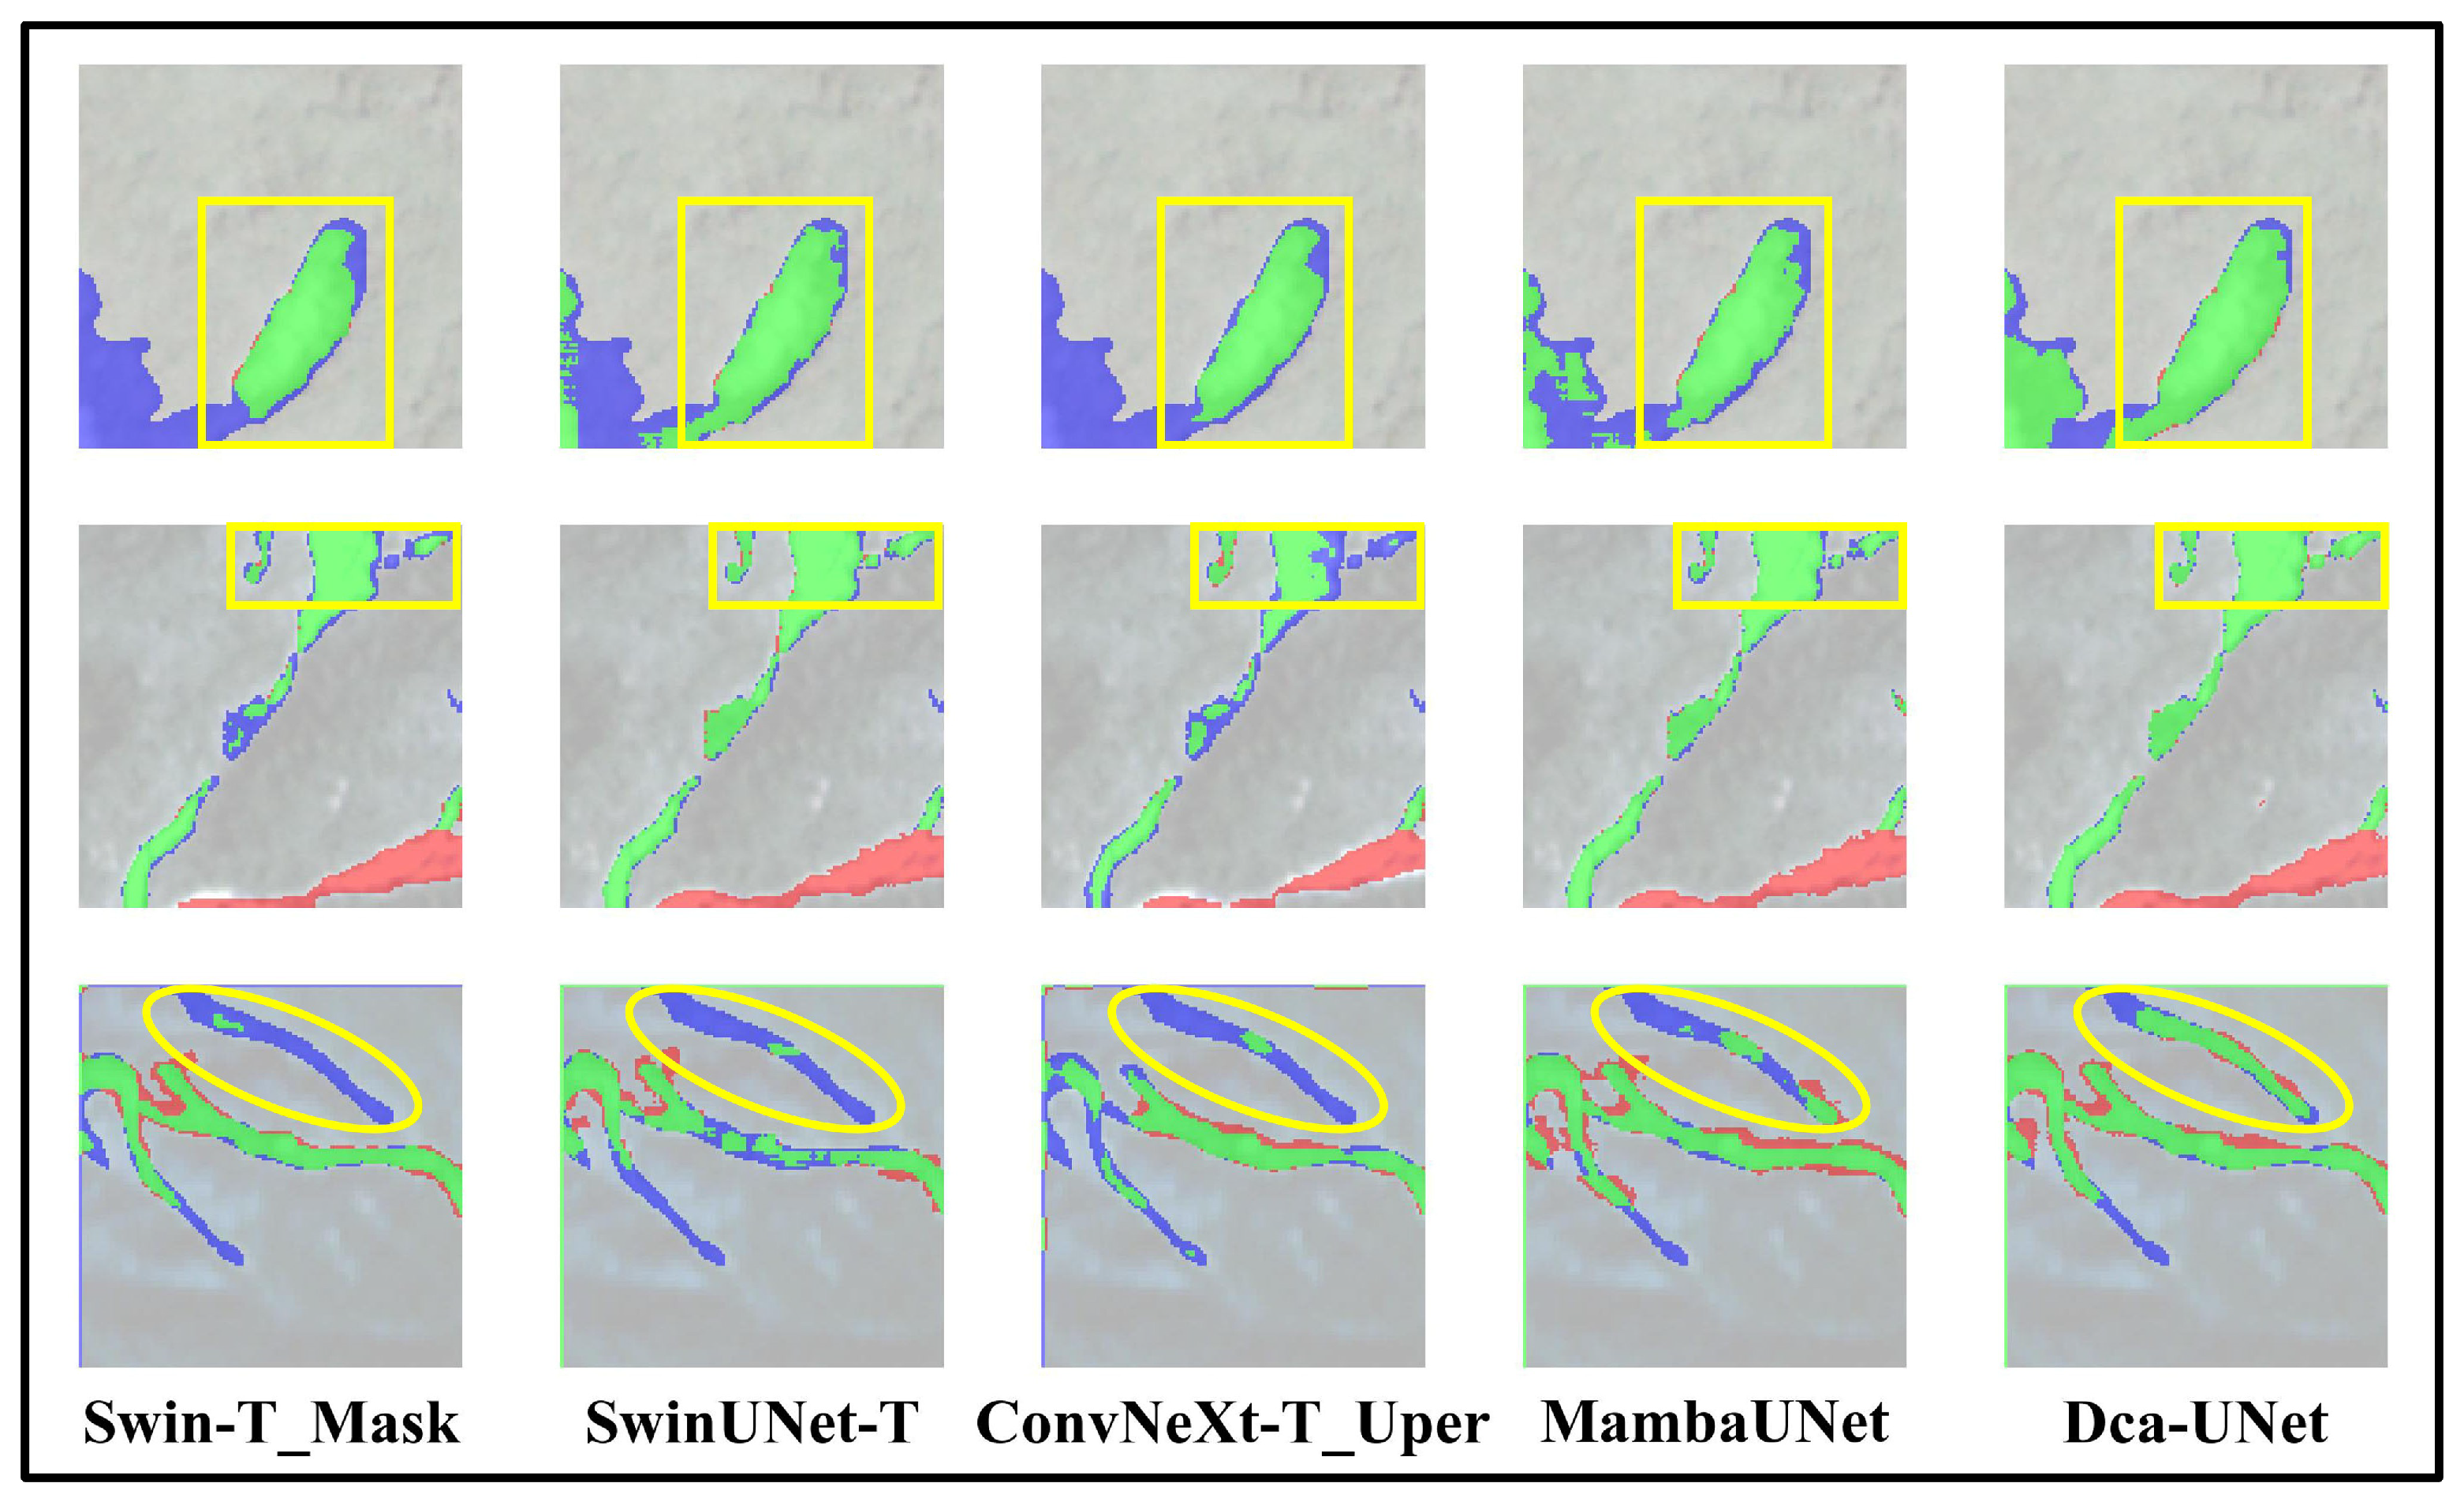
To provide a qualitative comparison with existing approaches, Figure 5, Figure 6 and Figure 7 show representative landslide detection results, including full-scene prediction maps and zoomed-in regions. These examples were selected from the test predictions to illustrate common visual error patterns, including missed landslide regions, isolated false detections, and boundary misalignment. They were not used to determine the quantitative ranking in Table 1, Table 2 and Table 3. In the prediction maps, red, blue, and green denote false positives (FP), false negatives (FN), and true positives (TP), respectively.
UNet_FCN denotes U-Net with an FCN decoder; UNet-DLv3 denotes U-Net with a DeepLabV3 decoder; R50-DLv3 and R50-DLv3+ denote ResNet50-based DeepLabV3 and DeepLabV3+; Swin-T_UPer and Swin-T_Mask denote Swin-Tiny paired with UPerNet and Mask2Former; and ConvNeXt-T_UPer denotes ConvNeXt-Tiny paired with UPerNet. SwinUNet-T, MambaUNet, and DCA-UNet are encoder–decoder models without a separate decoding head.
Figure 6. Qualitative comparison on HR-GLDD. Columns show the RGB image, the ground-truth mask, and the predictions of the compared models; green, red, and blue denote true positives (TP), false positives (FP), and false negatives (FN), respectively. The black box marks the region enlarged in Figure 7.
Remotesensing 18 02000 g006
Figure 7. Zoomed-in views of the boxed region in Figure 6 for Swin-T_Mask, SwinUNet-T, ConvNeXt-T_UPer, MambaUNet, and DCA-UNet. Green, red, and blue denote true positives (TP), false positives (FP), and false negatives (FN), respectively; yellow rectangles and ellipses highlight representative differences in boundary alignment, preservation of small structures, and missed detections.
Remotesensing 18 02000 g007
Visual comparisons further support the quantitative findings. Relative to the baseline models, DCA-UNet produces predictions with better boundary adherence and fewer missed landslide regions in several complex scenes. The most visible improvements appear in areas with fragmented topography and ambiguous background texture, where the proposed model yields more spatially coherent masks and fewer isolated false detections.
These qualitative gains are consistent with the intended roles of deformable convolution and multi-scale attention. The former is designed to adapt local sampling to irregular landslide geometry, while the latter improves contextual aggregation across scales. Because the present evaluation does not include dedicated boundary-distance metrics, we interpret the visual improvements cautiously: they support the quantitative trends and ablation results, but they do not by themselves prove a universal boundary-improvement mechanism.

4. Discussion

4.1. Why DCA-UNet Improves Landslide Segmentation

The core challenge in landslide detection lies in the geometric mismatch between the rigid, square receptive fields of traditional CNNs and the amorphous, highly irregular shapes of landslides. Our quantitative results (Table 1 and Table 2) show that DCA-UNet improves upon fixed-kernel architectures such as ResNet-50 and standard U-Net on the evaluated benchmarks. The ablation results and selected qualitative examples together support the interpretation that the Deformable Convolution (DCN) module helps the network better align its effective receptive field with irregular landslide margins. As visualized in the zoomed-in predictions (Figure 7), several compared models produce more blocky or fragmented predictions along landslide boundaries in the selected cases, whereas DCA-UNet more often preserves continuous outlines. This statement is based on our benchmark observations and should be read together with the quantitative tables, rather than as a claim that all conventional models universally fail at landslide boundaries.
Furthermore, the Aggregated Attention (AA) mechanism addresses scale variation by combining local-window information with pooled global context. Landslides in our datasets range from small, localized failures to large slope collapses, so a single receptive-field scale is unlikely to be sufficient. The qualitative results suggest that AA helps suppress background clutter and recover some missed landslide regions in complex scenes, which is consistent with the monotonic gains observed in the ablation study.

4.2. Robustness Across Modalities and Efficiency Considerations

One notable finding of this study is DCA-UNet’s strong performance on the GDCLD dataset (Table 3). Unlike Landslide4Sense (14 bands) and HR-GLDD (4 bands), GDCLD consists solely of RGB images. Deep learning models often benefit from multispectral signatures (e.g., near-infrared information) to distinguish landslides from bare soil, so the competitive performance of DCA-UNet on GDCLD suggests that the model can also exploit robust textural and geometric cues. At the same time, Landslide4Sense and HR-GLDD use  128 × 128 inputs, whereas GDCLD uses  512 × 512 crops and sliding-window inference. The resulting rankings therefore may reflect both architecture behavior and dataset-specific resolution/crop settings. Because all models within a given dataset use the same input protocol, the within-dataset comparisons remain controlled, but rankings should not be interpreted as a pure architecture-only effect across different resolutions. Moreover, because each benchmark is trained and evaluated within its own split, these results should be interpreted as evidence of robustness across benchmark settings rather than as a formal cross-domain generalization test. This distinction is important because recent studies have started to investigate cross-scene transfer and cross-domain adaptation more explicitly [38,39].
In terms of operational viability, DCA-UNet offers a competitive accuracy–parameter trade-off. Compared with transformer-based models such as SwinUNet-Tiny, it requires far fewer parameters (29.50 M vs. 117.06 M). Nevertheless, Table 5 indicates that additional deployment-oriented measurements, such as single-image latency, throughput, and FLOPs, are still needed before making stronger claims about real-time or edge-device suitability.

4.3. Limitations and Failure Cases

Despite these successes, DCA-UNet is not without limitations. A visual inspection of error cases reveals two primary challenges:
  • Spectral Confusion with Man-made Features: In some visually inspected error cases, the model misclassifies new road constructions, quarries, or barren agricultural land as landslides. This is likely due to the high spectral and textural similarity between fresh soil exposure and landslide debris, a common challenge in optical remote sensing. A stronger future analysis should report false-positive rates by land-cover or object type where such annotations are available.
  • Boundary Smoothing in Narrow Channels: While DCN improves overall region-overlap metrics and visual boundary adherence in the selected examples, the current benchmark does not report dedicated contour metrics. In extremely narrow debris flow channels (width < 5 pixels), the model can still over-smooth the edges, potentially underestimating the total affected area. Future work should add boundary F1, contour distance, or Hausdorff-distance-style measures to quantify this issue more directly.
  • Statistical and Training-Protocol Scope: The current manuscript reports a controlled from-scratch benchmark with dataset-specific preprocessing configurations. Although the consistency across three datasets and the ablation results are encouraging, repeated-seed statistics, confidence intervals, and pretrained variants of strong backbones would further strengthen the quantitative evidence base.
Future iterations could mitigate these issues by incorporating auxiliary boundary-aware loss functions or integrating topological constraints to better preserve thin structures.

4.4. Future Work

Looking ahead, three directions appear especially promising: (1) Temporal integration, for example by extending DCA-UNet to spatiotemporal networks that exploit pre- and post-event imagery and focus more directly on change information; (2) weakly supervised learning, such as point-based or scribble-based supervision to reduce the burden of dense pixel annotation; and (3) deployment-oriented optimization, including latency-aware redesign and large-scale cloud implementation for wide-area landslide monitoring.

5. Conclusions

This study presented DCA-UNet, a U-Net-style landslide segmentation framework that combines deformable convolution and resolution-aware local-global attention to better model irregular target geometry and multi-scale context. Within a controlled from-scratch benchmark on three public datasets, DCA-UNet achieved the best overall IoU/F1 ranking among the compared methods, reaching 61.92%/76.48% on Landslide4Sense, 59.24%/74.41% on HR-GLDD, and 58.40%/73.74% on GDCLD. The model also maintained a moderate parameter budget (29.50 M) relative to several heavier transformer-based baselines.
The evidence supports a clear but bounded conclusion: combining adaptive spatial sampling with local-global contextual aggregation improves landslide delineation across both multispectral and RGB benchmark settings. At the same time, parameter efficiency is not equivalent to deployment efficiency, and benchmark consistency is not equivalent to formal cross-domain generalization. Future work should therefore strengthen the evidence base through repeated-seed statistics, inference-side latency and FLOPs analysis, pretrained baseline comparisons, cross-domain validation, temporal modeling with pre- and post-event imagery, and weaker-supervision strategies for large-area landslide mapping.

Author Contributions

Conceptualization, Q.L., H.C., Y.S. and J.L.; methodology, J.L. and Y.Z.; software, J.L. and Y.Z.; validation, Y.S., J.L., Y.L., Q.L. and H.C.; formal analysis, Y.S.; investigation, C.W.; resources, S.L., S.X. and Q.L.; data curation, R.W.; writing—original draft preparation, Y.S.; writing—review and editing, Y.Z., W.W., Y.H., S.X., Q.L. and H.C.; visualization, Z.T.; supervision, Q.L. and H.C.; project administration, Y.S.; funding acquisition, X.K., S.L., Q.L. and H.C. All authors have read and agreed to the published version of the manuscript.

Funding

This research was funded by the Deep Earth Probe and Mineral Resources Exploration-National Science and Technology Major Project (No. 2024ZD1002207), Research grants from National Institute of Natural Hazards, Ministry of Emergency Management of China (No. ZDJ2025-55), Civil Aerospace Technology Advance Research Project of China (No. D040306), Jiangxi Provincial Natural Science Foundation (No. 20252BAC240275), Hubei Provincial Natural Science Foundation of China (No. 2025AFB447), Research Fund Program of Hubei Key Laboratory of Resources and Eco-Environment Geology (No. HBREGKFJJ-202412), and Geological Survey Projects of the China Geological Survey (No. DD20211391 and No. DD20230104).

Institutional Review Board Statement

Not applicable.

Informed Consent Statement

Not applicable.

Data Availability Statement

Publicly available datasets were analyzed in this study. Landslide4Sense, HR-GLDD, and GDCLD are cited in the reference list. The implementation used in this study is available at https://github.com/soeaxy/DCA-UNet (accessed on 10 June 2026).

Conflicts of Interest

The authors declare no conflict of interest.

References

  1. Li, P.; Wang, Y.; Xu, G.; Wang, L. LandslideCL: Towards Robust Landslide Analysis Guided by Contrastive Learning. Landslides 2022, 20, 461–474. [Google Scholar] [CrossRef]
  2. Walstra, J.; Chandler, J.H.; Dixon, N.; Dijkstra, T.A. Aerial Photography and Digital Photogrammetry for Landslide Monitoring. Geol. Soc. Lond. Spec. Publ. 2007, 283, 53–63. [Google Scholar] [CrossRef]
  3. Confuorto, P.; Casagli, N.; Casu, F.; De Luca, C.; Del Soldato, M.; Festa, D.; Lanari, R.; Manzo, M.; Onorato, G.; Raspini, F. Sentinel-1 P-SBAS Data for the Update of the State of Activity of National Landslide Inventory Maps. Landslides 2023. [Google Scholar] [CrossRef]
  4. Huang, F.; Cao, Z.; Guo, J.; Jiang, S.H.; Li, S.; Guo, Z. Comparisons of Heuristic, General Statistical and Machine Learning Models for Landslide Susceptibility Prediction and Mapping. CATENA 2020, 191, 104580. [Google Scholar] [CrossRef]
  5. Wu, W.; Zhang, Q.; Singh, V.P.; Wang, G.; Zhao, J.; Shen, Z.; Sun, S. A Data-Driven Model on Google Earth Engine for Landslide Susceptibility Assessment in the Hengduan Mountains, the Qinghai–Tibetan Plateau. Remote Sens. 2022, 14, 4662. [Google Scholar] [CrossRef]
  6. Tehrani, F.S.; Calvello, M.; Liu, Z.; Zhang, L.; Lacasse, S. Machine Learning and Landslide Studies: Recent Advances and Applications. Nat. Hazards 2022, 114, 1197–1245. [Google Scholar] [CrossRef]
  7. Cheng, G.; Wang, Z.; Huang, C.; Yang, Y.; Hu, J.; Yan, X.; Tan, Y.; Liao, L.; Zhou, X.; Li, Y.; et al. Advances in Deep Learning Recognition of Landslides Based on Remote Sensing Images. Remote Sens. 2024, 16, 1787. [Google Scholar] [CrossRef]
  8. Fu, S.; de Jong, S.M.; Deijns, A.; Geertsema, M.; de Haas, T. The SWADE Model for Landslide Dating in Time Series of Optical Satellite Imagery. Landslides 2023, 20, 913–932. [Google Scholar] [CrossRef]
  9. Shi, X.; Wu, Y.; Guo, Q.; Li, N.; Lin, Z.; Qiu, H.; Pan, B. Fast Mapping of Large-Scale Landslides in Sentinel-1 SAR Images Using SPAUNet. IEEE J. Sel. Top. Appl. Earth Obs. Remote Sens. 2023, 16, 7992–8006. [Google Scholar] [CrossRef]
  10. Anantrasirichai, N.; Biggs, J.; Kelevitz, K.; Sadeghi, Z.; Wright, T.; Thompson, J.; Achim, A.M.; Bull, D. Detecting Ground Deformation in the Built Environment Using Sparse Satellite InSAR Data with a Convolutional Neural Network. IEEE Trans. Geosci. Remote Sens. 2021, 59, 2940–2950. [Google Scholar] [CrossRef]
  11. Zhang, H.; Liu, M.; Wang, T.; Jiang, X.; Liu, B.; Dai, P. An Overview of Landslide Detection: Deep Learning and Machine Learning Approaches. In Proceedings of the 2021 4th International Conference on Artificial Intelligence and Big Data (ICAIBD); IEEE: Piscataway, NJ, USA, 2021; pp. 265–271. [Google Scholar] [CrossRef]
  12. Fang, Z.; Wang, Y.; Peng, L.; Hong, H. Integration of Convolutional Neural Network and Conventional Machine Learning Classifiers for Landslide Susceptibility Mapping. Comput. Geosci. 2020, 139, 104470. [Google Scholar] [CrossRef]
  13. Song, Y.; Song, Y.; Wang, C.; Wu, L.; Wu, W.; Li, Y.; Li, S.; Chen, A. Landslide Susceptibility Assessment through Multi-Model Stacking and Meta-Learning in Poyang County, China. Geomat. Nat. Hazards Risk 2024, 15, 2354499. [Google Scholar] [CrossRef]
  14. Song, Y.; Niu, R.; Xu, S.; Ye, R.; Peng, L.; Guo, T.; Li, S.; Chen, T. Landslide Susceptibility Mapping Based on Weighted Gradient Boosting Decision Tree in Wanzhou Section of the Three Gorges Reservoir Area (China). ISPRS Int. J. Geo-Inf. 2018, 8, 4. [Google Scholar] [CrossRef]
  15. Ganerød, A.J.; Lindsay, E.; Fredin, O.; Myrvoll, T.A.; Nordal, S.; Rød, J.K. Globally vs. Locally Trained Machine Learning Models for Landslide Detection: A Case Study of a Glacial Landscape. Remote Sens. 2023, 15, 895. [Google Scholar] [CrossRef]
  16. Lin, N.; Zhang, D.; Feng, S.; Ding, K.; Tan, L.; Wang, B.; Chen, T.; Li, W.; Dai, X.; Pan, J.; et al. Rapid Landslide Extraction from High-Resolution Remote Sensing Images Using SHAP-OPT-XGBoost. Remote Sens. 2023, 15, 3901. [Google Scholar] [CrossRef]
  17. Chen, C.; Fan, L. An Attribution Deep Learning Interpretation Model for Landslide Susceptibility Mapping in the Three Gorges Reservoir Area. IEEE Trans. Geosci. Remote Sens. 2023, 61, 3000515. [Google Scholar] [CrossRef]
  18. Bragagnolo, L.; Rezende, L.R.; Da Silva, R.V.; Grzybowski, J.M.V. Convolutional Neural Networks Applied to Semantic Segmentation of Landslide Scars. CATENA 2021, 201, 105189. [Google Scholar] [CrossRef]
  19. Shelhamer, E.; Long, J.; Darrell, T. Fully Convolutional Networks for Semantic Segmentation. IEEE Trans. Pattern Anal. Mach. Intell. 2017, 39, 640–651. [Google Scholar] [CrossRef] [PubMed]
  20. Ronneberger, O.; Fischer, P.; Brox, T. U-Net: Convolutional Networks for Biomedical Image Segmentation. In Medical Image Computing and Computer-Assisted Intervention—MICCAI 2015; Springer: Berlin/Heidelberg, Germany, 2015; Volume 9351, pp. 234–241. [Google Scholar] [CrossRef]
  21. Chen, L.C.; Papandreou, G.; Kokkinos, I.; Murphy, K.; Yuille, A.L. DeepLab: Semantic Image Segmentation with Deep Convolutional Nets, Atrous Convolution, and Fully Connected CRFs. IEEE Trans. Pattern Anal. Mach. Intell. 2018, 40, 834–848. [Google Scholar] [CrossRef]
  22. Yi, Y.; Zhang, W. A New Deep-Learning-Based Approach for Earthquake-Triggered Landslide Detection from Single-Temporal RapidEye Satellite Imagery. IEEE J. Sel. Top. Appl. Earth Obs. Remote Sens. 2020, 13, 6166–6176. [Google Scholar] [CrossRef]
  23. Chen, Y.; Wei, Y.; Wang, Q.; Chen, F.; Lu, C.; Lei, S. Mapping Post-Earthquake Landslide Susceptibility: A U-net like Approach. Remote Sens. 2020, 12, 2767. [Google Scholar] [CrossRef]
  24. Ullo, S.L.; Mohan, A.; Sebastianelli, A.; Ahamed, S.E.; Kumar, B.; Dwivedi, R.; Sinha, G.R. A New Mask R-CNN-based Method for Improved Landslide Detection. IEEE J. Sel. Top. Appl. Earth Obs. Remote Sens. 2021, 14, 3799–3810. [Google Scholar] [CrossRef]
  25. Chen, H.; He, Y.; Zhang, L.; Yao, S.; Yang, W.; Fang, Y.; Liu, Y.; Gao, B. A Landslide Extraction Method of Channel Attention Mechanism U-net Network Based on Sentinel-2A Remote Sensing Images. Int. J. Digit. Earth 2023, 16, 552–577. [Google Scholar] [CrossRef]
  26. Lu, W.; Hu, Y.; Zhang, Z.; Cao, W. A Dual-Encoder U-net for Landslide Detection Using Sentinel-2 and DEM Data. Landslides 2023, 20, 1975–1987. [Google Scholar] [CrossRef]
  27. Chen, X.; Liu, M.; Li, D.; Jia, J.; Yang, A.; Zheng, W.; Yin, L. Conv-Trans Dual Network for Landslide Detection of Multi-Channel Optical Remote Sensing Images. Front. Earth Sci. 2023, 11, 1182145. [Google Scholar] [CrossRef]
  28. Fu, Y.; Li, W.; Fan, S.; Jiang, Y.; Bai, H. CAL-net: Conditional Attention Lightweight Network for in-Orbit Landslide Detection. IEEE Trans. Geosci. Remote Sens. 2023, 61, 4408515. [Google Scholar] [CrossRef]
  29. Li, W.; Fu, Y.; Fan, S.; Xin, M.; Bai, H. DCI-PGCN: Dual-Channel Interaction Portable Graph Convolutional Network for Landslide Detection. IEEE Trans. Geosci. Remote Sens. 2023, 61, 4403616. [Google Scholar] [CrossRef]
  30. Liu, X.; Peng, Y.; Lu, Z.; Li, W.; Yu, J.; Ge, D.; Xiang, W. Feature-Fusion Segmentation Network for Landslide Detection Using High-Resolution Remote Sensing Images and Digital Elevation Model Data. IEEE Trans. Geosci. Remote Sens. 2023, 61, 4500314. [Google Scholar] [CrossRef]
  31. Shafapourtehrany, M.; Rezaie, F.; Jun, C.; Heggy, E.; Bateni, S.M.; Panahi, M.; Özener, H.; Shabani, F.; Moeini, H. Mapping Post-Earthquake Landslide Susceptibility Using U-net, VGG-16, VGG-19, and Metaheuristic Algorithms. Remote Sens. 2023, 15, 4501. [Google Scholar] [CrossRef]
  32. Song, Y.; Zou, Y.; Li, Y.; He, Y.; Wu, W.; Niu, R.; Xu, S. Enhancing Landslide Detection with SBConv-Optimized U-Net Architecture Based on Multisource Remote Sensing Data. Land 2024, 13, 835. [Google Scholar] [CrossRef]
  33. Ghorbanzadeh, O.; Xu, Y.; Ghamisi, P.; Kopp, M.; Kreil, D. Landslide4Sense: Reference Benchmark Data and Deep Learning Models for Landslide Detection. IEEE Trans. Geosci. Remote Sens. 2022, 60, 5633017. [Google Scholar] [CrossRef]
  34. Ghorbanzadeh, O.; Xu, Y.; Zhao, H.; Wang, J.; Zhong, Y.; Zhao, D.; Zang, Q.; Wang, S.; Zhang, F.; Shi, Y.; et al. The Outcome of the 2022 Landslide4Sense Competition: Advanced Landslide Detection From Multisource Satellite Imagery. IEEE J. Sel. Top. Appl. Earth Obs. Remote Sens. 2022, 15, 9927–9942. [Google Scholar] [CrossRef]
  35. Meena, S.R.; Nava, L.; Bhuyan, K.; Puliero, S.; Soares, L.P.; Dias, H.C.; Floris, M.; Catani, F. HR-GLDD: A Globally Distributed Dataset Using Generalized Deep Learning (DL) for Rapid Landslide Mapping on High-Resolution (HR) Satellite Imagery. Earth Syst. Sci. Data 2023, 15, 3283–3298. [Google Scholar] [CrossRef]
  36. Fang, C.; Fan, X.; Wang, X.; Nava, L.; Zhong, H.; Dong, X.; Qi, J.; Catani, F. A Globally Distributed Dataset of Coseismic Landslide Mapping via Multi-Source High-Resolution Remote Sensing Images. Earth Syst. Sci. Data 2024, 16, 4817–4842. [Google Scholar] [CrossRef]
  37. Xu, Y.; Ouyang, C.; Xu, Q.; Wang, D.; Zhao, B.; Luo, Y. CAS Landslide Dataset: A Large-Scale and Multisensor Dataset for Deep Learning-Based Landslide Detection. Sci. Data 2024, 11, 12. [Google Scholar] [CrossRef] [PubMed]
  38. Dong, A.; Dou, J.; Li, C.; Chen, Z.; Ji, J.; Xing, K.; Zhang, J.; Daud, H. Accelerating Cross-Scene Co-Seismic Landslide Detection Through Progressive Transfer Learning and Lightweight Deep Learning Strategies. IEEE Trans. Geosci. Remote Sens. 2024, 62, 4410213. [Google Scholar] [CrossRef]
  39. Chen, J.; Liu, J.; Zeng, X.; Zhou, S.; Sun, G.; Rao, S.; Guo, Y.; Zhu, J. A Cross-Domain Landslide Extraction Method Utilizing Image Masking and Morphological Information Enhancement. Remote Sens. 2025, 17, 1464. [Google Scholar] [CrossRef]
  40. Liu, Z.; Lin, Y.; Cao, Y.; Hu, H.; Wei, Y.; Zhang, Z.; Lin, S.; Guo, B. Swin Transformer: Hierarchical Vision Transformer Using Shifted Windows. In Proceedings of the IEEE/CVF International Conference on Computer Vision (ICCV); IEEE: Piscataway, NJ, USA, 2021; pp. 9992–10002. [Google Scholar] [CrossRef]
  41. Cao, H.; Wang, Y.; Chen, J.; Jiang, D.; Zhang, X.; Tian, Q.; Wang, M. Swin-Unet: Unet-like Pure Transformer for Medical Image Segmentation. arXiv 2021, arXiv:2105.05537. [Google Scholar] [CrossRef]
  42. He, X.; Zhou, Y.; Zhao, J.; Zhang, D.; Yao, R.; Xue, Y. Swin Transformer Embedding UNet for Remote Sensing Image Semantic Segmentation. IEEE Trans. Geosci. Remote Sens. 2022, 60, 4408715. [Google Scholar] [CrossRef]
  43. Zhou, N.; Hong, J.; Cui, W.; Wu, S.; Zhang, Z. A Multiscale Attention Segment Network-Based Semantic Segmentation Model for Landslide Remote Sensing Images. Remote Sens. 2024, 16, 1712. [Google Scholar] [CrossRef]
  44. Liu, B.; Wang, W.; Wu, Y.; Gao, X. Attention Swin Transformer UNet for Landslide Segmentation in Remotely Sensed Images. Remote Sens. 2024, 16, 4464. [Google Scholar] [CrossRef]
  45. Liu, Z.; Mao, H.; Wu, C.Y.; Feichtenhofer, C.; Darrell, T.; Xie, S. A ConvNet for the 2020s. In Proceedings of the 2022 IEEE/CVF Conference on Computer Vision and Pattern Recognition (CVPR); IEEE: Piscataway, NJ, USA, 2022. [Google Scholar] [CrossRef]
  46. Gu, A.; Dao, T. Mamba: Linear-Time Sequence Modeling with Selective State Spaces. arXiv 2023, arXiv:2312.00752. [Google Scholar]
  47. Ma, X.; Zhang, X.; Pun, M.O. RS 3 Mamba: Visual State Space Model for Remote Sensing Image Semantic Segmentation. IEEE Geosci. Remote Sens. Lett. 2024, 21, 6011405. [Google Scholar] [CrossRef]
  48. Dai, J.; Qi, H.; Xiong, Y.; Li, Y.; Zhang, G.; Hu, H.; Wei, Y. Deformable Convolutional Networks. In Proceedings of the IEEE International Conference on Computer Vision (ICCV); IEEE: Piscataway, NJ, USA, 2017; pp. 764–773. [Google Scholar] [CrossRef]
  49. Wang, W.; Dai, J.; Chen, Z.; Huang, Z.; Li, Z.; Zhu, X.; Hu, X.; Lu, T.; Lu, L.; Li, H.; et al. Internimage: Exploring Large-Scale Vision Foundation Models with Deformable Convolutions. In Proceedings of the IEEE/CVF Conference on Computer Vision and Pattern Recognition; IEEE: Piscataway, NJ, USA, 2023; pp. 14408–14419. [Google Scholar]
  50. Xiong, Y.; Li, Z.; Chen, Y.; Wang, F.; Zhu, X.; Luo, J.; Wang, W.; Lu, T.; Li, H.; Qiao, Y.; et al. Efficient Deformable Convnets: Rethinking Dynamic and Sparse Operator for Vision Applications. In Proceedings of the IEEE/CVF Conference on Computer Vision and Pattern Recognition; IEEE: Piscataway, NJ, USA, 2024; pp. 5652–5661. [Google Scholar]
  51. Shi, D. TransNeXt: Robust Foveal Visual Perception for Vision Transformers. In Proceedings of the IEEE/CVF Conference on Computer Vision and Pattern Recognition; IEEE: Piscataway, NJ, USA, 2024; pp. 17773–17783. [Google Scholar] [CrossRef]
Figure 1. Unified experimental pipeline, including dataset-specific preprocessing, backbone feature extraction, task-specific decoding, and optional auxiliary supervision. Gold dashed boxes group the data preprocessor, backbone, auxiliary head, and decode head; blue dashed boxes indicate internal processing units. Gray arrows denote within-module feature flow, and colored arrows connect the major pipeline stages. The asterisk denotes repeated layers, i.e., Layer  * N means that the layer is repeated N times.
Remotesensing 18 02000 g001
Figure 2. Overview of DCA-UNet. (a) Encoder–neck–decoder architecture with skip fusion and auxiliary supervision. Gold, green, and blue dashed boxes denote the encoder, neck, and decoder, respectively. Gray arrows indicate the main feature flow and resolution changes, orange arrows indicate skip connections passed to FeatureFuse modules, and the gray dashed arrow indicates the auxiliary supervision branch. The asterisk denotes multiplication or repeated application: for example,  C * 2 doubles the channel number, and DCABlock  * 2 indicates two consecutive DCA blocks. (b) Structure of the DCA block combining deformable convolution and aggregated attention.
Remotesensing 18 02000 g002
Figure 3. DCNv4-based deformable convolution module. Offsets and aggregation weights are predicted from input features and used for adaptive spatial sampling. Blue arrows indicate feature and offset/mask prediction flow, orange boxes and arrows indicate the sampled spatial window and its input to the DCNv4 operator, green blocks denote learned aggregation weights, and dashed arrows denote optional or grouped intermediate connections.
Remotesensing 18 02000 g003
Figure 4. Aggregated attention module. A local sliding-window path and a pooled global path are combined with positional bias and query embeddings to aggregate multi-scale contextual information. The gold, blue, and green dashed regions denote local sliding-window attention, spatial-reduction attention, and positional attention for dynamic relative position bias, respectively. Solid arrows indicate tensor flow between operations, dashed lines indicate token grouping or relative-position correspondence, and different colors separate local, pooled, query, and positional-bias streams.
Remotesensing 18 02000 g004
Figure 5. Qualitative comparison on Landslide4Sense. Columns show the RGB image, the ground-truth mask, and the predictions of the compared models; green, red, and blue denote true positives (TP), false positives (FP), and false negatives (FN), respectively.
Remotesensing 18 02000 g005
Table 1. Comparison of segmentation performance on the HR-GLDD dataset.
ModelDecode HeadIoUPrecisionRecallF1-ScoremF1-Score
UNetFCN55.9176.2467.7071.7284.23
UNet-DeepLabV3ASPP56.1876.0568.2671.9484.35
ResNet50-DeepLabV3ASPP50.6576.4060.0567.2581.85
ResNet50-DeepLabV3+DSASPP50.1675.9659.6366.8181.61
Swin-TinyUPerNet54.0270.2070.0970.1483.24
Swin-TinyMask2Former53.3673.6765.9469.5983.04
SwinUNet-Tiny56.8175.2169.9072.4684.61
ConvNeXt-TinyUPerNet52.5469.8967.9268.8982.57
MambaUNet54.4173.5567.6470.4783.51
DCA-UNet (Ours)59.2474.9373.8974.4185.65
Note: Bold values indicate the best performance for each metric.
Table 2. Comparison of segmentation performance on the Landslide4Sense dataset.
ModelDecode HeadIoUPrecisionRecallF1-ScoremF1-Score
UNetFCN60.3775.9274.6775.2987.36
UNet-DeepLabV3ASPP59.8277.7272.2074.8687.15
ResNet50-DeepLabV3ASPP49.5067.2965.1866.2282.72
ResNet50-DeepLabV3+DSASPP53.9171.0169.1370.0684.69
Swin-TinyUPerNet57.4273.9571.9872.9586.17
Swin-TinyMask2Former57.2673.2272.4372.8286.10
SwinUNet-Tiny61.3775.3876.7576.0687.75
ConvNeXt-TinyUPerNet56.2572.9771.0672.0085.68
MambaUNet59.9976.7473.3375.0087.22
DCA-UNet (Ours)61.9277.0675.9276.4887.97
Note: Bold values indicate the best performance for each metric.
Table 3. Comparison of segmentation performance on the GDCLD dataset.
ModelIoUPrecisionRecallF1-ScoremF1-Score
UNet49.5865.2267.4066.2981.61
UNet-DeepLabV349.6769.6263.4266.3781.75
ResNet50-DeepLabV350.3975.2060.4367.0182.19
ResNet50-DeepLabV3+53.8874.5666.0270.0383.76
Swin-Tiny (UPerNet)57.8479.4268.0473.2985.54
Swin-Tiny (Mask2Former)52.9579.5361.3069.2483.41
SwinUNet-Tiny46.0876.1353.8663.0980.15
ConvNeXt-Tiny55.4475.3467.7371.3384.45
MambaUNet45.5969.3657.0962.6379.80
DCA-UNet (Ours)58.4073.3674.1273.7485.69
Note: Bold values indicate the best performance for each metric.
Table 4. Ablation study on the Landslide4Sense dataset.
ModelClassIoUPrecisionRecallF1-ScoremF1-Score
UNetbackground98.8799.4299.4599.4387.36
landslide60.3775.9274.6775.29
UNet-DCbackground98.9299.4199.5099.4687.74
landslide61.3277.4774.6276.02
UNet-AAbackground98.9299.4499.4799.4687.86
landslide61.6376.7675.7676.26
DCA-UNetbackground98.9399.4799.4599.4688.14
landslide62.3676.4577.1976.82
Note: Bold values indicate the best performance for each metric.
Table 5. Comparison of model size and local training-side resource observations on Landslide4Sense. Runtime and memory values were measured on an Intel Xeon(R) Platinum 8481C CPU and an NVIDIA GeForce RTX 4090D GPU with 24 GB memory, and should not be interpreted as hardware-independent efficiency scores.
ModelDecode HeadParams (M)Memory (GB)Time (min/iter)
UNetFCN29.070.970.0274
UNet-DeepLabV3ASPP29.070.970.0310
ResNet50-DeepLabV3ASPP68.101.310.0504
ResNet50-DeepLabV3+DSASPP43.601.030.0538
Swin-TinyUPerNet59.841.280.0780
Swin-TinyMask2Former47.421.090.2086
SwinUNet-Tiny117.063.090.1081
ConvNeXt-TinyUPerNet60.151.090.0491
MambaUNet54.251.510.0979
DCA-UNet (Ours)29.501.760.1334
Note: Bold values indicate the best value in each resource column, where fewer parameters, lower memory use, or shorter time is preferable.
Disclaimer/Publisher’s Note: The statements, opinions and data contained in all publications are solely those of the individual author(s) and contributor(s) and not of MDPI and/or the editor(s). MDPI and/or the editor(s) disclaim responsibility for any injury to people or property resulting from any ideas, methods, instructions or products referred to in the content.