Article

Seismogenic Structure of the 1975 Haicheng Ms 7.3 Earthquake (NE China) Inferred from 3D Magnetotelluric Imaging

1
Liaoning Earthquake Agency, Shenyang 110034, China
2
State Key Laboratory of Earthquake Dynamics and Forecasting, Institute of Geology, China Earthquake Administration, Beijing 100029, China
3
Institute of Volcanology, China Earthquake Administration, Changchun 130117, China
4
Geophysical Exploration Center, China Earthquake Administration, Zhengzhou 450002, China
5
The Second Monitoring and Application Center, China Earthquake Administration, Xi’an 710043, China
*
Author to whom correspondence should be addressed.
These authors contributed equally to this work.
These authors also contributed equally to this work.
Remote Sens. 2026, 18(12), 1993; https://doi.org/10.3390/rs18121993
Submission received: 8 April 2026 / Revised: 3 June 2026 / Accepted: 10 June 2026 / Published: 15 June 2026

Highlights

What are the main findings?
  • A synform intracrustal conductive body controls the nucleation of the 1975 Haicheng earthquake.
  • The Haichenghe–Dayanghe fault forms a key pathway for upward migration of deep crustal fluids.
What are the implications of the main findings?
  • Fluid migration driven by Pacific Plate subduction plays a critical role in earthquake nucleation and clustering.
  • Variations in the depth of conductive layers reveal crust-dominated versus mantle-driven geodynamic processes in Northeast China.

Abstract

On 4 February 1975, the Haicheng Ms 7.3 earthquake occurred in the Liaodong Uplift, northeastern China. To investigate its seismogenic structure and deep geological environment, we acquired broadband magnetotelluric data along two intersecting profiles across the epicentral region and performed three-dimensional inversion. Two orthogonal electrical sections were then extracted from the resulting 3D resistivity model to image the crustal structure beneath the Haicheng earthquake area. The model reveals that the northern segment of the Tanlu fault corresponds to a major electrical discontinuity between the Xialiaohe Basin and the Liaodong Uplift, suggesting that it may represent a deep-seated fault zone extending into the lithosphere. Beneath the Liaodong Uplift, a prominent mid-crustal low-resistivity layer is developed, and a synform conductive body is resolved beneath the source region. The Haicheng mainshock and relocated aftershocks are mainly distributed along the interface between this conductive body and the overlying high-resistivity upper crust. In addition, the Haichenghe–Dayanghe fault is imaged as a conductive zone that connects the mid-crustal conductor with shallower crustal levels. These electrical features suggest that deep crustal fluids, possibly related to Pacific Plate subduction and craton destruction, may have migrated upward along fault zones, weakened the seismogenic fault system, and promoted earthquake nucleation. Compared with the volcanic regions of the Jilin–Heilongjiang orogenic belt, where conductive anomalies extend into the upper mantle, the Haicheng region is characterized mainly by intracrustal conductors. This contrast highlights the role of crustal-scale conductive structures in the seismogenic environment of the Haicheng earthquake and provides geophysical constraints for comparing earthquake- and volcano-related deep processes in northeastern China.

1. Introduction

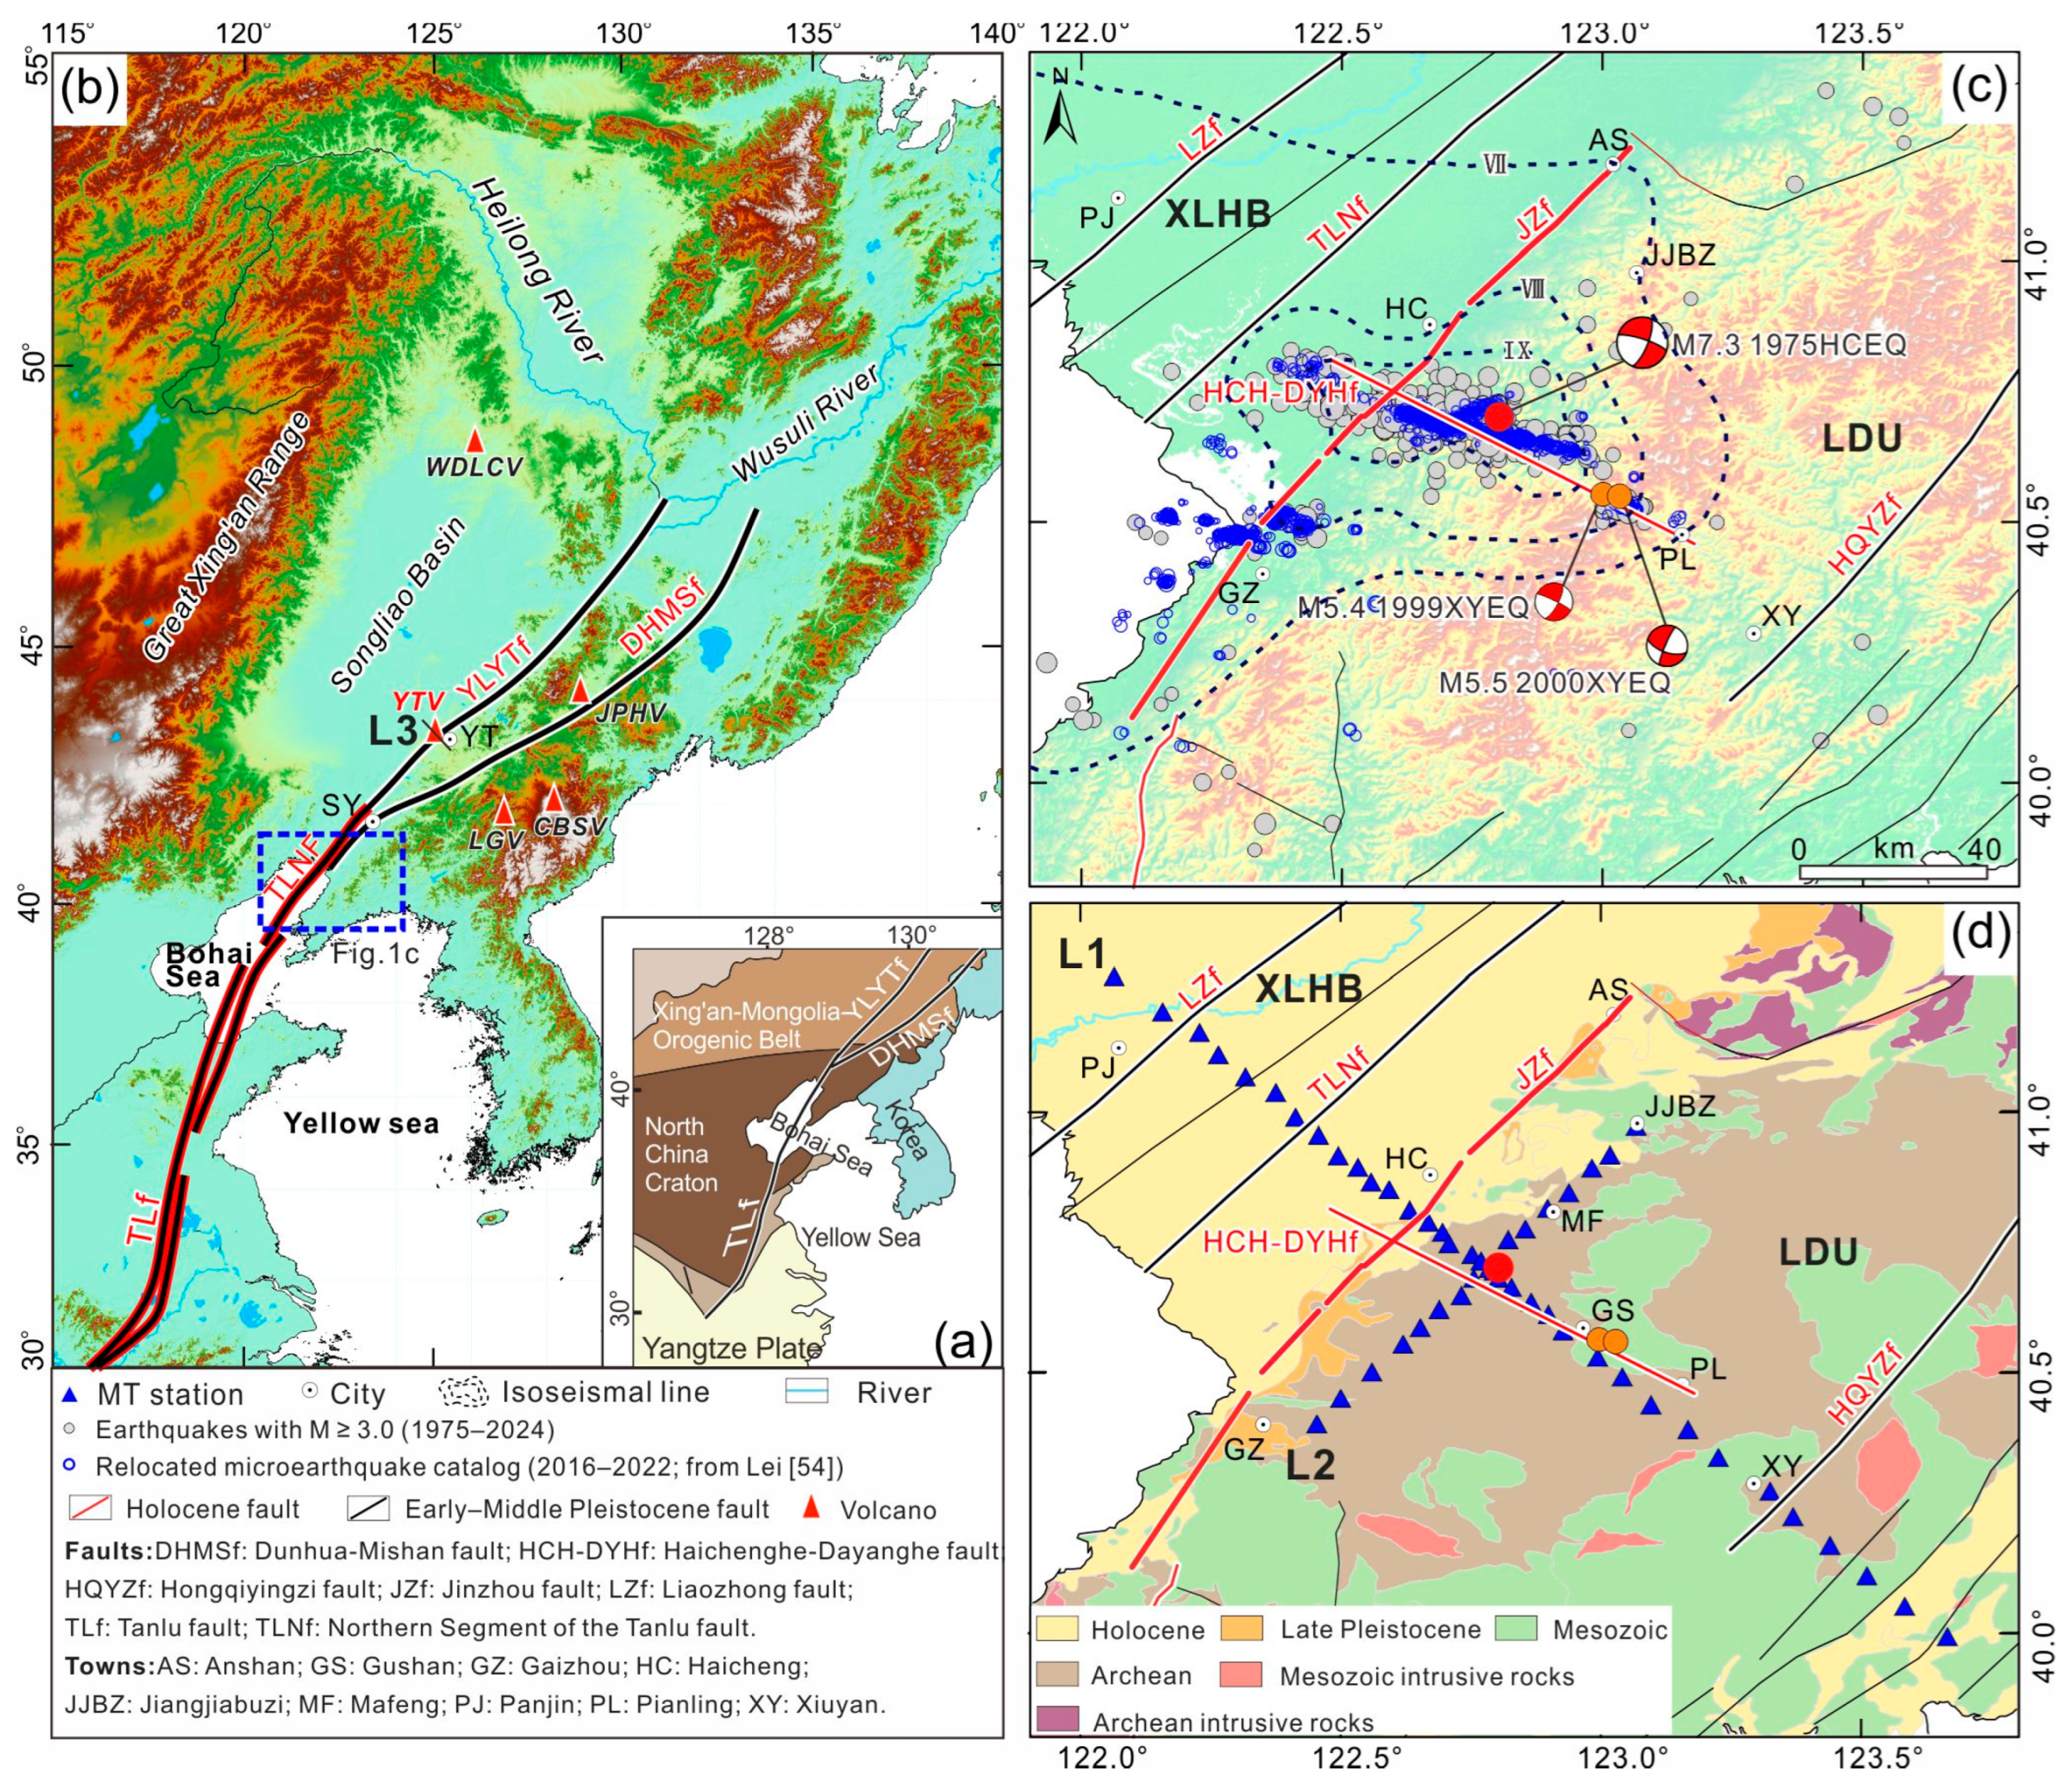
On 4 February 1975, at 19:36 local time, an Ms 7.3 earthquake struck Haicheng City, Liaoning Province, northeastern China (approximately 40.67°N, 122.80°E). The epicenter was located near the junction of the northern segment of the Tanlu fault (TLNf) and the Yilan–Yitong fault (YLYTf) (Figure 1a,b). This event was the largest recorded earthquake in northeastern China since the beginning of written records. The 1975 Haicheng earthquake is widely regarded as the first officially recognized successful short-term prediction of an earthquake with a magnitude of 7 or greater that achieved effective disaster mitigation, significantly reducing casualties and economic losses [1].
The Haicheng earthquake sequence exhibits a typical foreshock-mainshock-aftershock pattern. Both the frequency and intensity of foreshock activity increased markedly about 25 h before the mainshock. Focal depths were mainly concentrated at 12–15 km. No clear surface rupture zone has been identified. Instead, only a prominent left-lateral en echelon fracture zone was observed, suggesting that the earthquake was caused by shear slip along a near-vertical fault plane [2,3]. The aftershock sequence persisted for a long period and was mainly distributed in a belt trending N67°W. Seismic activity in this sequence continued for decades, with two moderate earthquakes of Ms 5.4 and Ms 5.5 occurring near Xiuyan in 1999 and 2000 at focal depths of 8 and 9 km, respectively [4]. These observations indicate that the regional tectonic stress field remains active [5] (Figure 1c).
During the decade after the earthquake, integrated geophysical investigations, including deep seismic sounding and magnetotelluric (MT) surveys, were carried out in the Haicheng region. These studies revealed strong lateral heterogeneity in the crust-upper mantle structure. In particular, a mid-crustal ductile layer with low velocity, high conductivity, and high temperature was identified beneath the overlying brittle crust. This layer was interpreted to facilitate deep material upwelling and heat transfer, thereby promoting stress concentration in the upper crust and exerting an important control on seismogenesis [6,7,8]. Over the past five years, improvements in seismic array density and data processing methods have substantially advanced understanding of the seismogenic mechanism in the Haicheng region. Studies based on data from the Liaoning regional seismic network [9,10,11] and dense temporary arrays [12,13,14,15] indicate that the western Xialiaohe Basin (XLHB) is characterized by a low-velocity upper crust, whereas the Liaodong Uplift (LDU) shows relatively high velocities. Beneath the Haicheng earthquake area, a prominent anomaly at depths of 15–24 km, characterized by low Vp, low Vs, and high Vp/Vs, has been identified and interpreted as a fluid-bearing reservoir. Along the Haichenghe–Dayanghe fault, alternating high- and low-velocity anomalies form structural heterogeneities that are favorable for stress accumulation. Overall, seismic activity in the Haicheng region is mainly controlled by a conjugate fault system.
In regions of strong earthquakes, the deep crust commonly contains thermal materials and fluids, which can produce significant variations in the electrical resistivity of subsurface media. The MT method is highly sensitive to such variations and is therefore an effective tool for investigating seismogenic environments [16,17,18,19,20]. With the development of three-dimensional (3D) MT inversion techniques [20,21] and advances in high-performance computing, 3D MT studies have revealed complex seismogenic structures and deep earthquake environments in multiple seismic regions. These studies demonstrate that subsurface resistivity structure provides important constraints on the occurrence of strong earthquakes and the distribution of aftershocks [22,23,24,25,26,27,28,29,30,31,32]. During the past three years, 3D MT investigations in northern North China, including the 1966 Xingtai, 1976 Tangshan, and 1997 Zhangbei earthquake regions, have revealed a characteristic vertical structure composed of a high-resistivity (rigid) upper crust and a low-resistivity (weak) middle-lower crust. In these regions, earthquake hypocenters are commonly located near the transition between the high- and low-resistivity layers, on the high-resistivity side [33,34,35]. In contrast, detailed investigations of the deep electrical structure in the 1975 Haicheng earthquake region remain limited.
This study presents newly acquired broadband 3D MT imaging results across the Haicheng earthquake region (Figure 1d). By integrating seismic geology, high-precision microseismic relocation data, and crustal deformation observations, the deep electrical structure of the region is delineated, together with the geometry of the deep extensions of the conjugate faults in the Haicheng earthquake area and their coupling with shallow and deep tectonic processes. In addition, through comparison with the electrical structure of the northeastern volcanic region, the dynamic mechanisms underlying the deep genesis of strong earthquakes and volcanism are discussed.

2. Tectonic Setting

The Haicheng earthquake occurred in the contact zone between the XLHB and the LDU, within an active continental margin formed by subduction of the Pacific Plate beneath the Eurasian Plate [36,37] (Figure 1b). In the Haicheng earthquake region and its surrounding areas, both NE- and NW-trending faults are well developed. The NE-trending faults mainly include the Liaozhong fault (LZf), the Northern Segment of the Tanlu fault (TLNf), the Jinzhou fault (JZf), and the Hongqiyingzi fault (HQYZf) [38] (Figure 1c). Among these faults, the JZf is a Holocene active fault [39], whereas the Hongqiyingzi fault (HQYZf) has been mapped as one of the major active faults in Liaoning and adjacent areas [40], although its latest activity age is less well constrained in the available literature. The Haichenghe–Dayanghe fault (HCH-DYHf) strikes NW and has been identified as a Holocene active sinistral strike-slip fault. Together with the JZf, it forms a conjugate fault system with NE- and NW-trending faults [13]. Its present activity is supported by the occurrence of the 1975 Haicheng Ms 7.3, 1999 Xiuyan Ms 5.4, and 2000 Xiuyan Ms 5.5 earthquakes along or near the fault, as well as by the dense NWW-trending belt of ML ≥ 2.0 earthquakes recorded since 1980, whose spatial distribution is consistent with the fault strike [41]. Cenozoic strata are widely exposed in the XLHB and mainly consist of Neogene sandstones and Quaternary alluvial deposits. In contrast, the LDU exposes Archean and Mesozoic strata, dominated by metamorphic complexes, volcanic rocks, conglomerates, and Mesozoic intrusive rocks such as granite and diorite porphyry [39] (Figure 1d).

3. Data Acquisition, Processing, and Analysis

3.1. Data Acquisition and Processing

Considering the development of NE-SW- and NW-SE-trending conjugate fault systems in the study area, together with the NW-SE distribution of the Haicheng aftershock sequence (Figure 1c), two broadband MT profiles arranged in a cross pattern were deployed across the Haicheng earthquake region (Figure 1d). Profile L1 trends NW-SE and consists of 36 stations. It crosses both the XLHB and the LDU, extends for approximately 200 km, and covers the 1975 Haicheng earthquake area as well as the 1999 and 2000 Xiuyan earthquake areas. Profile L2 trends SW-NE and consists of 15 stations, with a total length of approximately 85 km. On both profiles, station spacing within the Haicheng earthquake area is less than 1 km.
From May to June 2024, data acquisition was carried out using the MTU-5A magnetotelluric observation system manufactured by Phoenix Geophysics. Two horizontal electric field components (north–south and east–west) and three magnetic field components (north–south, east–west, and vertical) were recorded. Due to the presence of highways, railway networks, and multiple towns along the survey lines within the study area, significant sources of electromagnetic noise were present, which severely affected the quality of the MT data (Figure S1a). To obtain high-quality electromagnetic data, a remote reference station was established in Jiuzhi County, Qinghai Province, approximately 2200 km southwest of the study area, for synchronous observations (Figure S1b). In addition, to improve data stability and the signal-to-noise ratio, the recording duration at each field station exceeded three nights. Figure S1c shows the apparent resistivity and impedance phase curves from the Jiuzhi reference station, indicating that the reference data are of high quality. The MT data from the Haicheng area were processed using the remote reference technique and non-robust processing methods [42,43,44]. Figure S1d and Figure S1e present the apparent resistivity and impedance phase curves at 10 sites before and after remote reference processing, respectively, demonstrating a significant improvement in data quality. Ultimately, data from a total of 49 MT sites were obtained.

3.2. Regional Electrical Structure and Dimensionality Analysis

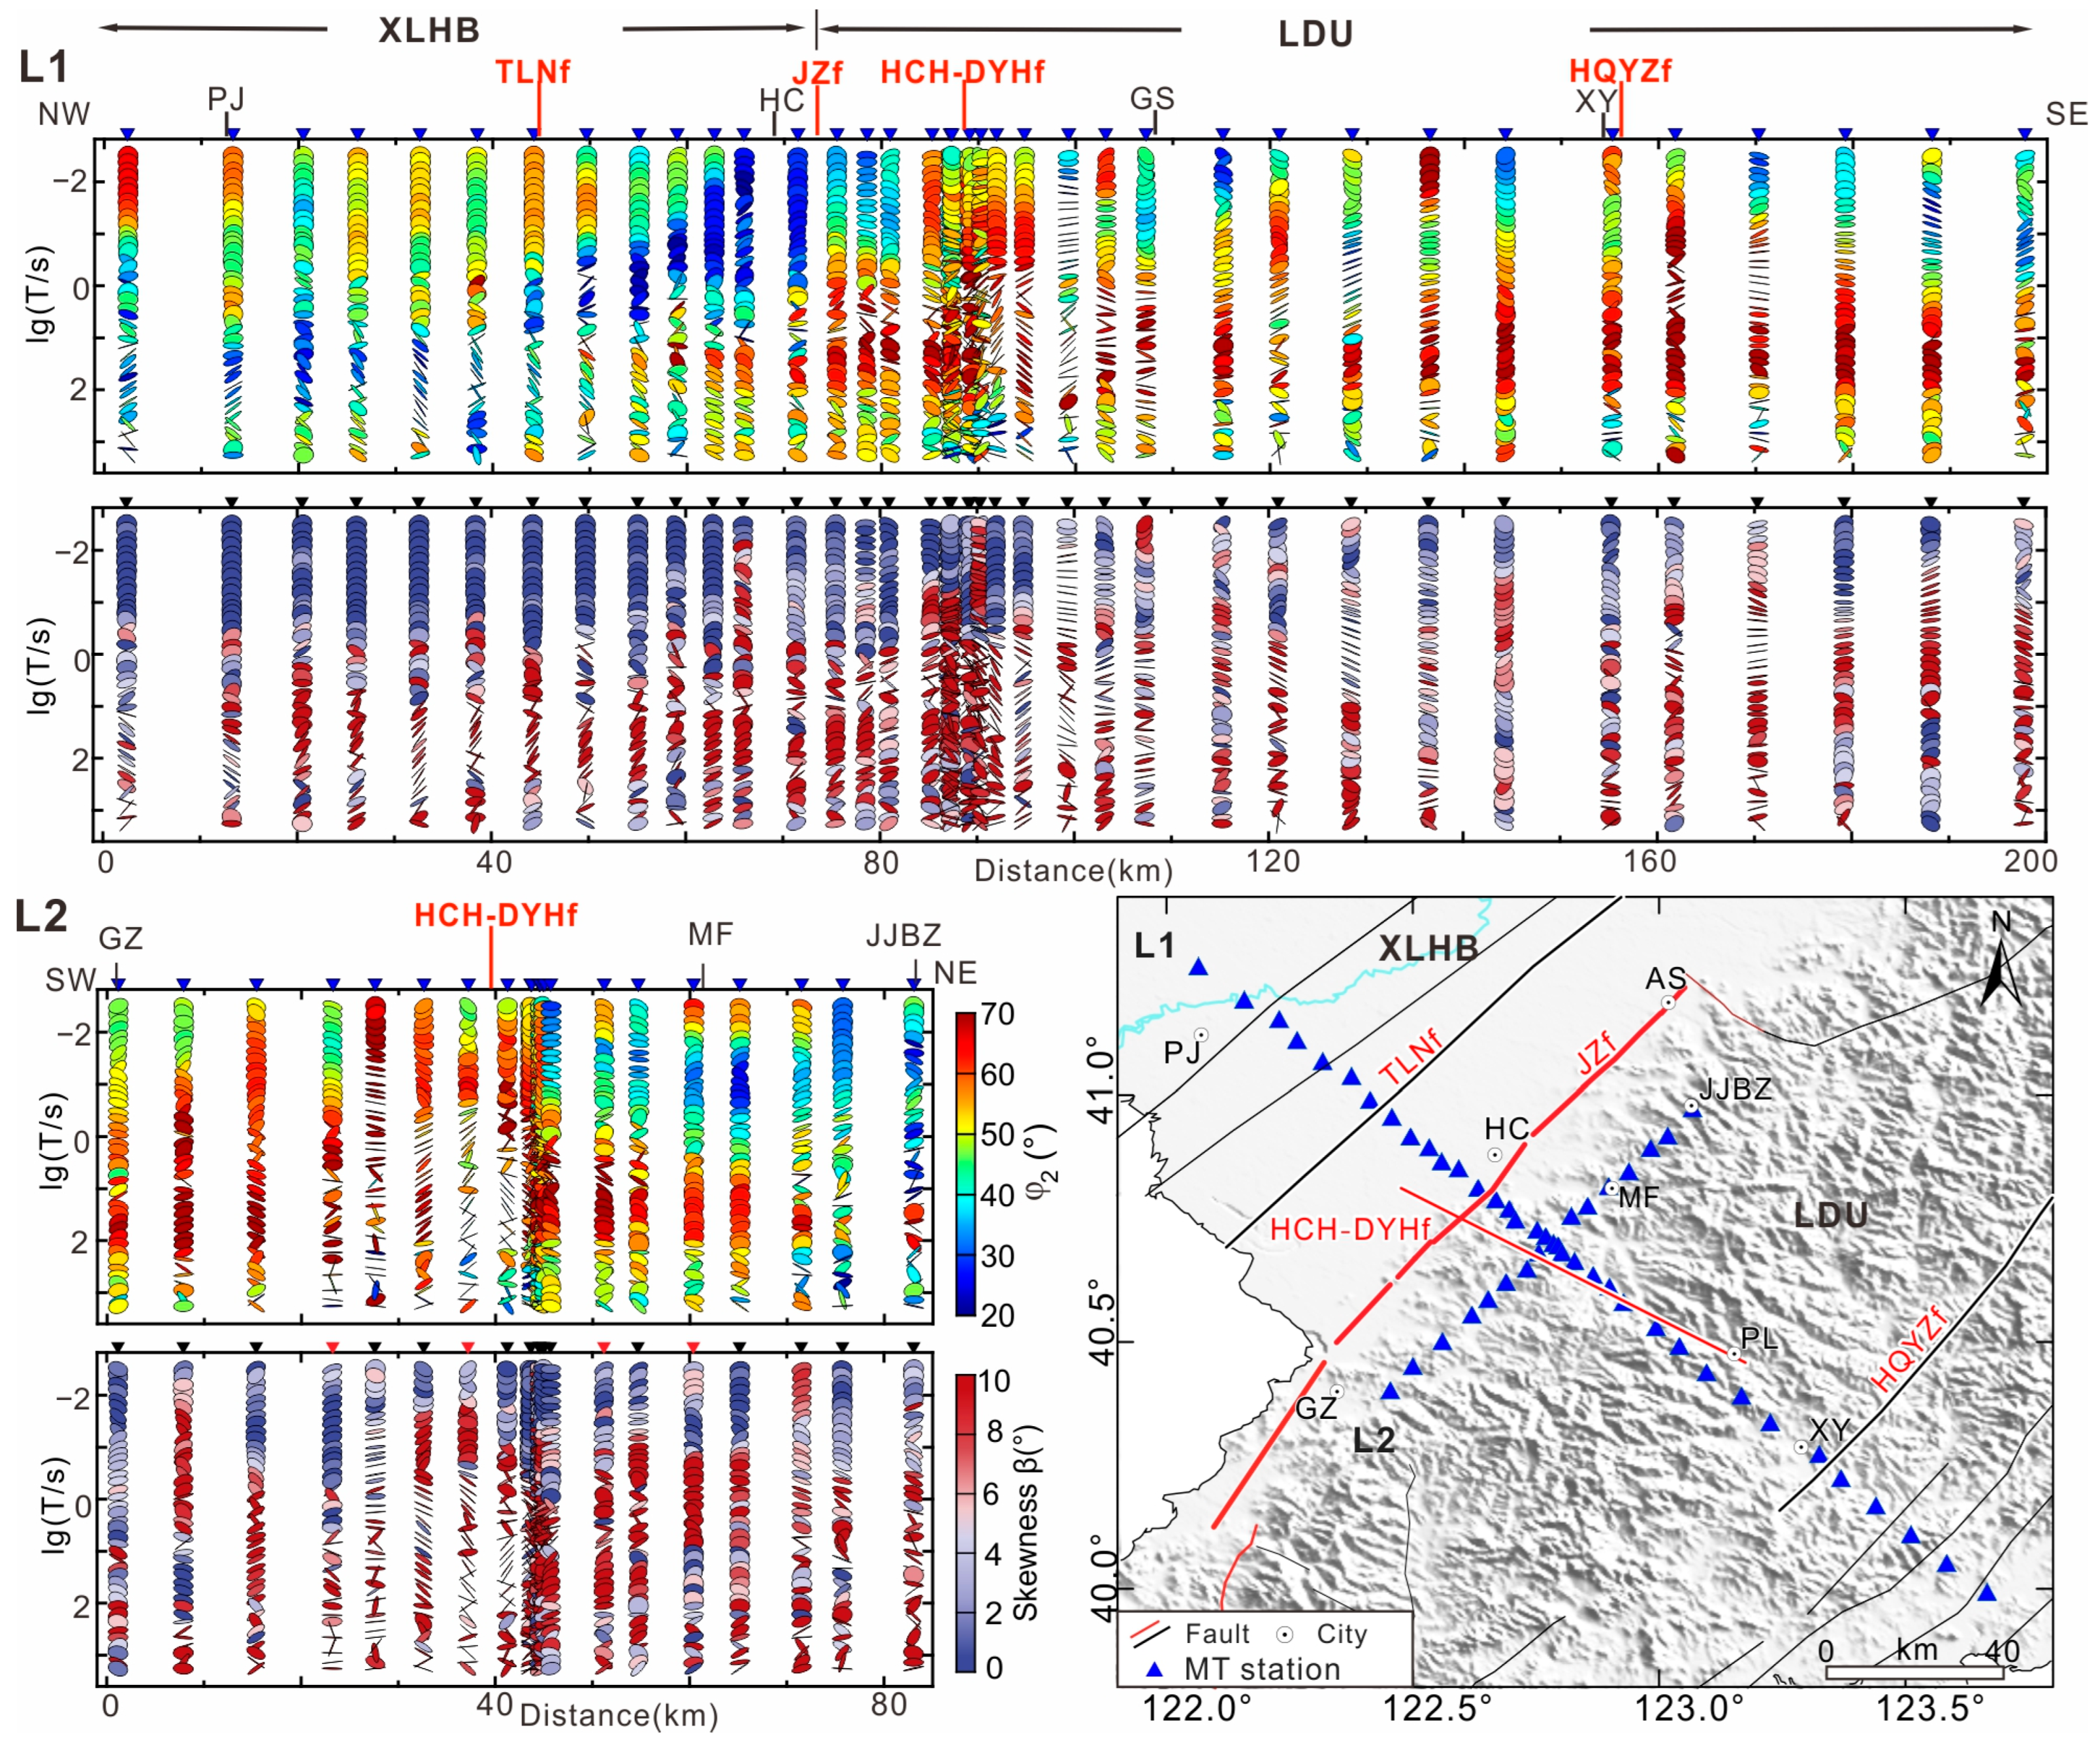
The phase tensor rotational invariant φ 2 reflects the frequency-dependent variation in apparent resistivity. When φ 2 < 45°, apparent resistivity increases as frequency decreases; when φ 2 > 45°, apparent resistivity decreases as frequency decreases [45]. Figure 2 presents the variation of the phase invariant φ 2 with period along profiles L1 and L2, revealing marked differences in electrical structure between the two major tectonic units, the XLHB and the LDU. In the XLHB, relatively high φ 2 values are observed at high frequencies, corresponding to periods shorter than a few seconds, whereas relatively low φ 2 values occur at lower frequencies. This pattern indicates the presence of a thin low-resistivity layer in the shallow part, which is typical of basin structure, and a relatively higher-resistivity structure at middle to deep levels. In contrast, in the LDU, relatively low φ 2 values appear at high frequencies, whereas the φ 2 values exceed 45° from periods of a few seconds to several thousand seconds. This feature indicates a resistivity structure characterized by high resistivity in the shallow to middle part and low resistivity in the middle to deep part. Profile L2 is located within the LDU and crosses the HCH-DYHf. On the southwestern side of the profile, φ 2 exhibits high values over the entire frequency range, indicating the presence of a large-scale low-resistivity structure extending from shallow to deep levels. On the northeastern side, φ 2 shows low values at high frequencies and high values at lower frequencies, suggesting a low-resistivity structure overlying a deep high-resistivity structure. Along profile L1, near the TLNf and the HCH-DYHf, and along profile L2 near the HCH-DYHf, φ 2 shows relatively high values across the full frequency range. Clear contrasts in φ 2 on both sides, indicating that the fault zones correspond to boundaries of electrical heterogeneity.
The magnitude of the two-dimensional deviation, |β|, derived from phase tensor decomposition can be used to assess the dimensionality of subsurface structures [46,47]. Considering the noise level and data uncertainty in the study area, |β| > 5° is taken to indicate strong three-dimensionality in the deep structure [29,48]. As shown in Figure 3, along profile L1 within the XLHB, |β| values are relatively small at high frequencies (periods < 1 s), indicating predominantly one-dimensional to two-dimensional structures. At periods longer than 1 s, however, |β| values are generally greater than 5°, suggesting that the subsurface electrical structure becomes more complex and increasingly 3D with increasing investigation depth. Within the LDU, most sites show |β| values greater than 5° from high to low frequencies, indicating pronounced three-dimensionality from shallow to deep levels and a higher degree of structural complexity than in the XLHB. Profile L2, which is located within the LDU, exhibits a |β| distribution pattern broadly consistent with that of the LDU segment along profile L1, with strong three-dimensionality at depth.

4. Three-Dimensional Inversion

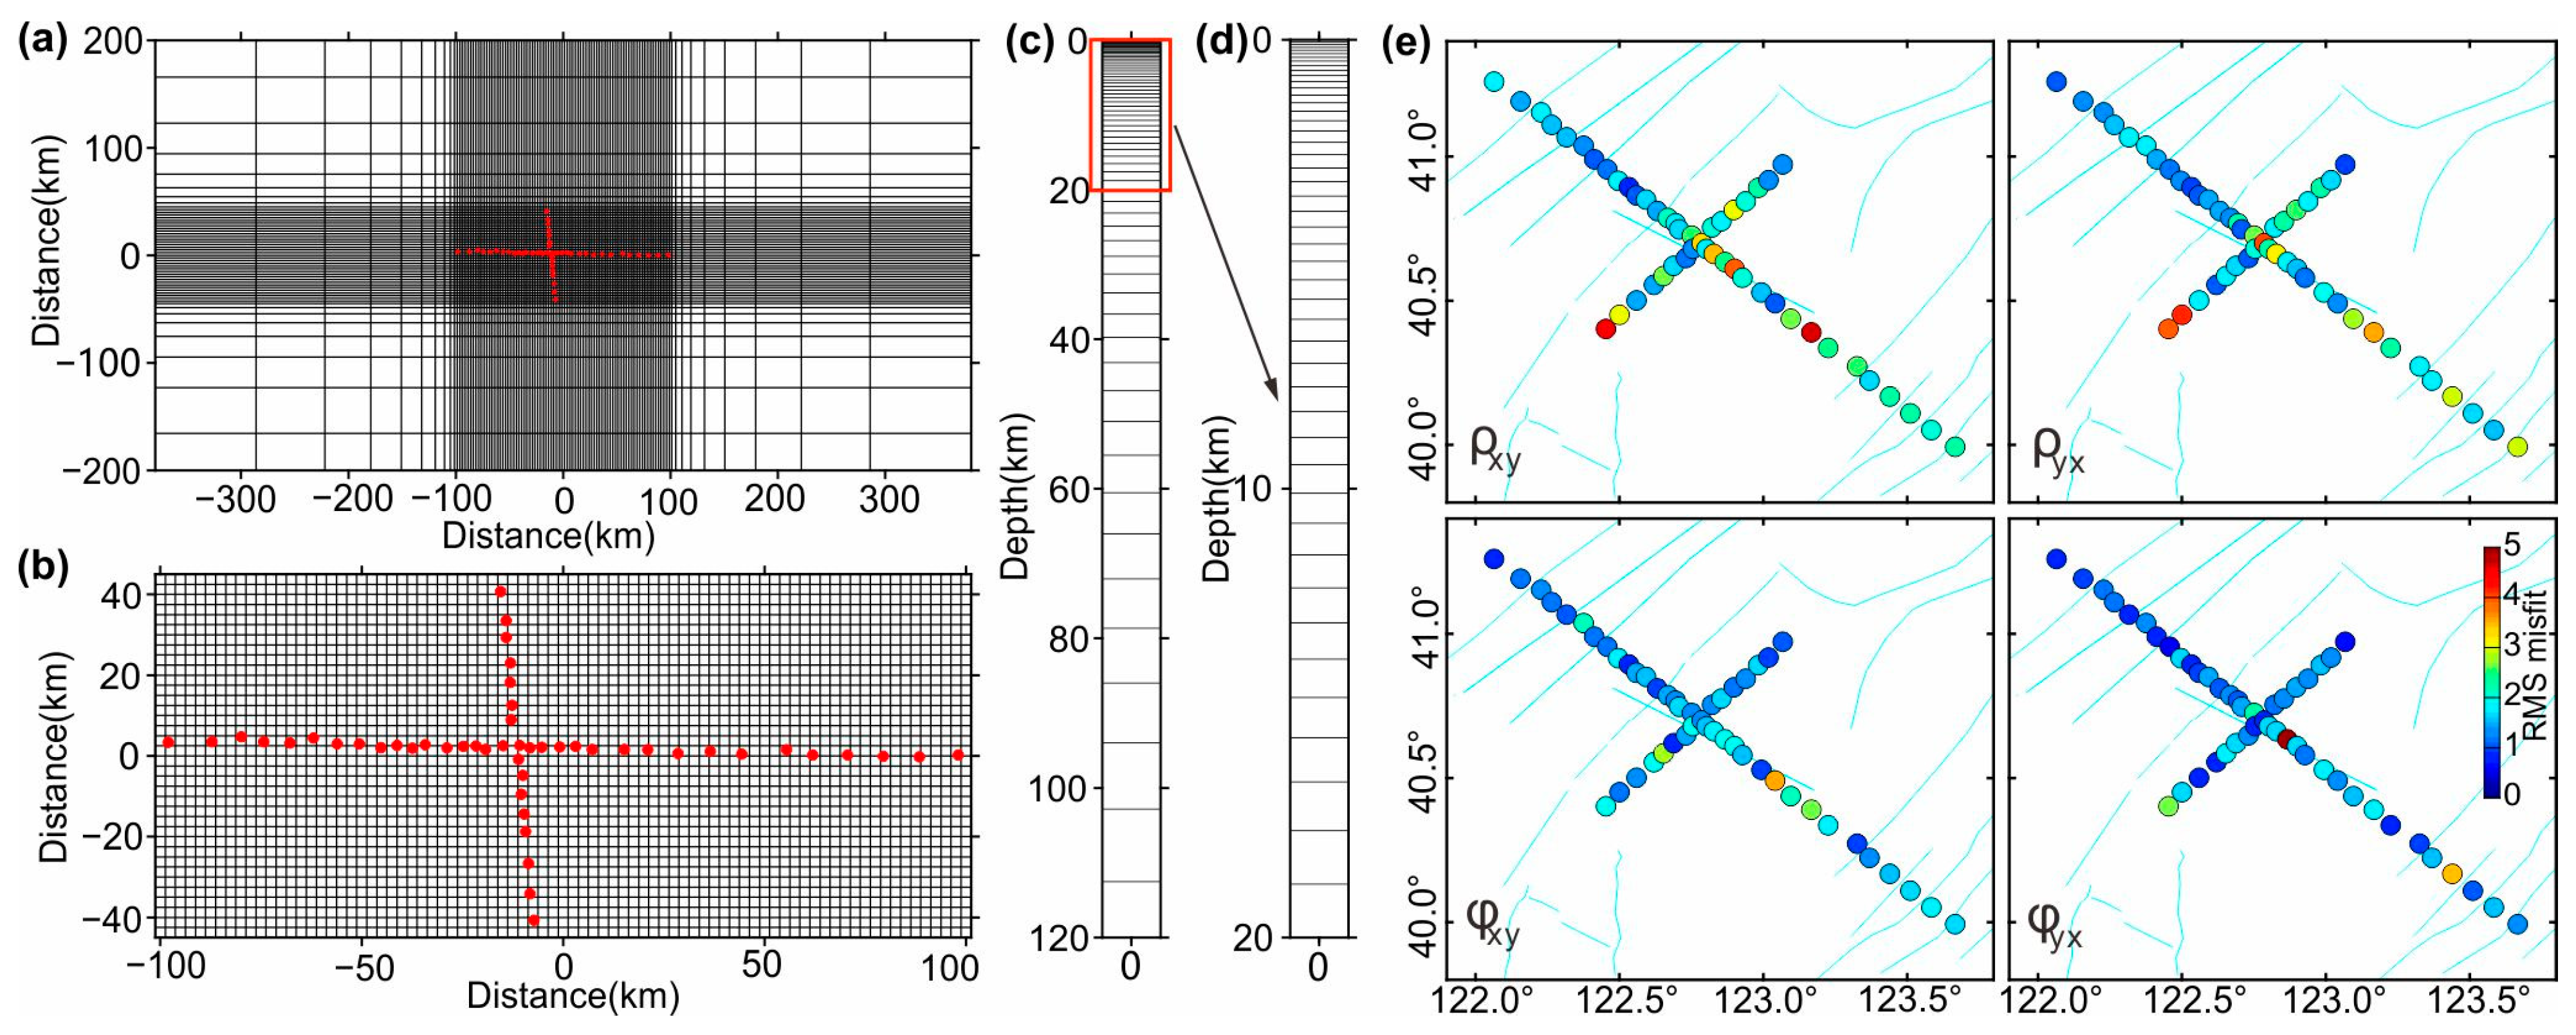
The phase tensor dimensionality analysis indicates that the Haicheng earthquake area is characterized by strong three-dimensionality. Accordingly, a 3D MT inversion method was employed to resolve the deep electrical structure [21,49]. Before inversion, frequency points strongly affected by noise were identified, and their error levels were increased to reduce their influence on the inversion [50]. During the 3D inversion, the model grid was rotated by −45°, which reduced the total number of grid cells and improved computational efficiency [51,52]. Model discretization included both horizontal and vertical grids. In the central area, the horizontal grid spacing was 2.5 km × 2.5 km, with 34 cells in the X direction and 79 cells in the Y direction. The core area was extended outward by 10 padding cells, with grid spacing increasing by a factor of 1.5. Because topographic relief in the study area is limited, topography was not included in the inversion. In the vertical direction, the initial layer thickness was 50 m, and layer thickness increased with depth using different growth factors: 1.1 for 0–2.5 km, 1.05 for 2.5–15 km, 1.1 for 15–150 km, and 1.2 for 150–800 km. A total of 87 vertical layers were used. The schematic diagram of the model discretization is shown in Figure 3. A total of 39 frequency points in the range of 320–0.000137 Hz from 49 sites along profiles L1 and L2 were selected, and both apparent resistivity and impedance phase data were used for inversion. The initial model was a homogeneous half-space with a resistivity of 100 Ω·m. The error floors were set to 10% for apparent resistivity and 2.84° for impedance phase. An automatic updating strategy was adopted for the regularization parameter during inversion. The initial regularization parameter was set to 5000, and the inversion was terminated when this value decreased to less than 10−8. The smoothing factors in the three directions were all set to 0.3. After 86 iterations, the final RMS misfit reached 1.86 (Figure 3, Figures S12 and S13). The fitting curves between the observed apparent resistivity and impedance phase data and the responses from the 3D inversion are presented in Supplementary Material Figure S2. We conducted sensitivity tests for the key anomalous bodies. The testing procedures and results are shown in Supplementary Figures S3–S9-2.

5. Results and Discussion

5.1. Deep Electrical Structure of the Study Region

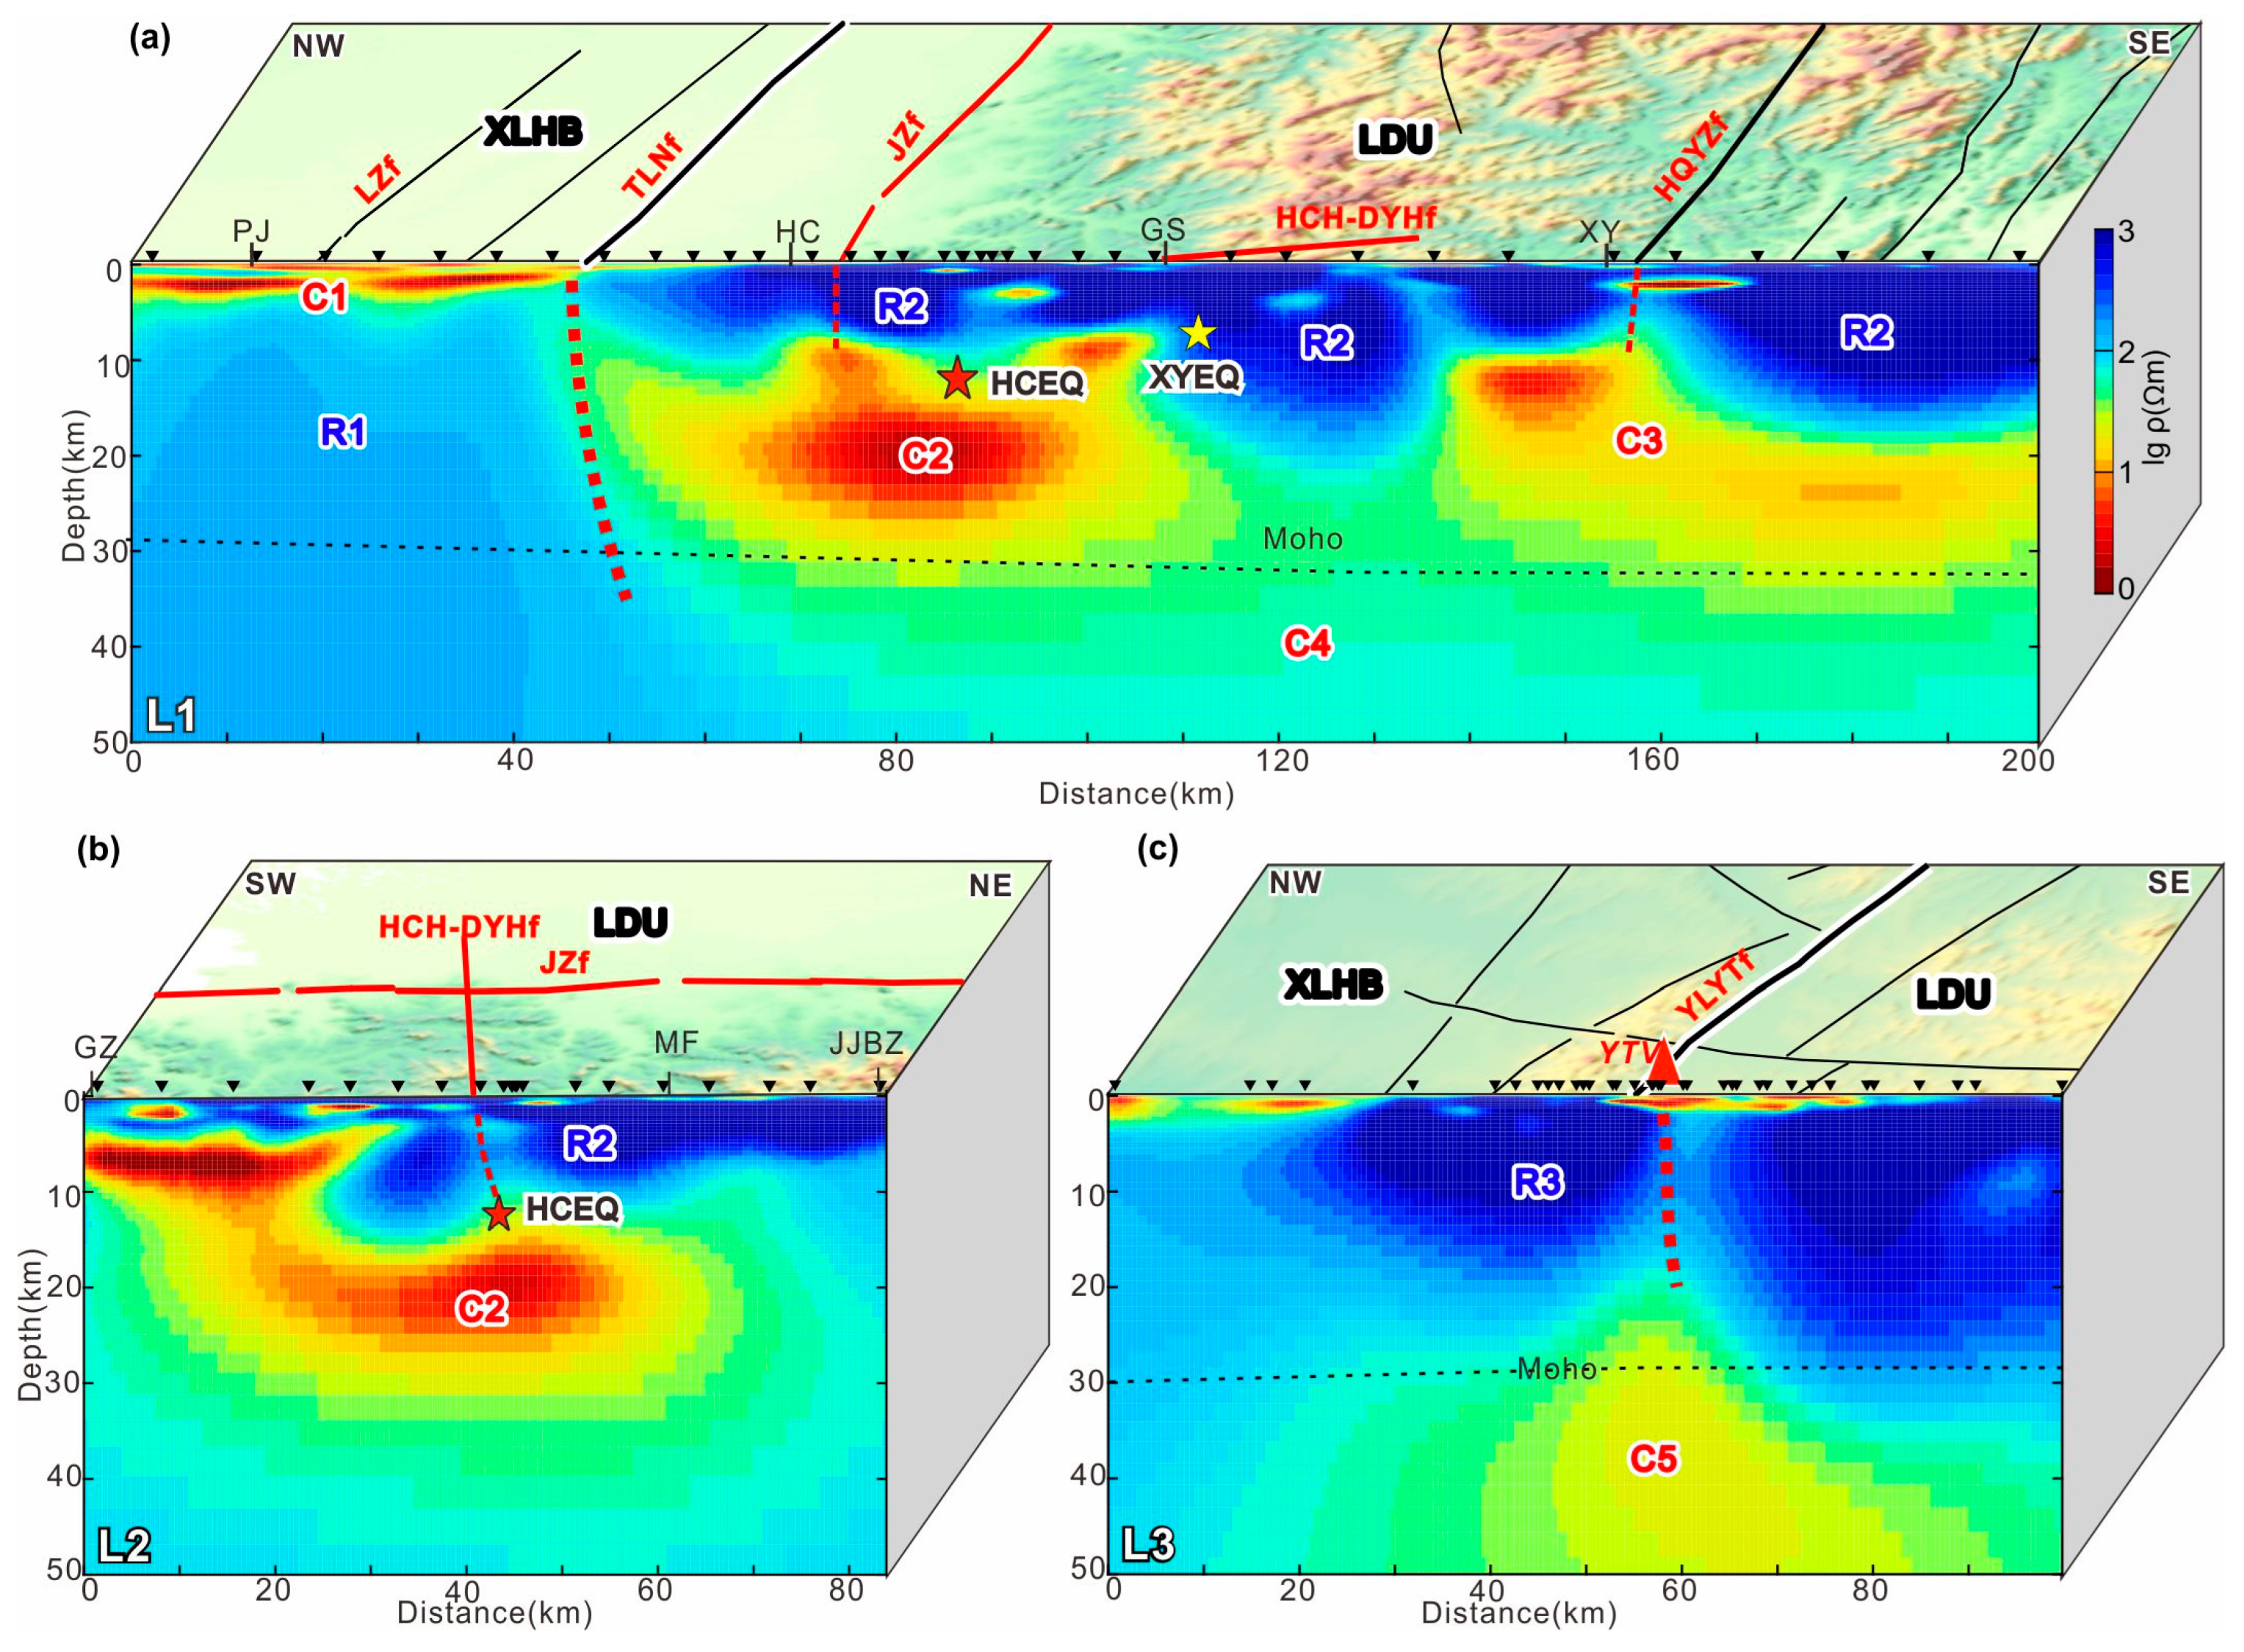
Figure 4a,b shows the deep electrical structure models crossing the Haicheng earthquake region, forming a cross-shaped configuration. Figure 4c presents the deep electrical structure model across the Yilan segment of the Yilan–Yitong fault [53]. The Moho depth in the study area varies from east to west, with a thicker crust beneath the LDU and a thinner crust beneath the XLHB. The Moho is located at a depth of approximately 32 km beneath the LDU and about 28 km beneath the XLHB [14].
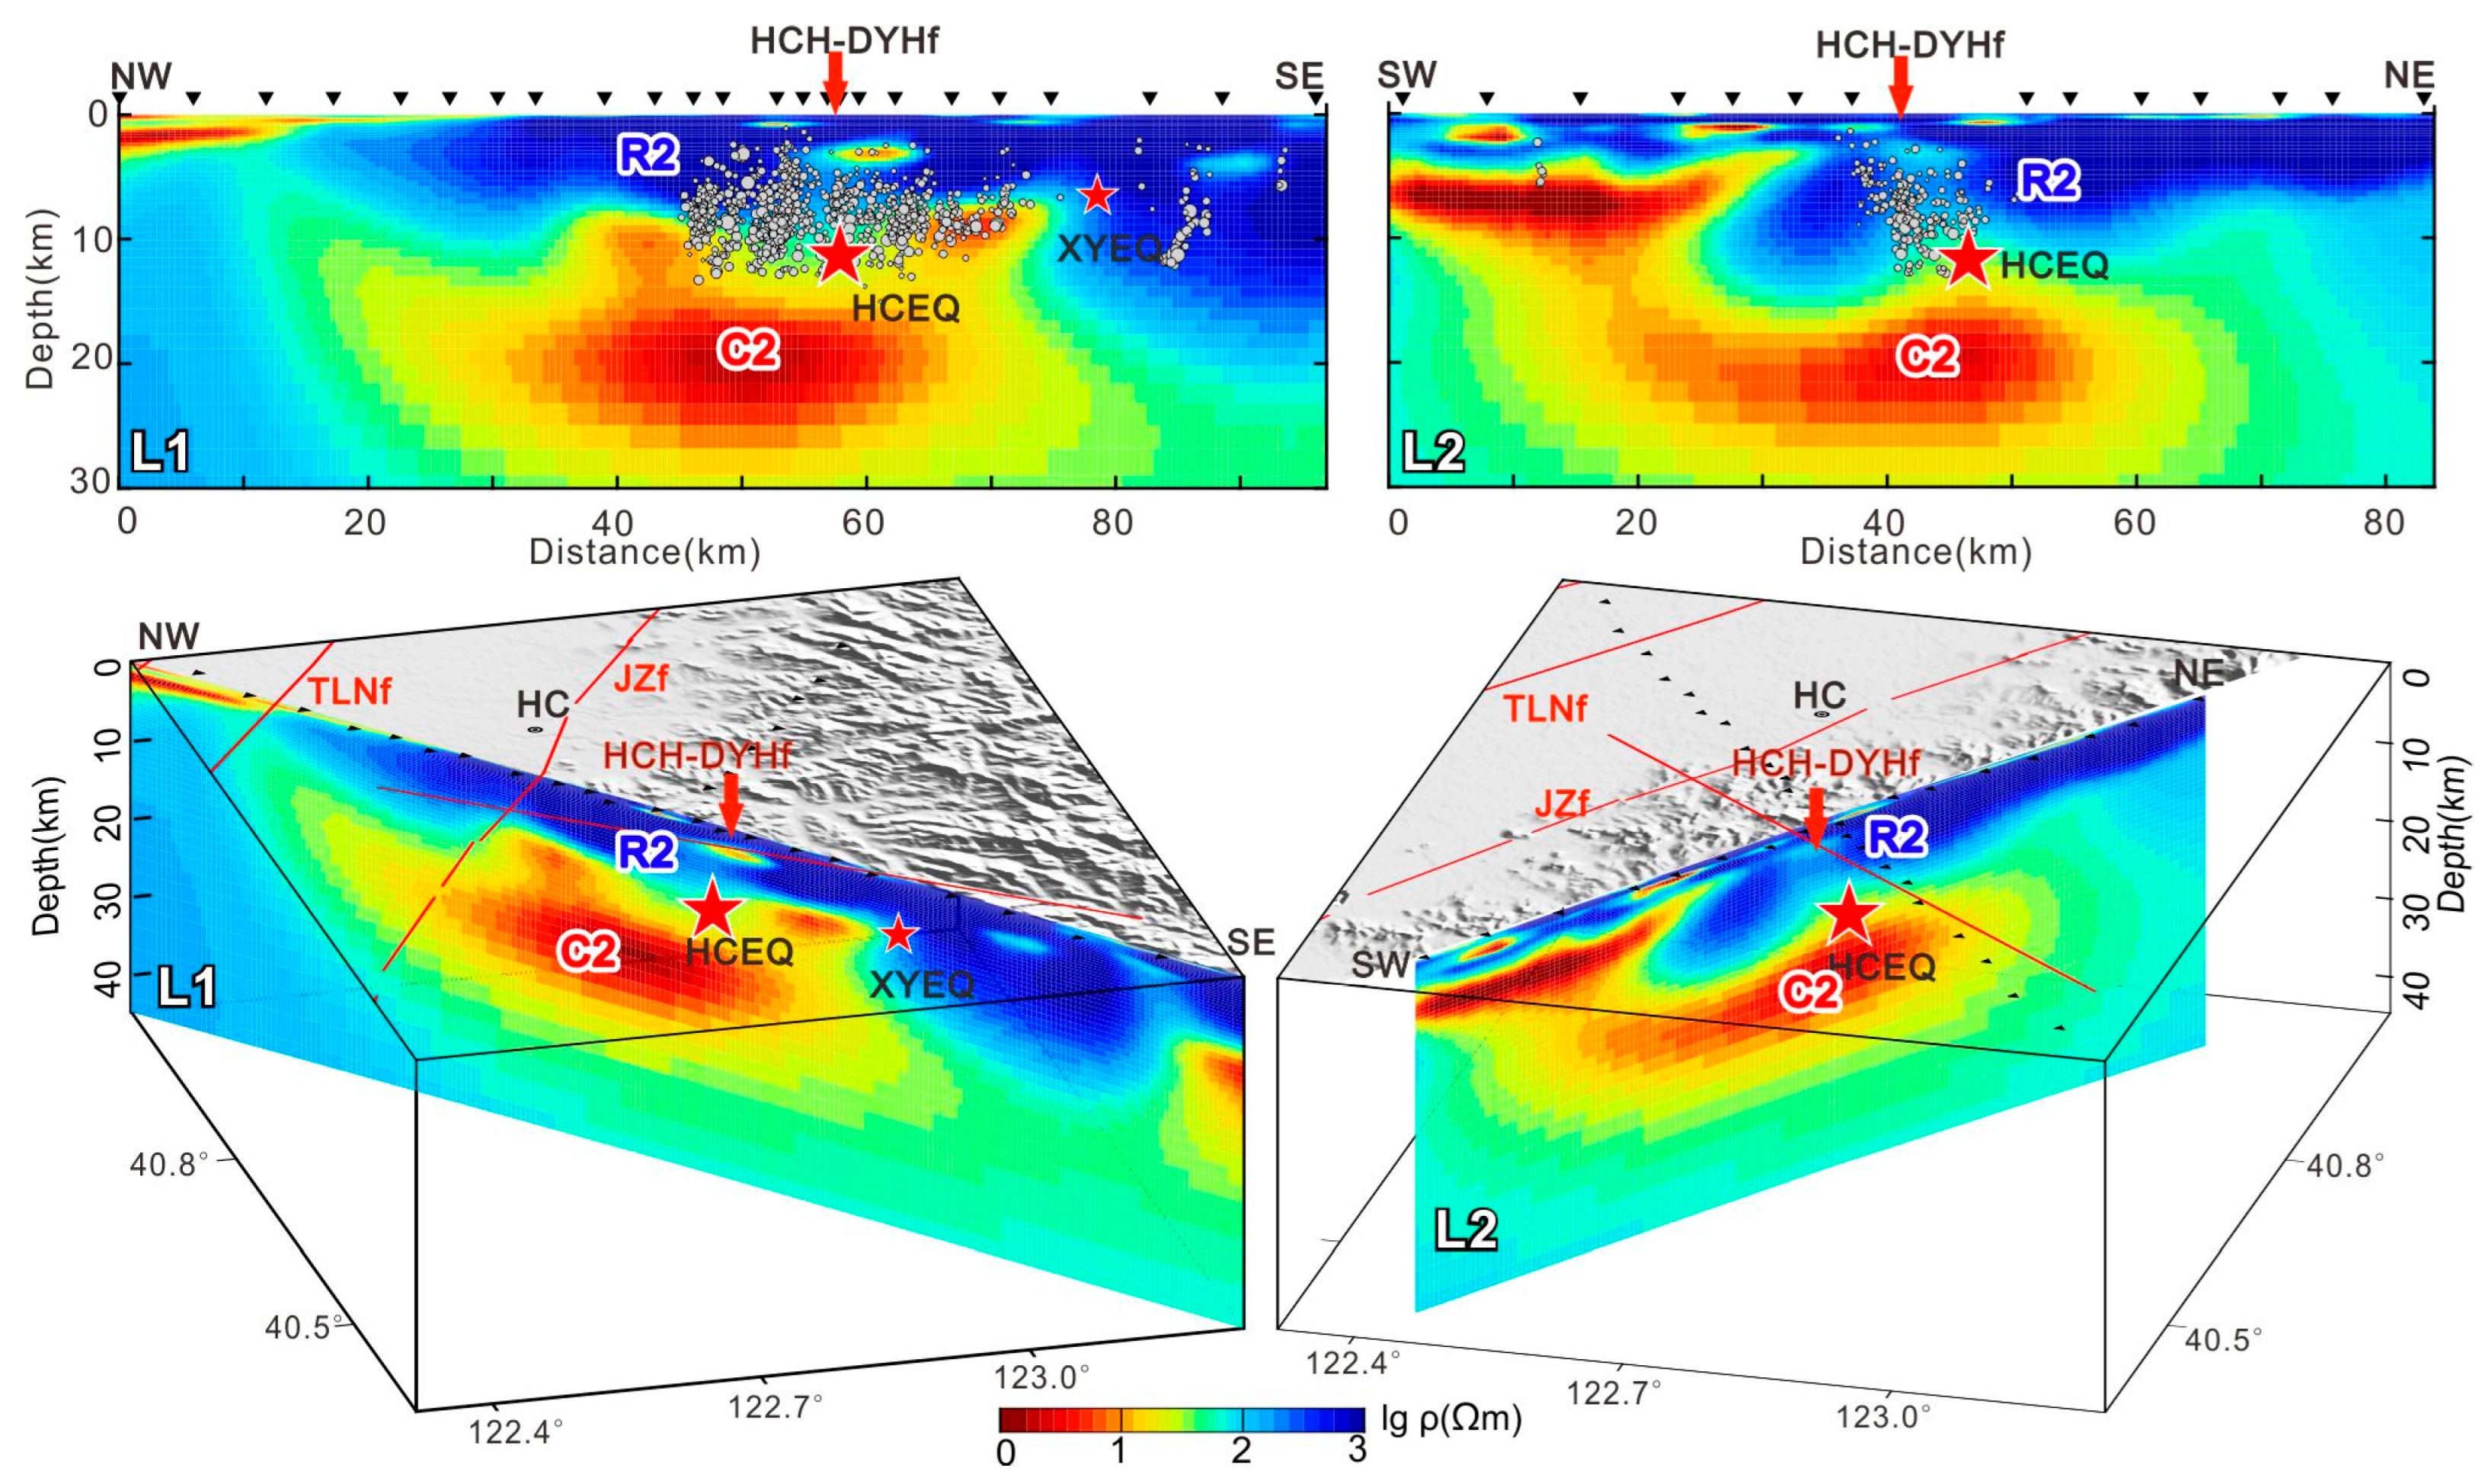
Figure 4a shows the deep electrical structure along the NW-SE-trending profile L1 and clearly reveals pronounced lateral contrasts between the XLHB and the LDU. The TLNf, which is concealed beneath Cenozoic strata, acts as a major boundary fault and is expressed as a near-vertical electrical discontinuity. On the northwestern side of this fault, within the XLHB, a low-resistivity layer (C1) extends from the surface to a depth of approximately 3–4 km and corresponds to the Cenozoic sedimentary cover. Below about 4 km, the middle crust is characterized by a high-resistivity structure (R1) that extends downward to the Moho. In contrast, on the northeastern side within the LDU, the upper crust at depths of 0–9 km exhibits a high-resistivity structure (R2), consistent with the widespread exposure of Precambrian metamorphic rocks and Mesozoic granites. At depths of 9–24 km, a low-resistivity layer is developed, with a strongly undulating top interface. Beneath the Haicheng earthquake area (C2) and the HQYZf (C3), this layer occurs at relatively shallow depths and generally has resistivity values lower than 10 Ω·m. The low-resistivity layer also shows a tendency to extend downward to below the Moho (C4). Within the LDU, the JZf is expressed only as an electrical contrast within the upper crust, whereas the resistivity structure beneath the HQYZf is more heterogeneous and exhibits transitional low-resistivity characteristics. Profile L2, which trends NE-SW within the LDU, crosses the NW-trending HCH-DYHf, and this fault is expressed as an electrical discontinuity zone. A shallow low-resistivity anomaly at 0–20 km distance and around 5 km depth may be connected with the deeper C2 conductor, suggesting a possible local upward extension of C2 toward shallower levels. Spatially, the fault corresponds to an upward bulge in the top interface of the underlying crustal low-resistivity layer (C2) (Figure 4b).
Approximately 350 km northeast of the Haicheng earthquake region, along the Yilan segment of the YLYTf (Figure 1b), Cao [53] conducted a 3D MT investigation of this fault segment and the adjacent Yitong volcanic field (Figure 4c). The results indicate that the YLYTf is expressed as an electrical discontinuity within a high-resistivity domain and separates a laterally continuous high-resistivity structure (R3) that extends from the surface to a depth of approximately 25 km. Below this depth, a prominent low-resistivity body (C5) extends to depths greater than 70 km and is interpreted as an alkaline basaltic magmatic system derived from the asthenosphere. Cao [53] further illustrated the geometry and depth variation of C5 using multiple horizontal resistivity slices, showing that this conductor is spatially continuous and becomes more pronounced in the middle–lower crust and uppermost mantle. In the lower crust, the YLYTf is directly connected to this magmatic system, suggesting that the fault serves as a major pathway for magma ascent.
In the LDU, the low-resistivity layers are mainly developed in the middle to lower crust, whereas in the Yitong and Longgang volcanic areas of the JHOB (Jilin–Heilongjiang Orogenic Belt), they extend from the lower crust into the upper mantle. The contrast in the occurrence depth of low-resistivity layers between the Haicheng earthquake region within the LDU and the volcanic regions of the JHOB may provide a useful geophysical constraint for comparing the deep structures of the North China Craton and the Xing’an–Mongolian Orogenic Belt.

5.2. Physical Properties of the Seismogenic Medium and Seismogenic Structure of the Haicheng Ms 7.3 Earthquake

The focal depth of the 1975 Haicheng Ms 7.3 mainshock was approximately 12 km [3], and no clear surface rupture was identified during post-earthquake geological investigations [2]. The aftershock sequence shows pronounced clustering and directional distribution, extending approximately 35 km in the NW-SE direction and about 16 km in the SW-NE direction [54]. Aftershock activity persisted for several decades, and two moderate earthquakes, with magnitudes of Ms 5.4 and Ms 5.5, occurred near Xiuyan in 1999 and 2000 at focal depths of 8 and 9 km, respectively [4].
Figure 5 presents the shallow electrical structure (<30 km) along the L1 and L2 profiles across the Haicheng earthquake region, together with a 3D visualization (A 3D fence-style visualization of the intersecting resistivity profiles is provided in Supplementary Figure S10). The epicenters of the Haicheng mainshock, the 1999 and 2000 Xiuyan earthquakes (shown in Figure 1c), and the precisely relocated microseismic events recorded during 2016–2022 [54] are projected onto the electrical structural models. For the L1 profile, microseismic events within ±10 km of the profile are selected, whereas for the L2 profile, only events within ±3 km are included. The L1 profile reveals a synform low-resistivity layer (C2) in the middle crust beneath the Haicheng earthquake region. The mainshock hypocenter is located at the interface between this low-resistivity layer (C2) and the overlying high-resistivity body (R2) in the upper crust. The aftershock sequence is mainly distributed above a depth of approximately 12 km and is concentrated along the interface between C2 and R2. The 1999 and 2000 Xiuyan earthquakes occurred near the shallow southeastern termination of the C2 layer, where it comes into contact with the high-resistivity body R2. The L2 profile further indicates that the HCH-DYHf is expressed as a steep-dipping, crust-penetrating electrical boundary zone directly connected to the crustal low-resistivity layer (C2).
The crustal low-resistivity body C2 beneath the Haicheng earthquake region is spatially consistent, within the limits of different model resolutions, with the low-velocity and high-Vp/Vs anomaly reported by previous seismic studies [15,19]. Therefore, C2 is interpreted as a possible fluid-rich zone rather than a direct result solely constrained by the MT data. This zone is also associated with relatively high temperatures of 500–600 °C and low densities [5,55]. In addition, carbon dioxide isotopic compositions of hot springs along the TLNf and in the surrounding areas indicate that the groundwater contains a deep fluid component, thereby confirming the presence of deep-seated fluids and their upward migration [56]. The direction of crustal movement in the Tanlu fault and adjacent regions differs from that of the maximum horizontal principal stress. Regional GPS velocities are nearly perpendicular to the fault strike, whereas the maximum horizontal compressive stress is oriented approximately N80°E [57,58]. Under this stress regime, the NW-trending HCH-DYHf is more susceptible to rupture than the major NE-trending faults and serves as a conduit for the upward migration and accumulation of deep fluids. During ascent, these fluids are impeded by overlying high-resistivity bodies and consequently accumulate along the interfaces between high- and low-resistivity units, where dense microseismicity is observed. The Haicheng mainshock occurred at the contact between the axis of the synform low-resistivity layer (C2) and the overlying high-resistivity body.
MT imaging further reveals the spatial distribution of crustal low-resistivity layers and identifies the HCH-DYHf as a conductive anomaly zone. These observations support the interpretation that the upward migration of crustal fluids is a key deep controlling factor for frequent foreshock activity, spatiotemporal variations in groundwater anomalies, aftershock clustering, and the distribution of seismic intensity [1,59,60,61]. The L1 profile further shows that the crustal low-resistivity layer C2 tends to extend southeastward, indicating favorable deep conditions for the occurrence of moderate earthquakes. This suggests that earthquakes of approximately magnitude 5 may still occur in this region in the future [5].

5.3. Deep Seismogenic Environment and Geodynamic Mechanisms of Strong Earthquakes and Volcanism in Northeast China

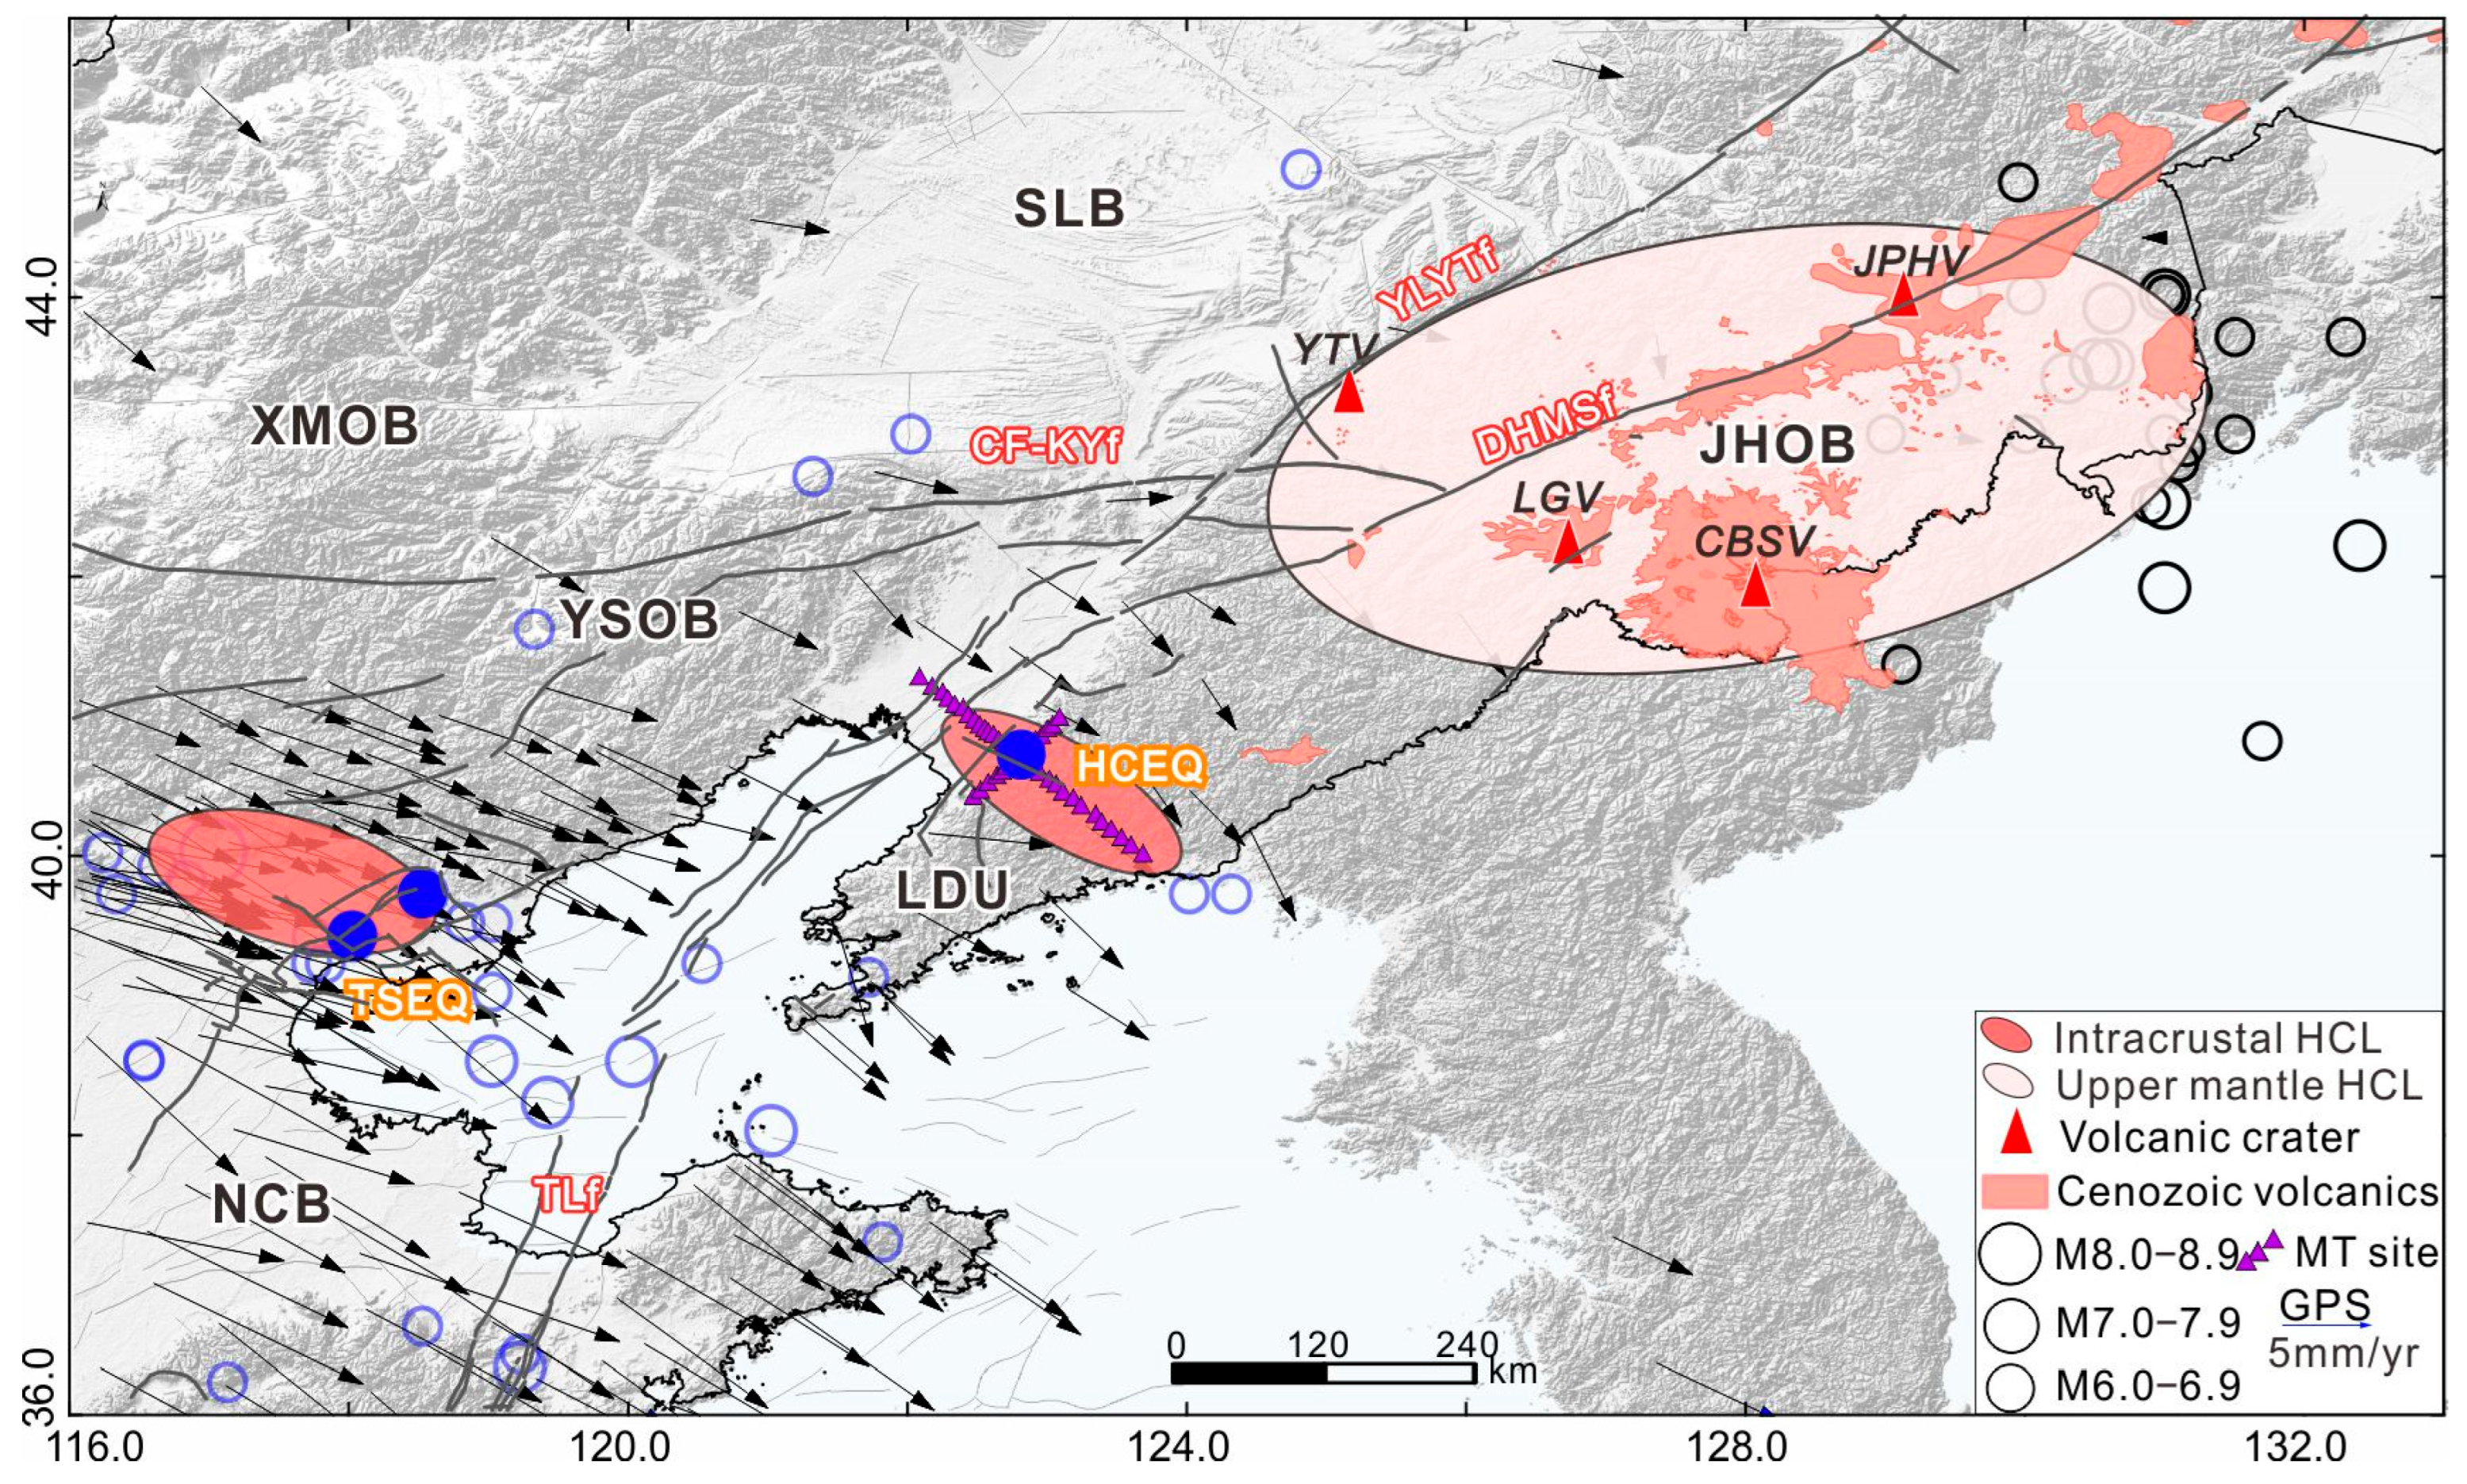
Figure 6 illustrates the tectonic subdivisions of northeastern China [62], together with GPS velocities [58] and the spatial distribution of historical strong earthquakes, volcanoes, and Cenozoic volcanic rocks [63]. As shown in Figure 6, the LDU is characterized by frequent historical strong earthquakes, most of which are shallow-focus events. GPS observations further indicate rapid southeastward extrusion of crustal materials, with velocities of up to approximately 4.0 mm/yr. The MT results of this study reveal a crustal low-resistivity layer beneath the 1975 Haicheng earthquake area. Similar crustal low-resistivity layers have also been identified in the regions of the 1976 Tangshan Ms 7.8 earthquake and the Luanxian Ms 7.1 earthquake [35,64]. Previous global and regional mantle tomography studies have revealed high-velocity anomalies associated with the subducting Pacific slab beneath East Asia and northeastern China, indicating that Pacific Plate subduction provides an important deep geodynamic background for lithospheric modification, intraplate volcanism, and seismicity in this region [65,66]. From a geodynamic perspective, strong earthquakes in this region are mainly controlled by near E-W horizontal compression superimposed on extensional deformation related to the upwelling of deep thermal materials induced by Pacific Plate subduction. The destruction of the North China Craton is a key tectonic event that contributed to the present earthquake-prone setting of North China. Geological, geophysical, and geochemical evidence indicate that the eastern North China Craton, which had a thick lithosphere of approximately 200–250 km during the Paleozoic–Triassic, has been transformed into a thinned, hot, juvenile, fertile, and isotopically depleted lithosphere with non-cratonic characteristics. Its present lithospheric thickness is generally estimated to be approximately 70–80 km, and it is characterized by high heat flow, frequent earthquakes, and widespread basin development [67,68]. This process has contributed to the destruction of the North China Craton and to the development of a conjugate fault system under regional extension. Deep fluids ascend along fault zones and accumulate in the middle crust, where fluid reservoirs are formed. These fluids may then migrate episodically upward through extensional step-over zones, reducing the effective normal stress on faults and thereby promoting foreshock clustering [69]. Continued fluid migration and stress adjustment ultimately lead to mainshock rupture. After the mainshock, the fault system remains in a “fault-valve” state, which sustains long-term aftershock activity [35,54]. This fluid-induced fault reactivation mechanism provides a plausible explanation for the nucleation process of the Haicheng earthquake.
In the JHOB, GPS velocities are significantly lower than those in the LDU, reaching only approximately 1.0 mm/yr [58]. Extensive basaltic lava fields and numerous volcanoes are distributed southeast of the YLYTf, and clusters of deep-focus earthquakes occur in the Jingpohu volcanic region to the southeast. MT studies indicate that the low-resistivity layers beneath these volcanic fields are mainly confined to the base of the lower crust and the top of the upper mantle. This feature is generally interpreted as evidence of mantle-derived magmatic activity and/or associated saline aqueous fluids or brines derived from magmatic processes, in which thermal weakening and strain accommodation reduce stress accumulation along faults and thus inhibit the occurrence of shallow strong earthquakes [40,53,70,71,72].
The marked contrast in the depth distribution of low-resistivity layers between the Haicheng earthquake region within the LDU and the volcanic regions of the JHOB, such as Yitong and Longgang, constitutes a key geophysical indicator for distinguishing the deep structures of the North China Craton and the Xing’an–Mongolian Orogenic Belt. In the LDU, low-resistivity layers are mainly developed within the middle-lower crust, whereas in the JHOB they extend from the base of the lower crust into the upper mantle. The crustal conductive layer beneath the LDU likely represents a mechanically weak zone formed by magma underplating and fluid release during the destruction of the North China Craton. The occurrence of the Haicheng earthquake above this layer suggests that it functions as a brittle-ductile transition zone controlling earthquake nucleation. This feature reflects a crust-dominated thermal regime, in which post-reactivation thermal perturbations are largely confined to the crust, and the contribution of mantle heat is relatively limited. In contrast, the conductive layers extending from the lower crust into the upper mantle beneath the JHOB correspond to mantle-derived partial melts and associated thermal pathways related to Cenozoic intraplate volcanism, such as that in the Longgang and Yitong areas. These features define a mantle-channel system that indicates post-orogenic reactivation and strong lithosphere-asthenosphere thermal coupling. Therefore, differences in the depth extent of low-resistivity layers may fundamentally record two distinct geodynamic processes: the LDU reflects intracrustal residual thermal effects associated with craton destruction, whereas the JHOB records active mantle upwelling and intraplate volcanism. This contrast in electrical structure provides important constraints on the regional lithospheric thermal state, seismicity, and volcanic hazard assessment.

6. Conclusions

A 3D MT imaging study was conducted to investigate the conjugate fault system and seismogenic structure in the 1975 Haicheng earthquake region. Two deep electrical structure models were constructed along the NW-SE and NE-SW profiles crossing the epicenter. The results indicate that the TLNf represents a major lithospheric-scale fault. On its southeastern side, the LDU is characterized by a mid-crustal low-resistivity layer. Beneath the Haicheng source region, a synform low-resistivity body is identified within the middle crust. The mainshock hypocenter and aftershock sequence are concentrated along the contact zone between this low-resistivity body and the overlying high-resistivity upper crust. The HCH-DYHf is expressed as a conductive anomaly connected to the crustal low-resistivity layer, forming a key pathway for the upward migration of deep fluids. This fluid migration system likely constitutes the deep controlling factor for frequent foreshock activity, spatiotemporal groundwater anomalies, aftershock clustering, and the distribution of seismic intensity during the Haicheng earthquake. The NW-SE profile further reveals that the crustal low-resistivity layer tends to extend southeastward, indicating favorable deep conditions for the occurrence of future moderate-to-strong earthquakes in this region.
Pacific Plate subduction promotes the migration and accumulation of deep fluids along fault zones. These fluids not only modify the physical properties of crustal materials but also alter the effective stress field, thereby controlling the nucleation and occurrence of strong earthquakes. This fluid-induced fault reactivation mechanism provides a plausible explanation for the Haicheng earthquake and offers new insight into the genesis of intraplate earthquakes. In addition, comparison with volcanic regions such as Yitong and Longgang reveals that the low-resistivity layers there extend from the lower crust into the upper mantle. The contrast in the depth distribution of conductive layers reflects two distinct geodynamic processes: the LDU records intracrustal residual thermal effects associated with craton destruction, whereas the JHOB records active mantle upwelling and intraplate volcanism. This contrast in electrical structure provides important constraints on the regional lithospheric thermal regime, seismicity, and volcanic hazard assessment. Future studies should focus on high-resolution imaging of deep structures and on tracing fluid sources and migration pathways, so as to improve understanding of the deep seismogenic environment of intraplate earthquakes and the magma supply systems beneath volcanic regions in northeastern China.

Supplementary Materials

The following supporting information can be downloaded at: https://www.mdpi.com/article/10.3390/rs18121993/s1, Figure S1: Remote reference processing and data quality comparison for MT data in the Haicheng earthquake area. Figure S2: Comparison between the observed apparent resistivity and impedance phase data at all sites and the corresponding responses from the 3D inversion. Figure S3: Locations of the selected electrical anomalies for sensitivity tests. Figure S4: Sensitivity test results for the C1 shallow conductor. Figure S5-1: Sensitivity test results for the C2 mid-crustal conductor near the Haicheng source region. Figure S5-2: Sensitivity test results for the C2 mid-crustal conductor near the Haicheng source region. Figure S6: Sensitivity test results for the C3 deep conductive anomaly. Figure S7: Sensitivity test results for the R1 resistive body. Figure S8: Depth sensitivity test results for structures below 50 km. Figure S9-1: Results of the frequency cut-off sensitivity test. Figure S9-2: Comparison between the full-frequency inversion model and the frequency cut-off inversion model excluding long-period data. Figure S10: Three-dimensional fence diagram of the electrical resistivity structure across the Haicheng earthquake region. Figure S11: Comparison between the MT resistivity model and previously published seismic velocity structures beneath the Haicheng earthquake region. Figure S12: Observed and calculated MT response pseudosections for profiles L1 and L2. Figure S13: Histogram of normalized residuals for all inverted data.

Author Contributions

Conceptualization, Y.Z.; software, X.L. (Xiaoyu Lou); investigation, Z.Z., X.J., Q.S., Y.L., and M.J.; resources, Z.Z. and Y.Z.; data curation, Z.Z., M.J. and X.L. (Xiaoyu Lou); writing—original draft preparation, Y.Z., X.L. (Xiaoyu Lou), Z.X., Z.H., X.L. (Xuehua Liu) and L.Z.; writing—review and editing, Y.Z.; visualization, X.L. (Xiaoyu Lou) and Z.X.; supervision, X.J., Q.S., Y.L., and M.J.; funding acquisition, Z.Z., X.J., and Y.Z. All authors have read and agreed to the published version of the manuscript.

Funding

This study was jointly supported by the Earthquake Science and Technology Spark Program Project (XH24006YA), the Liaoning Provincial Science and Technology Program (2025JH4/480000004), and the Science &Technology Fundamental Resources Investigation Program (2023FY101500).

Data Availability Statement

The data can be obtained from the authors upon request.

Acknowledgments

The 3D electromagnetic imaging inversion was performed on the supercomputing platform of the Institute of Geology, China Earthquake Administration. Some figures in this paper were prepared using GMT 5.4 [73]. We are grateful to Lei Xinglin for providing the relocated Haicheng earthquake data.

Conflicts of Interest

The authors declare no conflicts of interest.

References

  1. Jiao, M.R.; Yang, S.C.; Wang, X.L. A retrospective on the prediction process and its implications: Commemorating the 50th anniversary of the successful prediction of the 1975 Haicheng M 7.3 earthquake. Earthquake 2025, 45, 199–221. [Google Scholar]
  2. Deng, Q.D.; Wang, T.M.; Li, J.G.; Xiang, H.F.; Cheng, S.P. A discussion on source model of Haicheng earthquake. Sci. Geol. Sin. 1976, 3, 195–204. [Google Scholar]
  3. Gu, H.D.; Chen, Y.T.; Gao, X.L.; Zhao, Y. Focal mechanism of Haicheng, Liaoning Province, earthquake of February 4, 1975. Acta Geophys. Sin. 1976, 19, 270–285. [Google Scholar]
  4. Guo, X.Y.; Chen, X.Z.; Li, Y.E.; Wei, Y.G.; Chen, L.J. Significance test of focal mechanism consistency: Taking the foreshock sequence of the MS 5.4 Xiuyan earthquake on November 29, 1999 as an example. Acta Seismol. Sin. 2019, 41, 709–722. [Google Scholar] [CrossRef]
  5. Gao, C.B.; Zhong, Y.Z. Geological Background and Seismogenic Fault of the Haicheng-Xiuyan M 5.6 Earthquake of November 29, 1999. Seismol. Geol. 2000, 22, 405–412. [Google Scholar]
  6. Lu, Z.X. Progress of geophysical prospecting study on the deep structure of Haicheng earthquake area. Earthq. Res. China 1985, 1, 56–65. [Google Scholar]
  7. Lu, Z.X.; Liu, G.D.; Wei, M.H.; Meng, P.Z.; Zhao, J.M. Lateral inhomogeneity of crust and upper mantle in south Liaoning, China and its relationship with the M 7.3 Haicheng earthquake. Acta Seismol. Sin. 1990, 12, 367–378. [Google Scholar]
  8. Lu, L.Y.; Li, P.; Pan, K.; Lu, Z.X.; Xu, X.T. Mechanical analysis of source environment for the Haicheng M 7.3 earthquake. Seismol. Geol. 1997, 19, 141–147. [Google Scholar]
  9. Zheng, Q.; Liu, C.; Tian, Y.; Zhu, H.X. Seismic imaging of the middle and upper crust by double-difference tomography: The Haicheng earthquake (MS 7.3) in Liaoning Province. Appl. Geophys. 2018, 15, 125–136. [Google Scholar] [CrossRef]
  10. Wang, L.; Jiao, M.R.; Qian, R.; Zhang, B.; Yang, S.C.; Shao, Y.Y. Crustal velocity structure beneath the southern Liaoning Province derived from double difference tomography. Seismol. Geol. 2022, 44, 378–394. [Google Scholar]
  11. Zhang, P.; Dai, Z.; Yang, S.; Zha, X. Seismogenic structure of the hidden Haicheng fault system in China revealed by seismic observations from 2008 to 2018. Bull. Seismol. Soc. Am. 2023, 113, 2447–2460. [Google Scholar] [CrossRef]
  12. Sun, Q.S.; Bai, L.S.; Wang, L.; Wang, J.Y.; Yang, S.C.; Li, E.L. Fault structures of the Haichenghe fault zone in Liaoning, China from high-precision location based on dense array observation. J. Seismol. 2024, 28, 1293–1307. [Google Scholar] [CrossRef]
  13. Liu, J.X.; Pei, S.P.; Guo, Y.C. High-resolution tomography of P-wave velocity structures in the Haicheng region: Implications for the seismogenesis of the 1975 M 7.3 Haicheng earthquake. Earthq. Sci. 2025, 38, 590–600. [Google Scholar] [CrossRef]
  14. Shao, Y.Y.; Bai, L.S.; Liu, J.D.; Sun, Q.S.; Zhang, R.Q.; Wang, L.; Jiao, M.R.; Jia, L.H.; Wu, Q.J. High-resolution crustal structure of Haicheng seismic zone in Liaoning, inferred from teleseismic receiver functions of dense array. Chin. J. Geophys. 2025, 68, 517–530. [Google Scholar]
  15. Yan, D.; Tian, Y.; Liu, C.; Song, X. Seismicity and detailed fault zone structure beneath Haicheng seismic zone, NE China: Implications for the fluid-induced fault reactivation. J. Geophys. Res. Solid Earth 2026, 131, e2025JB032942. [Google Scholar] [CrossRef]
  16. Unsworth, M.; Bedrosian, P.A. On the geoelectric structure of major strike-slip faults and shear zones. Earth Planets Space 2004, 56, 1177–1184. [Google Scholar] [CrossRef]
  17. Becken, M.; Ritter, O.; Bedrosian, P.A.; Weckmann, U. Correlation between deep fluids, tremor and creep along the central San Andreas fault. Nature 2011, 480, 87–90. [Google Scholar] [CrossRef] [PubMed]
  18. Zhao, G.Z.; Unsworth, M.J.; Zhan, Y.; Wang, L.F.; Chen, X.B.; Jones, A.G.; Tang, J.; Xiao, Q.B.; Wang, J.J.; Cai, J.T.; et al. Crustal structure and rheology of the Longmenshan and Wenchuan MW 7.9 earthquake epicentral area from magnetotelluric data. Geology 2012, 40, 1139–1142. [Google Scholar] [CrossRef]
  19. Zhan, Y.; Yang, H.; Zhao, G.Z.; Zhao, L.Q.; Sun, X.Y. Deep electrical structure of crust beneath the Madongshan step area at the Haiyuan fault in the northeastern margin of the Tibetan plateau and tectonic implications. Chin. J. Geophys. 2017, 60, 2371–2384. (In Chinese) [Google Scholar] [CrossRef]
  20. Wang, X.B.; Zhang, G.; Zhou, J.; Li, D.W.; Luo, W.; Hu, Y.B.; Cai, X.L.; Guo, Z.M. Crust and upper mantle electrical resistivity structure in the Longmenshan tectonic belt and its relationship with Wenchuan and Lushan earthquakes. Chin. J. Geophys. 2018, 61, 1984–1995. (In Chinese) [Google Scholar] [CrossRef]
  21. Egbert, G.D.; Kelbert, A. Computational recipes for electromagnetic inverse problems. Geophys. J. Int. 2012, 189, 251–267. [Google Scholar] [CrossRef]
  22. Yin, C.C.; Liu, Y.H.; Xiong, B. Status and prospect of 3D inversions in EM geophysic. China Earth Sci. 2020, 63, 452–455. [Google Scholar] [CrossRef]
  23. Zhan, Y.; Zhao, G.Z.; Unsworth, M.; Wang, L.F.; Chen, X.B.; Li, T.; Xiao, Q.B.; Wang, J.J.; Tang, J.; Cai, J.T.; et al. Deep structure beneath the southwestern section of the Longmenshan fault zone and seimogenetic context of the 4.20 Lushan MS 7.0 earthquake. Chin. Sci. Bull. 2013, 58, 3467–3474. [Google Scholar] [CrossRef]
  24. Zhan, Y.; Liang, M.J.; Sun, X.Y.; Huang, F.P.; Zhao, L.Q.; Gong, Y.; Han, J.; Li, C.X.; Zhang, P.Z.; Zhang, H.P. Deep structure and seismogenic pattern of the 2021. 5. 22 Madoi (Qinghai) MS 7.4 earthquake. Chin. J. Geophys. 2021, 64, 2232–2252. (In Chinese) [Google Scholar] [CrossRef]
  25. Zhan, Y.; Sun, X.Y.; Liu, X.H.; Zhao, L.Q.; Li, D.H.; Li, S.; Dong, Z.Y.; Lou, X.Y.; Hao, C.T.; Bao, Y.X. Electrical resistivity structure of the Southeastern part of Bayan Har Block: Insights into the seismogenic environment of 2022 Maerkang earthquake swarm. Tectonophysics 2024, 886, 230425. [Google Scholar] [CrossRef]
  26. Zhan, Y.; Sun, X.Y.; Zhao, G.Z.; Zhao, L.Q.; Yang, X.P.; Yang, H.B.; Jiang, D.W.; Lou, X.Y. Electrical Structure of Southwestern Longmenshan Fault Zone: Insights into Seismogenic Structure of 2013 and 2022 Lushan Earthquakes. Remote Sens. 2024, 16, 370. [Google Scholar] [CrossRef]
  27. Liu, X.H.; Zhan, Y.; Zhao, L.Q.; Sun, X.Y.; Lou, X.Y. Using Resistivity Structure to Study the Seismogenic Mechanism of the 2021 Luxian MS 6.0 Earthquakes. Remote Sens. 2024, 16, 4116. [Google Scholar] [CrossRef]
  28. Zhao, L.Q.; Sun, X.Y.; Zhan, Y.; Yang, H.B.; Wang, Q.L.; Hao, M.; Liu, X.H. The seismogenic model of the Menyuan MS 6.9 earthquake on January 8, 2022, Qinghai Province and segmented extensional characteristics of the Lenglongling fault. Chin. J. Geophys. 2022, 65, 1536–1546. (In Chinese) [Google Scholar] [CrossRef]
  29. Cai, J.T.; Chen, X.B.; Xu, X.W.; Tang, J.; Wang, L.F.; Guo, C.L.; Han, B.; Dong, Z.Y. Rupture mechanism and seismotectonics of the MS 6.5 Ludian earthquake inferred from three-dimensional magnetotelluric imaging. Geophys. Res. Lett. 2017, 44, 1275–1285. [Google Scholar] [CrossRef]
  30. Sun, X.Y.; Zhan, Y.; Unsworth, M.; Egbert, G.; Zhang, H.P.; Chen, X.B.; Zhao, G.Z.; Sun, J.B.; Zhao, L.Q.; Cui, T.F.; et al. 3-D Magnetotelluric imaging of the easternmost Kunlun fault: Insights into strain partitioning and the seismotectonics of the Jiuzhaigou MS7.0 earthquake. J. Geophys. Res. Solid Earth 2020, 125, e2020JB019731. [Google Scholar] [CrossRef]
  31. Ye, T.; Chen, X.B.; Huang, Q.H.; Cui, T.F. Three-dimensional electrical resistivity structure in focal area of the 2021 Yangbi MS 6.4 Earthquake and its implication for the seismogenic mechanism. Chin. J. Geophys. 2021, 64, 2267–2277. (In Chinese) [Google Scholar] [CrossRef]
  32. Lou, X.Y.; Zhan, Y.; Zhao, L.Q.; Yang, H.B.; Zhang, H.P.; Wu, P.H.; Liu, X.H.; Avşar, Ü.; Sun, X.Y. Deep crustal structure and seismogenic environment of the 2023 Jishishan earthquake in the Southeastern Lajishan tectonic belt revealed by three-dimensional magnetotelluric imaging. Tectonophysics 2026, 928, 231150. [Google Scholar] [CrossRef]
  33. Sun, X.Y.; Zhan, Y.; Yang, X.P.; Zhou, Q.; Feng, X.T.; Zhao, L.Q.; Liu, X.H. Electrical structure of the fault system in the Tangyin graben, eastern margin of the Taihangshan uplift, China: Inferences from magnetotelluric imaging. J. Asian Earth Sci. 2023, 258, 105631. [Google Scholar] [CrossRef]
  34. Peng, Y.Q.; Sun, X.Y.; Zhan, Y.; Zhao, L.Q.; Liu, X.H.; Ran, Z.J.; Wang, L.S. 3D deep electrical structure and seismogenic environment in Zhangbei earthquake region. Chin. J. Geophys. 2022, 65, 3464–3480. [Google Scholar] [CrossRef]
  35. Cai, J.T.; Chen, X.B.; Dong, Z.Y.; Zhan, Y.; Liu, Z.Y.; Cui, T.F.; Jiang, F. Three-dimensional electrical structure beneath the epicenter zone and seismogenic setting of the 1976 MS7.8 Tangshan earthquake, China. Geophys. Res. Lett. 2023, 50, e2022GL102291. [Google Scholar] [CrossRef]
  36. Deng, Q.D.; Zhang, P.Z.; Ran, Y.K.; Yang, X.P.; Min, W.; Chen, L.C. Active tectonics and earthquake activities in China. Earth Sci. Front. 2003, 10, 66–73. [Google Scholar]
  37. Zhang, S. Tectonic Characteristics and Evolution History of the Yalujiang Fault Zone and Its Adjacent Areas. Doctoral Dissertation, Hefei University of Technology, Hefei, China, 2020. [Google Scholar]
  38. Wu, K.T. Seismic Fluid Geochemistry in the Anshan-Haicheng Area. Master’s Thesis, China University of Geosciences (Beijing), Beijing, China, 2019. [Google Scholar]
  39. Li, A.; Wan, B.; Wang, X.X.; Ji, H.M.; Suo, R. New evidence of the paleoearthquake rupture in the north Gaizhou-Anshan segment of the Jinzhou Fault. Seismol. Geol. 2023, 45, 111–126. [Google Scholar]
  40. Li, Y.B.; Weng, A.H.; Xu, W.L.; Zou, Z.L.; Tang, Y.; Zhou, Z.K.; Li, S.W.; Zhang, Y.H.; Ventura, G. Translithospheric magma plumbing system of intraplate volcanoes as revealed by electrical resistivity imaging. Geology 2021, 49, 1337–1342. [Google Scholar] [CrossRef]
  41. Cao, F.J.; Jia, L.H.; Li, M.Y.; Wang, S.Y. Activity and Seismic Risk Assessment of Main Faults in Liaoning Area. J. Jilin Univ. (Earth Sci. Ed.) 2021, 51, 286–295. [Google Scholar] [CrossRef]
  42. Gamble, T.D.; Goubau, W.M.; Clarke, J. Magnetotellurics with a remote magnetic reference. Geophysics 1979, 44, 53–68. [Google Scholar] [CrossRef]
  43. Egbert, G.D.; Booker, J.R. Robust estimation of geomagnetic transfer functions. Geophys. J. R. Astron. Soc. 1986, 87, 173–194. [Google Scholar] [CrossRef]
  44. Han, J.; Zhan, Y.; Sun, X.Y.; Zhao, G.Z.; Liu, X.H.; Bao, Y.X.; Sun, J.B.; Peng, Y.Q. Characteristics and processing of magnetotellurie data under strong electromagnetic interference environment. Seismol. Geol. 2022, 44, 736–752. [Google Scholar] [CrossRef]
  45. Heise, W.; Caldwell, T.G.; Bibby, H.M.; Bannister, S.C. Three-dimensional modelling of magnetotelluric data from the Rotokawa geothermal field, Taupo Volcanic Zone, New Zealand. Geophys. J. Int. 2008, 173, 740–750. [Google Scholar] [CrossRef]
  46. Caldwell, T.G.; Bibby, H.M.; Brown, C. The magnetotelluric phase tensor. Geophys. J. Int. 2004, 158, 457–469. [Google Scholar] [CrossRef]
  47. Bibby, H.M.; Caldwell, T.G.; Brown, C. Determinable and non-determinable parameters of galvanic distortion in magnetotellurics. Geophys. J. Int. 2005, 163, 915–930. [Google Scholar] [CrossRef]
  48. Booker, J.R. The magnetotelluric phase tensor: A critical review. Surv. Geophys. 2014, 35, 7–40. [Google Scholar] [CrossRef]
  49. Liu, Z.Y.; Chen, X.B.; Cai, J.T.; Cui, T.F.; Zhao, G.Z.; Tang, J.; Ouyang, B. The design and application of toPeak: A three-dimensional magnetotelluric inversion cloud computing system. Seismol. Geol. 2022, 44, 802–820. [Google Scholar] [CrossRef]
  50. Chen, X.B.; Zhao, G.Z.; Zhan, Y. MT data processing and interpretation Windows visual integrated system. Oil Geophys. Prospect. 2004, 39, 11–16. [Google Scholar]
  51. Tietze, K.; Ritter, O. Three-dimensional magnetotelluric inversion in practice: The electrical conductivity structure of the San Andreas Fault in central California. Geophys. J. Int. 2013, 195, 130–147. [Google Scholar] [CrossRef]
  52. Liu, Z.Y.; Kelbert, A.; Chen, X.B. 3D magnetotelluric inversion with arbitrary data orientation angles. Comput. Geosci. 2024, 188, 105596. [Google Scholar] [CrossRef]
  53. Cao, C.; Zhao, L.Q.; Zhan, Y.; Qi, Y.F.; Sun, X.Y.; Yang, X.; Lv, H.B.; Wang, Q.L.; Hou, B.W.; Qi, W.W. 3D magnetotelluric imaging of lithospheric magmatic systems in the Yitong Volcanic Area, Northeast China: Implications for fault-zone segmentation and seismic rupture dynamics along the Yilan-Yitong Fault. Tectonophysics 2026, 918, 231002. [Google Scholar] [CrossRef]
  54. Lei, X.; Wang, Z.; Ma, S.; He, C. Step-over of strike-slip faults and overpressure fluid favor occurrence of foreshocks: Insights from the 1975 Haicheng fore-main-aftershock sequence, China. Earthq. Res. Adv. 2024, 4, 100237. [Google Scholar] [CrossRef]
  55. Lai, X.L.; Li, S.L.; Sun, Y. Deep Tectonic Background of Three MS > 7.0 Strong Earthquakes in the Bohai Sea and Its Adjacent Region. J. Geod. Geodyn. 2007, 27, 31–34. [Google Scholar]
  56. Shi, H.; Cai, Z. Geochemical characteristics of underground fluids in some active fault zones in China. J. Geophys. Res. 1986, 91, 12282–12290. [Google Scholar] [CrossRef]
  57. Li, J.; Hou, G. Stress development in heterogeneous lithosphere: Insights into earthquake initiation in the Tan-Lu Fault Zone. Tectonophysics 2019, 750, 329–343. [Google Scholar] [CrossRef]
  58. Wang, M.; Shen, Z.K. Present-day crustal deformation of continental China derived from GPS and its tectonic implications. J. Geophys. Res. Solid Earth 2020, 125, e2019JB018774. [Google Scholar] [CrossRef]
  59. Wannamaker, P.E.; Caldwell, T.G.; Jiracek, G.R.; Maris, V.; Hill, G.J.; Ogawa, Y.; Bibby, H.M.; Bennie, S.L.; Heise, W. Fluid and deformation regime of an advancing subduction system at Marlborough, New Zealand. Nature 2009, 460, 733–736. [Google Scholar] [CrossRef] [PubMed]
  60. Kaya-Eken, T.; Ogawa, Y.; Usui, Y.; Kasaya, T.; Tunçer, M.K.; Honkura, Y.; Oshiman, N.; Matsushima, M.; Siripunvaraporn, W. 3-D electromagnetic imaging of highly deformed fluid-rich weak zones and locked section of the North Anatolian fault beneath the Marmara Sea. Geology 2026, 54, 200–204. [Google Scholar] [CrossRef]
  61. Wu, K.T.; Yue, M.S.; Wu, H.Y.; Cao, X.L.; Chen, H.T.; Huang, W.Q.; Tian, K.Y.; Lu, S.D. Certain characteristics of Haicheng earthquake (M = 7.3) sequence. Acta Geophys. Sin. 1976, 19, 270–285. [Google Scholar]
  62. Ren, J.S. A new generation tectonic map of China-Tectonic map of China and adjacent regions (1:5,000,000) with a brief explanation: Chinese tectonics from a global perspective. Acta Geosci. Sin. 2003, 24, 1–2. [Google Scholar]
  63. Fan, Q.C.; Sui, J.L.; Wang, T.H.; Li, N.; Sun, Q. History of volcanic activity, magma evolution and eruptive mechanisms of the Changbai volcanic province. Geol. J. China Univ. 2007, 13, 175–190. [Google Scholar]
  64. Zhang, Y.Y.; Jin, S.; Ye, G.F.; Zhang, H.J.; Wei, W.B.; Dong, H.; Gao, J. Intraplate seismic mechanisms in the Zhangjiakou-Bohai Seismic Belt: Insights from magnetotelluric data. Earth Planets Space 2024, 76, 174. [Google Scholar] [CrossRef]
  65. Huang, J.; Zhao, D. High-resolution mantle tomography of China and surrounding regions. J. Geophys. Res. 2006, 111, B09305. [Google Scholar] [CrossRef]
  66. Zhao, D. Global tomographic images of mantle plumes and subducting slabs: Insight into deep Earth dynamics. Phys. Earth Planet. Inter. 2004, 146, 3–34. [Google Scholar] [CrossRef]
  67. Menzies, M.; Xu, Y.G.; Zhang, H.F.; Fan, W.M. Integration of geology, geophysics and geochemistry: A key to understanding the North China Craton. Lithos 2007, 96, 1–21. [Google Scholar] [CrossRef]
  68. Zhang, K.J. Destruction of the North China Craton: Lithosphere folding-induced removal of lithospheric mantle? J. Geodyn. 2012, 53, 8–17. [Google Scholar] [CrossRef]
  69. Sibson, R.H.; Robert, F.; Poulsen, K.H. High-angle reverse faults, fluid-pressure cycling, and mesothermal gold-quartz deposits. Geology 1988, 16, 551–555. [Google Scholar] [CrossRef]
  70. Zhao, L.Q.; Hu, Y.X.; Zhan, Y.; Sun, X.Y.; Wang, Q.L.; Zhu, Y.Q.; Cao, C. Three-dimensional electrical structure and magma system of the monogenetic Longgang volcanic field, northeast China, inferred from broadband magnetotelluric data. J. Geophys. Res. Solid Earth 2022, 127, e2022JB024694. [Google Scholar] [CrossRef]
  71. Yang, B.; Zhang, F.; Uyeshima, M.; Lin, J.; Lin, W.L.; Yang, J.F.; Zhang, X.B.; Wang, W.; Liao, C.; Fang, H.; et al. Deep crustal hot zones control shallow magma reservoirs in an active transcrustal magmatic system. Commun. Earth Environ. 2026, 7, 17. [Google Scholar] [CrossRef]
  72. Iwamori, H.; Ogawa, Y.; Okada, T.; Watanabe, T.; Nakamura, H.; Kuwatani, T.; Nagata, K.; Suzuki, A.; Ichiki, M. Geofluid mapping reveals the connection between magmas, fluids, and earthquakes. Commun. Earth Environ. 2025, 6, 373. [Google Scholar] [CrossRef]
  73. Wessel, P.; Smith, W.H.F.; Scharroo, R.; Luis, J.; Wobbe, F. Generic Mapping Tools: Improved Version Released. Eos Trans. AGU 2013, 94, 409–410. [Google Scholar] [CrossRef]
Figure 1. Tectonic setting of northeastern China and distribution of magnetotelluric (MT) stations around the 1975 Haicheng earthquake area. (a) Major tectonic units of northeastern China and adjacent regions. (b) Tectonic framework of northeastern China and distribution of major volcanoes. (c) Major faults and earthquake distribution in the Haicheng earthquake area. (d) Geological background and MT station distribution in the Haicheng earthquake area. Geologic units: LDU: Liaodong Uplift; XLHB: Xialiaohe Basin. Volcanos: CBSV: Changbaishan Volcano; JPHV: Jingpohu Volcano; LGV: Longgang Volcano; WDLCV: Wudalianchi Volcano; YTV: Yitong Volcano.L1 and L2: MT profiles crossing the Haicheng earthquake area; L3:MT profile crossing the YTV. HCEQ: Haicheng Earthquake; XYEQ: Xiuyan Earthquake.
Remotesensing 18 01993 g001
Figure 2. Variations of the phase tensor invariant ( φ 2 ) and two-dimensional deviation angle |β| derived from phase tensor decomposition along two magnetotelluric profiles in the Haicheng earthquake area. LDU: Liaodong Uplift; XLHB: Xialiaohe Basin; TLNf: Northern Segment of the Tanlu fault; JZf: Jinzhou fault; HCH-DYHf: Haichenghe–Dayanghe fault; HQYZf: Hongqiyingzi fault; HC: Haicheng; PJ: Panjin; AS: Anshan; JJBZ: Jiangjiabuzi; GZ: Gaizhou; GS: Gushan; PL: Pianling; XY: Xiuyan.
Remotesensing 18 01993 g002
Figure 3. Three-dimensional inversion mesh discretization and RMS misfit distribution. (a) Horizontal mesh; (b) Horizontal mesh in the core area; (c) Vertical mesh within 120 km; (d) Vertical mesh within 20 km; (e) RMS misfit distribution of the 3D inversion.
Remotesensing 18 01993 g003
Figure 4. Deep electrical structures along three profiles in northeastern China (The locations of L1–L3 are shown in Figure 1). (a) Deep electrical structure along the NW–SE-trending L1 profile across the Haicheng earthquake area; (b) deep electrical structure along the SW–NE-trending L2 profile across the Haicheng earthquake area; (c) deep electrical structure along the L3 profile across the Yitong volcanic area, modified from Cao et al. [51]. LDU: Liaodong Uplift; TLNf: Northern Segment of the Tanlu fault; XLHB: Xialiaohe Basin; HCH-DYHf: Haichenghe–Dayanghe fault; HQYZf: Hongqiyingzi fault; JZf: Jinzhou fault; LZf: Liaozhong fault; HC: Haicheng; JJBZ: Jiangjiabuzi; GZ: Gaizhou; MF: Mafeng; PJ: Panjin; GS: Gushan; XY: Xiuyan; YTV: Yitong Volcano.
Remotesensing 18 01993 g004
Figure 5. Electrical structure of the Haicheng earthquake area and the distribution of strong earthquake hypocenters and aftershock sequences (microearthquake data after Lei et al. [52]). XLHB: Xialiaohe Basin; LDU: Liaodong Uplift; JZf: Jinzhou fault; LZf: Liaozhong fault; HCH-DYHf: Haichenghe–Dayanghe fault; TLNf: Northern Segment of the Tanlu fault; GS: Gushan; GZ: Gaizhou; HC: Haicheng; JJBZ: Jiangjiabuzi; MF: Mafeng; PJ: Panjin; XY: Xiuyan; HCEQ: Haicheng Earthquake; XYEQ: Xiuyan Earthquake.
Remotesensing 18 01993 g005
Figure 6. Tectonic divisions of northeastern China [62], and the distribution of GPS measurements [58] (The GPS velocities are shown with respect to the Eurasian continent reference frame), historical strong earthquakes, volcanoes, and Cenozoic volcanic rocks. JHOB: Jilin–Heilongjiang Orogenic Belt; LDU: Liaodong Uplift; NCB: North China Basin; SLB: Songliao Basin; XMOB: Xing’an–Mongolian Orogenic Belt; YSOB: Orogenic Belt; CF-KYf: Chifeng–Kaiyuan fault; DHMSf: Dunhua–Mishan fault; TLf: Tanlu fault; TSEQ: Tangshan earthquake; YLYTf: Yilan–yitong fault; HCEQ: Haicheng earthquake; CBSV: Changbaishan Volcano; LGV: Longgang Volcano; JPHV: Jingpohu Volcano; YTV: Yitong Volcano.
Remotesensing 18 01993 g006
Disclaimer/Publisher’s Note: The statements, opinions and data contained in all publications are solely those of the individual author(s) and contributor(s) and not of MDPI and/or the editor(s). MDPI and/or the editor(s) disclaim responsibility for any injury to people or property resulting from any ideas, methods, instructions or products referred to in the content.