Technical Note

Global Variations in GNSS-TEC During Storm Time Substorms on 23 December 2014

1
School of Electronic Information and Electrical Engineering, Chengdu University, Chengdu 610106, China
2
School of Earth and Space Science and Technology, Wuhan University, Wuhan 430072, China
3
College of Aviation Electronic and Electrical Engineering, Civil Aviation Flight University of China, Chengdu 641400, China
*
Author to whom correspondence should be addressed.
Remote Sens. 2026, 18(12), 1923; https://doi.org/10.3390/rs18121923
Submission received: 20 March 2026 / Revised: 27 May 2026 / Accepted: 4 June 2026 / Published: 10 June 2026

Highlights

What are the main findings?
  • GNSS dTEC maps show that three storm time substorms on 23 December 2014 induced strongly localized ionospheric responses rather than a globally uniform TEC disturbance.
  • Enhanced dTEC developed mainly from the prenoon to dusk sector at subauroral–auroral latitudes and over the polar cap, while South America exhibited decreased dTEC at low latitudes and increased dTEC at the magnetic equator.
What are the implications of the main findings?
  • Storm time substorms can simultaneously produce positive and negative TEC disturbances at different latitudes and in local time sectors through the combined effects of particle precipitation, convection electric fields, and prompt penetration electric fields.
  • To improve the accuracy of TEC prediction, local indices should be given greater consideration than global indices, as they can better capture regional ionospheric variability.

Abstract

TEC disturbances have substantial impacts on communications and global positioning systems. Based on total electron content (TEC) observations from global navigation satellite systems and plasma observations from the Defense Meteorological Satellite Program, global variations in and mechanisms of the differential TEC (dTEC) during three successive substorms, which occurred on 23 December 2014 during the main phase of a geomagnetic storm, were investigated. The results show that TEC disturbances were not globally uniform but exhibited pronounced latitude and local time dependences. One prominent dTEC enhancement, reaching up to 25 TECU within 10 min, occurred over North America from the prenoon to dusk sector at subauroral and auroral latitudes, related to the ionization driven by particle precipitation and storm-enhanced density (SED) driven by an intensified convection electric field. Enhanced dTEC at high latitudes expanded to midlatitudes, forming the broad midlatitude SED, expanding poleward and developing a tongue of ionization (TOI), persisting for 100 min. In addition, over South America at premidnight, decreased dTEC at low latitudes and increased dTEC at equatorial latitudes with amplitudes of around 16 TECU were consistent with suppression of the equatorial ionization anomaly (EIA), driven by substorm-related westward prompt penetration electric fields (PPEFs). These results demonstrate that storm time substorms can simultaneously enhance and deplete TEC in different latitude and local time sectors through the combined effects of particle precipitation, convection electric fields, and PPEFs.

1. Introduction

Total electron content (TEC) measures the integrated electron number density along a signal path, typically expressed in TEC units (TECUs), where 1 TECU = 1016 e · m−2. Owing to the rapid development of global navigation satellite systems (GNSS) and worldwide distributed receivers, the precise world map of the GNSS-TEC is available [1,2,3]. TEC is a fundamental parameter for ionosphere monitoring and a key error source for satellite navigation, positioning, and communication systems. Significant disturbances in TEC may have a catastrophic impact on satellite navigation, communication systems, and power grids [4,5,6,7,8]. Therefore, monitoring TEC in magnetically active periods is crucial for space weather forecasting.
A magnetospheric substorm is a fundamental process of solar wind–magnetosphere–ionosphere coupling. When a substorm occurs, explosive energy previously stored in the magnetospheric tail is released into the auroral ionosphere, giving rise to many pronounced effects, including obvious auroral brightening [9,10], rapid auroral electrojet intensification [11,12,13], intense localized bay-like magnetic disturbances [14,15], a sharp increase in particle precipitation [16,17], excitation of electromagnetic waves [18,19], and disturbances in TEC [20,21,22,23,24,25,26].
Previous studies have shown that substorms can produce both positive and negative TEC disturbances on timescales from several minutes to hours, possibly due to particle precipitation, electric field penetration, neutral wind, and thermospheric composition changes [20,21,22,23,24,25,26]. A superposed epoch analysis of global positioning system (GPS) TEC at high latitudes during 259 substorms demonstrated that TEC enhances during approximately 81% of the substorms. Substorm-related TEC enhancements typically peak within ~10 min after auroral onset, due to enhanced precipitating electron fluxes [25]. At midlatitude regions, GPS TEC observations revealed increases in TEC of ~7–8 TECU in the mid-latitude trough and rapid equatorward motion of the poleward wall of the trough after non-storm time substorms, consistent with enhanced energetic electron precipitation. [22].
During storm time substorms, coordinated airglow and GNSS-TEC observations reported concurrent 630 nm airglow enhancements and TEC increases over Japan, resulting from a large penetration electric field in storm time substorms [20,26]. In addition, the enhanced equatorward or poleward neutral wind could be another contributor to the upward and downward motion of the ionosphere through ion drag with a longer response time [26,27]. Negative TEC disturbances lasting for several hours during substorms have been observed at both high- and midlatitude stations in European and African sectors. Substorm energy input heats the polar thermosphere and produces a composition bulge, characterized by an increased [N2]/[O] density ratio. The two factors both enhanced the electron recombination rate in the polar region, leading to a decrease in TEC. Attributed to equatorward neutral winds, the composition bulge propagates to midlatitudes and causes TEC decreases there [21].
These studies have provided insights into the responses of TEC to substorms. However, most previous work has focused on limited latitude ranges or specific regions [20,22,24,25,26]. Observations of global GNSS-TEC during substorms in this work may contribute to further in-depth explorations of the temporal and spatial evolution of TEC during substorms and involving physical mechanisms. Moreover, the ionospheric penetrating electric fields during substorms are eastward on the dayside and westward on the nightside, exhibiting local time dependences, which may lead to local time dependences of TEC [28]. Therefore, investigating the local time dependences of TEC disturbances during substorms is a key focus of this work. Furthermore, compared with substorms under quiet time conditions, storm time substorms occur within a much more strongly preconditioned magnetosphere–ionosphere–thermosphere system [14,20,23]. As a result, their ionospheric and TEC responses can be more strongly local-time-dependent, longitudinally inhomogeneous, and physically complex compared to those under quiet time conditions. Thus, investigating TEC responses to storm time substorms is of considerable significance.
In this work, based on GNSS-TEC derived from receivers distributed all over the world, we analyze responses of TEC to storm time substorms on 23 December 2014. Plasma investigations of Defense Meteorological Satellite Program (DMSP) are also conducted to explain the physical mechanisms of TEC responses. Specifically, Section 1 presents the background of the TEC. Section 2 introduces the data sources and processing methods of GNSS-TEC data. Section 3 describes the global disturbances of TEC during storm time substorms on 23 December 2014. Section 4 discusses and provides possible physical mechanisms for the TEC responses to storm time substorms. Section 5 summarizes the main findings of this work.

2. Materials and Methods

2.1. Solar Wind and Geomagnetic Indices

Upstream solar wind and interplanetary magnetic field (IMF) parameters and geomagnetic indices, including By and Bz components of the IMF in geocentric solar magnetic coordinates (IMF By and IMF Bz), solar wind velocity (Vsw), solar wind proton density (Nsw), solar wind dynamic pressure (Psw), auroral electrojet index (AE), symmetric disturbance field in the horizontal direction H (SYM-H), and asymmetric disturbance component in H (ASY-H) with a temporal resolution of 1 min, are obtained from the OMNI database at https://spdf.gsfc.nasa.gov/pub/data/omni/ (accessed on 16 September 2025), which time-shifts in situ solar wind measurements to the Earth’s bow shock.
Moreover, we employ the time-integrated merging electric field (Em) to quantify the solar wind energy input into the ionosphere–thermosphere system [29,30].

2.2. GNSS-TEC Data Processing

The source data used to calculate TEC is obtained from more than 50 institutes and universities at https://stdb2.isee.nagoya-u.ac.jp/GPS/GPS-TEC/gnss_provider_list.html (accessed on 12 September 2025). Based on the carrier phase difference between L1 (1575.42 MHz) and L2 (1227.60 MHz), TEC was calculated using their pseudoranges [3,31,32]. The gridded GNSS vertical TEC (VTEC) with a time and spatial resolution of 5 min and 0.5° geographic latitude (GLat) × 0.5° geographic longitude (GLon) is available in the GNSS-TEC database, https://stdb2.isee.nagoya-u.ac.jp/GPS/GPS-TEC/ (accessed on 12 September 2025).
In order to accentuate disturbances of TEC from background TEC, we derived the TEC difference (dTEC) by subtracting the mean TEC of the ten geomagnetically quiet days in the same month from the observed TEC, and then analyzed the resulting dTEC [3]. Geomagnetically quiet days are defined in a list provided by the GFZ German Research Centre for Geosciences at ftp://ftp.gfz-potsdam.de/pub/home/obs/kpap/quietdst/qdrecent.txt (accessed on 2 October 2025). We further computed the median dTEC within each 4° GLat × 4° GLon bin, yielding a dTEC dataset in a time and spatial resolution of 5 min and 4° GLat × 4° Glon. It should be noted that the GFZ quiet day list is based on relative monthly Kp conditions rather than absolute geomagnetic quiescence, and the selected quiet days may still contain weak disturbances. Moreover, during storm time, the quiet day baseline method cannot fully separate the preconditioned storm time background from substorm-related perturbations. Therefore, the derived dTEC should be interpreted as reflecting both the disturbed background and the additional substorm response. Accordingly, the present study mainly focuses on the short-timescale dTEC responses after each onset to identify the TEC disturbances most closely associated with the three consecutive substorms rather than attributing the full storm time disturbance pattern exclusively to the substorms [3].
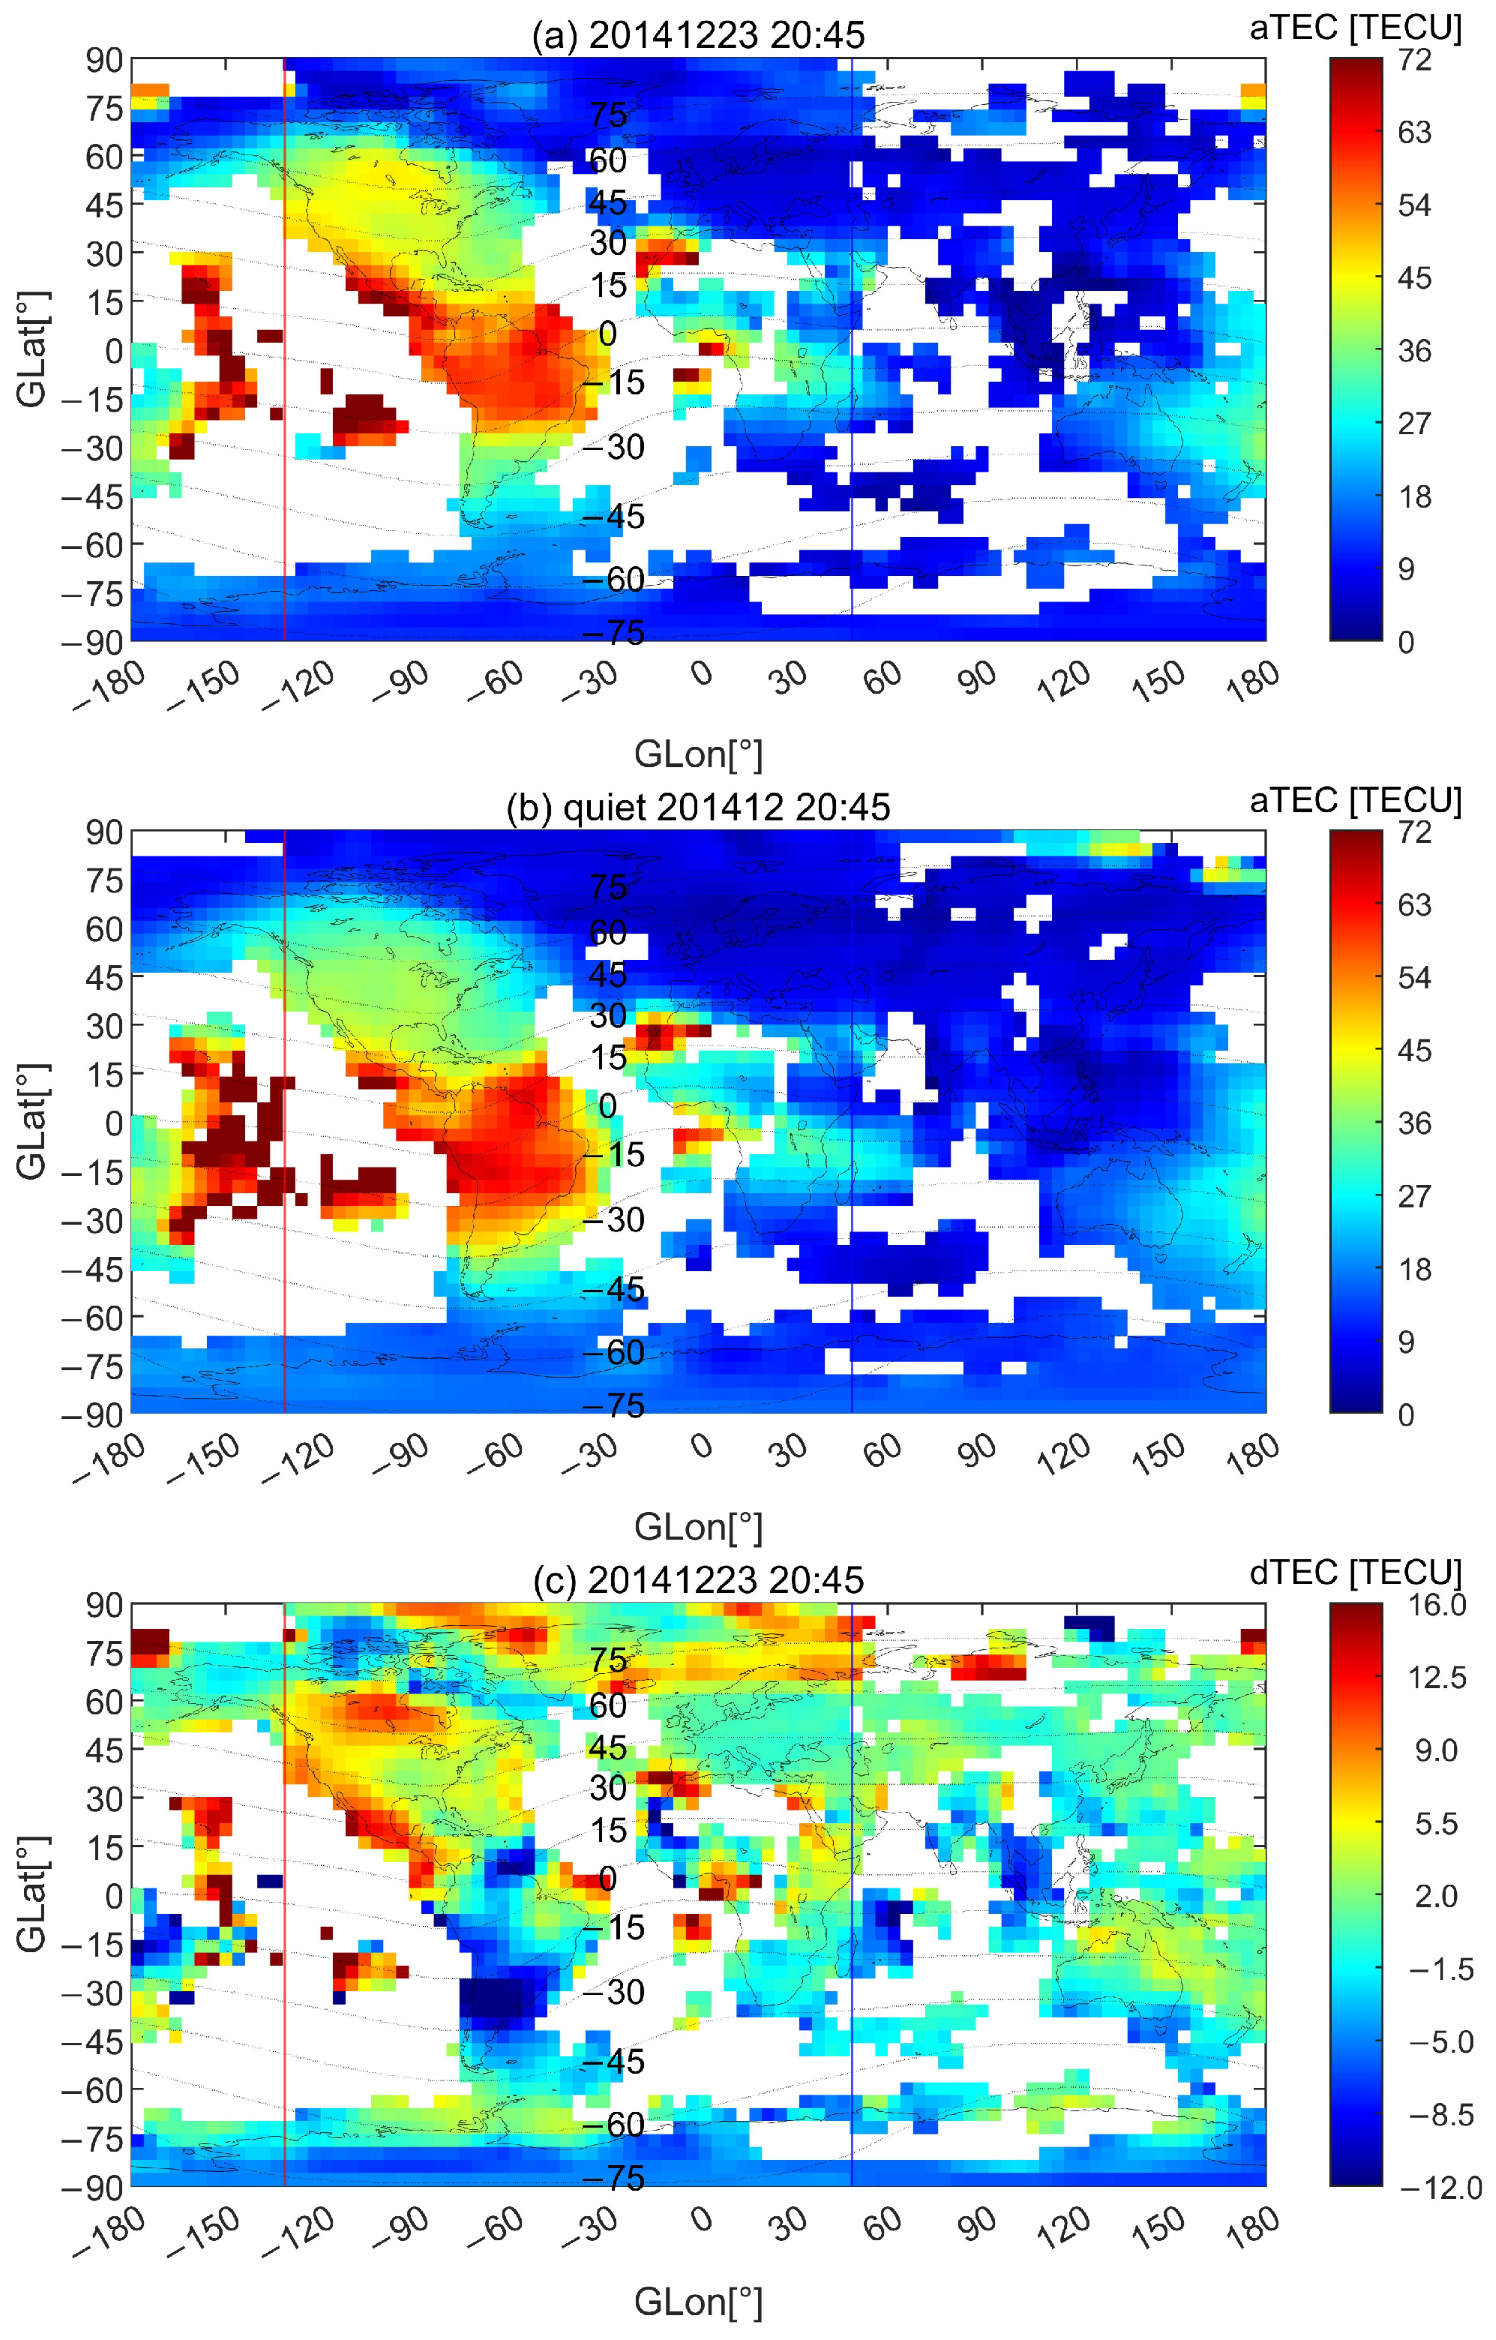
For example, Figure 1a shows the absolute TEC at 20:45 Universal Time (UT) on 23 December 2014, near an onset of a substorm during the main phase of a geomagnetic storm. Vertical red and blue lines in Figure 1a–c represent local noon and midnight, respectively. TEC with large amplitude is observed from 09:25 to 19:00 local time (LT) in low latitudes and equatorial regions, reaching a maximum of 75 TECU. The intense TEC in this area is attributed to the strong ionization related to solar radiation. An intense TEC expands from 15° to 40° GLat and ends at noon, consistent with the storm-enhanced density (SED). In addition, TEC from 50° to 60° GLat in the afternoon in North America shows a moderate enhancement, corresponding to the SED at middle latitudes [3]. Figure 1b illustrates the average TEC values at 20:45 UT during 10 geomagnetically quiet days in December 2014. During quiet days, the largest TEC is distributed from 09:25 to 19:00 LT in low latitudes and equatorial regions, due to strong ionization related to solar radiation. Figure 1c represents dTEC at 20:45 Universal Time (UT) on 23 December 2014. In Figure 1c, the SED phenomenon can be observed, more clearly than in Figure 1a, along with the TOI phenomenon depicted by the intense TEC expanding from 75° to 90° GLat near local noon and midnight. Moreover, the dTEC in Figure 1c shows more details, such as the enhancement of dTEC in the polar region and depletion of dTEC in South America. This indicates that dTEC is reliable when investigating TEC during substorms.

2.3. DMSP In Situ Measurements

The Defense Meteorological Satellite Program (DMSP) F17 satellite operates in near-Sun-synchronous orbits at about 850 km altitude with an orbital inclination of about 98° and an orbital period of ~101 min, and they predominantly fly along the dawn–dusk orbits. The onboard ion drift meter (IDM), which is part of the thermal plasma detector array (SSIES), provides in situ measurements of vertical and horizontal ion drift velocities [33]. Energetic electron precipitation is characterized using the integrated electron energy flux of electron precipitations obtained from the precipitating particle spectrometer (SSJ5), which measures electrons and ions ranging from 30 eV to 30 keV [34].

2.4. Substorm Event List

Substorm onset times were obtained from the SuperMAG-based substorm onset list [35], which has been widely adopted in studies of ionospheric disturbances induced by substorms [12,13,28,36]. A substorm onset at the key time, t0, was identified when all four of the following criteria were satisfied (SML represents SuperMAG electrojet lower index) [35]:
SML ( t 0   +   1 ) SML ( t 0 )   <   15   nT SML ( t 0   +   2 ) SML ( t 0 )   <   30   nT SML ( t 0   +   3 ) SML ( t 0 )   <   45   nT i = 4 i = 30 SML ( t 0   +   i ) 26 SML ( t 0 ) <   100   nT

3. Results

3.1. Solar Wind Condition and Geomagnetic Activity Indices

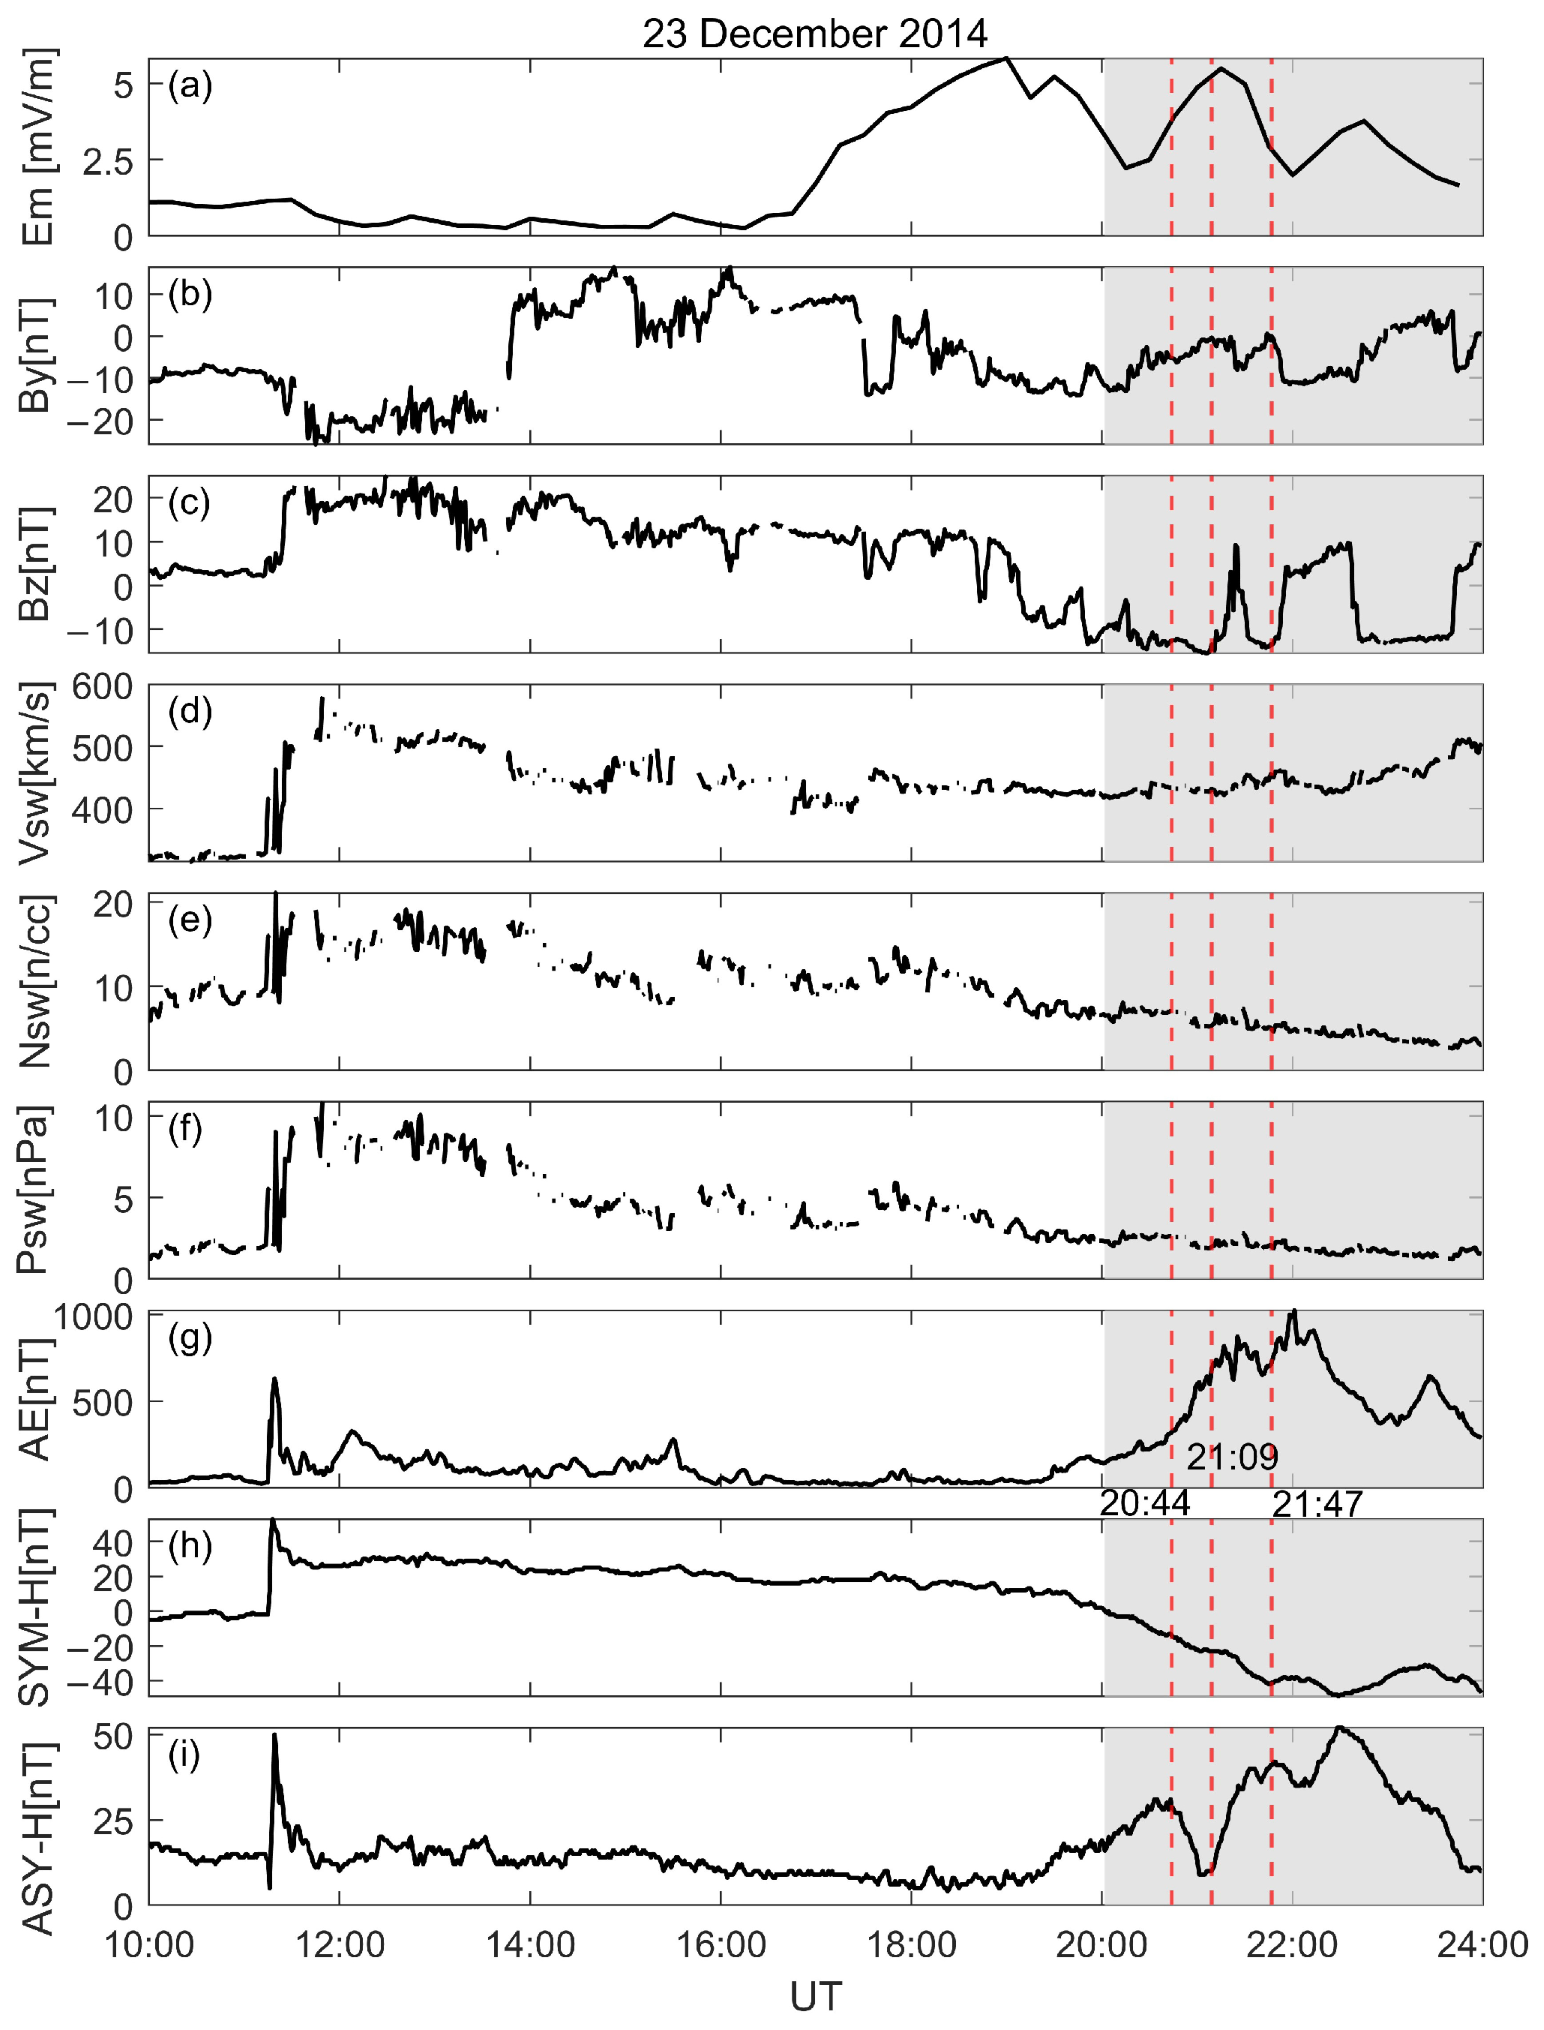
Three substorms subsequently occurred at 20:44, 21:09, and 21:47 Universal Time (UT) on 23 December 2014 (denoted by red dashed vertical lines in Figure 2) during the main phase of a geomagnetic storm (represented by gray shaded regions). The main phase of this geomagnetic storm started at around 20:00 UT on 23 December 2014 and ended at 01:38 UT on 24 December 2014.
The first substorm onset (20:44 UT) was accompanied by an enhanced Em, negative IMF By, and southward IMF Bz (Figure 2a–c), indicating intensified reconnection and enhanced energy transfer into the ionosphere. The second (21:09 UT) and third (21: 47 UT) substorm onsets were companied by sudden northward turnings of the IMF, a characteristic signature of substorms [37,38]. Vsw (Figure 2d) remains about 430 km/s at the first two onsets and increased to about 460 km/s at the third onset. Both Nsw and Psw (Figure 2e,f) showed slight decreases during these three substorms, suggesting progressively weaker direct compressional forcing on the magnetosphere [39].
The AE index (Figure 2g) increased sharply following the first onset (20:44 UT) and continued to increase after the second onset. The AE index showed several fluctuations between the second and third onsets. At 21:47 UT the third onset occurred, and AE reached a maximum of 1025 nT at around 22:00 UT and then decay to 371 nT near 23:00 UT. These three onsets occurred during a period of enhanced AE, indicating repeated intensifications of auroral electrojets and the development of the substorm current wedge [40].
Storm time ring current development is reflected by SYM-H (Figure 2h). SYM-H decreased from 0 nT at around 20:00 UT and remained negative until 24 December 2014, confirming that the three substorm onsets occurred during the storm main phase. Meanwhile, ASY-H (Figure 2i) decreased after the first and third onsets and increased at the second onset. The increase in ASY-H may suggest an enhancement of asymmetric current systems associated with substorm-related current systems and partial ring current contributions.

3.2. Regional Evolution of dTEC in Geographic Coordinates

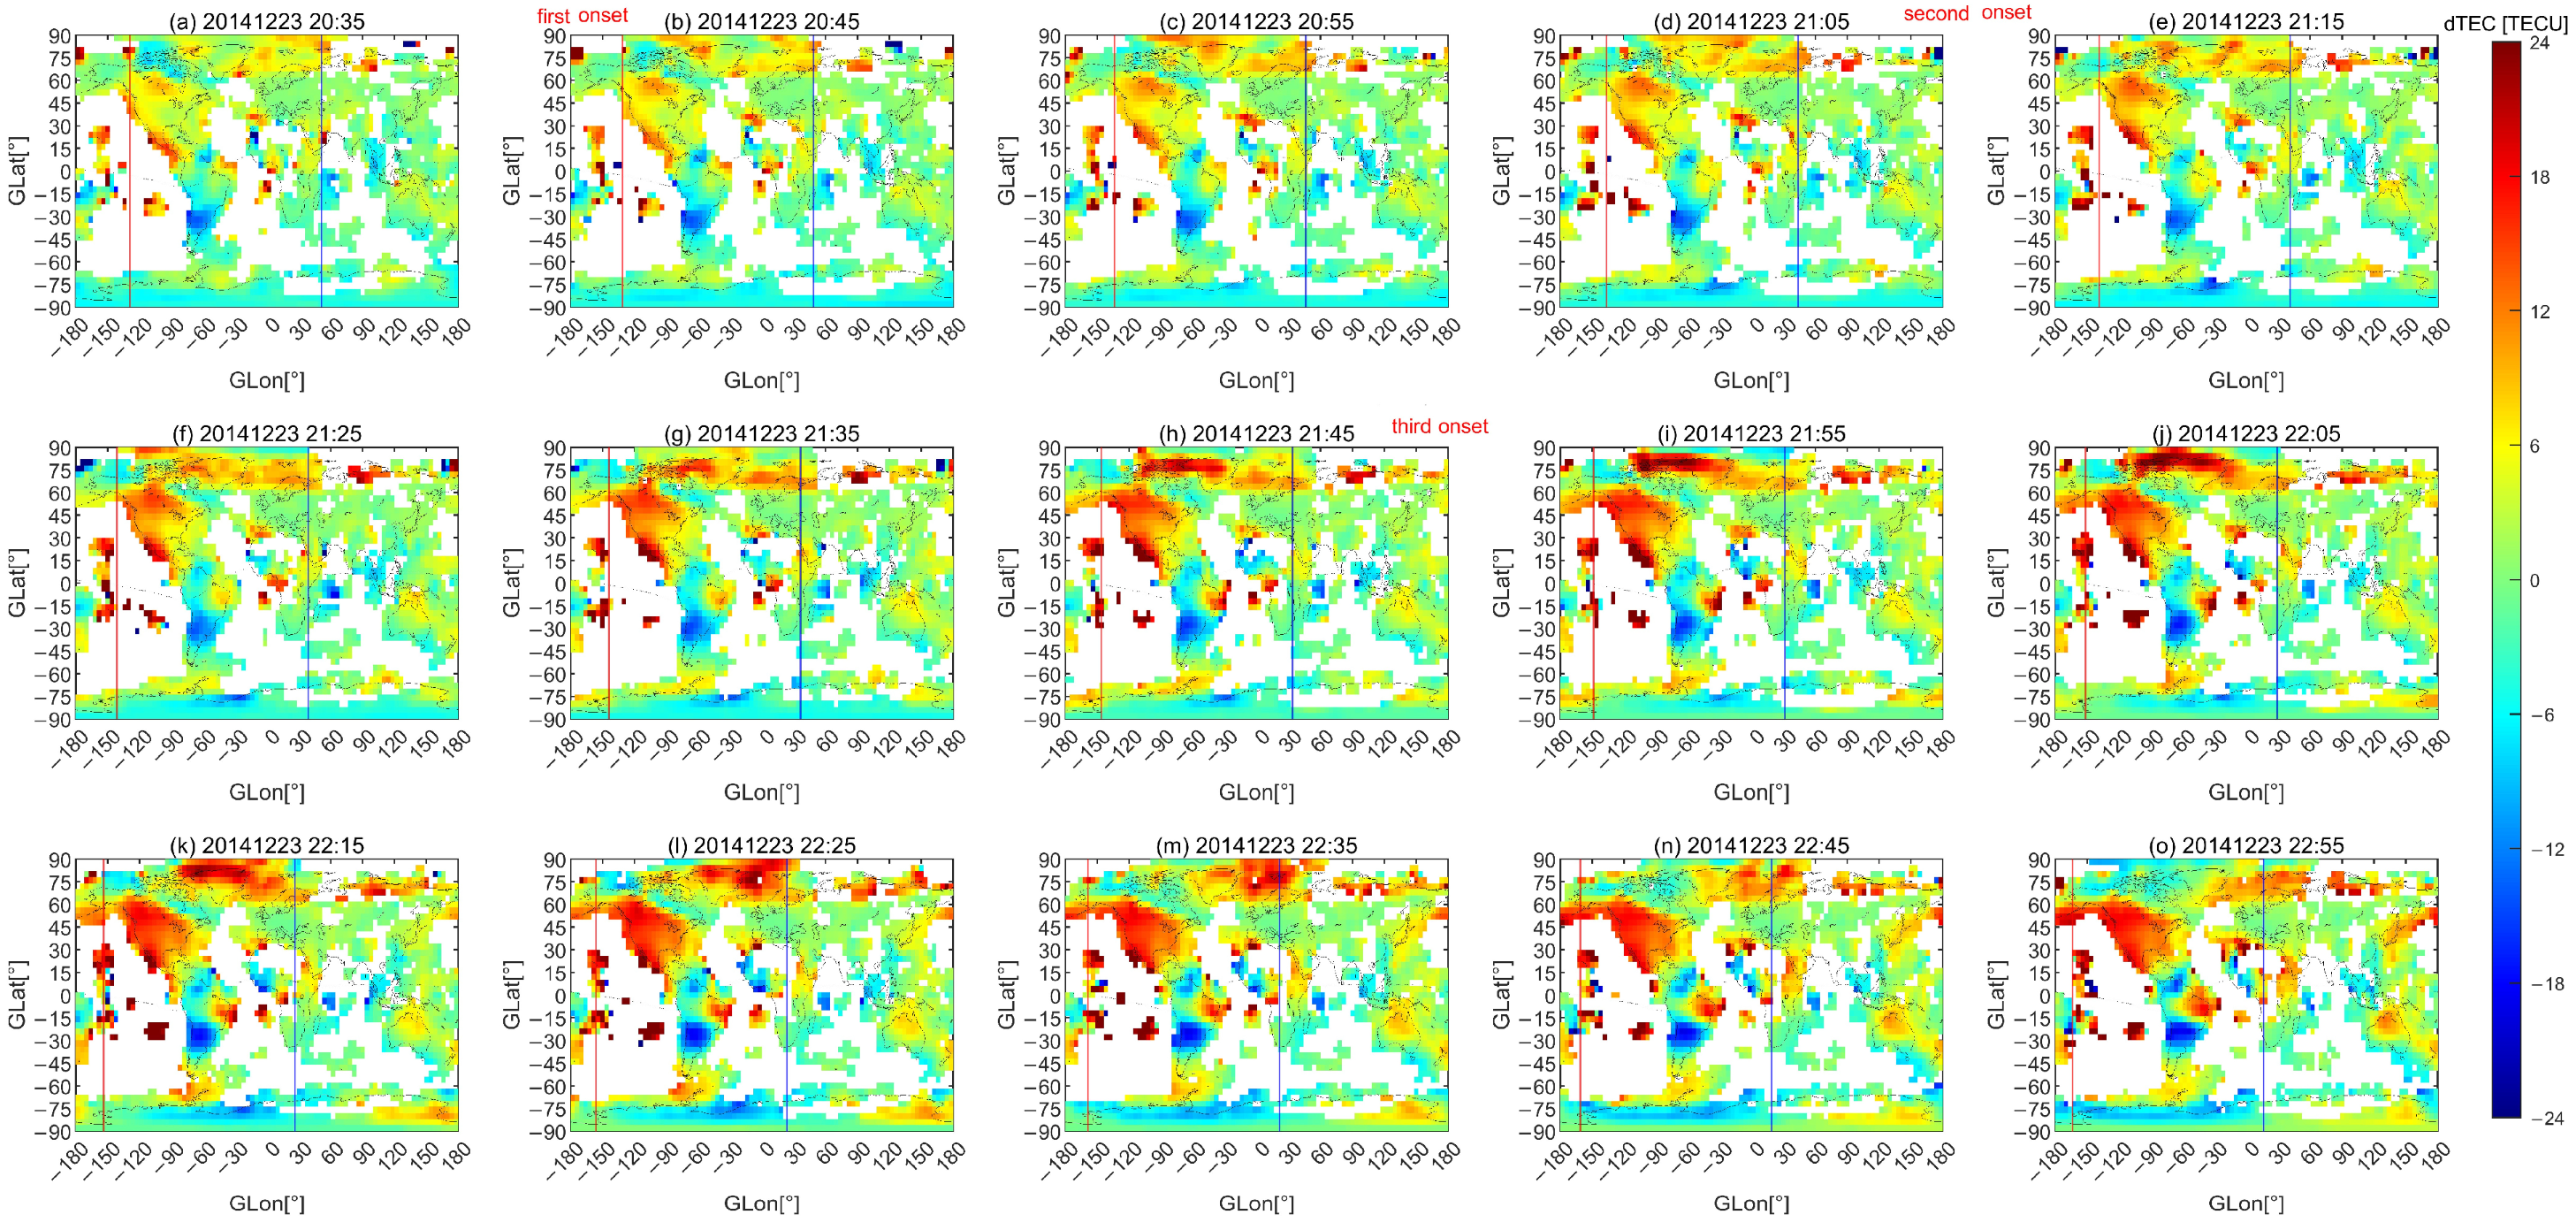
Figure 3 shows the regional evolution of dTEC in GLat–GLon coordinates from 20:35 to 22:10 UT on 23 December 2014, covering three substorm onsets at 20:44, 21:09, and 21:47 UT during the main phase of a storm. It emphasizes the regional localization of the disturbances and the asymmetry between the Northern and Southern Hemispheres.
Before the first onset (Figure 3a), the dTEC map shows an already highly structured dTEC distribution during the storm main phase. Positive dTEC was evident (i) at low and equatorial latitudes near local noon, (ii) over North America in the afternoon sector, and (iii) across broad northern polar regions from dusk to midnight. In contrast, pronounced negative dTEC occupied the midlatitude sector of South America.
After the first onset at 20:44 UT (Figure 3b–d), enhanced dTEC was observed over the northern polar region (including Europe) from dusk to midnight, with a maximum of 15 TECU after 10 min of the first onset. The dTEC over North America continued to intensify, forming a relatively narrow latitudinal band extending from 0° to 45°N GLat. Over South America, in the 28°W–56°W GLon sector, dTEC decreased at 0–10°N GLat while increasing at 0–15°S GLat, indicating a southward displacement of the enhanced dTEC structure near the equatorial region. At the same time, a broad negative dTEC band, with a minimum of −15 TECU, persisted in South America, extending from 22°S to 42°S GLat. On the equatorward side of Antarctica, dTEC increased slightly (4.5 TECU) at 60°S–75°S GLat and 30°W–150°W GLon, whereas a dTEC decrease (−9.5 TECU) over Antarctica was centered near 75°S GLat.
Following the second onset at 21:09 UT (Figure 3e–g), the enhanced dTEC over northern polar region and North America expanded further in both latitude and longitude and increased in magnitude. The enhanced dTEC over northern polar region occupied the largest area after 15 min of the onset. Moreover, dTEC at 15°N–30°N GLat and 144°W–164°W GLon increased. Over South America, the low-latitude enhanced dTEC continued its southward displacement and was centered near 12°S GLat at 21:35 UT (Figure 3g). The negative dTEC over the midlatitude South American sector remained prominent, with a minimum of −14 TECU. On the equatorward side of Antarctica, at 60°S–75°S GLat and 30°W–150°W GLon, dTEC continued to increase. Poleward of 75°S GLat, the decreased dTEC attained a maximum after 6 min of the onset (Figure 3e) and then gradually recovered. Outside the American sector, dTEC variations at mid to low latitudes were generally weaker during this interval.
The third substorm onset was at 21:47 UT, and Figure 3h shows dTEC almost right at the onset. After the third onset (Figure 3j–l), dTEC in northern polar regions increased sharply and reached a maximum of 26.5 TECU after 18 min followed by a decline accompanied by an eastward shift of the enhanced dTEC center. The peak time of dTEC in northern polar regions (22:05 UT) is close to the peak time of AE (22:02 UT) in Figure 2g, showing the direct effects of substorm energy and particle input on dTEC. From 21:45 to 22:15 UT, strong enhanced dTEC occupied much of North America and extended into the polar region. Beginning at 22:05 UT, an interesting dTEC pattern appeared in South America and eastern regions of Africa, with decreased dTEC (−17 TECU) developing near the off-equatorial low latitudes and a concurrent increased dTEC (24 TECU) near the equator between the two decreased dTEC regions. The negative dTEC over the midlatitude South American sector decreased at the third onset. In the Southern Hemisphere, dTEC in the southern auroral region continued to increase, reaching a maximum of 15.8 TECU and dTEC above 75°S GLat strengthened markedly, reaching a minimum of −15.5 TECU after 40 min of the third onset.
Overall, the three successive substorm onsets primarily intensified an already-established storm time dTEC pattern rather than producing a globally synchronous response. The most prominent features in Figure 3 are the stepwise reinforcement of positive dTEC in the polar regions and the North American high- to midlatitude sector, together with the sustained persistence of negative dTEC over the South American midlatitude sector.

3.3. Magnetic Latitude and Local Time Variations in dTEC Response

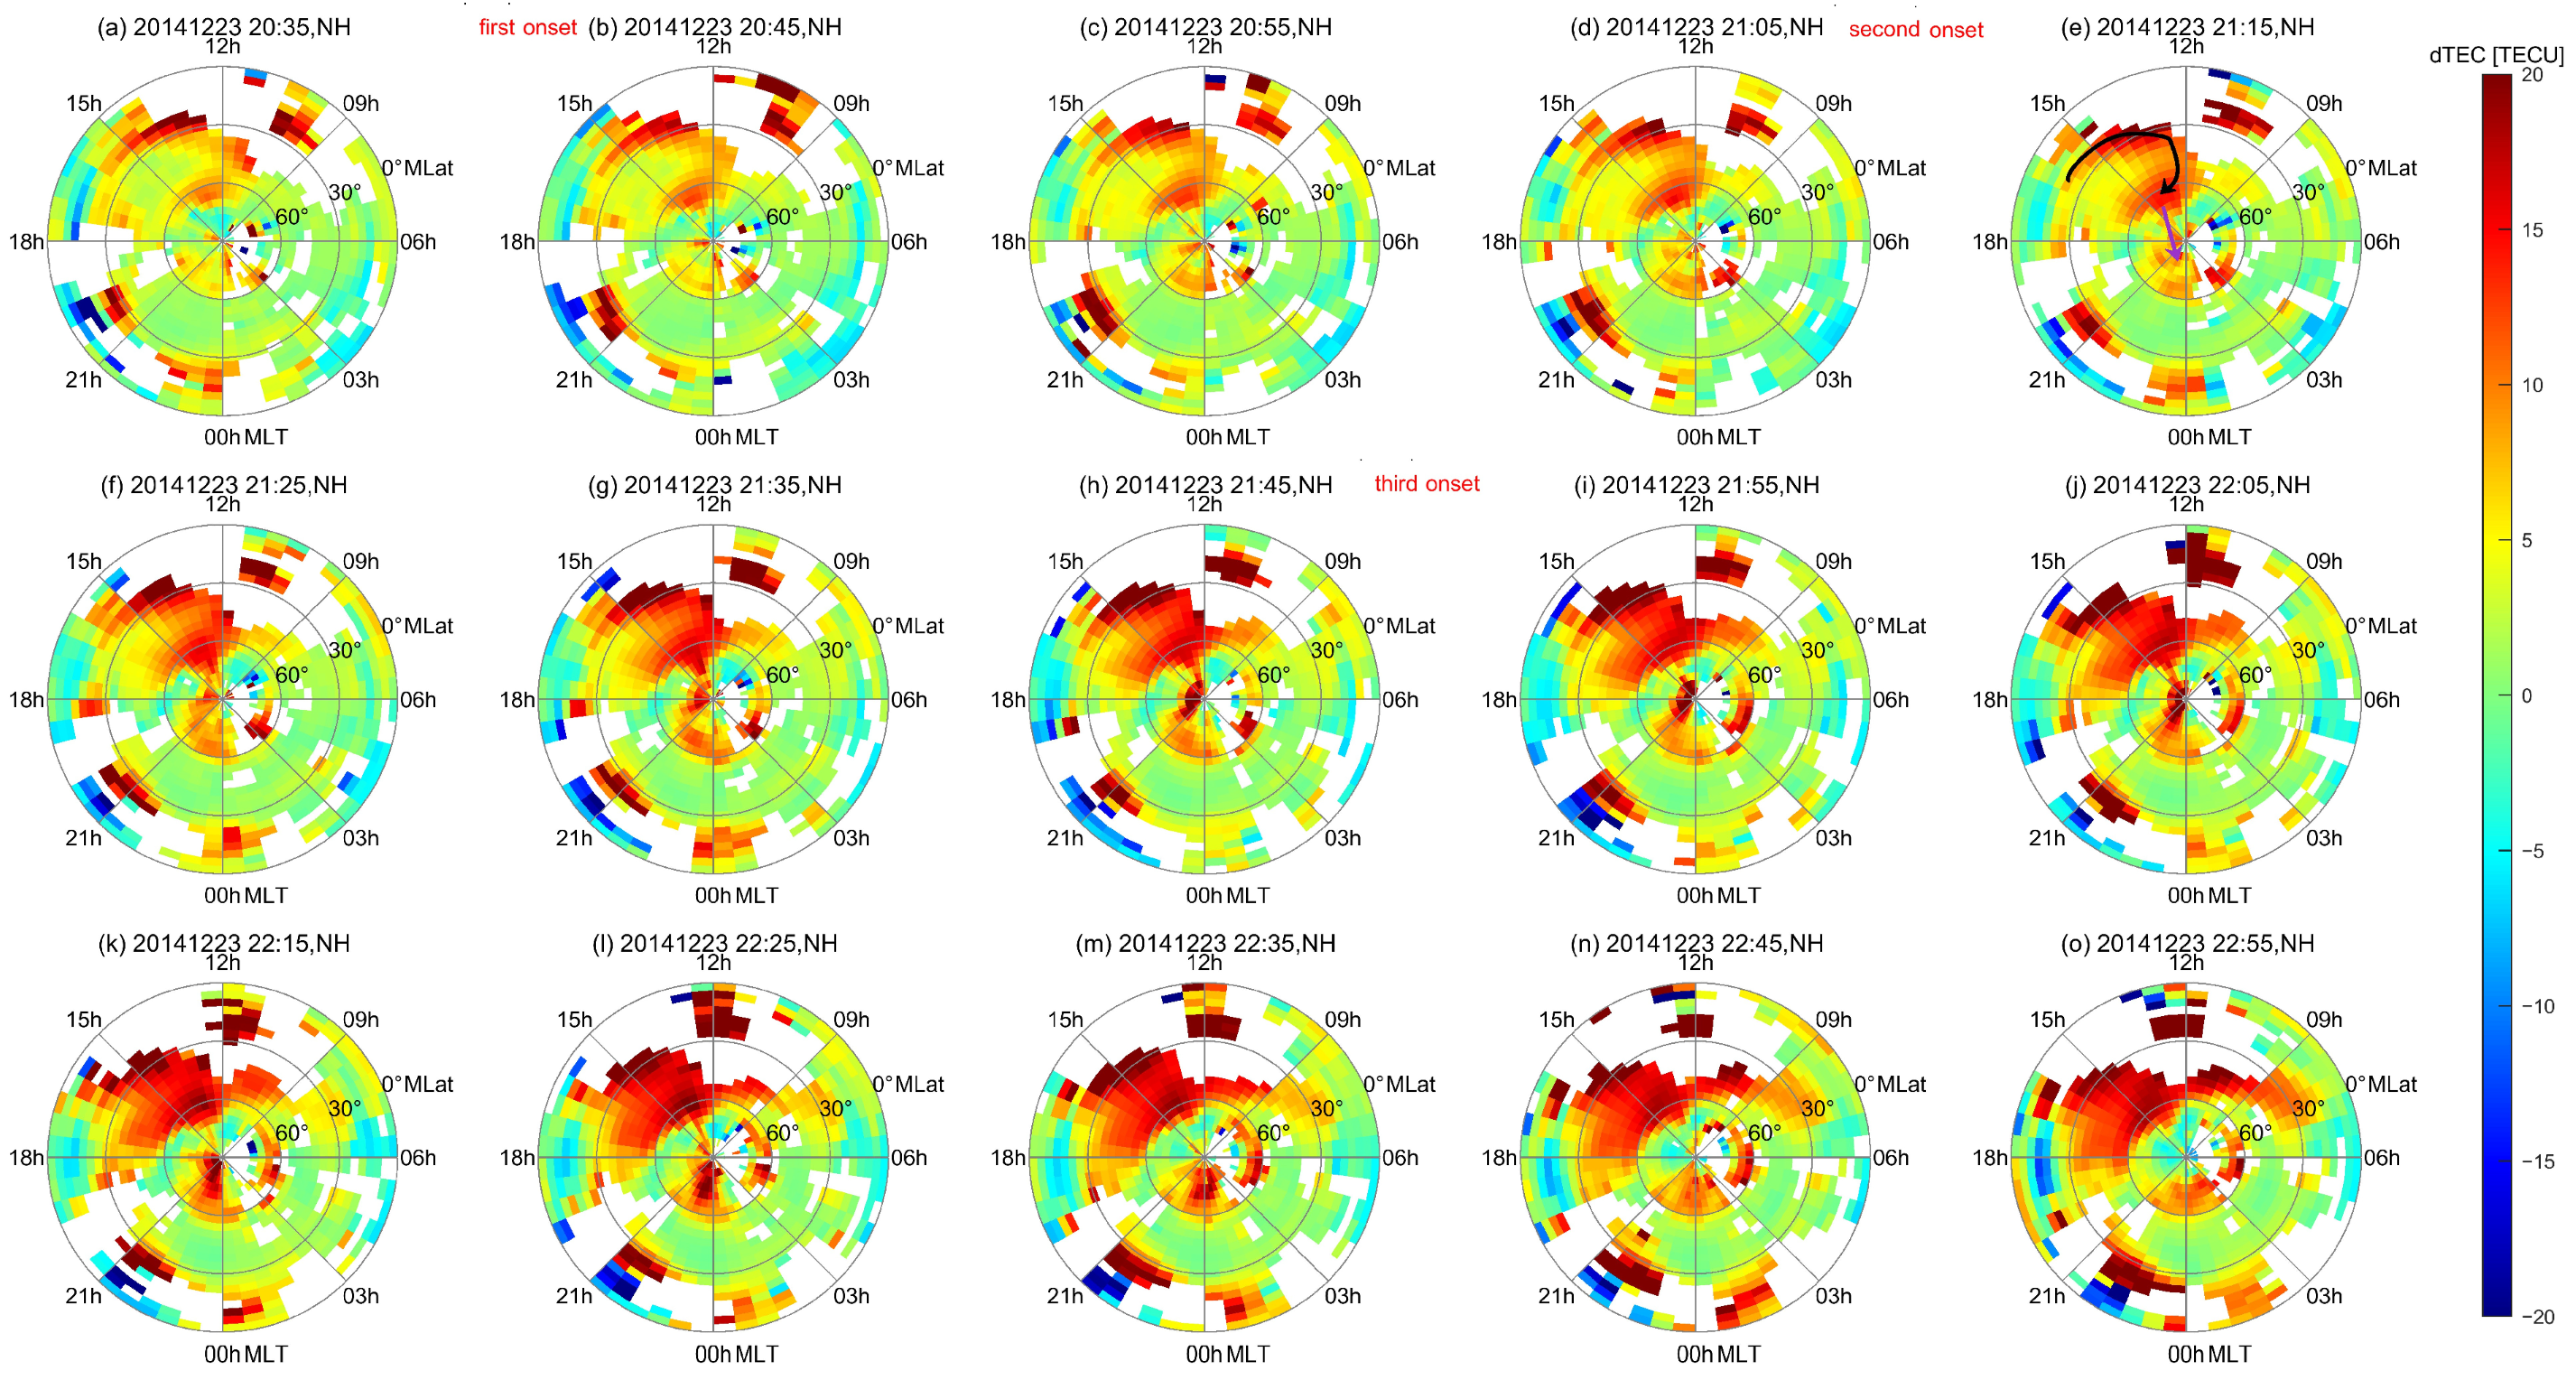
To further reveal the magnetic latitude and local time dependence of the TEC response, the same dTEC disturbances are analyzed in magnetic latitude (MLat)–magnetic local time (MLT) coordinates, as shown in Figure 4, spanning from 20:35 to 22:55 UT on 23 December 2014, including the three substorm onsets at 20:44, 21:09, and 21:47 UT. Prior to the first onset (Figure 4a), enhanced dTEC was distributed broadly from low to high latitudes in the 09–18 MLT sector, and was also evident at low latitudes and in polar regions in the 19–24 MLT sector, consistent with a strongly disturbed storm time background. Moreover, the dTEC pattern in the dusk sector was broadly consistent with the duskside branch of the two-cell convection pattern [41].
After the three onsets, dTEC in the prenoon to afternoon sector from midlatitudes to high latitudes intensified and reached a peak of 27.5 TECU, consistent with SED, denoted by a black arrow in Figure 4e. SED extended further both eastward and westward. After the second onset (21:09 UT), the enhanced dTEC at 12–15 MLT expanded poleward and connected to the enhanced dTEC at 19–24 MLT in polar regions (Figure 4e–h), corresponding to TOI [3,41], denoted by a purple arrow in Figure 4e. In addition, enhanced dTEC in the afternoon at 40°N–60°N MLat expanded to prenoon and reached 09 MLT at 21:45 UT (Figure 4e–h).
At low latitudes, responses of dTEC at 19–23 MLT showed a latitudinal contrast: dTEC at 0–15°N MLat decreased with a minimum of −26.8 TECU, while dTEC at 15°N–30°N MLat increased with a maximum of 26 TECU, in contrast to the equatorial ionization anomaly (EIA) phenomenon. The dTEC around midnight at low latitudes enhanced right after the onset and attained a peak of 15.3 TECU after 16 min.

4. Discussion

As shown in Figure 3 and Figure 4, after the three substorm onsets during the main phase of the storm on 23 December 2014, TEC disturbances are not globally uniform. Instead, they exhibit pronounced latitudinal and local time variability, with enhancement and depletion often occurring simultaneously in different sectors, which is consistent with previous studies [21,25]. One of the strongest dTEC enhancements occurred over North America from the prenoon to dusk sectors, especially at subauroral and auroral latitudes, with a maximum of 25 TECU. This spatial pattern suggests that the observed enhancement was not simply an immediate nightside auroral response to substorm onset but was superposed on a storm main phase background that had already been strongly preconditioned.
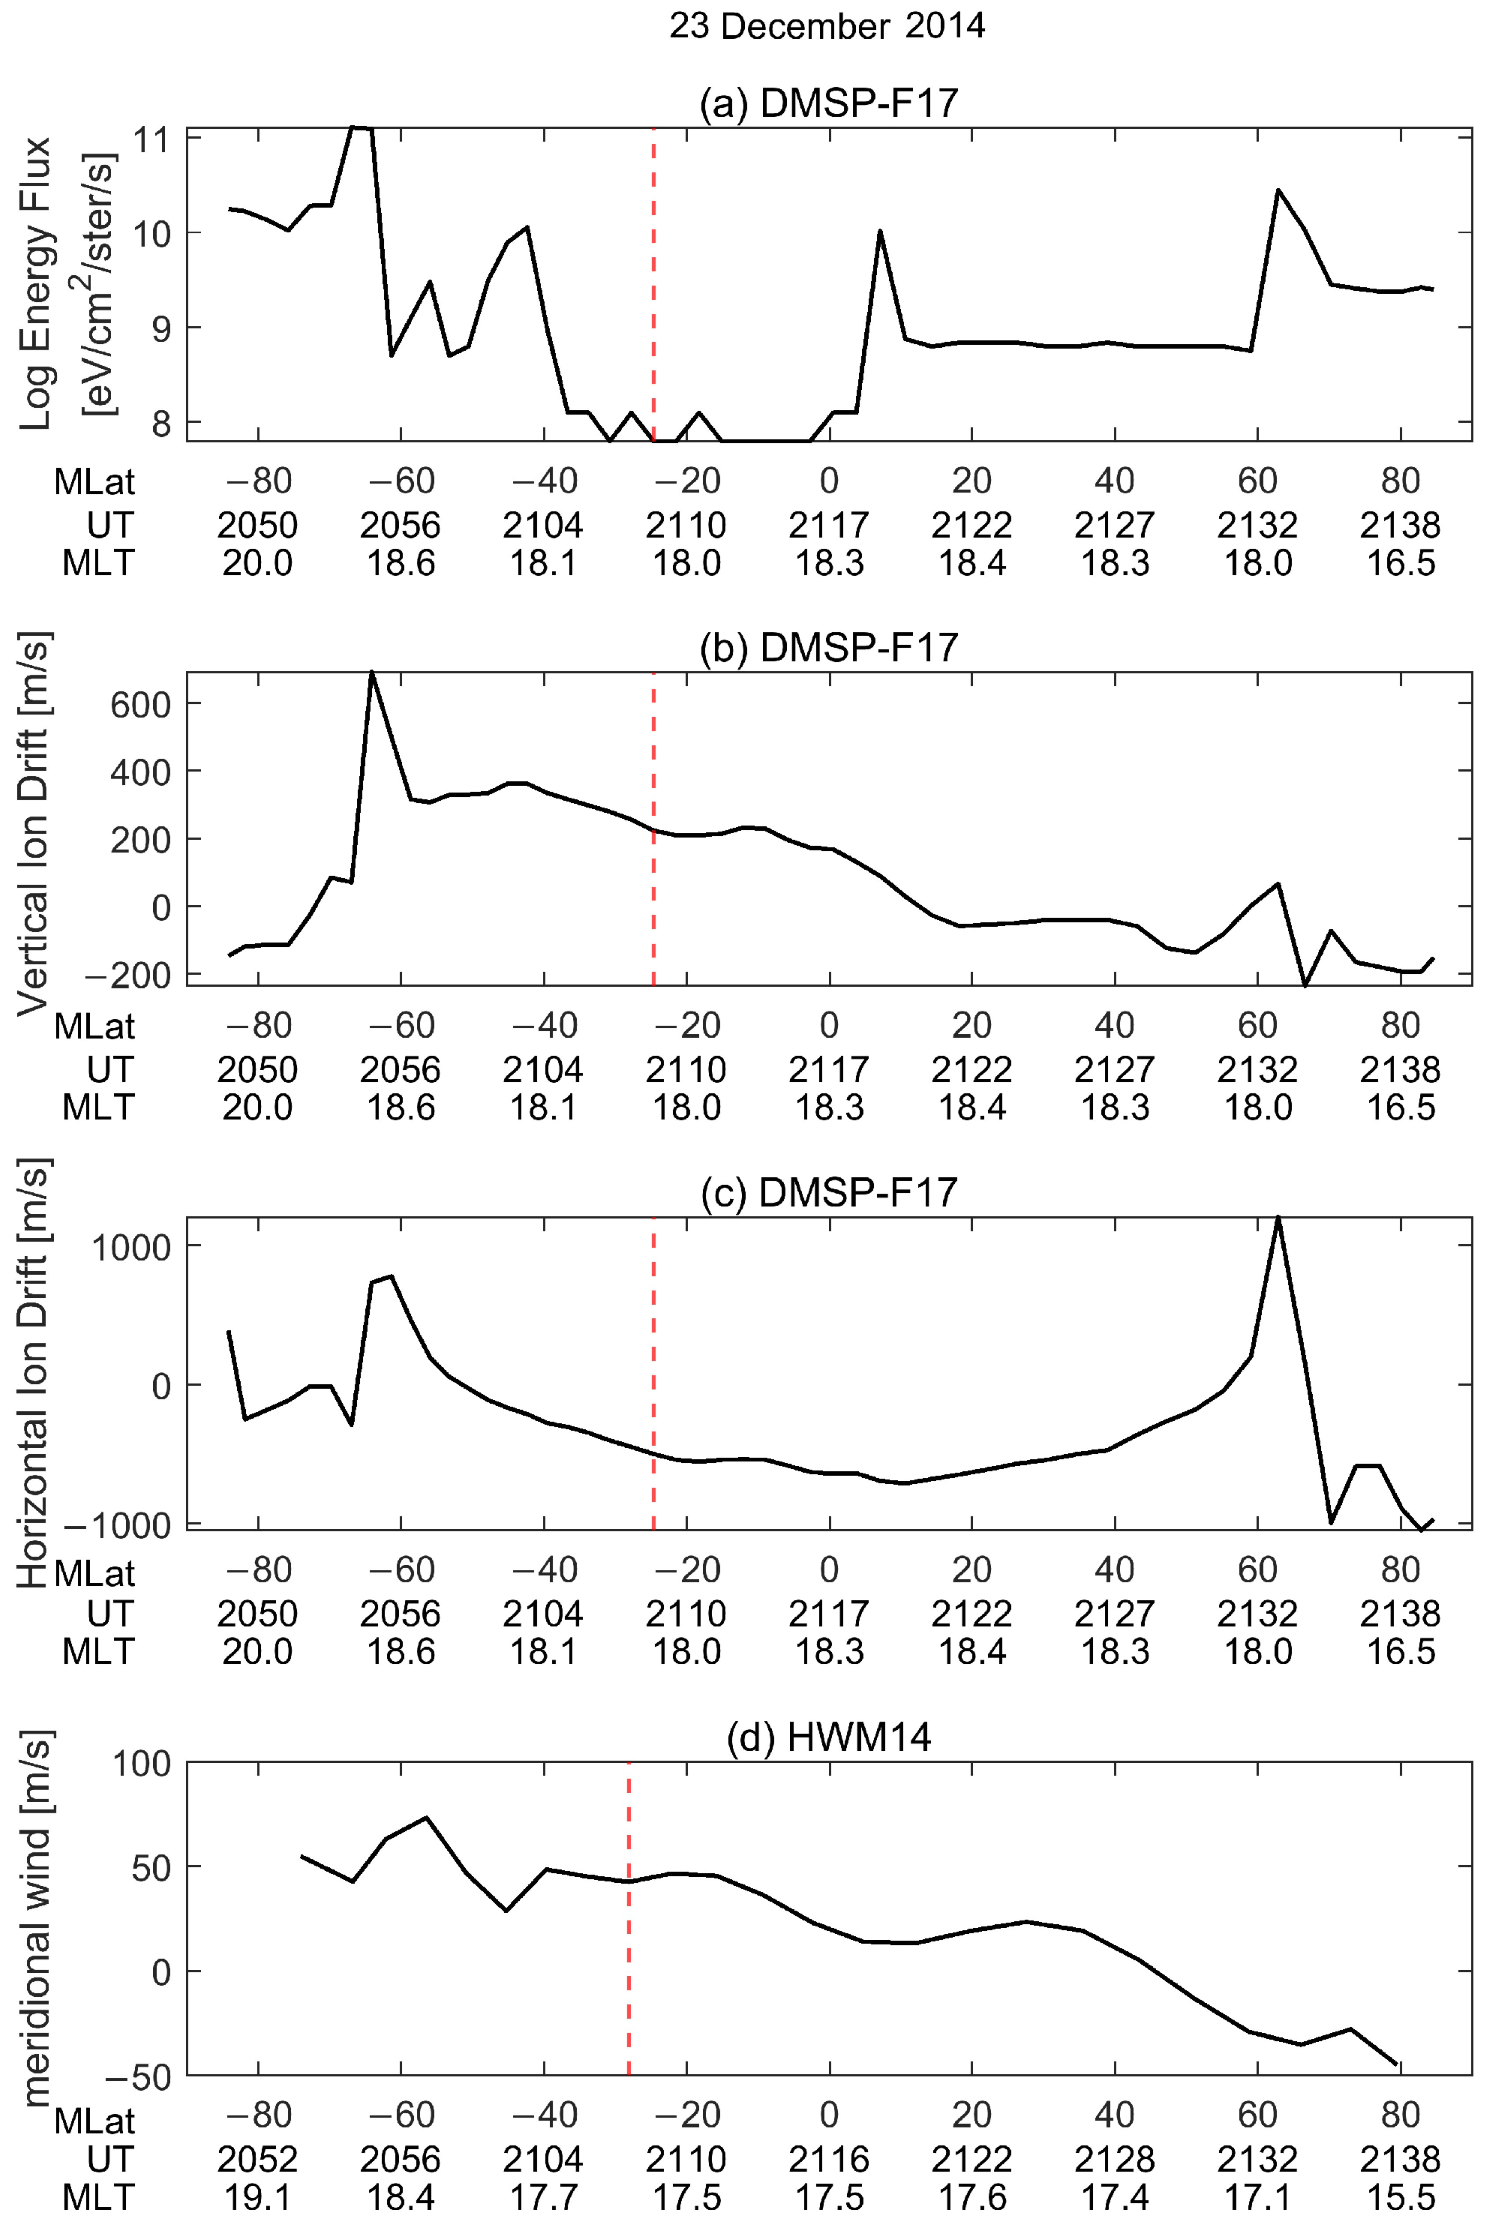
TEC disturbances can be driven by a prompt penetration electric field (PPEF), precipitation particles, convection-driven plasma redistribution, thermospheric winds and composition changes, and background ionospheric conditions [3,6,20,22,23,25,26]. Based on DMSP satellite observations and horizontal wind model (HWM) simulations, we consider three possible contributors in this work, as shown in Figure 5. Figure 5a–c show the DMSP F17 observations in the dusk sector (~18 MLT) on 23 December 2014 around the second substorm onset. Figure 5a shows the integrated electron energy flux derived from DMSP, monitoring particle precipitation. Figure 5b,c present the vertical and horizontal ion drift measurements derived from DMSP observations, respectively. These drift measurements serve as indicators of PPEF effects, because ion drifts are primarily driven by plasma E × B motion associated with electric field perturbations. Figure 5d shows meridional winds simulated by HWM14 corresponding to the times and locations of the DMSP F17 observations.
Owing to the local time limitation of satellite orbits, the interpretation is restricted to the dusk sector. Nevertheless, because the major dTEC variations in Figure 3 and Figure 4 occurred mainly from noon to dusk, this discussion remains relevant.

4.1. High-Latitude TEC Mechanisms

In Figure 5a, during the dusk sector pass of DMSP F17, the integrated electron energy flux peaked within the auroral oval around the second onset, representing strong particle precipitation during substorms. Injections of energetic magnetospheric particles and magnetic field dipolarization during substorms bring high-energy particles into the ionosphere [9,10,11,12,13,16,17,42,43]. The broad dTEC enhancement observed in polar regions in Figure 3 and Figure 4 is attributed to the enhanced ionization driven by particle precipitation [20,22,24,25,44]. At around 21:33 UT in the Northern Hemisphere, DMSP F17 measured an integrated electron energy flux peak at 17–18 MLT and 60–70° MLat, where the dTEC simultaneously reached 10 TECU (Figure 4g). A previous statistical study of 242 substorm events showed that substorm-related vertical TEC enhancements were mainly confined to the upward and downward Region 1 current systems and the Harang current system near 22.5 MLT, associated with electron precipitation originating from the plasma sheet [25]. Similarly, in Figure 4, the enhanced dTEC in the dawn sector occurred predominantly poleward of 60° GLat, corresponding to the typical Region 1 current systems. Moreover, the enhanced dTEC also occupied the Harang region, consistent with the previous study [25]. From the prenoon to dusk sectors during the first two substorms (Figure 4b–e), dTEC enhancement was largely restricted to the Region 1 current systems but later expanded into the Region 2 current systems and even lower latitudes (Figure 4g–o), likely reflecting the influence of the storm main phase.
Previous studies showed that during geomagnetic storms, enhanced dTEC at high latitudes developed in the noon to afternoon sectors as a result of SED and large-scale plasma transport. SED is generally understood as a storm time dayside mid- to high-latitude plasma enhancement produced by the combined effects of enhanced convection electric fields, plasma transport, and coupling to plasmaspheric erosion plumes [3,20,26,45]. In Figure 5b,c, downward and westward ion drift attained peaks at 61–64° MLat, near the auroral boundaries, representing intensified convection electric fields. A previous study also observed intense westward ion drift during the main phase of storms [20]. The enhanced dTEC in the prenoon to afternoon sectors was broadly consistent with the duskside branch of the two-cell convection pattern [41]. Therefore, in Figure 4, enhanced dTEC from prenoon to dusk sectors (also seen in North America in Figure 3) can be partly attributed to the SED phenomenon driven by intensified convection electric fields. Additionally, TOI, characterized by enhanced plasma density transported antisunward across the polar cap in an elongated tongue-like form, is exhibited clearly in Figure 4e–j (also seen in Figure 3e–j). The enhanced dTEC at 12–15 MLT expanded poleward and was transported to the polar cap at 19–24 MLT due to the enhanced two-cell convection in the polar cap region [46].

4.2. Midlatitude TEC Mechanisms

TEC in the prenoon to afternoon sector at middle latitudes (Figure 3 and Figure 4) showed significant enhancement as a result of broad SED. According to previous studies, enhanced dTEC at high latitudes expanded to midlatitudes and low latitudes. Then, the broad midlatitude SED was convected towards higher latitudes through the throat region separating the dawn and dusk convection cells and then extended into the polar cap as a TOI [3,41].
Over North America (Figure 3), the enhanced dTEC formed a narrow latitudinal structure extending from 0° to 45°N GLat. This is most likely associated with the development of SED, produced by intensified storm time convection electric fields and plasma transport, and possibly further strengthened by PPEF and neutral winds.
The persistent negative dTEC at midlatitudes of South America (centered at about 30° GLat) in Figure 3 might be related to local thermospheric composition change: high-latitude Joule heating during substorms drives global circulation that transports molecular-rich air equatorward, reduces the O/N2 ratio, enhances chemical recombination, and lowers F-region electron density, producing negative TEC at middle latitudes. A second likely contributor is neutral wind. Substorm energy input heats the auroral thermosphere and generates equatorward-propagating traveling atmospheric disturbances (TADs). After reaching middle latitudes, these disturbances can produce TEC troughs or sustained TEC depletion by modifying the neutral wind or depressing the F layer. Figure 3 shows that the negative dTEC over the midlatitude South American sector decreased at the third onset, after around 1 h of the first onset. Previous studies reported that storm time winds can affect equatorial winds with a time delay of 1 h [47,48], while thermospheric composition change generally needs more than 4 h [49]. Therefore, the negative dTEC is more likely associated with local electrodynamical modulation, in turn associated with neutral winds. However, the mechanism responsible for the persistent negative dTEC at South American midlatitudes remains unclear and requires further investigation through simulations and additional observations.

4.3. Low-Latitude TEC Mechanisms

An interesting structure was observed clearly in South America and eastern regions of Africa at premidnight (see Figure 3): negative dTEC disturbances developed at approximately 15°N and 15°S MLat, while positive dTEC disturbances developed around the magnetic equator. Figure 4 shows a similar distribution at 19–23 MLT. This latitudinal pattern suggests EIA suppression. Based on Swarm satellite observations, the equatorial electric field at 20:49 UT on 23 December 2014 was estimated to be −36.87 mV/m, suggesting a significant westward electric field, which drives downward plasma drift at the magnetic equator, weakens the normal upward E × B drift, and suppresses the equatorial fountain effect. As a result, the transport of plasma from the magnetic equator to the anomaly crests is reduced, leading to plasma accumulation near the equator and simultaneous depletion at low latitudes [50].
The westward electric field observed at low latitudes in the premidnight sector may be attributed to a substorm-related PPEF [14,28] and/or a disturbance dynamo electric field [30,51]. The observations and simulations shown in Figure 5b,d provide additional evidence for discussing this issue. In Figure 5b, vertical E × B ion drift increased downward at the substorm onset at 21:09 UT (18 MLT, 20°S MLat), corresponding to a westward electric field. Therefore, PPEF may contribute to the westward electric field at low latitudes in the premidnight sector. At substorm onset, cross-tail current is partially diverted along field lines into the ionosphere, forming the substorm current wedge and producing enhanced westward auroral electrojets as well as a strong nightside potential disturbance. Because the transmission of this convection-related electric field is faster than the buildup of shielding by Region 2 field-aligned currents, a westward PPEF appears promptly at premidnight low latitudes [14].
The meridional winds at 250 km simulated by HWM14 (shown in Figure 5d) were used to assess the possible contribution of disturbance-wind dynamo effects. During geomagnetically active periods, enhanced nightside high-latitude energy input heats the thermosphere and generates density bulges that propagate toward middle and low latitudes as traveling atmospheric disturbances and/or enhanced equatorward neutral winds. These equatorward winds are then deflected westward by the Coriolis force as they move to lower latitudes and generally require about 3–4 h to reach the equatorial region [14,30]. As shown in Figure 5d, the equatorward winds simulated by HWM14 exhibit only minor variations after the onset at 21:09 UT. This suggests that the disturbance dynamo electric field is unlikely to be the dominant contributor to the westward electric field observed at low latitudes in the premidnight sector. Instead, the westward electric field was more likely dominated by the substorm-related PPEF.
Since the response to the disturbances induced by storm time substorms depends on local time, the EIA suppression was the most significant at premidnight, corresponding to the South America sector in Figure 3 and Figure 4. This mechanism provides a plausible explanation for the observed combination of increased dTEC near the magnetic equator and decreased dTEC at ±15° MLat. However, this penetration mechanism can be further verified in future studies using more observational data and model simulations.
It is important to note that the results mainly reveal the physical characteristics and possible mechanisms of these three representative events, rather than universal behavior. Establishing the common features of substorm-related TEC disturbances will require future statistical studies based on the analysis of a larger number of storm time substorm events.

5. Conclusions

Based on GNSS-TEC and DMSP plasma observations, we examined the global TEC response to three successive substorms during the main phase of a geomagnetic storm on 23 December 2014. This case study highlights the complexity of energy input from consecutive overlapping substorms, and the main conclusions are as follows:
  • Storm time substorm-related TEC disturbances were strongly localized rather than globally uniform. The positive and negative dTEC disturbances developed simultaneously at different latitudes and in local time sectors and reached their largest amplitude of more than 25 TECU within 10–20 min after substorm onset.
  • At high latitudes, ionization induced by particle precipitation and SED driven by convection produced a rapid dTEC enhancement from the prenoon to dusk sectors, with a maximum amplitude of about 25 TECU within approximately 10 min.
  • The TOI developed during the storm time substorms and persisted for 100 min, enhancing dTEC from afternoon to night at high latitudes.
  • At low latitudes, EIA suppression developed with a decreased dTEC of −15.5 TECU at ±15° MLat and increased TEC of 15.8 TECU near the magnetic equator within 40 min, driven by substorm-related westward PPEFs.
Globally uniform models may not be sufficient for capturing the impacts of such events. Therefore, in order to improve the accuracy of disturbance prediction for navigation and communication systems during storms, greater weight should be given to regional/local data detection that can capture these strong localized responses, in addition to considering global indices.

Author Contributions

Conceptualization, Y.Z. and K.Z.; methodology, Y.Z. and Y.Y.; software, C.X. and K.Z.; validation, C.X. and Y.Z.; formal analysis, Y.Z. and L.T.; investigation, Y.Z. and K.Z.; resources, Y.Z.; data curation, Y.Z.; writing—original draft preparation, Y.Z. and L.T.; writing—review and editing, C.X., K.Z. and Y.Y.; visualization, L.T. and Y.Z.; supervision, Y.Z.; project administration, L.T. and Y.Z.; funding acquisition, L.T. and Y.Y. All authors have read and agreed to the published version of the manuscript.

Funding

This research was funded by the National Natural Science Foundation of China (42574236), the National Natural Science Youth Fund Project (12305214), Sichuan Science and Technology Program (2026NSFSC1427), and the Fundamental Research Funds for the Central Universities (25CAFUC04007).

Data Availability Statement

The solar wind and interplanetary magnetic field and magnetic activity index data are from NASA/GSFC’S Space Physics Data Facility’s OMNIWeb at https://spdf.gsfc.nasa.gov/pub/data/omni/ (accessed on 16 September 2025). TEC is obtained from more than 50 institutes and universities at the website https://stdb2.isee.nagoya-u.ac.jp/GPS/GPS-TEC/ (accessed on 12 September 2025). Geomagnetically quiet days are defined in a list provided by the GFZ German Re-search Centre for Geosciences at ftp://ftp.gfz-potsdam.de/pub/home/obs/kpap/quietdst/qdrecent.txt (accessed on 2 October 2025). DMSP data are from the OpenMadrigal project at https://cedar.openmadrigal.org/openmadrigal/ (accessed on 17 March 2025). Swarm data are from ESA’s website at https://swarm-diss.eo.esa.int/ (accessed on 23 May 2026). HWM14 simulations are performed using the CCMC online model interface at https://ccmc.gsfc.nasa.gov/models/HWM14~2014/ (accessed on 24 May 2026).

Conflicts of Interest

The authors declare no conflicts of interest.

References

  1. Pi, X.; Mannucci, A.J.; Lindqwister, U.J.; Ho, C.M. Monitoring of global ionospheric irregularities using the Worldwide GPS Network. Geophys. Res. Lett. 1997, 24, 2283–2286. [Google Scholar] [CrossRef]
  2. Hofmann-Wellenhof, B.; Lichtenegger, H.; Collins, J. Global Positioning System: Theory and Practice; Springer: New York, NY, USA, 1998. [Google Scholar]
  3. Shinbori, A.; Otsuka, Y.; Sori, T.; Tsugawa, T.; Nishioka, M. Temporal and spatial variations of total electron content enhancements during a geomagnetic storm on 27 and 28 September 2017. J. Geophys. Res. Space Phys. 2020, 125, e2019JA026873. [Google Scholar] [CrossRef]
  4. Skone, S.; de Jong, M. The impact of geomagnetic substorms on GPS receiver performance. Earth Planets Space 2000, 52, 1067–1071. [Google Scholar] [CrossRef]
  5. Astafyeva, E.; Yasyukevich, Y.; Maksikov, A.; Zhivetiev, I. Geomagnetic storms, superstorms, and their impacts on GPS-based navigation systems. Space Weather 2014, 12, 508–525. [Google Scholar] [CrossRef]
  6. Chen, R.H.; Nishimura, Y.; Liao, W.; Semeter, J.L.; Zettergren, M.D.; Donovan, E.F.; Angelopoulos, V. Subauroral TEC enhancement, GNSS scintillation, and positioning error during STEVE. J. Geophys. Res. Space Phys. 2024, 129, e2024JA033345. [Google Scholar] [CrossRef]
  7. Danilchuk, E.; Yasyukevich, Y.; Vesnin, A.; Klyusilov, A.; Zhang, B. Impact of the May 2024 Extreme Geomagnetic Storm on the Ionosphere and GNSS Positioning. Remote Sens. 2025, 17, 1492. [Google Scholar] [CrossRef]
  8. Fu, Z.; Shen, X.; Liu, Q.; Wang, N. Ionospheric Disturbances from the 2022 Hunga-Tonga Volcanic Eruption: Impacts on TEC Spatial Gradients and GNSS Positioning Accuracy Across the Japan Region. Remote Sens. 2025, 17, 3108. [Google Scholar] [CrossRef]
  9. Akasofu, S.I. The development of the auroral substorm. Planet. Space Sci. 1964, 12, 273–282. [Google Scholar] [CrossRef]
  10. Frey, H.U.; Mende, S.B.; Angelopoulos, V.; Donovan, E.F. Substorm onset observations by IMAGE-FUV. J. Geophys. Res. Space Phys. 2004, 109, A10304. [Google Scholar] [CrossRef]
  11. Fu, H.; Yue, C.; Zong, Q.-G.; Zhou, X.-Z.; Fu, S. Statistical characteristics of substorms with different intensity. J. Geophys. Res. Space Phys. 2021, 126, e2021JA029318. [Google Scholar] [CrossRef]
  12. Wang, H.; Lühr, H. Effects of solar illumination and substorms on auroral electrojets based on CHAMP observations. J. Geophys. Res. Space Phys. 2021, 126, e2020JA028905. [Google Scholar] [CrossRef]
  13. Zhong, Y.; Wang, H.; Zhang, K.; Xia, H.; Qian, C. Local time response of auroral electrojet during magnetically disturbed periods: DMSP and CHAMP coordinated observations. J. Geophys. Res. Space Phys. 2022, 127, e2022JA030624. [Google Scholar] [CrossRef]
  14. Kepko, L.; Mcpherron, R.L.; Amm, O.; Apatenkov, S.; Sergeev, V. Substorm current wedge revisited. Space Sci. Rev. 2015, 190, 1–46. [Google Scholar] [CrossRef]
  15. Käki, S.; Viljanen, A.; Juusola, L.; Kauristie, K. Spatio-temporal development of large-scale auroral electrojet currents relative to substorm onsets. Ann. Geophys. 2022, 40, 107–119. [Google Scholar] [CrossRef]
  16. Wing, S.; Gkioulidou, M.; Johnson, J.R.; Newell, P.T.; Wang, C.-P. Auroral particle precipitation characterized by the substorm cycle. J. Geophys. Res. Space Phys. 2013, 118, 1022–1039. [Google Scholar] [CrossRef]
  17. Partamies, N.; Tesema, F.; Bland, E.; Heino, E.; Kallelid, E. Electron precipitation characteristics during isolated, compound, and multi-night substorm events. Ann. Geophys. 2021, 39, 69–83. [Google Scholar] [CrossRef]
  18. Meredith, N.P.; Horne, R.B.; Anderson, R.R. Substorm dependence of chorus amplitudes: Implications for the acceleration of electrons to relativistic energies. J. Geophys. Res. Space Phys. 2001, 106, 13165–13178. [Google Scholar] [CrossRef]
  19. Smith, A.W.; Rae, I.J.; Forsyth, C.; Watt, C.E.J.; Murphy, K.R. On the magnetospheric ULF wave counterpart of substorm onset. J. Geophys. Res. Space Phys. 2020, 125, e2019JA027573. [Google Scholar] [CrossRef]
  20. Shiokawa, K.; Otsuka, Y.; Ogawa, T.; Igarashi, K.; Miyazaki, S.; Rich, F.J.; Saito, A.; Yumoto, Y. Comprehensive imaging observations of midlatitude ionospheric disturbances during storm time substorms. J. Geophys. Res. Space Phys. 2000, 105, 27067–27080. [Google Scholar] [CrossRef]
  21. Yuan, Z.; Tian, A.; Deng, X. Observation and Analysis of the Ionosphere Response to Substorms by GPS. J. Wuhan Univ. (Nat. Sci. Ed.) 2007, 53, 351–355. [Google Scholar]
  22. Zou, S.; Moldwin, M.B.; Coster, A.; Lyons, L.R.; Nicolls, M.J. GPS TEC observations of dynamics of the mid-latitude trough during substorms. Geophys. Res. Lett. 2011, 38, L14109. [Google Scholar] [CrossRef]
  23. Kozyreva, O.V.; Pilipenko, V.A.; Zakharov, V.I.; Engebretson, M.J. GPS–TEC response to the substorm onset during April 5, 2010, magnetic storm. GPS Solut. 2016, 21, 927–936. [Google Scholar] [CrossRef]
  24. Prikryl, P.; Weygand, J.M.; Ghoddousi-Fard, R.; Jayachandran, P.T.; Nikitina, L. Temporal and spatial variations of GPS TEC and phase during auroral substorms and breakups. Polar Sci. 2020, 28, 100602. [Google Scholar] [CrossRef]
  25. Weygand, J.M.; Wing, S. Temporal and spatial development of TEC enhancements during substorms. J. Geophys. Res. Space Phys. 2020, 125, e2019JA026985. [Google Scholar] [CrossRef]
  26. Morita, S.; Shiokawa, K.; Otsuka, Y.; Nshitani, N.; Shinbori, A.; Fujimoto, A.; Sori, T. Multiple-event study of substorm electric field penetration into middle latitudes based on simultaneous observation of 630-nm airglow enhancements at three stations. J. Geophys. Res. Space Phys. 2025, 130, e2025JA033721. [Google Scholar] [CrossRef]
  27. Liang, J.; Zou, Y.; Nishimura, Y.; Donovan, E.; Spanswick, E.; Conde, M. Neutral wind dynamics preceding the STEVE occurrence and their possible preconditioning role in STEVE formation. J. Geophys. Res. Space Phys. 2021, 126, e2020JA028505. [Google Scholar] [CrossRef]
  28. Zhong, Y.; Wang, H.; Zhang, K.; Xia, H.; Sun, Y.; Wang, C.; Cheng, Q. Responses of ionospheric F layer radial current to substorms during sawtooth events. Geophys. Res. Lett. 2024, 51, e2024GL109809. [Google Scholar] [CrossRef]
  29. Newell, P.T.; Sotirelis, T.; Liou, K.; Meng, C.-I.; Rich, F.J. A nearly universal solar wind-magnetosphere coupling function inferred from 10 magnetospheric state variables. J. Geophys. Res. Space Phys. 2007, 112, A01206. [Google Scholar] [CrossRef]
  30. Xiong, C.; Lühr, H.; Fejer, B.G. Global features of the disturbance winds during storm time deduced from CHAMP observations. J. Geophys. Res. Space Phys. 2015, 120, 5137–5150. [Google Scholar] [CrossRef]
  31. Jakowski, N.; Sardon, E.; Engler, E.; Jungstand, A.; Klahn, D. Relationships between GPS-signal propagation errors and EISCAT observations. Ann. Geophys. 1996, 14, 1429–1436. [Google Scholar] [CrossRef]
  32. Otsuka, Y.; Ogawa, T.; Saito, A.; Tsugawa, T.; Fukao, S.; Miyazaki, S. A new technique for mapping of total electron content using GPS network in Japan. Earth Planets Space 2002, 54, 63–70. [Google Scholar] [CrossRef]
  33. Rich, F.J.; Hairston, M. Large-scale convection patterns observed by DMSP. J. Geophys. Res. 1994, 99, 3827–3844. [Google Scholar] [CrossRef]
  34. Hardy, D.A.; Schmidt, L.K.; Gussenhoven, M.S.; Marshall, F.J.; Yeh, H.C.; Shumaker, T.L.; Huber, A.; Pantazis, J. Precipitating Electron and Ion Detectors (SSJ/4) for Block 5D/Flights 6-10 DMSP Satellites: Calibration and Data Presentation, Rep. AFGL-TR-84-0317; Air Force Geophysical Laboratory, Hanscom Air Force Base: Bedford, MA, USA, 1984. [Google Scholar]
  35. Newell, P.T.; Gjerloev, J.W. Evaluation of SuperMAG auroral electrojet indices as indicators of substorms and auroral power. J. Geophys. Res. Space Phys. 2011, 116, A12211. [Google Scholar] [CrossRef]
  36. Beharrell, M.J.; Honary, F.; Rodger, C.J.; Clilverd, M.A. Substorm-induced energetic electron precipitation: Morphology and prediction. J. Geophys. Res. Space Phys. 2015, 120, 2993–3008. [Google Scholar] [CrossRef]
  37. Hsu, T.-S.; McPherron, R.L. An evaluation of the statistical significance of the association between northward turnings of the interplanetary magnetic field and substorm expansion onsets. J. Geophys. Res. Space Phys. 2002, 107, 1398. [Google Scholar] [CrossRef]
  38. Morley, S.K.; Freeman, M.P. On the association between northward turnings of the interplanetary magnetic field and substorm onsets. Geophys. Res. Lett. 2007, 34, L08104. [Google Scholar] [CrossRef]
  39. Araki, T.; Shinbori, A. Relationship between solar wind dynamic pressure and amplitude of geomagnetic sudden commencement (SC). Earth Planets Space 2016, 68, 90. [Google Scholar] [CrossRef][Green Version]
  40. McPherron, R.L.; Russell, C.T.; Aubry, M.P. Satellite studies of magnetospheric substorms on August 15, 1968: 9. Phenomenological model for substorms. J. Geophys. Res. 1973, 78, 3131–3149. [Google Scholar] [CrossRef]
  41. Zhang, K.; Wang, H.; Liu, J.; Zheng, Z.; He, Y.; Gao, J.; Sun, L.; Zhong, Y. Dynamics of the tongue of ionizations during the geomagnetic storm on September 7, 2015. J. Geophys. Res. Space Phys. 2021, 126, e2020JA029038. [Google Scholar] [CrossRef]
  42. Watson, C.; Jayachandran, P.T.; Spanswick, E.; Donovan, E.F.; Danskin, D.W. GPS TEC technique for observation of the evolution of substorm particle precipitation. J. Geophys. Res. Space Phys. 2011, 116, A00I90. [Google Scholar] [CrossRef]
  43. Liou, K.; Meng, C.-I.; Lui, A.T.Y.; Newell, P.T.; Wing, S. Magnetic dipolarization with substorm expansion onset. J. Geophys. Res. Space Phys. 2002, 107, 1131. [Google Scholar] [CrossRef]
  44. Foster, J.C.; Erickson, P.J.; Nishimura, Y.; Zhang, S.R.; Bush, D.C.; Coster, A.J.; Meade, P.E.; Franco-Diaz, E. Imaging the May 2024 extreme aurora with ionospheric total electron content. Geophys. Res. Lett. 2024, 51, e2024GL111981. [Google Scholar] [CrossRef]
  45. Zou, S.; Moldwin, M.B.; Ridley, A.J.; Nicolls, M.J.; Coster, A.J.; Thomas, E.G.; Ruohoniemi, J.M. On the generation/decay of the storm-enhanced density plumes: Role of the convection flow and field-aligned ion flow. J. Geophys. Res. Space Phys. 2014, 119, 8543–8559. [Google Scholar] [CrossRef]
  46. Shinbori, A.; Kitamura, N.; Yamamoto, K.; Kumamoto, A.; Tsuchiya, F.; Matsuda, S.; Kasahara, Y.; Teramoto, M.; Matsuoka, A.; Sori, T. Characteristics of temporal and spatial variation of the electron density in the plasmasphere and ionosphere during the May 2024 super geomagnetic storm. Earth Planets Space 2025, 77, 181. [Google Scholar] [CrossRef]
  47. Emmert, J.T.; Fejer, B.G.; Shepherd, G.G.; Solheim, B.H. Altitude dependence of middle and low-latitude daytime thermospheric disturbance winds measured by WINDII. J. Geophys. Res. Space Phys. 2002, 107, 1483. [Google Scholar] [CrossRef]
  48. Scherliess, L.; Fejer, B.G. Storm-time dependence of equatorial disturbance dynamo zonal electric fields. J. Geophys. Res. Space Phys. 1997, 102, 24037–24046. [Google Scholar] [CrossRef]
  49. Bruinsma, S.; Forbes, J.M.; Nerem, R.S.; Zhang, X. Thermosphere density response to the 20–21 November 2003 solar and geomagnetic storm from CHAMP and GRACE accelerometer data. J. Geophys. Res. Space Phys. 2006, 111, A06303. [Google Scholar] [CrossRef]
  50. Aa, E.; Zhang, S.-R.; Wang, W.; Erickson, P.J.; Qian, L.; Eastes, R.; Harding, B.J.; Immel, T.J.; Karan, D.K.; Daniell, R.E. Pronounced suppression and X-pattern merging of equatorial ionization anomalies after the 2022 Tonga volcano eruption. J. Geophys. Res. Space Phys. 2022, 127, e2022JA030527. [Google Scholar] [CrossRef]
  51. Fejer, B.G.; Jensen, J.W.; Su, S.-Y. Quiet time equatorial F region vertical plasma drift model derived from ROCSAT-1 observations. J. Geophys. Res. Space Phys. 2008, 113, A05304. [Google Scholar] [CrossRef]
Figure 1. (a) TEC at 20:45 UT on 23 December 2014; (b) average TEC values of 10 geomagnetically quiet days in December 2014; (c) TEC difference (dTEC), defined by subtracting the average TEC values of 10 geomagnetically quiet days in current month from TEC, at 20:45 UT on 23 December 2014. Vertical red and blue lines represent local noon and midnight, respectively. The dashed lines represent the magnetic latitude (MLat) at a height of 300 km.
Remotesensing 18 01923 g001
Figure 2. (a) Time-integrated merging electric field, Em; (b) IMF By; (c) IMF Bz; (d) solar wind velocity, Vsw; (e) solar wind proton density, Nsw; (f) solar wind dynamic pressure, Psw; (g) auroral electrojet index, AE; (h) symmetric disturbance field in the horizontal direction H, SYM-H; and (i) asymmetric disturbance component in H, ASY-H, on 23 December 2014. The gray shaded regions represent the main phase of the geomagnetic storm. The red dashed vertical lines denote onsets of three substorms.
Remotesensing 18 01923 g002
Figure 3. Evolution of dTEC in geographic latitude–longitude coordinates from 20:35 to 22:55 UT on 23 December 2014 at an interval of 10 min. The three substorm onsets occurred at 20:44, 21:09, and 21:47 UT, marked in the subtitles. The vertical red and blue lines represent local noon and midnight, respectively. The dashed lines indicate 0° MLat at a height of 300 km.
Remotesensing 18 01923 g003
Figure 4. Temporal evolution of Northern Hemisphere (NH) dTEC in magnetic latitude (MLat)–magnetic local time (MLT) coordinates from 20:35 to 22:55 UT on 23 December 2014. The three substorm onsets occurred at 20:44, 21:09, and 21:47 UT, marked in the captions. In each polar plot, the radial direction denotes MLat from 0° to 90°, and the azimuthal direction denotes MLT, with 00 or 24 MLT at the bottom, 06 MLT on the right, 12 MLT at the top, and 18 MLT on the left. In (e), the black arrow represents SED, and the purple arrow represents TOI.
Remotesensing 18 01923 g004
Figure 5. (a) Integrated electron energy flux, (b) vertical ion drift velocity, and (c) horizontal ion drift velocity derived from DMSP F17 observations, as well as (d) meridional winds simulated by HWM14 corresponding to the times and locations of the DMSP F17 observations on 23 December 2014. Positive horizontal ion drift represents sunward ion drift, positive vertical ion drift represents downward ion drift, and positive meridional winds denote northward wind. The magnetic latitude (MLat), Universal Time (UT), and magnetic local time (MLT) are shown at the bottom of every panel. The red dashed vertical line denotes a substorm onset.
Remotesensing 18 01923 g005
Disclaimer/Publisher’s Note: The statements, opinions and data contained in all publications are solely those of the individual author(s) and contributor(s) and not of MDPI and/or the editor(s). MDPI and/or the editor(s) disclaim responsibility for any injury to people or property resulting from any ideas, methods, instructions or products referred to in the content.