1. Introduction
Urban land subsidence has become one of the most critical environmental and geohazard issues associated with rapid urbanization worldwide [
1,
2,
3]. Coastal cities are particularly vulnerable because they are commonly underlain by young and highly compressible sediments, making them more susceptible to long-term ground deformation. Traditional geodetic techniques, such as leveling and Global Navigation Satellite System (GNSS) observations, can provide high measurement accuracy; however, they are generally limited by sparse spatial coverage, high operational costs, and time-consuming data acquisition.
In contrast, Interferometric Synthetic Aperture Radar (InSAR) has emerged as an effective remote sensing technique for large-scale deformation monitoring. It has been widely applied to detect and quantify land subsidence in various metropolitan regions, including Jakarta [
4,
5], Ho Chi Minh City [
6], and Shenzhen [
7]. Compared with conventional geodetic methods, InSAR offers significant advantages in terms of wide-area coverage, high spatial resolution, and cost efficiency, enabling the generation of dense deformation measurements over extensive regions.
Despite these advantages, InSAR-derived deformation results remain affected by multiple sources of uncertainty. The fundamental principle of InSAR relies on the phase difference between at least two SAR acquisitions to estimate surface displacement, with measurements mapped at the pixel level in interferograms [
8]. Although this enables much denser spatial sampling than GNSS or leveling, each pixel generally represents an area of several square meters and may contain multiple heterogeneous scatterers [
9]. Consequently, the observed deformation signal within a single pixel is often a mixed response from different ground targets exhibiting distinct scattering characteristics and motion behaviors. This intrinsic limitation implies that even under the same processing strategy, deformation estimates may vary locally.
To address these limitations, various time-series InSAR techniques have been developed. Among them, the Small Baseline Subset (SBAS-InSAR) technique is effective for retrieving deformation over distributed scatterers, especially in densely vegetated regions [
10,
11], whereas Persistent Scatterer InSAR (PS-InSAR) provides highly precise measurements over stable point targets [
12]. Owing to their complementary characteristics, the integration of PS-InSAR and SBAS-InSAR has been widely regarded as a promising strategy for improving both spatial coverage and measurement accuracy. Previous studies have also explored the integration of InSAR with external geodetic observations, such as GNSS [
13] and leveling data [
14], demonstrating that multi-source fusion can effectively reduce uncertainties and improve deformation reliability. In theory, integrating multiple InSAR-derived datasets can provide similar benefits by combining the strengths of different techniques while mitigating their individual limitations.
In addition, due to the side-looking imaging geometry of SAR sensors, InSAR measurements are inherently acquired along the line-of-sight (LOS) direction. A common approach to overcome this limitation is to combine observations from ascending and descending tracks to retrieve vertical or even three-dimensional deformation components [
15,
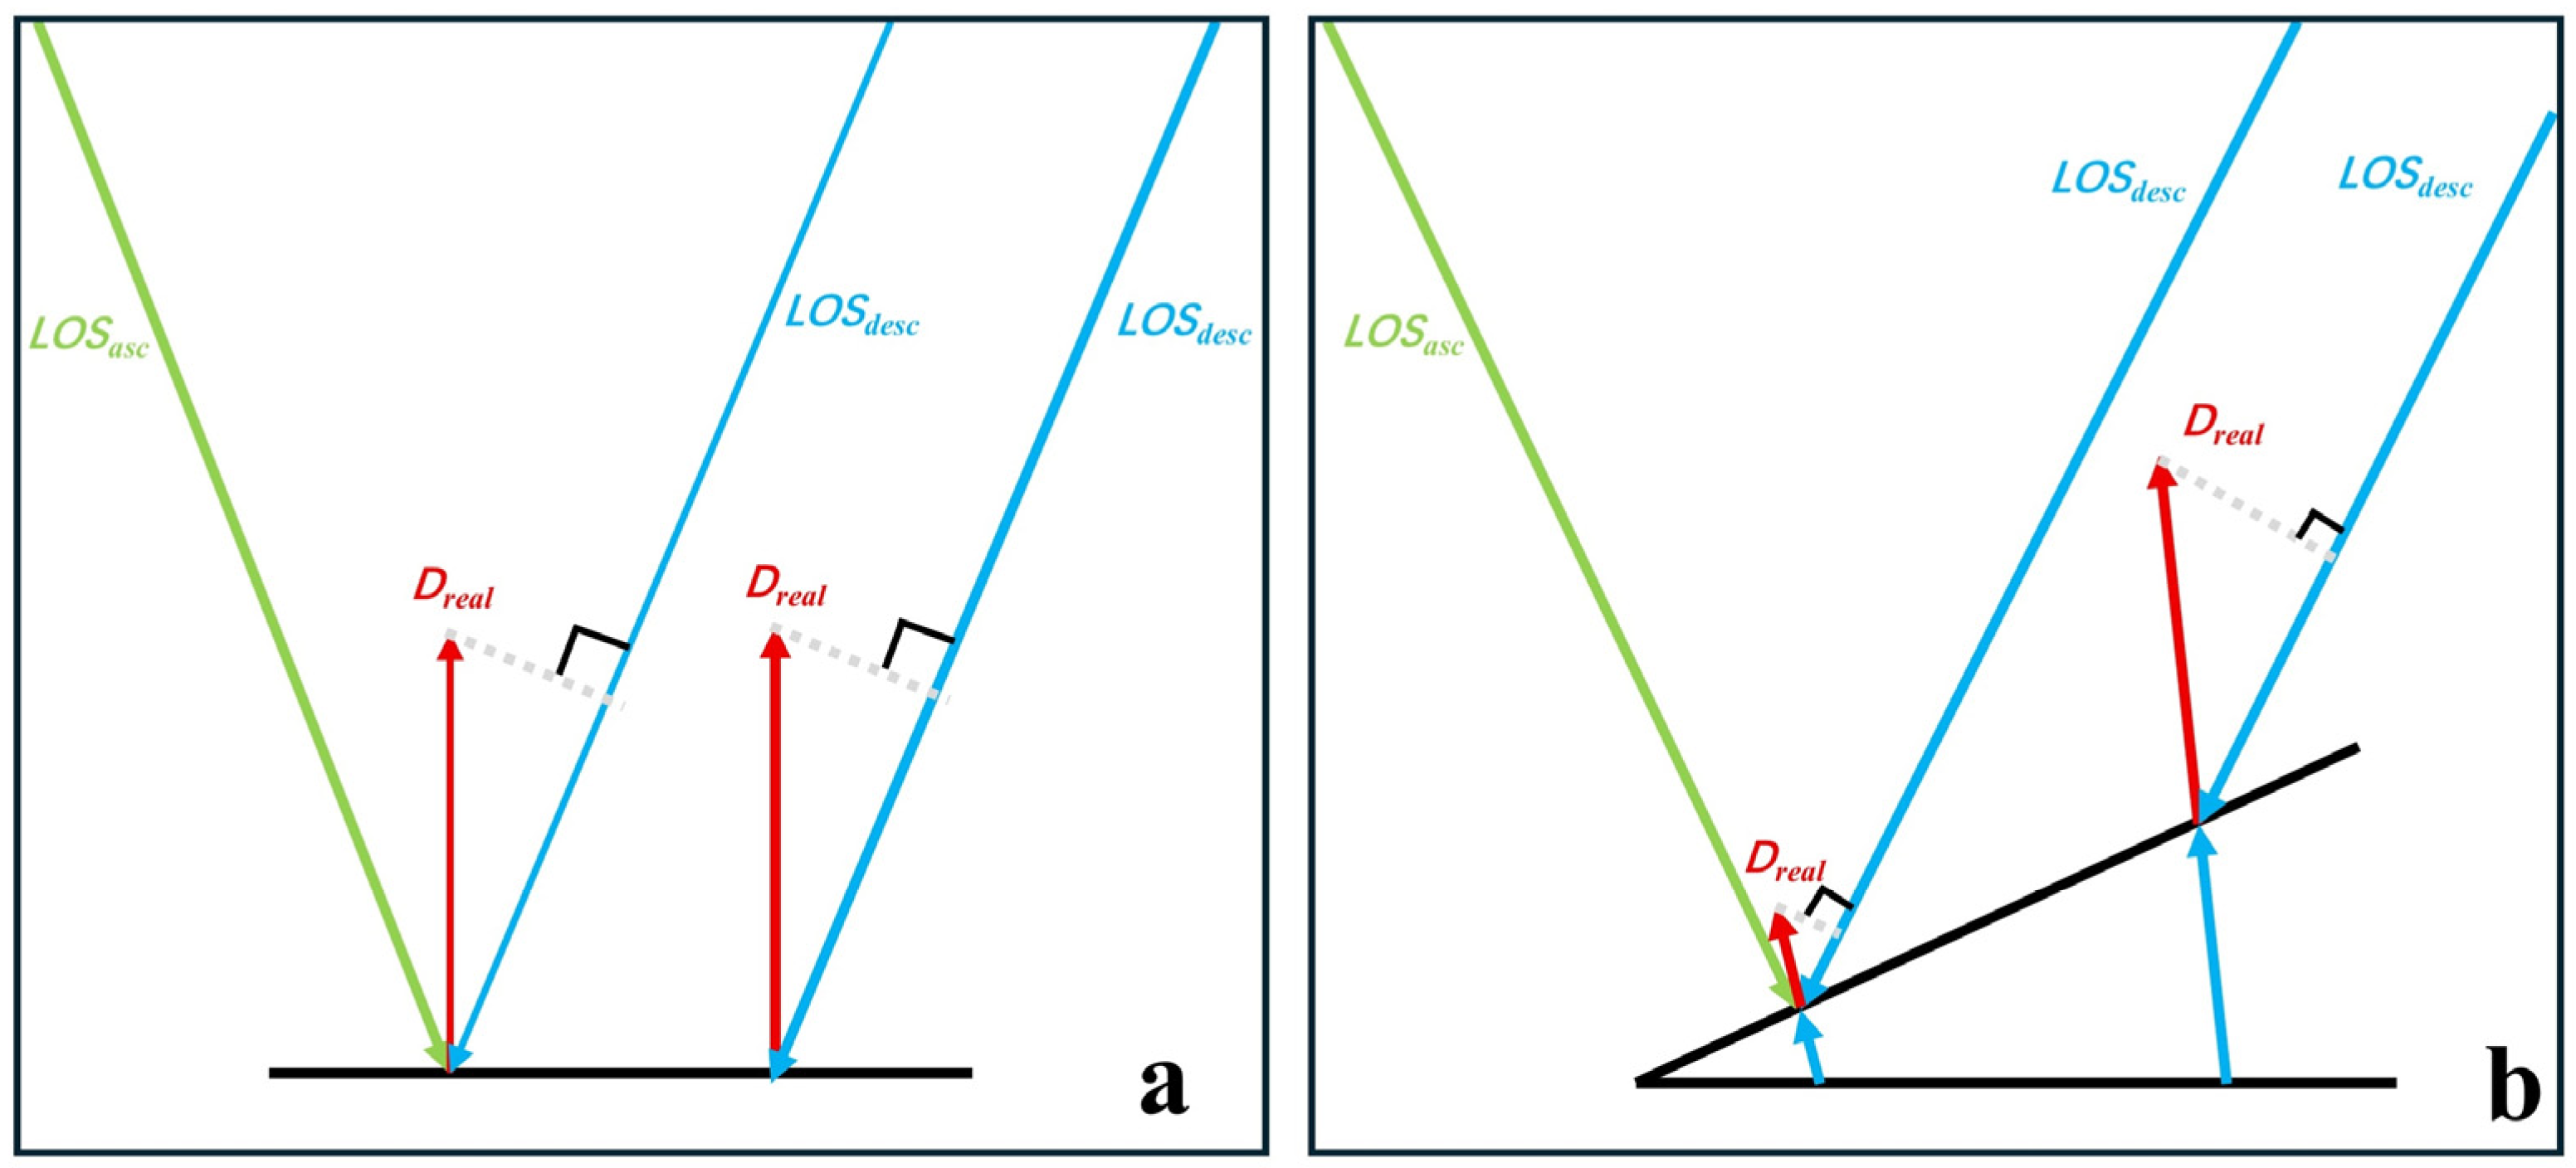
16]. However, as discussed above, observations from different tracks may correspond to different physical scatterers, even within the same pixel. As illustrated in
Figure 1a, when deformation occurs purely in the vertical direction, the LOS projections from different tracks remain consistent. In contrast, when deformation contains horizontal components, LOS measurements from different viewing geometries may differ substantially, as shown in
Figure 1b. This inconsistency becomes more significant in tropical and rapidly urbanizing regions, where dense vegetation and heterogeneous urban structures increase the probability that InSAR signals originate from different scattering targets.
Furthermore, InSAR-derived deformation results are susceptible to systematic errors caused by temporal decorrelation, atmospheric artifacts, orbital inaccuracies, and geometric distortions. An important yet often underexplored issue is the heterogeneous quality of interferometric observations. Different interferometric pairs may exhibit considerable variations in coherence and noise levels, resulting in uneven observation reliability across both spatial and temporal domains. Conventional time-series InSAR approaches generally adopt empirical weighting strategies, such as coherence-based thresholding, or simply assume uniform observation quality. However, these simplified schemes are unable to capture the complex and nonlinear relationships between multiple quality indicators and actual observation reliability. Consequently, they may introduce bias into the inversion process and reduce the robustness and accuracy of the retrieved deformation fields. This issue is particularly critical in complex urban environments, where a single observation geometry or processing technique is often insufficient for reliable deformation estimation.
In this study, an enhanced InSAR-based deformation monitoring framework is proposed by integrating PS-InSAR and SBAS-InSAR observations with an adaptive machine learning-based weighting strategy. A Random Forest model is employed to learn the relationship between multiple interferometric quality indicators and observation reliability, enabling data-driven weighting in the time-series inversion process. In addition, a Direct Merging Method (DMM) based on Cokriging is adopted to integrate deformation results obtained from different techniques and viewing geometries, thereby improving spatial consistency and facilitating vertical deformation estimation.
In time-series InSAR analysis, the reliability of interferometric observations plays a critical role in determining the accuracy and robustness of deformation estimates. Conventional weighting schemes are generally based on empirical indicators, such as interferometric coherence or temporal baseline thresholds. However, such approaches are inherently limited because they cannot effectively characterize the nonlinear relationships among multiple factors affecting observation quality, including decorrelation effects, atmospheric disturbances, and geometric distortions. To overcome this limitation, this study proposes an adaptive machine learning-based weighting strategy to quantitatively model the reliability of interferometric observations.
The main contributions of this study are summarized as follows:
(1) An adaptive machine learning-based weighting strategy is developed to quantitatively evaluate interferometric observation reliability using multiple quality indicators, replacing conventional empirical weighting schemes.
(2) A unified PS-SBAS InSAR framework with data-driven inversion is established, in which the learned weights are incorporated into time-series deformation retrieval to improve robustness against noise and decorrelation.
(3) A DMM-based multi-source integration approach is implemented to combine ascending and descending observations, thereby improving spatial continuity and enabling more reliable vertical deformation estimation.
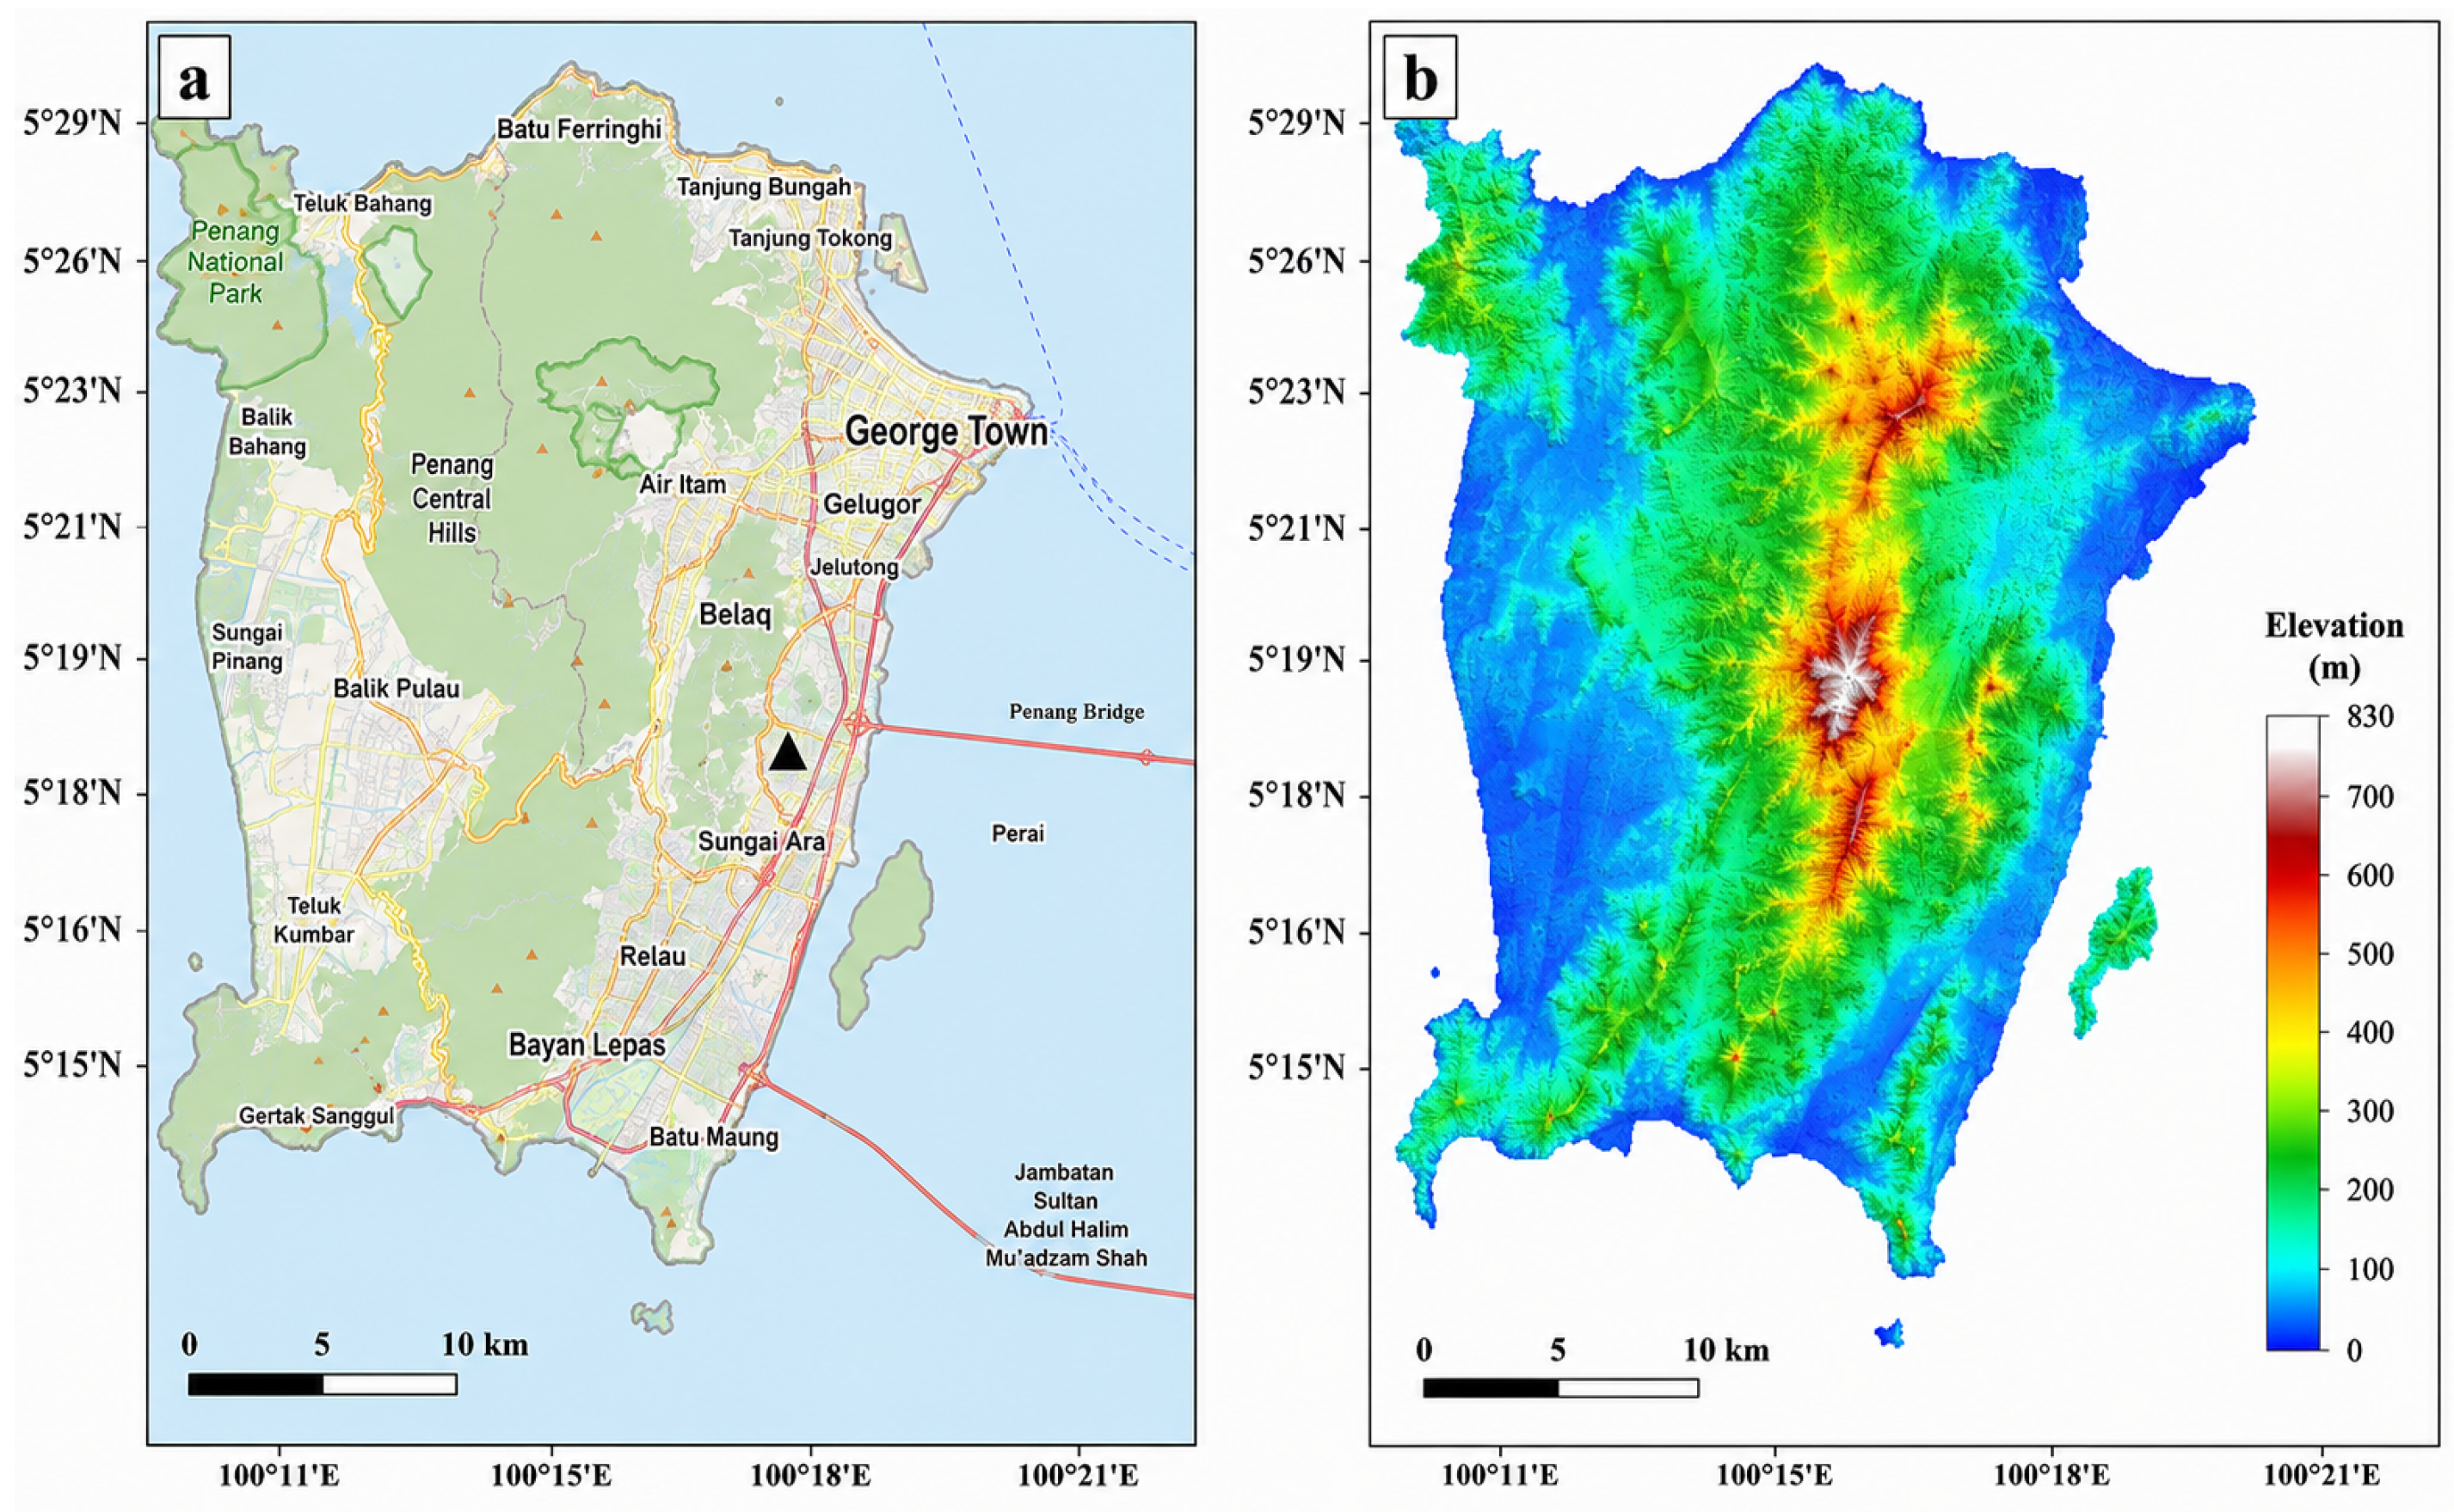
The proposed framework is applied to Sentinel-1 datasets over Penang Island, Malaysia, a typical tropical coastal region characterized by dense vegetation, rapid urbanization, and complex deformation patterns. The results demonstrate improved temporal stability and spatial consistency compared with conventional approaches, providing valuable insights into regional subsidence dynamics and offering a practical framework for large-scale deformation monitoring in complex environments.
2. Methodology
2.1. Pre-Processing
Sentinel-1 is a phase-preserving dual-polarization SAR satellite that can transmit signals in either horizontal (H) or vertical (V) polarization while receiving signals in both channels, enabling operation in VV and VH polarization modes. Previous studies have demonstrated that VV polarization is generally more suitable for InSAR applications under most conditions, and therefore it is commonly adopted without further evaluation. However, VH polarization may provide better performance in densely vegetated areas due to differences in scattering mechanisms [
17,
18].
In this study, a D-InSAR workflow was first employed to compare the performance of different polarization modes and determine the most suitable configuration for subsequent time-series analysis. Compared with a full multi-temporal InSAR (MT-InSAR) workflow, the D-InSAR approach requires significantly less computational time and is therefore more efficient for preliminary evaluation.
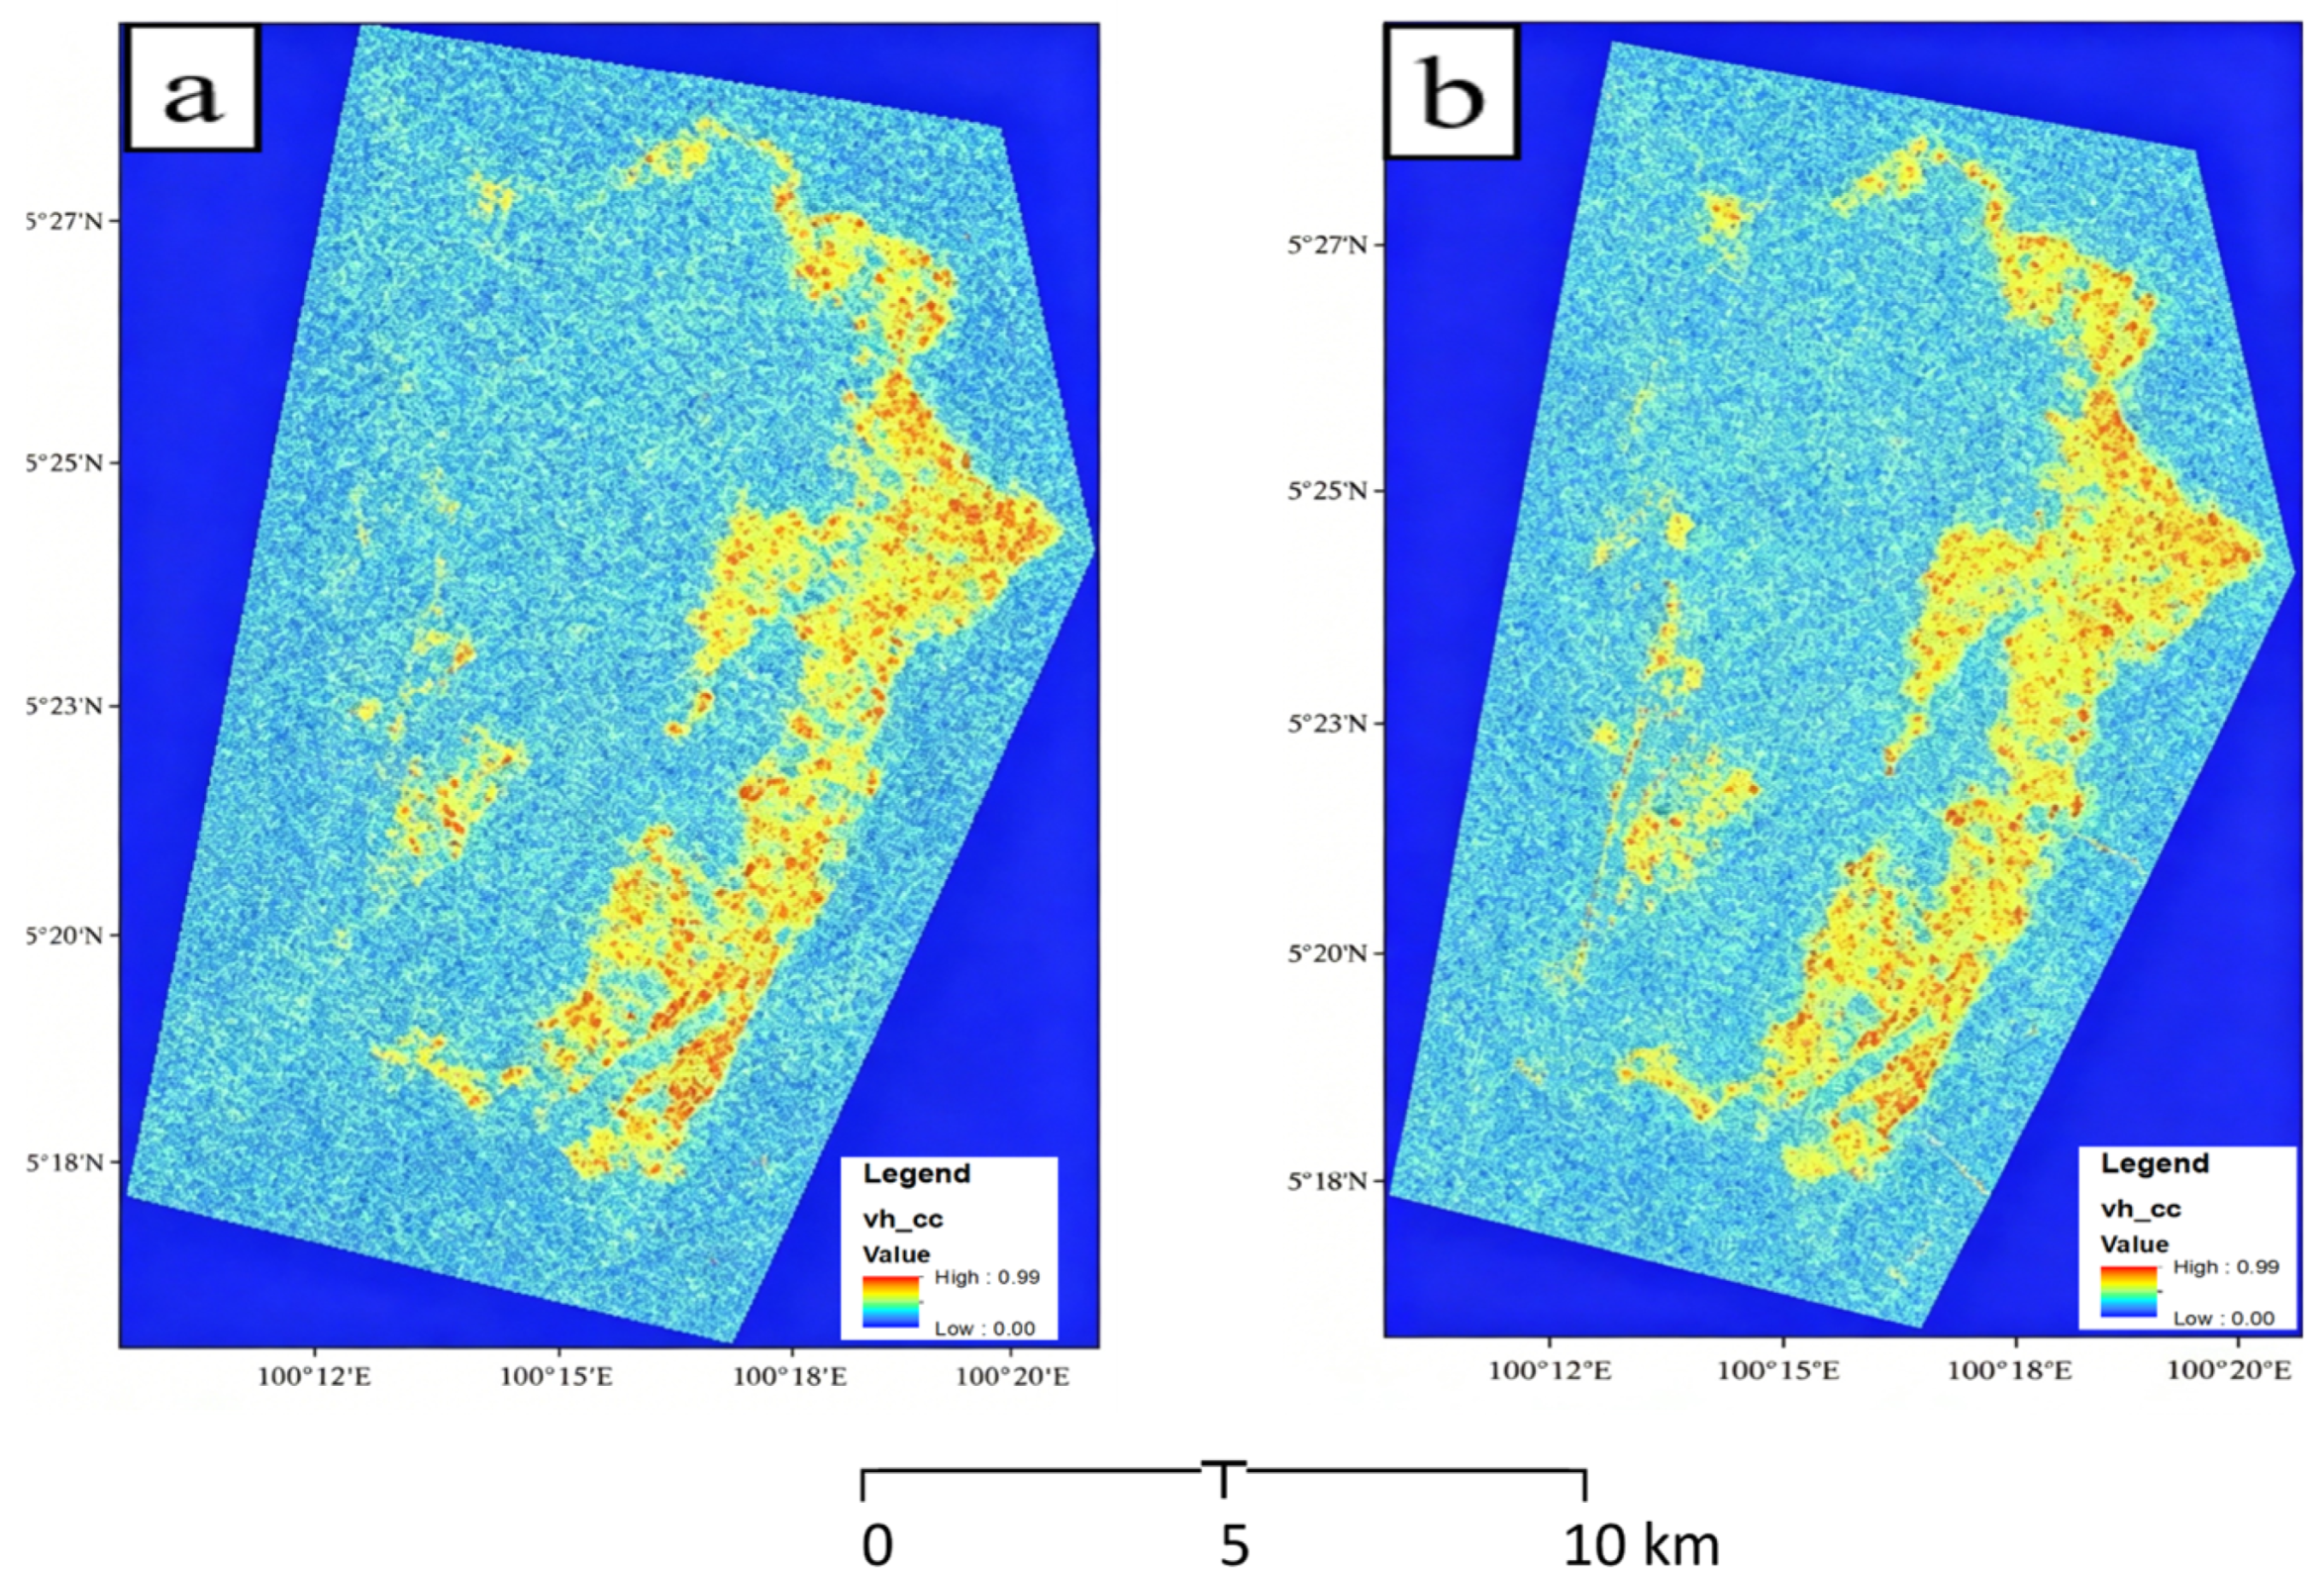
Figure 2 presents the coherence maps obtained from the two polarization modes. Visual analysis indicates that both VV and VH modes exhibit generally low coherence across the study area, although most urban and human settlement regions maintain relatively good coherence coverage. Furthermore, VV polarization exhibits broader coherent areas in suburban and rural regions, whereas VH polarization provides relatively more coherent pixels within major urban and industrial districts. These differences are closely related to the dominant scattering mechanisms associated with different land-cover types.
Based on the above analysis, VV polarization was selected for subsequent processing. Although the two polarization modes exhibit comparable overall coherence levels, VV polarization provides more spatially continuous and stable coherence coverage in suburban and rural areas, which constitute the majority of the study region. Consequently, VV polarization yields a higher density of reliable measurement points and improves the robustness of the subsequent InSAR time-series analysis.
2.2. Processing Sentinel-1 Radar Images by InSAR Techniques
As two of the most widely used time-series InSAR techniques, PS-InSAR [
19] and SBAS-InSAR [
20] were employed to retrieve land deformation. All Sentinel-1 images acquired in VV polarization mode were imported into the SARscape software (version 5.7) for subsequent processing.
The PS-InSAR technique estimates deformation by analyzing phase differences from stable point-like permanent scatterers (PSs), such as roads, buildings, rooftops, and other corner reflectors. In contrast, the SBAS-InSAR technique was developed to overcome the limitations associated with long temporal and spatial baselines in PS-InSAR, as well as its dependence on a large number of SAR images. By constructing interferometric pairs with relatively short baselines, SBAS-InSAR can effectively retrieve land deformation while reducing decorrelation effects [
20].
Considering the steep topography, dense vegetation, and generally low coherence conditions in the study area, a minimum coherence threshold of 0.35 was adopted in the PS-InSAR processing. In addition, maximum temporal and perpendicular baselines of 200 days and 300 m, respectively, were applied to reduce decorrelation effects. These parameters were selected based on empirical experience and commonly adopted settings in previous InSAR studies. The relatively moderate coherence threshold was chosen to balance phase quality and spatial coverage, while the temporal and spatial baseline constraints were intended to minimize decorrelation while preserving a sufficient number of interferometric pairs.
The Shuttle Radar Topography Mission (SRTM) Digital Elevation Model (DEM) was used to remove the topographic phase component in both processing workflows. In addition, the Goldstein filtering method was applied with multi-looking factors of 5 in the range direction and 1 in the azimuth direction to improve the signal-to-noise ratio (SNR). The Minimum Cost Flow (MCF) method [
21] and the Delaunay 3D method [
22] were employed for phase unwrapping using a threshold of 0.3.
For the SBAS-InSAR processing, 40 ground control points (GCPs) selected from stable high-coherence areas and uniformly distributed across the study region were used to refine orbital errors and retrieve land deformation. The residual topographic phase was subsequently removed, following the standard SBAS-InSAR processing procedure [
21]. Furthermore, atmospheric decorrelation effects were mitigated using high-pass filtering in the temporal domain (300 days) and low-pass filtering in the spatial domain (1200 m).
Finally, the deformation time-series inversion was further enhanced using the proposed adaptive machine learning-based weighting strategy, as described in
Section 2.4.
2.3. Post-Processing
As shown in
Figure 1a, when land deformation occurs primarily in the vertical direction, the vertical deformation component can be estimated as:
where
θ is the local incidence angle,
denotes the deformation measured in the line-of-sight (LOS) direction, and
represents the vertical deformation component. In urban areas, deformation is often dominated by vertical motion; therefore, this relationship has been widely used to approximate vertical land deformation [
23,
24]. However, horizontal displacement may still occur in many situations, and the use of a single viewing geometry can introduce inconsistencies into the deformation estimates. Moreover, InSAR observations acquired under different imaging geometries and acquisition conditions may exhibit discrepancies, particularly in densely vegetated regions where persistent scatterers are sparse [
25,
26,
27]. These limitations reduce the reliability of deformation estimates derived from a single InSAR technique.
To address these issues, this study adopts the Direct Merging Method (DMM), which integrates PS-InSAR and SBAS-InSAR results using the ordinary Cokriging method [
28,
29,
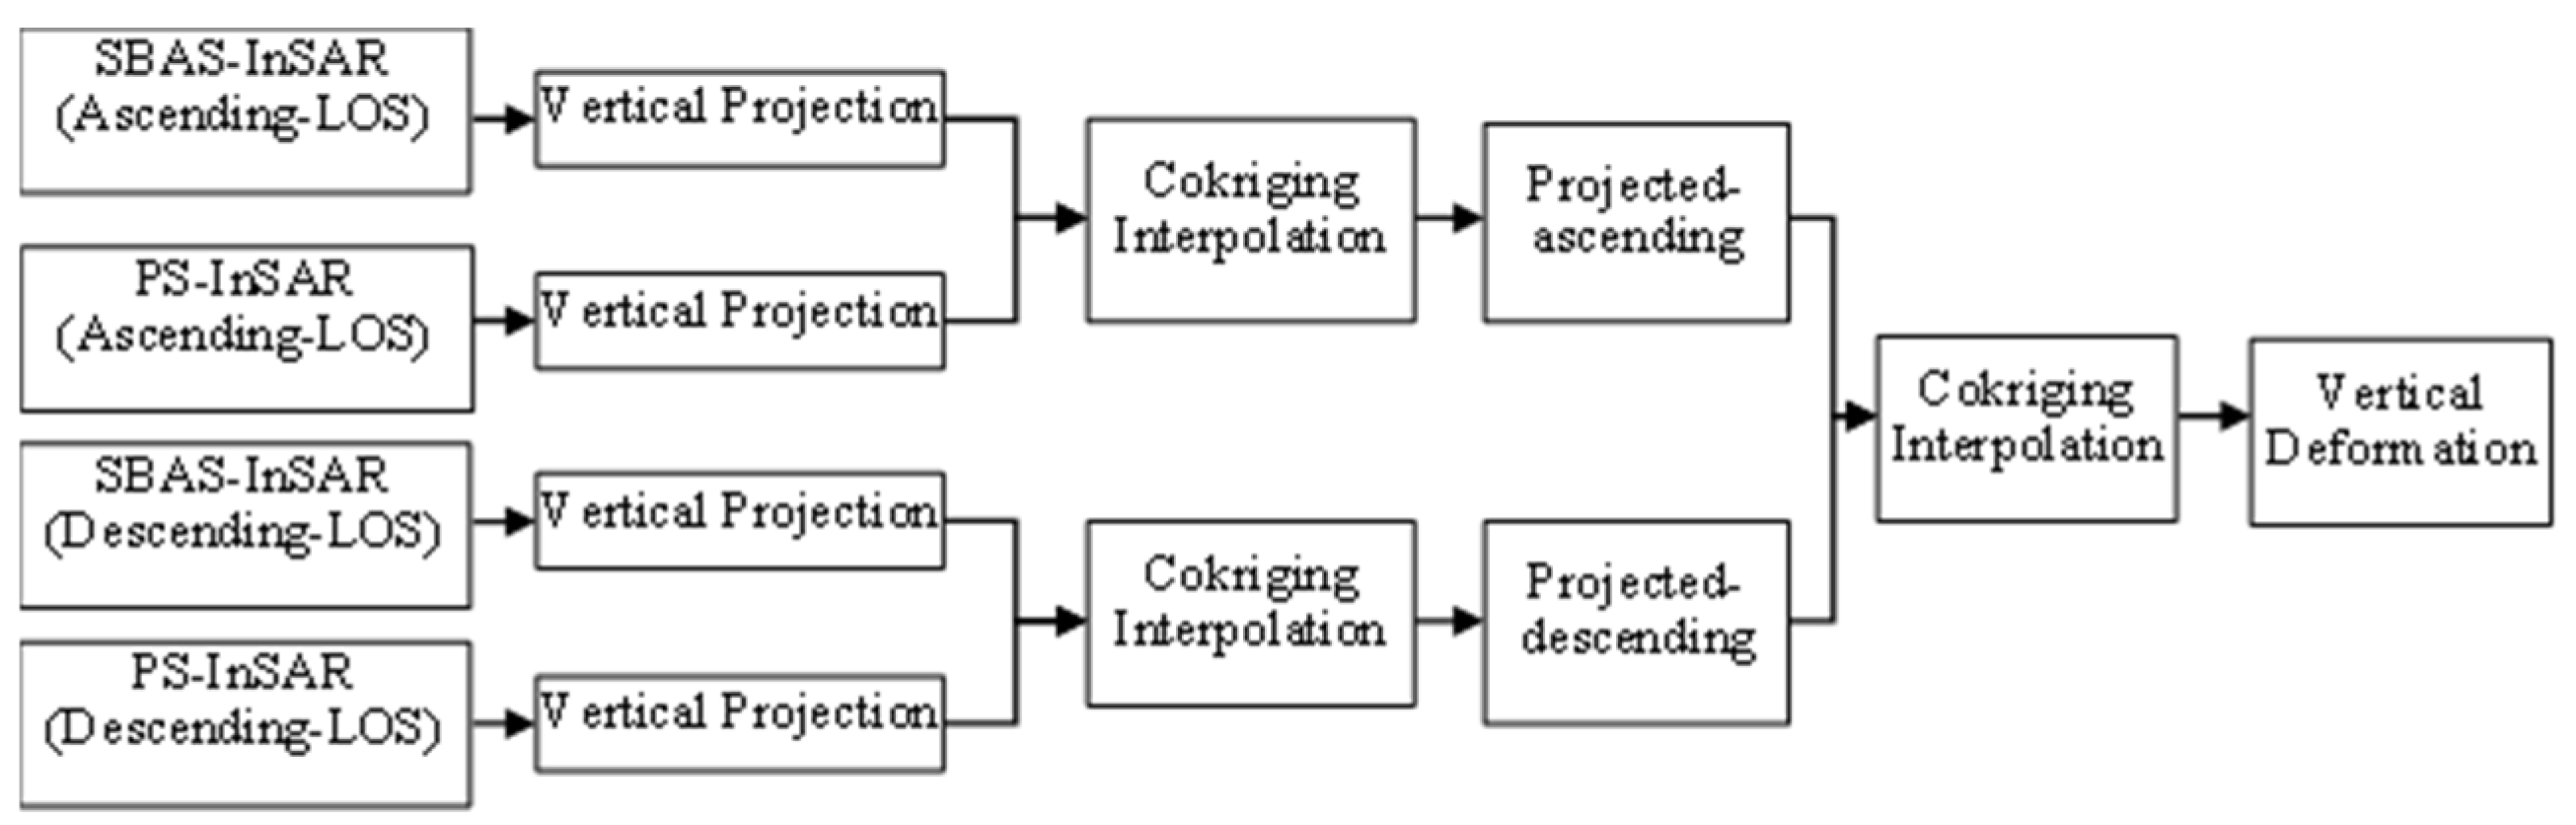
30]. For clarity, the DMM procedure is implemented as a sequential workflow consisting of three major steps: LOS projection, PS/SBAS fusion, and ascending/descending integration.
(1) LOS projection: All InSAR-derived deformation measurements are first projected from the LOS direction into the vertical direction using Equation (1). To ensure consistency among datasets, all InSAR results are further converted into a unified spatial reference system and data format through GIS-based processing.
(2) PS-InSAR and SBAS-InSAR fusion: For each orbit direction (ascending and descending), the projected PS-InSAR and SBAS-InSAR results are integrated using the ordinary Cokriging method. In this process, the PS-InSAR results are treated as the primary variable because of their higher precision over stable scatterers, whereas the SBAS-InSAR results are used as the secondary variable to improve spatial coverage.
(3) Ascending and descending integration: After generating fused deformation fields for both ascending and descending tracks, a second Cokriging process is performed to integrate the two datasets. In this stage, the ascending-track results are defined as the primary variable and the descending-track results as the secondary variable, enabling the estimation of the final vertical deformation field.
The overall workflow is illustrated in
Figure 3. Although the proposed post-processing procedure improves spatial consistency and reduces residual artifacts, it does not explicitly consider the heterogeneous reliability of interferometric observations. This issue is further addressed through the adaptive weighting strategy described in
Section 2.4.
2.4. Machine Learning-Based Adaptive Weighting Strategy
The adaptive weighting strategy mentioned above is implemented as follows: A Random Forest (RF) regression model is employed to learn the mapping between multiple quality-related features and the corresponding observation reliability.
For each interferometric pair, a set of descriptive features is constructed to characterize its quality. These features are selected because they capture different aspects of interferometric quality: coherence reflects phase stability, temporal and perpendicular baselines describe geometric and temporal decorrelation effects, amplitude stability indicates scattering consistency, spatial phase variance represents phase noise, and signal-to-noise ratio characterizes data quality. This set constitutes the primary quality indicators used in the Random Forest model for adaptive weighting. Let the feature vector for the
i-th interferometric observation be defined as:
where
d denotes the number of features.
A critical step in supervised learning is the construction of reliable training labels. In this study, the observation reliability is indirectly quantified based on the consistency of interferometric phases within redundant observation networks or through residual analysis after preliminary inversion. Specifically, interferometric pairs with lower phase residuals are considered more reliable, while those with higher residuals are assigned lower reliability scores. The target variable
is defined as a normalized reliability indicator:
where
represents the phase residual or an equivalent error metric for the
i-th interferogram, defined as the difference between the observed interferometric phase and the modeled phase obtained from a preliminary time-series inversion. This residual reflects the mismatch between observations and the estimated deformation model and is used to characterize the reliability of interferometric measurements.
To ensure the reliability of the training labels, a sufficient number of interferometric samples were collected from the entire dataset. In this study, approximately 10,000 interferometric observations were used to train the model. Prior to training, a preprocessing step was applied to remove abnormal samples. Specifically, interferometric pairs with extremely large residuals (top 5%) were considered outliers and excluded from the training dataset to prevent bias in the learned mapping. Regarding feature selection, the chosen input variables were designed to capture complementary aspects of interferometric quality. Interferometric coherence reflects phase stability and is widely recognized as a primary indicator of measurement reliability. Temporal and perpendicular baselines characterize temporal and geometric decorrelation effects, respectively. Spatial phase variance provides a direct measure of phase noise, while amplitude stability describes the consistency of scattering behavior over time. In addition, the signal-to-noise ratio (SNR) is included to quantify the overall data quality. To avoid redundancy among input variables, the correlation between features was preliminarily analyzed using pairwise correlation coefficients. Although moderate correlations exist between some variables (e.g., coherence and phase variance), they are not fully redundant and represent different physical aspects of data quality. Therefore, all selected features were retained to preserve complementary information for the Random Forest model.
The Random Forest model is used to approximate the nonlinear mapping:
Random Forest is an ensemble learning method that constructs multiple decision trees using bootstrap sampling and random feature selection, and aggregates their predictions to improve generalization performance and reduce overfitting.
The predicted reliability for each observation is then given by:
where
represents the estimated weight of the
i-th interferometric pair.
The estimated weights are incorporated into the time-series deformation inversion as a weighted least squares (WLS) problem. Let the InSAR observation model be expressed as:
where
A is the design matrix,
d is the deformation parameter vector,
is the observed interferometric phase vector.
The weighted inversion is formulated as:
where
is the diagonal weight matrix derived from the RF model. This formulation ensures that observations with higher predicted reliability contribute more significantly to the inversion, while noisy or decorrelated observations are effectively suppressed.
To ensure reproducibility and robustness of the Random Forest (RF) model, the main hyperparameters were explicitly configured. In this study, the number of decision trees was set to 200, which provides a good balance between prediction stability and computational efficiency. The maximum tree depth was limited to 15 to prevent overfitting, while the minimum number of samples required at each leaf node was set to 5 to improve generalization. Regarding the training strategy, the dataset consisting of interferometric observations was randomly divided into training and validation subsets with a ratio of 70–30%. In addition, a 5-fold cross-validation scheme was employed during model development to ensure robustness and reduce sensitivity to data partitioning. The final model was selected based on the lowest validation error. Furthermore, the relative importance of input features was evaluated using the built-in feature importance measure of the RF model. The results indicate that interferometric coherence and spatial phase variance are the most influential factors in predicting observation reliability, followed by temporal baseline and signal-to-noise ratio (SNR). In contrast, perpendicular baseline and amplitude stability show relatively lower contributions. This finding is consistent with the physical understanding that phase stability and noise characteristics dominate the quality of interferometric measurements.
To provide an overall view of the proposed framework, the complete processing workflow can be summarized as follows. First, Sentinel-1 SAR data are preprocessed and analyzed using both PS-InSAR and SBAS-InSAR techniques to obtain deformation measurements. Next, multiple interferometric quality indicators are extracted, and a Random Forest-based model is employed to estimate observation reliability and derive adaptive weights. These weights are incorporated into the time-series inversion to improve robustness. Subsequently, the deformation results from PS-InSAR and SBAS-InSAR are integrated using the Direct Merging Method (DMM), followed by the combination of ascending and descending observations to obtain the final vertical deformation field. This unified framework enables reliable and spatially consistent deformation monitoring by combining multi-source InSAR information with data-driven weighting.
4. Discussion
4.1. Performance and Limitation
As shown in
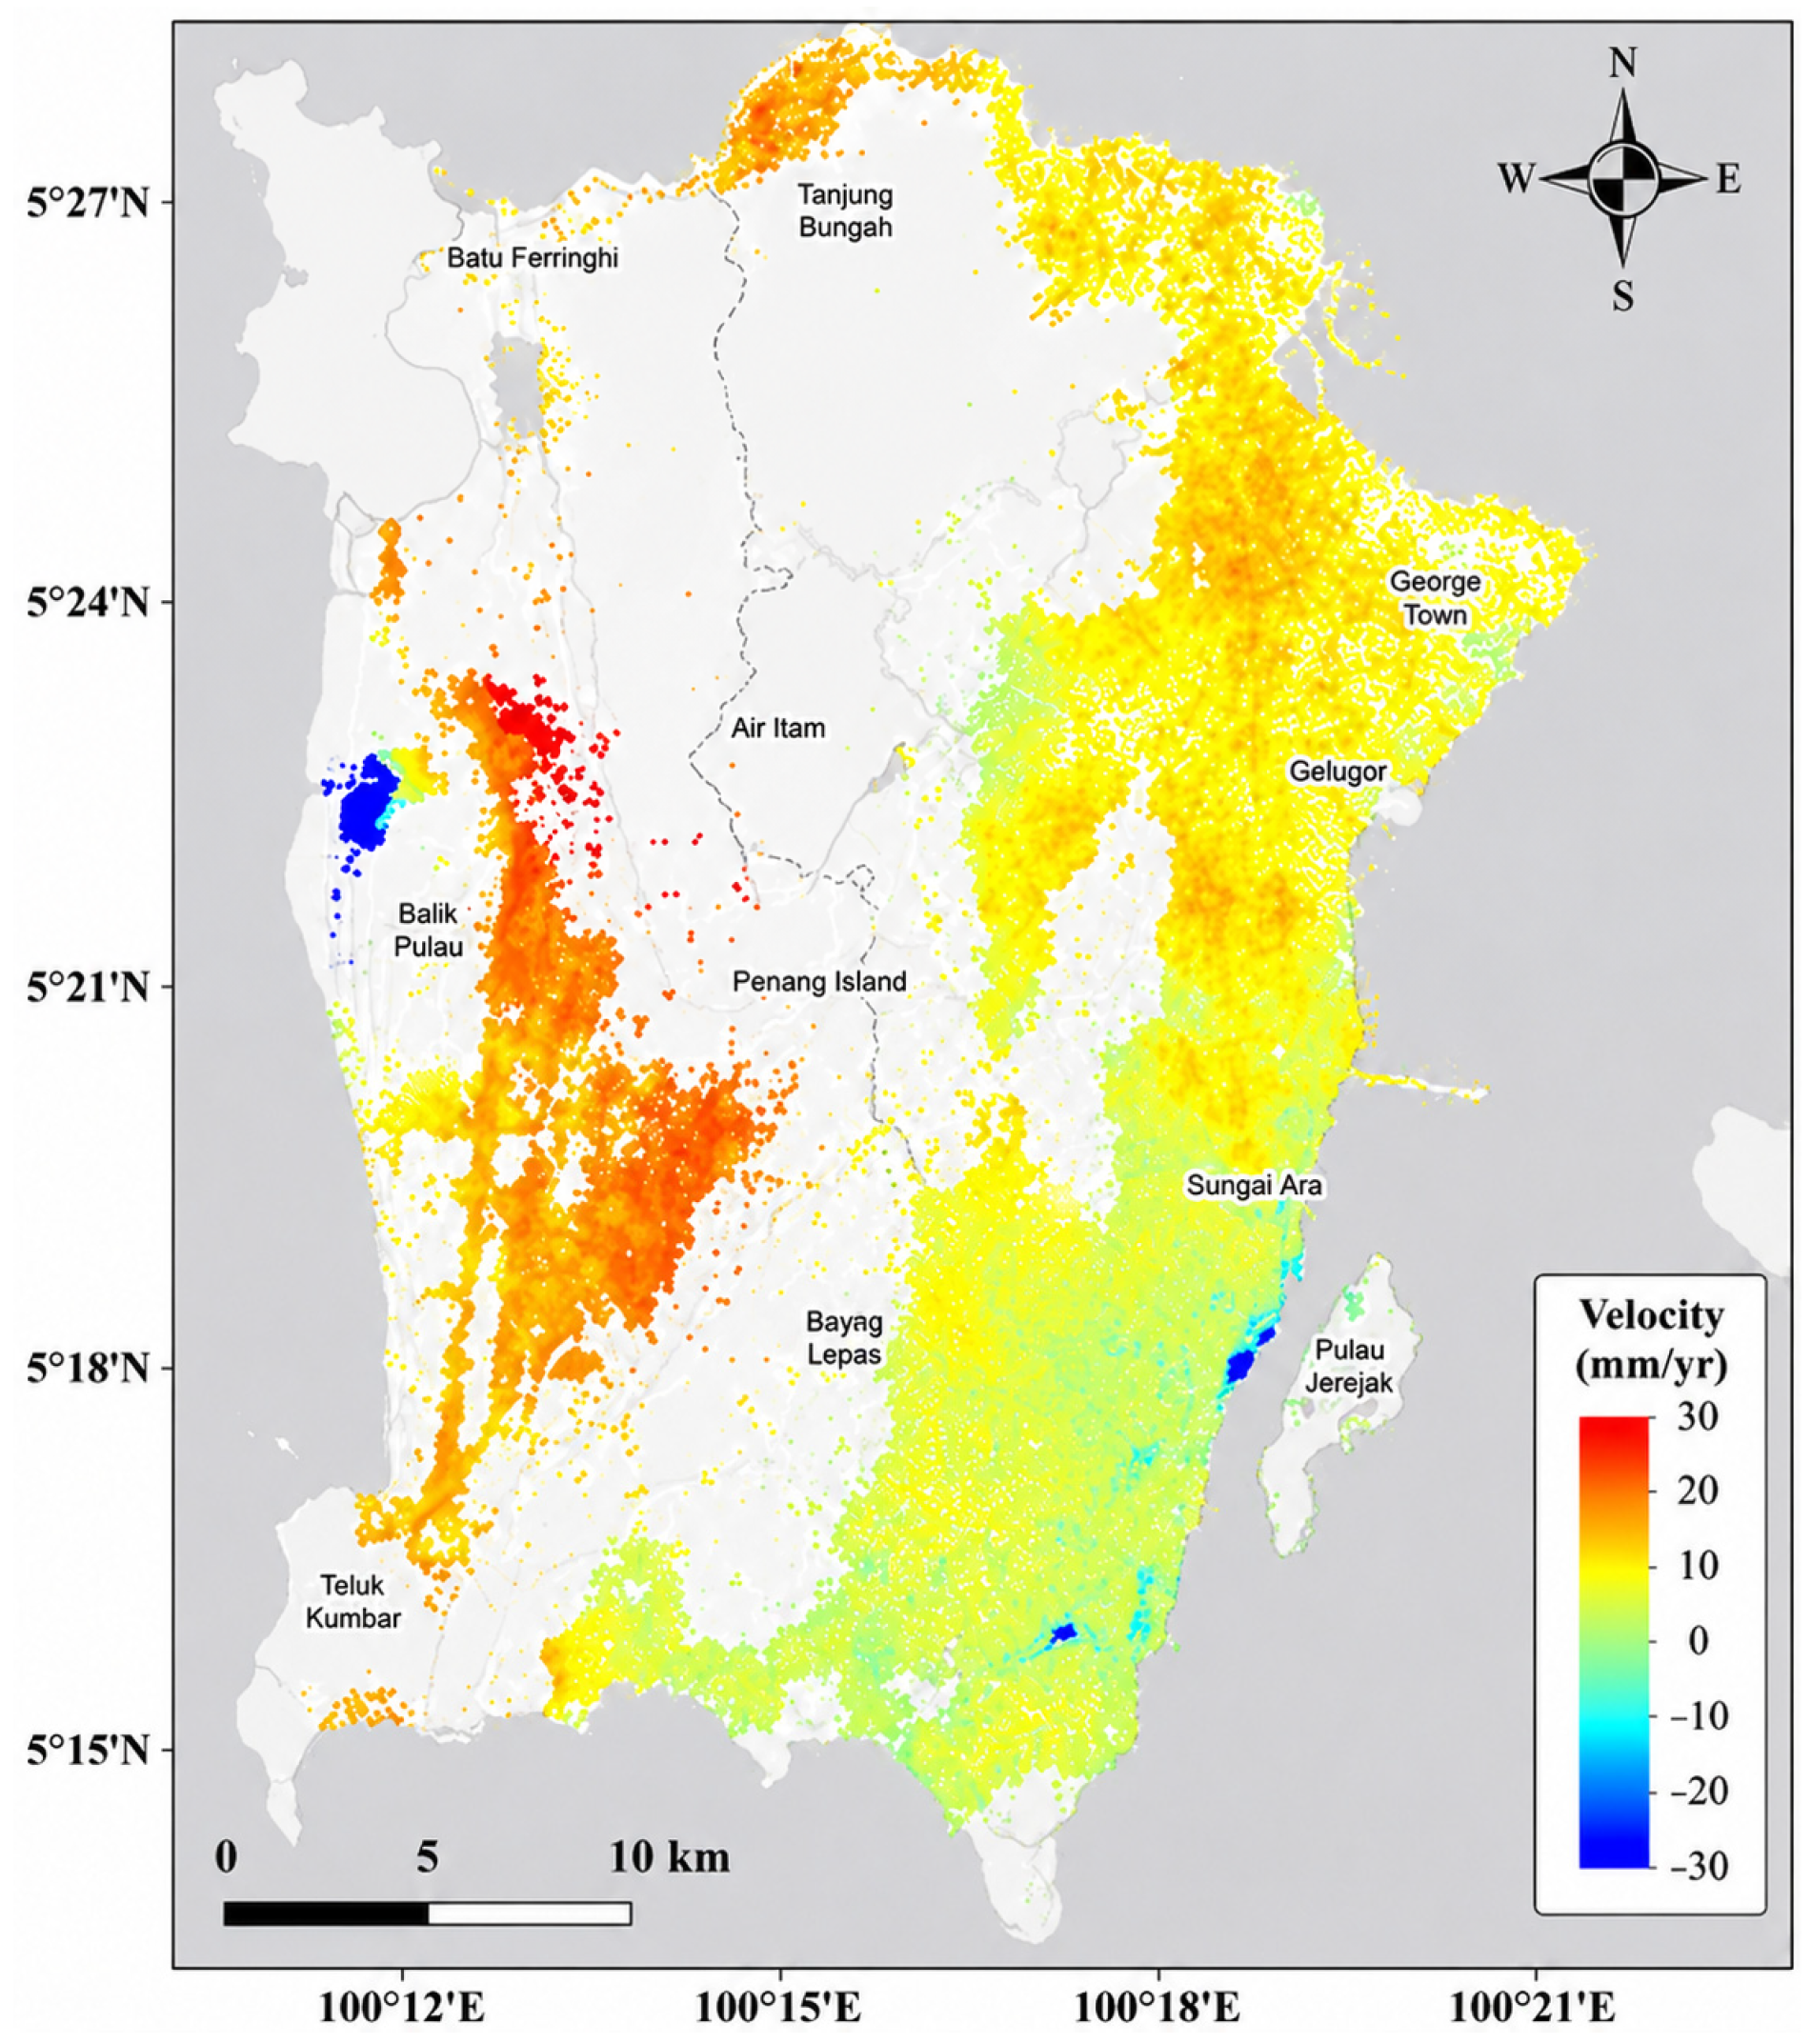
Figure 5, the land deformation results derived from different methods exhibit generally consistent spatial patterns. The most significant subsidence is concentrated along the western coastal region of the island, whereas slight uplift is observed in the northern and parts of the western inland areas. Overall, the deformation rates tend to decrease gradually from coastal regions toward inland areas. In addition, the DMM approach identifies land subsidence across approximately 71.73 km
2 of the island. Visual inspection indicates that the major deformation zones are clearly delineated in the DMM results and exhibit relatively continuous spatial distributions. Compared with individual InSAR-derived deformation products, the DMM provides a more spatially coherent representation of the deformation field, particularly in regions characterized by subtle deformation variations.
Although only one GNSS station (USMP) is available on the island, it still provides a useful reference for comparison with the InSAR-derived results. Din et al. reported a vertical deformation rate of approximately −0.9 mm/year with a standard error of 0.04 mm/year in Penang Island during the period from 1999 to 2011 [
35], whereas Blewitt et al. estimated a deformation rate of approximately −0.84 mm/year with a standard error of 2.40 mm/year over the past two decades [
36]. In comparison, the DMM result obtained in this study indicates a vertical deformation rate of approximately 0.31 mm/year at the corresponding location. Although discrepancies exist in both deformation magnitude and direction, the InSAR-derived result remains within the same order of magnitude as the GNSS-based estimates. These differences may be attributed to variations in observation periods, spatial representativeness, reference frameworks, and methodological assumptions. Therefore, the comparison should be regarded as a qualitative consistency assessment rather than a rigorous quantitative validation.
Due to the near-polar orbit configuration and right-looking imaging geometry of Sentinel-1, the incidence angles of ascending and descending observations can be considered approximately comparable under simplified SAR imaging assumptions, while the north–south deformation component is assumed to be negligible. Based on these assumptions, ascending and descending observations are combined to estimate the vertical deformation component. In this study, a weighted averaging strategy is further adopted to improve the robustness of the deformation estimation. This strategy helps reduce the influence of local errors and improves the spatial completeness of the retrieved deformation field.
Nevertheless, several limitations remain in the proposed framework. First, the assumption of negligible north–south deformation may introduce uncertainties in areas affected by significant horizontal motion. Second, the reliability labels used in the Random Forest model are indirectly derived from residual analysis rather than external ground truth observations, which may influence the accuracy of the learned weighting relationship. In addition, the limited availability of GNSS observations restricts the quantitative validation of the deformation results. Furthermore, despite the application of adaptive weighting and multi-source integration, residual atmospheric artifacts and decorrelation effects may still affect the deformation estimates in densely vegetated regions.
Because no universally accepted deformation threshold exists for the occurrence of geological hazards, the spatial extent and spatial distribution characteristics of land deformation are considered more meaningful for regional hazard assessment than the absolute deformation magnitude alone.
4.2. The Reasons for Land Subsidence
4.2.1. Land Deformation and Transport Networks
As an industrialized island, transportation networks play a critical role in the urban development of Penang Island. Although the island contains a dense road network, most roads are classified as tertiary roads, whereas only a limited number are major highways. In recent years, several new highway construction projects have also been approved by the government, many of which are distributed along coastal regions. Therefore, investigating the relationship between transportation infrastructure and local land subsidence is of considerable importance.
In this study, OpenStreetMap (OSM) shapefile layers were used to extract transportation-related features, including bridges, trunk roads, secondary roads, and tertiary roads.
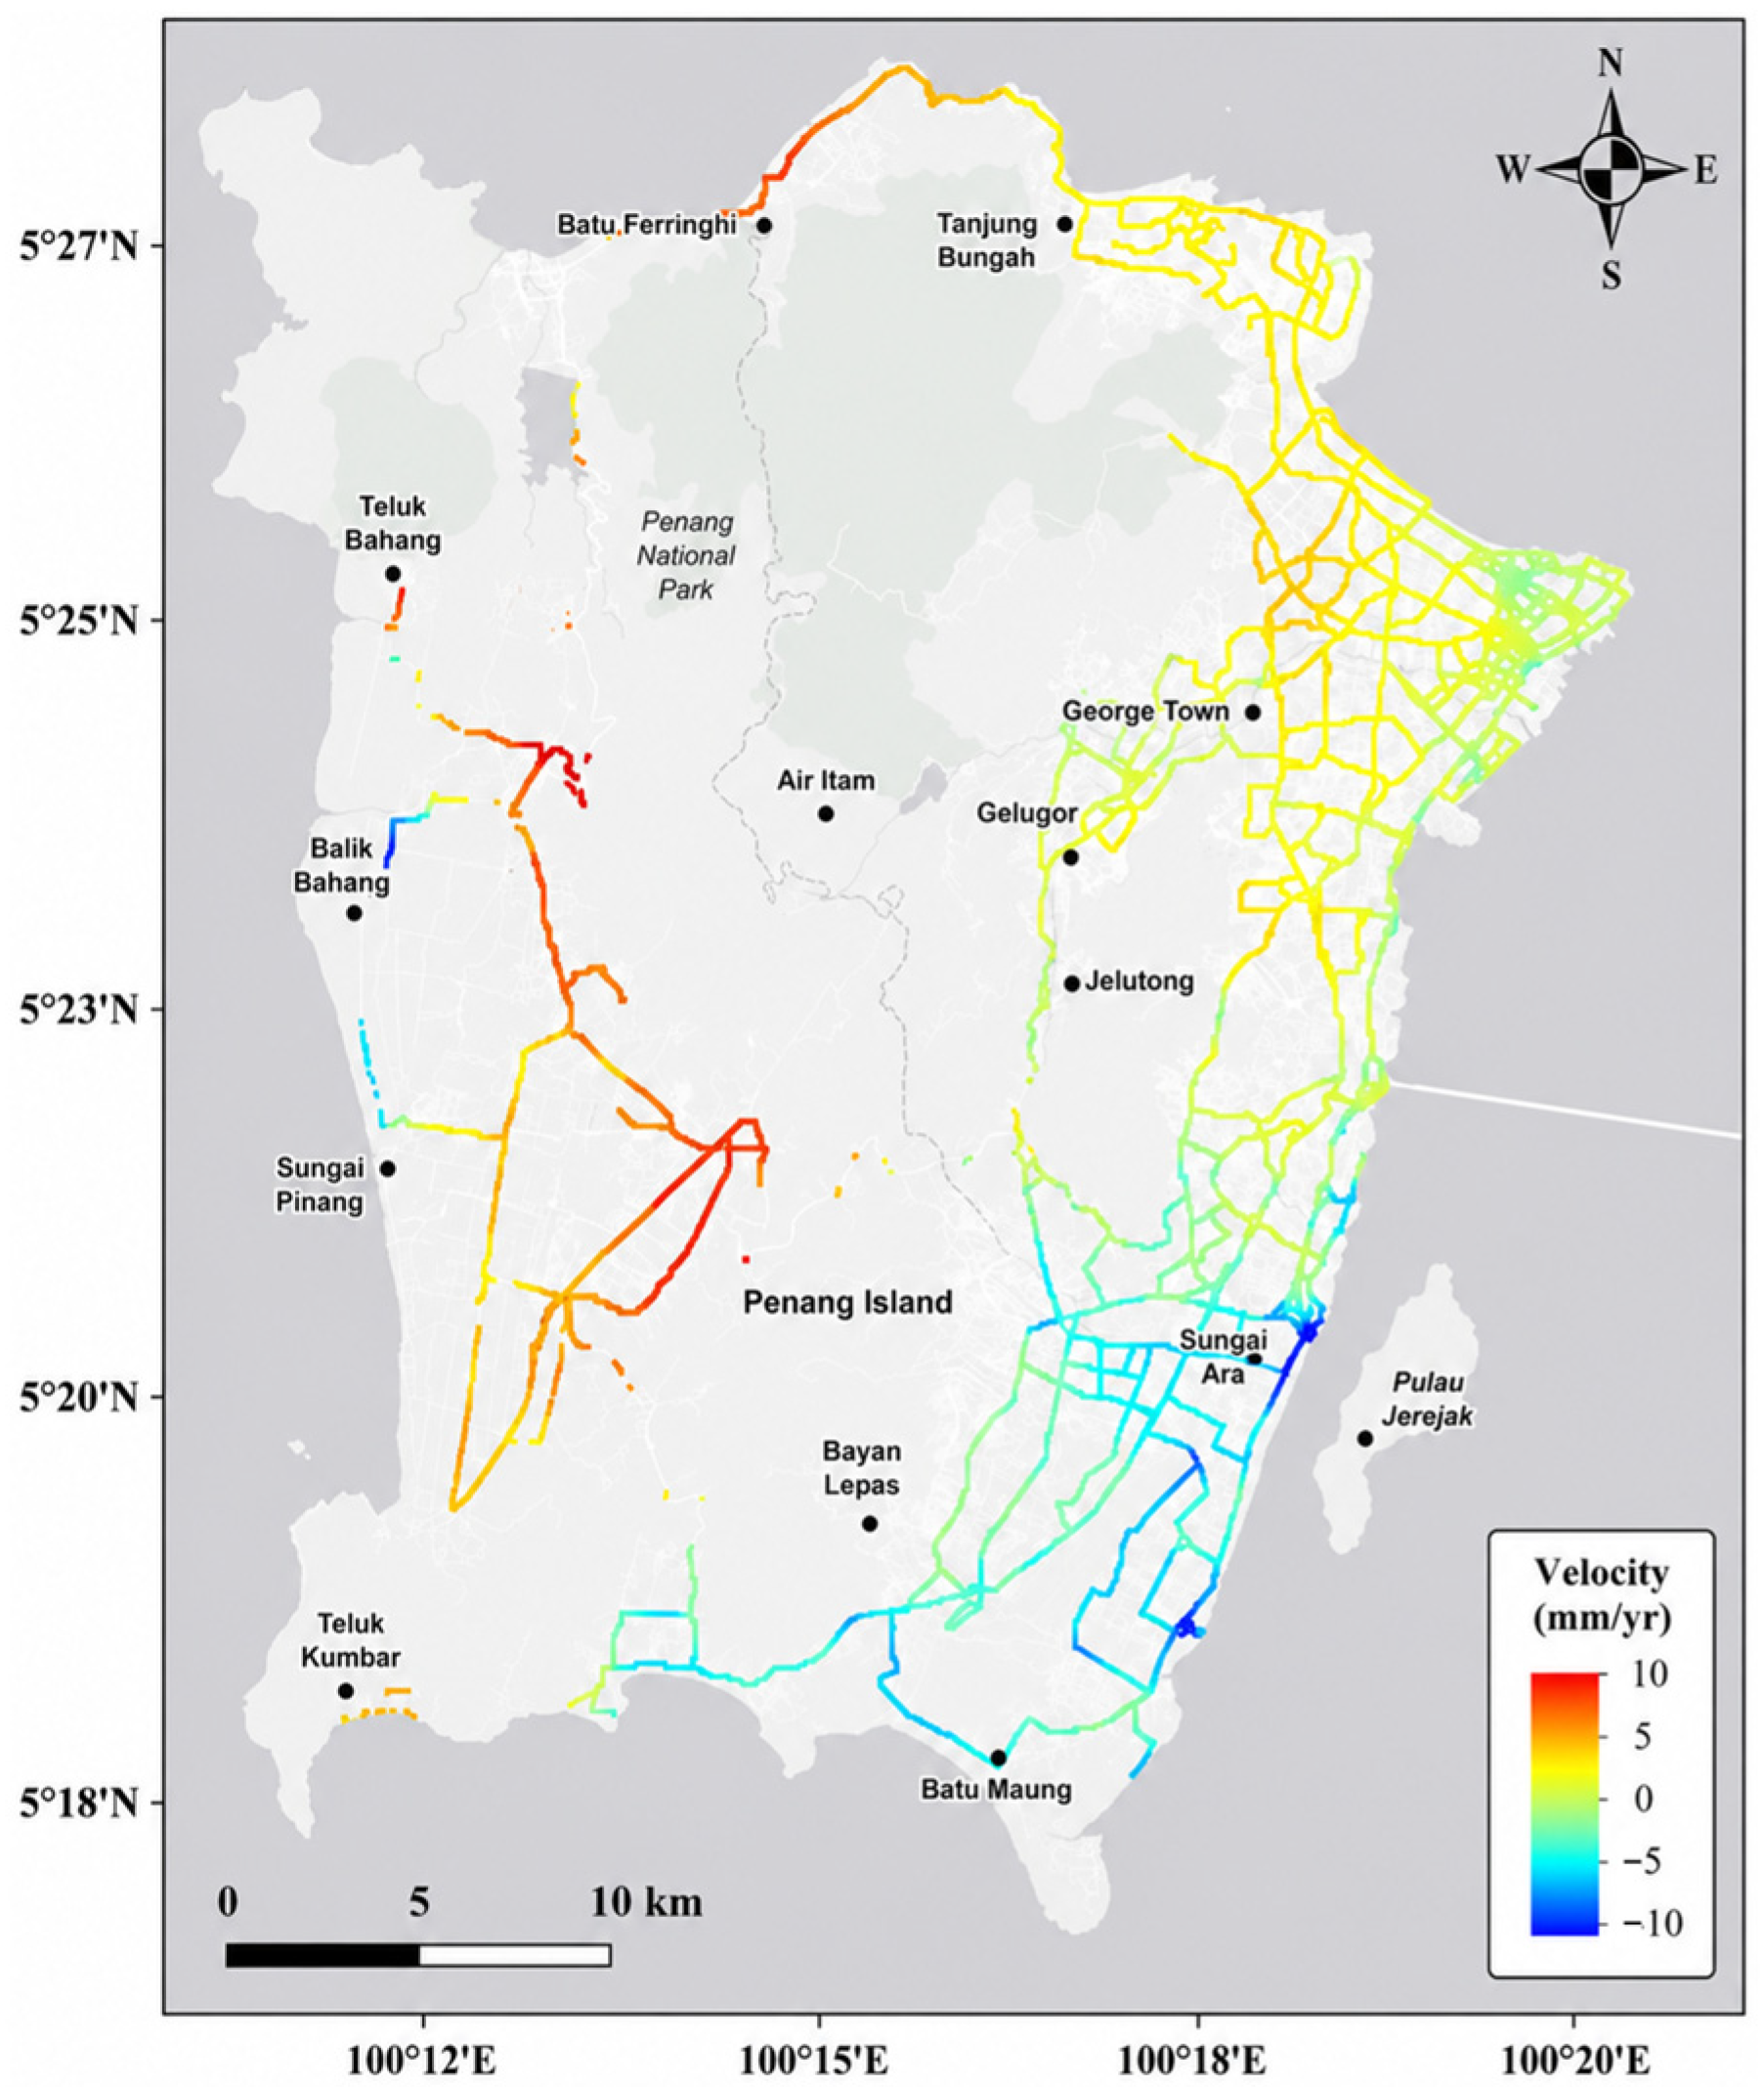
Figure 7 presents the spatial relationship between land deformation and the primary transportation network within the study area. Significant subsidence patterns are mainly observed in the southeastern part of the island, which corresponds to a major industrial zone. Most high subsidence values are concentrated along major trunk roads and road intersections that serve as the primary transportation corridors connecting industrial areas and urban centers.
In contrast, although the northeastern urban region contains a dense transportation network, the detected deformation rates remain relatively low. Slight uplift is observed along roads in the northern and western parts of the island. Based on visual interpretation combined with OpenStreetMap data, these areas are mainly located near the margins of mountainous terrain, where extensive building construction and urban expansion have occurred in recent years. In comparison, most transportation infrastructure in the eastern region was constructed earlier and appears to exhibit relatively stable deformation behavior. Other road-related features generally show weak and spatially stable deformation patterns.
Continuous monitoring of transportation infrastructure is important for regional risk assessment and infrastructure maintenance planning. Considering that several new highway projects and light rail transit systems are expected to be constructed in the coming years, the deformation results obtained in this study may provide useful references for urban planning and infrastructure management. Therefore, potential subsidence risks should be carefully considered in future coastal infrastructure development.
The observed deformation pattern is generally consistent with previous studies suggesting that repeated traffic loading and dynamic stress may accelerate the compaction of shallow soils, particularly in unconsolidated or reclaimed coastal areas. Long-term cyclic loading associated with transportation infrastructure may therefore contribute to localized subsidence along major roads and road intersections.
4.2.2. Land Deformation and Construction Projects
According to reports from the National Property Information Center, rapid urbanization in Penang has resulted in a substantial increase in urbanized land area, expanding from 29.5 km2 (10.2%) in 1960 to 112.0 km2 (37.4%) in 2015. At present, more than 220,000 residential units are distributed across the island, with over 10,000 new housing units being constructed annually. In response to increasing land demand and limited available land resources, several large-scale land reclamation projects are also currently underway.
As one of the most economically developed regions in Malaysia, Penang Island contains numerous ongoing and planned construction projects. Previous studies have suggested that intensive construction activities may contribute significantly to land subsidence. However, the deformation results obtained in this study indicate that large-scale construction projects do not necessarily correspond to the highest subsidence rates. In contrast, some relatively small-scale construction sites also exhibit noticeable subsidence within the study area.
To further investigate the factors controlling land subsidence, the relationship between deformation and soil type was analyzed based on the geological studies of Pradhan et al. [
37,
38].
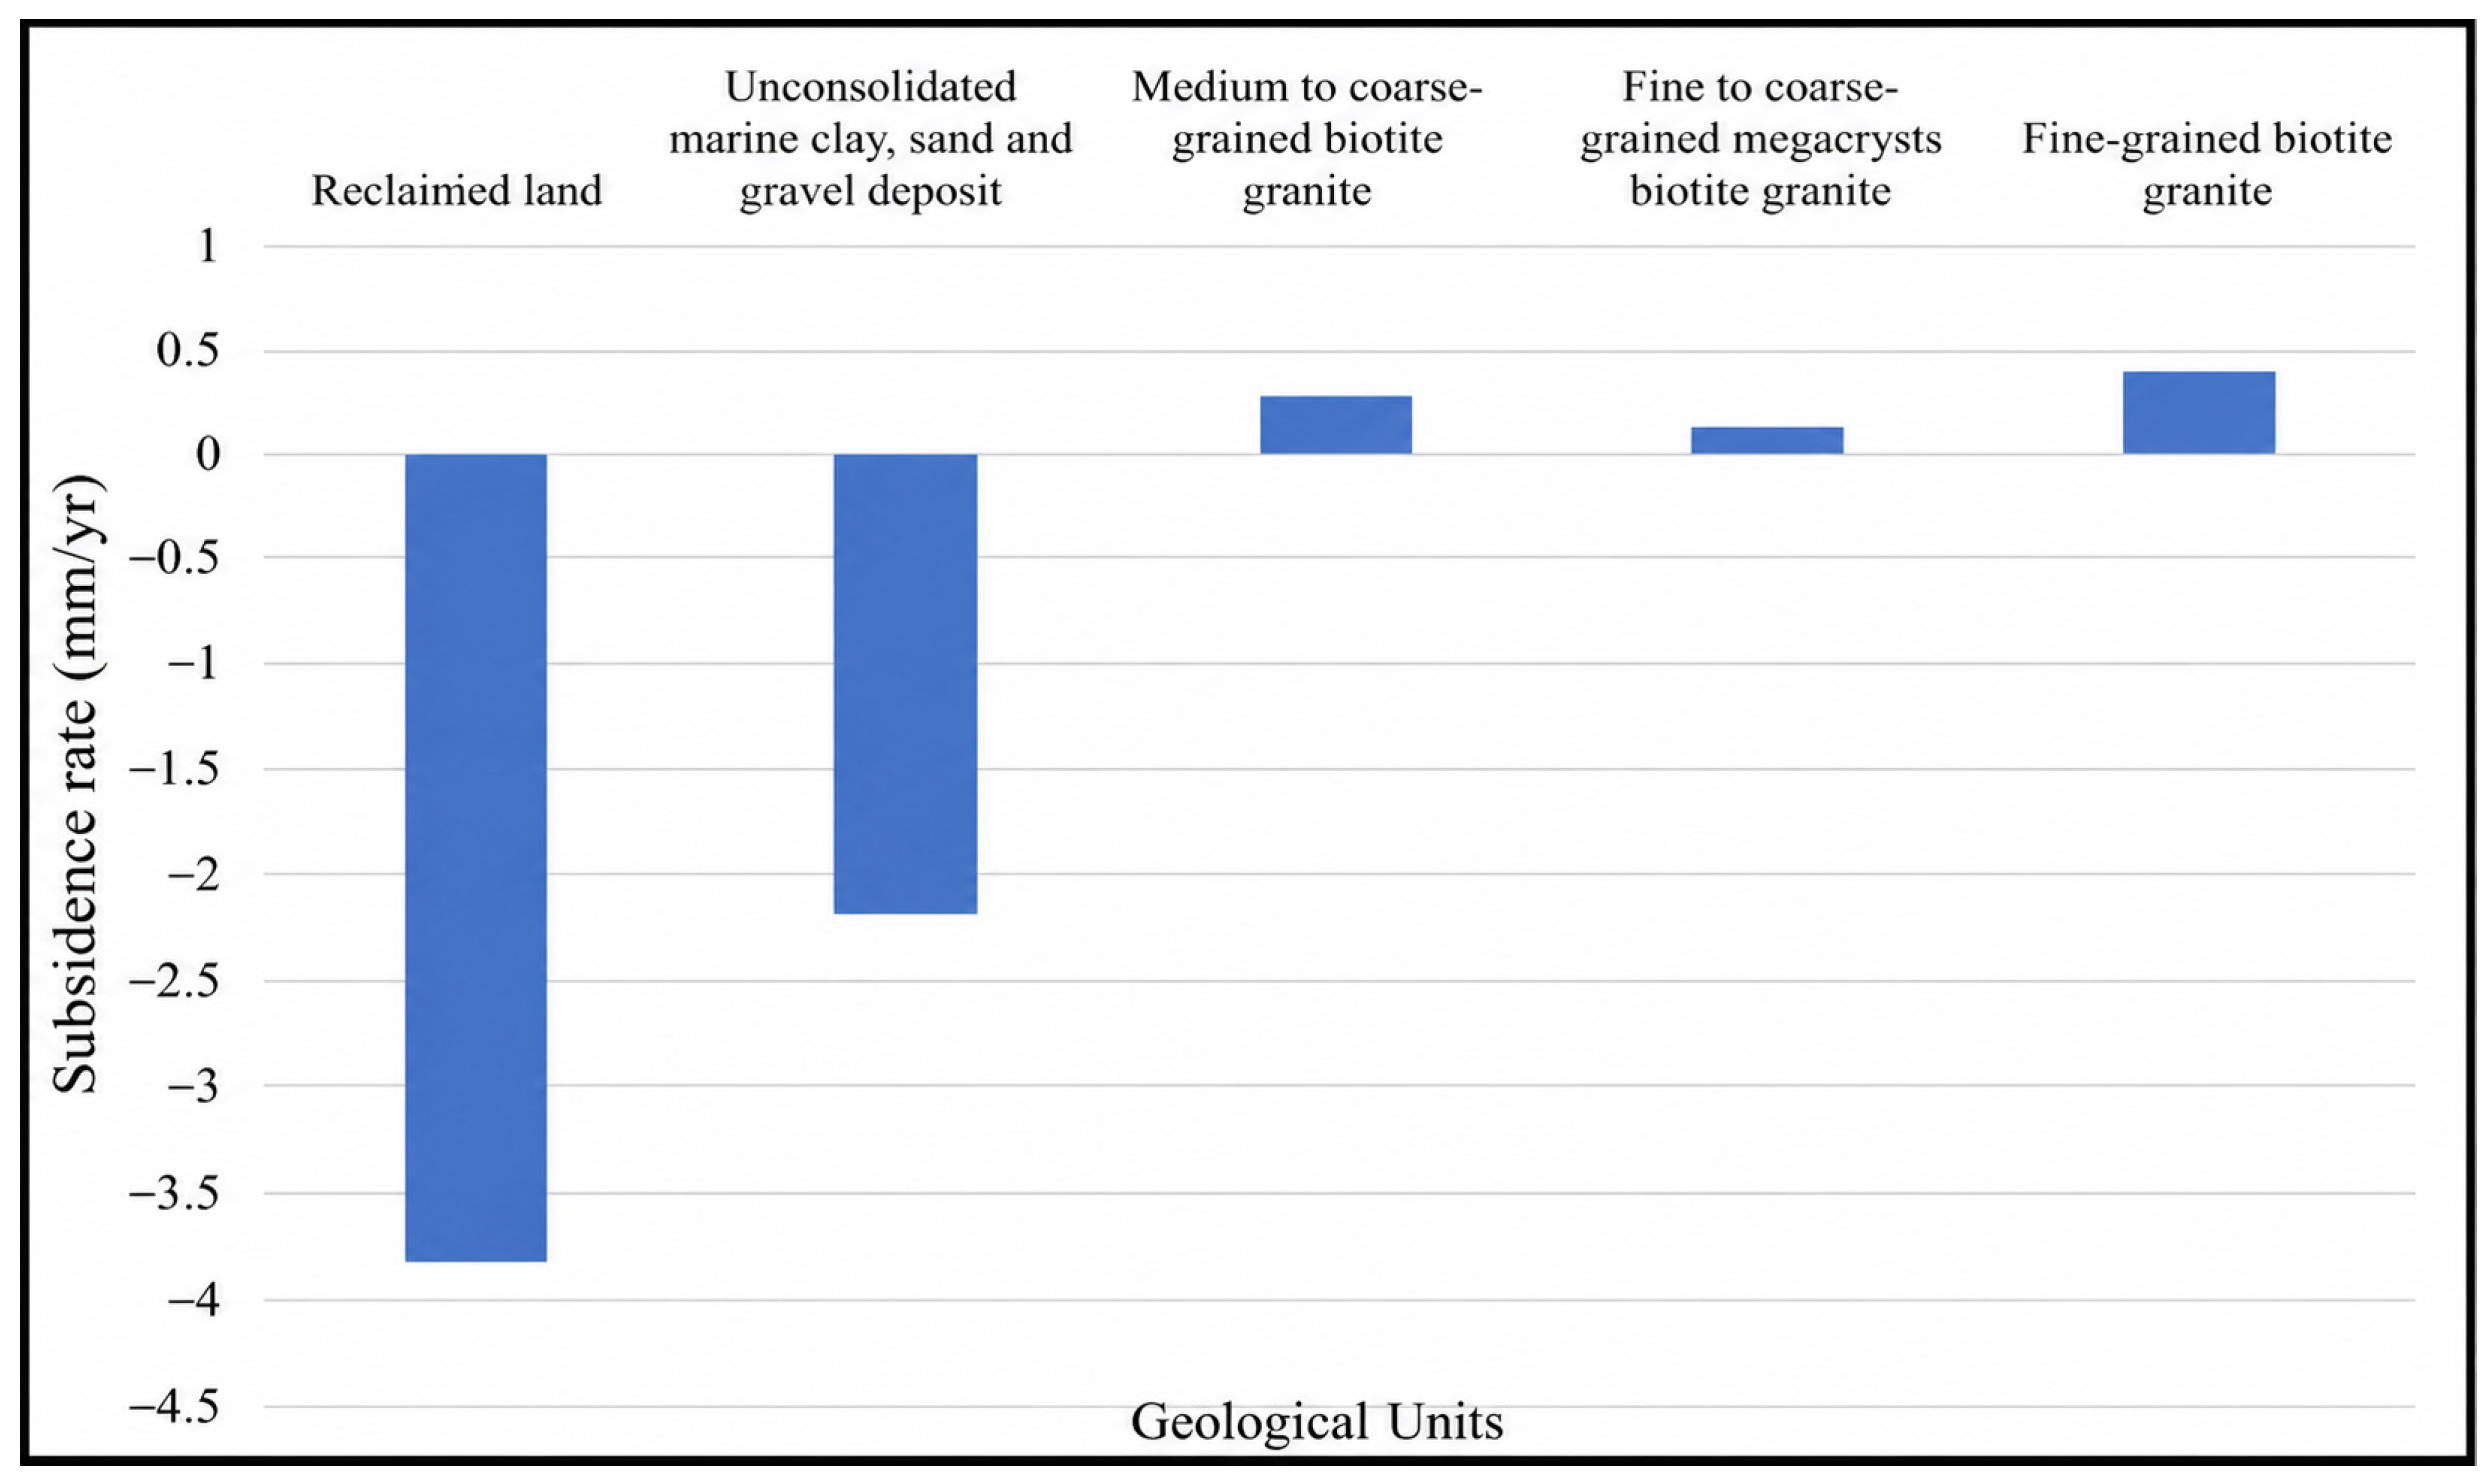
Figure 8 presents the mean subsidence rates corresponding to different geological units. The results indicate that unconsolidated soils and reclaimed lands exhibit relatively high subsidence rates, with most of these areas distributed along the coastal regions. In contrast, even regions characterized by intensive urban development but underlain by granite units generally show relatively low deformation rates.
These findings suggest that soil type plays a dominant role in controlling land subsidence, whereas construction activities mainly act as a secondary contributing factor that may locally intensify deformation. This interpretation is consistent with geotechnical theory, in which land subsidence is strongly influenced by the compressibility of underlying soils. Unconsolidated sediments and reclaimed lands are particularly susceptible to consolidation under external loading, which can lead to long-term deformation [
38]. In contrast, areas underlain by more competent geological units, such as granite, generally exhibit greater resistance to compression, even under substantial construction activities.
4.2.3. Land Deformation in Building Areas
Most parts of Penang Island are currently occupied by existing urban infrastructure, whereas only a limited number of areas correspond to entirely new construction projects. To further investigate the spatial characteristics of deformation in built-up regions,
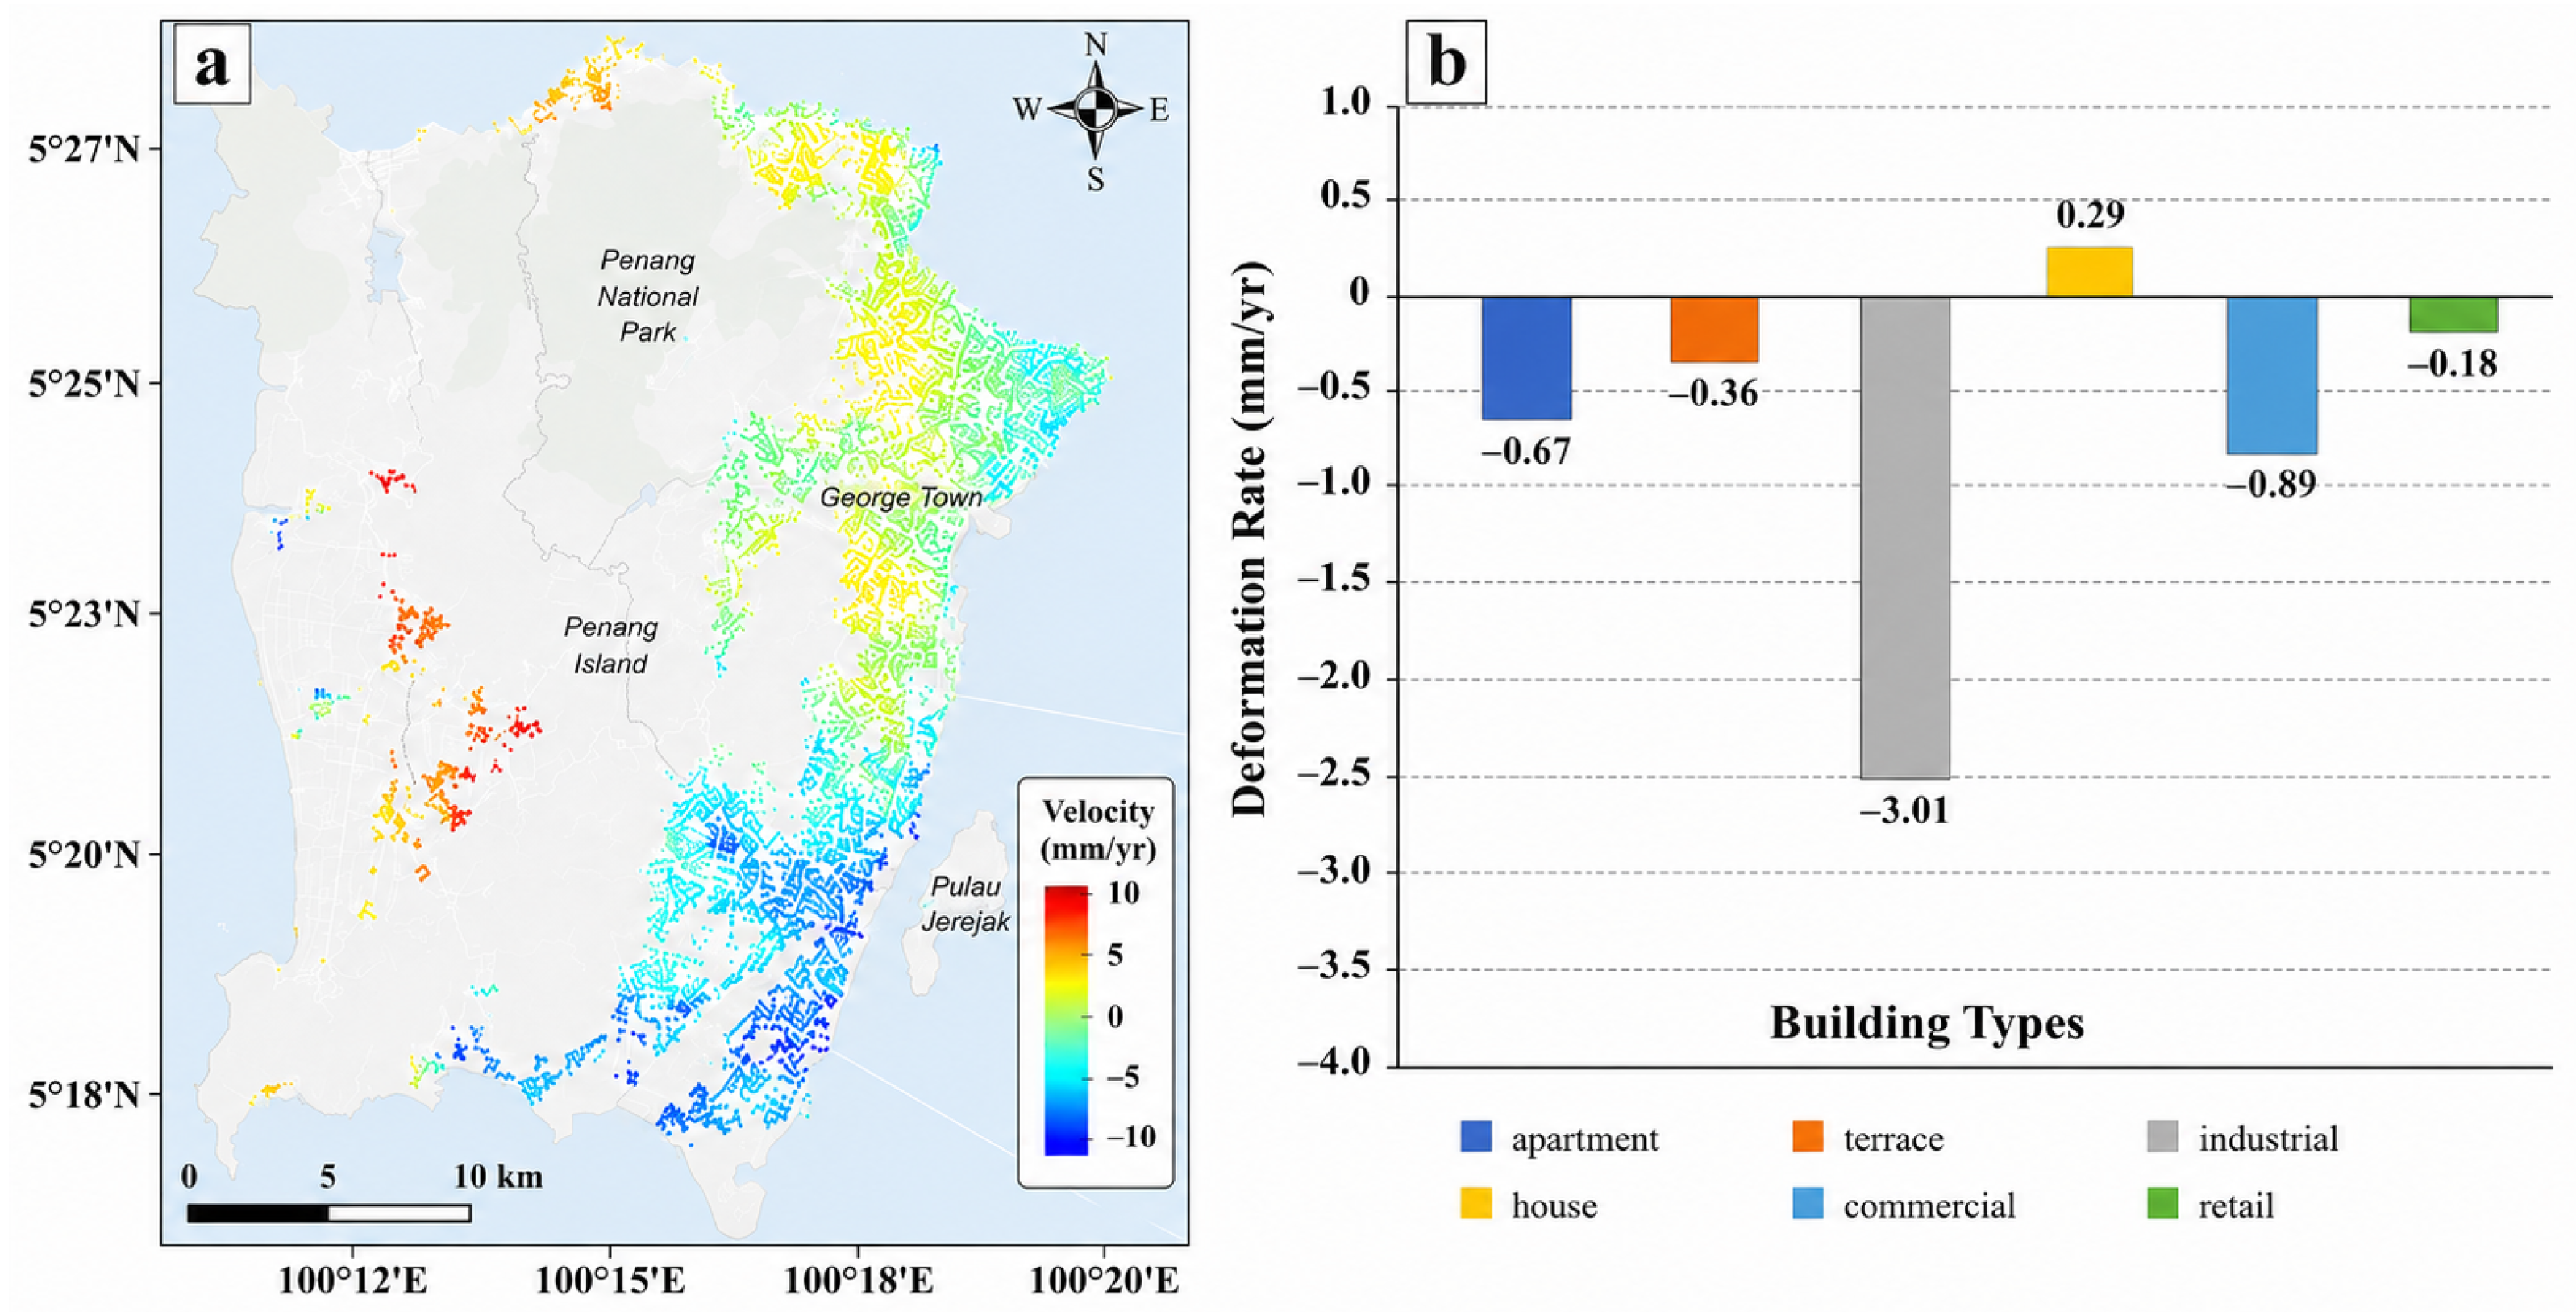
Figure 9a presents the annual mean deformation rates in building areas after excluding roads, parks, and other non-building features.
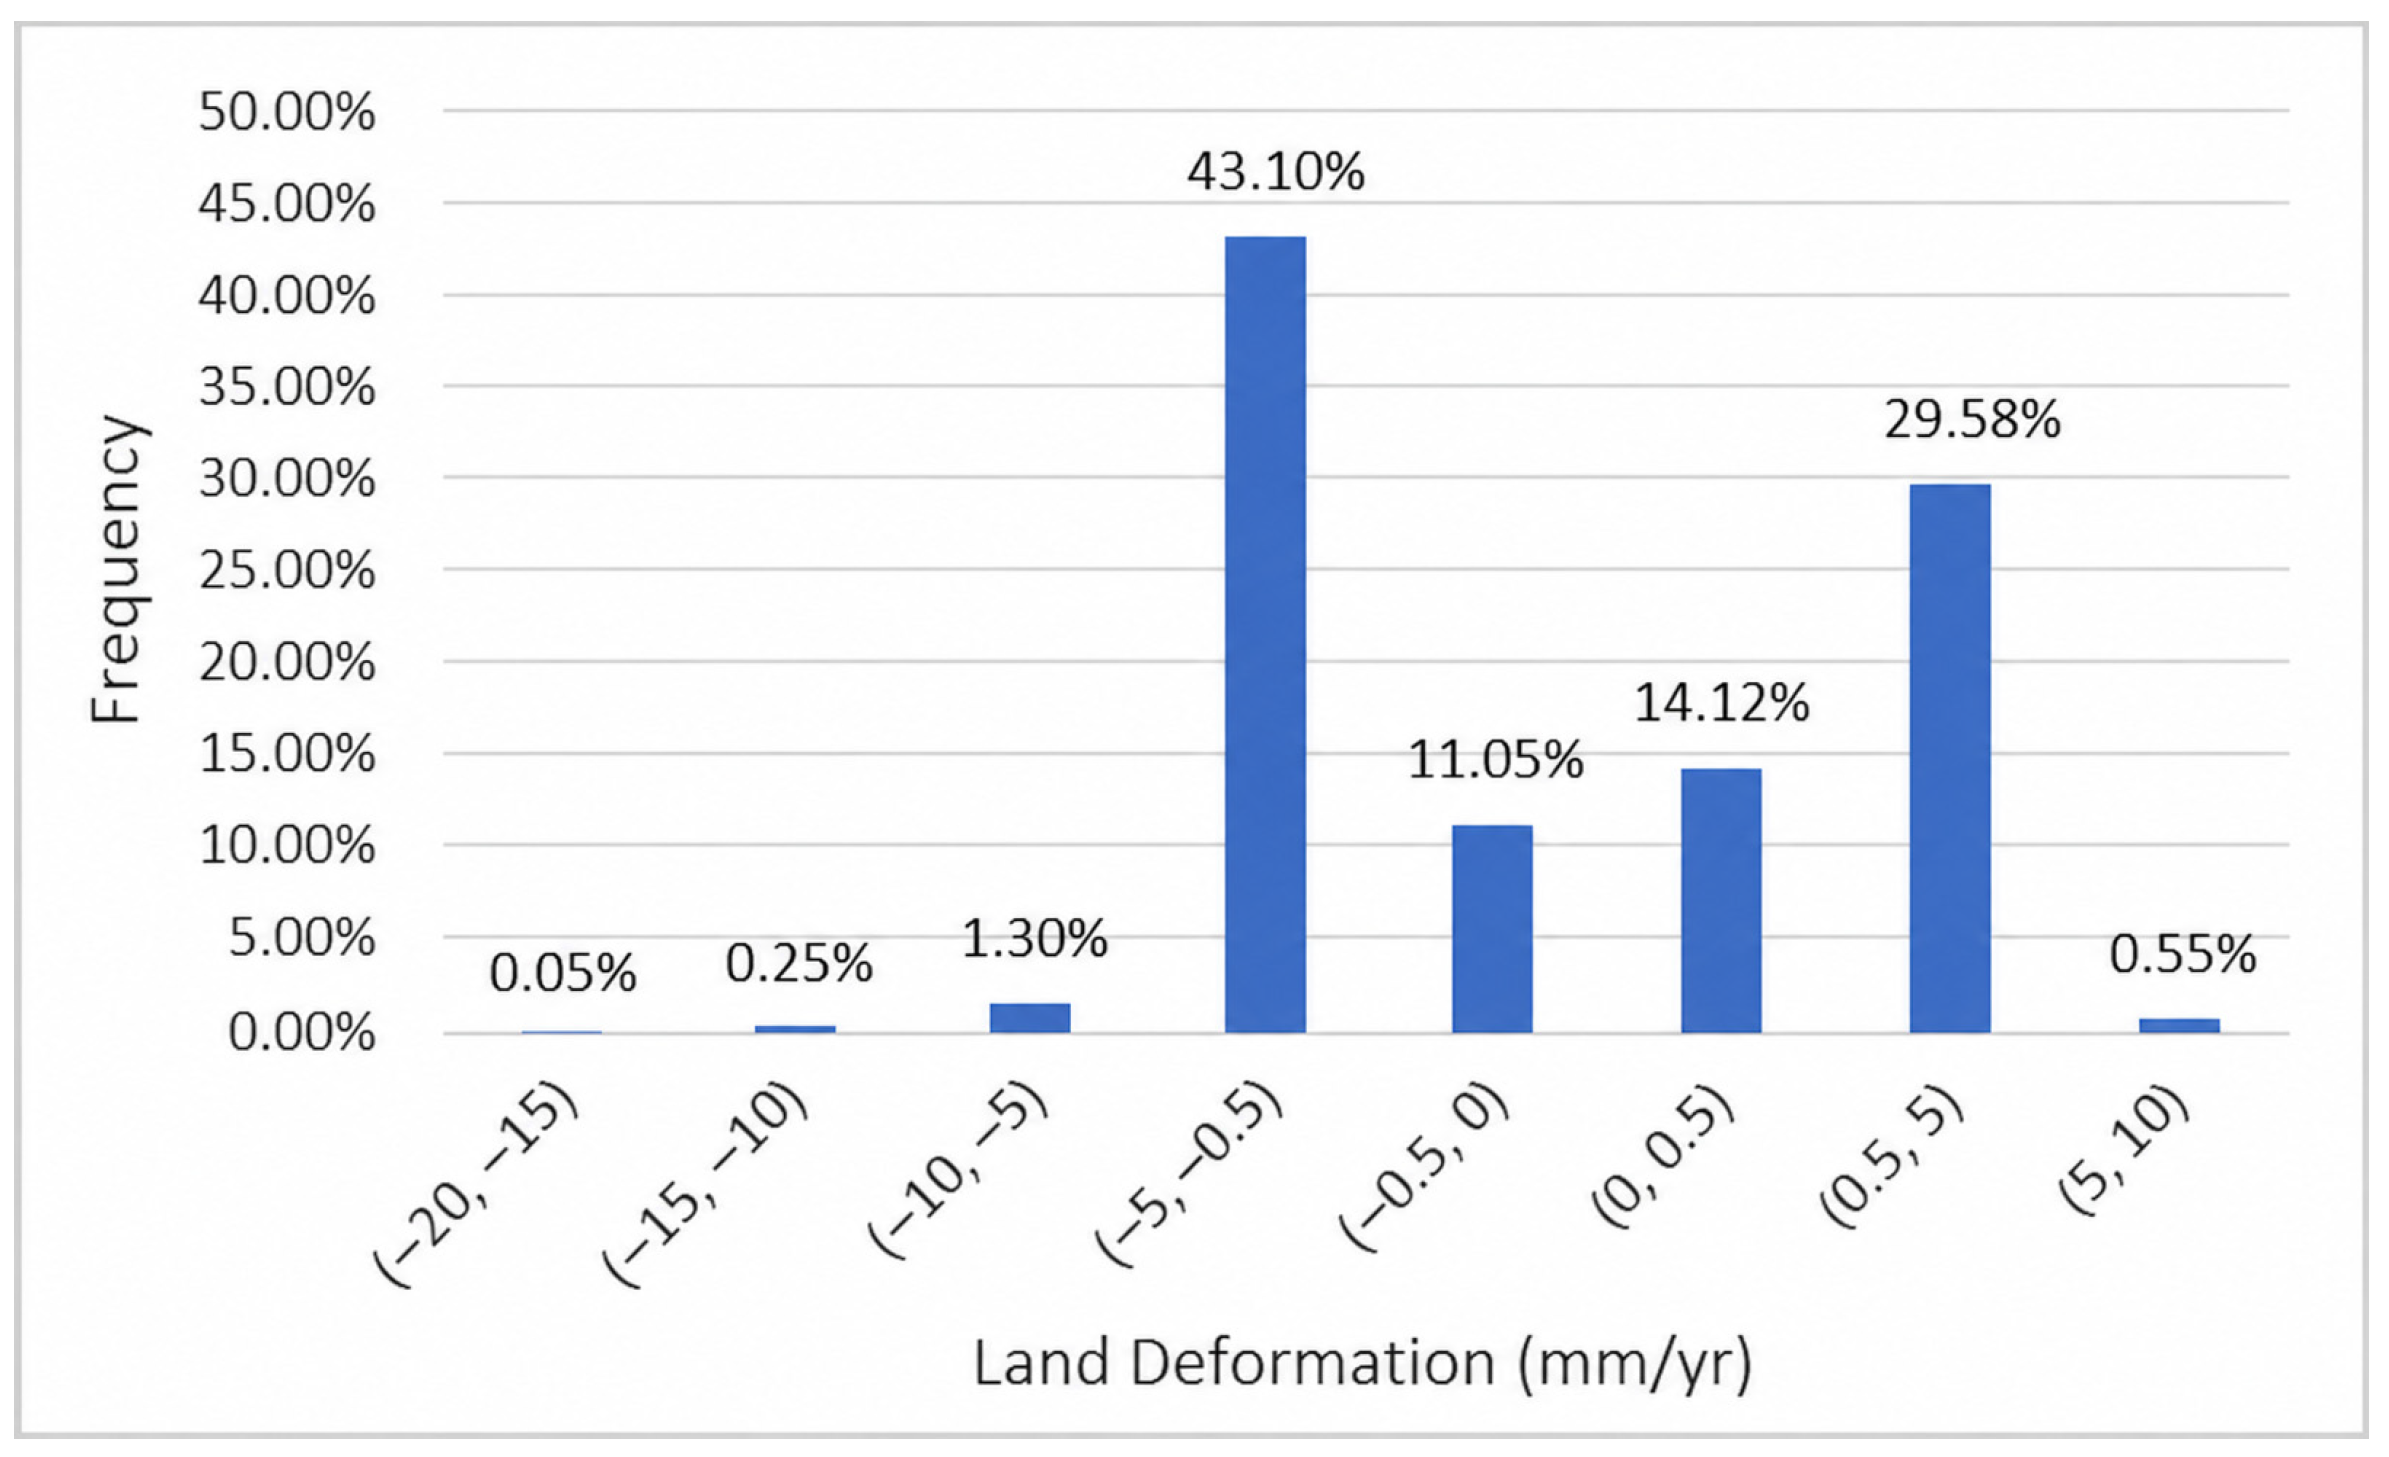
The results reveal a clear subsidence trend in the eastern part of the island, particularly in the southeastern region. In contrast, building areas located in inland regions generally exhibit slight uplift or relatively stable deformation conditions. The average deformation rate across the entire study area is approximately −0.52 mm/year, indicating that the overall ground deformation remains relatively moderate.
To provide a more detailed analysis, deformation rates associated with several representative building categories were quantified using OpenStreetMap shapefile data, as shown in
Figure 9b. The results indicate that large-scale buildings, such as commercial complexes and apartment buildings, generally exhibit higher subsidence rates, whereas smaller-scale buildings tend to remain relatively stable. The highest average deformation rates are observed in industrial and commercial buildings, many of which are located on reclaimed land along the coastal areas.
These findings suggest that building scale may also influence localized land subsidence, potentially due to the additional loading imposed by large structures. This interpretation is consistent with the mechanism of load-induced consolidation, in which heavy structural loads increase stress within subsurface soils, thereby accelerating compaction and settlement. Similar relationships between building loads and land subsidence have been widely reported in rapidly urbanizing regions.
4.2.4. Land Subsidence and Industrial Zone
The Bayan Lepas Free Industrial Zone, often referred to as the “Silicon Valley of the East,” is located along the southern coast of Penang Island. As one of the major industrial centers in Malaysia, the area hosts more than 3000 companies and has experienced rapid infrastructure development over the past decade, including the construction of highways and a sea-crossing bridge. Although the overall deformation rates across Penang Island remain relatively low, this industrial region exhibits comparatively significant land subsidence.
As shown in
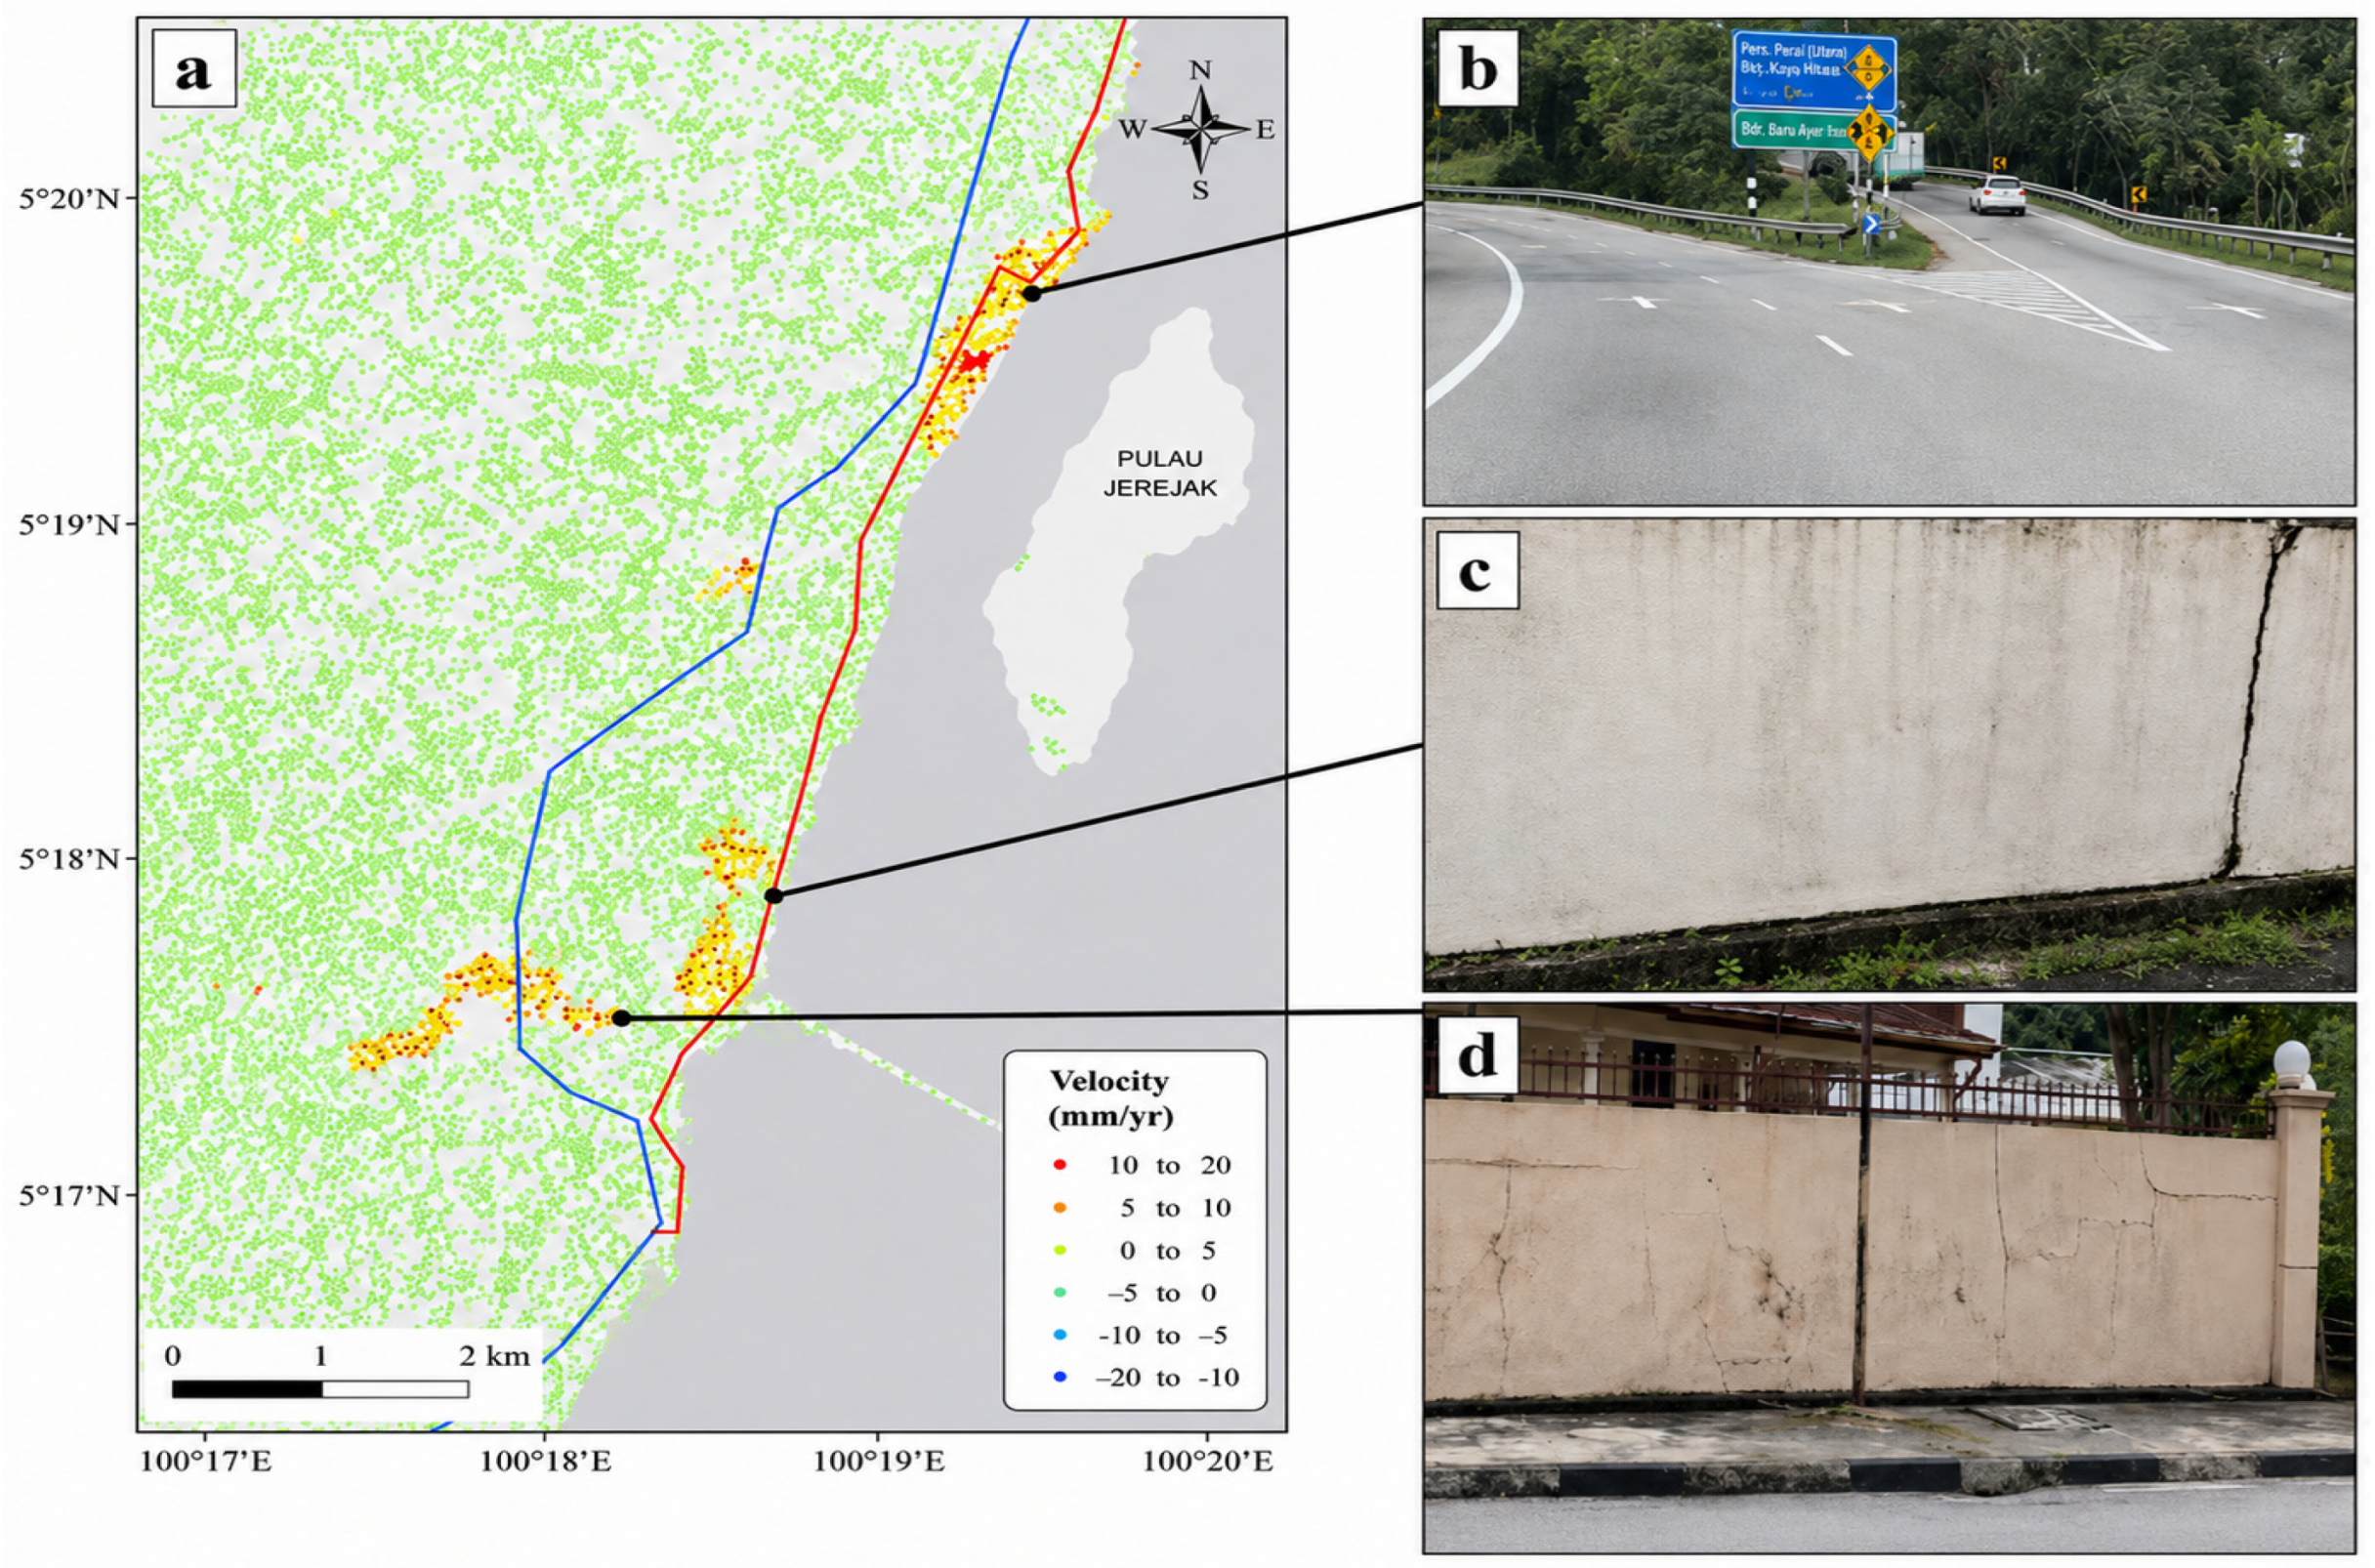
Figure 10a, most parts of the industrial zone are situated on reclaimed land, defined here as areas located outside the 1984 coastline, whereas only a limited portion of the region was developed after 2008. Despite the relatively long development history of these reclaimed areas, the detected subsidence rates remain considerably higher than those observed in reclaimed lands elsewhere on the island. Pronounced subsidence is particularly concentrated in coastal sections of the industrial zone, whereas comparatively lower deformation rates are observed in the central area.
Field investigations further indicate the presence of visible structural and surface deformation features, including wall cracks and uneven road surfaces (
Figure 10b–d). In addition, the region contains dense transportation infrastructure and serves as the entrance area to the sea-crossing bridge connecting Penang Island to the mainland. These observations suggest that the combined effects of soft-soil consolidation and long-term traffic loading are likely the primary factors contributing to land subsidence in this area, while transportation infrastructure may further amplify the deformation process.
In contrast, the relatively low deformation rates observed in the central industrial area suggest that industrial activities themselves may not be the dominant controlling factor. Instead, the observed deformation pattern appears to be more strongly associated with the geotechnical characteristics of reclaimed land. Reclaimed coastal soils generally exhibit high porosity and low shear strength, making them particularly susceptible to long-term consolidation under external loading. Previous studies have similarly reported that coastal reclamation areas are highly vulnerable to sustained land subsidence, especially when combined with additional loads from transportation infrastructure and urban development.
4.3. Ablation Study on Weighting Strategy
To quantitatively evaluate the effectiveness of the proposed machine learning-based weighting strategy, an ablation study was conducted by comparing three different weighting schemes in the time-series InSAR inversion process: (1) ordinary least squares without weighting (A1), (2) conventional coherence-based weighting (A2), and (3) the proposed machine learning-based adaptive weighting method (A3).
As summarized in
Table 2, the unweighted solution (A1) produces the lowest accuracy, with an RMSE of 12.8 mm and an MAE of 9.6 mm. This result indicates that treating all interferometric observations equally can lead to substantial error propagation, particularly in regions affected by decorrelation and atmospheric noise. Introducing coherence-based weighting (A2) improves the inversion accuracy to some extent, reducing the RMSE to 10.3 mm. This improvement demonstrates that incorporating observation-quality information can partially mitigate the influence of low-quality interferograms. However, the overall improvement remains limited because interferometric coherence alone cannot fully characterize the complex and nonlinear error sources affecting InSAR observations.
In contrast, the proposed machine learning-based weighting strategy (A3) achieves the best overall performance, with an RMSE of 7.6 mm and an MAE of 5.9 mm, corresponding to an improvement of approximately 40.6% relative to the unweighted solution. In addition, the coefficient of determination (R
2) increases to 0.87, indicating improved agreement with the reference measurements. These results suggest that the proposed machine learning model can effectively capture the nonlinear relationships between multiple interferometric quality indicators, as described in
Section 2.4, and the corresponding observation reliability, thereby enabling a more effective weighting strategy.
Furthermore, the advantages of the proposed method are not limited to improvements in overall inversion accuracy but also include enhanced robustness against noisy observations and outliers. By adaptively suppressing low-quality interferometric measurements, the proposed approach reduces the influence of decorrelation noise and anomalous observations during the inversion process, leading to more stable deformation estimates. This capability is particularly important in complex tropical urban environments, where interferometric quality often varies substantially across both spatial and temporal domains.
Overall, the ablation study demonstrates that the proposed machine learning-based adaptive weighting strategy plays a critical role in improving both the accuracy and robustness of deformation estimation and therefore represents one of the key methodological contributions of this study.
5. Conclusions
This study proposes an enhanced InSAR-based framework for land deformation monitoring by integrating multi-source InSAR observations with a machine learning-based adaptive weighting strategy. Specifically, PS-InSAR and SBAS-InSAR results derived from both ascending and descending Sentinel-1 datasets are incorporated into a unified fusion framework, while a data-driven weighting scheme is introduced into the time-series inversion process to address the heterogeneous reliability of interferometric observations.
The experimental results demonstrate that the proposed framework effectively improves the accuracy and robustness of deformation estimation. The ablation and comparative analyses indicate that the machine learning-based weighting strategy plays a critical role in enhancing inversion performance. Compared with conventional empirical weighting approaches, the proposed method more effectively captures the nonlinear relationships between multiple interferometric quality indicators and observation reliability. Furthermore, the multi-source fusion framework improves the spatial continuity and coverage of the deformation field by integrating complementary information from different InSAR techniques and observation geometries.
The application to Penang Island reveals spatially heterogeneous subsidence patterns, with more pronounced deformation observed in the western region and parts of the eastern coastal areas. The results suggest that geological conditions, particularly the presence of compressible sediments and reclaimed land, constitute the primary controlling factors of land subsidence. In contrast, anthropogenic factors such as construction activities and transportation loading mainly contribute to localized deformation enhancement. Compared with these factors, industrial activities themselves appear to have a relatively limited influence on regional subsidence patterns within the study area.
Overall, the proposed framework provides a practical and scalable solution for large-area deformation monitoring in complex tropical environments. By jointly addressing observation reliability and multi-source data integration, the method achieves improved spatial consistency and inversion stability compared with conventional InSAR approaches.
Nevertheless, several limitations remain in the current study. The adaptive weighting model relies on reliability labels derived indirectly from residual analysis rather than external ground-truth observations, and the limited availability of GNSS measurements restricts comprehensive quantitative validation. In addition, residual atmospheric effects and decorrelation noise may still influence the deformation results in densely vegetated regions.
Future work will focus on improving the generalization capability and transferability of the weighting model, as well as enhancing uncertainty quantification in the inversion process. The integration of additional external validation data, such as GNSS and leveling measurements, together with auxiliary datasets including high-resolution DEMs and atmospheric correction products, is expected to further improve deformation accuracy and support a more comprehensive interpretation of subsidence mechanisms.