Article

Comparative Analysis of Orographic Cirrus Clouds over Major Mountainous Regions Using Satellite Observations

1
Chongqing Research Institute of Big Data, Peking University, Chongqing 401329, China
2
Institute of Plateau Meteorology, China Meteorological Administration (CMA), Chengdu 610072, China
3
School of Atmospheric Sciences, Lanzhou University, Lanzhou 730050, China
4
Hubei Key Laboratory of Intelligent Yangtze and Hydroelectric Science, China Yangtze Power Co., Ltd., Yichang 443002, China
*
Author to whom correspondence should be addressed.
Remote Sens. 2026, 18(11), 1701; https://doi.org/10.3390/rs18111701
Submission received: 27 March 2026 / Revised: 15 May 2026 / Accepted: 20 May 2026 / Published: 25 May 2026

Highlights

What are the main findings?
  • Satellite observations reveal clear regional differences in the occurrence and vertical structure of orographic cirrus over the Rocky Mountains, Andes, Alps, and Himalayas.
  • Orographic cirrus over the Andes exhibits higher cloud top heights and thinner optical properties, while the other mountainous regions show more compact vertical structures and larger ice water paths.
What are the implications of the main findings?
  • The formation and properties of orographic cirrus are strongly modulated by regional topography, large-scale circulation, and convective activity.
  • These results highlight that the radiative influence of cirrus over mountainous regions can vary substantially across different climatic and dynamical environments.

Abstract

Orographic cirrus clouds frequently occur over mountainous regions and can influence the radiative balance of the upper troposphere, yet their characteristics and regional variability remain insufficiently understood on a global scale. In this study, we investigate the occurrence, vertical structure, and microphysical and optical properties of orographic cirrus over four major mountainous regions, namely the Rocky Mountains, the Andes, the Alps, and the Himalayas, using the Identification and Classification of Cirrus (IC-CIR) framework together with satellite observations from MODIS, CloudSat, and CALIPSO. The results reveal clear regional differences in both occurrence and structure. Cloud cover is higher over the Himalayas and the Alps and lower over the Andes, while seasonal variability is strongest over the Himalayas and the Alps and weakest over the Andes. In terms of vertical structure, cirrus over the Andes reaches higher cloud tops and exhibits a bimodal distribution. The Andes also show smaller values of ice water path, optical depth, and cirrus reflectance. These results provide a unified comparison of orographic cirrus clouds across four representative major mountainous regions and highlight substantial regional differences in their characteristics and potential radiative influence under different topographic and dynamical environments.

1. Introduction

Cirrus clouds, composed primarily of ice crystals, play a pivotal role in regulating Earth’s radiation balance by both reflecting incoming solar shortwave radiation and absorbing outgoing terrestrial longwave radiation [1,2,3,4]. Despite their climatic significance, the accurate representation of cirrus cloud processes in numerical models remains a major challenge due to their complex microphysical characteristics and strong spatiotemporal variability. Numerical experiments from the sixth phase of the Coupled Model Intercomparison Project (CMIP6) reveal that many general circulation models suffer from significant biases in representing the spatial distribution of ice clouds [5,6,7]. These deficiencies not only distort the simulation of both shortwave and longwave radiative fluxes, but also propagate uncertainties throughout key climate system components, including precipitation patterns, the hydrological cycle, and large-scale atmospheric circulation [8,9,10,11]. Improving the accuracy of ice cloud representation remains essential for enhancing the reliability of global climate simulations.
Cirrus clouds form through various mechanisms, each exhibiting distinct spatial patterns and microphysical properties [12,13]. Convective cirrus commonly occurs in the tropics as outflow from deep convection, while frontal cirrus is typical of mid-latitude cyclonic systems [14,15,16]. In contrast, orographic cirrus clouds form when moist air is lifted over mountainous terrain, making them prevalent over mountainous regions. These clouds are primarily generated through ice nucleation processes triggered by orographic gravity waves, which are produced when stable atmospheric flows interact with complex topography. Orographic gravity waves, generated when stably stratified atmospheric flow is forced over mountainous terrain, induce substantial vertical velocity fluctuations as air parcels oscillate vertically under the influence of buoyancy as a restoring force [17]. These fluctuations generate localized regions of rapid ascent and descent, leading to pronounced adiabatic cooling during upward motion. The associated temperature decrease enhances supersaturation with respect to ice, particularly in the upper troposphere, thereby facilitating the activation of ice nuclei and the subsequent formation of ice crystals, a sequence that plays a critical role in initiating cirrus formation in mountainous regions [18]. Satellite observations have revealed that orographic cirrus frequently occurs over mountainous regions and exhibits distinct microphysical characteristics compared to cirrus clouds over oceanic and continental backgrounds [19]. They tend to have higher ice water content and ice number concentrations, reflecting enhanced ice production under strong orographic lifting. Additionally, orographic cirrus are generally confined to smaller horizontal scales and show a characteristic bimodal structure in their microphysical distributions, indicating the impact of localized dynamical processes such as gravity waves [20]. These findings highlight the importance of explicitly accounting for orographic cirrus as a distinct cloud category in climate models to improve the representation of their radiative effects and associated climate feedback.
In addition to gravity-wave-induced lifting under stable stratification, orography can also modulate cirrus formation by lifting moist, conditionally unstable low-level air and enhancing convection under favorable thermodynamic conditions [21], with its effects varying across regions. For instance, in the Rocky Mountains, semitransparent orographic cirrus clouds exhibit marked diurnal variations during summer, with increased occurrence following convective activity, reflecting the strong modulation of cirrus formation by terrain-induced processes [22]. Over the nearby Wasatch Mountains, cirrus formation varies seasonally, forming in summer from local convective anvils due to orographic lifting, and in other seasons from cirrus advected by midlatitude jet streams [23]. Orographic clouds in the Asian monsoon region typically exhibit deep, thick lower layers and relatively low cloud-top heights [24]. Over the Himalayas, surface radiative cooling and latent heat effects associated with elevated terrain during summer play a dominant role in cirrus formation by facilitating the generation of low-level cirrus clouds [25,26].
While previous studies have provided valuable insights into the regional characteristics of orographic cirrus, a comprehensive intercomparison across major mountainous regions remains lacking. Most existing analyses focus on individual mountain systems, making it difficult to generalize orographic cirrus behavior under varying topographic and climatic conditions. The Identification and Classification of Cirrus (IC-CIR) system provides a global classification of cirrus clouds, including convective, frontal, and orographic cirrus, based on reanalysis data and satellite observations [27]. This framework offers a useful basis for systematically comparing orographic cirrus across different mountainous regions and for understanding how their formation mechanisms and microphysical properties vary under different topographic and climatic conditions. Building on this framework, we utilize satellite observations from both passive and active sensors to investigate the characteristics of orographic cirrus across several major mountainous regions globally, including the Rocky Mountains, the Himalayas, the Andes, and the Alps. Specifically, passive radiance measurements from MODIS are combined with active observations from the CloudSat radar and the CALIPSO lidar to provide a more comprehensive characterization of these clouds [28,29,30,31,32]. This study examines regional differences in the microphysical properties of orographic cirrus, aiming to elucidate how varying topographic and climatic conditions shape their formation and behavior. By providing a unified comparison of orographic cirrus clouds across four representative major mountainous regions, this study offers a more systematic understanding of how their occurrence, vertical structure, and microphysical and optical properties vary under different topographic and dynamical environments.
The remainder of this paper is organized as follows. Section 2 describes the datasets employed in this study, including the IC-CIR framework and the satellite observations. Section 3 outlines the procedure used to identify orographic cirrus clouds over the selected mountainous regions. Section 4 presents the results, with a focus on the regional and seasonal variations in the macrophysical, microphysical, and optical characteristics of orographic cirrus clouds. Section 5 summarizes and discusses the main findings.

2. Data

2.1. IC-CIR System

In this study, the Identification and Classification of Cirrus (IC-CIR) system is employed to identify orographic cirrus clouds. The IC-CIR framework [27] classifies cirrus clouds according to their likely formation mechanisms by combining satellite observations, reanalysis data, and topographic information. The IC-CIR classification is performed on a 1° × 1° grid and assigns each grid box to a specific dynamical regime, regardless of whether cirrus clouds are observed. This design separates the occurrence of cloud-forming meteorological conditions from the observed cloud properties and avoids making the regime definition dependent on a satellite cloud detection threshold.
The IC-CIR system considers several major cirrus formation regimes, including orographic, frontal, convective, jet-stream, and synoptic regimes, as well as buffer regimes around frontal and convective systems. The classification is applied sequentially, and each grid box is assigned to the first regime whose criteria are satisfied. Orographic regimes are identified based on the interaction between near-surface wind and sub-grid-scale topographic variability, representing environments favorable for terrain-induced lifting and orographic cirrus formation. The framework then distinguishes frontal and convective regimes by combining MODIS Aqua cloud properties with ERA-Interim frontal and updraught information. Buffer regimes are defined around these core systems to represent nearby diffuse cirrus, and the remaining grid boxes are classified as jet-stream or synoptic regimes based on upper-level wind speed and mid-tropospheric vertical motion. In this study, we used the IC-CIR classification dataset for 2003–2013 and focused on grid boxes classified as orographic regimes.

2.2. Digital Elevation Data

The GTOPO30 digital elevation dataset [33], developed by the U.S. Geological Survey (USGS), was used to delineate the major mountainous regions considered in this study. The dataset provides global coverage of topographic elevation with a horizontal resolution of 30 arc seconds, corresponding to approximately 1 km at the equator.

2.3. MODIS Observation

To investigate the optical properties of orographic cirrus clouds, observations from the Moderate Resolution Imaging Spectroradiometer (MODIS) were utilized. MODIS, onboard NASA’s Terra and Aqua satellites, provides global observations across 36 spectral bands ranging from visible to thermal infrared wavelengths. With its wide swath and high temporal sampling, MODIS achieves near-global coverage every one to two days and has been widely used for studies of clouds, aerosols, and atmospheric properties [34].
In this study, we primarily used the Level-3 gridded atmosphere dataset MYD08_D3 [35], which provides daily global statistics of atmospheric parameters aggregated on a 1° × 1° latitude–longitude grid. MODIS observations from 2003 to 2013 were used to ensure consistency with the IC-CIR classification dataset.

2.4. CloudSat and CALIPSO Observation

Observations from CloudSat and CALIPSO were used to investigate the vertical structure and microphysical properties of orographic cirrus clouds. Both satellites are part of the A-Train satellite constellation, which provides near-simultaneous observations of the same atmospheric column using complementary active and passive sensors. CloudSat carries a 94-GHz Cloud Profiling Radar (CPR) that provides vertical profiles of radar reflectivity with high sensitivity to cloud ice particles, enabling detailed observations of cloud vertical structure. The CALIPSO satellite carries the Cloud-Aerosol Lidar with Orthogonal Polarization (CALIOP), which provides high-resolution vertical measurements of cloud and aerosol backscatter. The combined radar–lidar observations substantially improve the detection and classification of clouds across a wide range of optical depths, particularly extending the capability to observe optically thin cirrus clouds that are difficult to detect using passive remote sensing alone [36,37]. Since continuous and stable observations from CloudSat and CALIPSO became available after mid-2006, only data from 2007 to 2013 were used in the analysis involving these active sensors.
The synergistic radar–lidar cloud classification product 2B-CLDCLASS-LIDAR [38] was used to identify cloud occurrence and classify cloud types based on their vertical structure. This product integrates radar reflectivity profiles from CloudSat with lidar backscatter measurements from CALIPSO, enabling improved detection of multi-layer cloud systems and more reliable discrimination of cloud phase and cloud type. Cirrus clouds were identified based on the cloud-type classification provided by this dataset, and their cloud top heights were derived for further analysis.
Ice cloud microphysical properties were obtained from the 2C-ICE retrieval product [39]. This product retrieves vertically resolved ice cloud properties using combined radar and lidar observations together with ancillary atmospheric information. The retrieved parameters include ice water content (IWC) and extinction coefficient. These variables were vertically integrated to derive the ice water path (IWP) and cirrus optical depth.

3. Methods

3.1. Major Mountainous Region

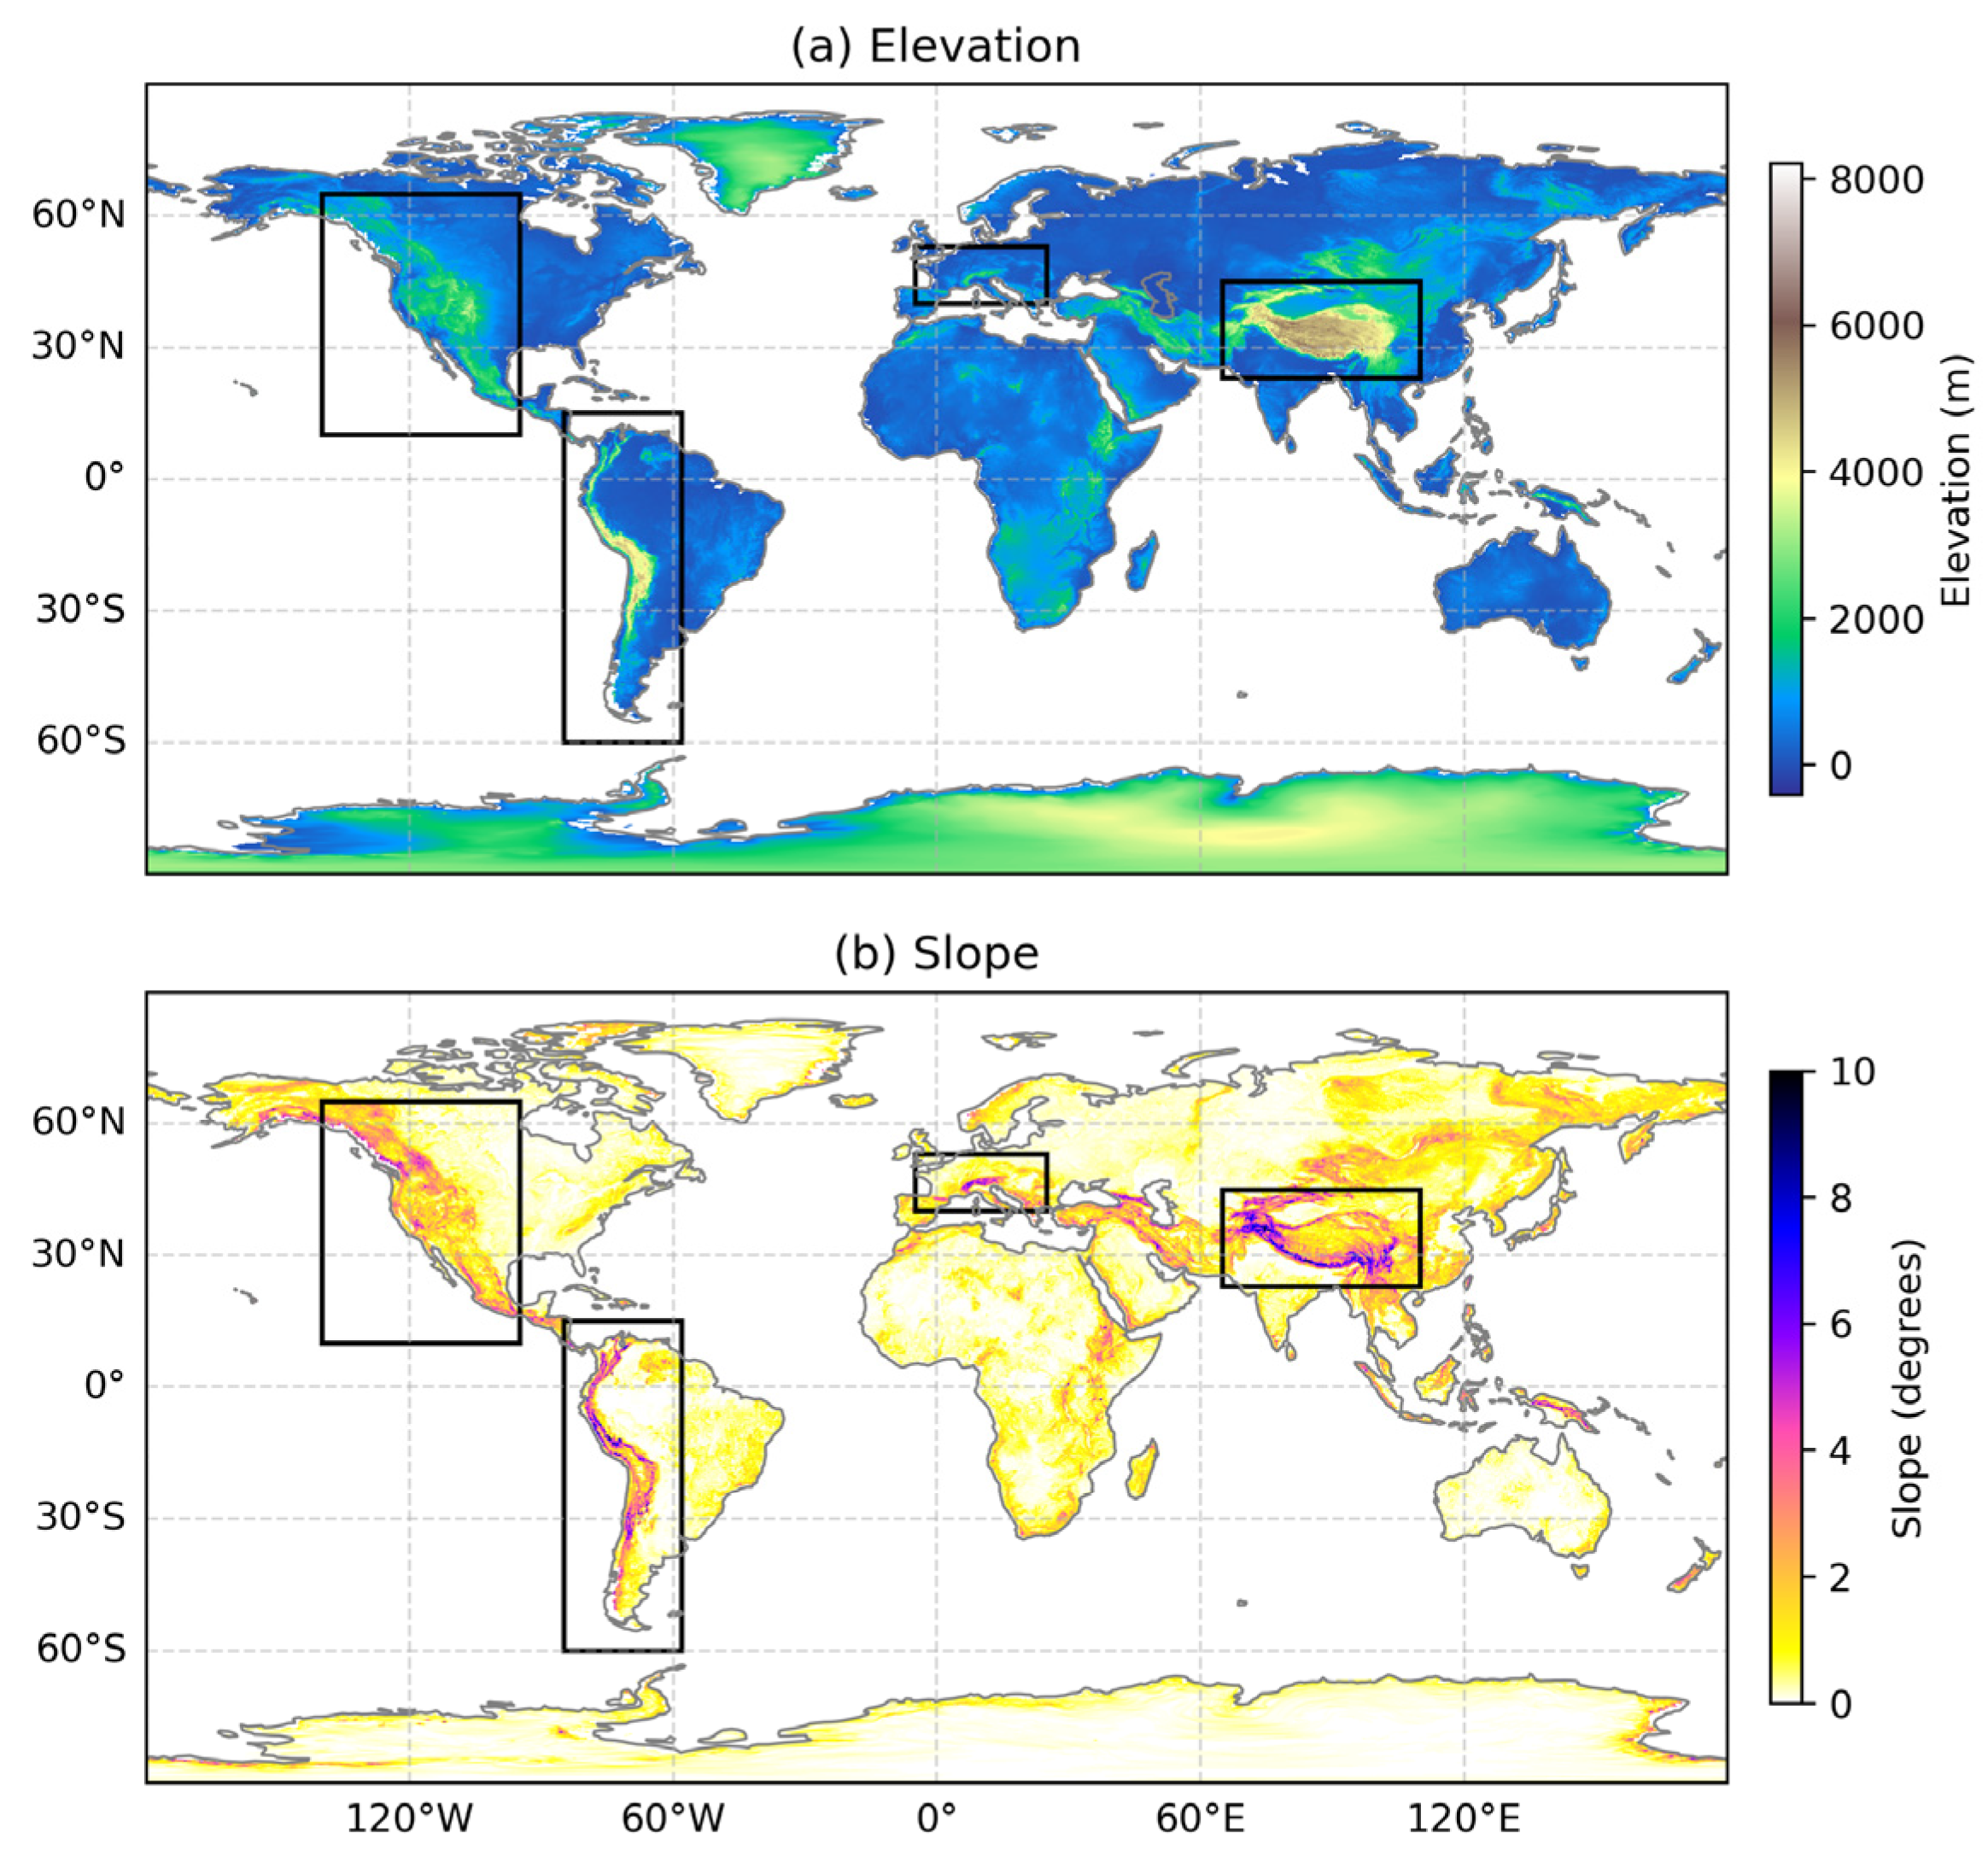
Figure 1 shows the global distribution of elevation and slope, from which major mountain ranges can be clearly identified. Based on these topographic features, climatic representativeness, and their documented relevance to orographic cirrus formation [40], four representative non-polar mountainous regions were selected: the Rocky Mountains, Andes, Alps, and Himalayas, as indicated by the black boxes in Figure 1. These four regions span distinct latitudinal zones, topographic configurations, and climatic backgrounds. The Rocky Mountains represent a major midlatitude continental mountain system in North America, while the Andes form an elongated north–south-oriented mountain barrier in the Southern Hemisphere. The Alps represent a complex European mountain system, whereas the Himalayas represent the highest Asian mountain system, strongly influenced by monsoonal circulation and the Tibetan Plateau. As shown in Figure 1, the Himalayas exhibit the highest elevations among the selected regions, with elevations locally exceeding 6000 m, and a pronounced topographic gradient along their southern slope. Although Greenland and Antarctica also contain extensive high-elevation terrain and can be affected by orographic gravity waves, they were excluded because their polar climates, ice-sheet surfaces, and distinct radiative regimes differ substantially from those of mid- and low-latitude mountain systems [41,42]. Including these polar regions would introduce additional polar-specific processes and reduce the comparability of the regional analysis. Therefore, the selected regions provide a suitable set of representative non-polar mountainous environments for comparing the macrophysical, microphysical, and optical characteristics of orographic cirrus clouds.

3.2. Orographic Cirrus

This study utilizes MODIS observations to identify the locations of cirrus clouds. By incorporating the IC-CIR classification system, orographic cirrus clouds are further distinguished from the observed cirrus. Subsequently, based on the predefined locations of major mountainous regions, cirrus clouds over each region are extracted for comparative analysis.
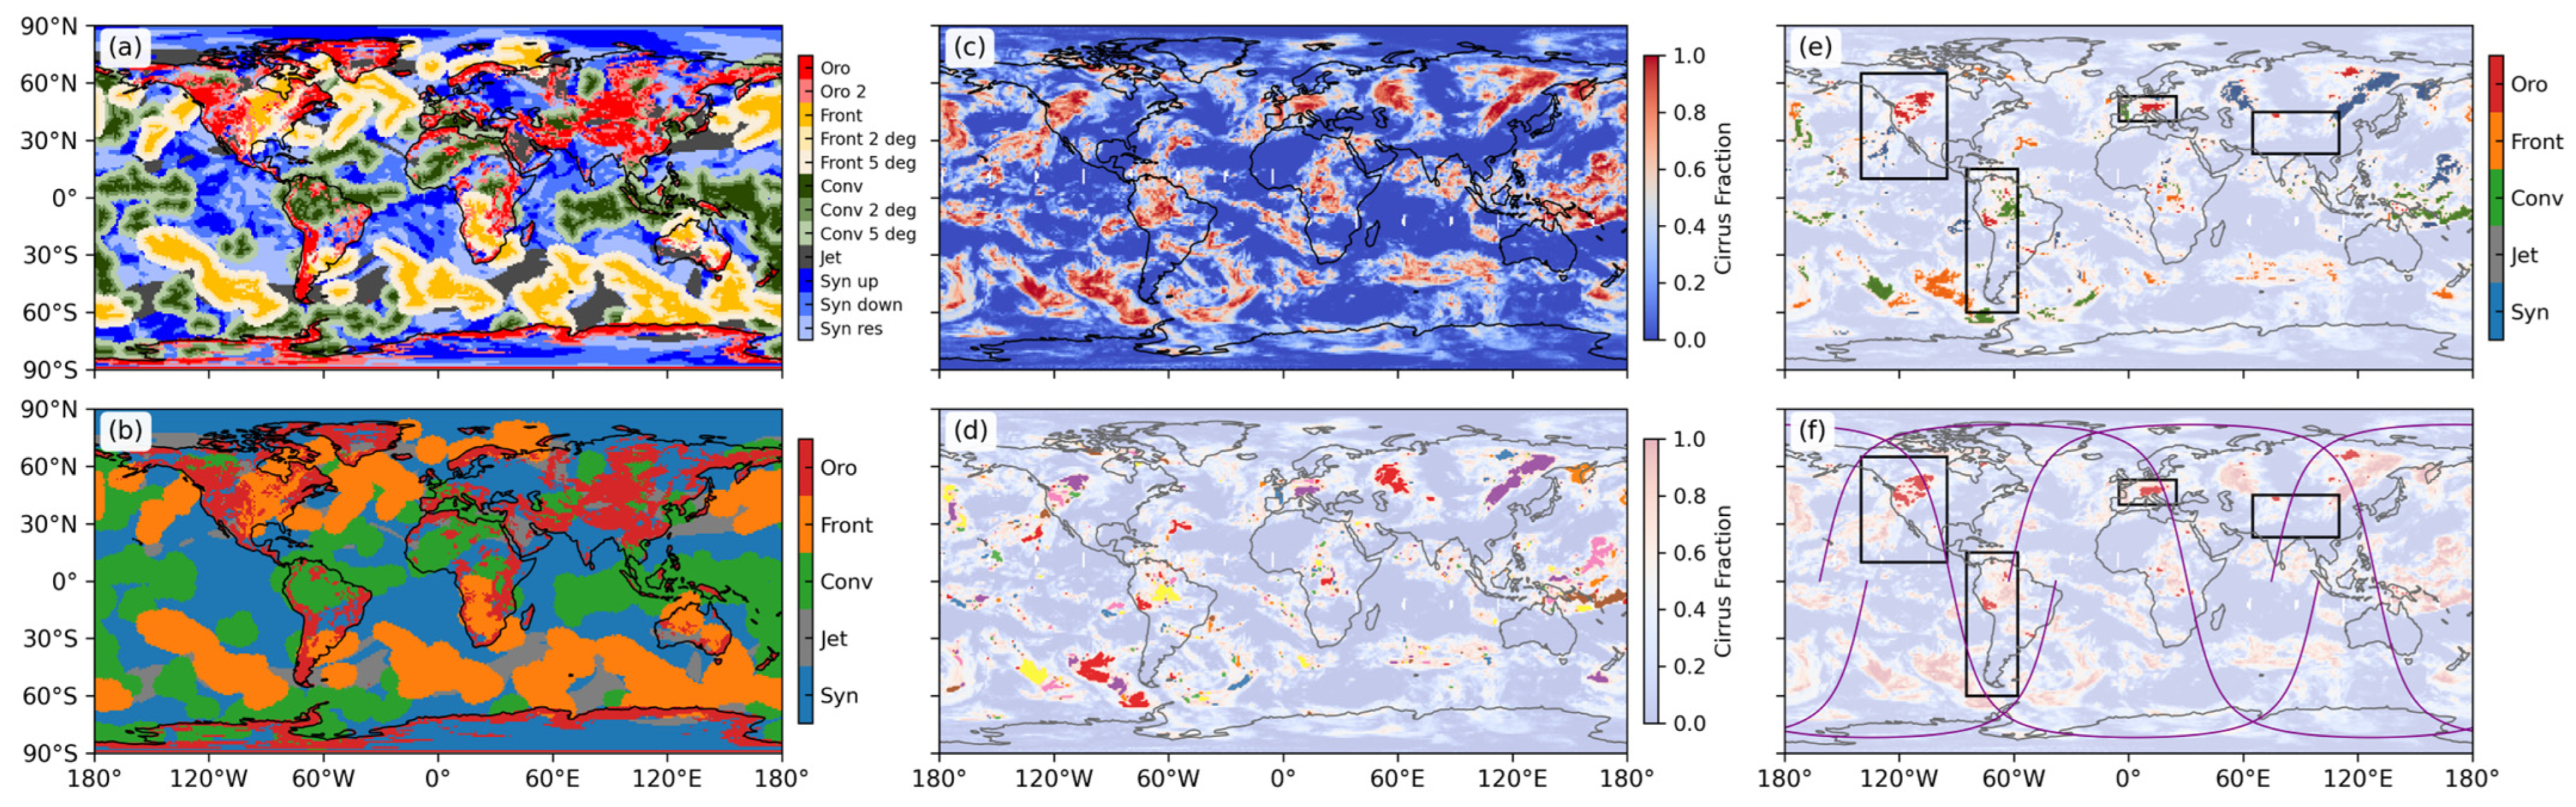
To illustrate the identification and classification of orographic cirrus clouds over different mountainous regions, observations on 29 March 2007 are taken as an example, as shown in Figure 2. Figure 2a presents the original cirrus dynamical regimes from the IC-CIR classification system. In this framework, cirrus clouds are associated with eleven different dynamical environments, including orographic lifting, frontal systems, convection, jet streams, and synoptic regimes, as well as several buffer regions located within 2° or 5° of the primary dynamical systems. To facilitate the interpretation of cirrus formation mechanisms, these eleven categories are further aggregated into five primary cirrus types: orographic, frontal, convective, jet-related, and synoptic cirrus, as shown in Figure 2b.
MODIS observations are then used to identify the spatial distribution of cirrus clouds. Figure 2c shows the cirrus fraction derived from the MYD08_D3 product, which represents the fractional coverage of cirrus clouds within each latitude–longitude grid cell. Latitude–longitude grid cells with a cirrus fraction greater than 0.85 are considered to be covered by cirrus clouds in this study. This threshold was selected to identify grid cells with relatively complete cirrus coverage rather than partially cloudy or marginal cirrus conditions. Similar high cloud-fraction criteria have been used in previous MODIS-based cloud studies to focus on cloudy scenes and reduce the influence of partially cloudy grid cells [43,44]. Therefore, the threshold of 0.85 used here represents a conservative choice for balancing sample purity and spatial continuity in the subsequent connected-component analysis. To evaluate the sensitivity of the results to this choice, we repeated the analysis using thresholds of 0.7, 0.8, and 0.9, and found that the main regional contrasts and seasonal patterns remained broadly consistent among these thresholds. Based on this threshold, a binary cirrus mask is constructed, and connected component analysis [45] is subsequently applied to identify individual cirrus cloud systems, as shown in Figure 2d. This method is widely used in satellite image analysis to detect spatially continuous cloud clusters in gridded datasets. It is particularly useful in this study because orographic cirrus clouds generated by mountain-induced lifting may be advected away from the mountain ranges by ambient winds. As a result, cirrus cloud systems associated with mountainous regions may extend beyond the predefined geographic boundaries. If cirrus clouds were selected solely based on fixed latitude–longitude boxes, parts of the same cloud system could be artificially excluded, especially for relatively small mountainous regions such as the Alps. By identifying spatially connected cirrus cloud systems first, this approach preserves complete cloud systems without introducing artificial boundaries.
For each cirrus cloud system identified through the connected component analysis, its formation mechanism is determined according to the dominant cirrus type within the system based on the five aggregated IC-CIR categories. The resulting classification is shown in Figure 2e, where different colors represent cirrus cloud systems associated with different dynamical processes. After the orographic cirrus systems are identified, each system is assigned to one of the selected mountainous regions according to its spatial overlap with the predefined regional boxes. Specifically, an orographic cirrus system is attributed to a given mountainous region if more than 50% of its grid cells are located within that region. This criterion ensures that each orographic cirrus system is associated with the region with which it has the largest spatial overlap, while avoiding artificial splitting of physically connected cloud systems by regional boundaries. Orographic cirrus clouds are primarily located near major mountain ranges, including the Rocky Mountains, Andes, and Alps. In contrast, convective cirrus clouds are primarily distributed in tropical regions, while frontal cirrus clouds are predominantly found along the mid-latitude storm tracks.
Figure 2f shows the orbital tracks of the CloudSat and CALIPSO satellites on the same day. These tracks indicate the A-Train satellite observations intersecting the identified orographic cirrus regions. The collocated radar–lidar observations from CloudSat and CALIPSO provide detailed vertical structure information for the detected cirrus clouds, enabling further analysis of the microphysical and structural characteristics of orographic cirrus clouds over the selected mountainous regions.
It is worth noting that not all cirrus clouds located over mountainous regions are categorized as orographic cirrus in the IC-CIR framework. As illustrated in Figure 2e, cirrus clouds associated with other dynamical processes can still occur in mountainous areas. For instance, several cirrus systems near the Rocky Mountains are identified as frontal cirrus, likely related to extratropical cyclones propagating across North America. In the northern Andes, convective cirrus clouds are also detected due to frequent tropical convection. These results suggest that cirrus clouds observed over mountainous terrain may originate from multiple dynamical processes rather than exclusively from orographic lifting. Such distinctions can be effectively captured by the IC-CIR classification framework but would be difficult to obtain using classifications based solely on geographic proximity to mountain ranges.

3.3. Statistical Analysis

To quantitatively evaluate the inter-regional differences in the properties of orographic cirrus clouds, non-parametric statistical analyses were performed. The Kruskal–Wallis test was first applied to examine whether statistically significant differences exist among the four mountainous regions. This test was selected because cloud-top height, ice water path, optical depth, and cirrus reflectance exhibit non-normal and skewed distributions. When the Kruskal–Wallis test indicated significant regional differences, pairwise Mann–Whitney U tests were further conducted to identify which regional pairs differed significantly. The p values from the pairwise tests were adjusted using the Holm method to account for multiple comparisons. A significance level of p < 0.05 was used throughout the analysis.

4. Results

4.1. Macrophysical Characteristics

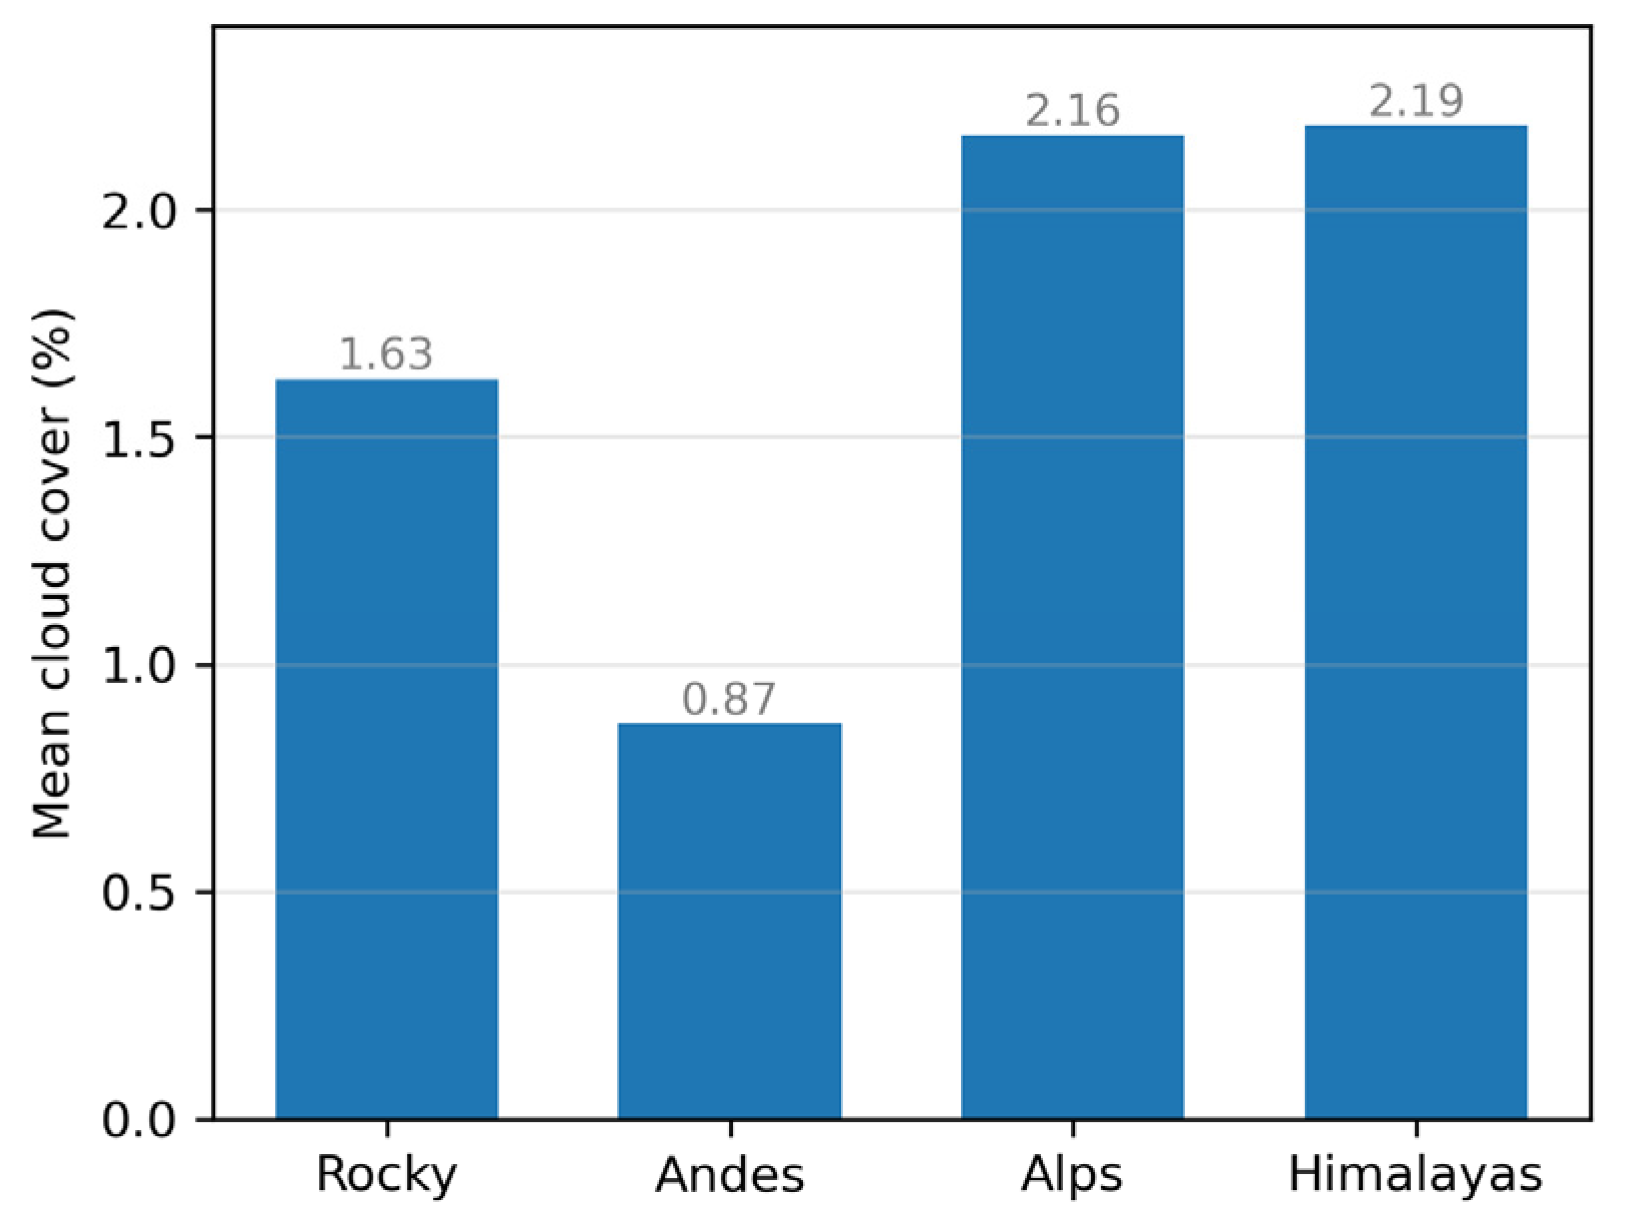
We first analyze the cloud cover of orographic cirrus over different mountainous regions. Here, cloud cover is defined, for a given region, as the ratio of the area covered by orographic cirrus to the total area of that region. The spatial variations among regions are shown in Figure 3. Overall, the mean orographic cirrus cloud cover over the four mountainous regions ranges from approximately 0.9% to 2.2%. Previous studies have reported a global mean orographic cirrus cloud cover of about 1.2% [46], broadly consistent with the values obtained here.
Among the four regions, the Himalayas and the Alps exhibit relatively higher orographic cirrus cloud cover than the Rocky Mountains, while the Andes show the lowest value. This pattern is consistent with differences in mountain orientation and their interaction with the prevailing large-scale circulation [18,47]. Both the Himalayas and the Alps are characterized by predominantly zonal orientations, which favor interaction with the prevailing large-scale circulation, including the midlatitude westerlies. Such configurations favor persistent cross-barrier flow and the generation of mountain waves, thereby enhancing upper-tropospheric cooling and conditions conducive to cirrus formation. In contrast, the Rocky Mountains and the Andes are largely meridionally oriented, which can reduce the efficiency of wave generation under zonal flow and lead to a comparatively weaker enhancement of orographic cirrus occurrence. In addition, the Himalayas and the Alps are located in the Northern Hemisphere midlatitudes, where stronger land–atmosphere interactions and more active synoptic disturbances may favor the formation of upper-tropospheric clouds. The Andes, by contrast, extend predominantly into the Southern Hemisphere, where large-scale subsidence and comparatively cleaner atmospheric conditions may limit the persistence of cirrus clouds. Previous modeling studies further indicate that orographic gravity waves can substantially enhance upper-tropospheric vertical velocity fluctuations and favor cirrus formation over mountainous terrain, highlighting the dynamical importance of terrain-induced wave activity in shaping regional orographic cirrus occurrence [48].
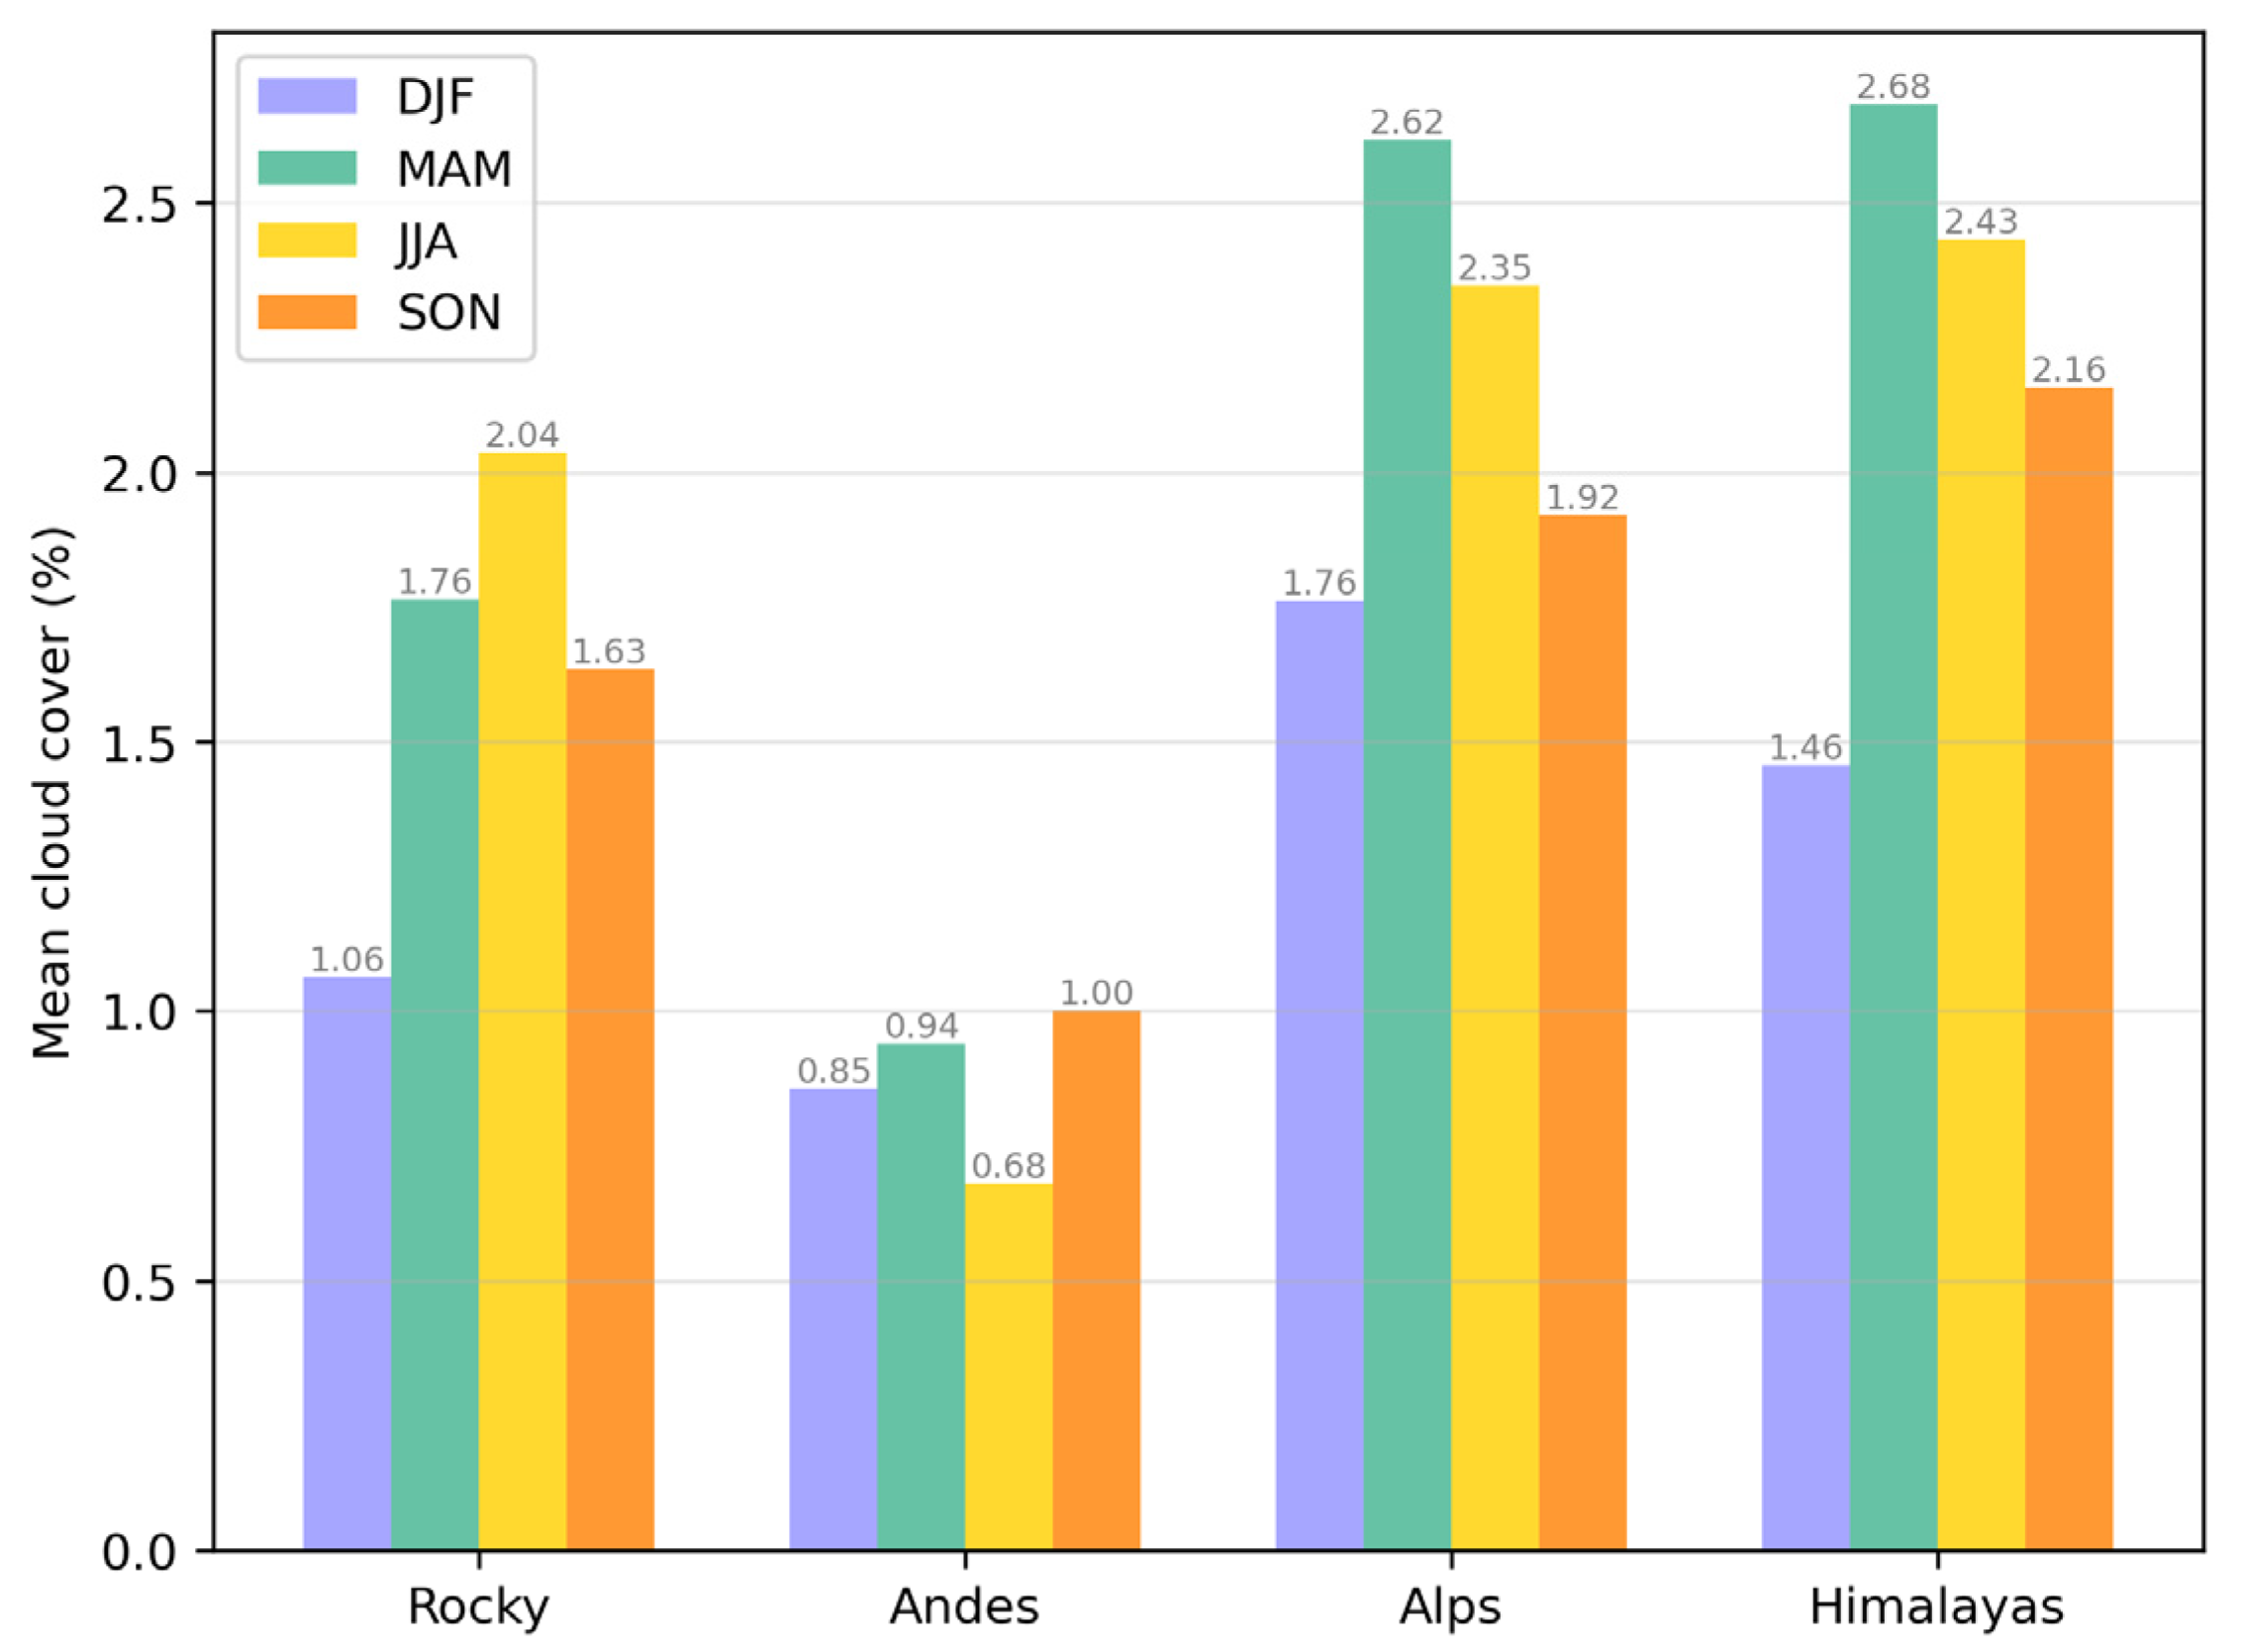
Figure 4 illustrates the seasonal variations in orographic cirrus cloud cover across the four mountainous regions. Clear regional differences in seasonal behavior can be observed. The Himalayas and the Alps exhibit the largest seasonal variability, with cloud cover reaching a pronounced maximum in MAM, when values increase to about 2.68% over the Himalayas and 2.62% over the Alps, and remaining relatively high during JJA. This seasonal enhancement is likely associated with increased upper-tropospheric moisture availability and intensified dynamical activity during the warm season in the Northern Hemisphere. Over the Himalayas, this variability is closely linked to the evolution of the Asian monsoon circulation, which transports large amounts of moisture toward the mountain range and enhances deep convection and upper-level cloud formation [49,50,51]. In contrast, the Alps are primarily influenced by midlatitude westerlies and synoptic-scale disturbances, while mountain-induced gravity waves generated by airflow over complex terrain can further promote cirrus formation in the upper troposphere [52].
In contrast, the Andes display a comparatively weak seasonal amplitude, with cloud cover varying only slightly from about 0.68% in JJA to approximately 1.00% in SON. This behavior likely reflects the generally dry background conditions and subsidence-dominated circulation over much of the region, which limit the frequency of cirrus formation. The Rocky Mountains show intermediate seasonal variability, with cloud cover increasing from about 1.06% in DJF to approximately 2.04% in JJA. This pattern suggests that seasonal changes in moisture supply and convective activity play an important role in modulating cirrus occurrence over the region. Overall, the distinct seasonal behaviors among the four mountainous regions highlight the combined influence of hemispheric circulation regimes, seasonal moisture availability, and terrain-induced dynamical processes on the formation of orographic cirrus clouds.
It should be noted that the relative magnitudes of the regional mean cloud cover shown in Figure 3 and Figure 4 are influenced by the predefined regional boundaries. Because cloud cover is calculated as the ratio of the area covered by orographic cirrus to the total area of each selected region, the inclusion of non-mountainous or oceanic areas can reduce the regional mean value. This effect is particularly relevant for the Rocky Mountains region, where the selected box includes relatively large oceanic areas upstream of the mountain range that are less favorable for hosting orographic cirrus. Therefore, the lower mean cloud cover over the Rocky Mountains, compared with the Alps and the Himalayas, may partly reflect the influence of regional boundary selection in addition to differences in topography and large-scale circulation.
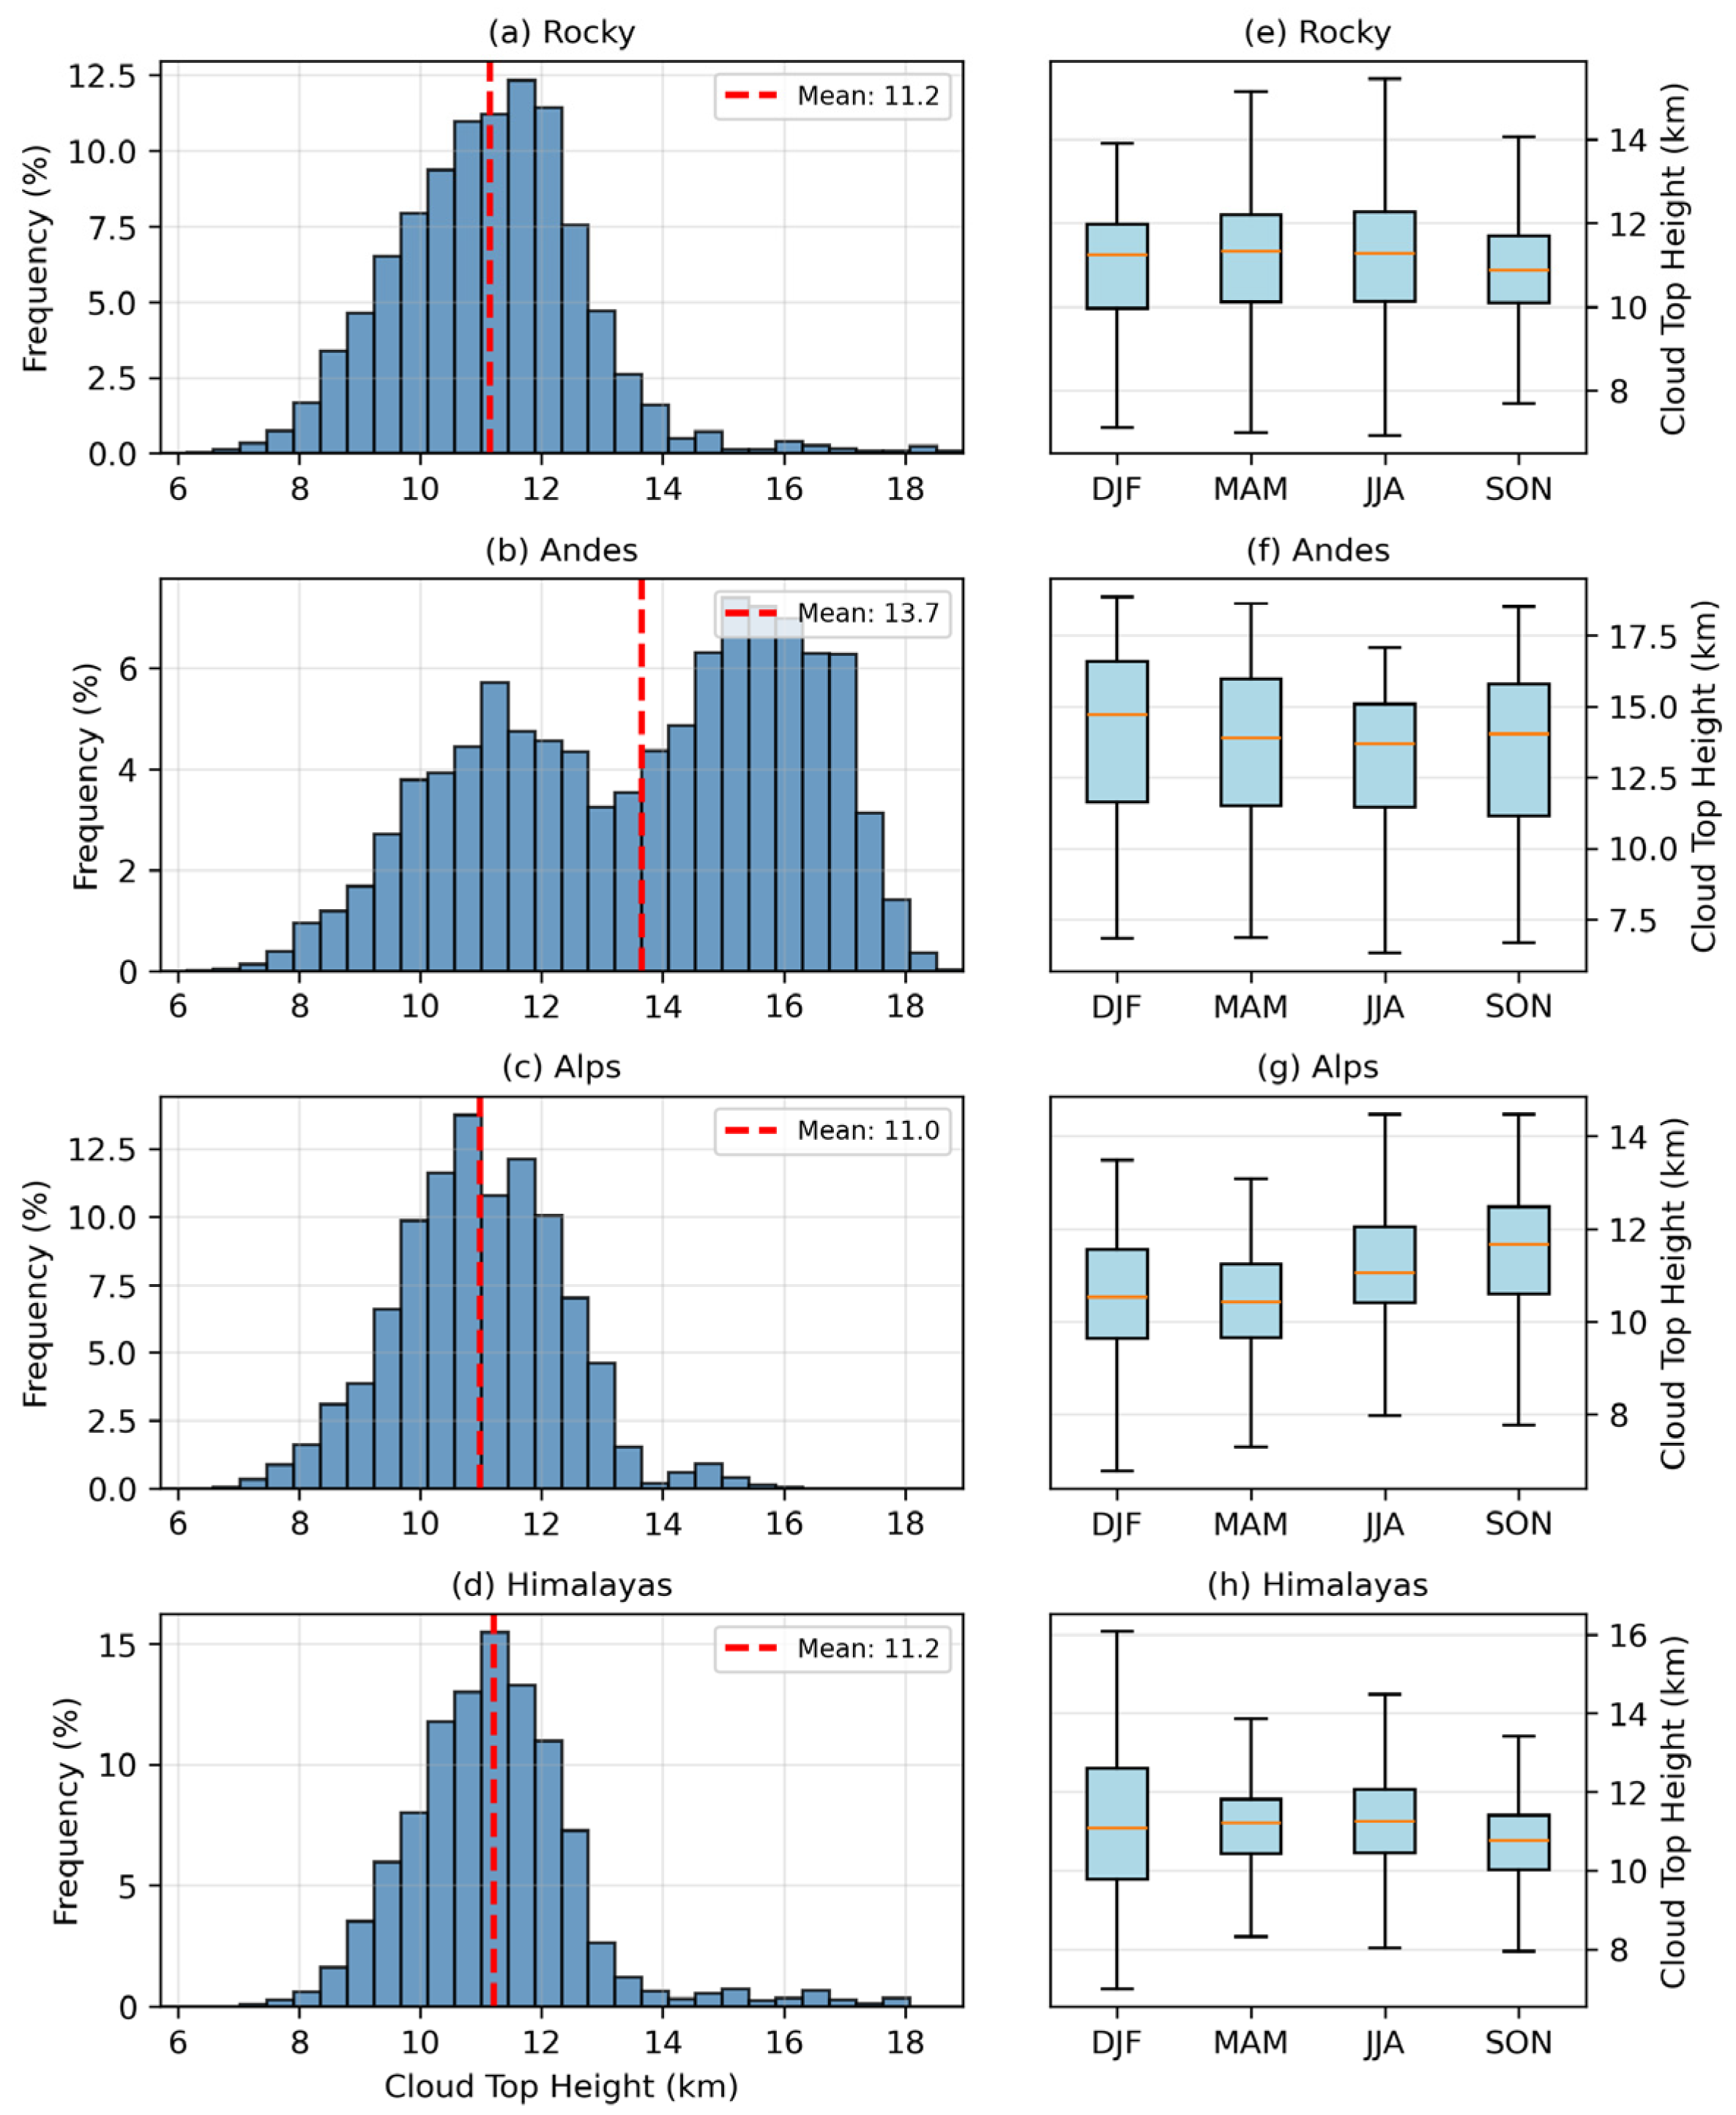
Figure 5 shows the distribution of cloud top height (CTH) across the four mountainous regions, providing insight into the vertical structure of orographic cirrus. The Andes exhibit substantially higher cloud tops than the other regions, with a mean CTH of approximately 13.7 km, whereas the Rocky Mountains, the Alps, and the Himalayas show mean CTH values clustered around 11 km. The Kruskal–Wallis test indicates statistically significant inter-regional differences in CTH among the four mountainous regions. Pairwise Mann–Whitney U tests further confirm that the CTH distribution over the Andes is significantly different from those over the Rocky Mountains, the Alps, and the Himalayas. These results support the conclusion that orographic cirrus over the Andes tends to reach higher altitudes than that over the other three mountainous regions.
Notably, the histogram of CTH over the Andes displays a pronounced bimodal distribution, with one peak near 11–12 km and another near 15–16 km. This bimodal structure suggests the presence of multiple dynamical pathways for the formation of orographic cirrus. The lower peak is consistent with cirrus clouds generated by direct orographic lifting, in which airflow forced over the mountain range cools adiabatically and forms ice clouds in the upper troposphere. The higher peak likely reflects the influence of deep convection that is triggered or enhanced by complex terrain, which can loft ice particles to higher altitudes and produce cirrus layers closer to the tropical tropopause.
Similar interactions between terrain-induced uplift and convective processes have been suggested to enhance high-level ice cloud development in mountainous environments [20]. Among the four mountainous regions, the Andes lie closest to the equatorial belt and span a broad latitudinal range from tropical to subtropical environments. This geographical setting allows terrain-modulated convection to occur under a higher tropical tropopause, thereby increasing the likelihood that some cirrus clouds extend to higher altitudes. Consequently, terrain-modulated convection may more readily contribute to the formation of high-altitude cirrus over this region. Although the Andes exhibit relatively low overall cloud cover (Figure 3), the cirrus clouds that do occur tend to reach higher altitudes, highlighting the combined influence of tropical convection and complex topography. In contrast, the Rocky Mountains, the Alps, and the Himalayas exhibit relatively similar CTH distributions, characterized by a single dominant peak around 10–12 km. This does not exclude the influence of seasonal convection or moisture transport in these regions, particularly under favorable large-scale circulation conditions. However, such influences do not appear to produce a separate high-altitude CTH mode comparable to that over the Andes. Within the IC-CIR framework, strongly convective cirrus and orographic cirrus are classified as distinct regimes, and the CTH distributions shown here therefore mainly reflect the vertical characteristics of cirrus identified as orographic. The dominant 10–12 km peak is consistent with cirrus generated in extratropical or subtropical mountainous environments, where cloud formation is often associated with terrain-induced lifting and mountain-wave dynamics rather than deep tropical convection.
Clear seasonal variability in CTH is observed across the four mountainous regions. Over the Rocky Mountains and the Himalayas, the seasonal median CTH remains relatively stable throughout the year, generally close to 11 km. The Alps show a gradual increase in median CTH from DJF to SON, rising from about 10.5 km in DJF to approximately 11.7 km in SON, suggesting enhanced upper-tropospheric lifting during the warmer months. In contrast, the Andes exhibit the largest variability, with higher cloud tops during DJF, consistent with stronger convective activity during the austral summer.

4.2. Microphysical and Optical Properties

The microphysical properties of orographic cirrus clouds are further examined through the distribution of ice water path (IWP) across the four mountainous regions, as shown in Figure 6. Previous studies have shown that the radiative properties of cirrus are highly sensitive to ice water content and column-integrated ice amount [53,54], highlighting the importance of IWP for understanding the climatic role of high-level ice clouds.
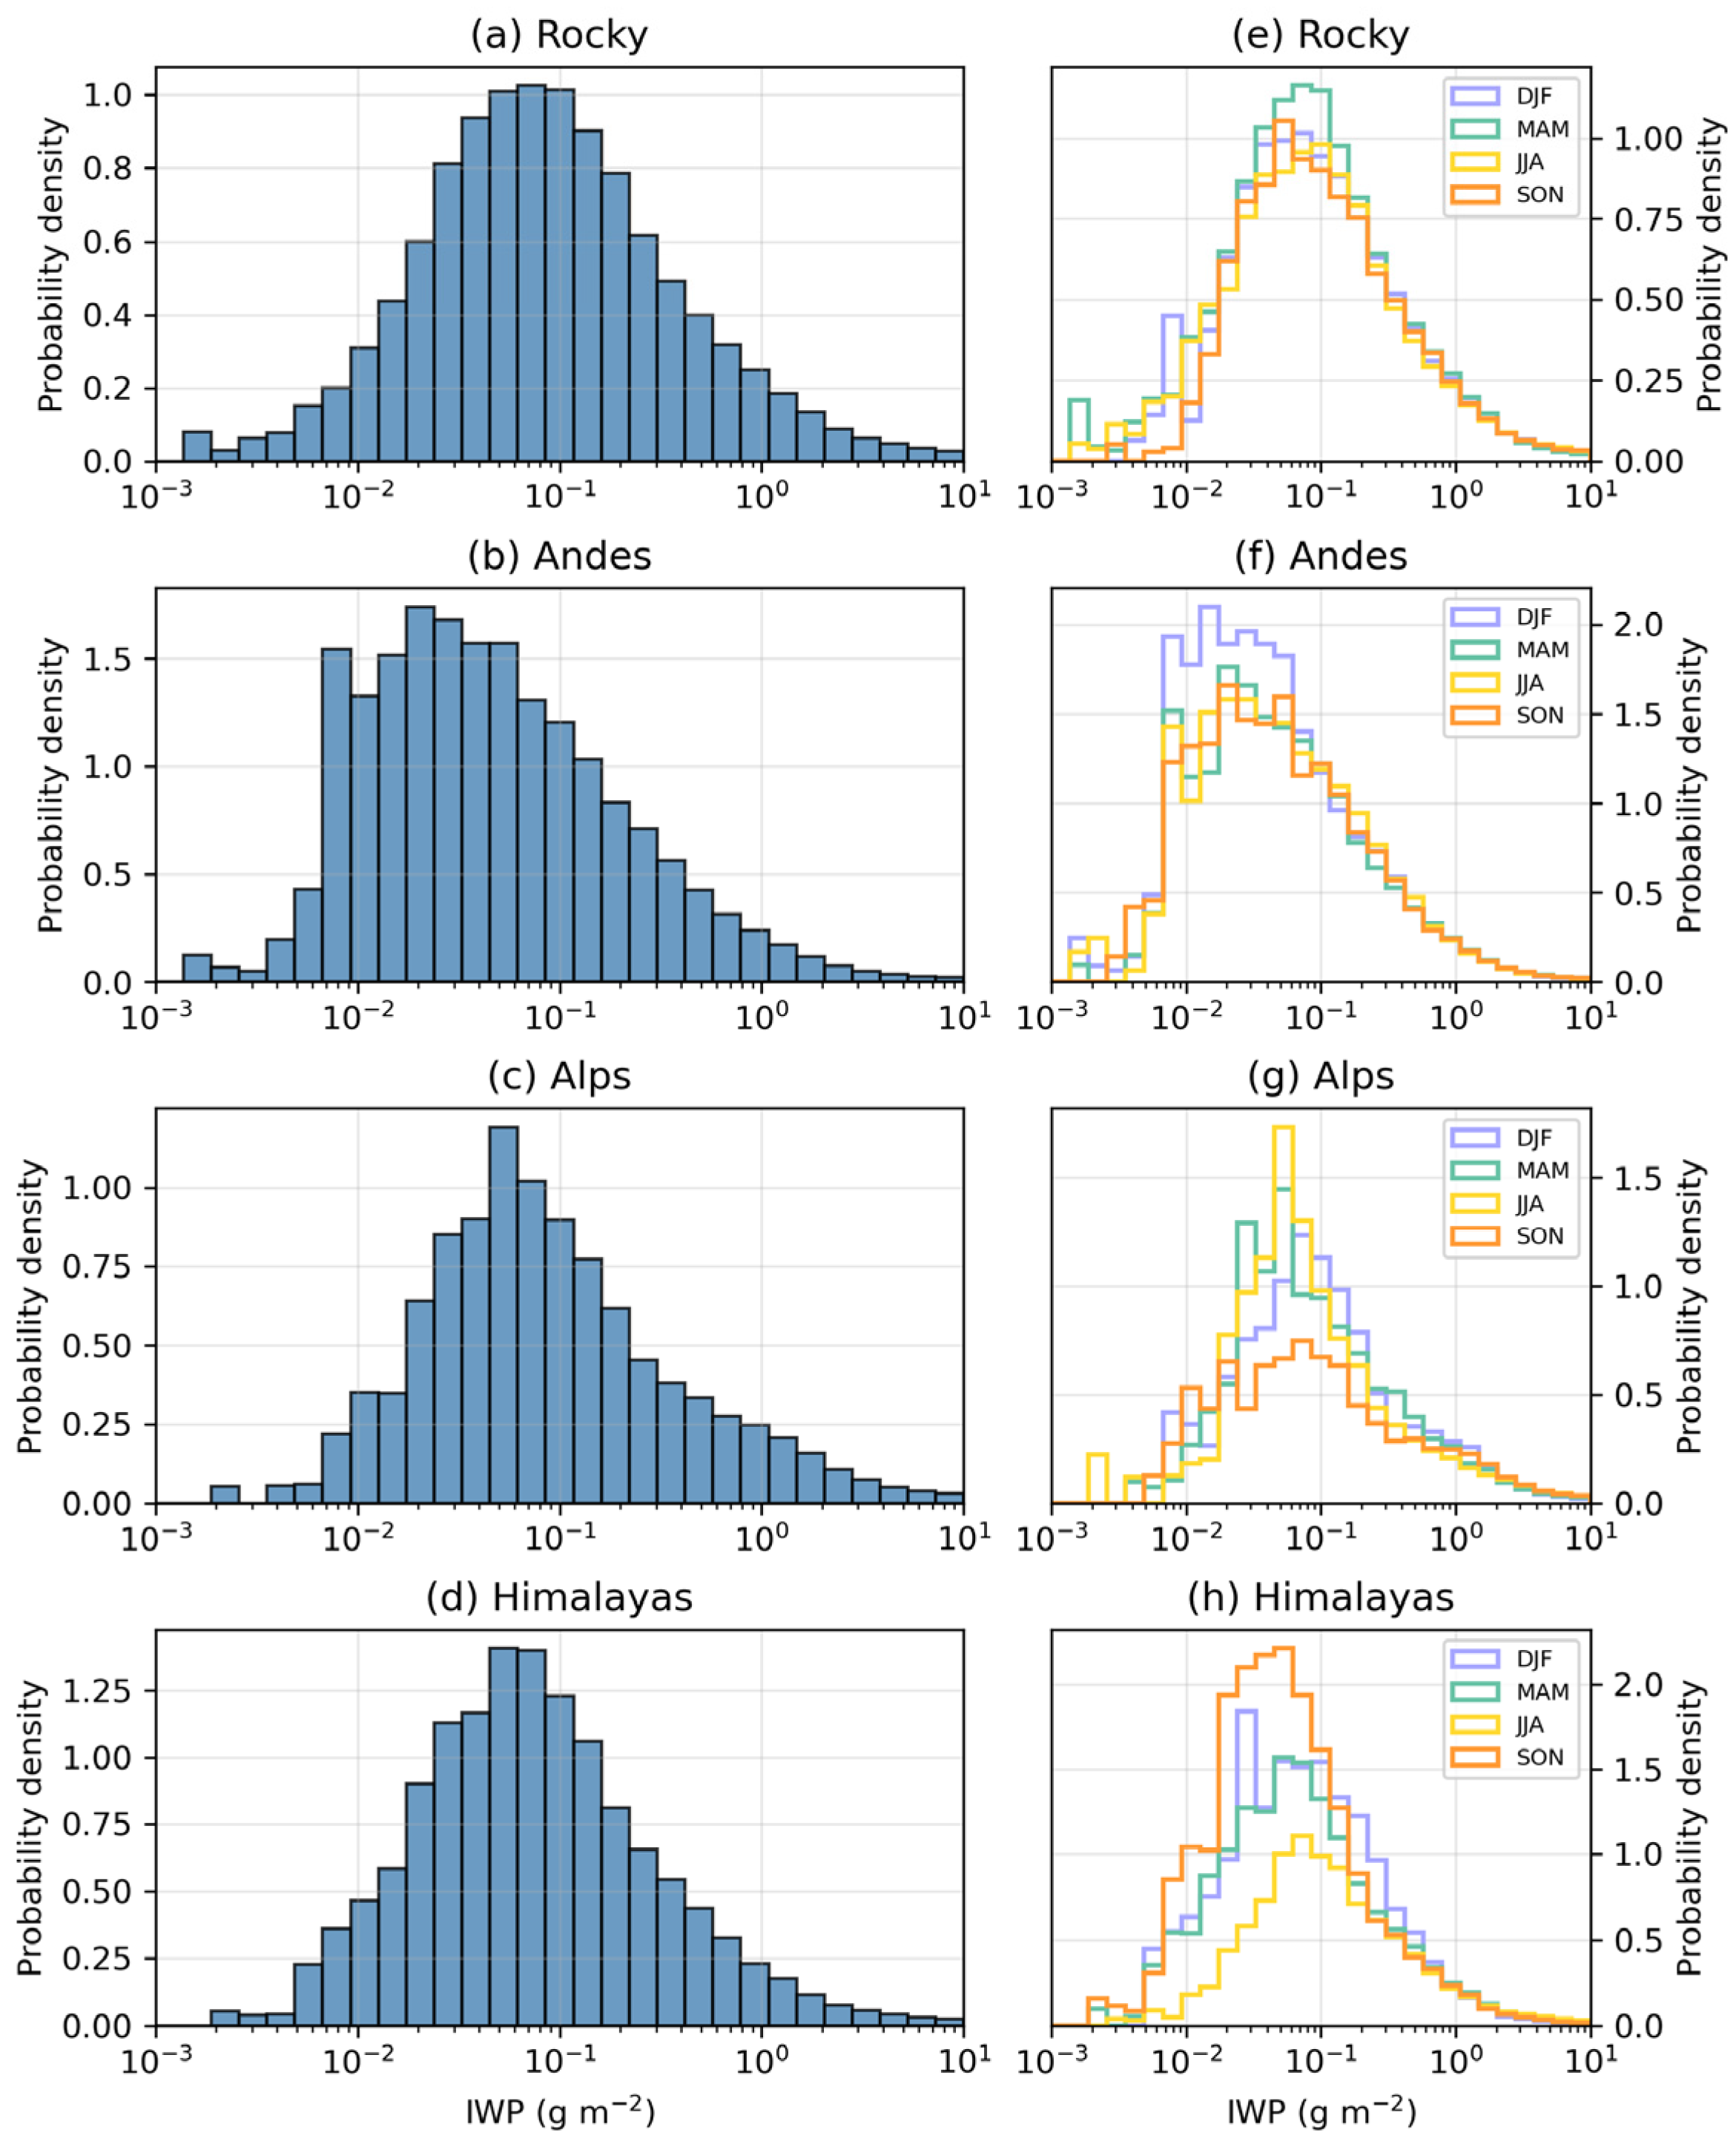
The probability density distributions of IWP show broadly similar patterns across the four regions (Figure 6a–d). In all regions, the highest probability densities occur within the range of approximately 10 2 to 10 1   g m 2 , while the probability gradually decreases toward larger IWP values. The distributions extend over several orders of magnitude, indicating that although most orographic cirrus clouds contain relatively small amounts of column-integrated ice, occasional cases with substantially larger ice mass also occur. Such broad microphysical variability is consistent with recent modeling work showing that cirrus particle properties are strongly influenced by differences in thermodynamic history along particle trajectories [55]. The Kruskal–Wallis test indicates statistically significant inter-regional differences in IWP among the four mountainous regions. Pairwise Mann–Whitney U tests further show significant differences for most regional pairs, except between the Andes and the Himalayas. However, the IWP distributions overlap substantially among regions, suggesting that these differences mainly represent modest distributional shifts rather than clearly separated regional regimes.
The seasonal variations in IWP distributions are further illustrated in Figure 6e–h. Over the Rocky Mountains, IWP exhibits only weak seasonal variability. In contrast, the Andes show slightly smaller IWP values during DJF, while the distributions in the other seasons remain broadly similar. The Alps exhibit moderate seasonal differences. The Himalayas display a clearer seasonal signal, with relatively smaller IWP values in SON, whereas the other seasons show comparable distributions.
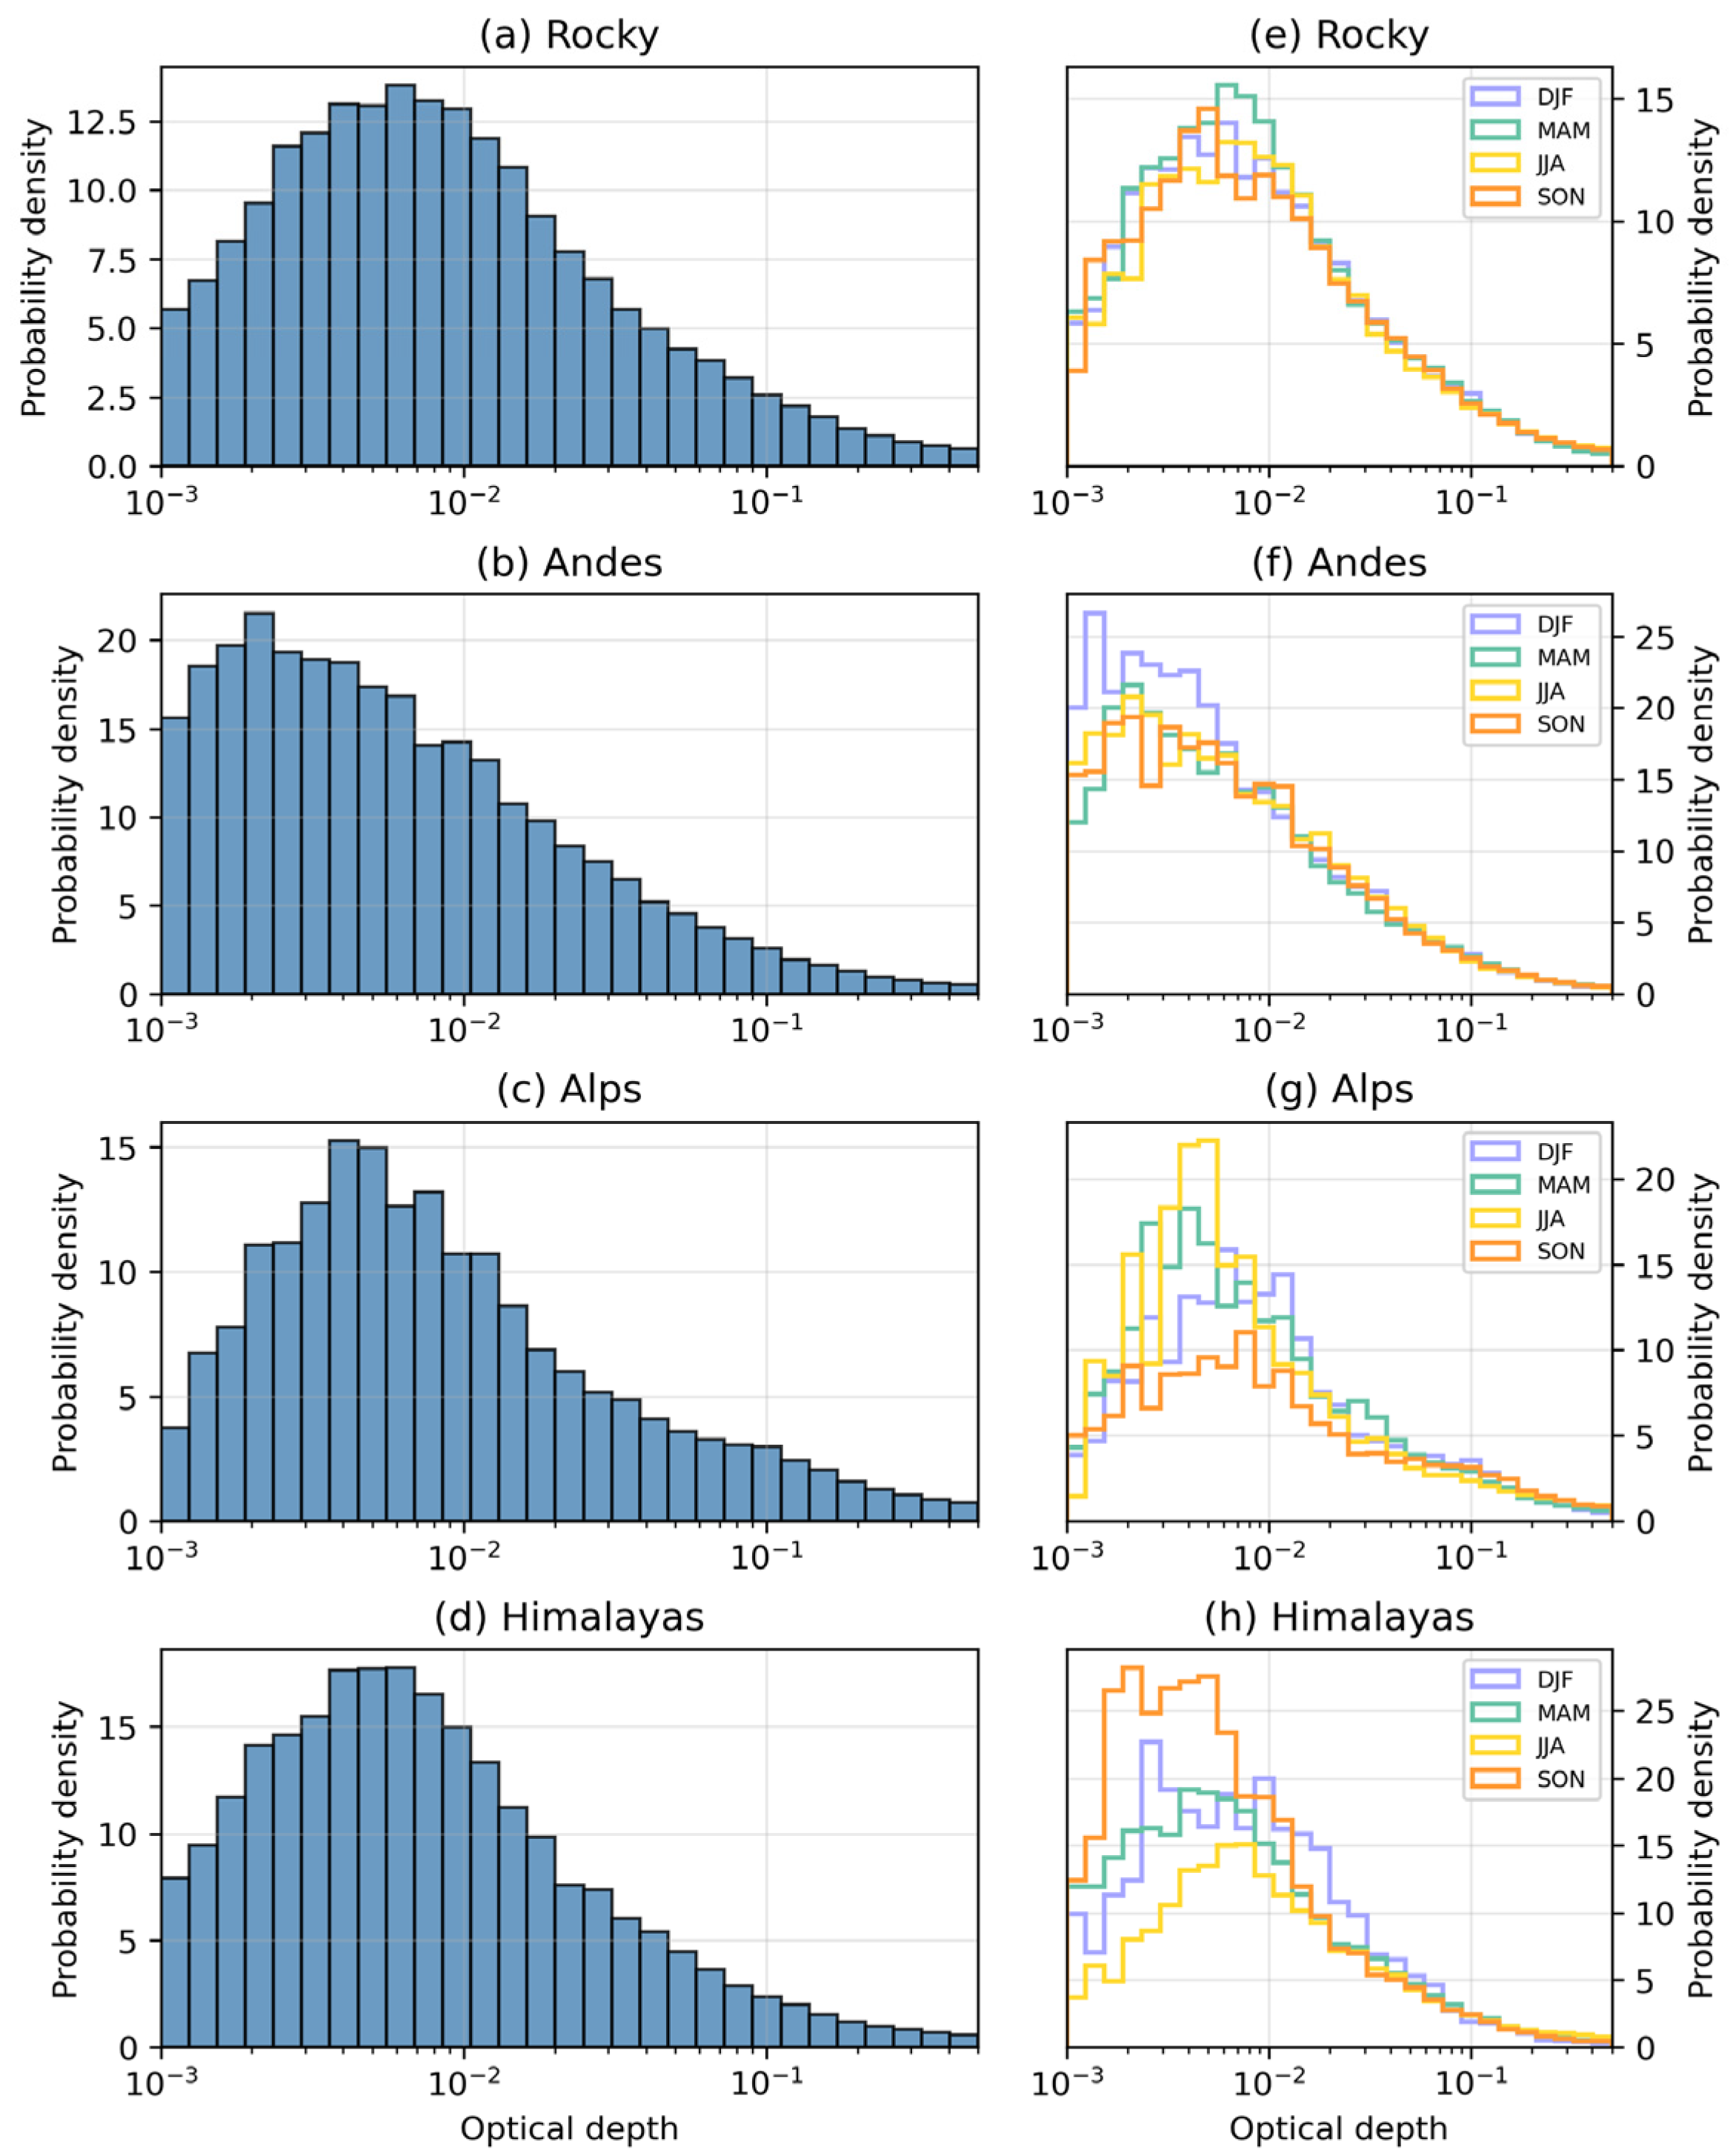
Figure 7 presents the distribution of cirrus optical depth over the four mountainous regions. Since cirrus optical depth is strongly related to the column-integrated ice amount, especially IWP, the optical-depth distributions show several features like those of IWP. Physically, larger IWP generally indicates a larger total ice mass along the atmospheric column and therefore stronger extinction of radiation, although particle size, habit, and vertical distribution can also modulate the relationship between IWP and optical depth. Overall, the optical depth distributions show comparable characteristics across the four regions. In most cases, the highest probability densities occur within the range of approximately 10 3 to 10 2 , while the probability gradually decreases toward larger optical depth values. The Kruskal–Wallis test indicates statistically significant inter-regional differences in optical depth among the four mountainous regions, and pairwise Mann–Whitney U tests further show significant differences for all regional pairs. Nevertheless, the distributions overlap substantially, indicating that these differences should be interpreted as modest distributional shifts rather than clearly separated regional regimes.
The seasonal variations in optical depth distributions are further illustrated in Figure 7e–h. Over the Rocky Mountains, optical depth exhibits only weak seasonal variability. In contrast, the Andes show slightly smaller optical depth values during DJF, while the seasonal distributions in the other seasons remain broadly similar. The Alps exhibit moderate seasonal differences, with somewhat larger optical depth values during SON. The Himalayas display a clearer seasonal signal, with relatively smaller optical depth values in SON, whereas the other seasons show comparable distributions.
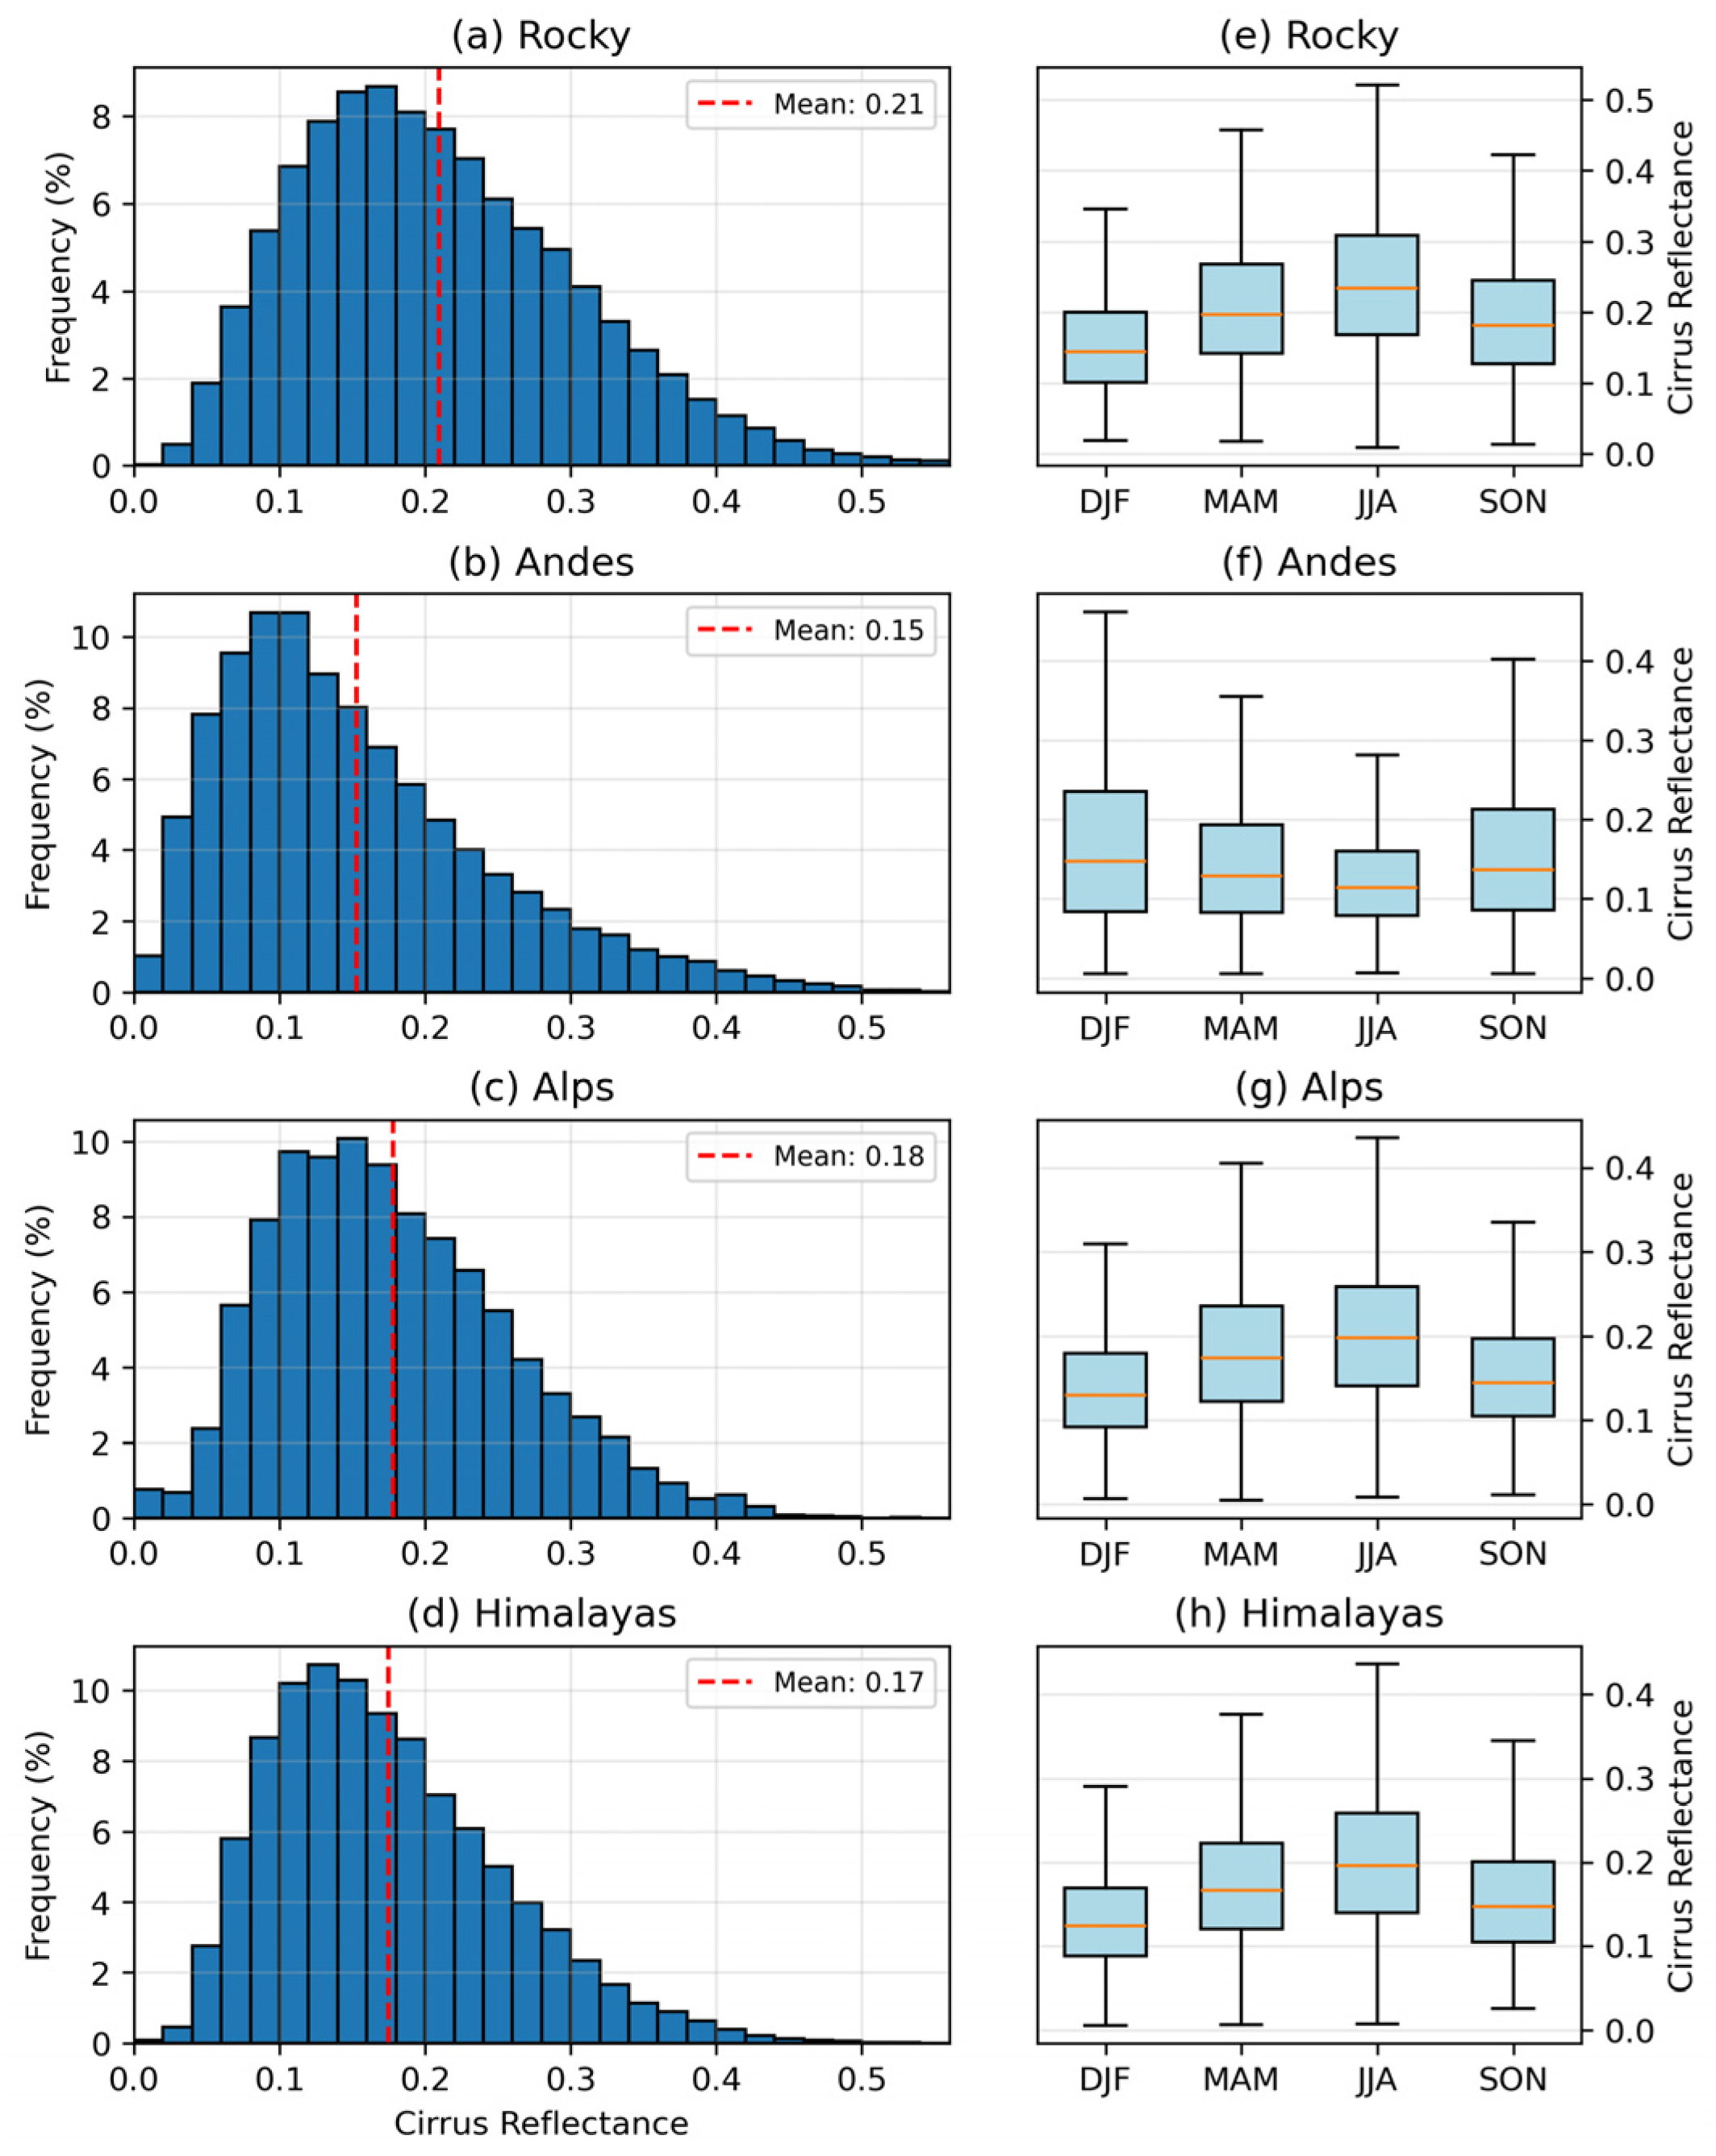
The optical characteristics of orographic cirrus clouds are further explored using the distribution of cirrus reflectance across the four mountainous regions, as shown in Figure 8. Cirrus reflectance represents the ability of cirrus clouds to scatter and reflect incoming solar radiation, and is closely linked to their optical and microphysical properties.
In all regions, the highest frequencies occur at relatively low reflectance values, and the frequencies gradually decrease as reflectance increases. This indicates that most orographic cirrus clouds are characterized by weak to moderate reflectance, while highly reflective cases are less common. The Kruskal–Wallis test indicates statistically significant inter-regional differences in cirrus reflectance among the four mountainous regions. Pairwise Mann–Whitney U tests further show that all regional pairs differ significantly. The median reflectance is highest over the Rocky Mountains, followed by the Alps and the Himalayas, and lowest over the Andes. This result confirms that orographic cirrus over the Andes tends to have lower reflectance values than that over the other three mountainous regions.
The seasonal variations in cirrus reflectance are further illustrated in Figure 8e–h. Overall, seasonal differences in cirrus reflectance are noticeable but remain smaller than the overall variability of the distributions. Over the Rocky Mountains, cirrus reflectance tends to be larger in JJA. The Andes show relatively weak seasonal contrasts, with only modest changes among different seasons. The Alps exhibit clearer seasonal differences, with somewhat larger reflectance values during JJA. The Himalayas also display an evident seasonal signal, with relatively lower reflectance in DJF and higher values in JJA, while MAM and SON remain intermediate. Previous studies have shown that cirrus reflectance generally reaches a maximum in winter and a minimum in summer in both hemispheres [56]. The seasonal patterns of orographic cirrus appear somewhat different from this large-scale tendency. Several regions exhibit enhanced reflectance during JJA, suggesting that cirrus optical properties over mountainous areas may be more strongly influenced by regional dynamical processes, such as orographic lifting, upper-tropospheric moisture variability, and warm-season convection.
The regional differences in IWP, optical depth, and cirrus reflectance can be further interpreted in relation to the distinct topographic and dynamical environments of the four mountain systems. Orographic cirrus formation requires not only terrain-induced lifting, but also sufficient upper-tropospheric moisture and favorable large-scale dynamical conditions. Previous modeling and observational studies have shown that mountain-wave-induced cooling can promote ice supersaturation and cirrus formation over complex terrain, while the resulting ice mass and optical properties are also sensitive to the thermodynamic history and moisture supply of the air parcels [18,20,48,55]. Therefore, the relatively larger median IWP, optical depth, and reflectance over the Rocky Mountains, Alps, and Himalayas may reflect environments where orographic lifting is more frequently accompanied by synoptic disturbances, cross-barrier flow, or seasonal moisture transport. In particular, the Himalayas are strongly influenced by the Asian monsoon system, which enhances moisture transport and convective activity during the warm season, while the Alps are frequently affected by midlatitude westerlies and synoptic-scale disturbances. These conditions can favor sustained upper-tropospheric lifting and ice production. In contrast, the Andes show relatively low cloud cover and generally lower median IWP and optical depth, suggesting that many detected orographic cirrus clouds in this region are optically thinner. However, their higher cloud tops indicate that terrain-modulated convection and tropical dynamical influences can still loft ice particles to high altitudes. This contrast suggests that cloud vertical development and column-integrated ice amount are controlled by different combinations of topographic forcing, moisture availability, and large-scale dynamics.

5. Discussion

The results show clear regional differences in the occurrence, vertical structure, and optical properties of orographic cirrus over the four mountainous regions. These differences suggest that the characteristics of orographic cirrus are influenced not only by terrain, but also by the background circulation and thermodynamic environment. The microphysical and optical contrasts further indicate that the potential radiative effects of orographic cirrus may differ among mountainous regions. Therefore, the regional dependence of cloud height and optical thickness should be considered when evaluating the radiative role of orographic cirrus over complex terrain. However, the present study does not directly quantify the radiative forcing of orographic cirrus. A quantitative linkage between cirrus properties and regional radiative effects requires dedicated radiative transfer calculations. Further investigation using a radiative transfer model is currently underway to examine the radiative effects of different cirrus formation types, including orographic cirrus. These analyses will be presented in a subsequent study.
Several uncertainties should also be considered when interpreting the results. The identification of cirrus-covered grid cells relies on the MODIS Level-3 cirrus fraction product. As a passive satellite sensor, MODIS may have limitations in detecting very thin or fragmented cirrus clouds, particularly when the cloud optical signal is weak. In mountainous regions, snow cover, complex terrain, and strong surface reflectance contrasts may further increase the uncertainty of cloud detection.
The use of a relatively high cirrus fraction threshold helps reduce contamination from partially cloudy or ambiguous grid cells, but it may also preferentially select more spatially extensive cirrus systems and exclude some thin or spatially fragmented cases. This could lead to an underestimation of absolute cirrus cloud cover. Nevertheless, because the same detection and classification framework is applied consistently across all four mountainous regions, the regional contrasts remain useful for comparative analysis. In addition, the analyses of cloud top height, ice water path, and optical depth are based on CloudSat/CALIPSO active observations, which provide more direct information on cloud vertical structure and partly complement the limitations of passive MODIS observations. Another source of uncertainty is related to the IC-CIR classification procedure, which assigns a single cirrus type to each grid cell according to sequential classification logic. In regions where multiple dynamical processes coexist, this may introduce uncertainty in the assigned cirrus type and may lead to an overestimation of orographic cirrus in some mixed-process cases.
The interpretation of cirrus formation mechanisms in this study is mainly based on observed regional and seasonal contrasts in satellite-derived cloud properties, together with previous knowledge of the dynamical environments of the selected mountainous regions. Although these interpretations are physically plausible, a complete attribution of the underlying formation mechanisms would require additional process-oriented diagnostics, such as vertical velocity, atmospheric stability, wind direction relative to terrain, moisture transport, and indicators of convective activity. Future work involving additional process-oriented diagnostic analyses will further quantify the relative roles of mountain-wave lifting, large-scale circulation, and terrain-modulated convection in shaping orographic cirrus properties.

6. Conclusions

This study conducted a comparative analysis of orographic cirrus clouds over four major mountainous regions, including the Rocky Mountains, the Andes, the Alps, and the Himalayas. The results show that orographic cirrus cloud cover remains relatively small over all four mountainous regions, but clear regional differences are observed. The Himalayas and the Alps exhibit relatively higher cloud cover, whereas the Andes show the lowest overall occurrence. Seasonal variability also differs among regions, with stronger seasonal changes over the Himalayas and the Alps and weaker variability over the Andes. The vertical structure of orographic cirrus also varies substantially among the four regions. Orographic cirrus over the Andes reaches higher altitudes than that over the other mountainous regions and exhibits a pronounced bimodal CTH distribution. In contrast, the Rocky Mountains, the Alps, and the Himalayas show more compact CTH distributions, with cloud tops mainly concentrated around 10–12 km. The microphysical and optical properties also show statistically significant regional differences, although these contrasts are generally weaker than those in CTH. For IWP and optical depth, the distributions overlap substantially among regions, suggesting that the detected differences should be interpreted as modest distributional shifts. In contrast, cirrus reflectance shows a clearer regional ordering, with the Rocky Mountains exhibiting the highest median reflectance and the Andes the lowest. Overall, the most robust regional contrast is found in the vertical structure, particularly the higher CTH over the Andes, while the differences in column-integrated ice amount and optical properties indicate more moderate regional variability.
Overall, these findings demonstrate that orographic cirrus clouds exhibit distinct regional characteristics in terms of occurrence, vertical structure, and microphysical and optical properties. The results provide observational evidence for understanding the regional variability of orographic cirrus over complex terrain and offer a basis for future studies on their formation mechanisms and radiative effects.

Author Contributions

Conceptualization, X.H.; methodology, X.H., T.D. and L.W.; data curation, X.H., Y.Z. and J.D.; formal analysis, X.H., C.W. and Z.H.; visualization, X.H. and T.D.; Writing—original draft preparation, X.H.; writing—review and editing, L.W., Y.Z. and J.D. All authors have read and agreed to the published version of the manuscript.

Funding

This research was supported by the National Key R&D Program of China under grant number 2025YFE0118205, the National Natural Science Foundation of China under grant number 42405075, the Natural Science Foundation of Chongqing under grant number CSTB2024NSCQ-MSX0612, and the Heavy Rain and Drought-Flood Disasters in Plateau and Basin Key Laboratory of Sichuan Province under grant number SCQXKJQN202416.

Data Availability Statement

The IC-CIR cirrus classification dataset is available from the Centre for Environmental Data Analysis (https://doi.org/10.5285/cddfe3093be247d7bac56c9fa9edb3d5). The GTOPO30 global digital elevation dataset is available from the U.S. Geological Survey (https://www.usgs.gov/). The MODIS Level-3 atmospheric product MYD08_D3 is available from the NASA Earthdata portal (https://www.earthdata.nasa.gov/). The CloudSat/CALIPSO products 2B-CLDCLASS-LIDAR and 2C-ICE are available from the NASA Atmospheric Science Data Center (https://www.earthdata.nasa.gov/centers/asdc-daac/, accessed on 1 March 2026). The original data presented in the study are openly available in Zenodo at https://doi.org/10.5281/zenodo.20077285.

Acknowledgments

We gratefully acknowledge the publicly available IC-CIR classification system, which formed the basis for identifying and analyzing orographic cirrus clouds in this work. We also acknowledge the U.S. Geological Survey for providing the GTOPO30 global digital elevation dataset. We thank the MODIS Atmosphere Science Team and the CloudSat and CALIPSO science teams for providing the high-quality satellite observations used in this work. We thank the editor and the anonymous reviewers for their helpful comments and suggestions. During the preparation of this manuscript, the authors used ChatGPT-5.3 for language polishing. The authors have reviewed and edited the output and take full responsibility for the content of this publication.

Conflicts of Interest

Author Zihang Han was employed by the company Hubei Key Laboratory of Intelligent Yangtze and Hydroelectric Science, China Yangtze Power Co., Ltd. The remaining authors declare that the research was conducted in the absence of any commercial or financial relationships that could be construed as a potential conflict of interest.

References

  1. Chen, A.; Zhao, C.; Zhang, H.; Yang, Y.; Li, J.; Yu, Y.; Zhang, Q.; Li, J. Weakened snow and ice melting by enhanced cloud short-wave cooling effect in the Arctic. Natl. Sci. Rev. 2025, 12, nwaf116. [Google Scholar] [CrossRef]
  2. Gasparini, B.; Sullivan, S.C.; Sokol, A.B.; Kärcher, B.; Jensen, E.; Hartmann, D.L. Opinion: Tropical cirrus—From micro-scale processes to climate-scale impacts. Atmos. Chem. Phys. 2023, 23, 15413–15444. [Google Scholar] [CrossRef]
  3. Fu, Q.; Carlin, B.; Mace, G. Cirrus horizontal inhomogeneity and OLR bias. Geophys. Res. Lett. 2000, 27, 3341–3344. [Google Scholar] [CrossRef]
  4. Sweeney, A.; Fu, Q. Interannual Variability of Zonal Mean Temperature, Water Vapor, and Clouds in the Tropical Tropopause Layer. J. Geophys. Res. Atmos. 2024, 129, e2023JD039002. [Google Scholar] [CrossRef]
  5. Li, J.L.F.; Xu, K.M.; Jiang, J.H.; Lee, W.L.; Wang, L.C.; Yu, J.Y.; Stephens, G.; Fetzer, E.; Wang, Y.H. An Overview of CMIP5 and CMIP6 Simulated Cloud Ice, Radiation Fields, Surface Wind Stress, Sea Surface Temperatures, and Precipitation Over Tropical and Subtropical Oceans. J. Geophys. Res. Atmos. 2020, 125, e2020JD032848. [Google Scholar] [CrossRef]
  6. Cesana, G.V.; Khadir, T.; Chepfer, H.; Chiriaco, M. Southern Ocean Solar Reflection Biases in CMIP6 Models Linked to Cloud Phase and Vertical Structure Representations. Geophys. Res. Lett. 2022, 49, e2022GL099777. [Google Scholar] [CrossRef]
  7. Vignesh, P.P.; Jiang, J.H.; Kishore, P.; Su, H.; Smay, T.; Brighton, N.; Velicogna, I. Assessment of CMIP6 Cloud Fraction and Comparison with Satellite Observations. Earth Space Sci. 2020, 7, e2019EA000975. [Google Scholar] [CrossRef]
  8. Nakanishi, M.; Michibata, T. How Does Cloud Emissivity Feedback Affect Present and Future Arctic Warming? Ocean-Land-Atmos. Res. 2025, 4, 0089. [Google Scholar] [CrossRef]
  9. Waliser, D.E.; Li, J.L.F.; Woods, C.P.; Austin, R.T.; Bacmeister, J.; Chern, J.; Del Genio, A.; Jiang, J.H.; Kuang, Z.; Meng, H.; et al. Cloud ice: A climate model challenge with signs and expectations of progress. J. Geophys. Res. Atmos. 2009, 114, D00A21. [Google Scholar] [CrossRef]
  10. Li, J.L.F.; Waliser, D.E.; Stephens, G.; Lee, S. Characterizing and Understanding Cloud Ice and Radiation Budget Biases in Global Climate Models and Reanalysis. Meteorol. Monogr. 2016, 56, 13.11–13.20. [Google Scholar] [CrossRef]
  11. Ge, J.; Li, W.; Huang, J.; Mu, Q.; Li, Q.; Zhao, Q.; Su, J.; Xie, Y.; Alam, K.; Zhu, Z.; et al. Dust Accelerates the Life Cycle of High Clouds Unveiled Through Strongly-Constrained Meteorology. Geophys. Res. Lett. 2024, 51, e2024GL109998. [Google Scholar] [CrossRef]
  12. Moradikian, S.; Moghim, S.; Hoshyaripour, G.A. Identifying and Characterizing Dust-Induced Cirrus Clouds by Synergic Use of Satellite Data. Remote Sens. 2025, 17, 3176. [Google Scholar] [CrossRef]
  13. Wang, Z. Anvil–radiation diurnal interaction: Shortwave radiative-heating destabilization driving the diurnal variation of convective anvil outflow and its modulation on the radiative cancellation. Atmos. Chem. Phys. 2025, 25, 5021–5039. [Google Scholar] [CrossRef]
  14. Krämer, M.; Rolf, C.; Luebke, A.; Afchine, A.; Spelten, N.; Costa, A.; Meyer, J.; Zöger, M.; Smith, J.; Herman, R.L.; et al. A microphysics guide to cirrus clouds—Part 1: Cirrus types. Atmos. Chem. Phys. 2016, 16, 3463–3483. [Google Scholar] [CrossRef]
  15. Nakoudi, K.; Ritter, C.; Stachlewska, I.S. Properties of Cirrus Clouds over the European Arctic (Ny-Ålesund, Svalbard). Remote Sens. 2021, 13, 4555. [Google Scholar] [CrossRef]
  16. Ye, B.-Y.; Lee, G. Vertical Structure of Ice Clouds and Vertical Air Motion from Vertically Pointing Cloud Radar Measurements. Remote Sens. 2021, 13, 4349. [Google Scholar] [CrossRef]
  17. Dowling, D.R.; Radke, L.F. A Summary of the Physical Properties of Cirrus Clouds. J. Appl. Meteorol. 1990, 29, 970–978. [Google Scholar] [CrossRef]
  18. Joos, H.; Spichtinger, P.; Lohmann, U.; Gayet, J.F.; Minikin, A. Orographic cirrus in the global climate model ECHAM5. J. Geophys. Res. Atmos. 2008, 113, D18205. [Google Scholar] [CrossRef]
  19. Nazaryan, H.; McCormick, M.P.; Menzel, W.P. Global characterization of cirrus clouds using CALIPSO data. J. Geophys. Res. 2008, 113, D16211. [Google Scholar] [CrossRef]
  20. Seiki, T.; Kodama, C.; Satoh, M.; Hagihara, Y.; Okamoto, H. Characteristics of Ice Clouds Over Mountain Regions Detected by CALIPSO and CloudSat Satellite Observations. J. Geophys. Res. Atmos. 2019, 124, 10858–10877. [Google Scholar] [CrossRef]
  21. Houze, R.A. Orographic effects on precipitating clouds. Rev. Geophys. 2012, 50, RG1001. [Google Scholar] [CrossRef]
  22. Menzel, W.P.; Wylie, D.P.; Strabala, K.I. Seasonal and Diurnal Changes in Cirrus Clouds as Seen in Four Years of Observations with the VAS. J. Appl. Meteorol. 1992, 31, 370–385. [Google Scholar] [CrossRef]
  23. Sassen, K.; Campbell, J.R. A Midlatitude Cirrus Cloud Climatology from the Facility for Atmospheric Remote Sensing. Part I: Macrophysical and Synoptic Properties. J. Atmos. Sci. 2001, 58, 481–496. [Google Scholar] [CrossRef]
  24. Shige, S.; Kummerow, C.D. Precipitation-Top Heights of Heavy Orographic Rainfall in the Asian Monsoon Region. J. Atmos. Sci. 2016, 73, 3009–3024. [Google Scholar] [CrossRef]
  25. Zhang, F.; Yu, Q.-R.; Mao, J.-L.; Dan, C.; Wang, Y.; He, Q.; Cheng, T.; Chen, C.; Liu, D.; Gao, Y. Possible mechanisms of summer cirrus clouds over the Tibetan Plateau. Atmos. Chem. Phys. 2020, 20, 11799–11808. [Google Scholar] [CrossRef]
  26. Liu, Y.; Chen, W.; Li, X.; Zhang, Z.; Chen, H.; Niu, X.; Hu, Q.; Chen, D. Contrasting Precipitation Variations over the Himalayas–Southeastern Tibetan Plateau in Winter: Insights from the Perspectives of Anthropogenic Warming and Arctic Sea Ice Variations. J. Clim. 2024, 37, 6081–6092. [Google Scholar] [CrossRef]
  27. Gryspeerdt, E.; Quaas, J.; Goren, T.; Klocke, D.; Brueck, M. An automated cirrus classification. Atmos. Chem. Phys. 2018, 18, 6157–6169. [Google Scholar] [CrossRef]
  28. Oreopoulos, L.; Cho, N.; Lee, D. New insights about cloud vertical structure from CloudSat and CALIPSO observations. J. Geophys. Res. Atmos. 2017, 122, 9280–9300. [Google Scholar] [CrossRef]
  29. Haladay, T.; Stephens, G. Characteristics of tropical thin cirrus clouds deduced from joint CloudSat and CALIPSO observations. J. Geophys. Res. 2009, 114, D00H07. [Google Scholar] [CrossRef]
  30. Du, J.; Ge, J.; Huang, J.; Li, Y.; Zhang, C.; Hu, X.; Liu, B.; Li, X.; Qiu, Y.; Zhu, Y. An Advanced Algorithm for Accurate Retrieval of Liquid Water Cloud Properties Using Spaceborne Radar. IEEE Trans. Geosci. Remote Sens. 2025, 63, 4114309. [Google Scholar] [CrossRef]
  31. Li, Y.; Ge, J.; Hu, Y.; Xu, Z.; Du, J.; Mu, Q. Global Low Clouds Evolution and Their Meteorological Drivers Across Multiple Timescales. Remote Sens. 2025, 17, 4045. [Google Scholar] [CrossRef]
  32. Zhang, H.; Zhang, Y.; Li, Z.; Zheng, Y. Aerosol Influences on Cloud Water: Insights from ARM EPCAPE Observations with Explainable Machine Learning. Geophys. Res. Lett. 2025, 52, e2025GL115163. [Google Scholar] [CrossRef]
  33. Earth Resources Observation and Science Center. USGS 30 ARC-second Global Elevation Data, GTOPO30; U.S. Geological Survey: Reston, VA, USA, 1997. [CrossRef]
  34. Platnick, S.; King, M.D.; Ackerman, S.A.; Menzel, W.P.; Baum, B.A.; Riedi, J.C.; Frey, R.A. The MODIS cloud products: Algorithms and examples from terra. IEEE Trans. Geosci. Remote Sens. 2003, 41, 459–473. [Google Scholar] [CrossRef]
  35. MODIS Atmosphere Science Team. MYD08_D3 MODIS/Aqua Aerosol Cloud Water Vapor Ozone Daily L3 Global 1Deg CMG; NASA: Greenbelt, MD, USA, 2017. [CrossRef]
  36. Stephens, G.; Winker, D.; Pelon, J.; Trepte, C.; Vane, D.; Yuhas, C.; L’Ecuyer, T.; Lebsock, M. CloudSat and CALIPSO within the A-Train: Ten Years of Actively Observing the Earth System. Bull. Am. Meteorol. Soc. 2018, 99, 569–581. [Google Scholar] [CrossRef]
  37. Mu, Q.; Ge, J.; Huang, J.; Hu, X.; Peng, N.; Li, Y.; Wang, M.; Zhang, J.; Xu, Z.; Zhang, C.; et al. A New Classification of In Situ and Anvil Cirrus Clouds Uncovers Their Properties and Interhemispheric Connections. AGU Adv. 2025, 6, e2025AV001919. [Google Scholar] [CrossRef]
  38. Sassen, K.; Wang, Z.; Liu, D. Global distribution of cirrus clouds from CloudSat/Cloud-Aerosol Lidar and Infrared Pathfinder Satellite Observations (CALIPSO) measurements. J. Geophys. Res. 2008, 113, D00A12. [Google Scholar] [CrossRef]
  39. Deng, M.; Mace, G.G.; Wang, Z.; Berry, E. CloudSat 2C-ICE product update with a new Ze parameterization in lidar-only region. J. Geophys. Res. Atmos. 2015, 120, 023600. [Google Scholar] [CrossRef]
  40. Tselioudis, G.; Rossow, W.; Zhang, Y.; Konsta, D. Global Weather States and Their Properties from Passive and Active Satellite Cloud Retrievals. J. Clim. 2013, 26, 7734–7746. [Google Scholar] [CrossRef]
  41. Hindley, N.P.; Wright, C.J.; Smith, N.D.; Hoffmann, L.; Holt, L.A.; Alexander, M.J.; Moffat-Griffin, T.; Mitchell, N.J. Gravity waves in the winter stratosphere over the Southern Ocean: High-resolution satellite observations and 3-D spectral analysis. Atmos. Chem. Phys. 2019, 19, 15377–15414. [Google Scholar] [CrossRef]
  42. Van Tricht, K.; Lhermitte, S.; Lenaerts, J.T.M.; Gorodetskaya, I.V.; L’Ecuyer, T.S.; Noël, B.; van den Broeke, M.R.; Turner, D.D.; van Lipzig, N.P.M. Clouds enhance Greenland ice sheet meltwater runoff. Nat. Commun. 2016, 7, 10266. [Google Scholar] [CrossRef] [PubMed]
  43. Riuttanen, L.; Bister, M.; Kerminen, V.-M.; John, V.O.; Sundström, A.-M.; Dal Maso, M.; Räisänen, J.; Sinclair, V.A.; Makkonen, R.; Xausa, F.; et al. Observational evidence for aerosols increasing upper tropospheric humidity. Atmos. Chem. Phys. 2016, 16, 14331–14342. [Google Scholar] [CrossRef]
  44. Nguyen Huu, Ż.; Kotarba, A.Z.; Wypych, A. Evaluation of the operational MODIS cloud mask product for detecting cirrus clouds. Atmos. Meas. Tech. 2025, 18, 3897–3915. [Google Scholar] [CrossRef]
  45. Hu, X.; Ge, J.; Li, W.; Du, J.; Li, Q.; Mu, Q. Vertical Structure of Tropical Deep Convective Systems at Different Life Stages from CloudSat Observations. J. Geophys. Res. Atmos. 2021, 126, e2021JD035115. [Google Scholar] [CrossRef]
  46. Hu, X.; Zhang, L.; Ge, J.; Wang, L.; Huang, X.; Du, J.; Mu, Q.; Liu, B.; Wang, H. Characteristics of Cirrus Clouds from Different Formation Mechanisms. J. Remote Sens. 2025, 5, 0666. [Google Scholar] [CrossRef]
  47. Dolaptchiev, S.I.; Spichtinger, P.; Baumgartner, M.; Achatz, U. Interactions between Gravity Waves and Cirrus Clouds: Asymptotic Modeling of Wave-Induced Ice Nucleation. J. Atmos. Sci. 2023, 80, 2861–2879. [Google Scholar] [CrossRef]
  48. Lyu, K.; Liu, X.; Bacmeister, J.; Zhao, X.; Lin, L.; Shi, Y.; Sourdeval, O. Orographic Cirrus and Its Radiative Forcing in NCAR CAM6. J. Geophys. Res. Atmos. 2023, 128, e2022JD038164. [Google Scholar] [CrossRef]
  49. Boos, W.R.; Kuang, Z. Dominant control of the South Asian monsoon by orographic insulation versus plateau heating. Nature 2010, 463, 218–222. [Google Scholar] [CrossRef] [PubMed]
  50. Chen, B.; Liu, X. Seasonal migration of cirrus clouds over the Asian Monsoon regions and the Tibetan Plateau measured from MODIS/Terra. Geophys. Res. Lett. 2005, 32, L06804. [Google Scholar] [CrossRef]
  51. Yang, X.; Ge, J.; Hu, X.; Wang, M.; Han, Z. Cloud-Top Height Comparison from Multi-Satellite Sensors and Ground-Based Cloud Radar over SACOL Site. Remote Sens. 2021, 13, 2715. [Google Scholar] [CrossRef]
  52. Kärcher, B.; Ström, J. The roles of dynamical variability and aerosols in cirrus cloud formation. Atmos. Chem. Phys. 2003, 3, 823–838. [Google Scholar] [CrossRef]
  53. Fu, Q.; Liou, K.N. Parameterization of the Radiative Properties of Cirrus Clouds. J. Atmos. Sci. 1993, 50, 2008–2025. [Google Scholar] [CrossRef]
  54. Wang, M.; Su, J.; Peng, N.; Xu, Y.; Ge, J. Diurnal cycle of cirrus cloud and its associated radiative effects at the SACOL site. Atmos. Res. 2022, 265, 105887. [Google Scholar] [CrossRef]
  55. Chandrakar, K.K.; Morrison, H.; Harrington, J.Y.; Pokrifka, G.; Magee, N. What Controls Crystal Diversity and Microphysical Variability in Cirrus Clouds? Geophys. Res. Lett. 2024, 51, e2024GL108493. [Google Scholar] [CrossRef]
  56. Zhao, F.; Tang, C.; Dai, C.; Wu, X.; Wei, H. The Global Distribution of Cirrus Clouds Reflectance Based on MODIS Level-3 Data. Atmosphere 2020, 11, 219. [Google Scholar] [CrossRef]
Figure 1. (a) Elevation derived from the GTOPO30 dataset. (b) Slope derived from elevation data. The four boxes indicate the major mountainous regions investigated in this study.
Remotesensing 18 01701 g001
Figure 2. Example illustrating the identification and classification of cirrus cloud systems on 29 March 2007. (a) Cirrus dynamical regimes from the IC-CIR classification system, which distinguishes 11 cirrus categories. (b) Cirrus types aggregated into five primary categories: orographic, frontal, convective, jet-related, and synoptic cirrus. (c) Cirrus fraction derived from the MODIS MYD08_D3 product. (d) Cirrus cloud systems identified from MODIS cirrus fraction using connected component analysis. The light background indicates the original MODIS cirrus fraction, and the colored patches denote individual connected cirrus cloud systems. Different colors are used only to distinguish separate systems and do not represent different cloud types. (e) Cirrus cloud systems classified according to their dominant formation mechanisms. Black boxes denote the selected mountainous regions. (f) Orographic cirrus clouds detected over the four mountainous regions, with purple lines indicating the orbital tracks of the CloudSat and CALIPSO satellites on the same day. Only the A-Train tracks that pass over these mountainous regions and detect orographic cirrus clouds are shown.
Remotesensing 18 01701 g002
Figure 3. Mean orographic cirrus cloud cover over the four mountainous regions.
Remotesensing 18 01701 g003
Figure 4. Seasonal mean orographic cirrus cloud cover over the four mountainous regions. Seasons are defined as DJF (December–February), MAM (March–May), JJA (June–August), and SON (September–November).
Remotesensing 18 01701 g004
Figure 5. Distribution of cloud-top height (CTH) of orographic cirrus over the four mountainous regions. Panels (ad) show the frequency distributions of CTH, with dashed red lines indicating the mean values. Panels (eh) present seasonal boxplots of CTH for DJF (December–February), MAM (March–May), JJA (June–August), and SON (September–November).
Remotesensing 18 01701 g005
Figure 6. Distribution of ice water path (IWP) of orographic cirrus clouds over the four mountainous regions. Panels (ad) show the probability density distributions of IWP for the Rocky Mountains, Andes, Alps, and Himalayas, respectively. Panels (eh) present the seasonal probability density distributions of IWP for the same regions, with different colors indicating DJF (December–February), MAM (March–May), JJA (June–August), and SON (September–November).
Remotesensing 18 01701 g006
Figure 7. Distribution of cirrus optical depth (τ) of orographic cirrus clouds over the four mountainous regions. Panels (ad) show the probability density distributions of optical depth for the Rocky Mountains, Andes, Alps, and Himalayas, respectively. Panels (eh) present the seasonal probability density distributions of optical depth for the same regions, with different colors indicating DJF (December–February), MAM (March–May), JJA (June–August), and SON (September–November).
Remotesensing 18 01701 g007
Figure 8. Distribution of cirrus reflectance of orographic cirrus clouds over the four mountainous regions. Panels (ad) show the frequency distributions of cirrus reflectance for the Rocky Mountains, Andes, Alps, and Himalayas, respectively. Panels (eh) present the seasonal variations in cirrus reflectance for the same regions using boxplots, with DJF (December–February), MAM (March–May), JJA (June–August), and SON (September–November) shown separately.
Remotesensing 18 01701 g008
Disclaimer/Publisher’s Note: The statements, opinions and data contained in all publications are solely those of the individual author(s) and contributor(s) and not of MDPI and/or the editor(s). MDPI and/or the editor(s) disclaim responsibility for any injury to people or property resulting from any ideas, methods, instructions or products referred to in the content.