Article

LiDAR-Guided Semantic 3D Gaussian Splatting for Forest Digital Twins

1
College of Natural Resources and Environment, South China Agricultural University, Guangzhou 510642, China
2
College of Mathematics and Informatics, South China Agricultural University, Guangzhou 510642, China
3
College of Engineering, South China Agricultural University, Guangzhou 510642, China
*
Author to whom correspondence should be addressed.
Remote Sens. 2026, 18(11), 1696; https://doi.org/10.3390/rs18111696
Submission received: 8 April 2026 / Revised: 20 May 2026 / Accepted: 22 May 2026 / Published: 24 May 2026

Highlights

What are the main findings?
  • This study proposes a semantically constrained 3D Gaussian Splatting framework that fuses handheld laser point clouds and unmanned aerial vehicle (UAV) images, taking into account the structural accuracy and visual realism of forest reconstruction.
  • An adaptive optimization strategy based on geometric anchor points is proposed, which balances canopy texture preservation and trunk expansion artifact suppression through trunk structure constraints.
What are the implications of the main findings?
  • This framework can automatically extract forestry parameters like diameter at breast height from the reconstructed forest digital twins without physical contact. It complements and supports forest inventory and carbon sink estimation tasks.
  • Semantically guided physical constraints can alleviate the limits of purely visual rendering methods in complex understory environments. This provides technical support for building forest digital twins that have both accurate measurability and great visual effects.

Abstract

Forest digital twins play a crucial role in modern precision forestry by supporting biomass estimation and carbon cycle monitoring. However, existing 3D reconstruction methods struggle to simultaneously achieve metric-level structural accuracy and visual realism in complex understory environments. This study proposes a semantically constrained 3D Gaussian Splatting framework that fuses handheld LiDAR point clouds with unmanned aerial vehicle imagery. First, a multi-modal fusion mechanism is constructed to extract geometric anchors from registered LiDAR data for precise 3DGS spatial initialization, which mitigates rendering artifacts and geometric drift caused by poor initialization in purely visual methods. Second, a semantic regularization optimization strategy is proposed to realize differentiated modeling of tree trunks and canopies, effectively balancing the structural accuracy of rigid trunks and the photorealistic rendering of non-rigid canopies. Experiments conducted on three study plots demonstrate that the proposed approach achieves an average PSNR of 24.94 dB, SSIM of 0.773, and LPIPS of 0.231 across all plots, outperforming standard NeRF and baseline 3DGS, while enabling DBH estimation with R2 = 0.848 and RMSE = 2.705 cm. This method provides a solution for high-fidelity forest digital twin construction in open-canopy forest environments such as urban and campus forests.

1. Introduction

Forests play a critical role as the global community accelerates efforts to address climate change and achieve carbon neutrality. As the largest terrestrial carbon sinks, they play an important role in regulating the global carbon cycle and maintaining ecological balance [1,2]. However, anthropogenic habitat loss and fragmentation from deforestation and land-use change continue to alter ecosystem structure and ecological interactions [3], further underscoring the urgency for accurate and scalable forest monitoring tools. Against this backdrop, modern forest digital twins have progressively transitioned from theoretical concepts into vital practical tools supporting tasks such as forest inventory and carbon sink measurement [4,5,6]. This field is undergoing a transformation, evolving from traditional coarse visualization to novel representation models that combine structural accuracy and visual realism [7,8]. For modern precision forestry, structural accuracy and visual realism are no longer competing, isolated optimization goals, but two indispensable core requirements. Extracting tree structural indicators requires centimeter-level geometric precision from the model [9,10,11,12], while ecological management work, such as species classification and phenology monitoring, fundamentally relies on authentic visual and texture information. To this end, cost-effective drone-based monitoring toolkits have been rapidly adopted across diverse ecological assessment scenarios, including stream habitat health evaluation [13], as these platforms enable high-frequency, spatially explicit data acquisition without requiring extensive field crews. Therefore, a technical framework that cannot balance these two core dimensions at the same time cannot serve as a comprehensive tool to support the next generation of forest resource inventory [14,15].
Current 3D tree reconstruction technologies primarily follow three main routes. The first is passive optical vision, which mainly utilizes Structure-from-Motion (SfM) and Multi-View Stereo (MVS) algorithms [16,17]. This approach is highly versatile and can be deployed across various platforms: ground-based photogrammetry (e.g., handheld cameras or tripod-mounted rigs) is suitable for detailed individual tree scanning, while UAV-based photogrammetry excels in capturing canopy textures at the stand or plot scale [18]. Although UAV-based photogrammetry excels in capturing canopy textures, these methods struggle with complex undercanopy imaging environments. The intricate lighting conditions and bark textures in forests often lead to feature matching failures, thereby causing geometric drift and structural incompleteness in trunk reconstruction [19,20,21]. In recent years, the emergence of Neural Radiance Fields (NeRF) [22] and 3D Gaussian Splatting (3DGS) [23] has revolutionized the field of scene reconstruction by providing continuous volumetric representations and real-time rendering capabilities, achieving groundbreaking progress in complex natural scenes [24,25,26,27]. But standard 3DGS is essentially an explicit radiance field optimization method driven by photometric loss [28]. In understory forest environments, the 3DGS algorithm without support from explicit geometric constraints may fail to tell the true shape of objects apart from light and brightness during the optimization process, which leads to reconstruction deviations. To keep rendered images from multiple views consistent in color and brightness, the algorithm incorrectly generates floating artifacts and also causes bulging and volume expansion in reconstructed tree trunks [29]. Therefore, to ensure the reconstructed model has both realistic visual effects and accuracy fit for practical measurement, this problem of geometric structure deformation must be addressed. In the absence of strong geometric constraints, it tends to generate translucent artifacts inside the tree canopy [30]. Consequently, it fails to meet the metric-level requirements for extracting forestry parameters like diameter at breast height(DBH) [31,32]. In contrast, active laser scanning, particularly Terrestrial Laser Scanning (TLS) and Mobile Laser Scanning (MLS), effectively compensates for the weakness of passive optical vision in trunk geometric reconstruction, owing to its core advantage of directly acquiring 3D spatial coordinates [33]. UAV-borne LiDAR enables large-scale forest surveys with comprehensive canopy coverage from an aerial perspective. Handheld LiDAR instruments equipped with Simultaneous Localization and Mapping (SLAM) technology have now become the standard for acquiring metric-level point clouds of the forest understory [34]. Yet, this technical route also has its flaws [35]. On the one hand, LiDAR data can only provide pure geometric spatial information, lacking the texture features required for species identification and health monitoring. On the other hand, ground based scanning is limited by a bottom-up observation perspective, causing the upper canopy and treetops, which is crucial for tree height measurement, to often become sparse or even completely missing due to occlusion [36].
The third route involves purely geometric algorithmic modeling, such as Quantitative Structure Models (QSMs) represented by AdTree [37] or TreeQSM [38]. These methods attempt to fit cylinders to point clouds to extract tree skeletons. Although it has high efficiency in parametric calculation, it is highly dependent on prior assumptions [39]. Such excessive geometric abstraction discards the true morphological characteristics of individual trees, degrades them into parameterized skeletal diagrams and loses the visual and structural accuracy essential for digital twins. Therefore, the critical challenge that current research urgently needs to resolve is: how to break through the cross-modal barrier between pure vision and pure LiDAR, and construct a unified framework that balances structural accuracy with visual realism in open forest environments such as urban and campus settings, where understory structure is relatively simple, without relying on highly abstract priors like QSM.
In terms of physical properties, a tree consists of rigid trunks and branches and non-rigid leaves [40]. Traditional fusion strategies, such as simply coloring LiDAR point clouds with images, cannot effectively address this issue. They typically apply a uniform global optimization strategy to the entire scene, thereby falling into a dilemma: either sacrificing the surface structural accuracy of the trunk in exchange for the photometric rendering performance of the canopy, or making the canopy appear noisy and stiff to satisfy strict geometric constraints. Furthermore, existing forestry 3DGS frameworks fail to fully exploit the potential of LiDAR point clouds, still relying on sparse SfM point clouds for scale initialization. This prevents the geometric precision of modern SLAM LiDAR from being effectively translated into prior knowledge for the radiance field, forcing the model to consume iterations blindly estimating already known geometric topologies [41].
To address this issue, this study proposes a 3D forest stand reconstruction framework dubbed Semantically Constrained 3D Gaussian Splatting. This framework achieves multi-modal fusion of LiDAR point clouds and UAV multiview imagery through a physical and semantic decoupling mechanism. Unlike previous loosely coupled strategies, our method utilizes LiDAR point clouds as geometric skeletal anchors for the scene, leveraging optical imagery to supplement texture details, and explicitly introduces semantic constraints into the optimization process of 3DGS.
This research goes beyond the basic visualization typical of traditional forest reconstruction and provides a new approach for generating 3D forest digital assets. The core contributions of this paper are summarized as follows:
(1)
A multi-modal fusion mechanism combining active laser scanning and passive optical imaging is constructed. Through a coarse-to-fine spatial registration pipeline for terrestrial LiDAR point clouds and UAV SfM point clouds, geometric anchors are extracted to provide geometric scale and photometric priors for 3D Gaussian Splatting (3DGS) initialization. This mechanism not only accelerates the convergence of the radiance field model but also mitigates artifacts and geometric drift caused by poor initialization in 3DGS methods.
(2)
A semantic regularization optimization strategy is proposed. Aiming at the structural heterogeneity of forest scenes, an unsupervised wood-leaf semantic segmentation pipeline is developed to distinguish trunks and canopies, with a trunk-specific objective function designed accordingly. Strict geometric constraints are applied to trunk primitives to mitigate volumetric inflation and topological distortion. This strategy achieves a better balance between structural accuracy and visual realism in forest 3D reconstruction.
(3)
The application potential of 3DGS in precision forestry parameter extraction is validated. Experiments show that the proposed framework not only achieves favorable novel view synthesis quality but also enables the extraction of DBH values from digital twins. This provides robust support for the practical application of 3DGS technology in the field of forest digital twins.

2. Materials

2.1. Research Sites

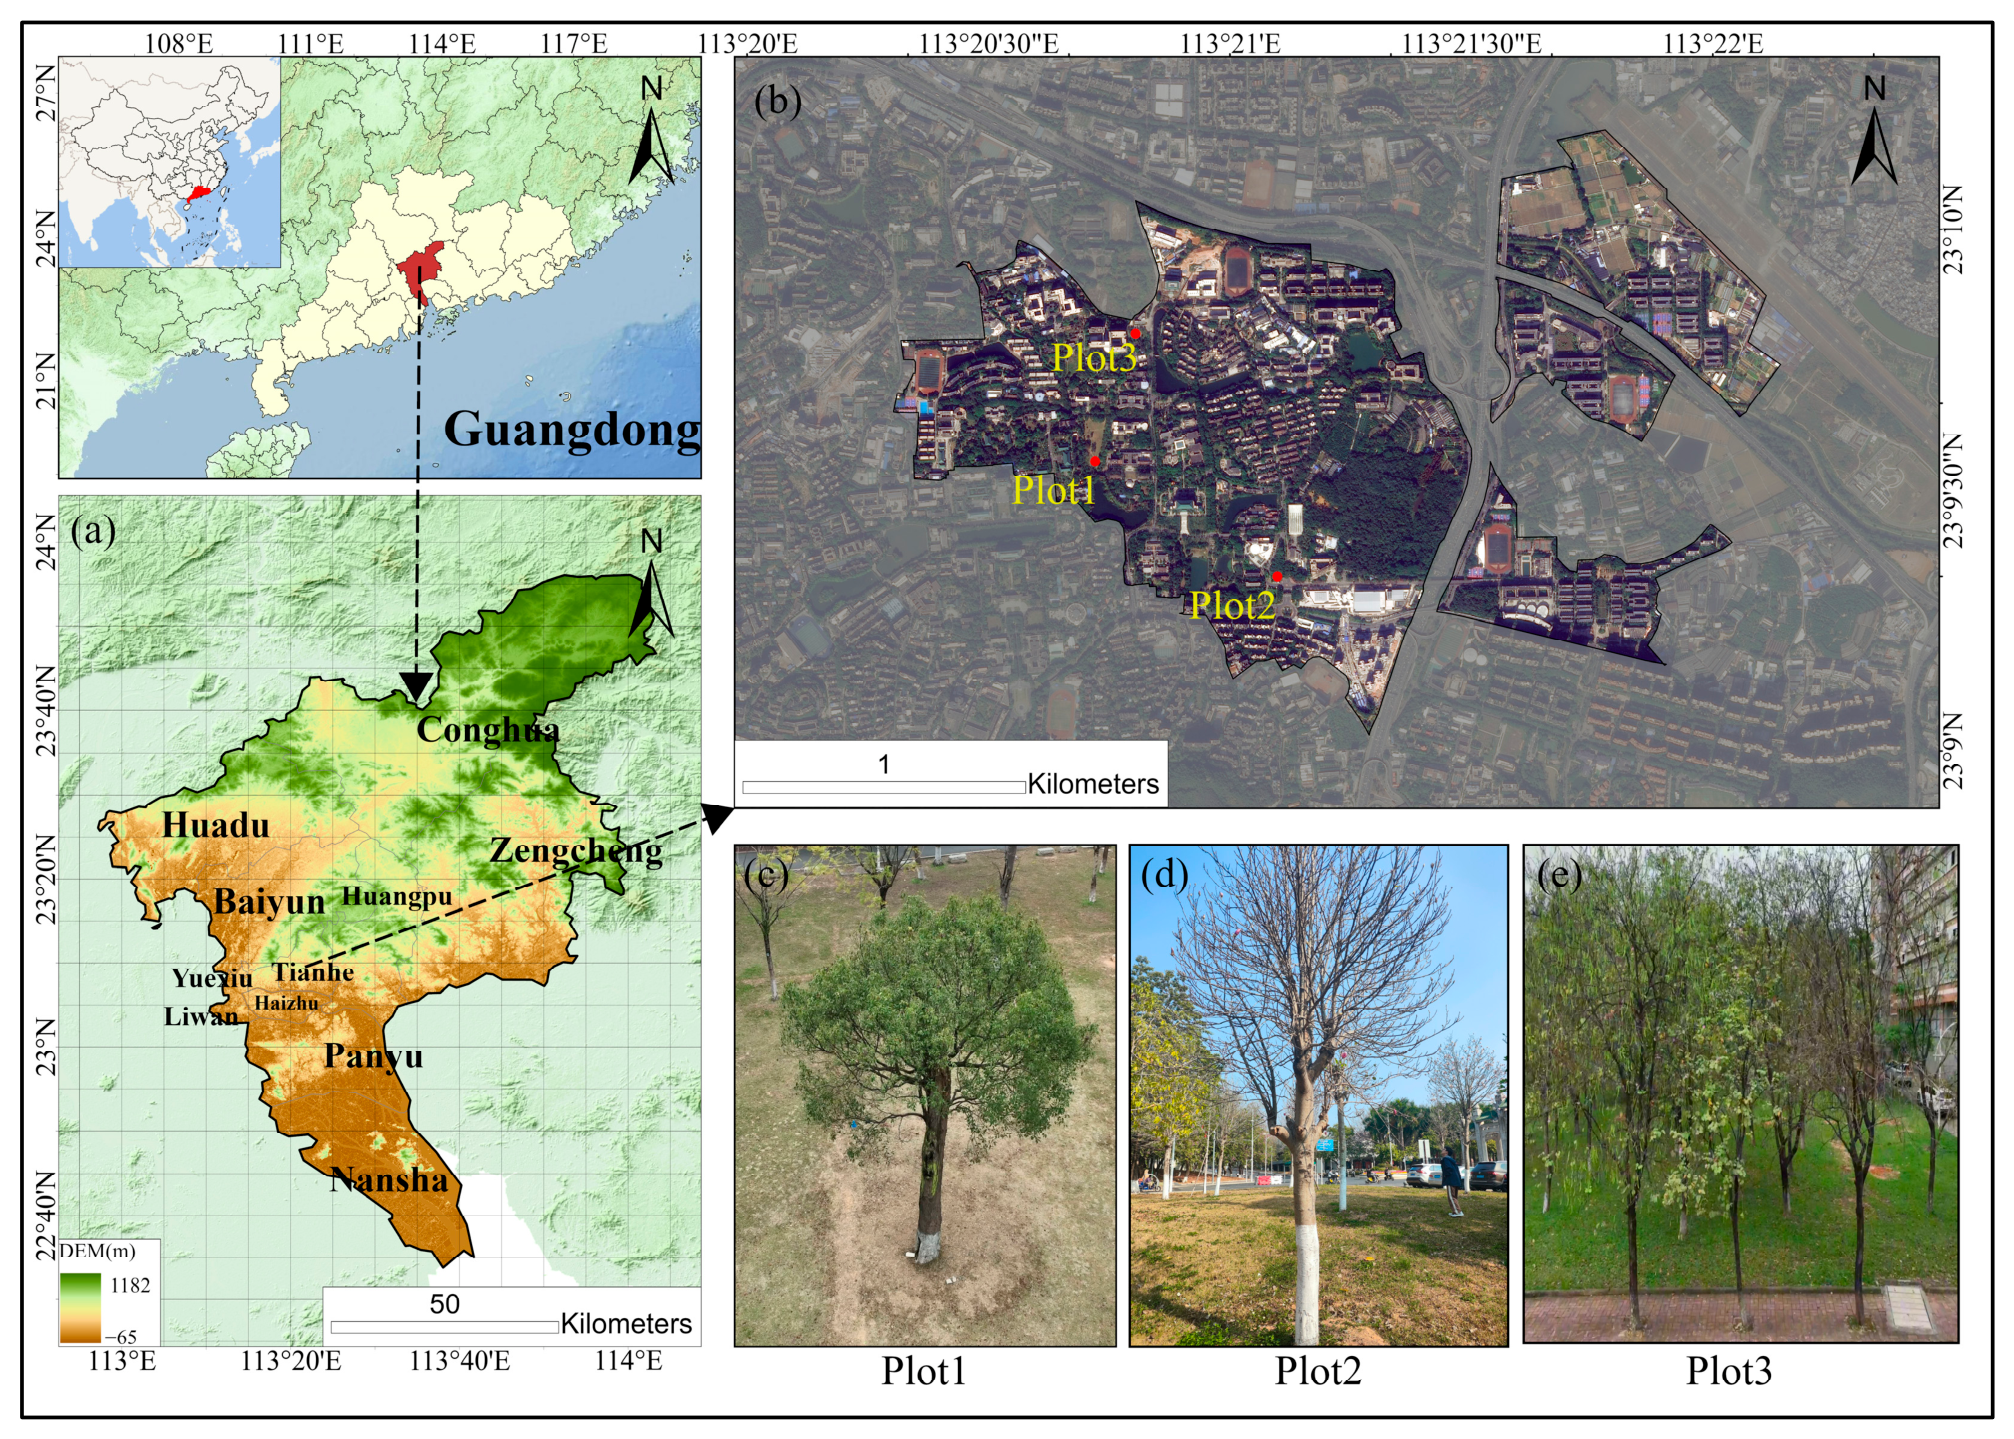
We selected three representative plots within the campus of South China Agricultural University in Guangzhou, China, as our research sites. First, the controlled environment allows precise acquisition condition management (wind speed < 2 m/s, consistent illumination), which is essential for establishing a reliable baseline. Second, urban and campus forests represent the most immediate application scenario for low-cost digital twins. Plot 1 is located in a relatively flat and open area featuring a single Camphor tree (Cinnamomum camphora), a typical evergreen broad-leaved species. Plot 2 also represents an isolated tree scenario, but contains a Yulan Magnolia (Magnolia denudata) with almost no leaves. Unlike the evergreen canopy of the Camphor, this Magnolia exhibits a distinct branching topology with a more complex skeletal structure. Plot 3 is an irregular forest stand consisting of 17 Bauhinia trees (Bauhinia variegata) with dense canopies and an overall moderate stand-level canopy closure of approximately 0.5. Figure 1 illustrates the geographical location, morphology, and spatial layout of these three areas. These diverse plots were selected to validate the robustness and reconstruction accuracy of our proposed multimodal fusion and semantically constrained algorithms when facing challenges such as varying scales, different topological features, and geometric occlusions.
It should be noted that all plots are located within the same campus, and the current validation scope is limited to open-canopy urban forests. Further systematic validation across diverse forest biomes—including tropical, subtropical, and boreal forests—remains a key direction for future work.
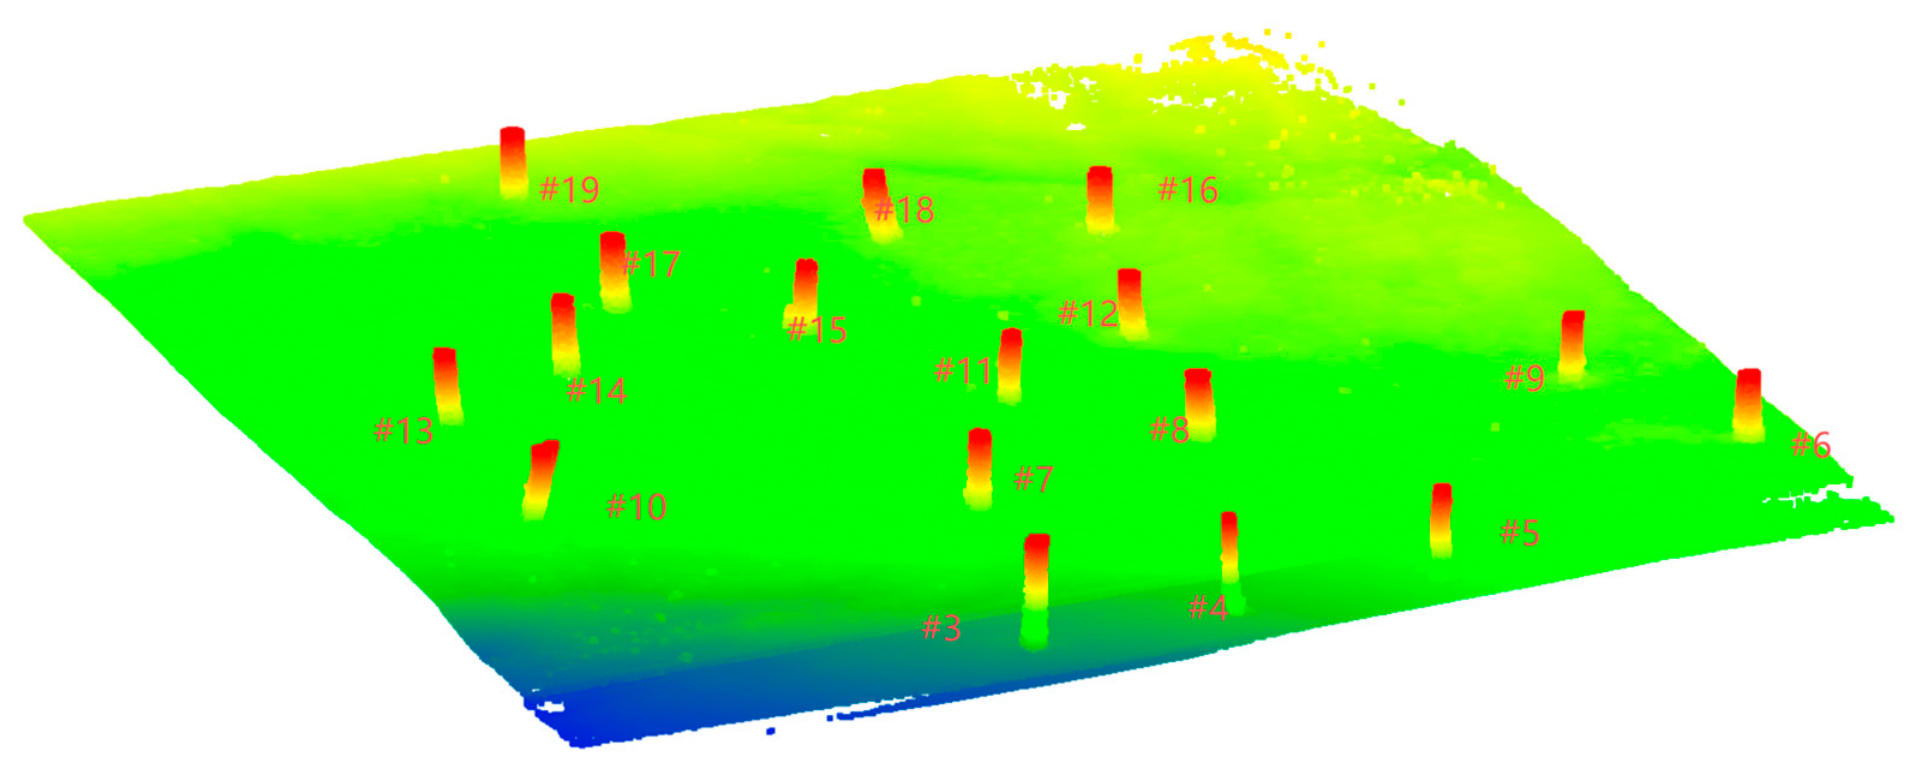
The trunk-only LiDAR point clouds of Plot 3 after wood-leaf semantic separation are illustrated in Figure 2.

2.2. Data Acquisition

This study employs a multimodal data acquisition approach combining handheld LiDAR scanning with UAV-based photogrammetry. The technical specifications and parameters of all key hardware devices are detailed in Table 1.
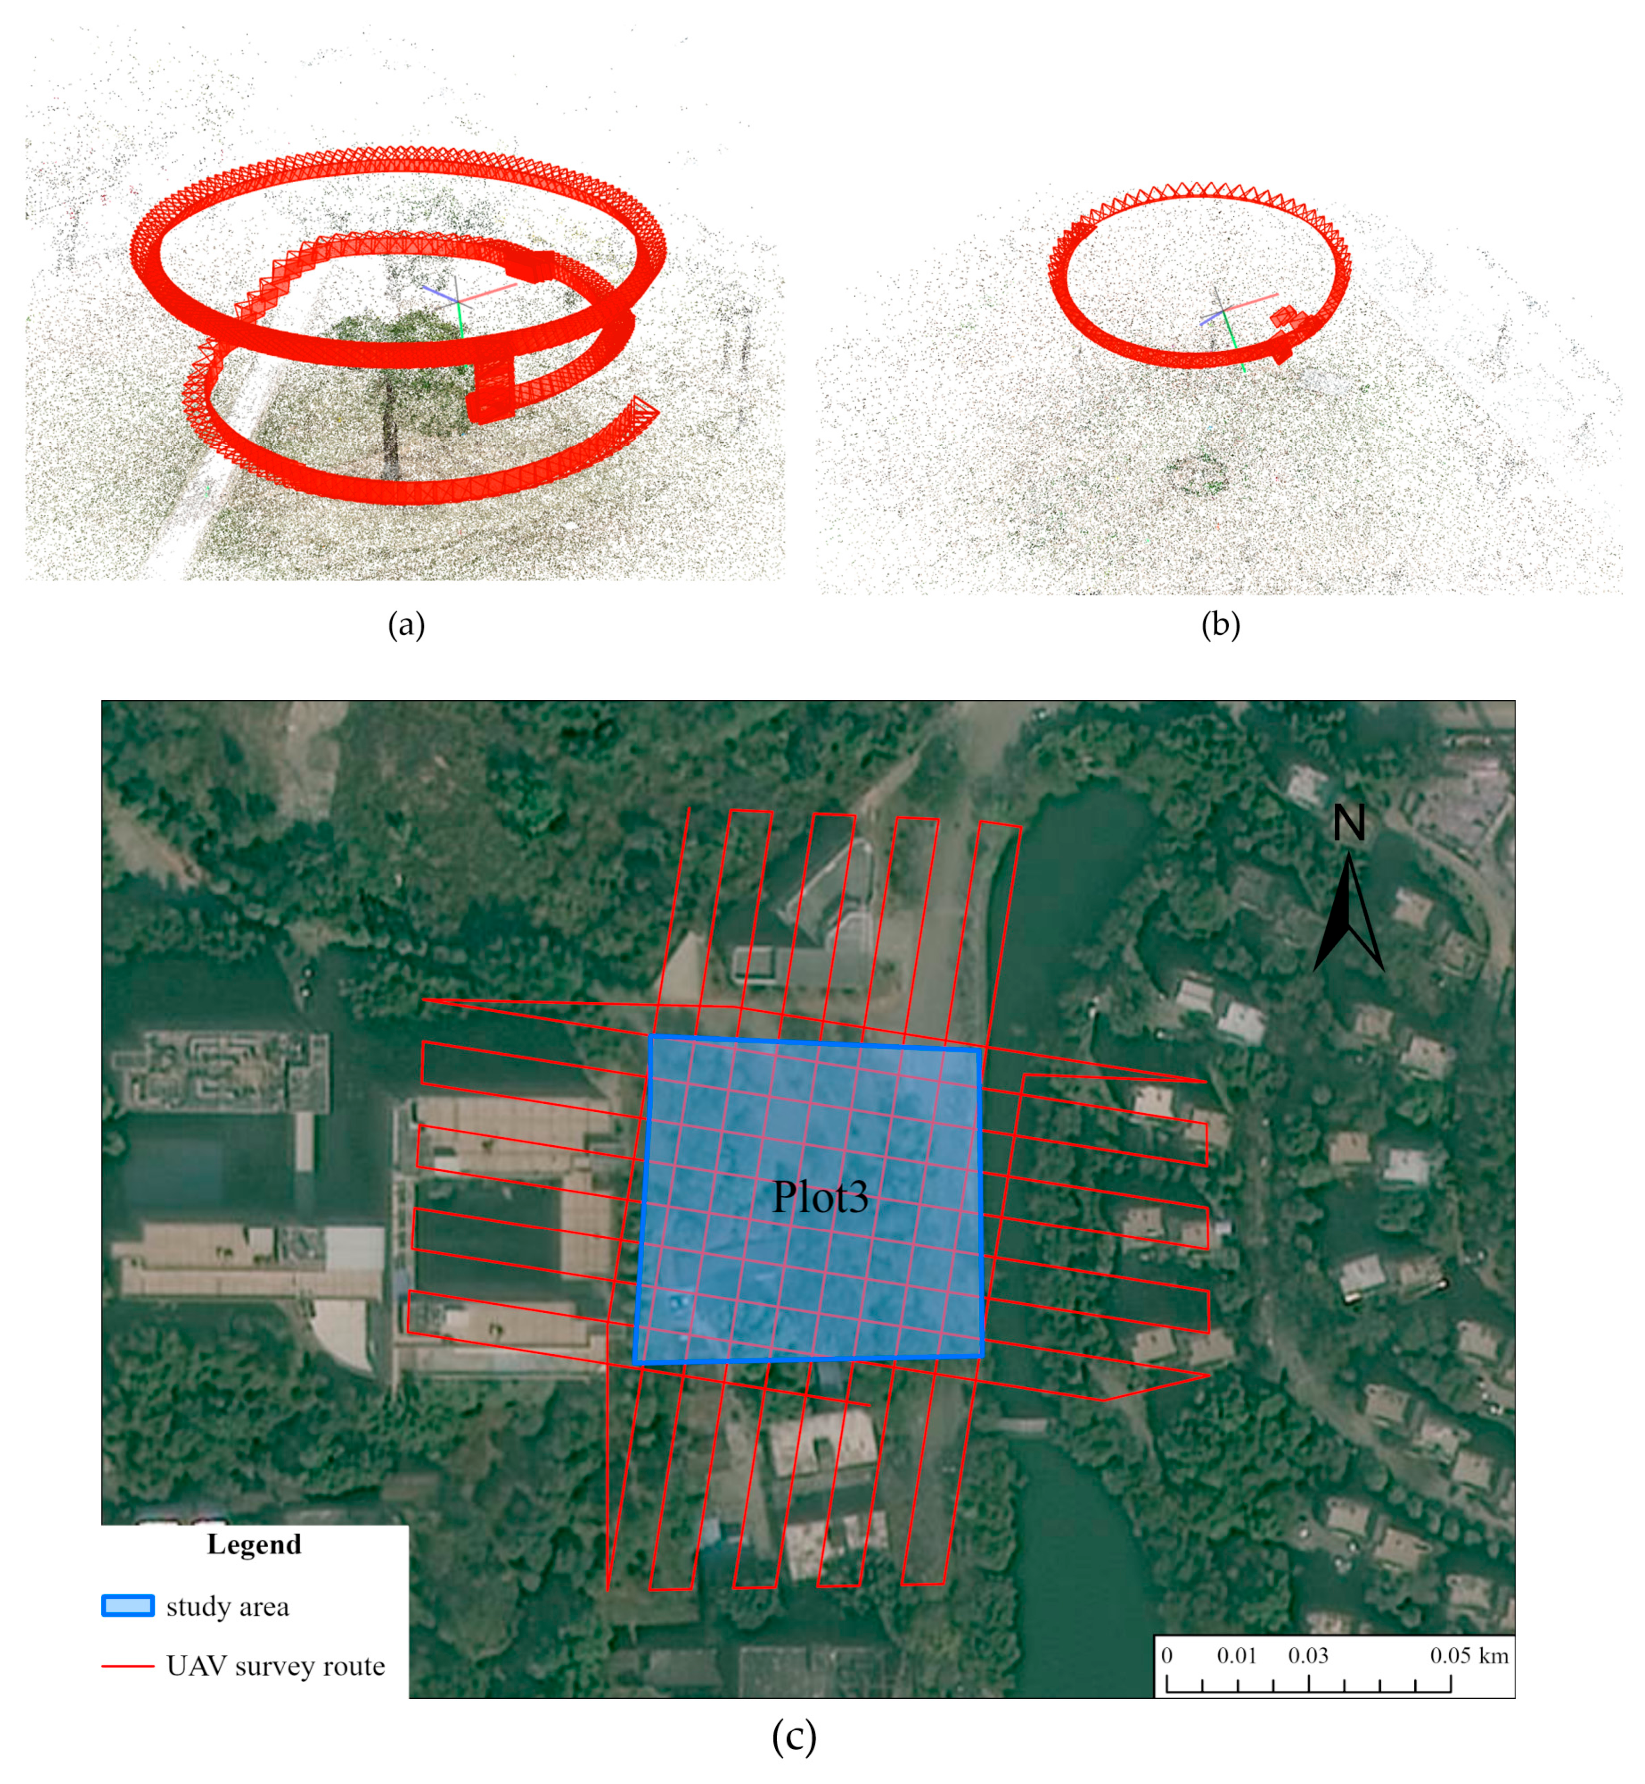
For image acquisition, a DJI Mavic 3 Enterprise UAV (DJI, Shenzhen, China) was used for multi-view imagery collection. For the individual tree reconstruction tasks in Plots 1 and 2, the UAV primarily utilizes an orbital flight pattern to ensure complete texture coverage. For the complex stand in Plot 3, a combination of grid flight paths and multi-angle oblique photography was used to maximize visual penetration through canopy gaps. To ensure high feature matching success rates for the SfM algorithm, forward and side overlaps were strictly maintained above 80%. The resulting camera poses and flight trajectories processed via COLMAP [16] are shown in Figure 3.
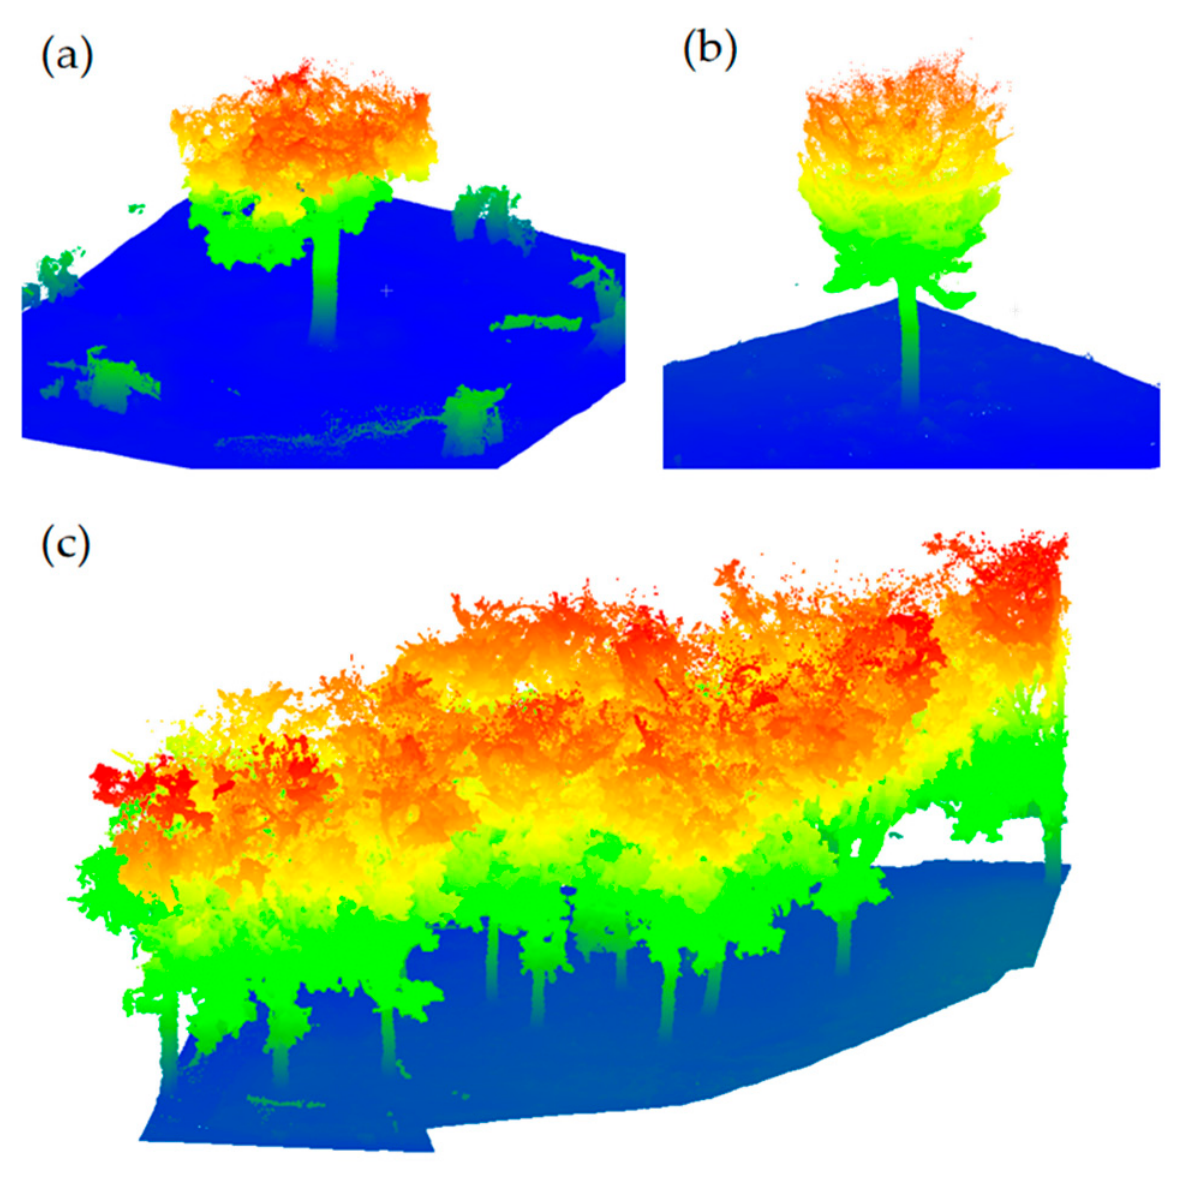
The passive aerial photogrammetry often has difficulty in capturing structures beneath dense canopies and is prone to geometric drift. We utilized the SHARE SLAM S20(SHARE UAV LTD, Shenzhen, China) handheld mobile laser scanning system to obtain high-precision point clouds of the understory and trunks, providing the model with a ground truth physical scale. During scanning, the operator traversed the plots in a closed loop trajectory. This continuous mobile scanning mode effectively alleviates the occlusion issues common in traditional static TLS, enhancing the completeness of the lower forest structure. The complete raw handheld SLAM LiDAR point clouds for all plots are displayed in Figure 4, which serve as the foundational geometric input for the subsequent reconstruction pipeline.
Finally, considering the sensitivity of explicit radiance field models to the static scene assumption, data collection was synchronized during windless periods with uniform, soft lighting on the same day. This minimized leaf movement interference on multiview geometric alignment. The final dataset statistics are summarized in Table 2.

3. Methods

3.1. Overview of the Framework

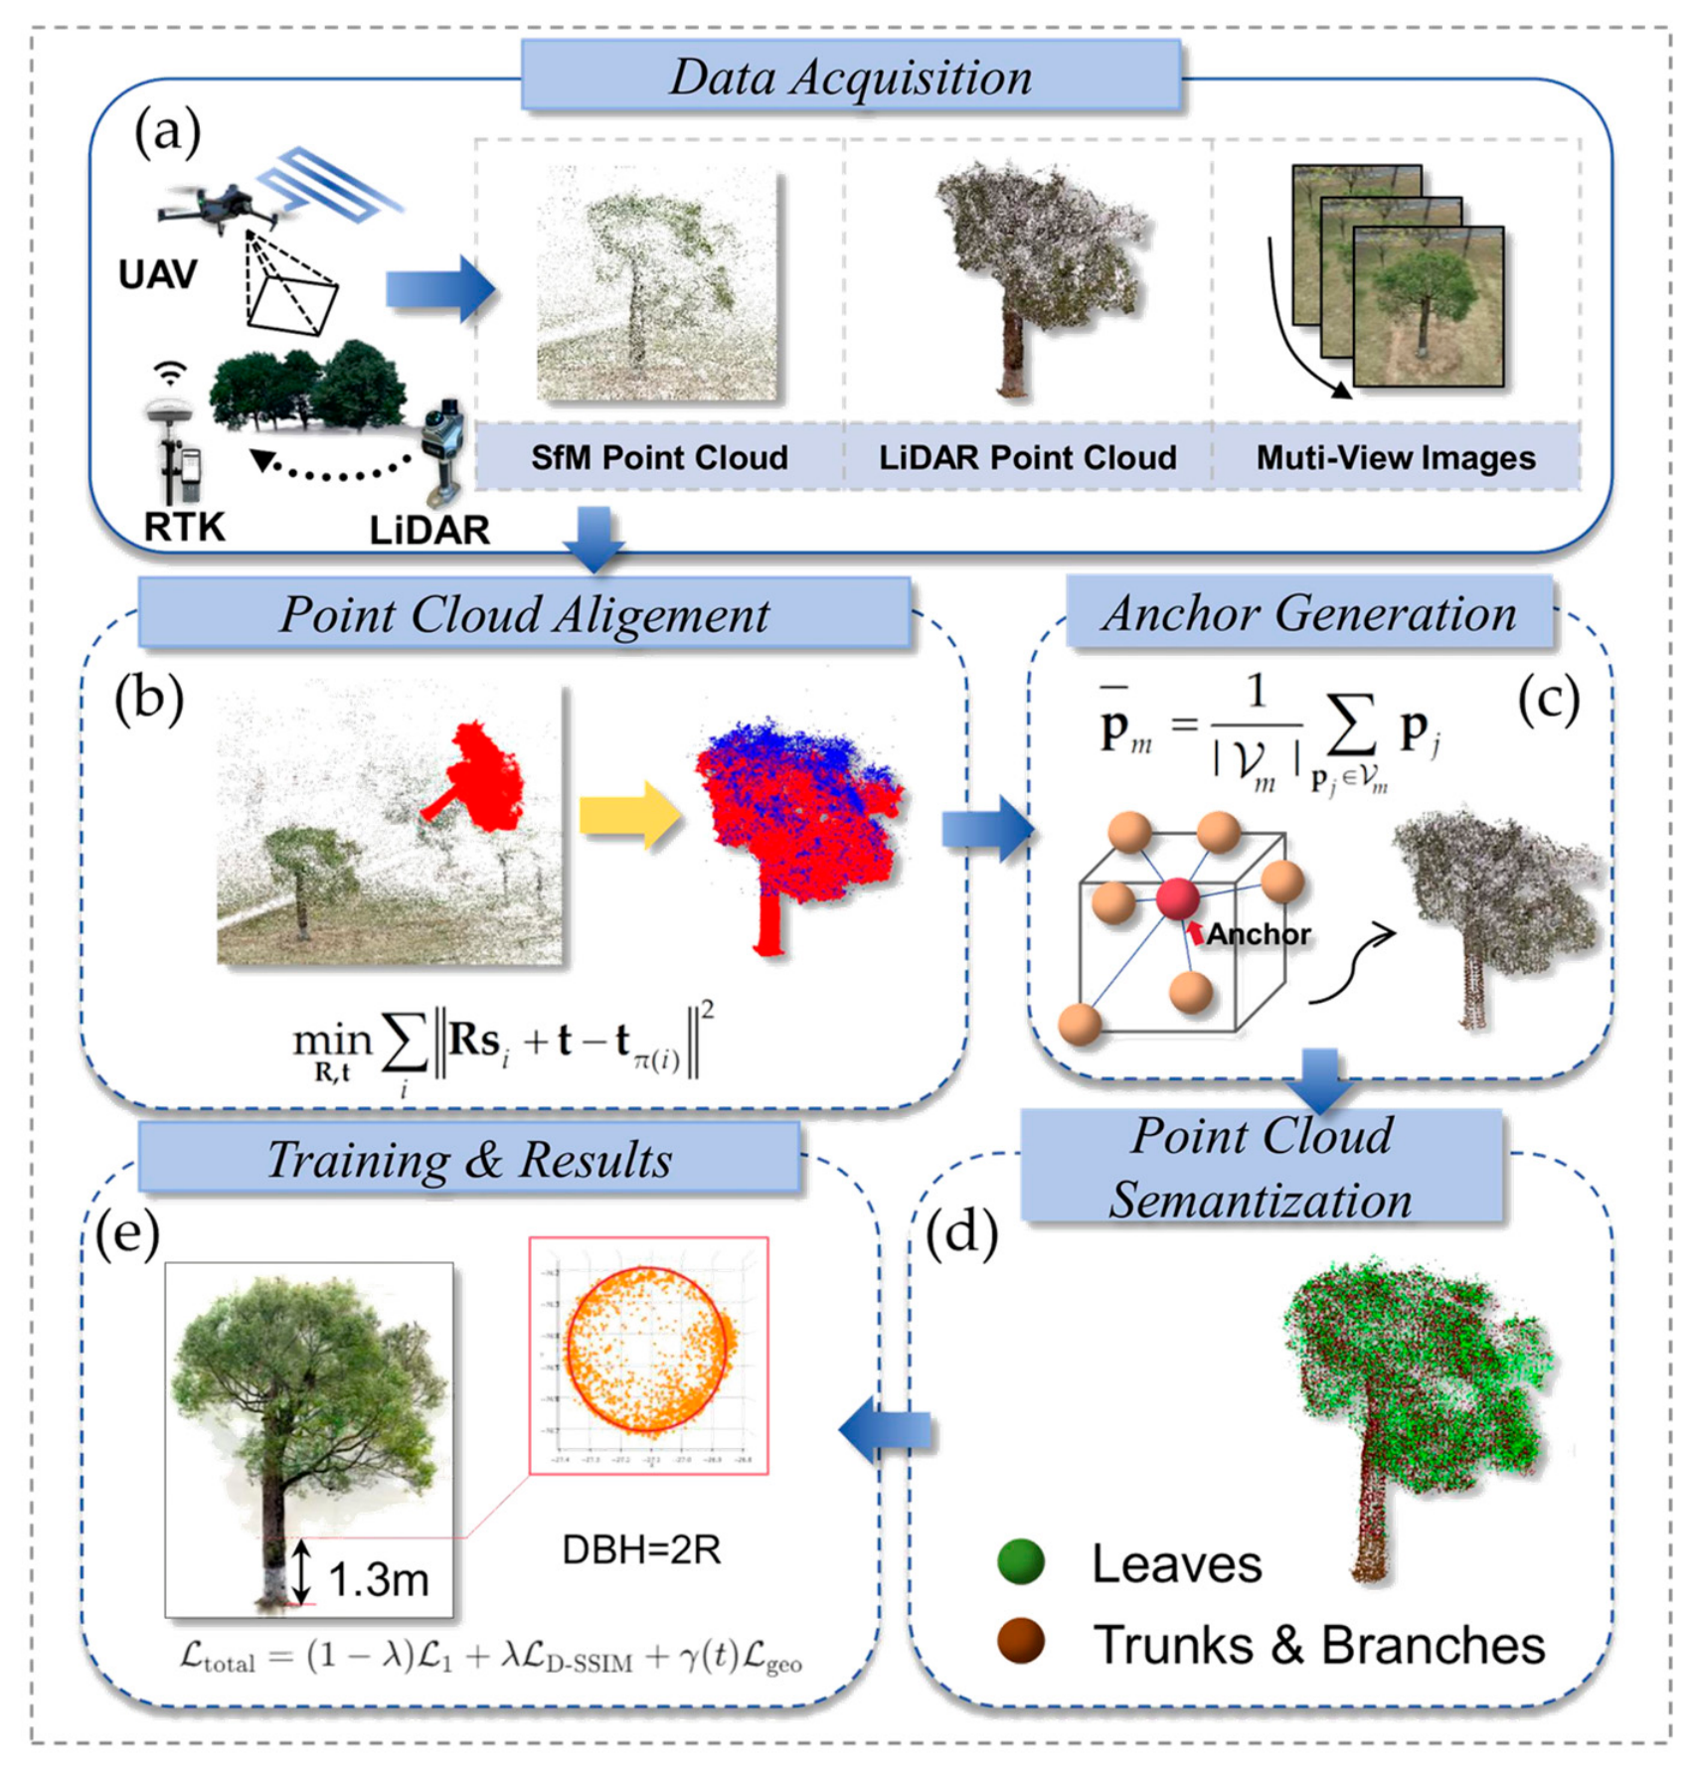
This section illustrates the overall technical workflow of the proposed framework, as shown in Figure 5.

3.2. Multi-Modal Data Alignment

Since active terrestrial LiDAR and passive UAV SfM photogrammetry use different local coordinate systems and vary in scale and perspective, achieving a unified 3D representation requires high-precision spatial registration. Multi-modal point cloud registration has become a key step for fusing terrestrial LiDAR and UAV photogrammetry in forest scenarios [42]. We adopt a coarse-to-fine registration strategy.
Coarse Registration. LiDAR and SfM point clouds must be aligned to a unified coordinate system before training. Due to the self-similarity of vegetation structures in forest scenes, traditional automated feature matching often falls into local optima. We performed manual feature point selection using CloudCompare v2.14 to establish an initial transformation.
Fine Registration. Following coarse alignment, the Iterative Closest Point (ICP) algorithm is introduced for precision refinement. Our goal is to minimize the spatial distance between the source and target point clouds through an optimization function:
min R , t i R s i + t t π ( i ) 2
where R S O ( 3 ) and t 3 represent the iteratively optimized rotation matrix and translation vector, respectively, and π ( i ) denotes the nearest neighbor correspondence between the source and target points. Starting from the initial pose provided by coarse registration, the algorithm iteratively updates the correspondences and the transformation matrix until the error converges or the maximum number of iterations is reached. The integration of the ICP algorithm compensates for inherent defects in SfM-derived point clouds, for instance, geometric drift and data sparsity under forest canopies, thereby significantly enhancing the spatial consistency across multiple modalities. Regarding the manual labor of this registration pipeline, only the coarse registration step requires minimal manual intervention. For each plot, at least 4 pairs of stable homologous feature points need to be manually selected, with a total manual operation time of approximately 5 min per plot. All subsequent steps, including the ICP-based fine registration and the entire downstream processing workflow, are automated without any additional manual intervention.

3.3. Geometric Anchors Generation

Due to the massive volume of LiDAR data, downsampling the LiDAR point cloud is required to enable its fusion with the sparse SfM point cloud. In other words, we aim to downsample the LiDAR dataset into a sparser representation while preserving the fundamental structural features, namely geometric anchors, that are necessary for 3DGS training. In this study, the geometric anchor set A is constructed based on the registered LiDAR point cloud. The core objective of this procedure is to filter out observation noise while precisely retaining critical morphologies, such as tree trunks and skeletal branches. Let the input point cloud after multi-modal registration be defined as
P = { p i 3 } i = 1 N
where N denotes the total number of spatial points in the input point cloud. p i represents the 3D coordinate vector of the i-th point in the set P .

3.3.1. Voxel-Based Spatial Homogenization

In this study, we introduce a voxel grid to discretize the spatial domain. For each non-empty voxel, the 3D centroid coordinates of the enclosed points are calculated to represent the geometric information within the corresponding local space, thereby yielding the downsampled point cloud set P v [43].
P v = { p ¯ m } m = 1 M
p ¯ m = 1 | V m | p j V m p j
In the above two equations, M denotes the total number of non-empty voxels that contain at least one point within the bounding box, which also corresponds to the size of the downsampled point cloud retained.

3.3.2. Statistical Outlier Filtering

After spatial homogenization, some discrete points and observation noise still remain in the point cloud. Since such abnormal points lack connectivity in topology, this study adopts a statistical distribution method based on neighborhood distance features to verify the confidence of the point cloud P v . For any target point in the point cloud, the average Euclidean distance between the target point and its neighboring points in the local environment is calculated. Denoising is conducted by the global normal truncation rule, so that the non-outlier points after the final screening form the geometric anchor set A . The retention judgment criterion for points is defined as follows:
d m μ d + α σ d
where d m denotes the average spatial Euclidean distance between the m-th target point p ¯ m and its k nearest neighbor points in the downsampled point cloud, which reflects the local geometric dispersion degree of this point; μ d represents the global statistical mean of the average neighborhood distance sequence for all data points within the set P v ; σ d represents the global standard deviation of the average neighborhood distance sequence for all data points within the set P v ; and α denotes the standard deviation multiplier factor that controls the truncation interval of the statistical distribution.
The local distance expectation d m of outlier points at the canopy edge and drift noise exhibits an abnormally high characteristic, which will exceed the upper bound constrained by the above inequality and thus be completely filtered out. According to the hyperparameter settings in this study, the number of neighbor points k for analysis is set to 16, and the filtering multiplier α is set to 2.5 [44]. The finally retained set of geometric anchors is defined as A = { a i } i = 1 | A | , where | A | denotes the total cardinality of anchors after processing, and a i represents the exact coordinate of the i-th anchor within the set.

3.3.3. Coupling Mechanism with 3DGS Initialization

The generated geometric anchor set A not only serves as the visualization result in the point cloud preprocessing stage, but also acts as a data prior to directly drive the initial state construction of the 3DGS representation model. Specifically, the 3D Euclidean coordinates of the anchors directly act as the initial center position metric for each Gaussian primitive:
μ i ( 0 ) = a i
where μ i ( 0 ) denotes the 3D mean position vector of the i-th Gaussian primitive at the 0-th optimization step (i.e., the initialization stage) of the 3DGS network, and a i represents the 3D coordinate point extracted from the corresponding index in the geometric anchor set A .
Meanwhile, the initialization operation estimates the initial triaxial scale components of the corresponding Gaussian primitive based on the distance span between points within the anchor set, which is formulated as
s i ( 0 ) = log dist i 2 + ε 1 3
where s i ( 0 ) denotes the logarithmic scale scaling vector assigned to the i-th Gaussian primitive at the initialization stage, dist i represents the Euclidean distance between the anchor a i and its nearest neighbor anchor in 3D space (used to approximate the local volume size that the Gaussian primitive should cover), and ε is a tiny positive real constant added to the squared distance term to prevent zero values inside the logarithmic function when the Euclidean distance approaches zero, thereby maintaining the numerical stability of gradients during subsequent backpropagation.
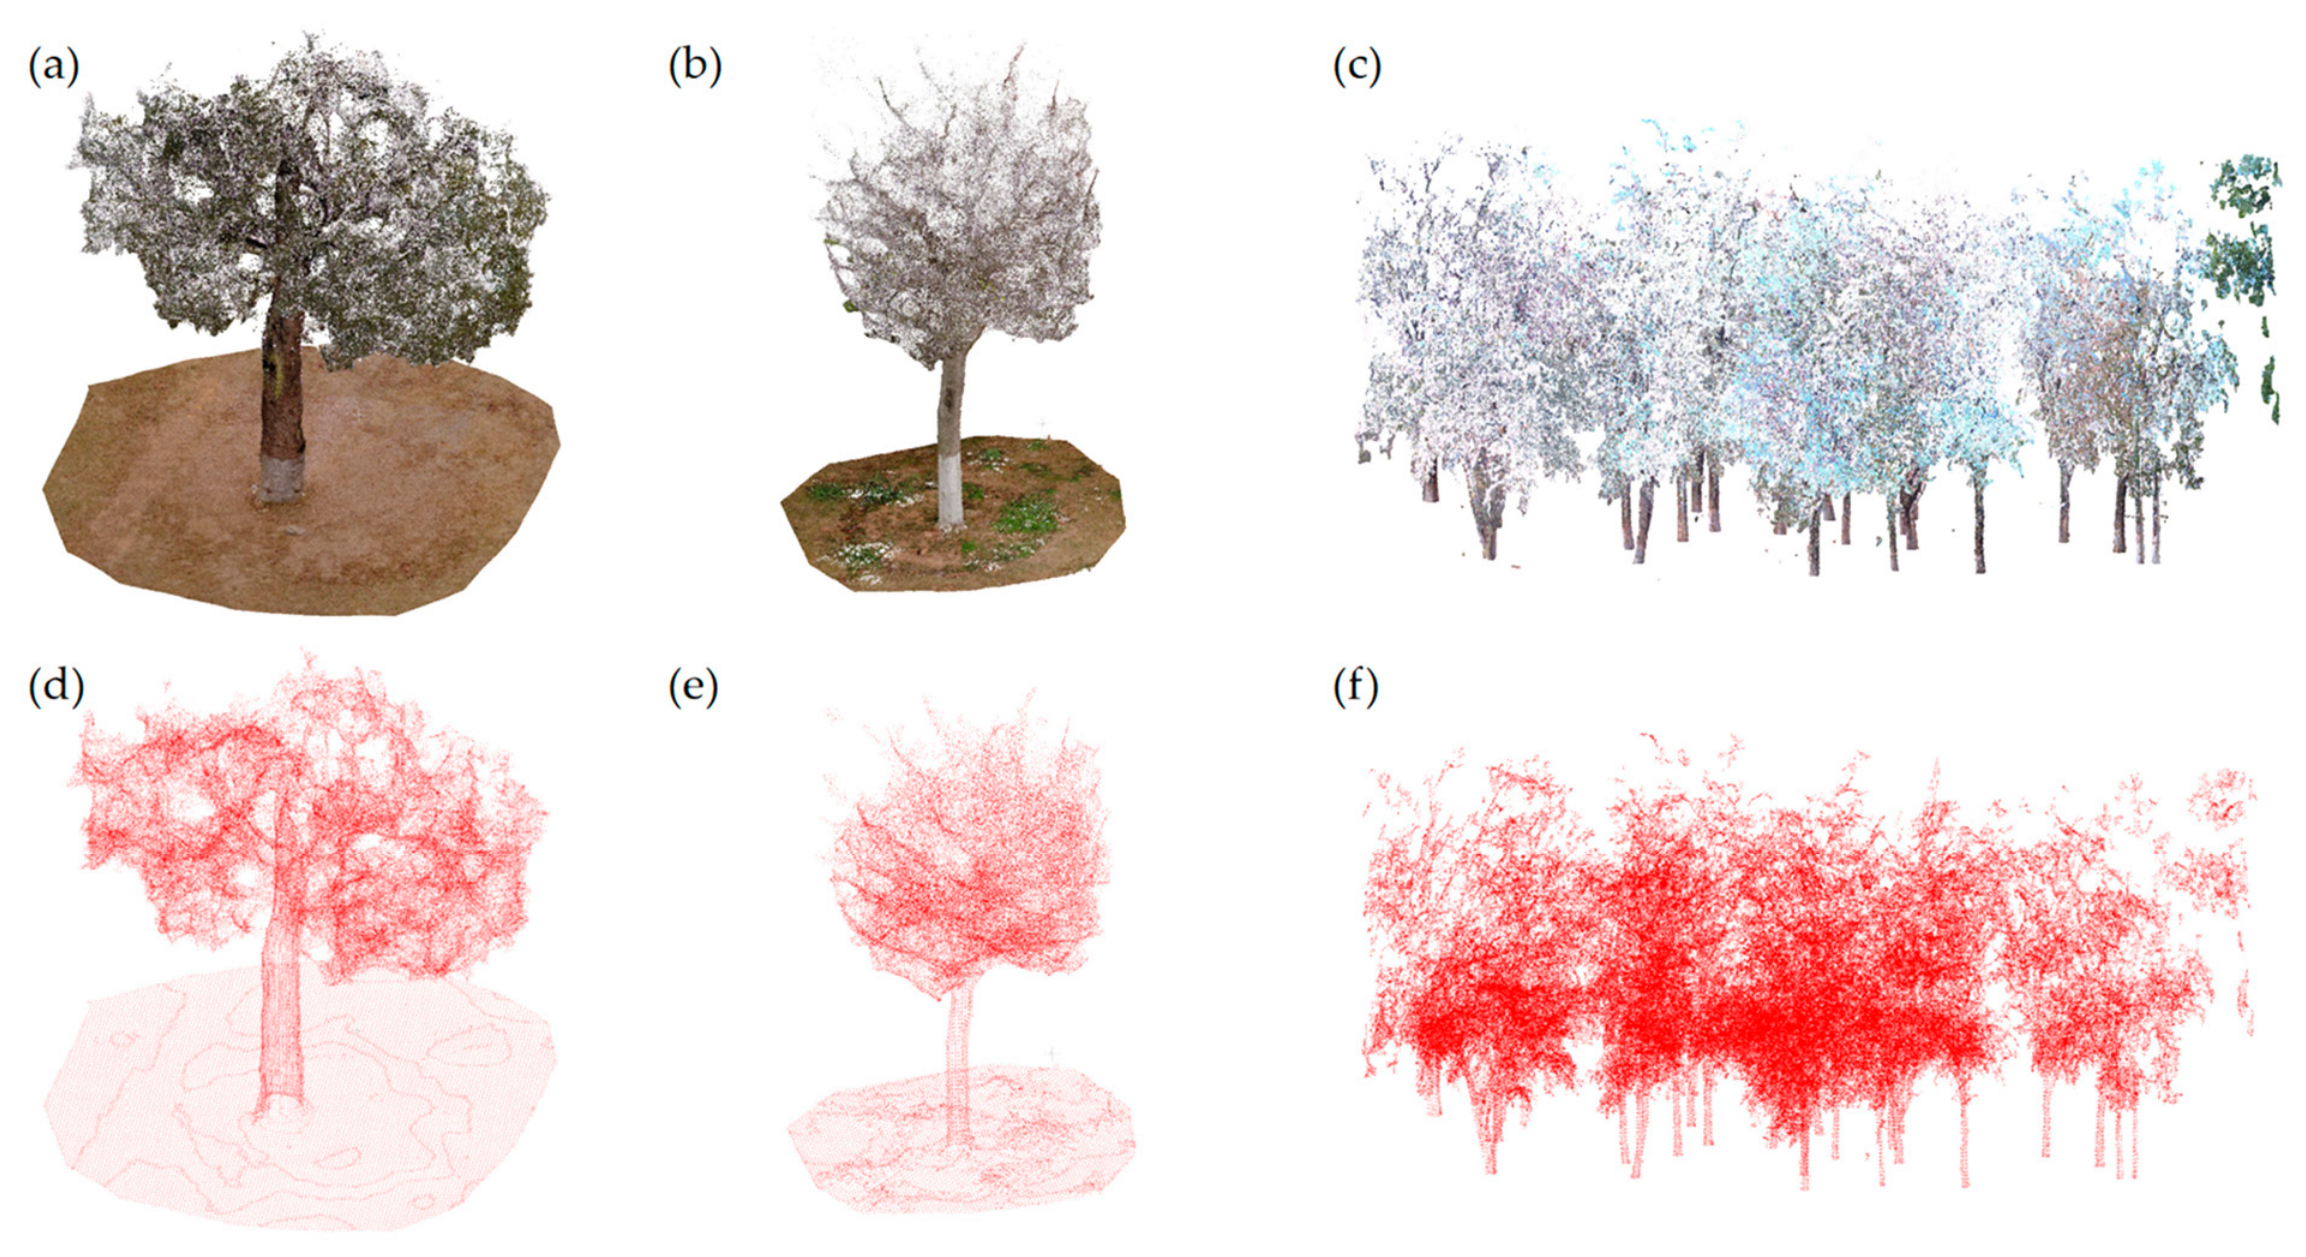
Through the above coupling mechanism, the geometric anchor set defines the spatial reference and volume extent of the initial Gaussian primitives. The voxel homogenization strategy effectively constrains the disordered surge of the variance of the initial logarithmic scale s i ( 0 ) , while the distance statistical threshold method prevents the generation of abnormal primitives that cause view occlusion. The combination of these two strategies jointly establishes a geometric prior foundation for the subsequent semantic regularization training targeting tree trunks. The fused point clouds and the final extracted geometric anchors for each plot are visualized in Figure 6.

3.4. Semantic Segmentation for Individual Trees

To facilitate the subsequent trunk-constrained optimization strategy, this study proposes an unsupervised point cloud semantic segmentation pipeline to accurately segment the input point cloud P into leaves (label 0) and trunks/main branches (label 1).
We compute the local covariance matrix for each point using k = 20 neighbors (k-NN) to extract its eigenvalues λ 1 λ 2 λ 3 0 . These are used to derive key 3D geometric features: linearity L i = ( λ 1 λ 2 ) / λ 1 , planarity P i = ( λ 2 λ 3 ) / λ 1 and sphericity S i = λ 3 / λ 1 . Then, by introducing a color weight ω = 0.5 , we construct a joint feature vector x i = [ L i , P i , S i , ω r i , ω g i , ω b i ] for each point, followed by clustering using a binary K-means algorithm. Given the distinct linear structural prior of tree trunks, the cluster with the higher average linearity is directly designated as the trunk category, which effectively resolves the label ambiguity typical in unsupervised clustering.
Connected component analysis on the k-NN graph is employed to refine the segmentation boundaries. Isolated components containing fewer points than a threshold τ c are considered misclassified noise and relabeled based on the nearest neighbor principle. Here, τ c is set to 50 [45]. This post-processing step effectively filters out scattered artifacts and enhances the spatial continuity of the trunk structures. The resulting semantic labels provide reliable prior constraints for the subsequent 3DGS optimization.

3.5. Semantically Constrained 3D Gaussian Splatting

3.5.1. 3DGS Representation

The 3D Gaussian Splatting abandons the implicit representation of NeRF and adopts explicit 3D Gaussian ellipsoids to model the scene. Each Gaussian primitive consists of position μ , covariance matrix Σ , opacity α , and spherical harmonic coefficients. Its probability density function is
G ( x ) = e 1 2 ( x μ ) T Σ 1 ( x μ )
To ensure that Σ remains positive definite during optimization, the algorithm decomposes it into rotation R and scaling S, i.e., Σ = R S S T R T . This explicit representation is not only easy to edit but also suitable for high-performance parallel computing.
During rendering, 3D ellipsoids need to be splatted onto the 2D imaging plane. Using the EWA Splatting algorithm and local affine transformation approximation, the 3D covariance Σ is mapped to 2D covariance Σ via the view transformation matrix W and the Jacobian matrix J of the projective transformation:
Σ = J W Σ W T J T
The training objective is to minimize the discrepancy between rendered images and ground truth views. The total loss L is a weighted combination of the L 1 loss for color calibration and the D-SSIM loss for structure and detail optimization:
L = ( 1 λ ) L 1 + λ L D - SSIM
L 1 = 1 N i = 1 N I ^ i I i
The loss function is not only used to update the attribute parameters of Gaussian spheres, but the positional gradients it generates also serve as the core signal for adaptive density control. The algorithm monitors gradients in the view space, and when gradients in a region are excessively large (indicating poor fitting), it clones or splits the Gaussian ellipsoids at that location. This mechanism enables the loss function to not only determine the appearance of Gaussian spheres but also dynamically govern where new Gaussian spheres are generated.

3.5.2. Semantic-Aware Optimization Strategy

We propose a semantic-aware optimization strategy that imposes special constraints on Gaussian primitives and introduces a local geometric regularization term L geo , specifically for trunk primitives with distinct structural attributes. The total loss function is defined as
L total = ( 1 λ ) L 1 + λ L D - SSIM + γ ( t ) L geo
To avoid imposing overly strict penalties during the early stages when the network is establishing the rough scene structure, the weight γ ( t ) employs a delayed linear warm-up strategy. Specifically, γ ( t ) smoothly increases from 0 to a peak value of γ max = 0.02 between iterations T start = 3000 and T end = 7000 [46]. This setup effectively bypasses the initial chaotic phase and the densification peak of 3DGS, prioritizing the preliminary alignment of photometric features.
Adaptive regularization with two key parts tackles topological changes in 3DGS from frequent densification and pruning:
A dynamic semantic confidence weight w i = α i P i q i is defined to accurately filter a high-confidence trunk candidate set S . Here, α i is the current opacity, P i [ 0 ,   1 ] is the trunk-affiliation probability inherited from the parent primitive, and q i is a Softmax pseudo-label score based on the shortest Euclidean distances from the primitive center to the LiDAR trunk and leaf anchors.
Considering the uneven density of LiDAR point clouds in forest scenes, we dynamically infer an adaptive logarithmic target scale s target = log β d ¯ K ( i ) + ϵ 1 3 (where β is a scaling factor and ϵ is a minimal constant), based on the average spatial distance d ¯ K ( i ) of the local K-nearest anchors.
The local semantic geometric loss function L geo for the candidate set S is refined as
L geo = 1 i S w i i S w i μ i a nn ( i ) 2 2 N pos 2 + s i s target 2 2
where a nn ( i ) is the closest LiDAR trunk anchor to primitive i, and N pos is a scene-scale normalization constant computed based on the bounding box. This loss function effectively constrains the spatial compactness of the trunk surface and significantly mitigates primitive drift before the spatial topology stabilizes.
Constraining the spatial variance of trunk-related Gaussian primitives L geo can achieve two effects: (1) it anchors Gaussian primitives near LiDAR, providing a basis for subsequent DBH extraction; (2) visually, it can effectively eliminate low-opacity floating objects in the understory space that appear in 3DGS.

3.6. DBH Measurement

To automatically extract the DBH from the reconstructed 3DGS scene, this study proposes a measurement algorithm combining opacity filtering and weighted least squares circle fitting.
To address low-confidence floaters caused by complex lighting and environmental noise, we first filter out Gaussian primitives in the trunk category with an opacity α i < 0.1. Subsequently, a horizontal primitive slice P slice with a thickness of Δ h = 0.2 m is extracted at the standard breast height ( Z bh = 1.3 m):
P slice = μ i μ i P trunk , α i 0.1 , z i Z bh Δ h 2
where μ i = ( x i , y i , z i ) denotes the spatial center of the i-th Gaussian primitive.
Next, a standard RANSAC algorithm is employed to remove gross outliers from the slice, yielding an inlier set I . While traditional circle fitting treats all data points equally, in the 3DGS representation, primitives with higher opacity α i typically indicate denser and more reliable physical surfaces. Therefore, we introduce an opacity-weighted optimization strategy during the inlier fitting stage [32,47]. By introducing the algebraic circle equation parameters u , v and w , we construct a residual sum of squares objective function weighted by α i :
E ( u , v , w ) = i I α i x i 2 + y i 2 + u x i + v y i + w 2
By minimizing this objective function and solving the resulting weighted normal equations, the precise center and radius r of the trunk cross-section can be directly derived. The final DBH of the target tree is computed as DBH = 2r.

3.7. Model Training and Evaluation Metrics

3.7.1. Baseline Implementations

Neural Radiance Fields (NeRFs). The NeRF baseline follows the original architecture proposed by Mildenhall et al. [22]. An MLP with 8 hidden layers of 256 units each, using ReLU activations, is employed to model density and view-dependent color. A skip connection is applied at the 4th layer. Positional encoding uses 10 frequency bands for spatial coordinates and 4 frequency bands for viewing directions. Volumetric rendering samples 64 points per ray in the coarse pass and 128 points in the fine pass. Training is performed with the Adam optimizer at an initial learning rate of 5 × 10⁻⁴, decaying exponentially to 5 × 10⁻⁵, with a batch size of 4096 rays per iteration. All plots are trained for 300,000 iterations.
Standard 3D Gaussian Splatting (3DGS). The 3DGS baseline follows Kerbl et al. [23]. Gaussian primitives are initialized directly from COLMAP SfM point clouds without LiDAR geometric priors. The Adam optimizer is used with learning rates of 1.0 × 10⁻⁴ for positions, 2.5 × 10⁻³ for scales and rotations, and 5.0 × 10⁻³ for opacity. Spherical harmonic coefficients are optimized at a learning rate of 2.5 × 10⁻³. Adaptive density control is applied every 100 iterations: primitives with opacity below 0.005 are pruned, and those with large view-space gradients are cloned or split. The model is trained for 30,000 iterations per plot. All hyperparameters remain at the original default values [21]. Both baselines are trained on the same NVIDIA GeForce RTX 4060 GPU with 48 GB RAM to ensure hardware consistency.
We selected these two core baselines because they represent the two dominant technical paradigms in modern 3D reconstruction and are the most widely accepted standard benchmarks in the field. Direct comparison with vanilla 3DGS also allows us to accurately quantify the independent contributions of our proposed LiDAR geometric anchor initialization and semantic regularization modules. We have also included a LiDAR-only DBH estimation baseline, which is the gold standard for forestry parameter extraction.

3.7.2. Evaluation Metrics

We introduce three common metrics to compare rendered and ground truth images to fully evaluate the novel view synthesis quality of the proposed method in forest digital twins: Peak Signal-to-Noise Ratio (PSNR), Structural Similarity Index Measure (SSIM), and Learned Perceptual Image Patch Similarity (LPIPS) [48,49,50]. Specifically, PSNR measures the absolute pixel-level errors in color and luminance; SSIM focuses on assessing the structural coherence of complex branch networks and bark textures; LPIPS calculates distances in a pre-trained deep feature space, making it highly sensitive to blurring and smudging in the canopy, thereby compensating for the limitations of traditional metrics in perceiving self-similar textures. It is worth noting that higher PSNR and SSIM values indicate better reconstruction fidelity, whereas a lower LPIPS value signifies superior perceptual quality for the human visual system.

4. Results

4.1. Overall Reconstruction Performance

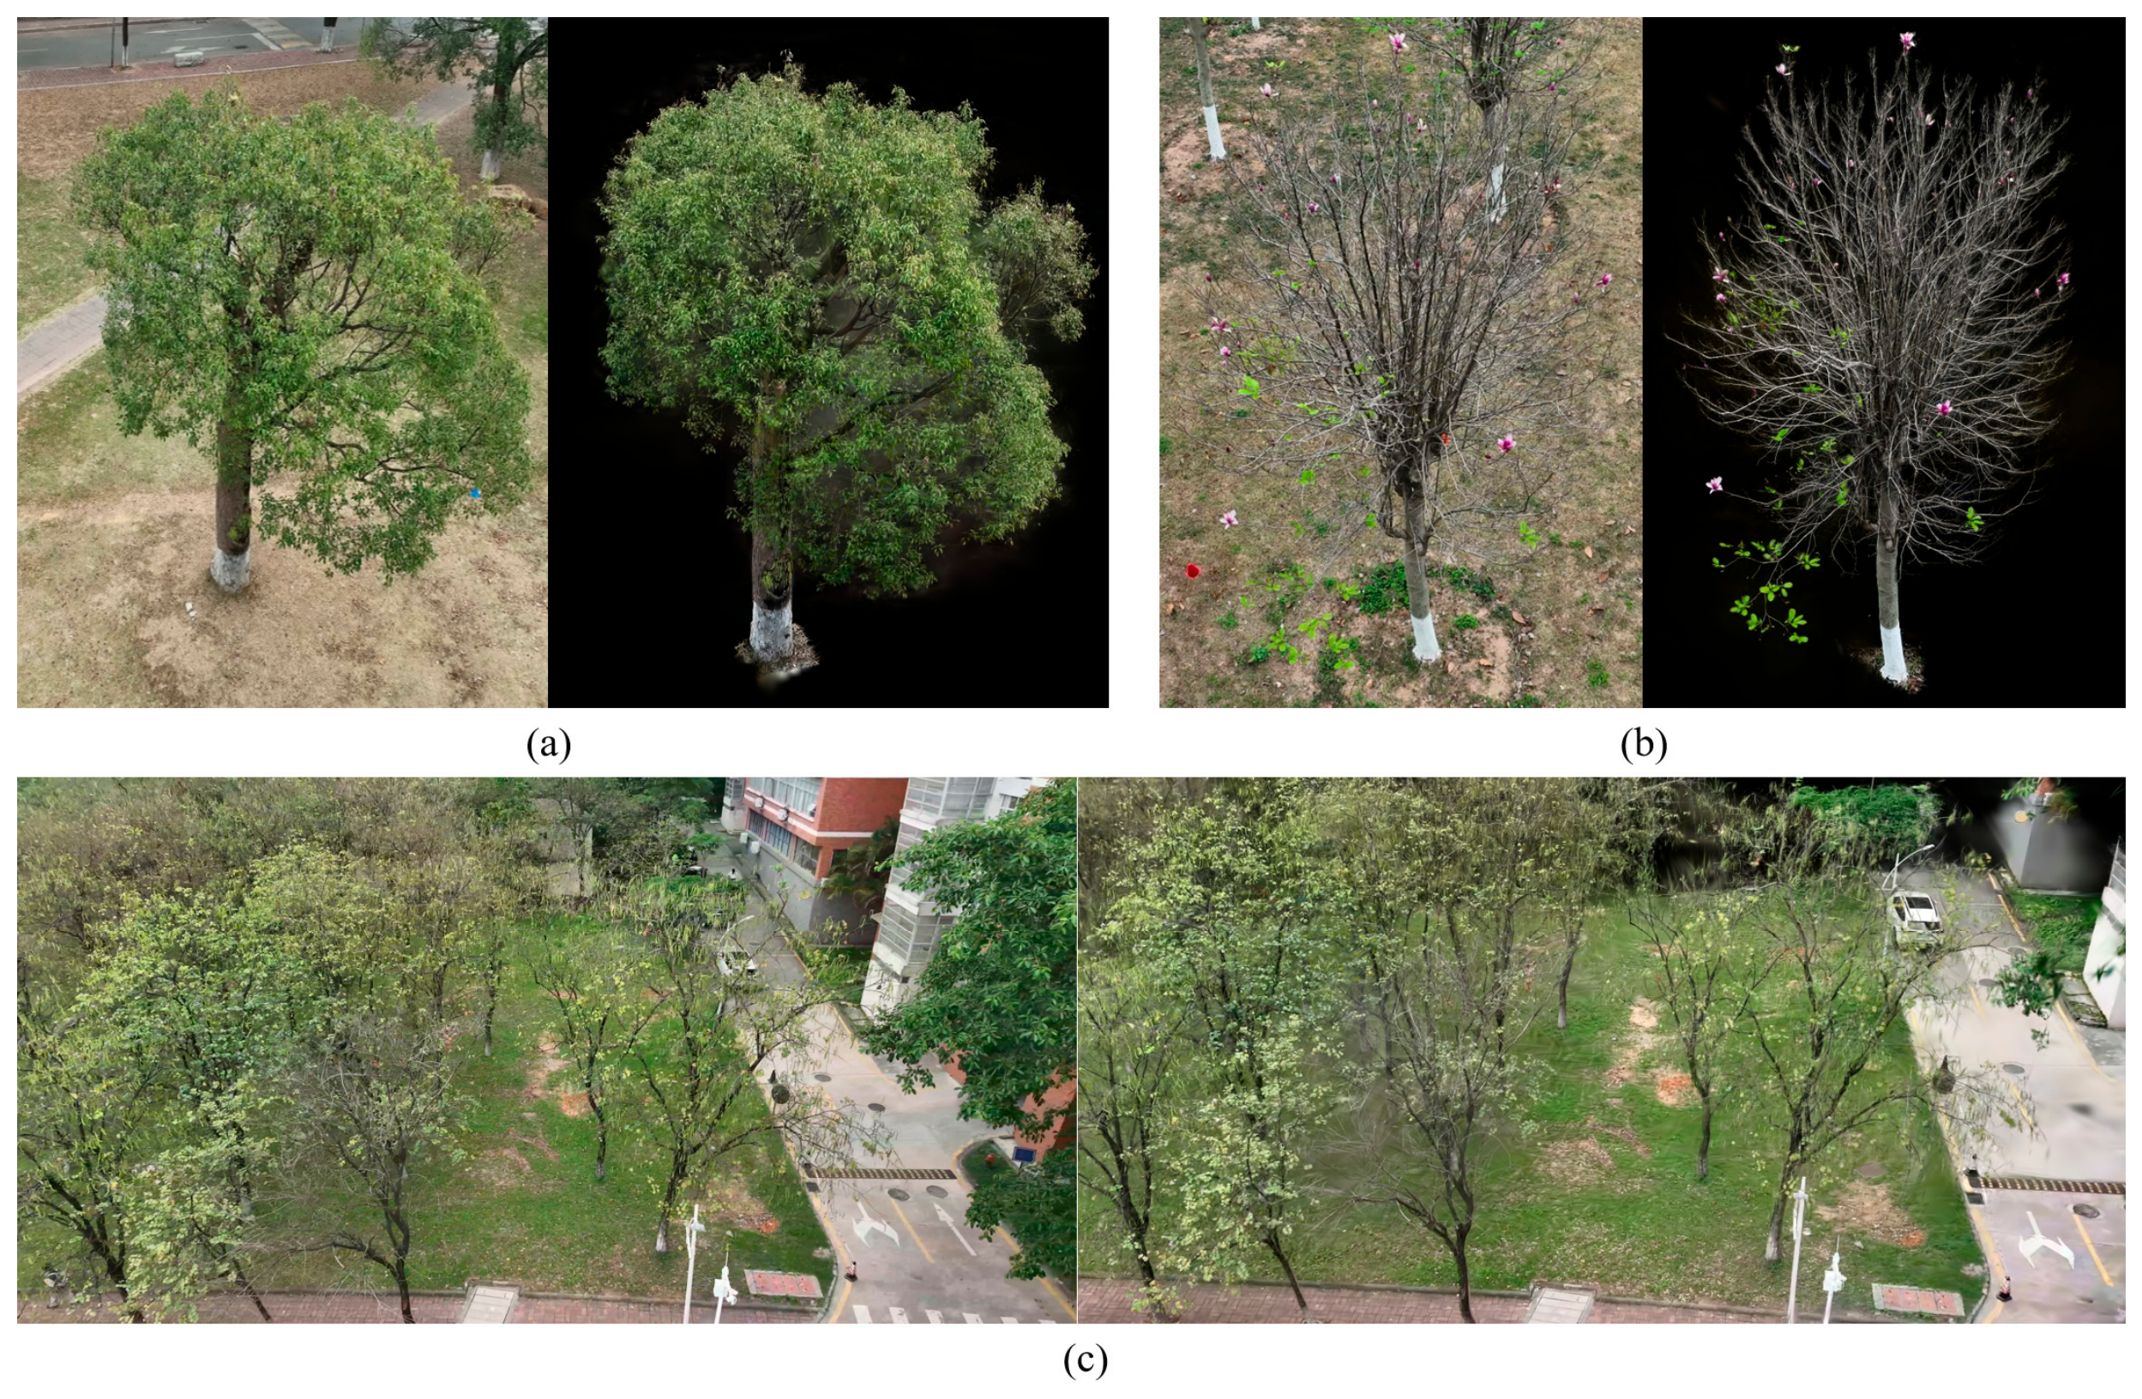
Figure 7 shows the 3D reconstruction results of the three experimental plots for performance evaluation of the proposed framework. As shown in the figure, the framework successfully adapts to the increasing complexity of forest stands: from the dense evergreen canopy of Cinnamomum camphora (Plot 1), the unique branch topology of Magnolia denudata (Plot 2), to the geometric occlusion within the miniature stand (Plot 3). By deeply fusing UAV photogrammetric textures with LiDAR point clouds, the generated digital twin exhibits a smooth spatial transition between tree trunks and non-rigid leaves. Notably, in the highly occluded understory area of Plot 3, the basic topological structure of tree trunks remains relatively intact, which demonstrates the strong robustness of our spatial registration and initialization strategies when dealing with complex natural environments with relatively simple understory structures.

4.2. Qualitative Visual Comparison

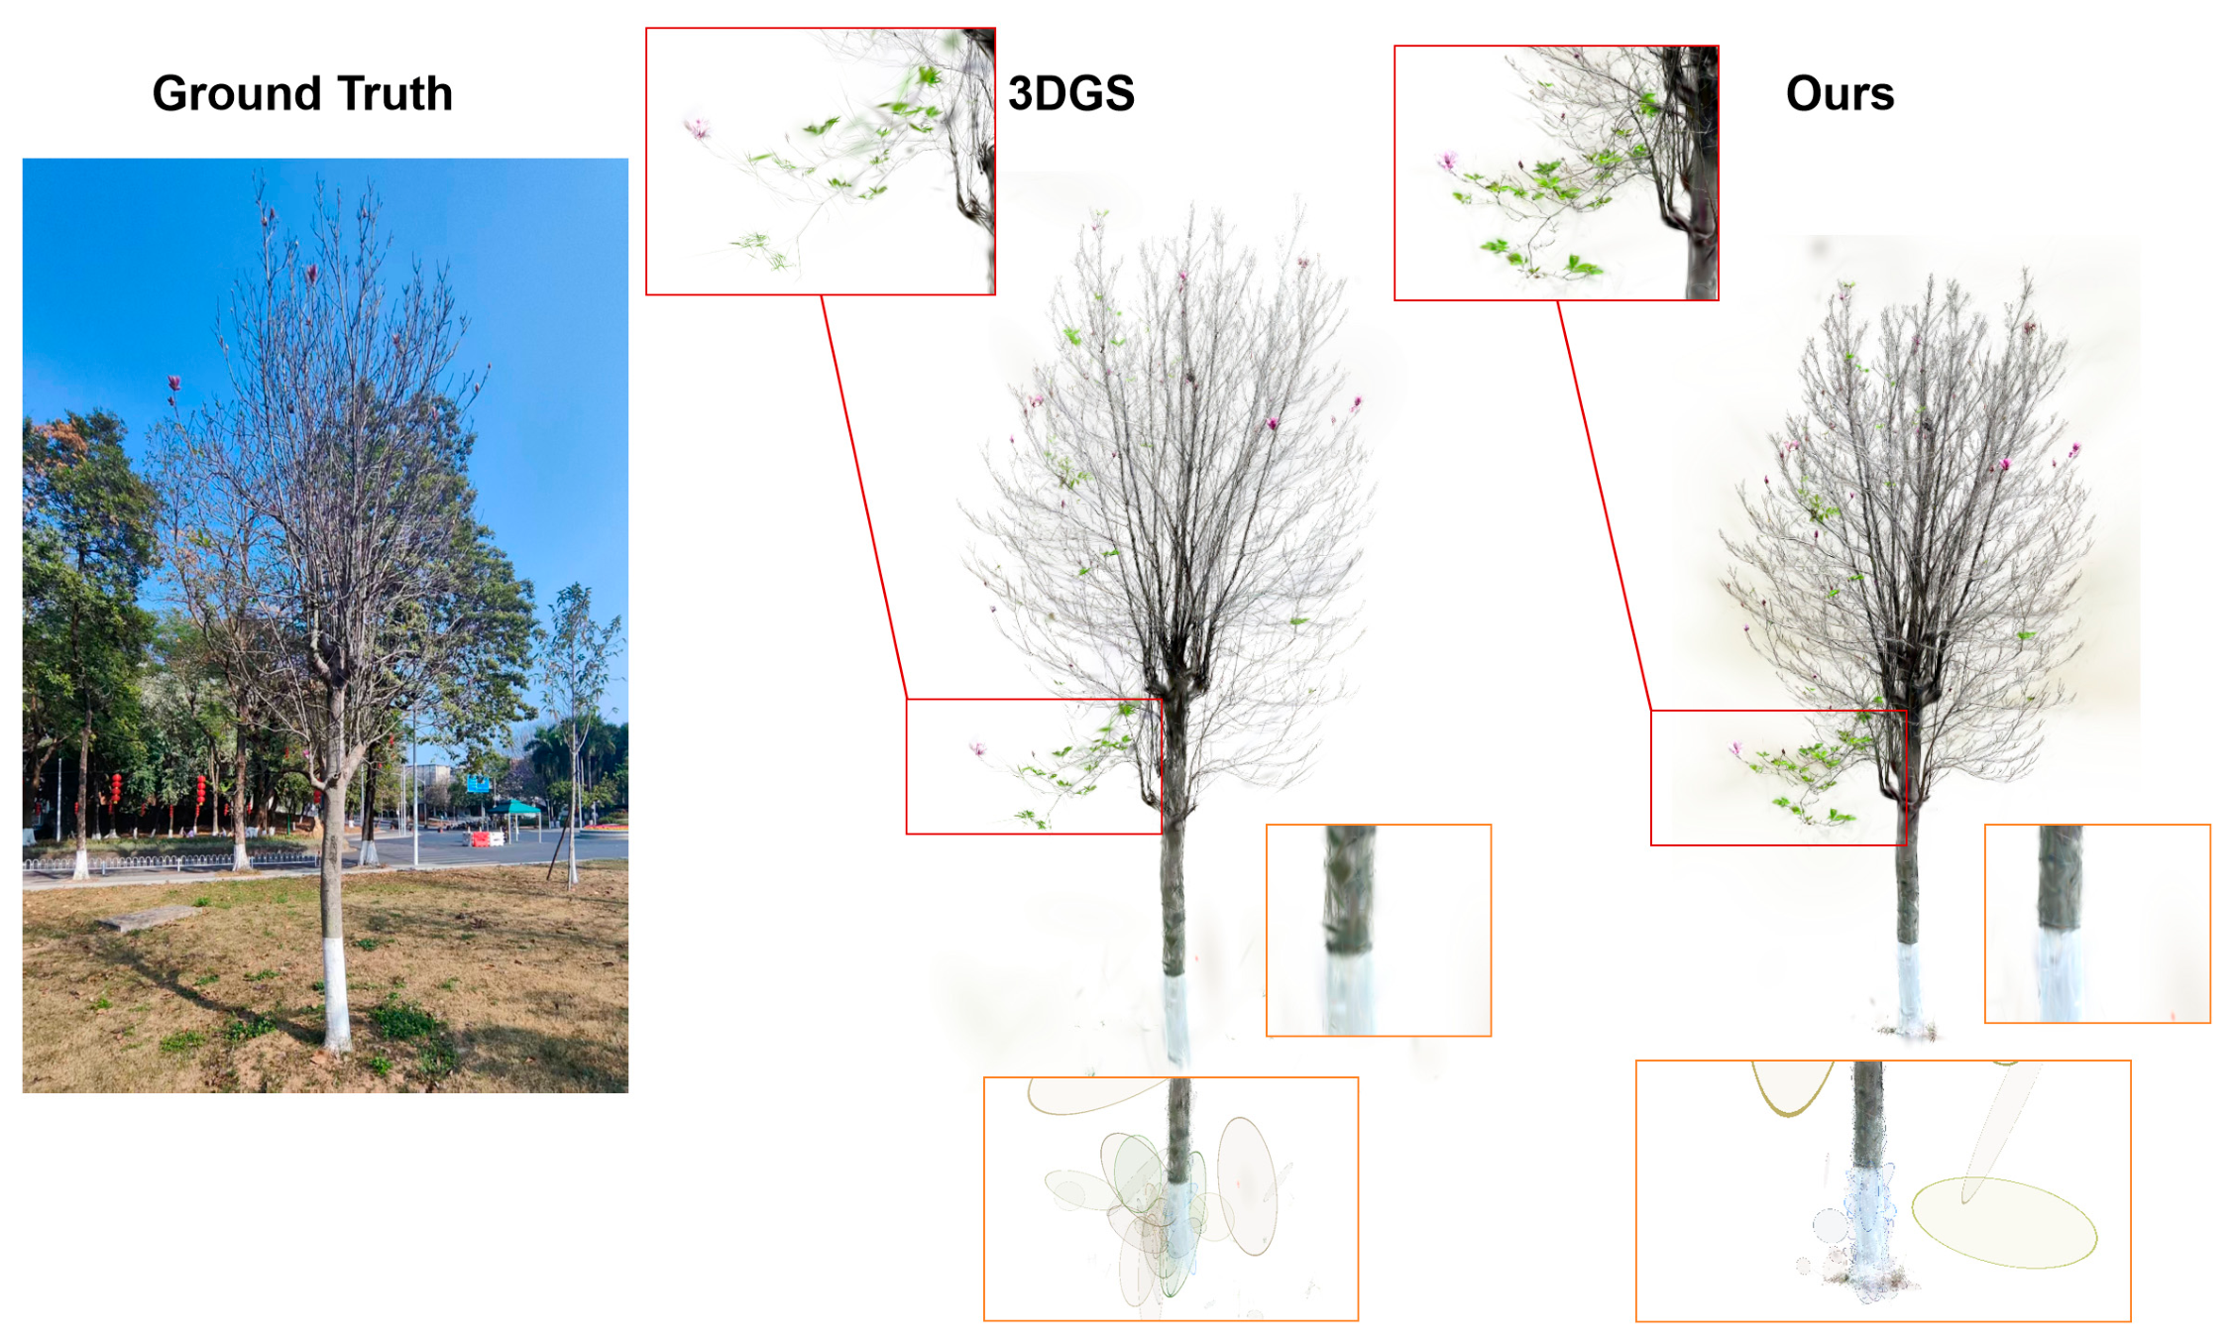
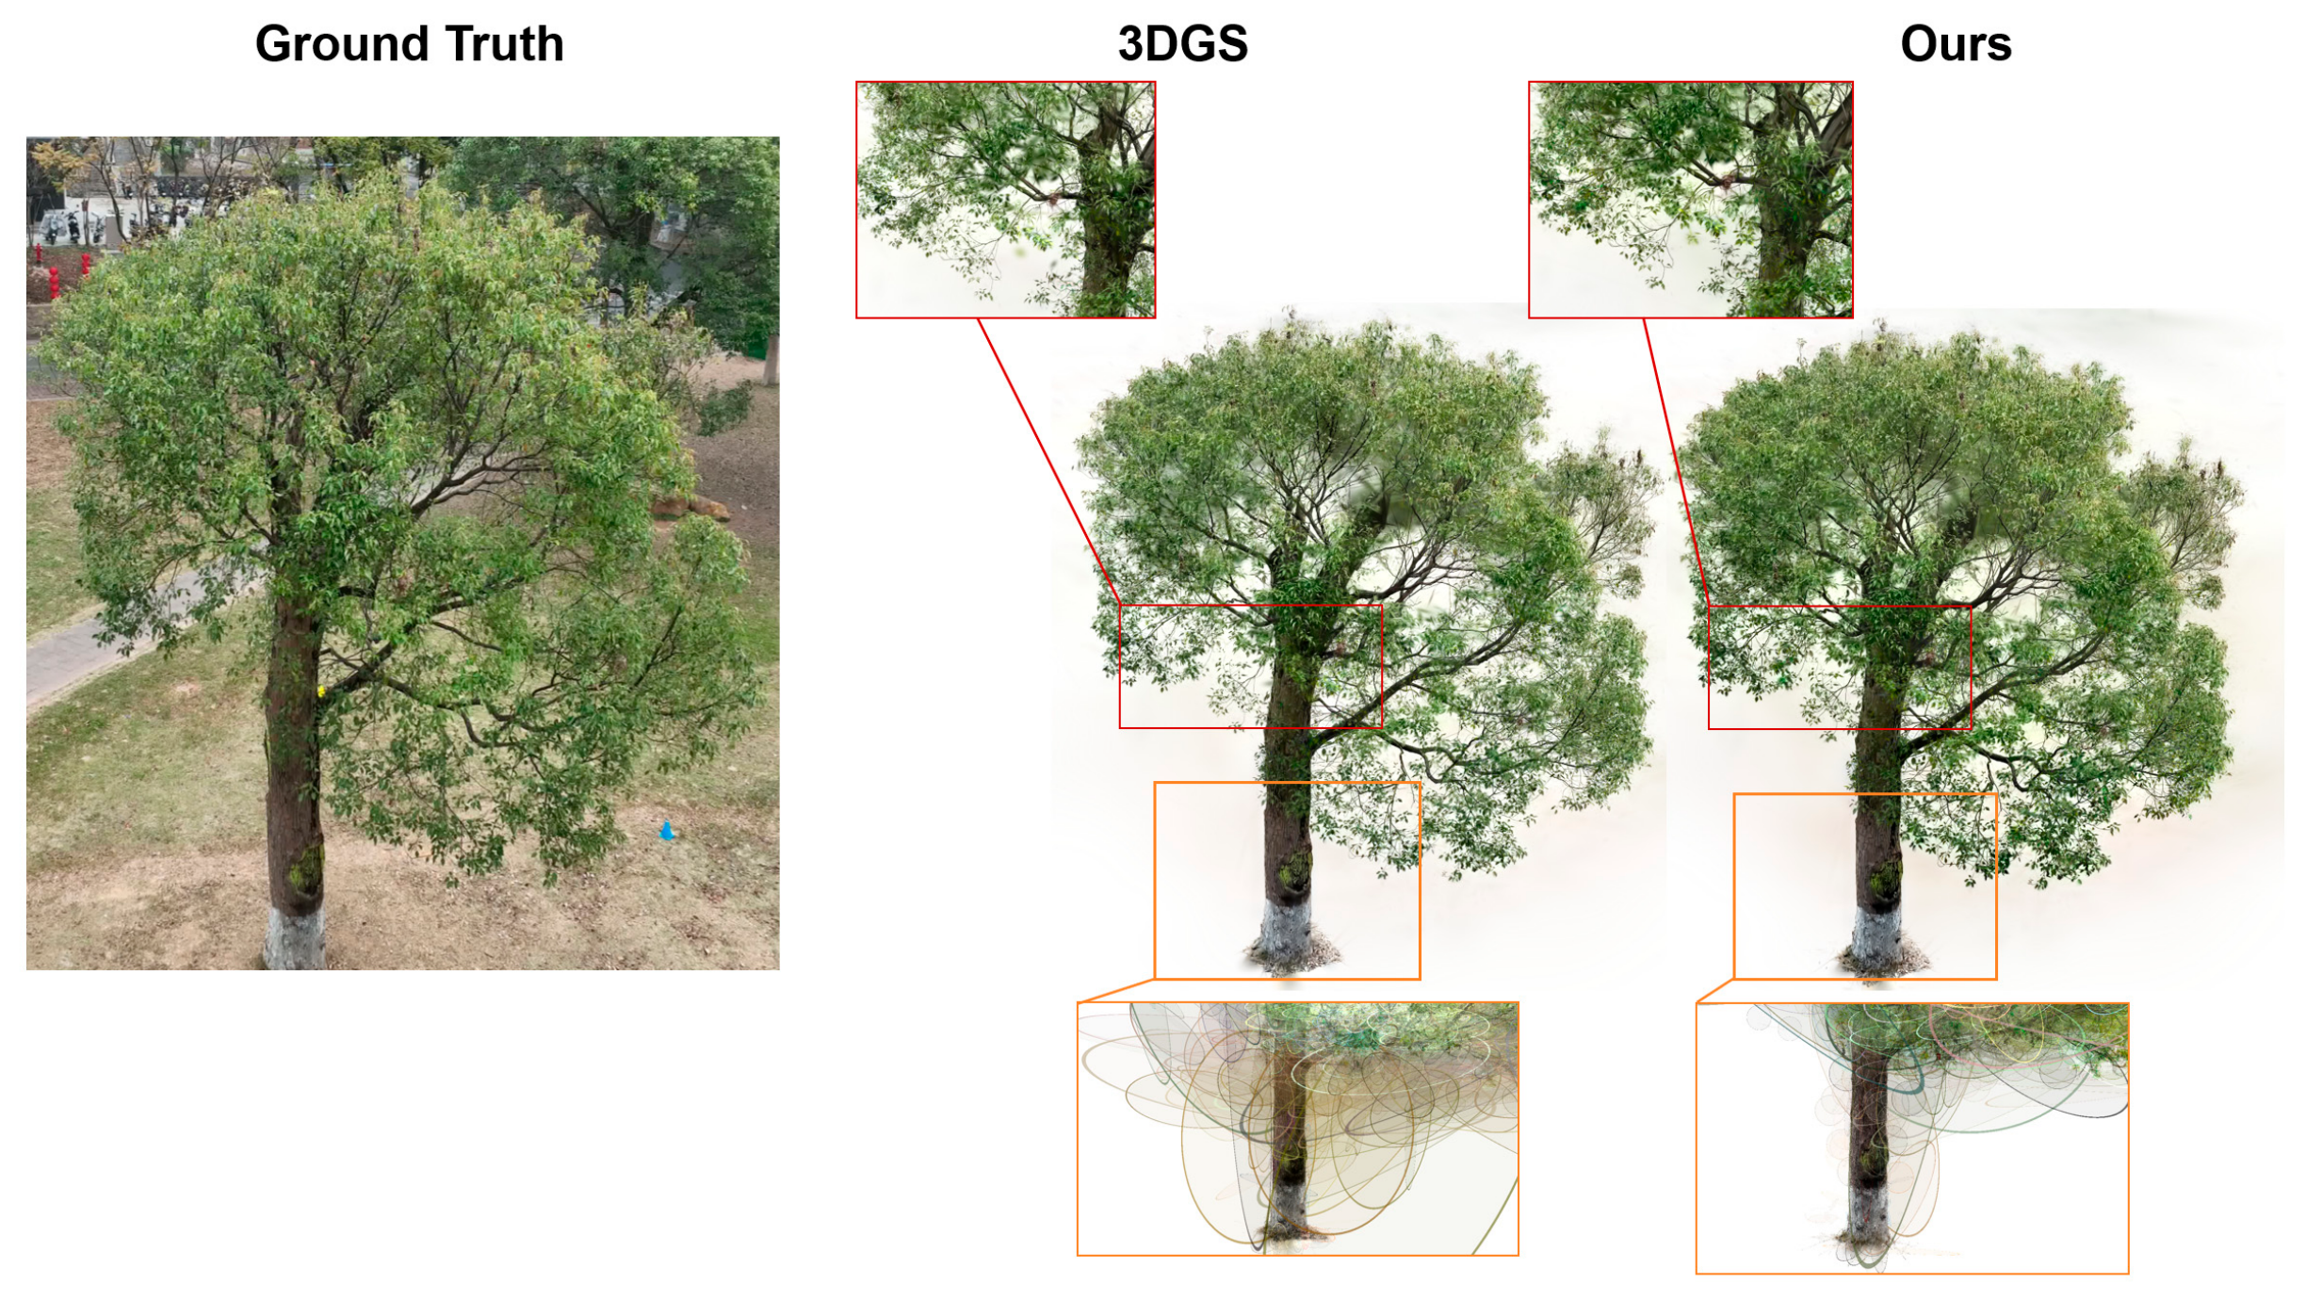
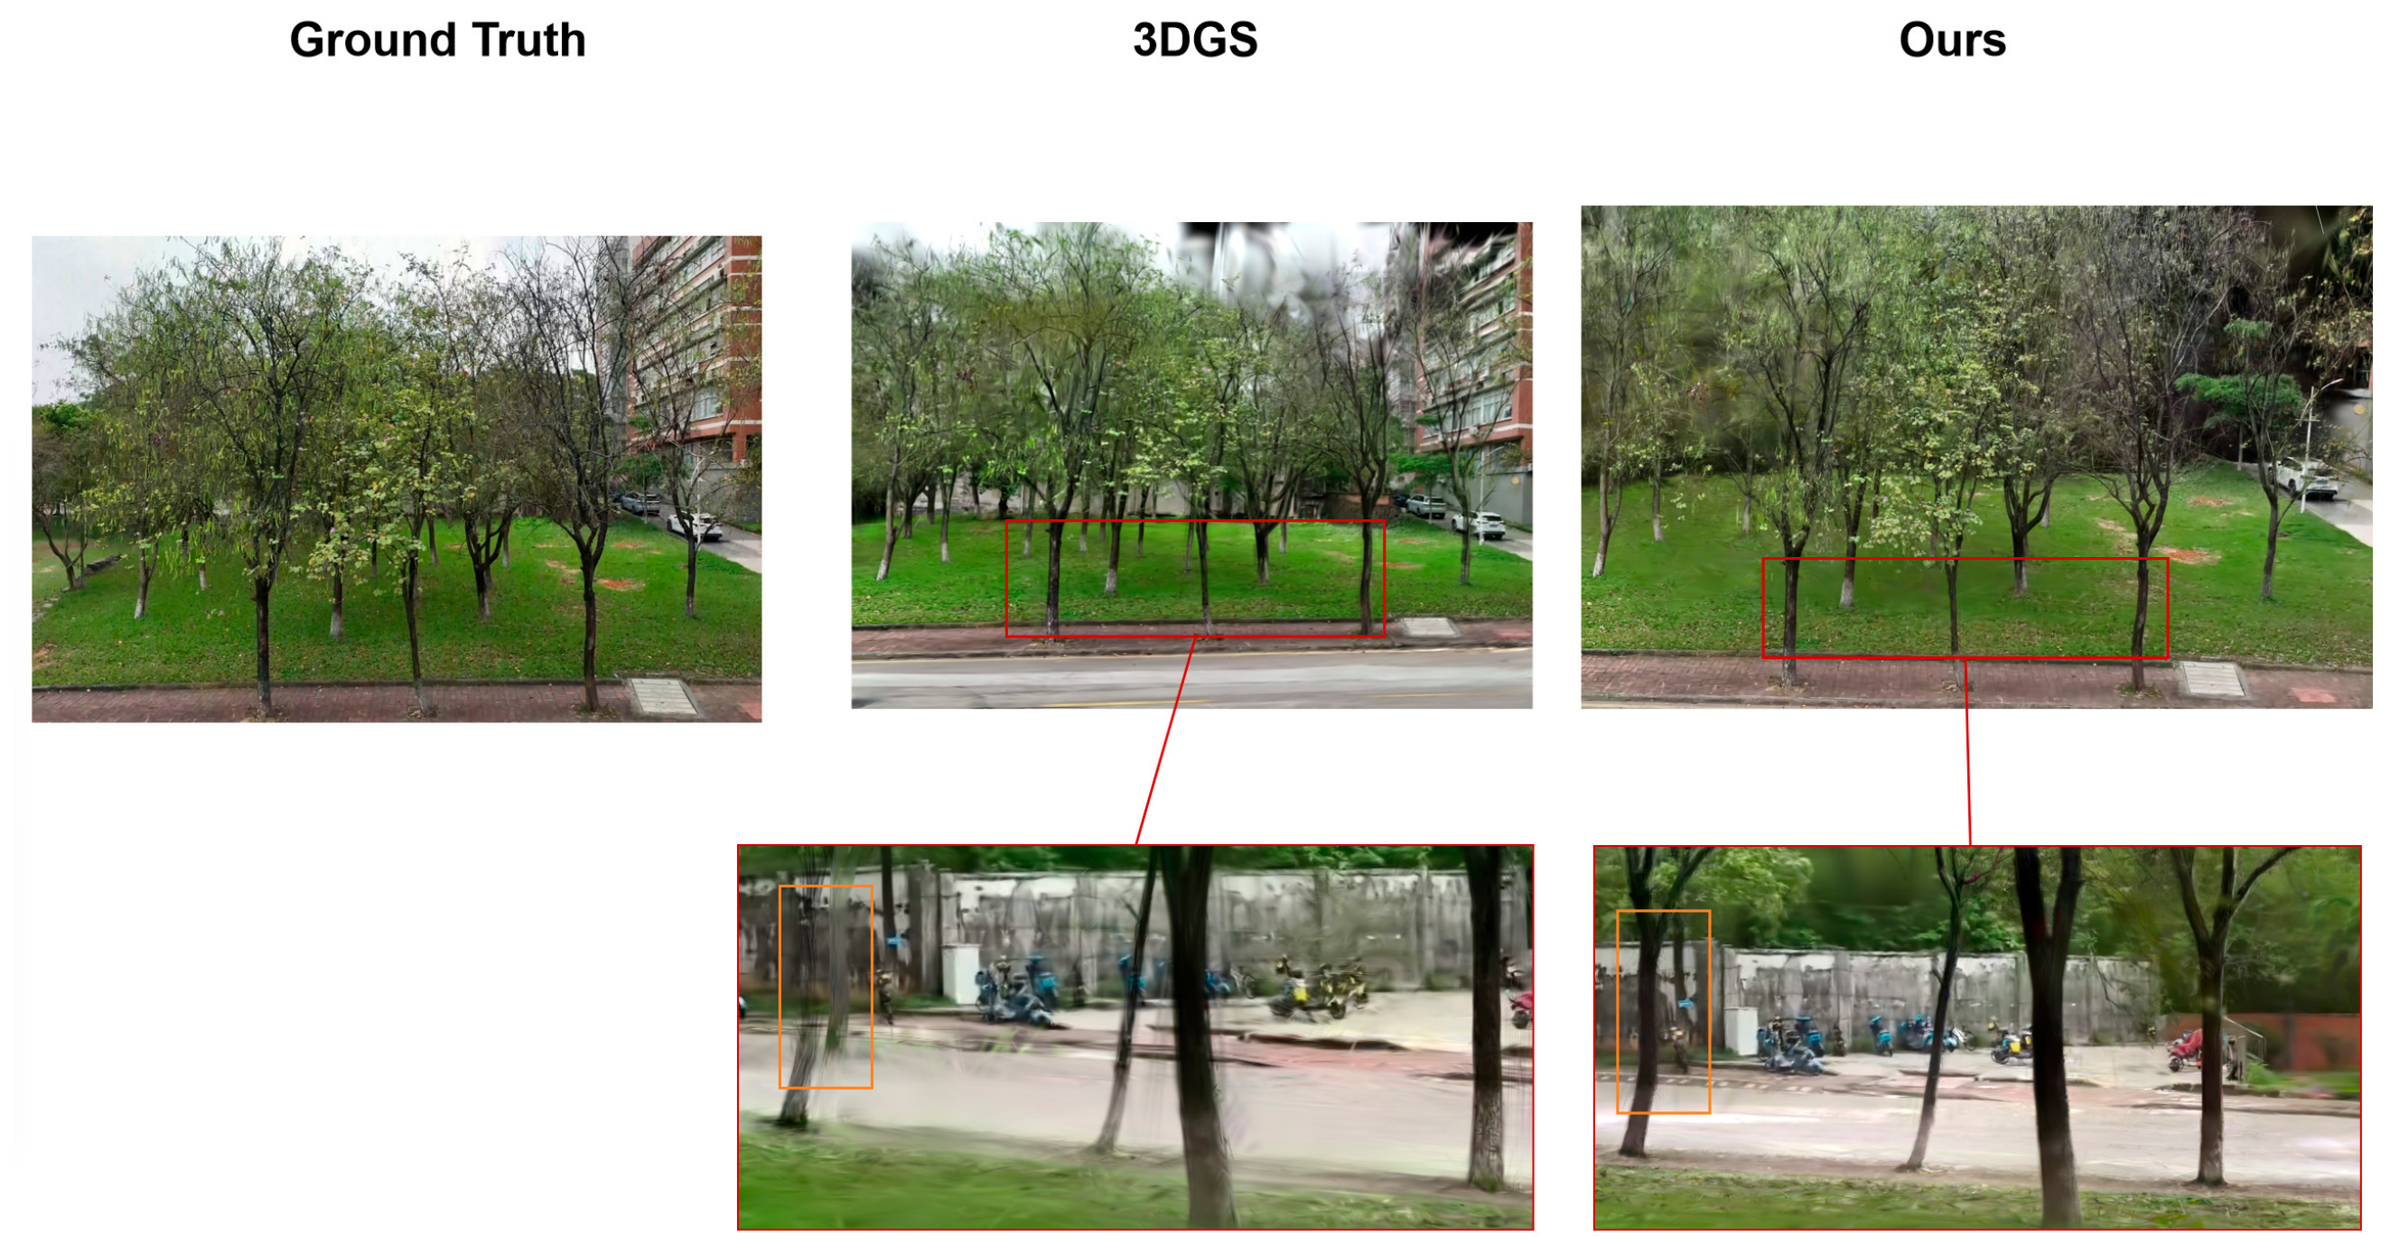
Beyond the macroscopic structure, the superiority of the semantic constraint strategy proposed in this paper is more prominent in the synthesis of fine-grained visual details, as shown in Figure 8, Figure 9 and Figure 10. The 3DGS baseline without explicit geometric anchors fails to converge correctly in the understory area, resulting in semi-transparent floating artifacts. In sharp contrast, our method reconstructs the trunk and clear leaf outlines with less volumetric noise. This visual evaluation result is strictly corroborated by the quantitative rendering metrics in Table 3. Across all three study plots, our method consistently achieves the best novel view synthesis quality, with an average PSNR of 24.94 dB, SSIM of 0.773, and LPIPS of 0.231, outperforming both the standard NeRF and baseline 3DGS methods. while maintaining training efficiency comparable to the standard 3DGS.

4.3. Quantitative Geometric Accuracy

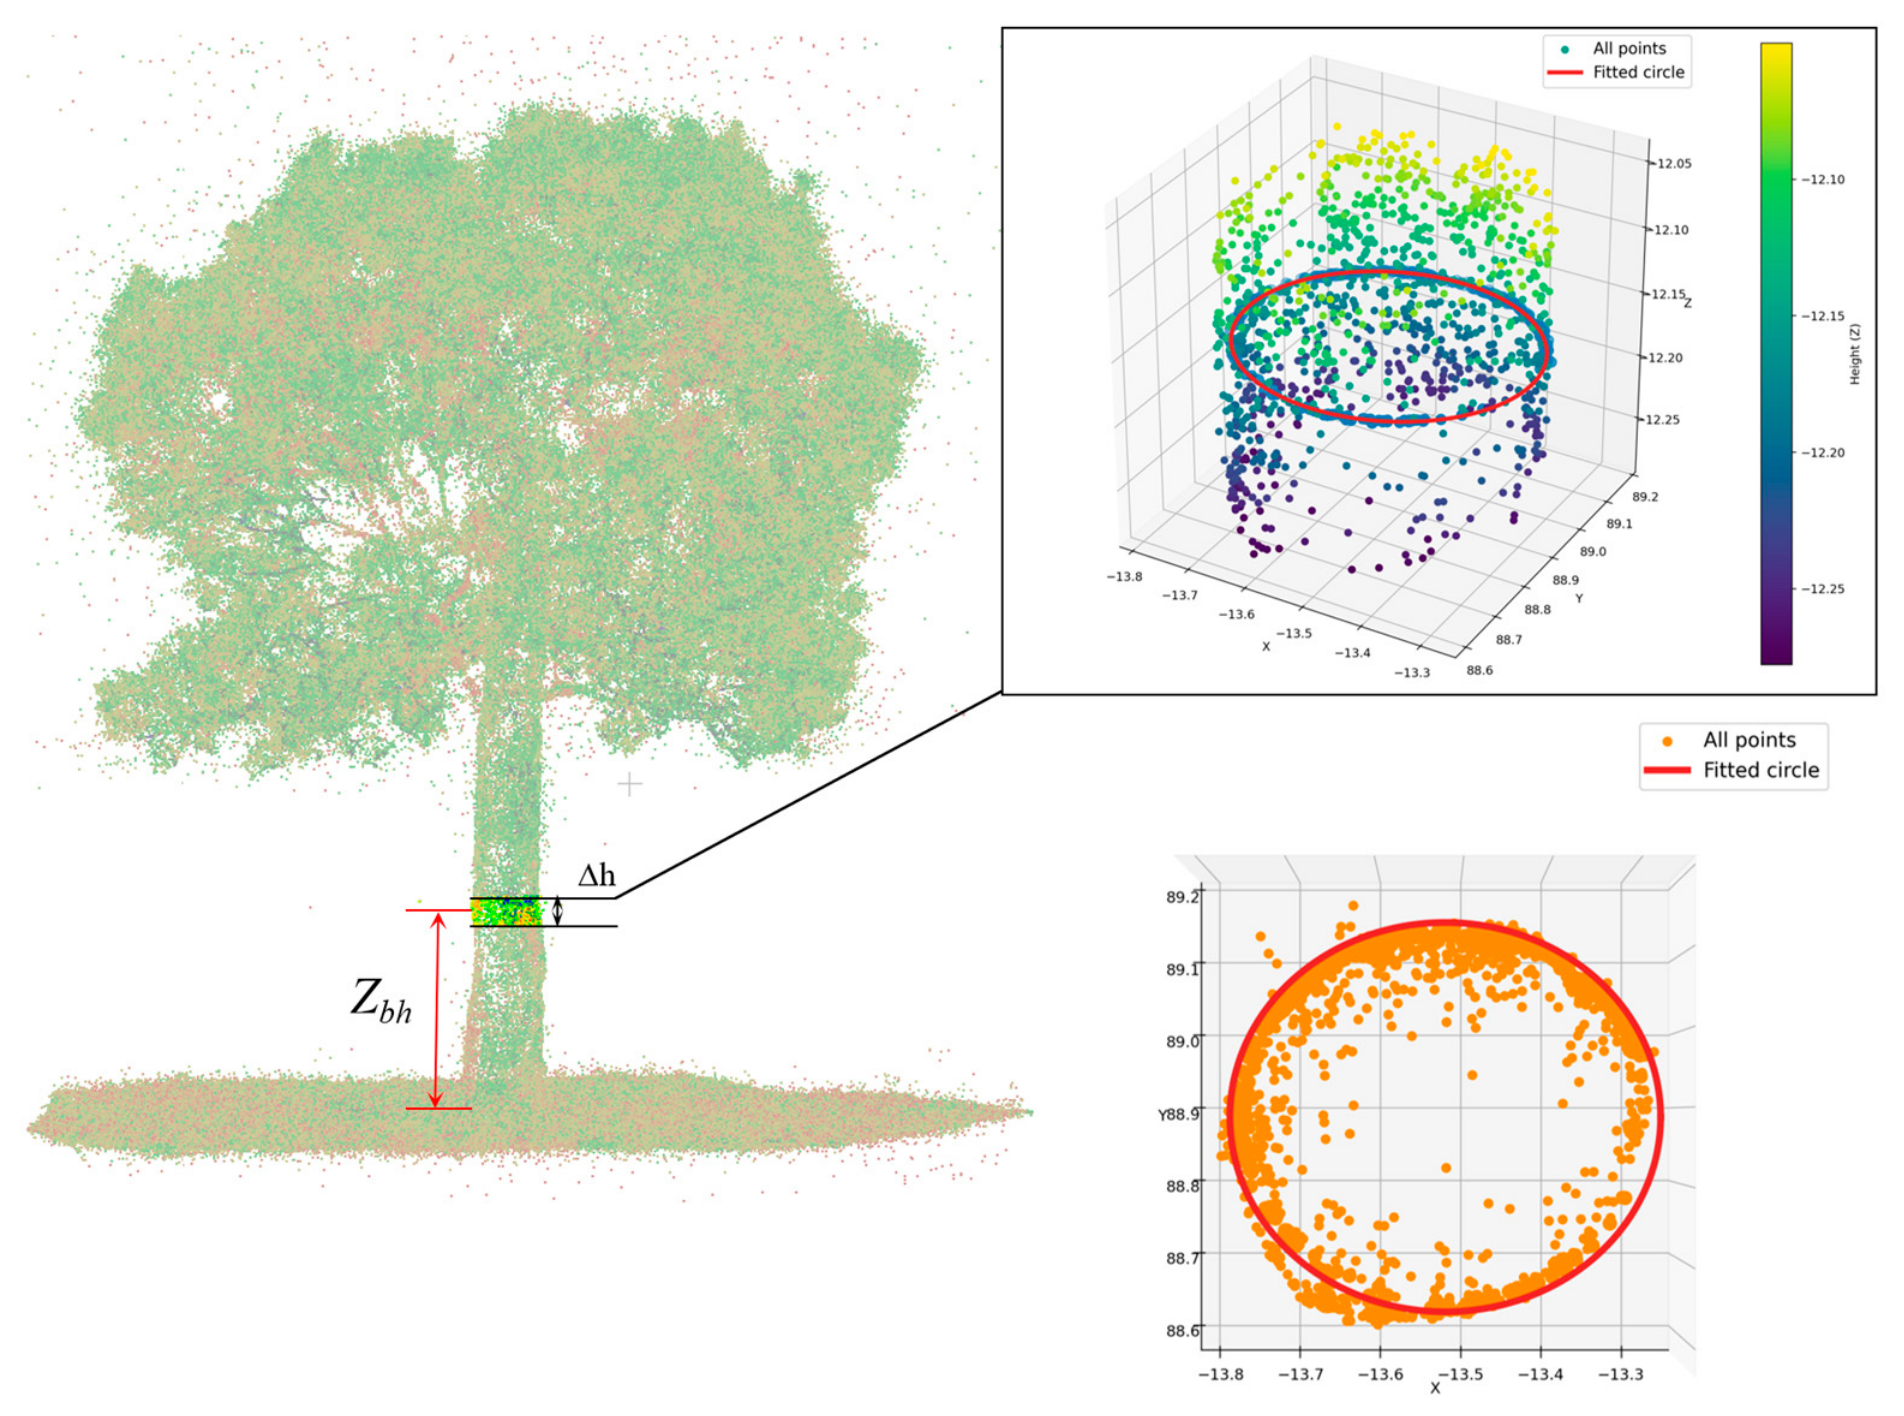
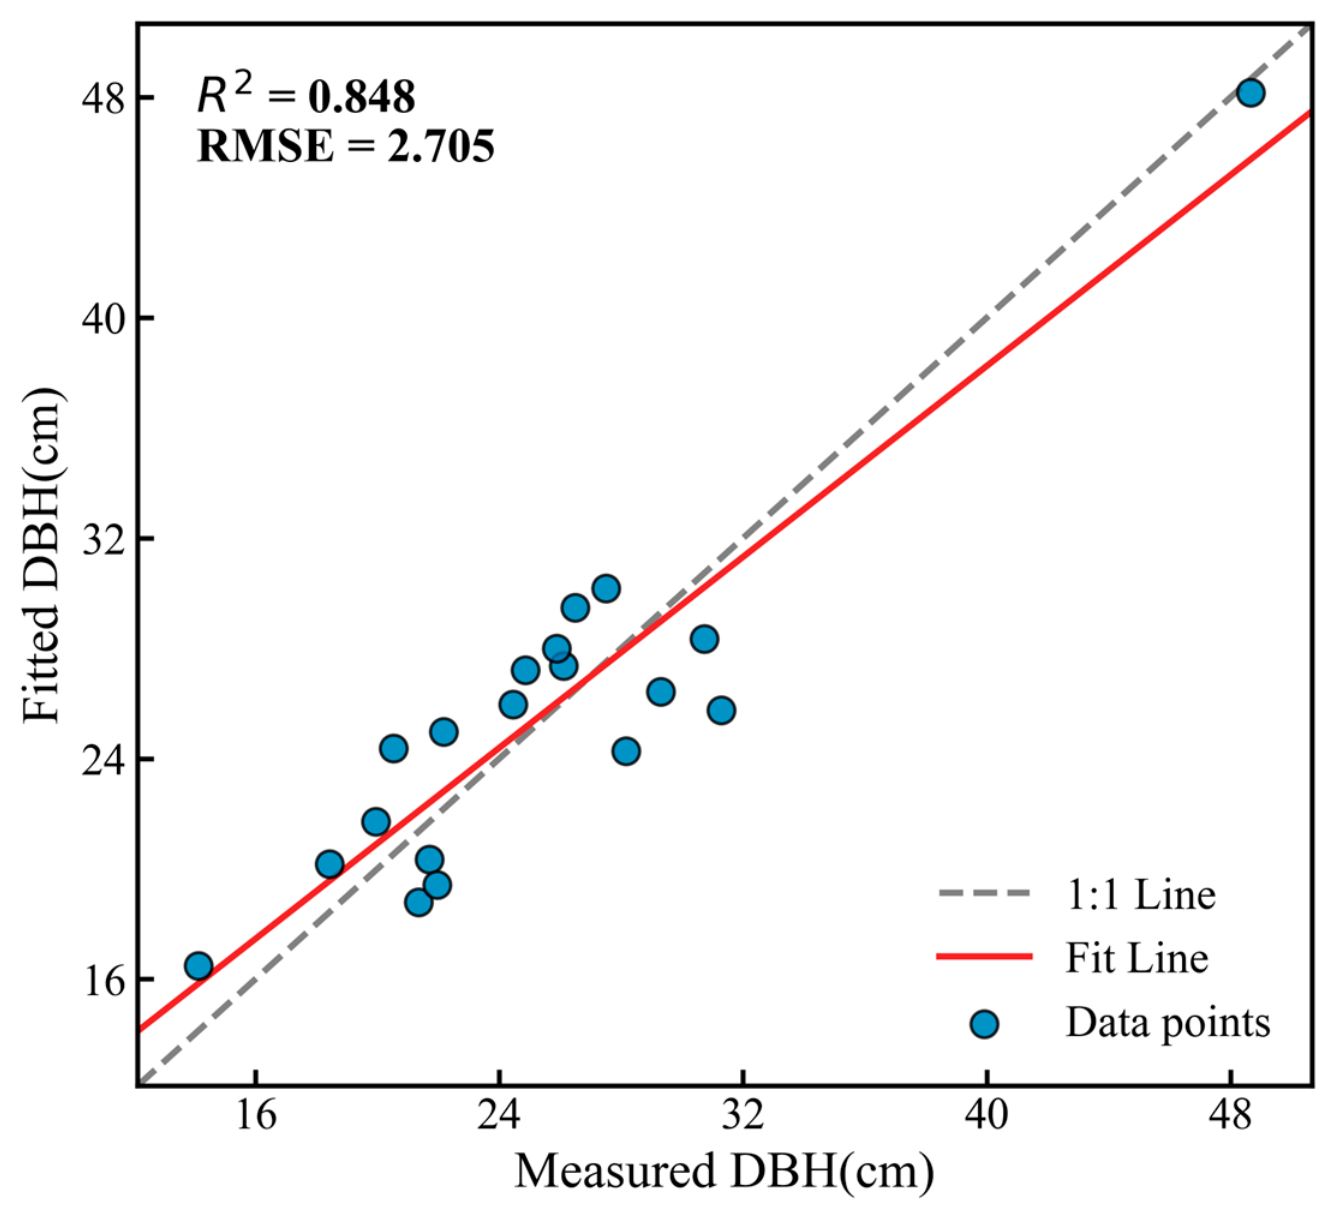
The diameter at breast height extraction results derived from the reconstructed 3DGS model are visualized in Figure 11. Meanwhile, Figure 12 presents the correlation scatter plot between DBH extracted via the aforementioned DBH fitting process and the ground truth measured by field tape in the field. The data points are highly clustered along the 1:1 reference line, demonstrating the high structural accuracy of our semantic-aware optimization strategy. Meanwhile, quantitative analysis shows that the average DBH extraction error is strictly constrained to approximately 2.705 cm. Through quantitative and qualitative verification of structural accuracy, the proposed method effectively alleviates the modality gap issue in cross-modal representation, and the generated 3D assets can serve as measurable physical digital twins for practical applications and research. The detailed DBH estimation results, including fitted values, field-measured ground truth, and relative errors for each individual tree, are listed in Table 4.
Table 4 compares the DBH estimates obtained by direct LiDAR fitting and the proposed method. As can be seen, direct LiDAR fitting yields smaller absolute errors on the majority of individual trees (17 out of 19), which is expected given that DBH is inherently a geometric measurement and LiDAR point clouds provide direct structural observations.
In particular, the visual optimization introduced by the proposed method may introduce a certain degree of perturbation to trunk geometry. In particular, in regions with lower point density or more severe occlusion (e.g., #5 and #6 in Plot 3), the DBH deviations of the reconstructed results tend to increase.
It should be noted that a small number of individual trees show relatively large relative errors, with the maximum reaching approximately ±18%. We conduct a critical analysis of these discrepancies as follows:
First, the core cause of these large errors is the small diameter and severe canopy occlusion. Specifically, the two samples with the largest errors (#4 and #5 in Plot 3) are small-diameter trees with DBH < 21 cm. For such samples, the tiny geometric deviation in the reconstruction process will be amplified into a large relative error due to the small diameter base.
Second, in terms of implications, although the relative error of these individual samples is relatively high, their absolute error is still controlled at the centimeter level. This means that the method still meets the basic requirements of forest inventory, as the absolute error of DBH measurement is far more important than the relative error for biomass and carbon stock estimation. In terms of limitations, this result reveals that the current framework still has room for improvement in processing small-diameter trees under severe occlusion. The unsupervised semantic segmentation pipeline may misclassify the occlusion boundary, leading to a slight deviation of the trunk point cloud slice.

4.4. Ablation Experiment

We conducted ablation experiments on Plot 1 to quantitatively verify the contribution of each module in the proposed framework, focusing on evaluating the roles of two core modules: LiDAR geometric anchor initialization and semantic-aware optimization. As shown in Table 5, the standard 3D Gaussian Splatting method, driven purely by vision, used as the baseline model, performs relatively poorly across all evaluation metrics. The core reason is that in complex canopy environments, passive photogrammetry itself suffers from geometric degradation and feature-matching failure issues.
After individually introducing the LiDAR initialization module, the rendering quality of the model is improved, with PSNR rising to 25.22 and SSIM rising to 0.769. This improvement demonstrates that active LiDAR scanning can enhance the modeling performance of understory areas, providing the model with robust physical scale priors and preventing the radiance field from converging to local optimal solutions with numerous artifacts. In particular, using the semantic optimization module alone is structurally infeasible, as the semantic–geometric loss mathematically relies on the absolute coordinates provided by LiDAR anchors.
The full algorithm pipeline that integrates both LiDAR priors and semantic optimization achieves the best photometric fidelity. More importantly, only under this dual-constraint mechanism can the framework realize physical quantity reconstruction. By adding specific regularization constraints to tree trunks, the semantic constraint can prevent the volume expansion of tree trunk Gaussian primitives, and the final model’s DBH estimation error is limited to 2.705 cm. The ablation experimental results fully demonstrate that the two modules proposed in this study not only have functional complementarity but also are essential components for integrating visual realism and structural accuracy in forest digital twin use cases. This confirms that our dual-constraint mechanism can simultaneously satisfy the two requirements of forest applications, rather than making a trade-off between them as previous methods did.

4.5. Parameter Sensitivity Analysis

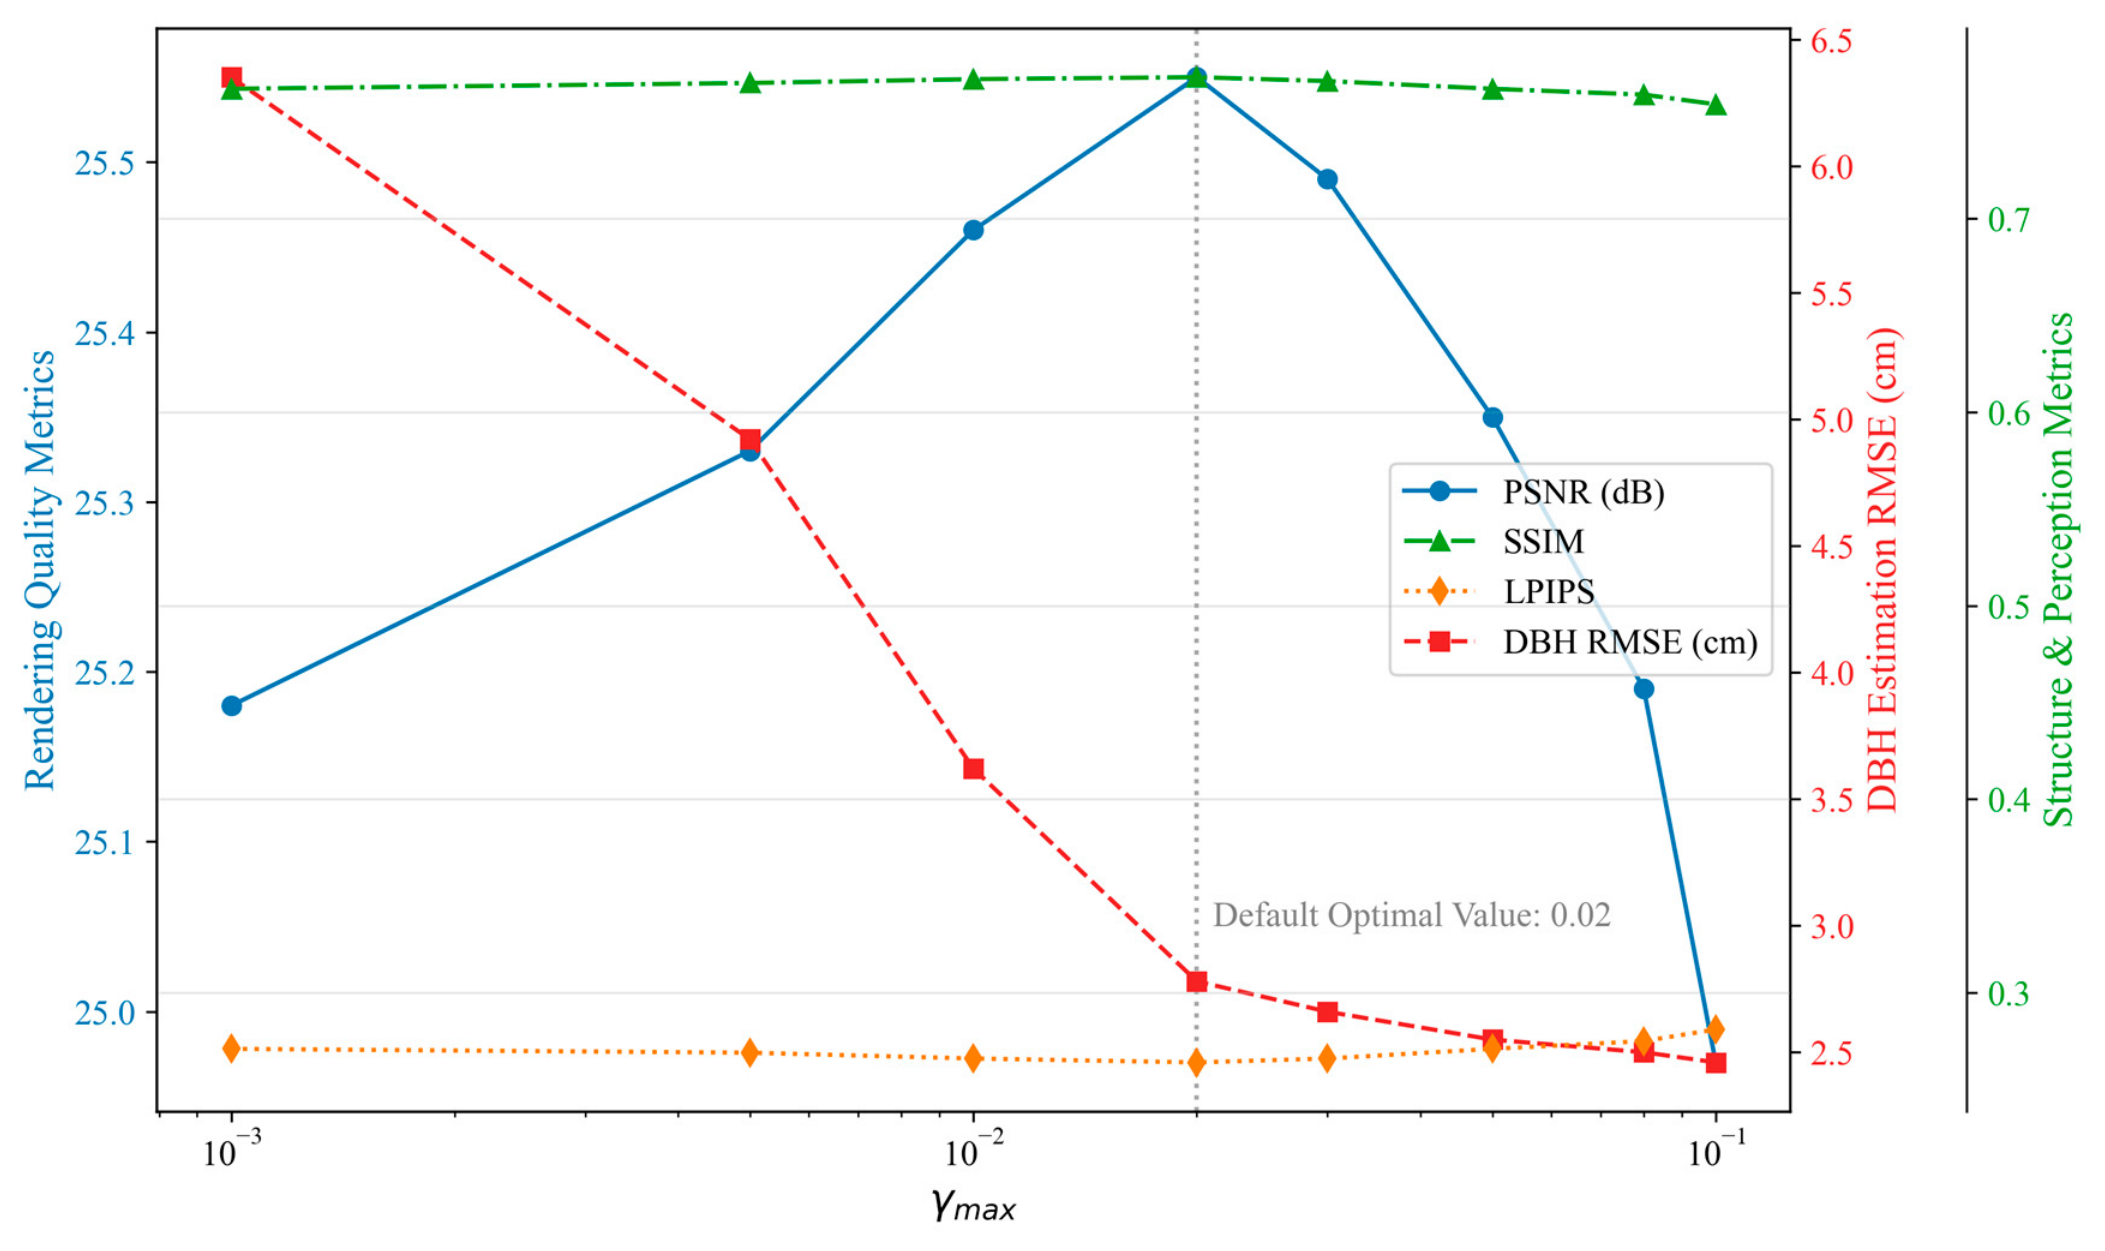
To verify the robustness of the core regularization parameter, we performed sensitivity analysis on the peak weight γ max of our semantic geometry regularization, evaluating its effects on rendering quality and geometric measurement accuracy (Figure 13).
The results reveal the following pattern for γ max : when set too low, the geometric constraint becomes insufficient, causing Gaussians in the trunk region to drift spatially under photometric loss, which increases DBH estimation error and degrades rendering quality. As γ max increases to 0.02, the model achieves optimal visual metrics while reducing DBH error to 2.705 cm—meeting forestry measurement standards. Beyond 0.02, the overly strong geometric constraint forces excessive prioritization of geometric alignment at the expense of canopy texture details, leading to degradation in rendering quality. Geometric accuracy simultaneously plateaus, with further increases in regularization weight yielding no additional measurement improvement.
These findings confirm γ max = 0.02 as the optimal configuration for our framework. The parameter maintains stable performance within the 0.01–0.03 range, demonstrating good robustness and allowing flexible trade-off adjustments for different application scenarios.

5. Discussion

This research aims to solve the problem of balancing structural accuracy and texture realism in the construction of forest digital twins. Our findings confirm that combining handheld SLAM LiDAR point clouds with UAV photography through a semantically constrained 3DGS framework can alleviate the problem of geometric drift in purely visual renderings. Taken together, these results demonstrate that semantically guided feature fusion is a feasible solution for generating high-fidelity forest digital twins in open-canopy forest environments, such as urban and campus forests.
When comparing with recent domain-specific 3DGS works for forest applications, our method has several characteristics. TreeDGS [32] focuses on single-tree DBH estimation from aerial imagery, while our framework supports stand-level reconstruction, including understory structures through multi-modal fusion of terrestrial LiDAR and UAV imagery. LI-GS [41] proposes a general LiDAR-guided 3DGS method for arbitrary scenes, but our work introduces forest-specific semantic constraints that effectively mitigate trunk volumetric inflation. ForestSplat [51] demonstrates the potential of purely visual 3DGS for forest mapping, but lacks the physical scale provided by LiDAR anchors, which is essential for quantitative forestry measurements.
The results demonstrate that the established model performs better. The average error for measuring DBH is kept at 2.705 cm. The relative error is 9.84%. We achieved this by converting LiDAR point clouds into geometric anchors for 3DGS initialization. We added a semantic constraint regularization method.
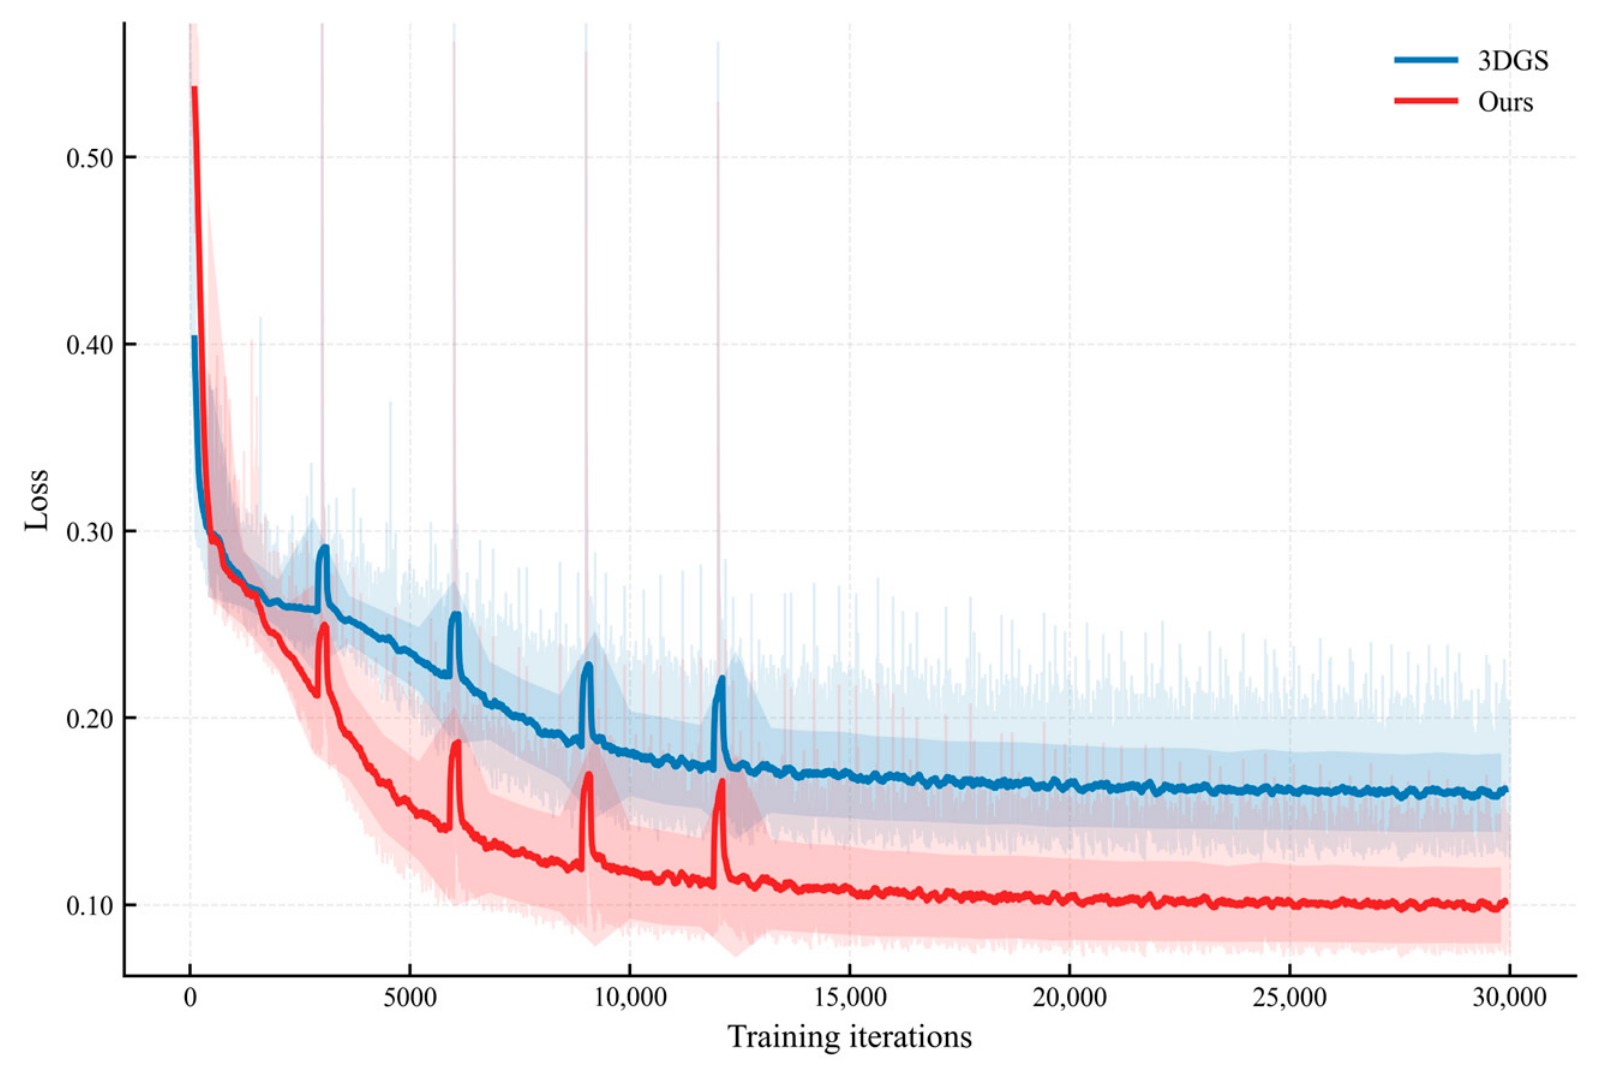
Forests feature severe canopy occlusion and complex understory environments, where vision-only optimized photometric loss suffers from significant performance degradation and tends to induce optimization bias, forcing the model to generate semi-transparent floating artifacts to maintain photometric consistency across multi-view 2D projections. The proposed method addresses this limitation by introducing a local density-aware target scale s target and a semantic geometric loss L geo , which penalizes the spatial drift of Gaussian primitives based on LiDAR spatial coordinates and effectively anchors trunk primitives. This method prevents unnecessary periodic growth of Gaussian primitives in the densification stage, as verified by the training curve in Figure 14: our LiDAR-guided method (red curve) achieves significantly faster convergence and a lower final loss than the baseline. Meanwhile, the DBH measurement benefits from the proposed opacity-weighted RANSAC fitting, which transforms conventional geometric fitting into a radiance field-aware robust optimization and mathematically suppresses fitting noise.
Recent neural rendering studies [51] have reported similar findings. Our experiments reveal that vanilla 3DGS struggles to reconstruct complex forest environments. This paper proves a new point. Our research validates that 3DGS is not merely a visual rendering tool for image synthesis, but also holds preliminary potential as a quantitative measurement tool for forestry research in open-canopy forest environments.
Neural rendering has recently received considerable attention in forestry 3D reconstruction. Tian et al. point out a problem [52]. Purely vision-based radiance field methods produce photorealistic images but lack an accurate physical scale, limiting their utility for precise 3D measurement. Our method addresses this limitation by incorporating LiDAR data as a geometric basis.
While recent methods such as TreeDGS improve the rendering quality and structural optimization of individual trees, our approach leverages multi-modal data to extend high-precision reconstruction from single trees to complex forest stands.
The main contribution of this study is the simultaneous achievement of clear visualization and accurate measurement in forest scenes: we develop a fusion method and an innovative optimization strategy that combine the advantages of UAV imagery and LiDAR point clouds, with our model both recovering clear tree details and maintaining a low level of error in trunk DBH measurement. This study demonstrates a key finding for 3D forest reconstruction: the semantic classification of tree components into trunks and leaves reduces blurry noise and artifacts in the computation process. The proposed framework has strong real-world applicability, as it enables automatic extraction of tree size parameters directly from the reconstructed 3D models to assist traditional time-consuming and labor-intensive manual field measurements, and provides a practical tool for modern precision forestry and forest carbon storage estimation.
Limitations. The current framework has several limitations. The unsupervised segmentation pipeline relies on both local geometric features and color clustering, so its effectiveness may decrease in dense natural forests where complex understory vegetation occludes trunk geometry and epiphytes blur color boundaries. Complex understory vegetation blocks trunk geometry in dense natural forests. Epiphytes blur color boundaries. The effectiveness of this pipeline might decrease in these environments. In the natural secondary forest test with a canopy density of 0.72, DBH estimated that the RMSE rose to 8.42 cm, which cannot meet the forestry measurement accuracy requirements. Our method builds on the assumption of static scenes. The model is sensitive to dynamic environmental changes. We carefully collected data under windless conditions. Slight leaf swaying is unavoidable in natural environments. This movement introduces local blur in canopy rendering. When the ambient wind speed reaches 3.7 m/s, the PSNR drops by 4.2 dB and obvious motion blur occurs.
Future work. Future research will focus on three main directions to solve these limitations. First, extending the validation scope from campus-level open-canopy forests to dense natural forests with complex multi-layered understory. This will require systematic experiments in diverse forest biomes—including tropical, subtropical, and boreal forests—where dense shrub layers, lianas, and epiphytes pose significant challenges to both LiDAR scanning completeness and unsupervised semantic segmentation accuracy. Second, future work aims to overcome the segmentation bottleneck. Researchers can integrate lightweight pre-trained 3D deep learning models (e.g., RandLA-Net [53]), which have demonstrated efficient semantic extraction on large-scale point clouds with minimal computational overhead. Since our framework already provides geometric anchor points that spatially register LiDAR and image data, these learned semantic features can be directly integrated into the existing optimization pipeline, reducing manual intervention while maintaining structural accuracy. Finally, developers can convert this workflow into an automated cloud-based digital twin platform. This conversion will accelerate its deployment in national forest inventories, where the metric-level DBH estimates derived from our reconstruction can directly feed into allometric models for above-ground biomass and carbon stock estimation [54]. Furthermore, the photorealistic texturing enabled by our method can provide policymakers with intuitive visual tools for carbon credit auditing and biodiversity conservation monitoring.

6. Conclusions

This study proposes a semantic-constrained 3D Gaussian Splatting framework for forest digital twins, achieving physically measurable 3D reconstruction through physics-semantics decoupled fusion of handheld SLAM LiDAR point clouds and UAV imagery while preserving visual realism.
Validation across three experimental plots demonstrates that the proposed method outperforms standard NeRF and baseline 3DGS in rendering quality (average PSNR of 24.94 dB, SSIM of 0.773). Moreover, tree monitoring metrics such as DBH can be extracted from the reconstructed models with an R2 = 0.848, achieving an RMSE of 2.705 cm, which satisfies the accuracy requirements for forestry surveys. These results substantiate a key insight: 3D Gaussian Splatting is not merely a visual rendering technique but also holds promise as a quantitative forestry measurement tool.
The primary contribution of this work lies in the proposed dual-constraint mechanism (LiDAR geometric anchor initialization + semantic regularization optimization), which enables the radiance field to directly leverage LiDAR priors as the physical scale reference rather than relying on implicit geometry estimation during iterative optimization. This approach mitigates geometric drift caused by feature matching failures in complex understory environments inherent to vision-only methods. Experimental results confirm the functional complementarity of the two modules: geometric anchors provide spatial positioning reference, while semantic constraints suppress voxel over-expansion in trunk regions. The synergistic effect of both components enables measurement accuracy and visual realism to be jointly satisfied within a unified framework.
The current method exhibits limited performance in natural stands with high canopy closure (RMSE for DBH estimation increases to 8.42 cm at canopy closure of 0.72) and relies on the static scene assumption. Future work will proceed in three directions: (1) extending validation from open-canopy stands such as urban and campus forests to tropical, subtropical, and boreal old-growth forests to assess robustness under complex multilayered understory vegetation; (2) incorporating lightweight 3D deep learning models (e.g., RandLA-Net) to improve the accuracy and automation of semantic segmentation; and (3) developing an automated cloud-based digital twin platform to integrate high-precision DBH estimation results directly into allometric growth models for aboveground biomass and carbon stock estimation, thereby providing technical support for national forest resource inventories and carbon sink accounting.

Author Contributions

Conceptualization, Z.Z. and Y.C.; Methodology, Z.Z. and Y.C.; Software, Z.Z. and Y.D.; Validation, Z.Z. and H.L.; Formal Analysis, X.Z. (Xuan Zheng) and Y.D.; Investigation, Z.Z. and H.L.; Resources, Y.C.; Data Curation, X.Z. (Xuan Zheng) and H.L.; Writing—Original Draft Preparation, Z.Z. and Z.L.; Writing—Review and Editing, Z.L. and Y.D.; Visualization, Z.Z. and H.L.; Supervision, Y.C. and X.Z. (Xiaolan Zhong); Project Administration, Y.C. and X.Z. (Xiaolan Zhong); Funding Acquisition, Y.C. All authors have read and agreed to the published version of the manuscript.

Funding

This research was funded by the Special Project of Bases and Talents of the Ministry of Science and Technology, grant number 2022xjkk1003.

Data Availability Statement

The raw data supporting the conclusions of this article will be made available by the authors on request.

Acknowledgments

The authors would like to express their gratitude to South China Agricultural University for providing the experimental facilities and research environment.

Conflicts of Interest

The authors declare no conflicts of interest.

References

  1. Mo, L.; Zohner, C.M.; Reich, P.B.; Liang, J.; De Miguel, S.; Nabuurs, G.-J.; Renner, S.S.; Van Den Hoogen, J.; Araza, A.; Herold, M.; et al. Integrated Global Assessment of the Natural Forest Carbon Potential. Nature 2023, 624, 92–101. [Google Scholar] [CrossRef] [PubMed]
  2. Pan, Y.; Birdsey, R.A.; Phillips, O.L.; Houghton, R.A.; Fang, J.; Kauppi, P.E.; Keith, H.; Kurz, W.A.; Ito, A.; Lewis, S.L.; et al. The Enduring World Forest Carbon Sink. Nature 2024, 631, 563–569. [Google Scholar] [CrossRef]
  3. Wang, W.; Deelen, T.V.; Wei, F.; Li, S.; Wang, L. Anthropogenic Habitat Loss and Fragmentation May Alter Coevolutionary Progress as Examined in a Brood Parasitism Model. Ecol. Evol. 2025, 15, e71721. [Google Scholar] [CrossRef] [PubMed]
  4. Tagarakis, A.C.; Benos, L.; Kyriakarakos, G.; Pearson, S.; Sørensen, C.G.; Bochtis, D. Digital Twins in Agriculture and Forestry: A Review. Sensors 2024, 24, 3117. [Google Scholar] [CrossRef]
  5. Gomes, P.P.; Cardoso, T. AI-Driven Wildfire Prediction and Response in Portugal. In Advances in Environmental Engineering and Green Technologies; Tariq, M.U., Sergio, R.P., Eds.; IGI Global: Hershey, PA, USA, 2025; pp. 115–144. [Google Scholar]
  6. Terryn, L.; Calders, K.; Meunier, F.; Bauters, M.; Boeckx, P.; Brede, B.; Burt, A.; Chave, J.; Da Costa, A.C.L.; D’hont, B.; et al. New Tree Height Allometries Derived from Terrestrial Laser Scanning Reveal Substantial Discrepancies with Forest Inventory Methods in Tropical Rainforests. Glob. Change Biol. 2024, 30, e17473. [Google Scholar] [CrossRef]
  7. Barros, A.P. Digital Twin Earth: The next-Generation Earth Information System. Front. Sci. 2024, 2, 1383659. [Google Scholar] [CrossRef]
  8. Chen, Z.; Lin, Z.; Shi, T.; Deng, D.; Chen, Y.; Pan, X.; Chen, X.; Wu, T.; Lei, J.; Li, Y. Advancing Forest Inventory in Tropical Rainforests: A Multi-Source LiDAR Approach for Accurate 3D Tree Modeling and Volume Estimation. Remote Sens. 2025, 17, 3030. [Google Scholar] [CrossRef]
  9. Simonetti, A.; Araujo, R.F.; Celes, C.H.S.; Da Silva E Silva, F.R.; Dos Santos, J.; Higuchi, N.; Trumbore, S.; Magnabosco Marra, D. Canopy Gaps and Associated Losses of Biomass—Combining UAV Imagery and Field Data in a Central Amazon Forest. Biogeosciences 2023, 20, 3651–3666. [Google Scholar] [CrossRef]
  10. Bartolomei, L.; Teixeira, L.; Chli, M. Fast Multi-UAV Decentralized Exploration of Forests. IEEE Robot. Autom. Lett. 2023, 8, 5576–5583. [Google Scholar] [CrossRef]
  11. Kussul, N.; Giuliani, G.; Shelestov, A.; Cherniatevych, A.; Drozd, S.; Kolotii, A.; Salii, Y.; Yavorskyi, O.; Malyniak, V.; Lavreniuk, A.; et al. AI-Powered Digital Twin Framework for Land Use Change in Disaster Affected Regions. IEEE J. Sel. Top. Appl. Earth Obs. Remote Sens. 2025, 18, 27473–27492. [Google Scholar] [CrossRef]
  12. Chen, Y.; Zhang, S.; Sun, Q.; Xiong, H.; Zhang, W. Under-Canopy UAV Global Path Planning for Tree DBH Estimation Using LiDAR. Int. Arch. Photogramm. Remote Sens. Spat. Inf. Sci. 2025, 48, 55–61. [Google Scholar] [CrossRef]
  13. Wang, W.; Lu, B.; Wu, C.H. Cost-Effective Drone Monitoring and Evaluating Toolkits for Stream Habitat Health: Development and Application. Environ. Monit. Assess. 2025, 198, 10. [Google Scholar] [CrossRef] [PubMed]
  14. Liang, X.; Liu, G.; Dou, X. Under-Canopy UAV Solutions for Forest Inventory—Challenges and Opportunities. Int. Arch. Photogramm. Remote Sens. Spat. Inf. Sci. 2025, 48, 183–188. [Google Scholar] [CrossRef]
  15. Karjalainen, V.; Koivumäki, N.; Hakala, T.; Muhojoki, J.; Hyyppä, E.; George, A.; Suomalainen, J.; Honkavaara, E. Towards Autonomous Photogrammetric Forest Inventory Using a Lightweight Under-Canopy Robotic Drone. Int. J. Remote Sens. 2026, 47, 62–96. [Google Scholar] [CrossRef]
  16. Schonberger, J.L.; Frahm, J.-M. Structure-from-Motion Revisited. In Proceedings of the 2016 IEEE Conference on Computer Vision and Pattern Recognition (CVPR); IEEE: Las Vegas, NV, USA, 2016; pp. 4104–4113. [Google Scholar]
  17. Yao, Y.; Luo, Z.; Li, S.; Fang, T.; Quan, L. MVSNet: Depth Inference for Unstructured Multi-View Stereo. In Computer Vision—ECCV 2018; Ferrari, V., Hebert, M., Sminchisescu, C., Weiss, Y., Eds.; Lecture Notes in Computer Science; Springer International Publishing: Cham, Switzerland, 2018; Volume 11212, pp. 785–801. [Google Scholar]
  18. Iglhaut, J.; Cabo, C.; Puliti, S.; Piermattei, L.; O’Connor, J.; Rosette, J. Structure from Motion Photogrammetry in Forestry: A Review. Curr. For. Rep. 2019, 5, 155–168. [Google Scholar] [CrossRef]
  19. Yan, F.; Guan, T.; Ullah, M.R.; Gao, L.; Fan, Y. A Precise Forest Spatial Structure Investigation Using the SLAM+AR Technology. Front. Ecol. Evol. 2023, 11, 1152955. [Google Scholar] [CrossRef]
  20. Shen, P.; Jing, X.; Deng, W.; Jia, H.; Wu, T. PlantGaussian: Exploring 3D Gaussian Splatting for Cross-Time, Cross-Scene, and Realistic 3D Plant Visualization and Beyond. Crop J. 2025, 13, 607–618. [Google Scholar] [CrossRef]
  21. García-Pascual, B.; Martín-Cortés, C.; Zhou, X.; Lopatin, E.; Acuna, M.; Kärhä, K. Tree Stem Diameter Estimation Using Inexpensive UAV Photogrammetric Data and Monte Carlo Methods. ISPRS Ann. Photogramm. Remote Sens. Spat. Inf. Sci. 2025, 10, 49–56. [Google Scholar] [CrossRef]
  22. Mildenhall, B.; Srinivasan, P.P.; Tancik, M.; Barron, J.T.; Ramamoorthi, R.; Ng, R. NeRF: Representing Scenes as Neural Radiance Fields for View Synthesis. In Computer Vision—ECCV 2020; Vedaldi, A., Bischof, H., Brox, T., Frahm, J.-M., Eds.; Lecture Notes in Computer Science; Springer International Publishing: Cham, Switzerland, 2020; Volume 12346, pp. 405–421. [Google Scholar]
  23. Kerbl, B.; Kopanas, G.; Leimkuehler, T.; Drettakis, G. 3D Gaussian Splatting for Real-Time Radiance Field Rendering. ACM Trans. Graph. 2023, 42, 1–14. [Google Scholar] [CrossRef]
  24. Wang, W.; Wang, Z.; Wang, Z.; Liu, S.; Liu, M.; She, J.; Zhang, S.; Han, J.; Guan, Y.; Zhou, W.; et al. SAGStree: A High-Performance and Highly Realistic 3-D Tree Componentization Method Based on 3DGS. IEEE Trans. Geosci. Remote Sens. 2025, 63, 1–17. [Google Scholar] [CrossRef]
  25. Ojo, T.; La, T.; Morton, A.; Stavness, I. Splanting: 3D Plant Capture with Gaussian Splatting. In Proceedings of the SIGGRAPH Asia 2024 Technical Communications; ACM: Tokyo, Japan, 2024; pp. 1–4. [Google Scholar]
  26. Petrovska, I.; Jutzi, B. Seeing beyond Vegetation: A Comparative Occlusion Analysis between Multi-View Stereo, Neural Radiance Fields and Gaussian Splatting for 3D Reconstruction. ISPRS Open J. Photogramm. Remote Sens. 2025, 16, 100089. [Google Scholar] [CrossRef]
  27. Stuart, L.A.G.; Wells, D.M.; Atkinson, J.A.; Castle-Green, S.; Walker, J.; Pound, M.P. High-Fidelity Wheat Plant Reconstruction Using 3D Gaussian Splatting and Neural Radiance Fields. GigaScience 2025, 14, giaf022. [Google Scholar] [CrossRef]
  28. Ju, Y.; Zhao, Y.; Xiao, J.; Zhang, C.; Jiang, Z.; Zhou, H.; Zhou, W.; Yu, H.; Dong, J. Photometric Regularization for 3D Gaussian Splatting in Multi-View Surface Projection. IEEE J. Sel. Top. Signal Process. 2025, 19, 1682–1693. [Google Scholar] [CrossRef]
  29. Turkulainen, M.; Ren, X.; Melekhov, I.; Seiskari, O.; Rahtu, E.; Kannala, J. DN-Splatter: Depth and Normal Priors for Gaussian Splatting and Meshing. In Proceedings of the 2025 IEEE/CVF Winter Conference on Applications of Computer Vision (WACV); IEEE: Tucson, AZ, USA, 2025; pp. 2421–2431. [Google Scholar]
  30. Yan, C.; Qu, D.; Xu, D.; Zhao, B.; Wang, Z.; Wang, D.; Li, X. GS-SLAM: Dense Visual SLAM with 3D Gaussian Splatting. In Proceedings of the 2024 IEEE/CVF Conference on Computer Vision and Pattern Recognition (CVPR); IEEE: Seattle, WA, USA, 2024; pp. 19595–19604. [Google Scholar]
  31. Jiang, L.; Li, C.; Sun, J.; Chee, P.; Fu, L. Estimation of Cotton Boll Number and Main Stem Length Based on 3D Gaussian Splatting. In Proceedings of the 2024 Anaheim, CA, USA, 28–31 July 2024; American Society of Agricultural and Biological Engineers: St. Joseph, MI, USA, 2024. [Google Scholar]
  32. Shaheen, B.; Nguyen, M.-H.; Bui, B.-T.; Shubham; Wu, T.; Fairley, M.; Zane, M.; Wu, M.; Tompkin, J. TreeDGS: Aerial Gaussian Splatting for Distant DBH Measurement. Remote Sens. 2026, 18, 867. [Google Scholar] [CrossRef]
  33. Hyyppä, E.; Kukko, A.; Kaartinen, H.; Yu, X.; Muhojoki, J.; Hakala, T.; Hyyppä, J. Direct and Automatic Measurements of Stem Curve and Volume Using a High-Resolution Airborne Laser Scanning System. Sci. Remote Sens. 2022, 5, 100050. [Google Scholar] [CrossRef]
  34. Chen, S.; Verbeeck, H.; Terryn, L.; Van Den Broeck, W.A.J.; Vicari, M.B.; Disney, M.; Origo, N.; Wang, D.; Xi, Z.; Hopkinson, C.; et al. The Impact of Leaf-Wood Separation Algorithms on Aboveground Biomass Estimation from Terrestrial Laser Scanning. Remote Sens. Environ. 2025, 318, 114581. [Google Scholar] [CrossRef]
  35. Qiu, H.; Zhang, H.; Lei, K.; Zhang, H.; Hu, X. Forest Digital Twin: A New Tool for Forest Management Practices Based on Spatio-Temporal Data, 3D Simulation Engine, and Intelligent Interactive Environment. Comput. Electron. Agric. 2023, 215, 108416. [Google Scholar] [CrossRef]
  36. Ye, N.; Van Leeuwen, L.; Nyktas, P. Analysing the Potential of UAV Point Cloud as Input in Quantitative Structure Modelling for Assessment of Woody Biomass of Single Trees. Int. J. Appl. Earth Obs. Geoinf. 2019, 81, 47–57. [Google Scholar] [CrossRef]
  37. Du, S.; Lindenbergh, R.; Ledoux, H.; Stoter, J.; Nan, L. AdTree: Accurate, Detailed, and Automatic Modelling of Laser-Scanned Trees. Remote Sens. 2019, 11, 2074. [Google Scholar] [CrossRef]
  38. Raumonen, P.; Kaasalainen, M.; Åkerblom, M.; Kaasalainen, S.; Kaartinen, H.; Vastaranta, M.; Holopainen, M.; Disney, M.; Lewis, P. Fast Automatic Precision Tree Models from Terrestrial Laser Scanner Data. Remote Sens. 2013, 5, 491–520. [Google Scholar] [CrossRef]
  39. Cimdins, R.; Yrttimaa, T.; Vastaranta, M.; Kankare, V. Assessing Forest Structural Complexity: Insights from Alternative Laser Scanning Approaches. Scand. J. For. Res. 2026, 41, 40–53. [Google Scholar] [CrossRef]
  40. Ammatelli, J.H.; Gutmann, E.D.; Bush, S.A.; Barnard, H.R.; Ciruzzi, D.M.; Loheide, S.P.; Raleigh, M.S.; Lundquist, J.D. Measuring Tree Sway Frequency with Videos for Ecohydrologic Applications: Assessing the Efficacy of Eulerian Processing Algorithms. Agric. For. Meteorol. 2025, 373, 110751. [Google Scholar] [CrossRef]
  41. Jiang, C.; Gao, R.; Shao, K.; Wang, Y.; Xiong, R.; Zhang, Y. LI-GS: Gaussian Splatting with LiDAR Incorporated for Accurate Large-Scale Reconstruction. IEEE Robot. Autom. Lett. 2025, 10, 1864–1871. [Google Scholar] [CrossRef]
  42. Campos, M.B.; Castanheiro, L.F.; Shah, D.; Wang, Y.; Kukko, A.; Puttonen, E. Overview and Benchmark on Multi-Modal Lidar Point Cloud Registration for Forest Applications. Int. Arch. Photogramm. Remote Sens. Spat. Inf. Sci. 2024, 48, 43–50. [Google Scholar] [CrossRef]
  43. Zhang, Y.; Wu, J.; Yang, Z.; Deng, K. A Coarse-to-Fine DLG and TLS Data Registration Method. IEEE J. Sel. Top. Appl. Earth Obs. Remote Sens. 2023, 16, 3506–3518. [Google Scholar] [CrossRef]
  44. Young, T.J.; Jubery, T.Z.; Carley, C.N.; Carroll, M.; Sarkar, S.; Singh, A.K.; Singh, A.; Ganapathysubramanian, B. “Canopy Fingerprints” for Characterizing Three-Dimensional Point Cloud Data of Soybean Canopies. Front. Plant Sci. 2023, 14, 1141153. [Google Scholar] [CrossRef]
  45. Sun, J.; Wang, P.; Gao, Z.; Liu, Z.; Li, Y.; Gan, X.; Liu, Z. Wood–Leaf Classification of Tree Point Cloud Based on Intensity and Geometric Information. Remote Sens. 2021, 13, 4050. [Google Scholar] [CrossRef]
  46. Guédon, A.; Lepetit, V. SuGaR: Surface-Aligned Gaussian Splatting for Efficient 3D Mesh Reconstruction and High-Quality Mesh Rendering. In Proceedings of the 2024 IEEE/CVF Conference on Computer Vision and Pattern Recognition (CVPR); IEEE: Seattle, WA, USA, 2024; pp. 5354–5363. [Google Scholar]
  47. Sheng, Y.; Zhao, Q.; Wang, X.; Liu, Y.; Yin, X. Tree Diameter at Breast Height Extraction Based on Mobile Laser Scanning Point Cloud. Forests 2024, 15, 590. [Google Scholar] [CrossRef]
  48. Zhang, R.; Isola, P.; Efros, A.A.; Shechtman, E.; Wang, O. The Unreasonable Effectiveness of Deep Features as a Perceptual Metric. In Proceedings of the 2018 IEEE/CVF Conference on Computer Vision and Pattern Recognition; IEEE: Salt Lake City, UT, USA, 2018; pp. 586–595. [Google Scholar]
  49. Hore, A.; Ziou, D. Image Quality Metrics: PSNR vs. SSIM. In Proceedings of the 2010 20th International Conference on Pattern Recognition; IEEE: Istanbul, Turkey, 2010; pp. 2366–2369. [Google Scholar]
  50. Wang, Z.; Bovik, A.C.; Sheikh, H.R.; Simoncelli, E.P. Image Quality Assessment: From Error Visibility to Structural Similarity. IEEE Trans. Image Process. 2004, 13, 600–612. [Google Scholar] [CrossRef]
  51. Shaheen, B.; Zane, M.D.; Bui, B.-T.; Shubham; Huang, T.; Merello, M.; Scheelk, B.; Crooks, S.; Wu, M. ForestSplat: Proof-of-Concept for a Scalable and High-Fidelity Forestry Mapping Tool Using 3D Gaussian Splatting. Remote Sens. 2025, 17, 993. [Google Scholar] [CrossRef]
  52. Tian, G.; Chen, C.; Huang, H. Comparative Analysis of Novel View Synthesis and Photogrammetry for 3D Forest Stand Reconstruction and Extraction of Individual Tree Parameters. Remote Sens. 2025, 17, 1520. [Google Scholar] [CrossRef]
  53. Hu, Q.; Yang, B.; Xie, L.; Rosa, S.; Guo, Y.; Wang, Z.; Trigoni, N.; Markham, A. RandLA-Net: Efficient Semantic Segmentation of Large-Scale Point Clouds 2020. In Proceedings of the IEEE/CVF Conference on Computer Vision and Pattern Recognition; IEEE: New York, NY, USA, 2020. [Google Scholar]
  54. Chave, J.; Réjou-Méchain, M.; Búrquez, A.; Chidumayo, E.; Colgan, M.S.; Delitti, W.B.C.; Duque, A.; Eid, T.; Fearnside, P.M.; Goodman, R.C.; et al. Improved Allometric Models to Estimate the Aboveground Biomass of Tropical Trees. Glob. Change Biol. 2014, 20, 3177–3190. [Google Scholar] [CrossRef]
Figure 1. Location of the research sites and experimental plot distribution. (a) Location of South China Agricultural University in Guangzhou, Guangdong Province, China; (b) Orthophoto of the campus with the spatial extent of the three experimental plots marked; (c) field photograph of Plot 1 (single Cinnamomum camphora tree); (d) field photograph of Plot 2 (single leafless Magnolia denudata tree); (e) field photograph of Plot 3 (mixed stand of 17 Bauhinia variegata trees).
Remotesensing 18 01696 g001
Figure 2. Trunk LiDAR point cloud of Plot 3. This figure shows the trunk-only handheld SLAM LiDAR point cloud of Plot 3 (17 Bauhinia stands, corresponding to Figure 1e) after wood-leaf semantic separation, with only the trunk structure preserved.
Remotesensing 18 01696 g002
Figure 3. UAV image acquisition flight trajectories and camera poses solved via COLMAP for the three experimental plots. (a) Orbital flight trajectory and camera pose distribution for Plot 1; (b) orbital flight trajectory and camera pose distribution for Plot 2; (c) combined grid and oblique photography flight path and multi-view camera pose distribution for Plot 3.
Remotesensing 18 01696 g003
Figure 4. Full raw handheld SLAM LiDAR point clouds of the experimental plots. Complete raw handheld SLAM LiDAR point clouds of the three study plots, serving as the original geometric data for the proposed semantic-constrained 3DGS framework. (a) Plot 1 (single Cinnamomum camphora tree); (b) Plot 2 (single leafless Magnolia denudata tree); (c) Plot 3 (17-tree Bauhinia variegata stand).
Remotesensing 18 01696 g004
Figure 5. Overall workflow of the proposed semantic-constrained 3DGS framework for forest digital twin construction. The pipeline consists of five core modules: (a) multi-modal data acquisition via handheld LiDAR and UAV imagery; (b) coarse-to-fine spatial registration of LiDAR and SfM point clouds; (c) geometric anchor generation and 3DGS initialization with LiDAR priors; (d) unsupervised semantic segmentation of trunks and canopy, followed by semantic-aware adaptive optimization of 3D Gaussian primitives; (e) DBH extraction from the reconstructed digital twin via opacity-weighted circle fitting.
Remotesensing 18 01696 g005
Figure 6. Fused point clouds and geometric anchors of the three experimental plots. This figure presents fused point clouds (handheld LiDAR + UAV SfM integration) and extracted geometric anchors for three study plots. Fused point clouds combine LiDAR geometric precision and UAV spatial information; denoised, downsampled geometric anchors provide the 3DGS model initialization prior. The whitening of the point cloud at the top of the tree trunks is caused by direct sunlight exposure during the data acquisition process. (a) Plot 1 (Cinnamomum camphora) fused point cloud; (b) Plot 2 (Magnolia denudata) fused point cloud; (c) Plot 3 (Bauhinia variegata stand) fused point cloud; (d) Plot 1 geometric anchors; (e) Plot 2 geometric anchors; (f) Plot 3 geometric anchors.
Remotesensing 18 01696 g006
Figure 7. Overall 3D reconstruction results of three experimental forest plots. This figure shows the digital twin reconstruction outputs of the proposed framework for three test plots. The left panel shows the ground truth images, while the right panel shows the reconstruction results of our proposed method. Subfigure (a) corresponds to Plot 1 with a single Cinnamomum camphora tree. Subfigure (b) corresponds to Plot 2 with a single leafless Magnolia denudata tree. Subfigure (c) corresponds to Plot 3 with a mixed stand of 17 Bauhinia variegata trees. The results show that the framework can maintain a complete trunk topological structure and smooth transition between trunks and leaves in forest scenes with different complexity levels, and has good robustness to understory occlusion.
Remotesensing 18 01696 g007
Figure 8. Qualitative visual comparison of novel view synthesis for Plot 1. This figure compares the rendering effects of different methods in Plot 1. The first column shows the ground truth real image of the test view. The second column shows the rendering result of the baseline 3DGS method. The third column shows the rendering result of the method proposed in this study. The comparison shows that the proposed method can reconstruct clearer bark textures and leaf outlines with less volumetric noise and floating artifacts in the understory area.
Remotesensing 18 01696 g008
Figure 9. Qualitative visual comparison of novel view synthesis for Plot 2. This figure compares the rendering effects of different methods in Plot 2. The first column shows the ground truth real image of the test view. The second column shows the rendering result of the baseline 3D Gaussian Splatting method. The third column shows the rendering result of the method proposed in this study. The comparison shows that the proposed method can accurately restore the complex branch topological structure of the leafless Magnolia denudata tree with higher structural integrity.
Remotesensing 18 01696 g009
Figure 10. Qualitative visual comparison of novel view synthesis for Plot 3. This figure compares the rendering results of different methods in Plot 3. The first column shows the ground truth images of the test views. The second column shows the rendering results of the baseline 3D Gaussian Splatting method. The third column presents the rendering results of the proposed method. The comparison shows that the proposed method can preserve the trunk structure in the forest stand.
Remotesensing 18 01696 g010
Figure 11. Visualization of diameter at breast height extraction results from the reconstructed 3DGS model. The left image displays the complete 3D Gaussian Splatting point cloud of the target individual tree, marking the standard breast height position and the horizontal slice used for diameter calculation. The top right subfigure shows the 3D distribution of valid Gaussian primitives within the extracted slice and the fitted circle used for diameter calculation. The bottom right subfigure is the top-down 2D view of the same slice, presenting the planar distribution of Gaussian primitives and the final fitted circle.
Remotesensing 18 01696 g011
Figure 12. Correlation scatter plot of measured and extracted diameter at breast height. This figure shows the correlation between field-measured DBH and DBH extracted from the 3D forest digital twin reconstructed by our proposed method. The linear fitting yields a coefficient of determination of 0.848 and a root mean square error of 2.705 cm.
Remotesensing 18 01696 g012
Figure 13. Sensitivity analysis of the γ max parameter. The blue solid curve denotes the PSNR metric, the green dashed curve denotes the SSIM metric, the orange dotted curve denotes the LPIPS metric, and the red dashed curve denotes the DBH estimation RMSE. The results demonstrate that γ max = 0.02 is the optimal configuration.
Remotesensing 18 01696 g013
Figure 14. Training loss curve comparison. This figure presents the training loss curves of two 3DGS methods across training iterations. The blue curve denotes the RGB-only 3DGS method, while the red curve denotes the 3DGS method with LiDAR guidance and semantic constraints. The results show that the LiDAR-guided method converges faster and yields a lower final loss.
Remotesensing 18 01696 g014
Table 1. Key technical specifications of the experimental devices.
DeviceParameterSpecification
SHARE SLAM S20
Remotesensing 18 01696 i001
Point Cloud Output200,000 points/s
Point Cloud Frequency10 Hz
Measurement Range0.1–70 m
RTK Positioning AccuracyHorizontal: 0.8 cm + 1 ppm
Vertical: 1.5 cm + 1 ppm
Absolute Accuracy≤5 cm
DJI Mavic 3 Enterprise
Remotesensing 18 01696 i002
Camera Sensor4/3-inch CMOS, 20 MP
Resolution3840 × 2160
Field of View84°
Image Capture Rate 0.7 s/fr
Computing WorkstationCPUIntel Core i9-13900K
GPUGeForce RTX 4060
RAM48 GB
Table 2. Statistics of experimental datasets for three plots.
Dataset IDTree SpeciesNumber of ImagesResolutionNumber of Points
Plot 1Camphor Tree4321920 × 1080 19,053,897
Plot 2Yulan Magnolia33711,823,626
Plot 3Bauhinia85759,896,864
1 To balance the GPU memory consumption and training efficiency of the 3DGS model, all images were downsampled to a resolution of 1920 × 1080 for training.
Table 3. Rendering performance and training efficiency comparison of different methods.
MethodPlot 1Plot 2Plot 3
PSNR↑SSIM↑LPIPS↓TimePSNR↑SSIM↑LPIPS↓TimePSNR↑SSIM↑LPIPS↓Time
NeRF23.460.6390.271684 min23.690.7340.177747 min22.060.6650.3872579 min
3DGS24.700.7490.28072 min23.950.8310.16495 min23.380.7170.334198 min
Ours25.480.7720.26670 min25.140.8840.11488 min24.210.7360.318204 min
Table 4. DBH extraction accuracy for individual trees.
Dataset IDTrees IDMeasured DBH (cm)LiDAR OnlyOurs
Fitted DBH (cm)ErrorFitted DBH (cm)Error
Plot 1#148.6648.34−0.7%48.17−1.0%
Plot 2#221.7120.95−3.5%20.34−6.3%
Plot 3#324.8625.77+3.7%27.21+9.5%
#414.1315.90+12.5%16.48+16.6%
#520.5321.34+3.9%24.37+18.7%
#631.2928.64−8.5%25.75−17.7%
#726.1127.73+6.2%27.37+4.8%
#830.7329.56−3.8%28.34−7.8%
#919.9520.91+4.8%21.72+8.9%
#1025.8927.68+6.9%28.04+8.3%
#1121.3619.82−7.2%18.79−12.0%
#1218.4319.98+8.4%20.17+9.4%
#1324.4526.16+7.0%25.96+6.2%
#1428.1625.76−8.5%24.28−13.8%
#1521.9720.10−8.5%19.42−11.6%
#1622.1823.46+5.8%24.97+12.6%
#1726.4928.44+7.4%29.47+11.3%
#1829.3028.11−4.1%26.44−9.8%
#1927.5029.00+5.5%30.18+9.7%
Table 5. Ablation experiment results of core modules.
LiDAR InitializationSemantic OptimizationPSNR↑SSIM↑LPIPS↓
//24.700.7490.280
/25.220.7690.270
25.480.7720.266
Disclaimer/Publisher’s Note: The statements, opinions and data contained in all publications are solely those of the individual author(s) and contributor(s) and not of MDPI and/or the editor(s). MDPI and/or the editor(s) disclaim responsibility for any injury to people or property resulting from any ideas, methods, instructions or products referred to in the content.