


Highlights
What are the main findings?
- A 500 m Land Degradation Index (LDI) was developed for Brazil by integrating deforestation age, climate-filtered gross primary productivity, and soil organic carbon, enabling the mapping of degradation intensity and variation beyond categorical SDG 15.3.1 assessments.
- Between 2001 and 2021, Brazil lost 50.5 Mha of conserved land and gained 53.5 Mha in intermediate-to-severe degradation classes; in 2021, conserved land remained concentrated in the Amazon (86.73%) and Pantanal (87.95%), whereas the Atlantic Forest had the lowest conserved share (34.77%), and degradation intensified around Indigenous Lands and Quilombola Territories.
What are the implications of the main findings?
- The LDI provides a reproducible national-scale framework for identifying areas where long-term land-use legacies have already reduced ecosystem condition, making it a practical complement to SDG 15.3.1 for Land Degradation Neutrality monitoring across biomes.
- By showing conservation cores inside Indigenous Lands and Quilombola Territories but worsening degradation in their surroundings, the index can support restoration targeting, territorial protection, and frontier-control strategies in socio-environmentally vulnerable areas.
Abstract
Global land degradation metrics often rely on trend-based categories that miss cumulative severity, frequently misclassifying degraded areas as stable. To overcome this, we developed a Land Degradation Index (LDI) to assess degradation across Brazil on a 500 m grid for 2001 and 2021. The LDI integrates land-cover change legacy (deforestation age), ecosystem functioning (Gross Primary Productivity), and soil condition (Soil Organic Carbon) into a six-level gradient ranging from conserved to highly degraded. Results reveal that between 2001 and 2021, Brazil lost 50.5 million hectares of conserved land, while intermediate and severe degradation expanded by 53.5 million hectares. Conservation remained concentrated in the Amazon and Pantanal, whereas degradation intensified across the Atlantic Forest, Cerrado, and Caatinga, particularly along agricultural frontiers. Furthermore, while Indigenous Lands and Quilombola Territories act as vital conservation cores, the LDI reveals intensified degradation in their immediate surroundings, highlighting the intersection of biophysical decline, land conflicts, and socio-environmental vulnerability. The proposed index advances beyond conventional indicators, such as SDG 15.3.1, by incorporating both the intensity and variation of degradation processes into a unified analytical framework, providing a robust, reproducible framework to support Land Degradation Neutrality (LDN) targets, inform public policies, and guide inclusive territorial planning.
1. Introduction
The United Nations Convention to Combat Desertification (UNCCD) defines land degradation as the partial or total reduction in the biological and economic potential and ecological complexity of croplands, pastures, forests, and woodlands, resulting from the combined action of different pressures, with particular emphasis on inadequate land occupation, use, and management practices [1]. Over the last few decades, the concept of land degradation has evolved from the notion of desertification—this degradation process occurs exclusively in arid, semi-arid, and dry sub-humid regions—into a broader concept referring to the loss of ecosystem capacity to provide essential ecosystem services [2]. It is currently estimated that around 1.2 billion people are affected by this process globally, with impacts on food security and climate regulation [3]. Despite these advances, many approaches remain limited in their ability to capture the multidimensional and cumulative nature of degradation processes.
However, the measurement of land degradation still lacks methodological consensus. Part of the literature focuses on isolated biophysical indicators, such as productivity trends derived from the Normalized Difference Vegetation Index (NDVI) [4,5]. Although widely used, NDVI-based approaches are limited in this context because they capture vegetation greenness rather than carbon assimilation and are susceptible to saturation in dense canopies, soil background effects, and seasonal variability. Gross primary productivity (GPP), by contrast, directly quantifies the amount of carbon fixed by vegetation through photosynthesis, providing a more functionally meaningful representation of ecosystem productivity and its responses to land use and climate stressors. In contrast, other studies incorporate land-use and land-cover changes, soil organic carbon losses, or combinations of these and other indicators to represent land degradation [6,7].
At the international level, the United Nations (UN) 2030 Agenda incorporated Target 15.3 into the Sustainable Development Goals (SDGs), aiming to achieve Land Degradation Neutrality (LDN) by 2030. To monitor this commitment, the UNCCD recommends the use of Indicator 15.3.1, composed of three sub-indicators: (i) land cover, (ii) land productivity, and (iii) soil organic carbon. The assessment should be carried out periodically using time-series data to identify trends in degradation, recovery, or stability.
Despite the institutional progress reflected in Indicator 15.3.1, limitations remain. The method is based primarily on detecting categorical changes (degrading, stable, improving) and does not assess the intensity of degradation. Thus, areas that have historically been in degraded states may be classified as “stable,” provided they do not show further deterioration during the period under analysis [8,9]. This limitation may lead to a systematic underestimation of the severity of degradation, particularly in landscapes where degradation has historically accumulated rather than recently expanded.
This methodological limitation becomes even more relevant when considering that land degradation does not occur homogeneously across a territory, nor does it produce uniform impacts. Its importance as an environmental problem depends on the social, economic, and environmental context of the location in which it occurs [10]. In Brazil, degradation manifests heterogeneously across biomes and socioecological contexts, reflecting climatic, historical, and structural differences in land use. Such heterogeneity challenges the application of standardized indicators across contrasting ecological domains. The use of this indicator in different ecological contexts may mask regional specificities, such as the dynamics of savannization in the Amazon [11] or sandization in the Pampa [12].
In addition to the ecological dimension, the effects of land degradation are distributed unevenly among social groups. Indigenous peoples and quilombola communities are affected by pressures from agricultural expansion, illegal mining, and logging, directly threatening their survival [13,14]. Family farmers, although responsible for a large share of the foods that make up the basic food basket, with annual production equivalent to approximately 165 million food baskets [15], face technical and economic constraints that may make them both victims and agents of the process [16]. In contrast, medium- and large-scale producers, by expanding monocultures and extensive livestock systems, are among the main drivers of degradation [17]. These asymmetries highlight the need to integrate socioecological dimensions into land degradation assessments.
Even so, much of the literature focuses on isolated biomes [18] or adopts global approaches that fail to capture local specificities [10]. Comparative studies investigating degradation across different socioecological contexts in Brazil remain limited [19]. As a result, there is a gap in approaches that can simultaneously capture spatial heterogeneity, cumulative degradation processes, and socioecological variability at national scales.
In view of these limitations, the present study proposes developing a Land Degradation Index (LDI) that accounts for the specific characteristics of the Brazilian territory by integrating the three UNCCD sub-indicators: land cover, land productivity, and soil organic carbon, using remote sensing data and national soil databases. The proposed index advances beyond conventional SDG 15.3.1 applications by incorporating both the intensity and variation of degradation processes into a unified analytical framework.
Accordingly, the study aims to address the following questions: (i) What is the extent of land degradation in Brazil? (ii) What patterns emerge across different biomes? and (iii) how does degradation put pressure on traditional communities? By explicitly linking biophysical indicators to territorial and social contexts, the results are intended to inform public policies for mitigation and restoration, supporting the Brazilian Action Plan to Combat Desertification and Mitigate the Effects of Drought (PAB-Brazil) and the achievement of LDN targets within Brazilian territory.
2. Materials and Methods
This study quantifies biophysical land degradation in Brazil through an index constructed by integrating three complementary sub-indicators: (i) land cover change legacy (LC), expressed as deforestation age; (ii) land productivity, estimated by GPP; and (iii) soil organic carbon (SOC). These dimensions were selected to represent structural, functional, and edaphic components of land system integrity. The LDI is calculated for two benchmark periods, 2001 and 2021, allowing transitions and worsening of degradation over the period to be measured.
The methodology enables spatial comparability, transparency, and reproducibility. All datasets are harmonized to the same spatial resolution and processed using standardized normalization and ordinal classification procedures. Preprocessing steps included reprojection, resampling, and masking to ensure spatial consistency across datasets. The sub-indicators were integrated using map algebra to produce a synthetic score, which was subsequently reclassified into degradation classes. The methodological process for deriving the LDI is illustrated in Figure 1.
Figure 1.
Methodological workflow for deriving the LDI.
2.1. Study Area
Brazil covers an area of approximately 8,515,767 km2, making it the largest country in South America and the fifth largest in the world (Figure 2). Brazil exhibits substantial climatic diversity due to its vast territorial extent and altitudinal variation. The country is characterized by different climatic regimes (equatorial, tropical, semi-arid, and subtropical), reflecting the influence of distinct atmospheric systems [20]. The combination of climate, relief, and soils results in a wide variety of biomes (Amazon, Cerrado, Caatinga, Atlantic Forest, Pantanal, and Pampa), each with its own environmental and ecological characteristics [21]. This diversity provides a suitable framework for testing spatial variability in degradation patterns under contrasting socioecological conditions.
Figure 2.
Extent of the Brazilian territory.
In addition to biophysical differences, the Brazilian territory is marked by distinct governance regimes and forms of land appropriation, which also shape trajectories of land use and conservation [22]. In this context, Indigenous Lands (ILs) and Quilombola Territories (QTs) are legally recognized territorial categories with their own rules governing land use, occupation, and management. Their inclusion as analytical strata stems not only from their socio-environmental relevance but also from the hypothesis that different institutional regimes and governance arrangements may produce distinct patterns of degradation or conservation. This assumption is explored in a comparative rather than causal analytical framework.
Brazil has 637 ILs officially recognized by the State, including traditionally occupied lands and Indigenous reserves, totaling approximately 117 million hectares designated for the permanent possession and exclusive usufruct of Indigenous peoples, ensuring the preservation of their cultures, ways of life, and relationships with the land [23,24]. QTs, in turn, comprise 433 recognized areas, home to approximately 167,000 people. These territories are characterized as areas traditionally occupied by descendants of enslaved Africans who resisted slavery by forming autonomous communities known as quilombos, marked by strong ties to their ancestry, distinctive cultural practices, and collective land use [25,26].
When analyzed as specific territorial units, ILs and QTs enable assessment of how governance, productive practices, and external pressures are reflected in the spatial patterns of land degradation. Thus, for this study, three Indigenous areas and three quilombola areas were selected, located in different biomes and having recorded land tenure conflicts between 2001 and 2021. In addition to territorial conflicts and external pressures affecting these areas, the selection of ILs and QTs also considered spatial-scale criteria. Because the LDI is operationalized using data with a spatial resolution of 500 m × 500 m, only ILs and QTs with sufficient territorial extent to support analysis at this scale were included.
For ILs, the first study region comprises a transboundary mosaic between Pará and Maranhão in the eastern portion of the Legal Amazon, encompassing the Alto Rio Guamá, Alto Turiaçu, Awá, and Caru ILs, totaling approximately 1,100,157 hectares. This group is home to 9597 Indigenous people [27], including the Tembé (Tenetehar), Ka’apor, and Awá-Guajá peoples. The inhabitants of these ILs face long-standing pressures from logging, invasions, and conflict, intensified by frontier dynamics and infrastructure projects such as the duplication of the Carajás Railway [28,29].
The second area comprises a socio-environmental mosaic in the Araguaia Valley, covering 2,055,621 hectares and inhabited by 5172 Indigenous people [27]. This area includes the Utaria Wyhyna/Iròdu Irána, Inãwebohona, Tapirapé/Karajá, Cacique Fontoura, Krahó-Kanela, São Domingos, and Taego Ãwa ILs, in addition to Araguaia Park. Located mainly on Bananal Island and adjacent areas, in the middle course of the Araguaia River, these lands lie in the Cerrado-Amazon transition zone and within a system of seasonally flooded wetlands and fluvial plains between the Araguaia and Javaés rivers. This is the largest fluvial island in the world, recognized as a wetland of international importance and part of the Cerrado Biosphere Reserve [30,31].
The third area, in turn, includes the Mangueirinha IL, located in the southwestern part of the state of Paraná, within the Atlantic Forest biome, between the municipalities of Chopinzinho, Coronel Vivida, and Mangueirinha, on the southern bank of the Iguaçu River. It is occupied by the Kaingang and Guarani peoples, with a demarcated area of approximately 17,000 hectares and a population of 2377 Indigenous inhabitants [27]. The area is subject to recurring anthropogenic pressures, including flooding associated with road construction and episodes of illegal exploitation of Araucaria, while continuous Indigenous mobilization and resistance are also observed [32].
For QTs, three areas were also analyzed. These areas have likewise recorded conflicts in recent years and are spatially distant from one another. The first region covers approximately 51,532 hectares and comprises the Fazenda Grande and Boa Vista do Pixaim QTs. These QTs are located in the state of Bahia, on the banks of the São Francisco River, forming a traditional territory where land regularization is still underway. In both territories, episodes of violence and land conflict, such as the destruction of crops, threats, unlawful confinement of residents, and investigations into disappearances, highlight the pressure on the territory and the urgent need for protective measures and the completion of land titling [33].
In the second quilombola area, the Kalunga and Kalunga do Mimoso QTs form a socio-territorial unit within the Cerrado and together cover 319,239 hectares, with a population of 3889 quilombola people [25]. The Kalunga territory is recognized as the largest quilombola community in the country. It faces recurring conflicts associated with the expansion of agribusiness, mining, and tourism, as well as recent alerts of deforestation [34]. The Kalunga do Mimoso community, in turn, maintains historical and cultural ties with the Kalunga people and highlights the need for structural public policies to ensure rights and improve local services [35].
Finally, the third area comprises the Baú QT, with a traditional occupation along the Jequitinhonha River and more than 80 resident families, reflecting three centuries of community presence in the region. The area, covering 15,413 hectares, remains untitled and is still undergoing land regularization, although the quilombo was certified by the Palmares Cultural Foundation in June 2008. Between 2023 and 2024, progress in this process intensified conflicts and threats against local leaders, culminating in an armed attack in November 2024, involving gunfire directed at homes and the blocking of access routes [36].
2.2. Construction of the Sub-Indicators
The database was structured as a raster with an approximate spatial resolution of 500 m to ensure spatial comparability across biomes. All datasets were harmonized to the same extent and grid, and the LDI was calculated only for terrestrial, non-urban pixels with valid information for the three sub-indicators. Water bodies and urban areas were excluded using the 2022 Annual Land Cover and Land Use Mapping of Brazil (Mapbiomas) classification [37], and the same analytical mask was applied to both benchmark years to maintain a consistent spatial domain for comparison. Thus, the LDI was estimated within a fixed 2022 terrestrial, non-urban analytical domain, rather than using year-specific masks for each benchmark year. This procedure minimizes spatial misalignment and ensures that LDI changes reflect variation within the same set of eligible pixels instead of changes in the spatial extent of the analysis. However, it also implies that areas classified as urban or water in 2022 were excluded from the 2001 surface, even if they had a different land-cover condition in the baseline year. Consequently, pixels that were non-urban terrestrial areas in 2001 but transitioned to urban areas or water bodies by 2022 were not included in the baseline LDI surface. This may introduce a conservative bias by underrepresenting some land-conversion processes that occurred between 2001 and 2022.
The construction of the sub-indicators aimed to represent complementary dimensions of biophysical land degradation, land cover change legacy, land productivity, and soil organic matter, on an ordinal scale from 1 to 6, where 1 indicates the worst relative performance and 6 the best. The choice of a standardized ordinal scale was intended to mitigate differences in units and ranges between continuous and categorical variables, reduce sensitivity to outliers, and enable subsequent additive integration. Additionally, ordinal scaling facilitates comparability while avoiding assumptions of linearity across heterogeneous variables.
The LDI was co-created within the framework of the PAB-Brazil seminars [15], through an iterative process of feedback and adjustment. Across 14 meetings held in different states and regions of Brazil, thematic maps were presented to participants, who provided contributions through guided discussions. The meetings included 426 members of civil society, 5 members of the private sector, 365 members of governmental institutions, and 145 members of research institutions. These contributions informed the contextual refinement and interpretation of the performance metrics for each indicator. At the same time, the final reclassification thresholds were consolidated by the research team based on methodological consistency, data availability, and national-scale comparability.
Participation included public agency technicians, researchers, and representatives of priority territories, which ensured alignment with public policy demands and sensitivity to regional socio-environmental specificities. The suggestions were incorporated into subsequent versions of the outputs under the supervision of specialists from Brazilian public institutions, including the National Institute of the Semiarid (INSA), the Brazilian Institute of Geography and Statistics (IBGE), and the Brazilian Agricultural Research Corporation (Embrapa).
2.2.1. Land Cover Change Legacy
Land use and land cover (LULC) dynamics were represented by deforestation age, calculated as the time elapsed between the year of the first transition from a native vegetation class to a different class (agriculture, pasture, etc.) identified in the pixel and the target analysis year (2001 or 2021). This metric was used to approximate cumulative anthropogenic pressure on land systems. For this purpose, annual PRODES polygons (Annual Monitoring of Native Vegetation Suppression) from 2007 to 2022 were integrated. In this study, 2007 was adopted as the transition year between the Mapbiomas-based historical reconstruction and the PRODES-based suppression layer. This harmonized approach prioritizes consistency across biomes; the pre-2007 PRODES Amazon series was not directly incorporated into the LDI workflow.
Annual LULC transitions from the Mapbiomas Project between 1985 and 2007 were used to identify conversions from “native vegetation” to “anthropic use” before PRODES. This procedure resulted in the “year of first deforestation” for each pixel and, for each temporal benchmark (2001 and 2021), the deforestation age (the difference between the target year and the year of the event). However, this approach is constrained by the temporal coverage of the available LULC series. Pixels converted before 1985 do not present an observable transition within the Mapbiomas period. As a result, these areas may be assigned no deforestation event or a more favorable land-use condition than expected, leading to an underestimation of degradation in regions where native vegetation had already been removed before the start of the annual LULC record. Therefore, the deforestation age should be interpreted as the age of deforestation detectable within the available monitoring period, rather than the complete historical duration of land conversion.
The underlying assumption was that a longer time since deforestation tends to reflect the impact of anthropogenic land use and, therefore, a greater degree of impairment of the land’s structural and functional attributes. However, this proxy may not fully capture variations in management intensity or potential recovery processes over time. Accordingly, the sub-indicator was reclassified into six ordinal levels, with lower values assigned to older deforestation ages and higher values assigned to areas with no record of recent deforestation (Table 1).
Table 1.
LC sub-indicator and performance intervals.
Class 6 also includes pixels that remained under native vegetation throughout the entire analyzed series, serving as the reference for the best relative condition in this sub-indicator. The remaining classes divide the event’s age into increasing ranges of “time since conversion,” prioritizing practical discrimination in the national context.
2.2.2. Land Productivity
Land productivity was assessed using the annual MODIS MOD17A3HGF (Terra) and MYD17A3HGF (Aqua) products, combined through a pixel-by-pixel annual average. This combination reduces sensor-specific noise and improves the robustness of productivity estimates. To mitigate the influence of climatically anomalous years, a climate filter based on the 6-month Standardized Precipitation Evapotranspiration Index (SPEI-6) was applied, chosen for its sensitivity to medium-term vegetation water stress [38,39]. This filter was adopted because the LDI is intended to capture structural land degradation rather than transient climate-driven productivity fluctuations. Therefore, when the target year coincides with an extreme drought or an anomalously wet period, the raw GPP value may reflect short-term climatic conditions more strongly than the land system’s underlying productive capacity.
The range from −0.99 to 0.99 for the mean SPEI in the target year was considered neutral; if a pixel did not meet this criterion, the value from the subsequent year was selected, and if the anomaly persisted, the value from the previous year was used. If no neutral year was found in the surrounding period, the mean of the three-year window (previous-target-subsequent) was used. Thus, the target year was always preferred when it was climatically neutral, and adjacent years were used only according to a predefined decision hierarchy. This procedure was intended to reduce climate noise in the productivity signal rather than arbitrarily mix information from different years. The SPEI, available at a spatial resolution of 0.5 degrees, was used only to select years, not to adjust GPP values directly. Thus, climatic variability is controlled indirectly through temporal filtering rather than explicit normalization of productivity values.
The use of 0.5-degree SPEI data introduces a scale mismatch relative to the 500 m LDI grid. Although SPEI was used only as a temporal filter to reduce the influence of anomalous years on GPP, its coarse resolution may smooth local hydroclimatic variability, especially in regions with complex topography or strong climatic gradients. Therefore, the selected GPP values may not fully represent local water-stress conditions in some pixels.
The GPP raster (kg C/m2) was then reclassified into six levels according to intervals defined for Brazil, preserving the monotonic relationship between productivity and performance (Table 2). These levels were informed by published MODIS-derived productivity benchmarks, which indicate mean potential GPP values of approximately 2.0 kg C m−2 yr−1 for forests, 1.5 kg C m−2 yr−1 for grasslands, and 1.8 kg C m−2 yr−1 for croplands [40]. Lower productivity classes were also defined based on the reduced, highly climate-sensitive productivity commonly observed in dryland ecosystems, where GPP is strongly affected by aridity, drought, and degradation processes [41].
Table 2.
Land productivity sub-indicator and performance intervals.
Thus, areas with higher GPP, after climate filtering, receive higher scores because they reflect vegetation dynamics and ecosystem responses to environmental conditions [42]. Nevertheless, differences in intrinsic ecosystem productivity across biomes may still influence this sub-indicator.
2.2.3. Soil Organic Carbon
SOC was obtained from the national reference map for 2021 [43]. Because an equivalent national SOC map was not available for 2001, SOC for 2001 was retrospectively estimated using the land-cover transition approach described in the Trends.Earth User Guide [44]. In this procedure, the 2021 SOC layer was used as the reference condition, and adjustment factors associated with Köppen climate zones and LULC transitions were applied backward from 2021 to 2001 to approximate the SOC condition expected before the observed land-cover change. Thus, the 2001 SOC layer represents a modeled back-casting estimate rather than a directly observed historical SOC map. The transition coefficients (f) used were: Af = 0.48; Am, Cwa, Cwb, Cwc = 0.64; BSh, As, Aw = 0.58; Cfa = 0.80; Cfb, Csa, Csb = 0.69. SOC (g/kg) was reclassified into six levels representing a gradient of soil quality (Table 3).
Table 3.
SOC sub-indicator and performance ranges.
This retrospective procedure does not imply that SOC losses are reversible or that land-cover recovery would necessarily restore SOC at the same rate or magnitude. Rather, it provides an operational back-casting approximation of the pre-transition SOC condition based on the available 2021 reference map and LULC transition factors, following the transition-coefficient approach adopted in the Trends.Earth framework for data-scarce contexts. Because no independent national SOC map or systematic historical field measurements were available for 2001, uncertainty intervals could not be estimated in this study. Therefore, temporal differences involving the SOC component should be interpreted with caution, as indicative changes within the LDI framework rather than as direct measurements of SOC gain or loss. In this sense, apparent SOC-related changes may reflect both actual differences in land conditions and uncertainty associated with the retrospective reconstruction.
The choice of increasing thresholds reflects the positive association between organic matter and carbon contents and desirable soil attributes (structure, water retention capacity, fertility, and resilience), so that higher values result in better scores. Because SOC for 2001 is derived rather than directly observed, uncertainty associated with this estimation should be considered when interpreting temporal changes. Accordingly, the SOC sub-indicator was used to support a relative assessment of soil quality within the LDI framework, rather than to quantify absolute historical SOC change.
2.3. Land Degradation Index
The LDI was conceived as a synthetic, additive, and dimensionless indicator that integrates three complementary dimensions of biophysical conditions (Equation (1)): LC (represented by deforestation age), land productivity (represented by GPP), and soil organic matter (represented by SOC). Each dimension is standardized on an ordinal scale from 1 to 6, with a common orientation (higher values indicate a better relative condition), thus allowing direct combination through map algebra. Accordingly, for each pixel p in the national grid and for each target year t (2001; 2021), the following is defined:
where are the reclassified scores of the LC, GPP, and SOC sub-indicators, respectively, as a result, the LDI ranges from 3 to 18, where lower values denote poorer condition (greater degradation) and higher values denote better condition.
Integration with equal weights reflects the assumption that the three dimensions capture non-redundant aspects of the land system’s integrity and that, at the scale of analysis, no single dimension should dominate the assessment. This assumption implies equal contribution of each sub-indicator, which simplifies interpretation but may not reflect all ecological contexts. This choice implies partial compensability among sub-indicators (for example, an intermediate performance in GPP may partially offset a low vegetation age), which is mitigated by two safeguards: (i) the common orientation and ordinal normalization reduce scale effects and outliers, and (ii) the “conserved” class imposes a stricter criterion (see below), limiting cases of high scores resulting merely from compensation. Such compensability should be interpreted with caution, as high performance in one dimension may partially offset low performance in another, without necessarily indicating ecological recovery.
For substantive interpretation and communication of results, the continuous LDI score is converted into severity levels according to fixed thresholds, defined to maintain consistency across territorial scales and over time, as illustrated in Table 4. Accordingly, a filter was applied so that the “conserved” level would represent only areas classified as native vegetation in the LULC mapping conducted by the IBGE [45], including forest vegetation, wetlands, and grassland vegetation, and that remained consistently classified as native vegetation in Mapbiomas throughout the entire 1985–2022 period.
Table 4.
Classification of land degradation levels.
The LDI is calculated independently for 2001 and 2021, producing two comparable surfaces. Temporal change is analyzed using two complementary metrics: (i) ΔLDI (LDI2021–LDI2001), which expresses the shift in the continuous score; and (ii) a transition matrix between classes, which distinguishes the loss of conserved areas and increases in severity (i.e., an increase in the level of degradation).
Therefore, only pixels with valid values for all three sub-indicators are considered in the LDI calculation. Units with missing data are treated as no data and excluded from the syntheses. The internal consistency of the index was assessed through spatial inspection in reference areas and by examining whether the resulting spatial patterns were coherent with known land-use gradients and biome-level degradation contexts.
2.4. Qualitative Verification of the LDI
Because the LDI is proposed as a new synthetic indicator, its relationship with land degradation was assessed through qualitative and indirect verification. No independent national-scale ground-truth dataset on land degradation intensity is currently available for Brazil, and field verification was not feasible in this first application. Therefore, the verification procedure was based on conceptual consistency, participatory contextual calibration, spatial plausibility, temporal coherence, and comparison with documented degradation processes.
We evaluated the LDI in light of the participatory process conducted during the PAB-Brazil seminars. As described in Section 2.2, preliminary maps and indicator outputs were discussed in 14 meetings held across different Brazilian regions, with representatives from civil society, governmental institutions, research institutions, and other stakeholders. These discussions informed adjustments to performance metrics and provided a participatory assessment of plausibility grounded in local and institutional knowledge. However, this process should not be interpreted as formal field validation.
Spatial plausibility was assessed by comparing LDI patterns with known degradation contexts reported in the literature, including the Amazon deforestation arc, agricultural expansion in the Cerrado and MATOPIBA, historical fragmentation in the Atlantic Forest, agricultural and livestock intensification in the Pampa, drought-related degradation in the Caatinga, and recent fire and hydrological disturbances in the Pantanal. Finally, temporal coherence was examined by assessing whether LDI transitions between 2001 and 2021 were consistent with expected trajectories of native vegetation loss, agricultural frontier expansion, and increasing land-use pressure.
3. Results
The most conserved areas in Brazil are concentrated in the northern part of the country (Figure 3). At the same time, continuous belts of intermediate land degradation (Levels 2 and 3) are densest in the South and Southeast. In turn, the Northeast and Central-West regions show the greatest concentration of the highest degradation levels (Levels 4 and 5). Spatially, the transition in degradation between 2001 and 2021 indicates two simultaneous trends: the reduction of conserved areas and the worsening of degradation into more severe classes (Levels 4 and 5). This spatial pattern is consistent with processes commonly associated with agricultural expansion, forest fragmentation, and intensive land use. This intensification of degradation may be associated with agricultural expansion, forest fragmentation, and intensive land use [46]. In addition, climatic factors such as severe droughts amplify the effects of degradation, especially in the country’s semi-arid region [47].
Figure 3.
Spatial distribution and variations in the LDI level in Brazil in 2001 and 2021, and the corresponding changes in degradation levels.
Between the years analyzed, there was a reduction of 50.5 million hectares of conserved area, while higher degradation levels (Classes 3, 4, and 5) increased by 53.5 million hectares. Taken together, these changes indicate a marked territorial shift from better-preserved conditions toward intermediate and high degradation classes. During the same period, there is broad agreement in the literature regarding the marked reduction of conserved areas and the shift toward more severe degradation classes [48]. Projections indicate that, even under conservative scenarios, the trend is toward a decline in native vegetation and an increase in degraded areas, with impacts on biodiversity and ecosystem services [49].
3.1. Evaluation of the LDI Across Different Biomes
The biome-level analysis shows that, in 2021, there was a strong asymmetry between conserved and degraded areas (see Figure 4 and Appendix A). The Amazon remained predominantly conserved, representing 86.73% of its territory. Degradation in this biome, which contains the highest concentration of ILs and QTs in the country, is concentrated at intermediate levels (Levels 2 and 3), mainly in the region known as the deforestation arc. The deforestation arc extends from eastern Pará through Mato Grosso and Rondônia to Acre, concentrating most forest destruction due to the expansion of cattle ranching, agriculture (especially soybeans), and land grabbing, facilitated by highways and weak enforcement.
Figure 4.
Spatial distribution and percentage of LDI degradation levels by biome. The Level 1 area of the Pantanal covers 300 hectares (0.002%) and is not shown in the figure.
In the Cerrado, the conserved class accounts for 60.83% of the territory, while degradation Levels 2 and 3 form a continuous region associated with agricultural expansion. This expansion is most pronounced in the MATOPIBA region, considered the country’s newest agricultural frontier. MATOPIBA comprises parts of the states of Maranhão, Tocantins, Piauí, and Bahia, with a predominance of the Cerrado biome, although it also includes transition areas with other biomes.
The Caatinga has 78.60% conserved area, but approximately 19.40% of its territory falls within degradation Levels 3 and 4, a pattern compatible with the combined effects of water stress and diffuse agricultural and livestock use in the semi-arid region [50]. The Pantanal, in turn, combines a high conservation rate (87.95%) with clusters of Level 3 and 4 degradation, which is consistent with recent fire events and eco-hydrological disturbances reported for the biome [51].
The Atlantic Forest exhibits the lowest proportion of conserved territory (34.77%) and a high presence of intermediate degradation levels in historically converted and fragmented landscapes with greater urbanization. The Pampa has 58.53% conserved area and a degraded area in Levels 2 and 3 (40.23%) in the northern part of the biome, reflecting the intensification of agriculture and livestock production over native grasslands [52].
In this context, the 2021 assessment of Brazilian biomes suggests that most conserved areas are concentrated in large continuous forest tracts in the Amazon and in the wetlands of the Pantanal. In contrast, the most extensive degraded areas are located in productive corridors (Cerrado and Pampa), urban concentrations (Atlantic Forest), and semi-arid areas (Caatinga), where fire, land conversion, and soil management appear to shape the severity of degradation.
3.2. Degradation and Pressures on Traditional Communities
The analysis of the LDI between 2001 and 2021 reveals a strong intra-territorial protective effect and intensified degradation in areas surrounding ILs. Across all cases analyzed, the IL polygons remained predominantly classified as conserved, while degraded classes expanded in the peripheral zones (Figure 5).
Figure 5.
LDI assessment in ILs analyzed and surrounding areas.
In the eastern Amazon mosaic (the Alto Rio Guamá, Alto Turiaçu, Awá, and Caru ILs), the surrounding area showed a marked increase in Classes 1–3. Level 1 rose from 7275 to 19,650 ha, Level 2 from 13,075 to 20,750 ha, and Level 3 from 1625 to 20,875 ha between 2001 and 2021, indicating a substantial expansion of degraded conditions around territorial boundaries. This pattern is consistent with the documented context of logging and cattle-ranching invasions, as well as with land repossession actions and territorial governance efforts in the Alto Rio Guamá IL. A survey conducted by Instituto Escolhas [53] reports that 12% of the Alto Rio Guamá territory was deforested due to invasions by loggers and cattle ranchers, reinforcing the structural pressure along the frontier zone between the states of Pará and Maranhão.
In the Araguaia corridor (the Utaria Wyhyna/Iròdu Irána, Tapirapé/Karajá, Inawebohona, Cacique Fontoura, Taego Ãwa ILs, and Araguaia Park), there was a 1.630% increase in Level 2, in addition to increases in Levels 3 and 4. This rise in degradation is compatible with the historical conversion of native forest areas into pastureland in the middle Araguaia region and on Bananal Island [31]. In this territory, land conflicts have led to court-ordered evictions of cattle ranchers, as well as territorial setbacks that were later reversed in favor of local peoples.
In the Mangueirinha IL, adjacent areas maintained high degradation intensity, whereas within the IL, only Level 2 degradation increased. The interior remains predominantly conserved, a pattern consistent with evidence that the formal recognition of ILs in the Atlantic Forest reduces deforestation rates from −0.73% to −0.05% per year [54]. However, the regional history records multiple violations associated with territorial reduction, infrastructure development (highways and reservoir construction), and illegal Araucaria extraction, which may help explain the persistence of diffuse pressures, albeit less intense than those observed along Amazonian frontiers [32].
When the QTs are analyzed (Figure 6), the interiors of each territory remain predominantly conserved across all three cases. At the same time, the surrounding areas show intensified degradation, especially near the Kalunga and Kalunga do Mimoso QTs. This pattern suggests that territorial delimitation may help maintain ecological integrity within the QTs. However, the degradation observed in surrounding regions indicates that land governance and enforcement may still be insufficient.
Figure 6.
LDI assessment in QTs analyzed and surrounding areas.
In the Fazenda Grande and Boa Vista do Pixaim QTs, between 2001 and 2021, the surrounding area shifted from a pattern of moderate degradation (Levels 2 and 3) to severe degradation (Level 4). Within the QTs, the area classified as Level 4 increased from 1425 ha to 3925 ha, while Level 3 declined from 1875 to 1000 ha and Level 2 from 450 to 100 ha. These QTs have a history of violence and land disputes, including the destruction of crops and fences by hired gunmen in Boa Vista do Pixaim. Recent episodes include reports of unlawful confinement of quilombola residents by alleged police officers and intimidation linked to the progress of the demarcation process in Fazenda Grande [55].
In the Kalunga and Kalunga do Mimoso QTs, degradation increased substantially, resulting in the emergence of an area of 3125 ha classified as Level 2 and a 575 ha increase in Level 3, indicating a recent advance in degradation. These new hotspots are concentrated mainly in areas bordering neighboring properties and along roads and internal access routes, suggesting spatial correspondence with agricultural expansion, road opening, and recurrent fire use.
In the Baú QT, the area shows an increase of 675 ha in Level 2 degradation and 150 ha in Level 3, with a slight reduction in Level 1, indicating a transition toward more severe stages of degradation from 2001 to 2021. The current period has been marked by threats and violence in this territory, including the recent armed attack in 2024. The slow pace of land regularization in this territory has hindered its protection, allowing the advance of enterprises such as lithium mining, which further increases socio-environmental vulnerability in the area. This pattern is consistent with the broader worsening trend observed in the surrounding area, according to the LDI.
4. Discussion
The LDI highlights the combination of loss of conserved areas and the densification of intermediate degradation classes across Brazilian territory, especially in productive belts and agricultural frontier zones. Structurally, the country still retains extensive blocks of native vegetation, particularly in large continuous forest tracts and wetlands. However, the LC between 2001 and 2021 indicates that the area covered by native vegetation is declining. At the same time, areas previously moderately affected by degradation are shifting toward more severe levels of degradation. This configuration is consistent with and reinforces the interpretation of a chronic and cumulative degradation process, in which apparent stability in some areas masks long-term trajectories of declining land quality.
The results are consistent with the historical context of Brazilian occupation. The Southeast region, in particular, has been the country’s main economic center since European colonization, with deforestation of native forests for coffee and sugarcane cultivation, as well as mining, especially during the eighteenth and nineteenth centuries [56]. The removal of native vegetation exposed fragile soils, leading to erosion, gully formation, and fertility loss, aggravated by conventional agricultural practices and intensive livestock production [57]. From the twentieth century onward, accelerated urbanization and industrialization increased pressure on natural resources, expanding demand for water, soil, and energy and, consequently, intensifying degradation.
Historically, Brazilian occupation began along the coast. Still, the most intense degradation became consolidated inland, where the economy was organized around extensive agriculture and livestock production, concentrating land ownership and encouraging predatory resource use. In the Northeast, low-technology agriculture based on slash-and-burn practices, short-term cultivation, and land abandonment exhausted the soil, reduced biodiversity, and generated poorer areas [58]. In addition, the gradual replacement of the Caatinga by pasture and agricultural land has been documented in several basins and semi-arid landscapes, resulting from intensified urbanization, livestock raising, and firewood and charcoal extraction [59,60].
By contrast, the Central-West region was incorporated more recently into the agricultural frontier, driven by incentive policies, technological advances (such as soybean varieties adapted to the Cerrado), and road infrastructure [61]. In this context, the growing international demand for soybeans, corn, and beef intensified land conversion and input use, accelerating compaction, erosion, and organic matter loss [52].
More broadly, changes in commodity prices, federal incentive programs (such as Proálcool for sugarcane), and the flexibilization of environmental legislation have shaped land use and favored agricultural and livestock expansion at the expense of conservation [62]. The cumulative duration of intensive land use, combined with the lack of conservation practices, helps explain why these regions currently present the highest rates of soil degradation, erosion, fertility loss, and habitat fragmentation.
In this context, the LDI is proposed as an analytical complement to global metrics such as UNCCD Indicator 15.3.1 [63]. By incorporating LC, GPP, and soil organic carbon into a single spatial framework, the index was designed to explore cumulative degradation processes that may not be fully captured by land-cover stability alone. In particular, the combined use of these sub-indicators may help identify areas where apparently stable LC coincides with long-term anthropogenic pressure, reduced carbon stocks, or lower ecosystem productivity. However, this interpretation should be treated as an analytical hypothesis rather than as a validated diagnostic outcome, since the present study does not compare LDI classes with independent field measurements, higher-resolution degradation assessments, or external productivity and soil-quality datasets.
The projected progressive displacement of agricultural areas toward regions outside their optimal climatic suitability range indicates that production systems will increasingly operate under less favorable environmental conditions, characterized by a higher frequency of temperatures above the physiological optimum and greater water deficit. Rising temperatures and reduced rainfall have already shifted about 28% of Brazilian agricultural areas into suboptimal climatic conditions, with projections indicating that this figure could reach up to 74% by 2060 if current trends persist [54].
This scenario may favor additional productivity losses, land abandonment, and the expansion of degraded pastures [64]. This cycle may further exacerbate degradation, as less-adapted production systems that rely on inadequate conservation measures intensify erosion, loss of organic matter, and vegetation fragmentation. From this perspective, the LDI can be interpreted as a spatially explicit indicator that identifies areas where the interaction among climate stress, land use, and inadequate soil management may intensify degradation in the absence of intervention.
Differences in conservation status among Brazilian biomes confirm that land degradation in the country is not a homogeneous phenomenon, but rather the expression of historical trajectories of occupation and ecological vulnerabilities shaped by economic and political interests. In large forest blocks and wetlands, such as the Amazon and Pantanal, the LDI points to the coexistence of extensive conserved areas with degradation corridors associated with deforestation fronts, fires, and hydrological changes. In these contexts, the priority is no longer merely to restore areas already severely degraded, but, above all, to contain conversion and fragmentation along these fronts, preventing areas with intermediate degradation from advancing toward irreversible thresholds of ecosystem function loss [65].
In biomes of consolidated agricultural frontiers, such as the Cerrado and Pampa, the LDI records the accumulation of areas at intermediate levels of degradation, reflecting prolonged exposure to monocultures, extensive livestock production, and intensive soil tillage [66]. In MATOPIBA, the expansion of pasturelands and the 253% increase in soybean area between 2000 and 2014 illustrate this dynamic, with estimates indicating that 17.2 million hectares may still be legally deforested in the region [67]. The fact that the most degraded classes have grown proportionally less than the intermediate levels suggests ecosystems that remain functionally active, but with impoverished soils and high dependence on inputs. In these regions, priority actions should focus on changing the current production model, reducing pressure on native remnants, and preventing intermediate degradation from turning into widespread severe degradation [68].
In the Atlantic Forest and parts of the Caatinga, however, the LDI reflects distinct trajectories. In the former, degradation is marked by the historical conversion of land cover, intense vegetation fragmentation, and strong urbanization. The landscape is dominated by mixed-use mosaics in which forest remnants are isolated within agricultural and urban matrices [69]. In the latter, the structural water stress of the semi-arid region combines with diffuse land uses, extensive management, and limited capacity to invest in conservation practices, producing degradation hotspots amid areas that remain conserved [49]. In both cases, the intermediate LDI classes indicate areas where restoration policies, support for agroecological farming, and adaptive water management can produce relatively rapid and synergistic gains in biodiversity, production, and water security.
The focus on certain ILs and QTs makes explicit the presence of an intra-territorial protective effect, which is associated with intensified degradation in adjacent zones. This pattern corroborates evidence that ILs and protected areas in the Amazon accounted for only 5% of net forest loss between 2000 and 2021, despite covering more than half of the region’s forested area [70]. Consistently, the results show that the conserved class predominates within these territories. In contrast, the more degraded classes become denser around them, following fronts of deforestation, agricultural expansion, infrastructure projects, and mining [22].
This spatial configuration suggests that ILs and QTs analyzed function as conservation cores amid a growing front of anthropogenic pressure. In the Amazon, ILs and protected areas accounted for only 5% of net forest loss between 2000 and 2021, despite encompassing more than half of the forested areas [70], and Indigenous territories in the southwestern Amazon prevented significant deforestation even under pressures from urban expansion and cattle ranching [71]. However, this protective effect is not guaranteed: deforestation within Amazonian ILs has increased by 129% since 2013, penetrating 30% deeper into the interior of these territories between 2019 and 2021 [72].
At the same time, the advance of more severe classes in the surroundings of ILs and QTs and, in some cases, the internal shift from moderate to more intense levels of degradation indicate that the protective effect is not guaranteed. Recent data confirm this trend: deforestation within Amazonian ILs has increased by 129% since 2013, penetrating 30% deeper into the interior of these territories between 2019 and 2021 [72]. Land conflicts, invasions, illegal resource extraction, and delays in land titling increase socio-environmental vulnerability and tend to bring the degraded frontier closer to territorial boundaries and, eventually, into the territories themselves. In these contexts, degradation ceases to be merely a biophysical problem. It also becomes an expression of environmental injustice and rights violations, in which the loss of land quality is intertwined with threats to life, culture, and the political autonomy of communities [73].
For national and state strategies to combat degradation, such as the PAB-Brazil [15], the LDI can help connect sectoral policies that currently operate in a fragmented way, such as biodiversity conservation, agricultural expansion, climate change adaptation, the regularization of traditional territories, and regional development policies. International experiences reinforce the need for integration. In Nigeria, the operationalization of LDN is hindered by mechanisms dispersed across uncoordinated policy instruments [74], a problem the LDI seeks to mitigate by providing a common metric for multiple scales and sectors. By showing that land degradation in Brazil is concentrated largely in productive corridors and in the peripheries of conserved territories, the index suggests that the most effective responses will be those capable of articulating economic, regulatory, and territorial justice instruments, rather than relying exclusively on isolated restoration actions in areas with high levels of degradation.
In practical terms, the LDI can serve as a spatial prioritization tool for land management and ecological conservation. Intermediate degradation classes may indicate areas where preventive measures, such as soil conservation, sustainable intensification, agroecological transition, or recovery of degraded pasture, can prevent further decline. More severe classes may help identify priority areas for active restoration, erosion control, revegetation, or stricter regulation of land-use practices. Conserved areas surrounded by worsening degradation may indicate strategic locations for buffer zones, ecological corridors, and territorial protection measures. Therefore, the LDI can inform restoration planning, conservation zoning, monitoring of agricultural frontiers, and the coordination of land-use policies with biodiversity and soil conservation strategies.
In operational terms, the LDI can support land management and ecological conservation by organizing intervention priorities according to degradation severity and territorial context. Rather than prescribing a single management action, the index can be used to distinguish areas where prevention, restoration, monitoring, or territorial protection should be prioritized. Intermediate degradation classes may guide early interventions to prevent further decline, while severe classes may indicate areas where active restoration or stricter land-use regulation is needed. Conserved areas adjacent to expanding degradation fronts can be interpreted as strategic zones for maintaining connectivity, establishing buffers, and strengthening protection measures.
Overall trends indicate the need to rapidly halt the loss of conserved areas and reverse the growth of intermediate degradation classes before they reach critical levels. Differences among biomes reinforce the need for territorialized responses, and the strategic role of Indigenous peoples and quilombola communities highlights that an effective LDN agenda must also be socially just. At the same time, the interpretation of these patterns should take into account that the LDI is an integrated proxy for relative degradation intensity and does not, by itself, establish causal mechanisms.
5. Conclusions
The analyses conducted conclude that the LDI fulfills its objective of providing a consistent measure of land degradation in Brazil. Overall, the results indicate that the LDI captures spatial variability and relative differences in degradation intensity across the national territory. The indicator proved sensitive to both structural differences among biomes and historical trajectories of occupation, revealing severity gradients that isolated metrics would not capture. By distinguishing degradation levels at two points in time (2001 and 2021), the LDI also enabled identification of trends of worsening or stabilization, demonstrating its applicability as a monitoring tool within the limits of the adopted methodological framework.
In terms of general trends, the LDI points to a combination of declining areas with better soil conditions and the expansion of intermediate degradation classes, especially in agricultural frontier zones and productive corridors. Although extensive conserved areas remain in some biomes, the observed trajectory indicates a cumulative loss of land quality, with intensification in areas already under pressure from deforestation, fires, land-use conversion, and intensive soil management. Differences among biomes do not represent exceptions to this pattern, but rather variations in how degradation is expressed. In some cases, degradation is associated with the recent opening of agricultural frontiers; in others, it is linked to a long history of land use and vegetation fragmentation, or to contexts of structural aridity and limited capacity to invest in conservation practices. These findings reinforce that land degradation in Brazil is a spatially heterogeneous and path-dependent process.
The inclusion of selected ILs and QTs in the analysis provided additional evidence of how land degradation dynamics may differ within and around traditional territories. Across the six case studies analyzed, the results suggest that some ILs and QTs exhibited lower degradation levels than their surrounding areas, indicating their potential to conserve land quality under specific territorial and governance conditions. However, these findings should not be generalized to all ILs and TQs in Brazil, as the analysis was limited to a small set of cases and did not capture the full diversity of ecological, institutional, and socio-economic contexts in which these territories are embedded. The progression of degradation in surrounding areas and, in some cases, within the analyzed territories also indicates that any protective effect is context-dependent and may be weakened by external pressures such as deforestation, land-use conversion, fires, and limited support for territorial management.
Despite the advances made in this study, some limitations should be considered when interpreting the results. The use of equal weights and discrete thresholds, although useful for transparency and national-scale comparability, simplifies ecological and productive differences among Brazilian biomes and implies partial compensability among sub-indicators. Thus, similar LDI scores may result from different combinations of LC, GPP, and SOC conditions, which should be considered when interpreting the severity of degradation. In addition, the analysis was based on two benchmark periods centered on 2001 and 2021, which limits the assessment of interannual variability and short-term responses to extreme events. The climate-screened GPP and the retrospective estimation of SOC for 2001 should therefore be interpreted as operational approximations rather than direct annual observations. Finally, although the LDI was assessed through conceptual consistency, participatory contextual calibration, spatial plausibility, and comparison with documented degradation processes, it was not validated against independent field measurements or higher-resolution degradation assessments. Future studies should compare LDI outputs with local evidence and field-based soil and vegetation measurements to evaluate its sensitivity, uncertainty, and diagnostic performance, and to test alternative weighting schemes, aggregation methods, and biome-specific thresholds.
Overall, the LDI provides a spatially explicit and integrative framework for assessing relative land degradation patterns in Brazil within the limits of the adopted methodological assumptions. Its national-scale application offers a preliminary basis for identifying degradation gradients, territorial contrasts, and priority areas for further investigation. However, its use as a diagnostic or monitoring tool should be accompanied by sensitivity analyses, uncertainty assessment, and independent validation.
Author Contributions
Conceptualization, U.A.B., A.M.P.-M. and J.E.C.; methodology, U.A.B.; validation, U.A.B., S.H.O. and L.D.A.C.; formal analysis, U.A.B., A.M.P.-M. and J.E.C.; investigation, U.A.B., S.H.O. and L.D.A.C.; resources, U.A.B.; data curation, U.A.B.; writing—original draft preparation, U.A.B., H.C.d.B.; writing—review and editing, H.C.d.B., S.H.O., L.D.A.C. and A.M.G.L.; visualization, U.A.B., H.C.d.B. and A.M.G.L.; supervision, A.M.P.-M. and J.E.C.; funding acquisition, U.A.B. and J.E.C. All authors have read and agreed to the published version of the manuscript.
Funding
This research and the APC were funded by Brazilian Federal Agency for Support and Evaluation of Graduate Education-Brazil (CAPES), grant numbers 88887.081801/2024-00 and 88881.083587/2024-01.
Data Availability Statement
The Land Degradation Index (LDI) presented in this study can be accessed at https://doi.org/10.5281/zenodo.19262821.
Acknowledgments
We wish to thank the Ministry of the Environment and Climate Change (MMA) for its partnership with the Caatinga and Desertification Observatory (OCA) through the decentralized execution agreement (TED nº 07/2024 SNPCT/MMA/UFCG) and Brazilian Federal Agency for Support and Evaluation of Graduate Education (CAPES), which provided scholarships to the first to fourth authors. The authors are also grateful to the National Institute of the Semi-Arid Region (INSA).
Conflicts of Interest
The authors declare no conflicts of interest.
Abbreviations
The following abbreviations are used in this manuscript:
| Embrapa | Brazilian Agricultural Research Corporation |
| GPP | Gross Primary Productivity |
| IBGE | Brazilian Institute of Geography and Statistics |
| IL | Indigenous Land |
| INSA | National Institute of the Semiarid |
| LC | Land Cover Change Legacy |
| LDI | Land Degradation Index |
| LDN | Land Degradation Neutrality |
| LULC | Land Use and Land Cover |
| MATOPIBA | Region comprising the states of Maranhão, Tocantins, Piauí, and Bahia |
| MMA | Ministry of the Environment and Climate Change |
| NDVI | Normalized Difference Vegetation Index |
| PAB-Brazil | Brazilian Action Plan to Combat Desertification and Mitigate the Effects of Drought |
| PRODES | Annual Monitoring of Native Vegetation Suppression |
| QT | Quilombola Territory |
| SDG | Sustainable Development Goal |
| SOC | Soil Organic Carbon |
| SPEI | Standardized Precipitation Evapotranspiration Index |
| UN | United Nations |
| UNCCD | United Nations Convention to Combat Desertification |
Appendix A
Table A1.
Quantification of LDI classes by biome.
References
- UNCCD. Global Land Outlook, 2nd ed.; UNCCD: Bonn, Germany, 2022; ISBN 978-92-95118-52-2. [Google Scholar]
- Dronin, N. Reasons to Rename the UNCCD: Review of Transformation of the Political Concept through the Influence of Science. Environ. Dev. Sustain. 2023, 25, 2058–2078. [Google Scholar] [CrossRef] [Scilit]
- Bai, Z.; Russ, J.D.; Mayr, K.F.; Dent, D. How Is Gaia Doing? Trends in Global Land Degradation and Improvement. Ambio 2025, 54, 1902–1938. [Google Scholar] [CrossRef] [Scilit]
- Eckert, S.; Hüsler, F.; Liniger, H.; Hodel, E. Trend Analysis of MODIS NDVI Time Series for Detecting Land Degradation and Regeneration in Mongolia. J. Arid Environ. 2015, 1113, 16–28. [Google Scholar] [CrossRef] [Scilit]
- Yengoh, G.T.; Dent, D.; Olsson, L.; Tengberg, A.E.; Tucker, C.J., III. Use of the Normalized Difference Vegetation Index (NDVI) to Assess Land Degradation at Multiple Scales: Current Status, Future Trends, and Practical Considerations; Springer: Cham, Switzerland, 2015; ISBN 978-3-319-24112-8. [Google Scholar]
- Bär, V.; Akinyemi, F.O.; Ifejika Speranza, C. Land Cover Degradation in the Reference and Monitoring Periods of the SDG Land Degradation Neutrality Indicator for Switzerland. Ecol. Indic. 2023, 151, 110252. [Google Scholar] [CrossRef] [Scilit]
- Thomas, A.; Bentley, L.; Feeney, C.; Lofts, S.; Robb, C.; Rowe, E.C.; Thomson, A.; Warren-Thomas, E.; Emmett, B. Land Degradation Neutrality: Testing the Indicator in a Temperate Agricultural Landscape. J. Environ. Manag. 2023, 346, 118884. [Google Scholar] [CrossRef] [Scilit] [PubMed]
- Prince, S.D. Challenges for Remote Sensing of the Sustainable Development Goal SDG 15.3.1 Productivity Indicator. Remote Sens. Environ. 2019, 234, 111428. [Google Scholar] [CrossRef] [Scilit]
- Sims, N.C.; Barger, N.N.; Metternicht, G.I.; England, J.R. A Land Degradation Interpretation Matrix for Reporting on UN SDG Indicator 15.3.1 and Land Degradation Neutrality. Environ. Sci. Policy 2020, 114, 1–6. [Google Scholar] [CrossRef] [Scilit]
- Cherlet, M.; Hutchinson, C.; Reynolds, J.; Hill, J.; Sommer, S.; Von Maltitz, G. World Atlas of Desertification; Publications Office of the European Union: Luxembourg, 2018; ISBN 978-92-79-75350-3. [Google Scholar]
- Bottino, M.J.; Nobre, P.; Giarolla, E.; da Silva, M.B., Jr.; Capistrano, V.B.; Malagutti, M.; Tamaoki, J.N.; de Oliveira, B.F.A.; Nobre, C.A. Amazon Savannization and Climate Change Are Projected to Increase Dry Season Length and Temperature Extremes over Brazil. Sci. Rep. 2024, 14, 5131. [Google Scholar] [CrossRef] [Scilit] [PubMed]
- Suzuki, L.E.A.S.; de Araújo Pedron, F.; de Oliveira, R.B.; Rovedder, A.P.M. Challenges in the Management of Environmentally Fragile Sandy Soils in Southern Brazil. Soil Syst. 2023, 7, 9. [Google Scholar] [CrossRef] [Scilit]
- Costa, J.M.D.; dos Santos, V.F.; da Silva Koch, E.R. Changes in the Landscape, Threats, and the Struggle of the Quilombola Communities from Alto Trombetas for Their Territories. Tapuya Lat. Am. Sci. Technol. Soc. 2023, 6, 2278866. [Google Scholar] [CrossRef] [Scilit]
- Rorato, A.C.; Picoli, M.C.A.; Verstegen, J.A.; Camara, G.; Silva Bezerra, F.G.; Escada, M.I.S. Environmental Threats over Amazonian Indigenous Lands. Land 2021, 10, 267. [Google Scholar] [CrossRef] [Scilit]
- MMA. Plano de Ação Brasileiro de Combate à Desertificação e Mitigação Dos Efeitos Da Seca; Ministério do Meio Ambiente e Mudança do Clima: Brasília, Brazil, 2025. [Google Scholar]
- Dhillon, R.; Moncur, Q. Small-Scale Farming: A Review of Challenges and Potential Opportunities Offered by Technological Advancements. Sustainability 2023, 15, 15478. [Google Scholar] [CrossRef] [Scilit]
- Maeda, E.E.; Abera, T.A.; Siljander, M.; Aragão, L.E.O.C.; Moura, Y.M.d.; Heiskanen, J. Large-Scale Commodity Agriculture Exacerbates the Climatic Impacts of Amazonian Deforestation. Proc. Natl. Acad. Sci. USA 2021, 118, e2023787118. [Google Scholar] [CrossRef] [Scilit]
- Lapola, D.M.; Pinho, P.; Barlow, J.; Aragão, L.E.O.C.; Berenguer, E.; Carmenta, R.; Liddy, H.M.; Seixas, H.; Silva, C.V.J.; Silva-Junior, C.H.L.; et al. The Drivers and Impacts of Amazon Forest Degradation. Science 2023, 379, eabp8622. [Google Scholar] [CrossRef] [Scilit] [PubMed]
- Curtis, P.G.; Slay, C.M.; Harris, N.L.; Tyukavina, A.; Hansen, M.C. Classifying Drivers of Global Forest Loss. Science 2018, 361, 1108–1111. [Google Scholar] [CrossRef] [Scilit]
- Marinho, K.F.S.; de Melo Barbosa Andrade, L.; Spyrides, M.H.C.; Silva, C.M.S.; de Oliveira, C.P.; Bezerra, B.G.; Mutti, P.R. Climate Profiles in Brazilian Microregions. Atmosphere 2020, 11, 1217. [Google Scholar] [CrossRef] [Scilit]
- Braga, A.; Laurini, M. Spatial Heterogeneity in Climate Change Effects across Brazilian Biomes. Sci. Rep. 2024, 14, 16414. [Google Scholar] [CrossRef] [Scilit]
- Alves-Pinto, H.N.; Cordeiro, C.L.O.; Geldmann, J.; Jonas, H.D.; Gaiarsa, M.P.; Balmford, A.; Watson, J.E.M.; Latawiec, A.E.; Strassburg, B. The Role of Different Governance Regimes in Reducing Native Vegetation Conversion and Promoting Regrowth in the Brazilian Amazon. Biol. Conserv. 2022, 267, 109473. [Google Scholar] [CrossRef] [Scilit]
- FUNAI. Fundação Nacional Dos Povos Indígenas. Available online: https://www.gov.br/funai/pt-br/atuacao/terras-indigenas/geoprocessamento-e-mapas/painel-terras-indigenas (accessed on 9 March 2025).
- Rorato, A.C.; Camara, G.; Escada, M.I.S.; Picoli, M.C.A.; Moreira, T.; Verstegen, J.A. Brazilian Amazon Indigenous Peoples Threatened by Mining Bill. Environ. Res. Lett. 2020, 15, 1040a3. [Google Scholar] [CrossRef] [Scilit]
- IBGE. O Brasil Quilombola; Instituto Brasileiro de Geografia e Estatística (IBGE): Brasília, Brazil, 2025. [Google Scholar]
- Costa, D.M. Uncovering Histories: Archaeology and the Contemporary Struggles of Quilombola Communities in the Amazon. J. Afr. Diaspora Archaeol. Herit. 2025, 14, 24–49. [Google Scholar] [CrossRef] [Scilit]
- IBGE—Instituto Brasileiro de Geografia e Estatística. Demographic Census. Available online: https://www.ibge.gov.br/estatisticas/sociais/saude/22827-censo-demografico-2022.html (accessed on 9 May 2025).
- Neepes Mapa de Conflitos. Available online: https://mapadeconflitos.ensp.fiocruz.br/conflito/ma-povos-indigenas-da-ti-alto-turiacu-cansam-de-ameacas-a-sua-seguranca-e-a-seu-territorio-e-desistem-de-esperar-a-atuacao-do-poder-publico/ (accessed on 6 June 2025).
- Meline, M.; Eyng, V. Plano de Gestão Terra Indígena Alto Rio Guamá; Equipe de Conservação da Amazônia: Brasília, Brazil, 2018. [Google Scholar]
- Bonin, I.T.; Liebgott, R.A. Necropolítica e Violências Contra os Povos Indígenas No Brasil. Caminhos Diálogo 2022, 10, 46–63. [Google Scholar] [CrossRef] [Scilit]
- Zanatto, V.G. Conflitos Entre Unidades de Conservação e Terras Indígenas: O Caso da Ilha do Bananal—TO. Meridiano Rev. Geogr. 2016, 5, 145–164. [Google Scholar]
- Bertuol, E.; da Silva, É.N. Conflito Agrário Na Terra Indígena de Mangueirinha—PR. História Debate 2021, 4, 1–13. [Google Scholar]
- CPT. Bahia Comissão Pastoral da Terra—Regional Bahia. Available online: https://cptba.org.br/comunidade-quilombola-tem-relatorio-tecnico-publicado-no-diario-oficial-da-uniao/ (accessed on 8 June 2025).
- dos Santos, J.G.; de Avelar, G.A. Conflitos Por Terra No Território Quilombo Kalunga: Agronegócio, Mineração e Pequenas Centrais Hidroelétricas. Espaço Rev. 2023, 25, 46–57. [Google Scholar] [CrossRef] [Scilit]
- Evangelista, S.R.; Maia, M.B.; Costa, M.C.G.; Furtunato, K.V.; Tavares, H.S. Políticas Públicas Educacionais Para os Quilombos: A Comunidade Quilombola Kalunga do Mimoso. RELPE Rev. Leituras Pedagog. Educ. 2022, 5, 78–93. [Google Scholar]
- ABA. Manifestação de Repúdio ao Violento Atentado Contra a Comunidade Quilombola Baú, Município de Araçuaí, Vale do Jequitinhonha (MG); Associação Brasileira de Antropologia: Brasília, Brazil, 2024. [Google Scholar]
- Souza, C.M.; Shimbo, J.Z.; Rosa, M.R.; Parente, L.L.; Alencar, A.A.; Rudorff, B.F.T.; Hasenack, H.; Matsumoto, M.; Ferreira, L.G.; Souza-Filho, P.W.M.; et al. Reconstructing Three Decades of Land Use and Land Cover Changes in Brazilian Biomes with Landsat Archive and Earth Engine. Remote Sens. 2020, 12, 2735. [Google Scholar] [CrossRef] [Scilit]
- Vicente-Serrano, S.M.; Beguería, S.; López-Moreno, J.I. A Multiscalar Drought Index Sensitive to Global Warming: The Standardized Precipitation Evapotranspiration Index. J. Clim. 2010, 23, 1696–1718. [Google Scholar] [CrossRef] [Scilit]
- Beguería, S.; Vicente-Serrano, S.M.; Reig, F.; Latorre, B. Standardized Precipitation Evapotranspiration Index (SPEI) Revisited: Parameter Fitting, Evapotranspiration Models, Tools, Datasets and Drought Monitoring. Int. J. Climatol. 2014, 34, 3001–3023. [Google Scholar] [CrossRef] [Scilit]
- Krause, A.; Papastefanou, P.; Gregor, K.; Layritz, L.S.; Zang, C.S.; Buras, A.; Li, X.; Xiao, J.; Rammig, A. Quantifying the Impacts of Land Cover Change on Gross Primary Productivity Globally. Sci. Rep. 2022, 12, 18398. [Google Scholar] [CrossRef] [Scilit] [PubMed]
- Yao, J.; Liu, H.; Huang, J.; Gao, Z.; Wang, G.; Li, D.; Yu, H.; Chen, X. Accelerated Dryland Expansion Regulates Future Variability in Dryland Gross Primary Production. Nat. Commun. 2020, 11, 1665. [Google Scholar] [CrossRef] [Scilit]
- da Silva, J.N.B.; Galvíncio, J.D.; de Queiroga Miranda, R.; de Moura, M.S.B. Modelos Da Produtividade Primária Bruta em Área de Floresta Tropical em Sazonalmente Seca, Usando Dados Reflectância da Vegetação de Caatinga. Rev. Bras. Geogr. Física 2021, 14, 3775–3784. [Google Scholar] [CrossRef] [Scilit]
- Alvares, C.A.; Stape, J.L.; Sentelhas, P.C.; de Moraes Gonçalves, J.L.; Sparovek, G. Köppen’s Climate Classification Map for Brazil. Meteorol. Z. 2013, 22, 711–728. [Google Scholar] [CrossRef] [Scilit]
- Conservation International. Trends Earth. Available online: http://trends.earth/ (accessed on 5 January 2024).
- IBGE—Instituto Brasileiro de Geografia e Estatística. Monitoramento da Cobertura e Uso da Terra do Brasil: 2018/2020; IBGE: Rio de Janeiro, Brazil, 2022. [Google Scholar]
- Bourgoin, C.; Betbeder, J.; Le Roux, R.; Gond, V.; Oszwald, J.; Arvor, D.; Baudry, J.; Boussard, H.; Le Clech, S.; Mazzei, L.; et al. Looking beyond Forest Cover: An Analysis of Landscape-Scale Predictors of Forest Degradation in the Brazilian Amazon. Environ. Res. Lett. 2021, 16, 114045. [Google Scholar] [CrossRef] [Scilit]
- de Oliveira, M.L.; dos Santos, C.A.C.; de Oliveira, G.; Silva, M.T.; da Silva, B.B.; de Brito Leite Cunha, J.E.; Ruhoff, A.; Santos, C.A.G. Remote Sensing-Based Assessment of Land Degradation and Drought Impacts over Terrestrial Ecosystems in Northeastern Brazil. Sci. Total Environ. 2022, 835, 155490. [Google Scholar] [CrossRef] [Scilit]
- Gonçalves-Souza, D.; Vilela, B.; Phalan, B.; Dobrovolski, R. The Role of Protected Areas in Maintaining Natural Vegetation in Brazil. Sci. Adv. 2021, 7, eabh2932. [Google Scholar] [CrossRef] [Scilit] [PubMed]
- Paredes-Trejo, F.; Barbosa, H.A.; Daldegan, G.A.; Teich, I.; García, C.L.; Kumar, T.V.L.; Buriti, C.d.O. Impact of Drought on Land Productivity and Degradation in the Brazilian Semiarid Region. Land 2023, 12, 954. [Google Scholar] [CrossRef] [Scilit]
- da Rosa Ferraz Jardim, A.M.; do Nascimento Araújo, G., Jr.; da Silva, M.V.; dos Santos, A.; da Silva, J.L.B.; Pandorfi, H.; de Oliveira-Júnior, J.F.; de Castro Teixeira, A.H.; Teodoro, P.E.; de Lima, J.L.M.P.; et al. Using Remote Sensing to Quantify the Joint Effects of Climate and Land Use/Land Cover Changes on the Caatinga Biome of Northeast Brazilian. Remote Sens. 2022, 14, 1911. [Google Scholar] [CrossRef] [Scilit]
- Kumar, S.; Getirana, A.; Libonati, R.; Hain, C.; Mahanama, S.; Andela, N. Changes in Land Use Enhance the Sensitivity of Tropical Ecosystems to Fire-Climate Extremes. Sci. Rep. 2022, 12, 964. [Google Scholar] [CrossRef] [Scilit]
- da Silveira, J.G.; de Oliveira Neto, S.N.; do Canto, A.C.B.; Leite, F.F.G.D.; Cordeiro, F.R.; Assad, L.T.; Silva, G.C.C.; de Oliveira Marques, R.; Dalarme, M.S.L.; Ferreira, I.G.M.; et al. Land Use, Land Cover Change and Sustainable Intensification of Agriculture and Livestock in the Amazon and the Atlantic Forest in Brazil. Sustainability 2022, 14, 2563. [Google Scholar] [CrossRef] [Scilit]
- Instituto Escolhas. Recuperação Florestal Nas Terras Indígenas do Pará: Cultivando Alimentos com a Floresta Viva; Instituto Escolhas: São Paulo, Brazil, 2025. [Google Scholar]
- Benzeev, R.; Zhang, S.; Rauber, M.A.; Vance, E.A.; Newton, P. Formalizing Tenure of Indigenous Lands Improved Forest Outcomes in the Atlantic Forest of Brazil. Proc. Natl. Acad. Sci. USA Nexus 2023, 2, 1–8. [Google Scholar] [CrossRef] [Scilit]
- Bahia Ciranda. Quilombolas São Mantidos em Cárcere Privado por Supostos Policiais Na Bahia. Available online: https://midianinja.org/quilombolas-sao-mantidos-em-carcere-privado-por-supostos-policiais-na-bahia/ (accessed on 7 October 2025).
- da Silva, A.S.; Seliger, R.; Sattler, D.; Heinrich, J. Soil Degradation in Southeast Brazil: A Challenge for Restoration and Rehabilitation. In Strategies and Tools for a Sustainable Rural Rio de Janeiro; Nehren, U., Schlϋter, S., Raedig, C., Sattler, D., Hissa, H., Eds.; Springer: Cham, Switzerland, 2019; pp. 377–389. [Google Scholar]
- Ayer, J.E.B.; Lämmle, L.; Garofalo, D.F.T.; Mincato, R.L.; Servidoni, L.E.; Pereira, S.Y. Dinâmica Espaço-Temporal do Uso e Ocupação da Terra No Município de Ribeirão Preto, São Paulo, Brasil. GOT—J. Geogr. Spat. Plan. 2021, 23, 88–120. [Google Scholar] [CrossRef] [Scilit]
- Lima, S.S.; Cordeiro, J.L.; Teixeira, L.P.; Maia, R.P.; da Silva, M.V.C.; Moro, M.F. Caracterização Geográfica e Dinâmica de Uso da Terra da Ibiapaba e Seu Entorno, Domínio Fitogeográfico da Caatinga. Rev. Bras. Geogr. Física 2022, 15, 2500–2524. [Google Scholar] [CrossRef] [Scilit]
- Coelho, V.H.R.; Montenegro, S.M.G.L.; das Neves Almeida, C.; de Lima, E.R.V.; Ribeiro Neto, A.; de Moura, G.S.S. Dinâmica do Uso e Ocupação do Solo em Uma Bacia Hidrográfica do Semiárido Brasileiro. Rev. Bras. Eng. Agrícola Ambient. 2014, 18, 64–72. [Google Scholar] [CrossRef] [Scilit]
- Mariano, D.A.; dos Santos, C.A.C.; Wardlow, B.D.; Anderson, M.C.; Schiltmeyer, A.V.; Tadesse, T.; Svoboda, M.D. Use of Remote Sensing Indicators to Assess Effects of Drought and Human-Induced Land Degradation on Ecosystem Health in Northeastern Brazil. Remote Sens. Environ. 2018, 213, 129–143. [Google Scholar] [CrossRef] [Scilit]
- Broquet, M.; Campos, F.S.; Cabral, P.; David, J. Habitat Quality on the Edge of Anthropogenic Pressures: Predicting the Impact of Land Use Changes in the Brazilian Upper Paraguay River Basin. J. Clean. Prod. 2024, 459, 142546. [Google Scholar] [CrossRef] [Scilit]
- de Moraes, M.C.P.; de Mello, K.; Toppa, R.H. Protected Areas and Agricultural Expansion: Biodiversity Conservation versus Economic Growth in the Southeast of Brazil. J. Environ. Manag. 2017, 188, 73–84. [Google Scholar] [CrossRef] [Scilit]
- Bezerra, U.A.; Oliveira, S.H.; Pérez-Marin, A.M.; de Brito Leite Cunha, J.E. Documento de Suporte Metodológico Sobre o Processo de Degradação da Terra (ODS 15.3.1); Conservation International: Campina Grande, Brazil, 2024. Available online: https://odsbrasil.gov.br/content/documentos/suporte-metodologico-ods-15-3-1.pdf (accessed on 12 May 2026).
- Yang, Y.; Tilman, D.; Jin, Z.; Smith, P.; Barrett, C.B.; Zhu, Y.-G.; Burney, J.; D’Odorico, P.; Fantke, P.; Fargione, J.; et al. Climate Change Exacerbates the Environmental Impacts of Agriculture. Science 2024, 385, eadn3747. [Google Scholar] [CrossRef] [Scilit] [PubMed]
- Francaviglia, R.; Almagro, M.; Vicente-Vicente, J.L. Conservation Agriculture and Soil Organic Carbon: Principles, Processes, Practices and Policy Options. Soil Syst. 2023, 7, 17. [Google Scholar] [CrossRef] [Scilit]
- Gomes, L.; Simões, S.; Dalla Nora, E.; de Sousa-Neto, E.; Forti, M.; Ometto, J. Agricultural Expansion in the Brazilian Cerrado: Increased Soil and Nutrient Losses and Decreased Agricultural Productivity. Land 2019, 8, 12. [Google Scholar] [CrossRef] [Scilit]
- Polizel, S.P.; da Silva Pinto Vieira, R.M.; Pompeu, J.; da Cruz Ferreira, Y.; de Sousa-Neto, E.R.; Barbosa, A.A.; Ometto, J.P.H.B. Analysing the Dynamics of Land Use in the Context of Current Conservation Policies and Land Tenure in the Cerrado—MATOPIBA Region (Brazil). Land Use Policy 2021, 109, 105713. [Google Scholar] [CrossRef] [Scilit]
- Colman, C.B.; Guerra, A.; Almagro, A.; de Oliveira Roque, F.; Rosa, I.M.D.; Fernandes, G.W.; Oliveira, P.T.S. Modeling the Brazilian Cerrado Land Use Change Highlights the Need to Account for Private Property Sizes for Biodiversity Conservation. Sci. Rep. 2024, 14, 4559. [Google Scholar] [CrossRef] [Scilit] [PubMed]
- Broggio, I.S.; Silva-Junior, C.H.L.; Nascimento, M.T.; Villela, D.M.; Aragão, L.E.O.C. Quantifying Landscape Fragmentation and Forest Carbon Dynamics over 35 Years in the Brazilian Atlantic Forest. Environ. Res. Lett. 2024, 19, 034047. [Google Scholar] [CrossRef] [Scilit]
- Qin, Y.; Xiao, X.; Liu, F.; de Sa e Silva, F.; Shimabukuro, Y.; Arai, E.; Fearnside, P.M. Forest Conservation in Indigenous Territories and Protected Areas in the Brazilian Amazon. Nat. Sustain. 2023, 6, 295–305. [Google Scholar] [CrossRef] [Scilit]
- Virtanen, P.K.; Gonzaga Roa, A.; Fernández-Llamazares, Á.; Apurinã, F.; Facundes, S. Indigenous Governance and Relationality Have Effectively Avoided Forest Loss in the Southwest Amazon. Commun. Earth Environ. 2025, 6, 289. [Google Scholar] [CrossRef] [Scilit]
- Silva-Junior, C.H.L.; Silva, F.B.; Arisi, B.M.; Mataveli, G.; Pessôa, A.C.M.; Carvalho, N.S.; Reis, J.B.C.; Silva, A.R., Jr.; Motta, N.A.C.S.; e Silva, P.V.M.; et al. Brazilian Amazon Indigenous Territories under Deforestation Pressure. Sci. Rep. 2023, 13, 5851. [Google Scholar] [CrossRef] [Scilit]
- Anaya, F.C.; Espírito-Santo, M.M. Protected Areas and Territorial Exclusion of Traditional Communities: Analyzing the Social Impacts of Environmental Compensation Strategies in Brazil. Ecol. Soc. 2018, 23, art8. [Google Scholar] [CrossRef] [Scilit]
- Speranza, C.I.; Adenle, A.; Boillat, S. Land Degradation Neutrality—Potentials for Its Operationalisation at Multi-Levels in Nigeria. Environ. Sci. Policy 2019, 94, 63–71. [Google Scholar] [CrossRef] [Scilit]
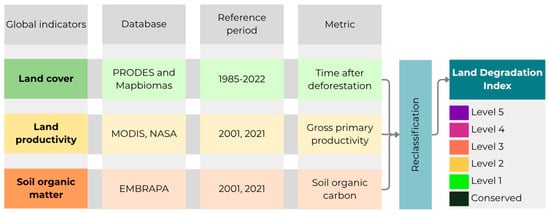
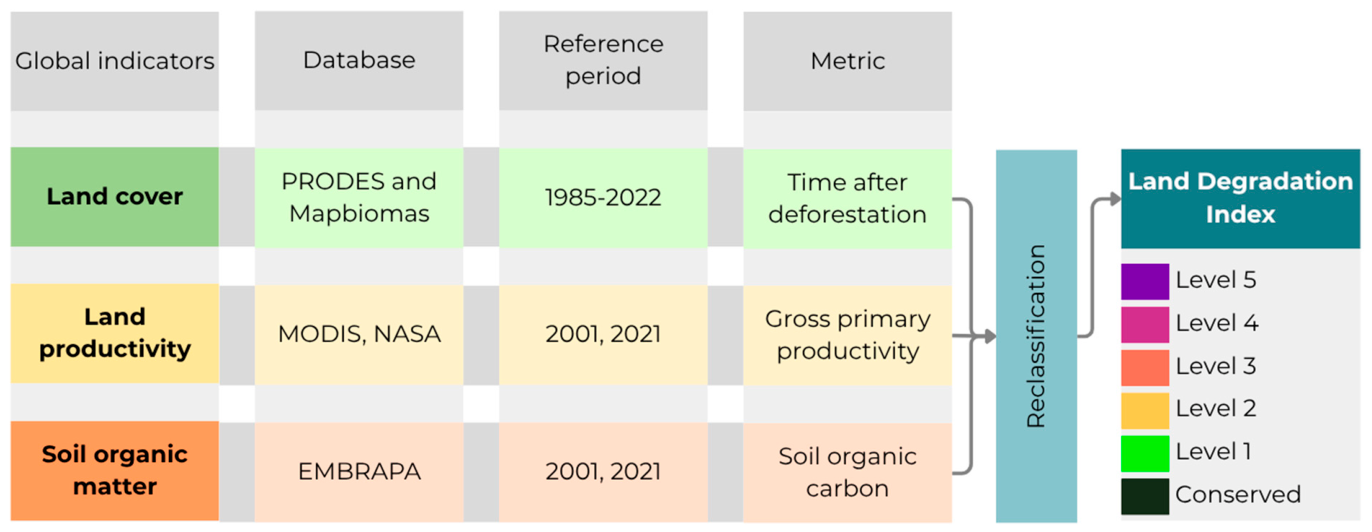
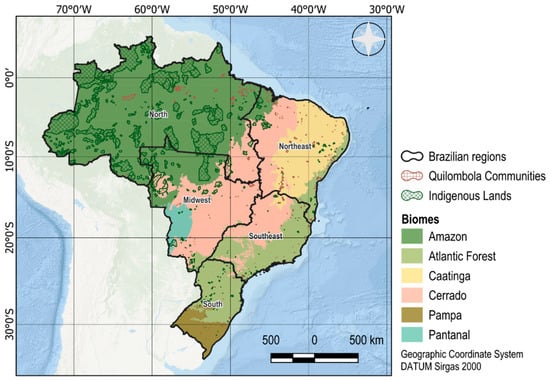
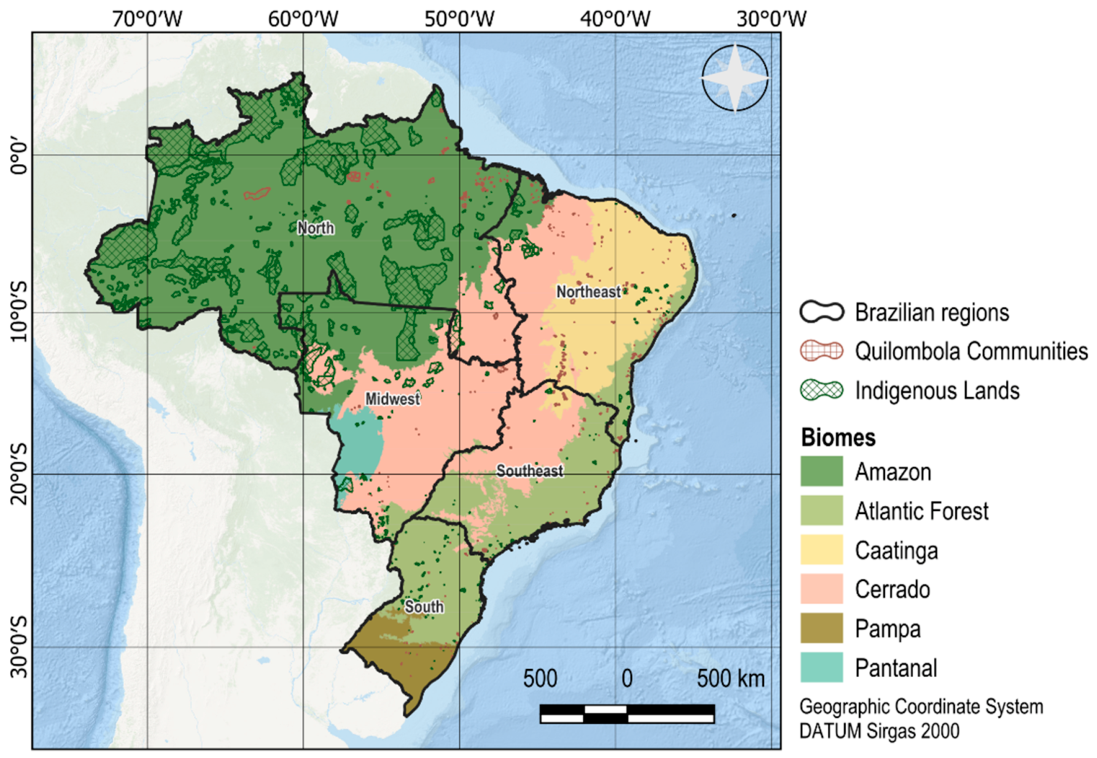
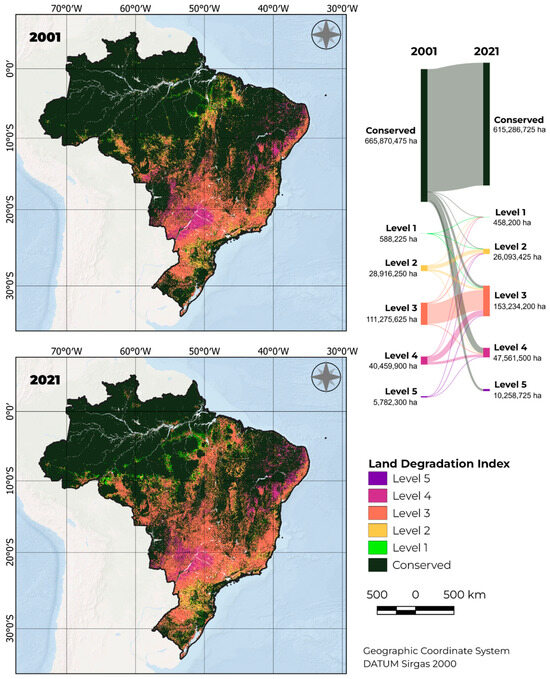
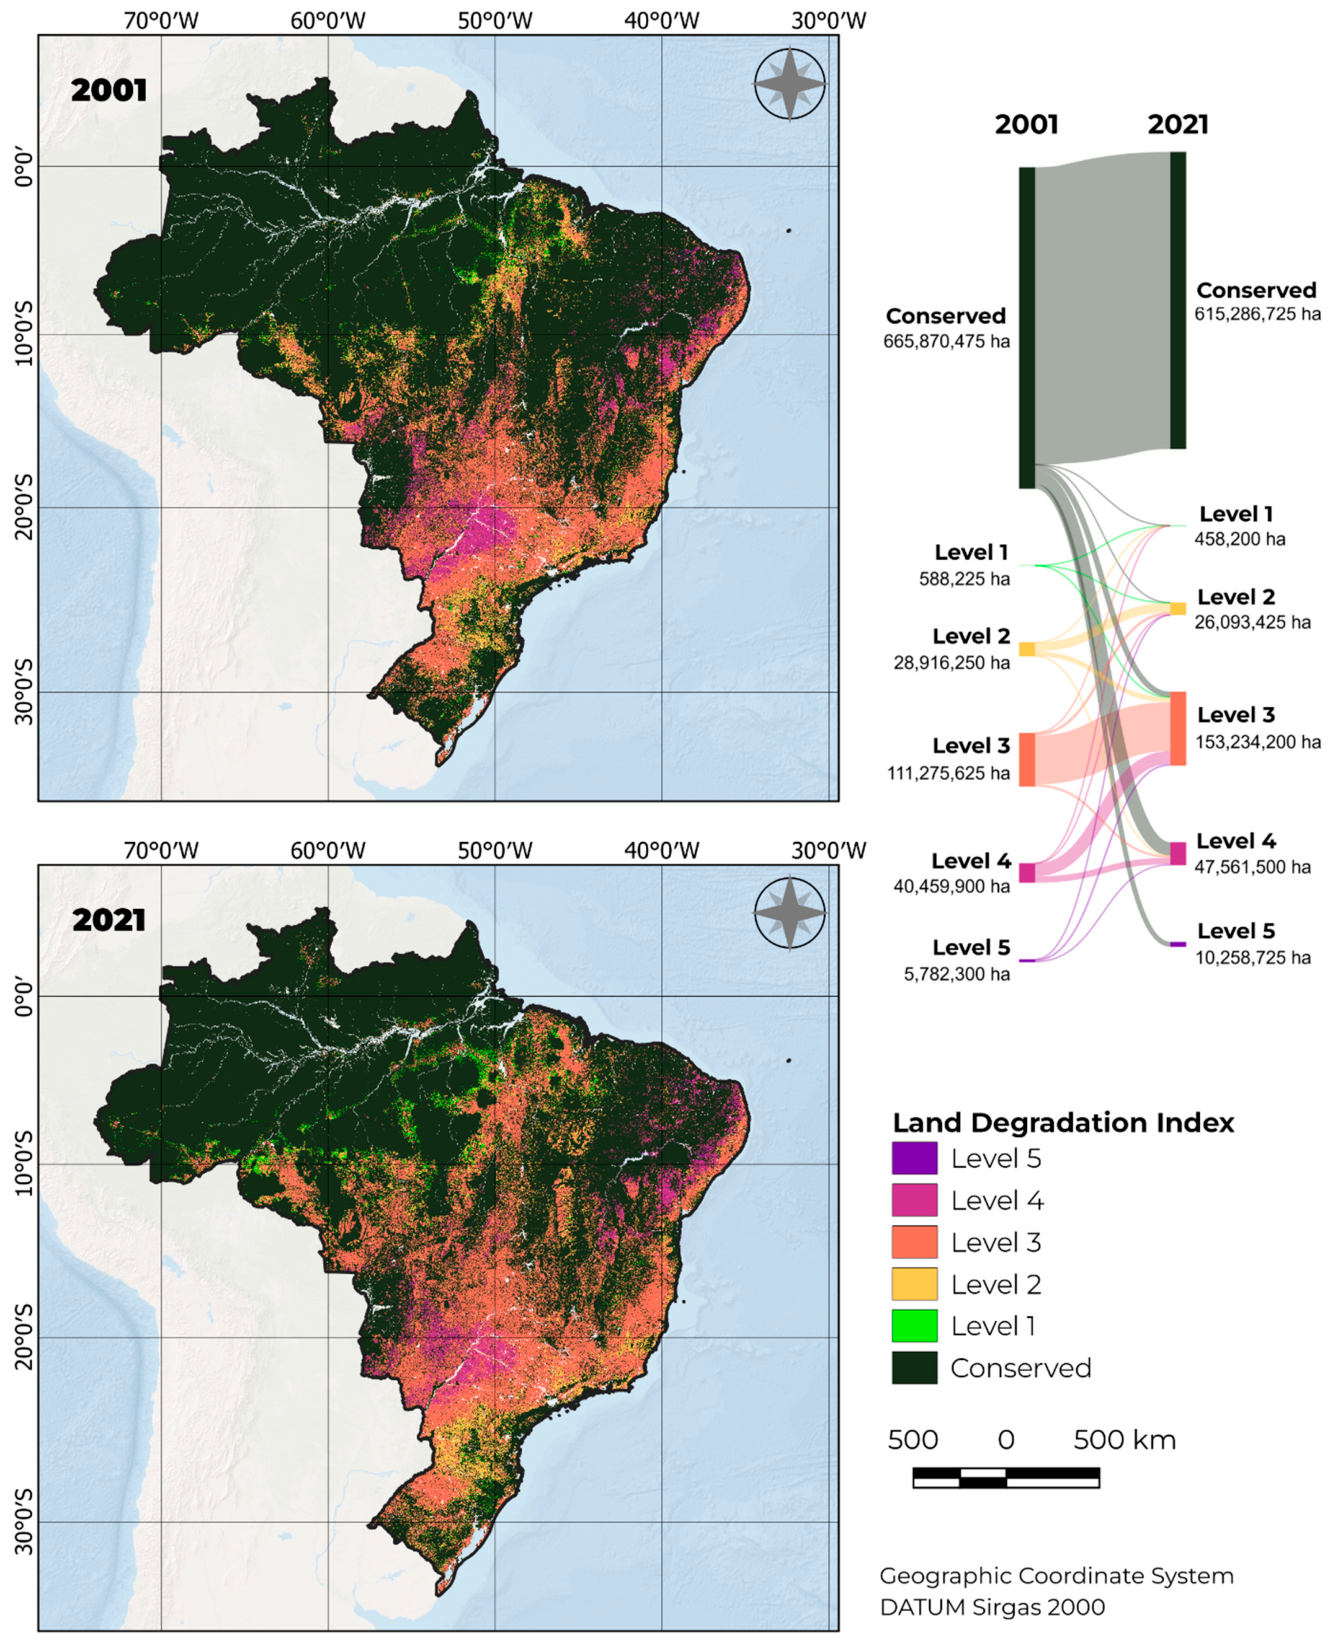
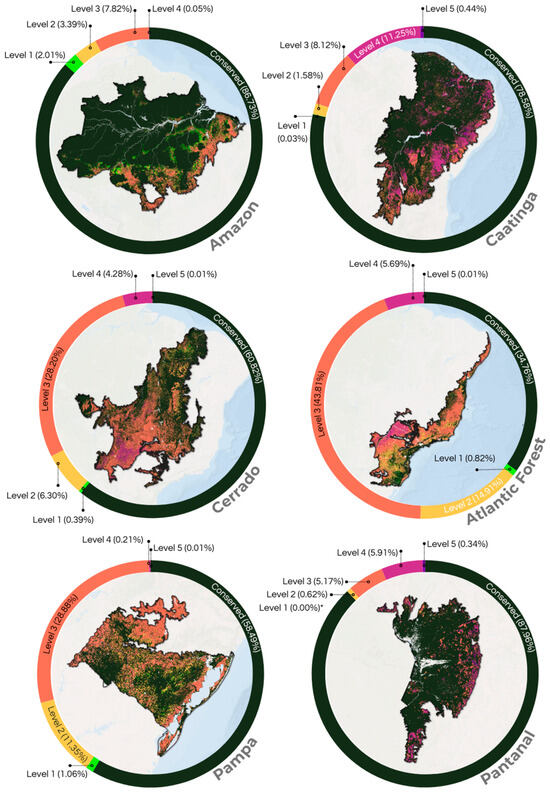
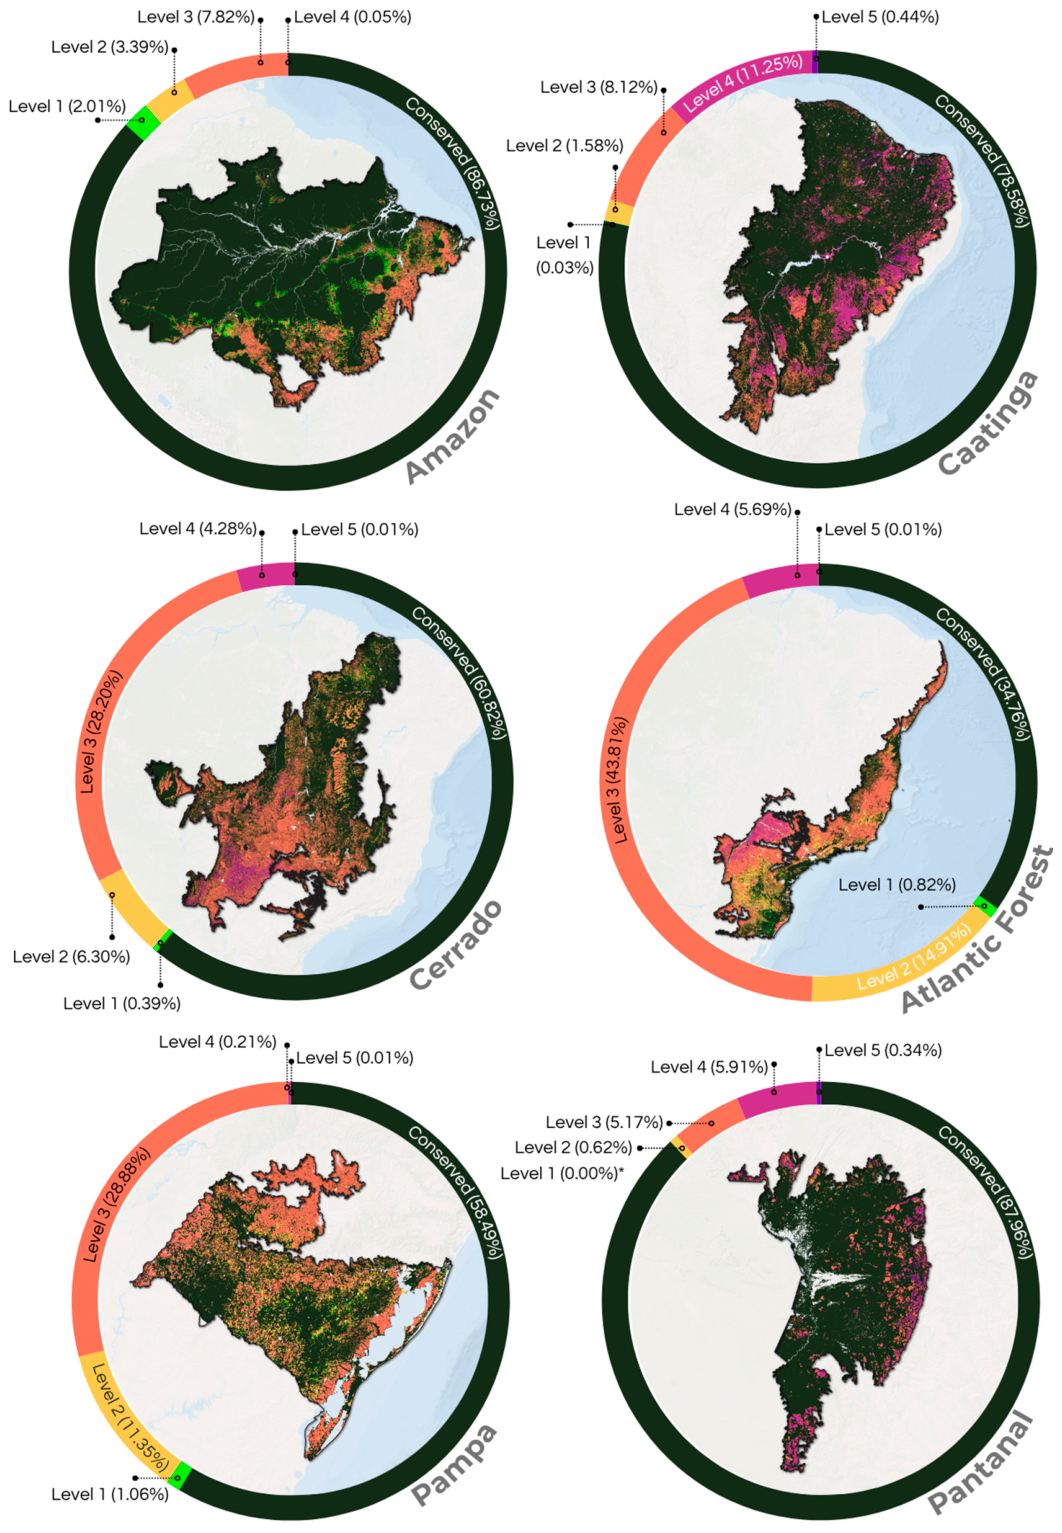
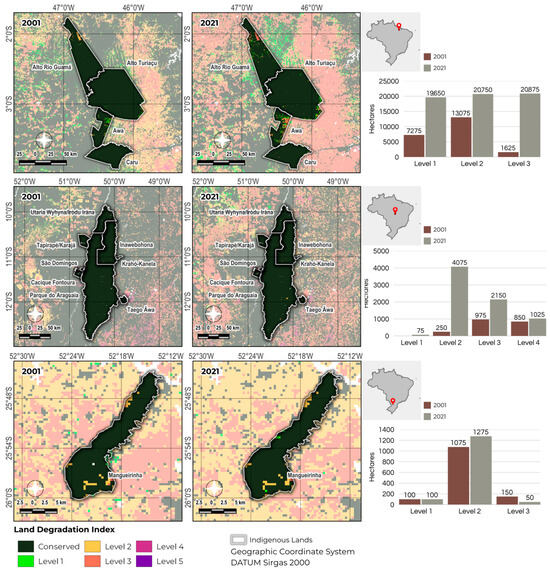
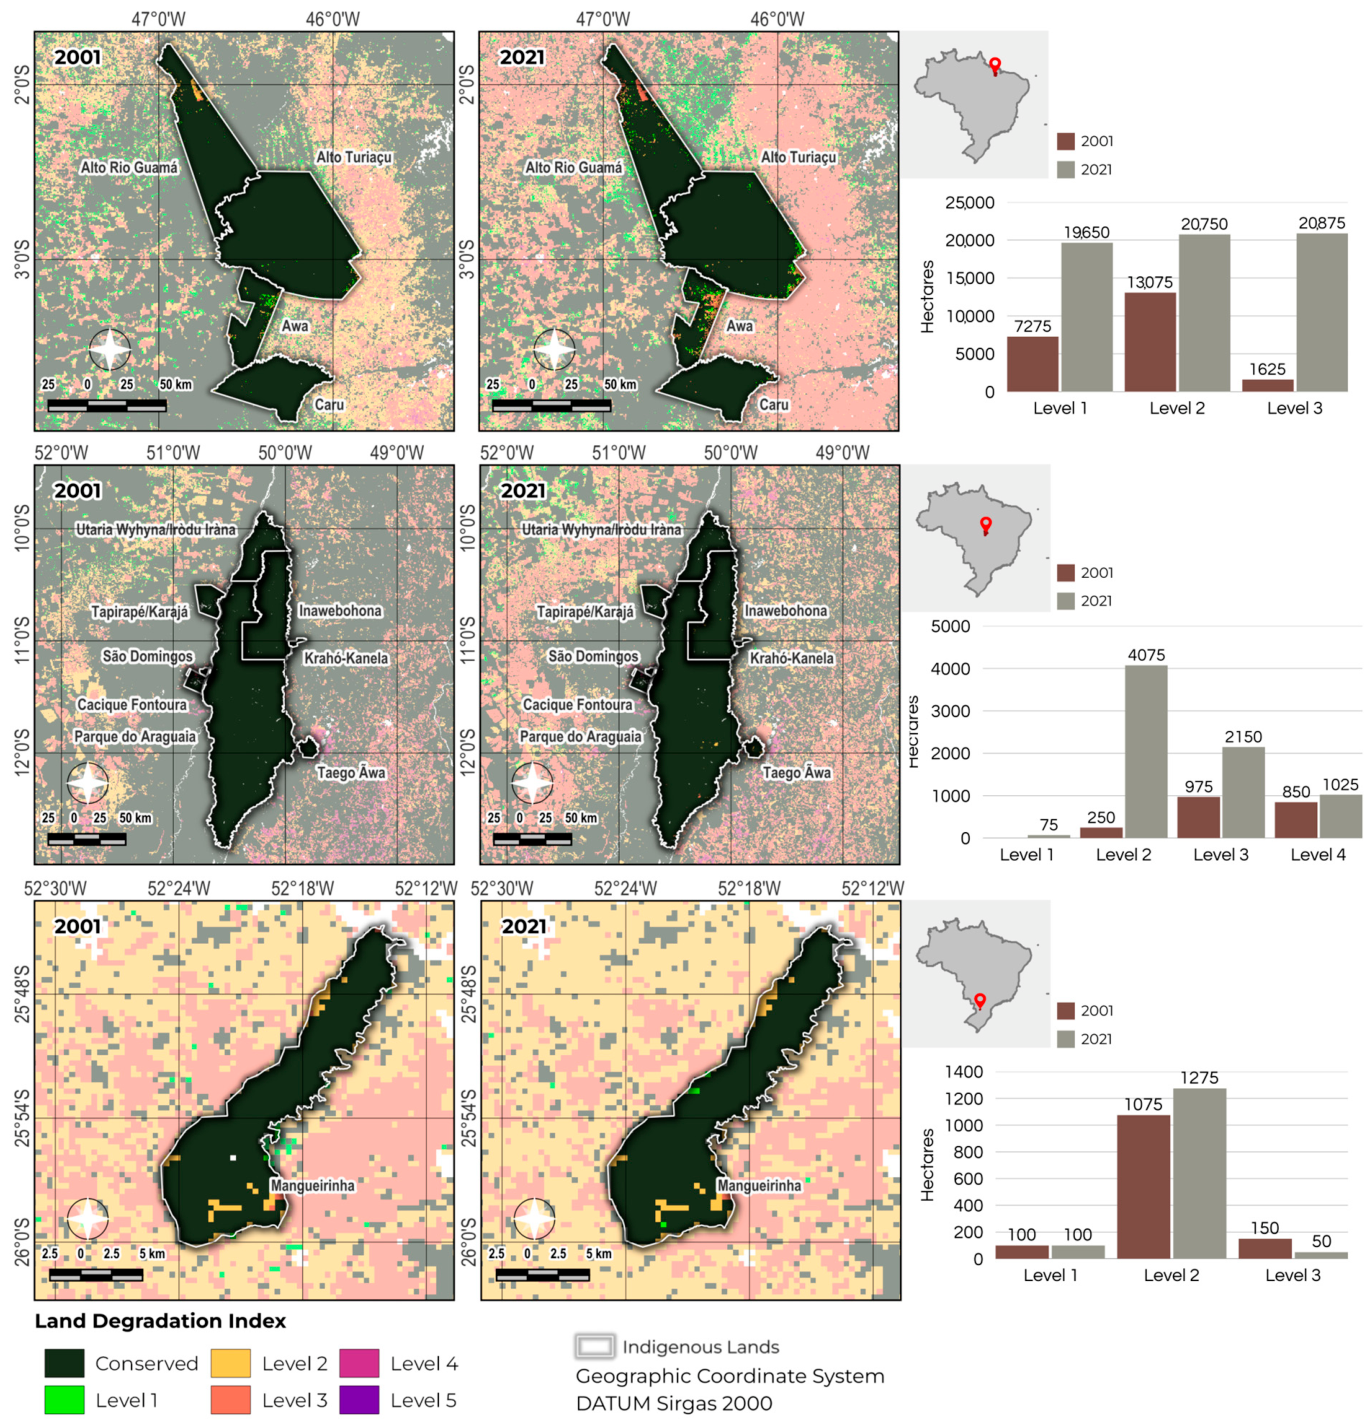
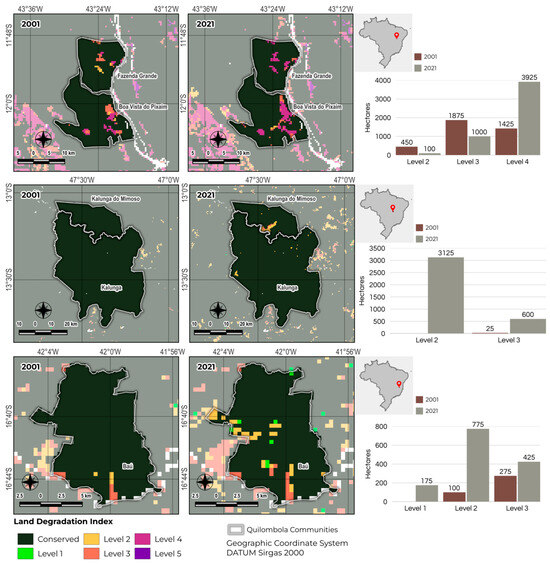
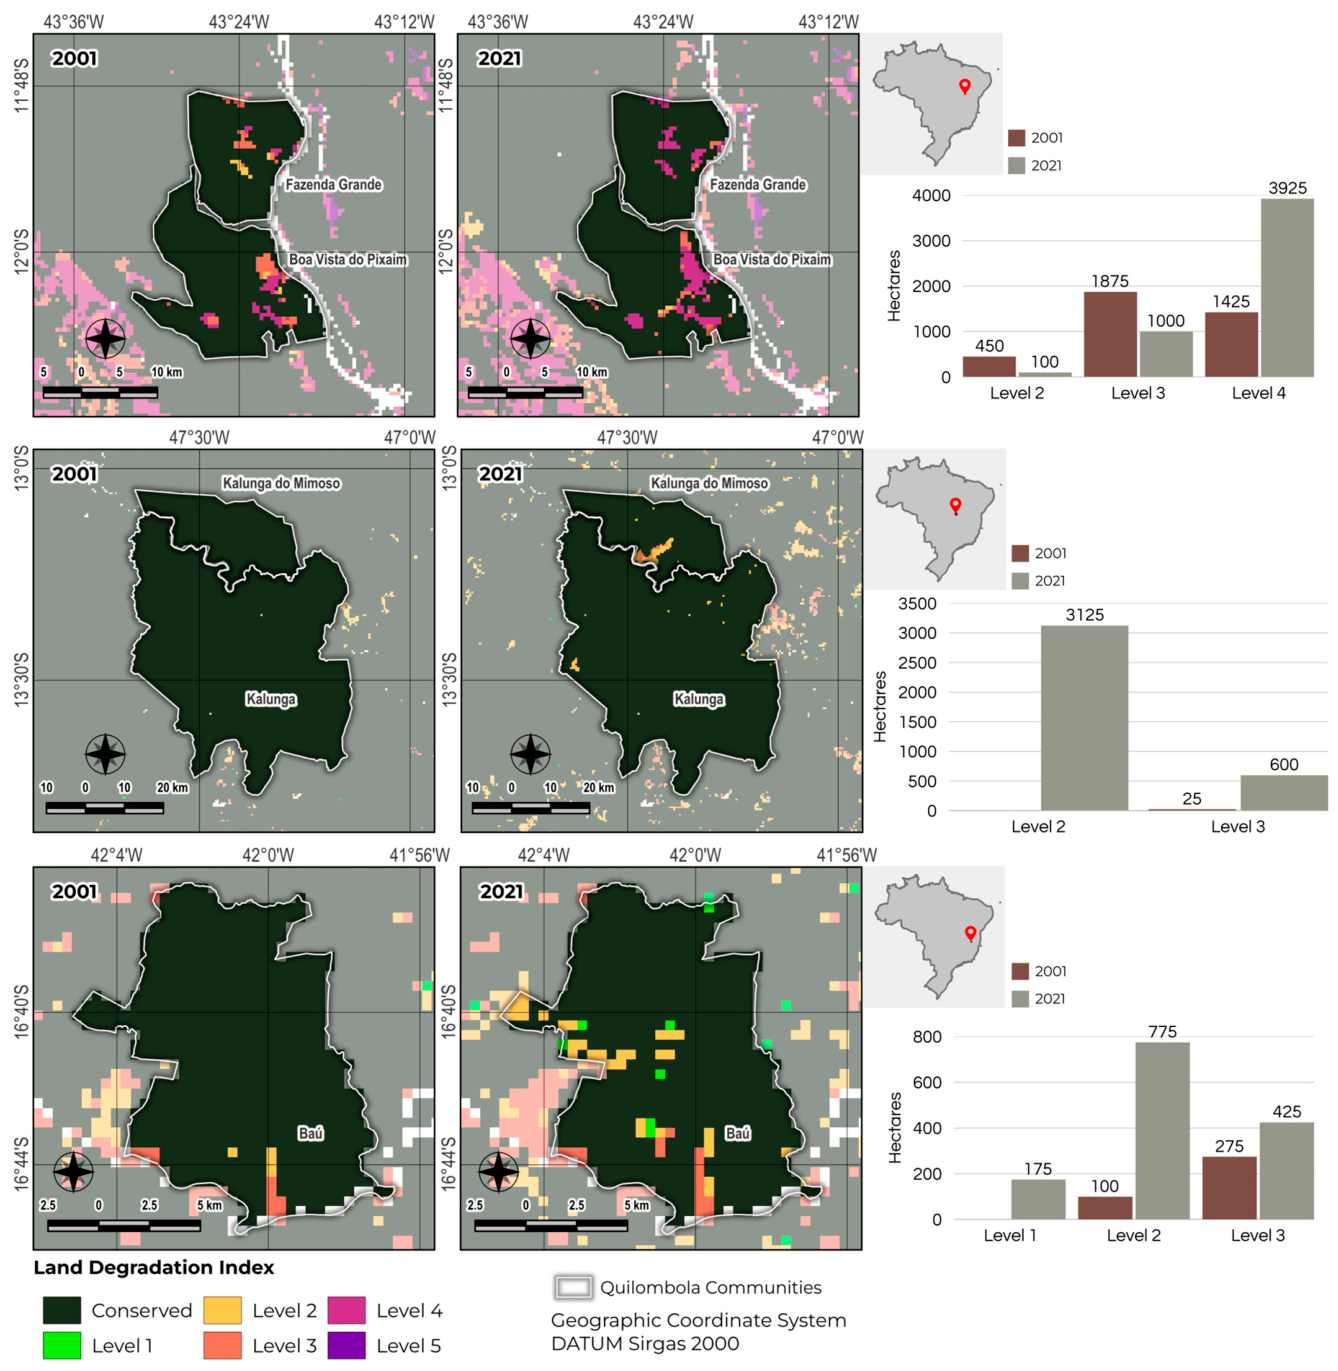

Disclaimer/Publisher’s Note: The statements, opinions and data contained in all publications are solely those of the individual author(s) and contributor(s) and not of MDPI and/or the editor(s). MDPI and/or the editor(s) disclaim responsibility for any injury to people or property resulting from any ideas, methods, instructions or products referred to in the content. |
© 2026 by the authors. Licensee MDPI, Basel, Switzerland. This article is an open access article distributed under the terms and conditions of the Creative Commons Attribution (CC BY) license.