Global Accuracy, Stability, and Consistency Assessment and Usage Recommendations of POLDER/PARASOL GRASP Aerosol Products

Highlights
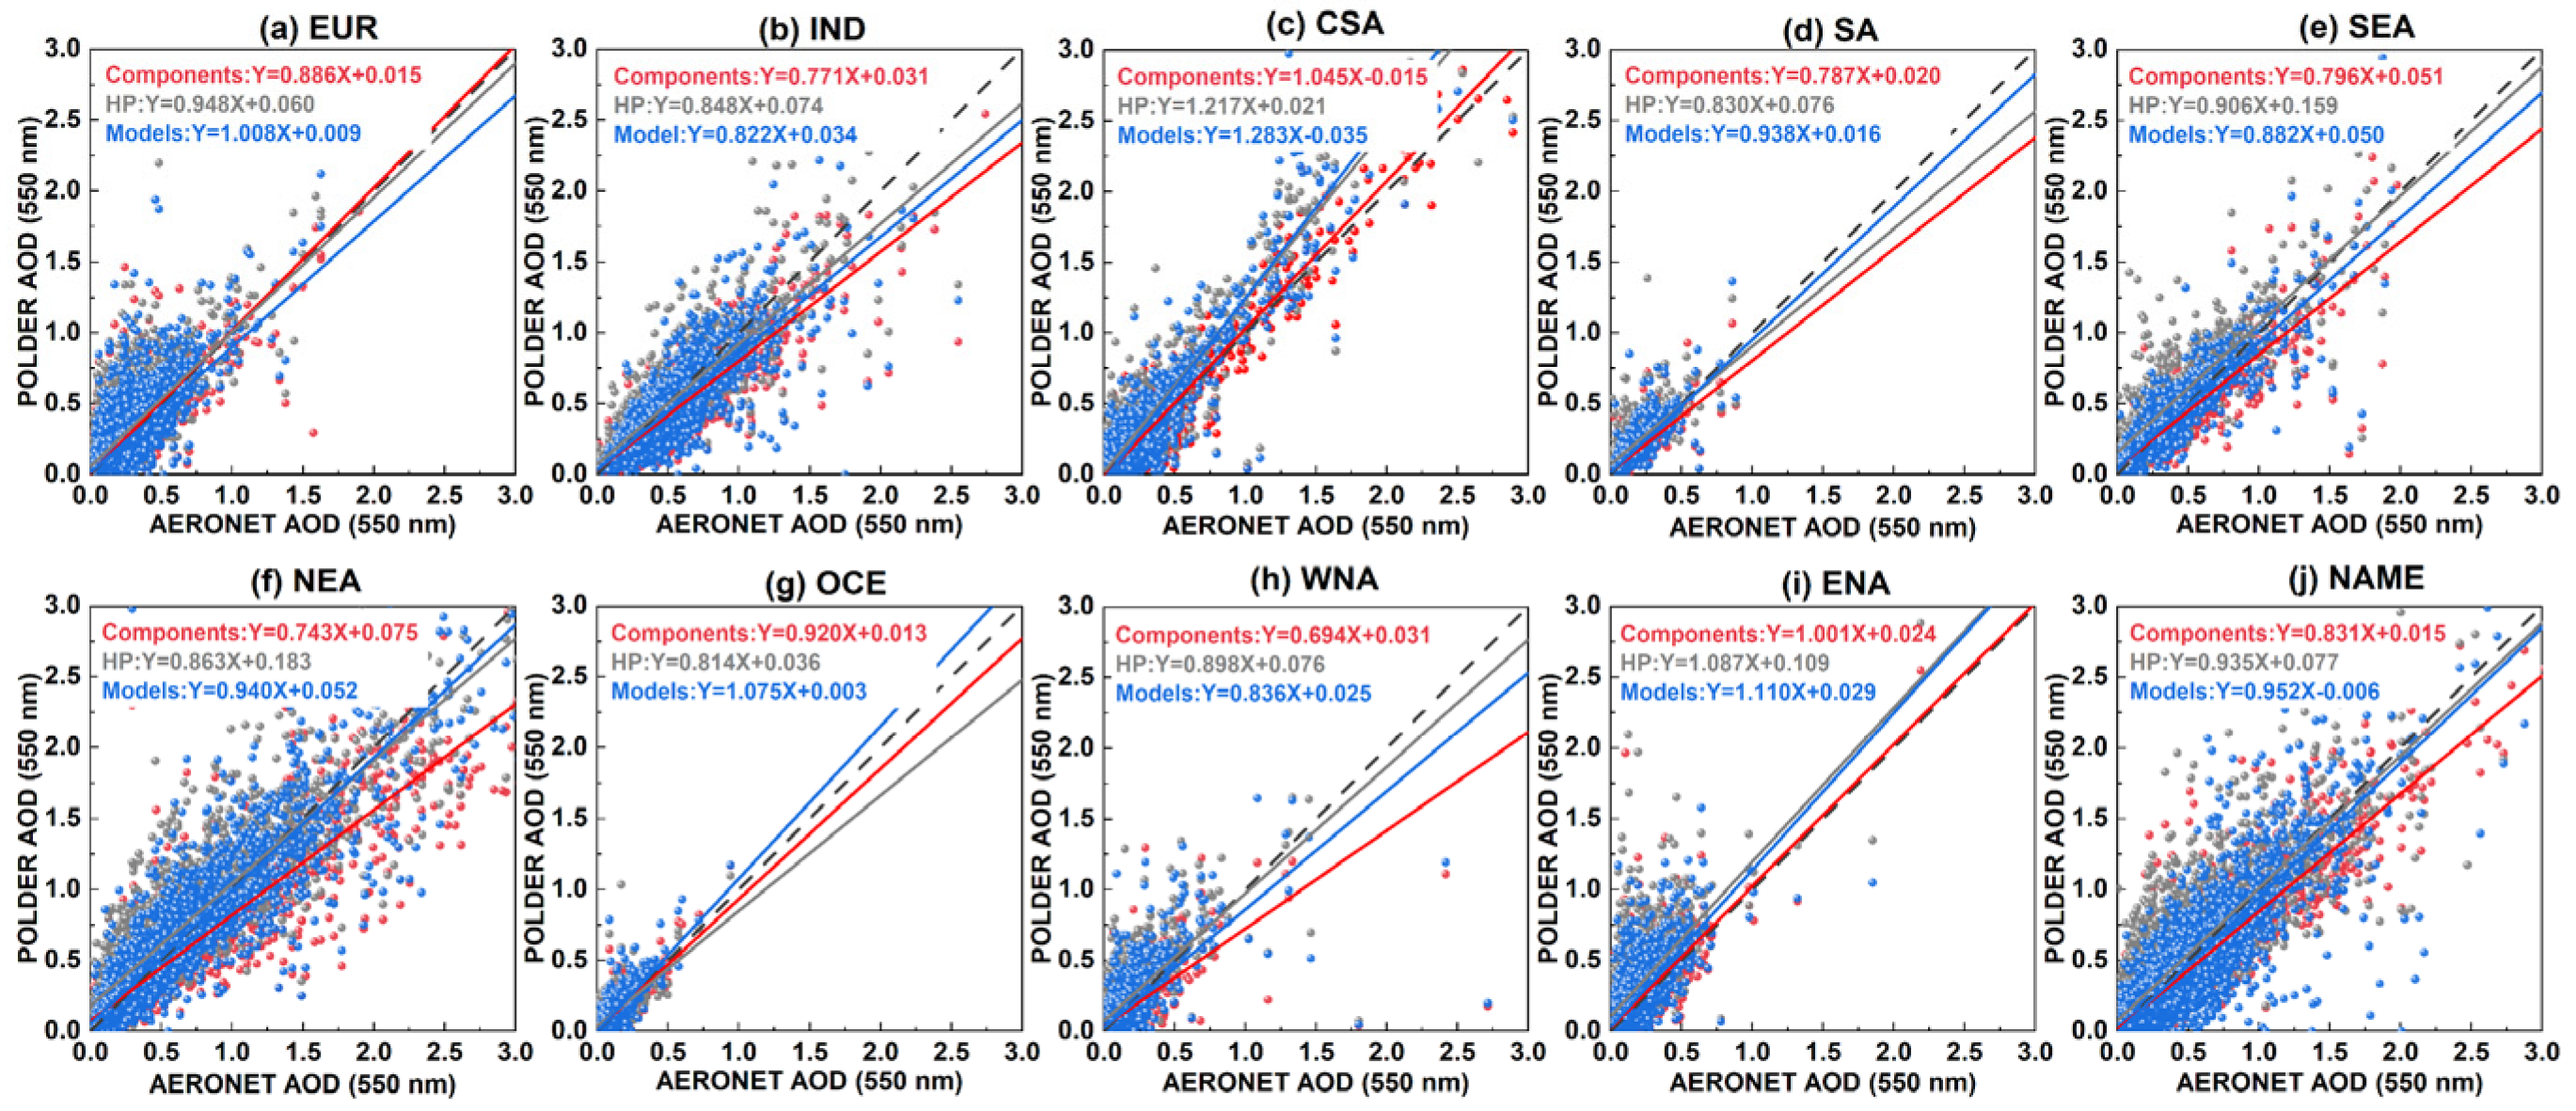
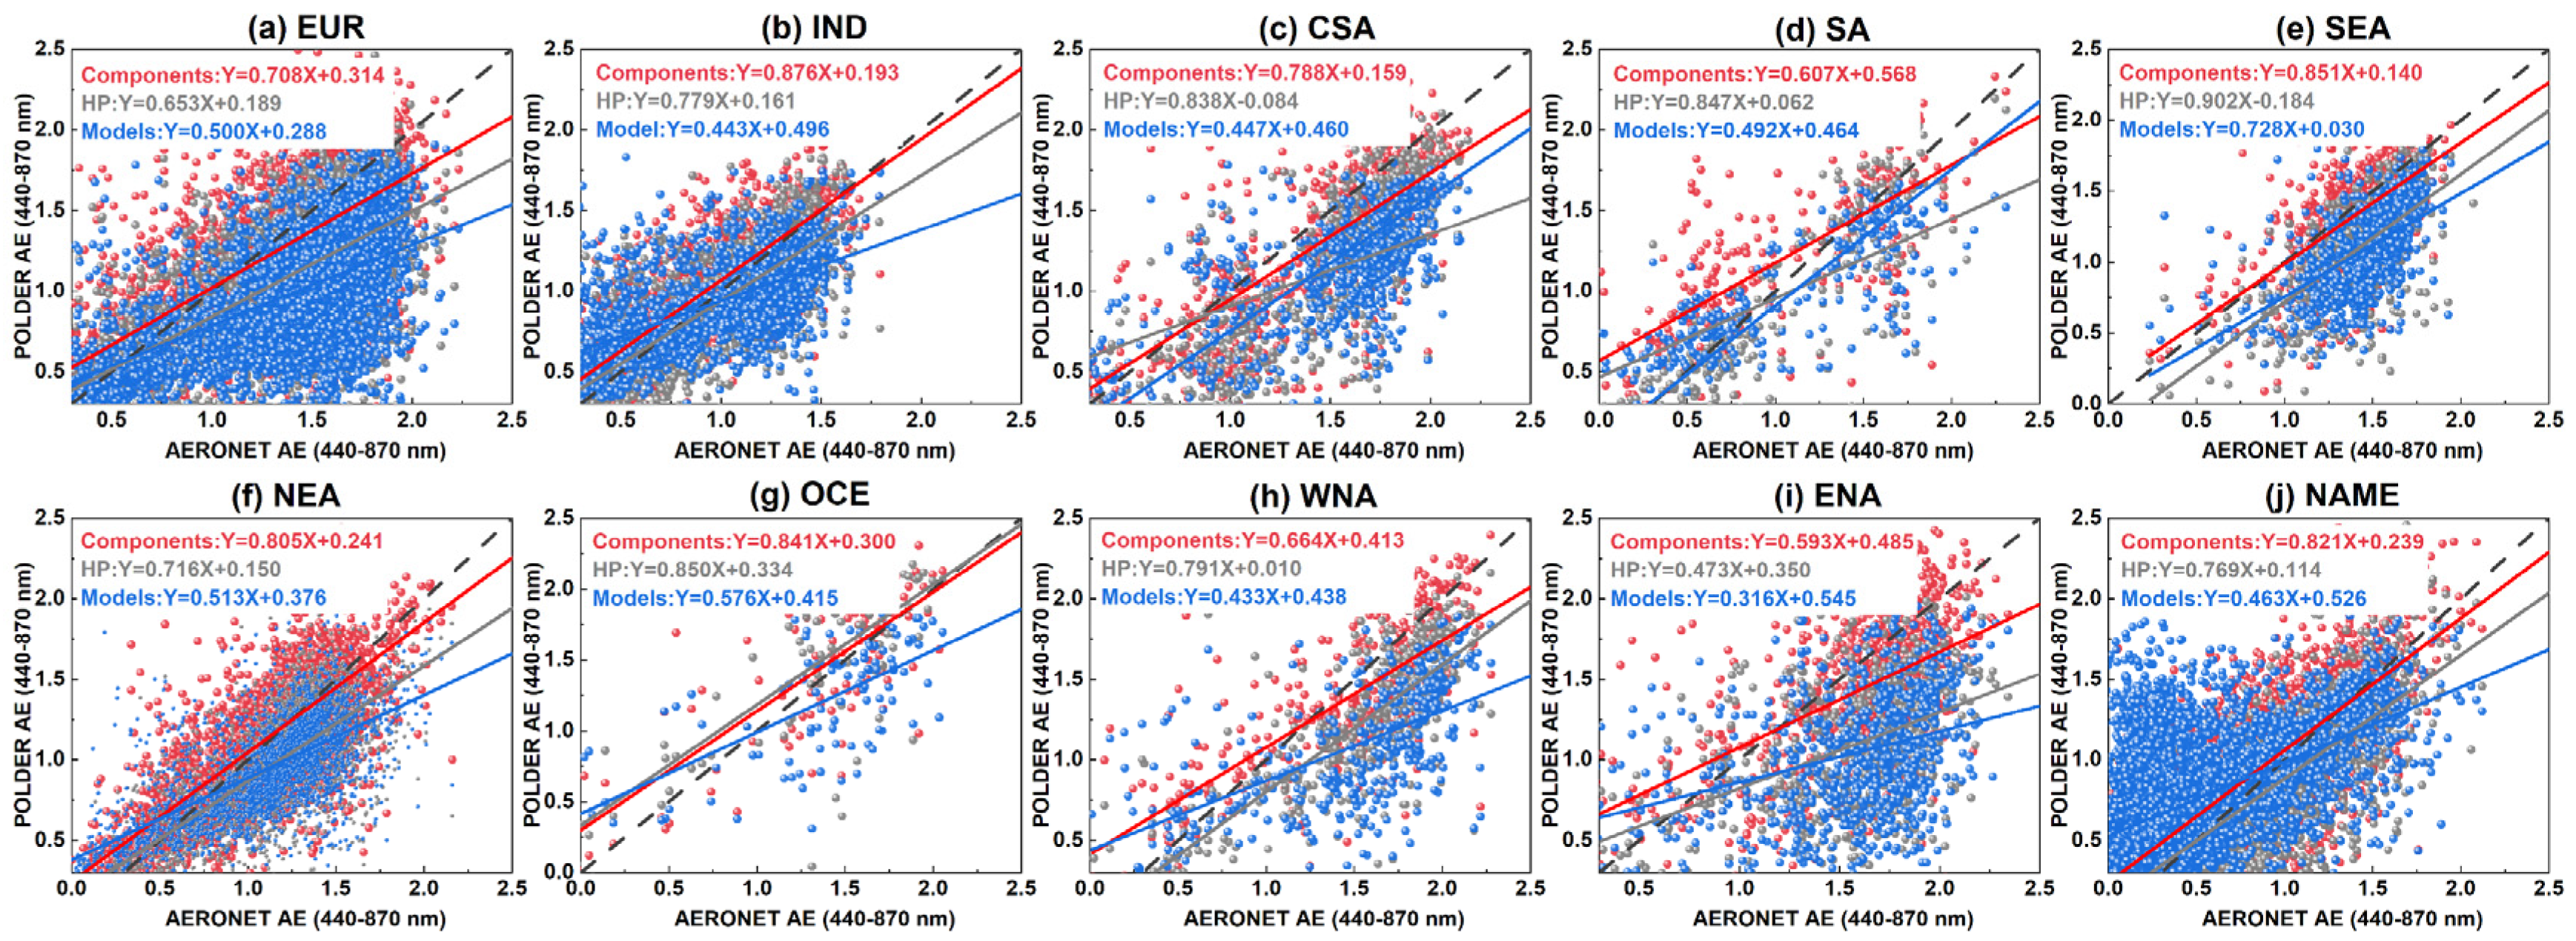
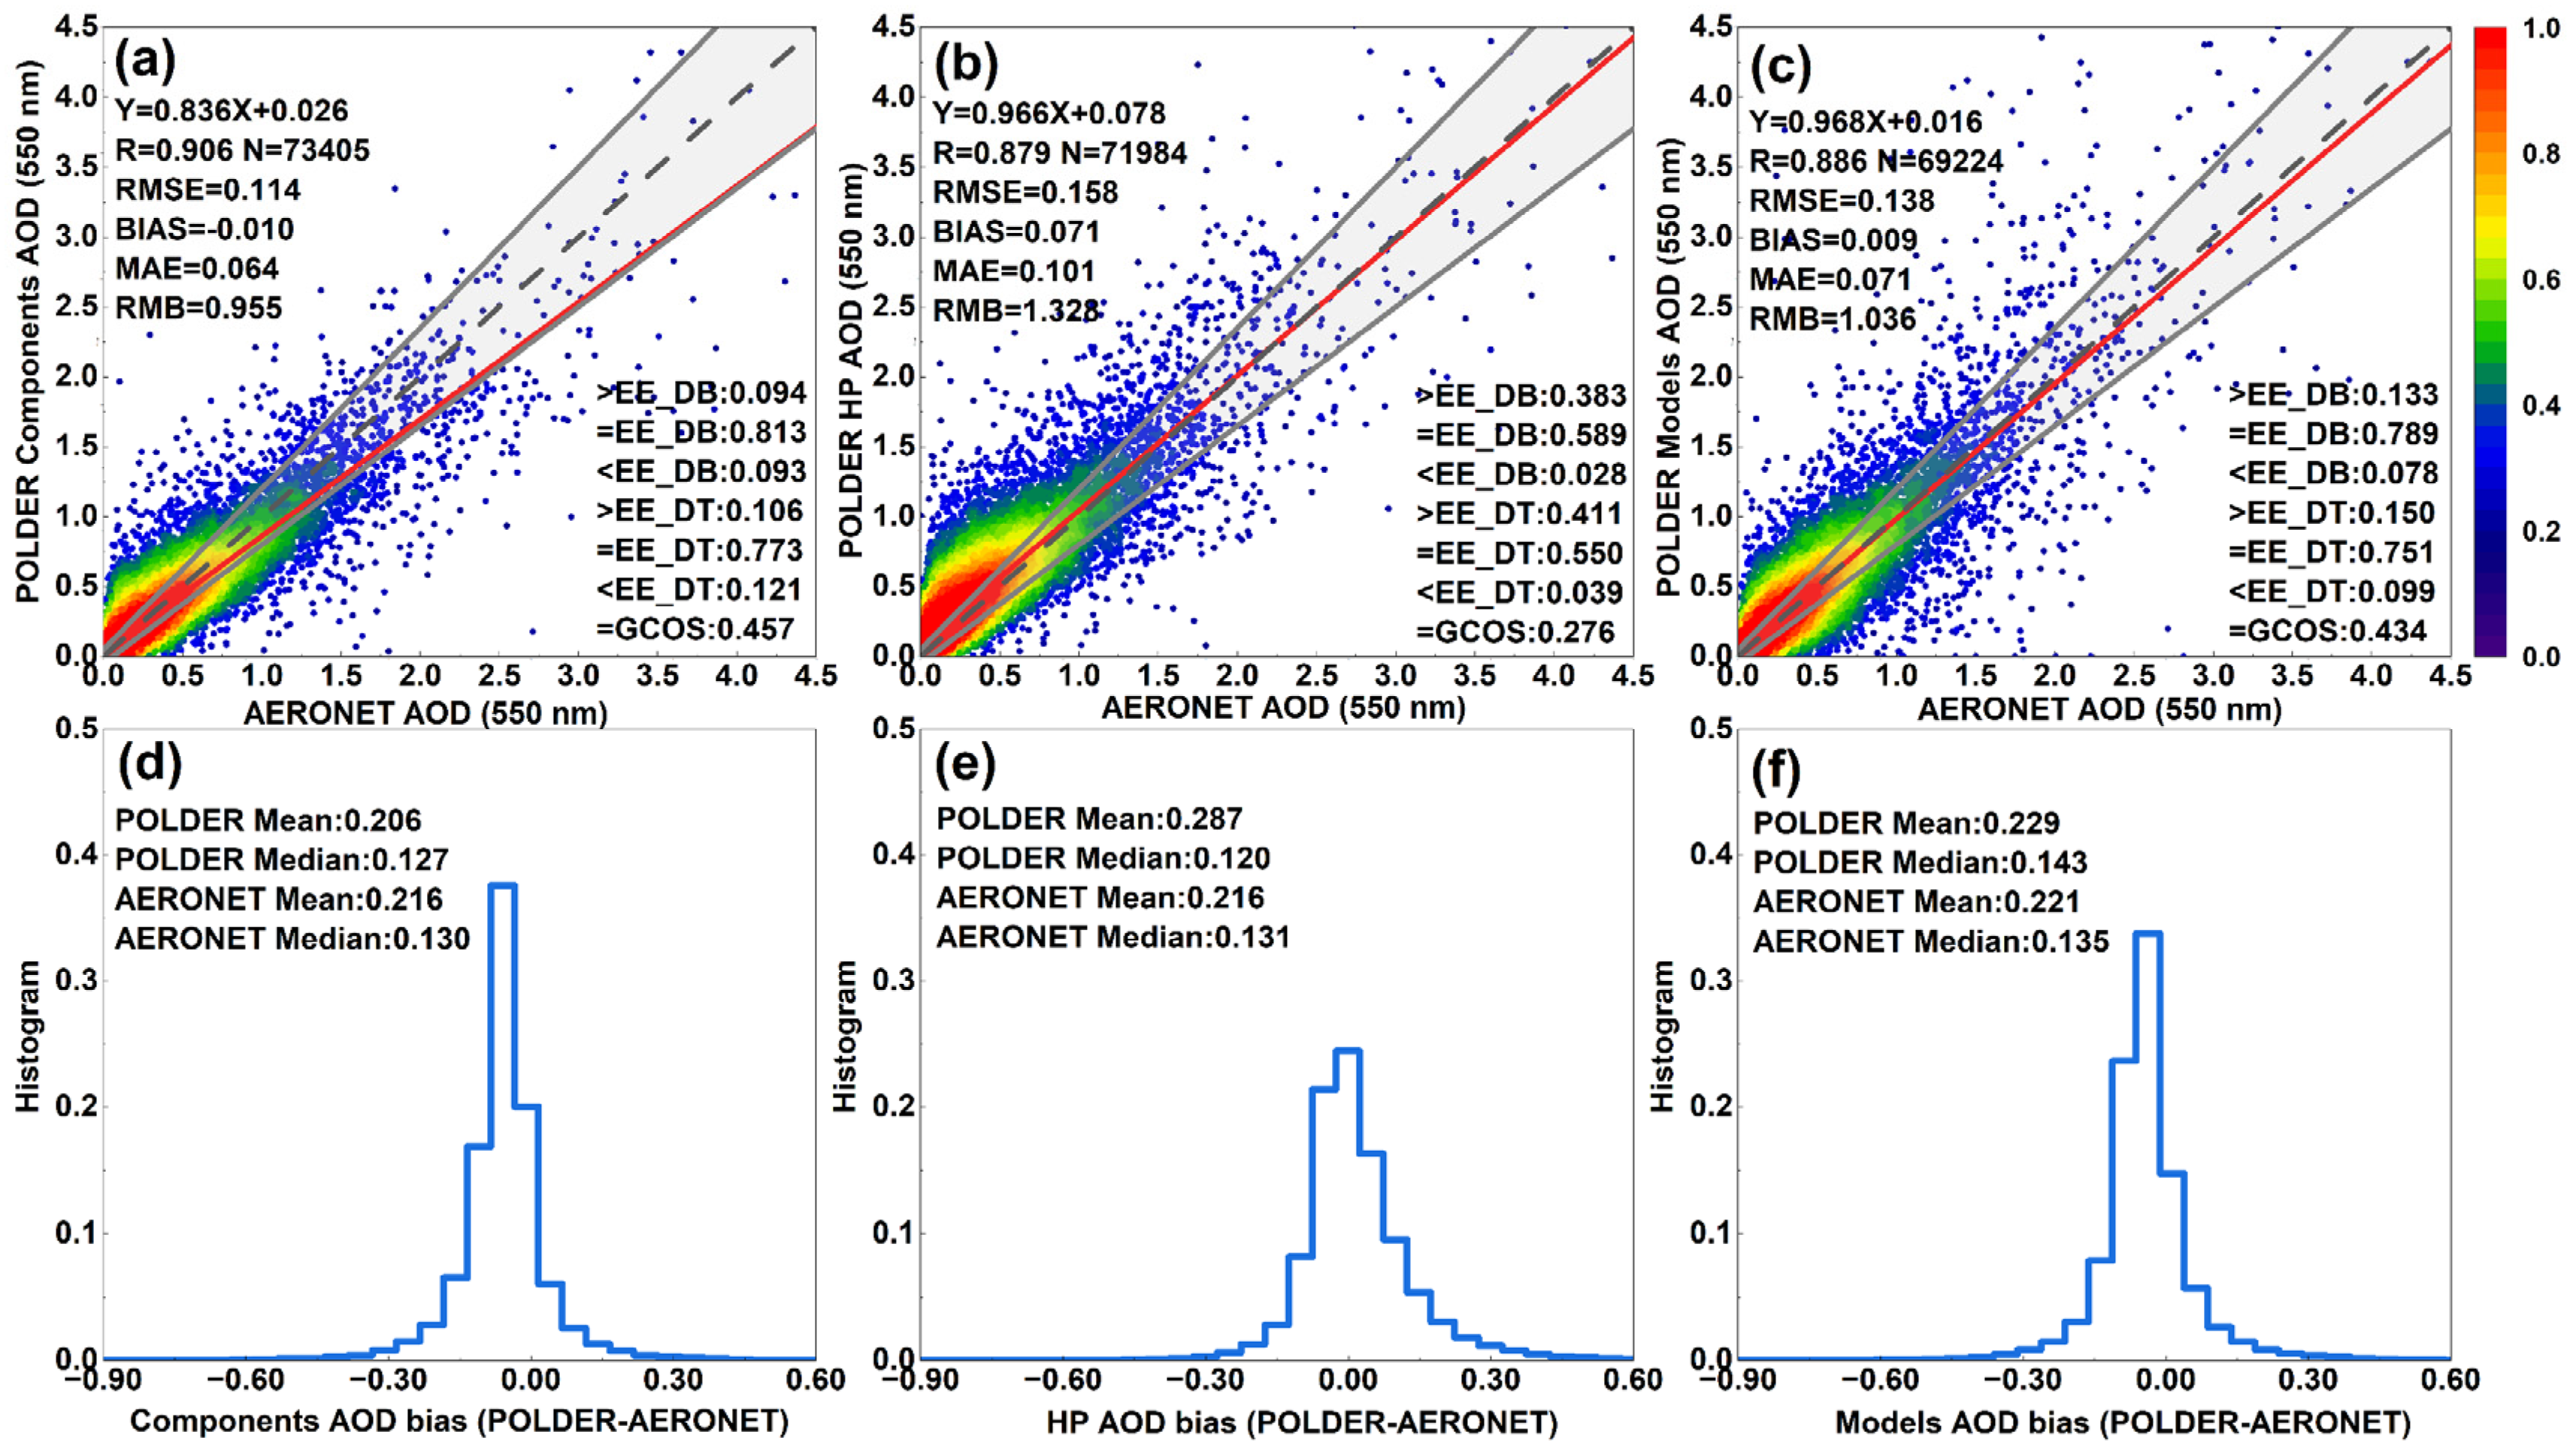
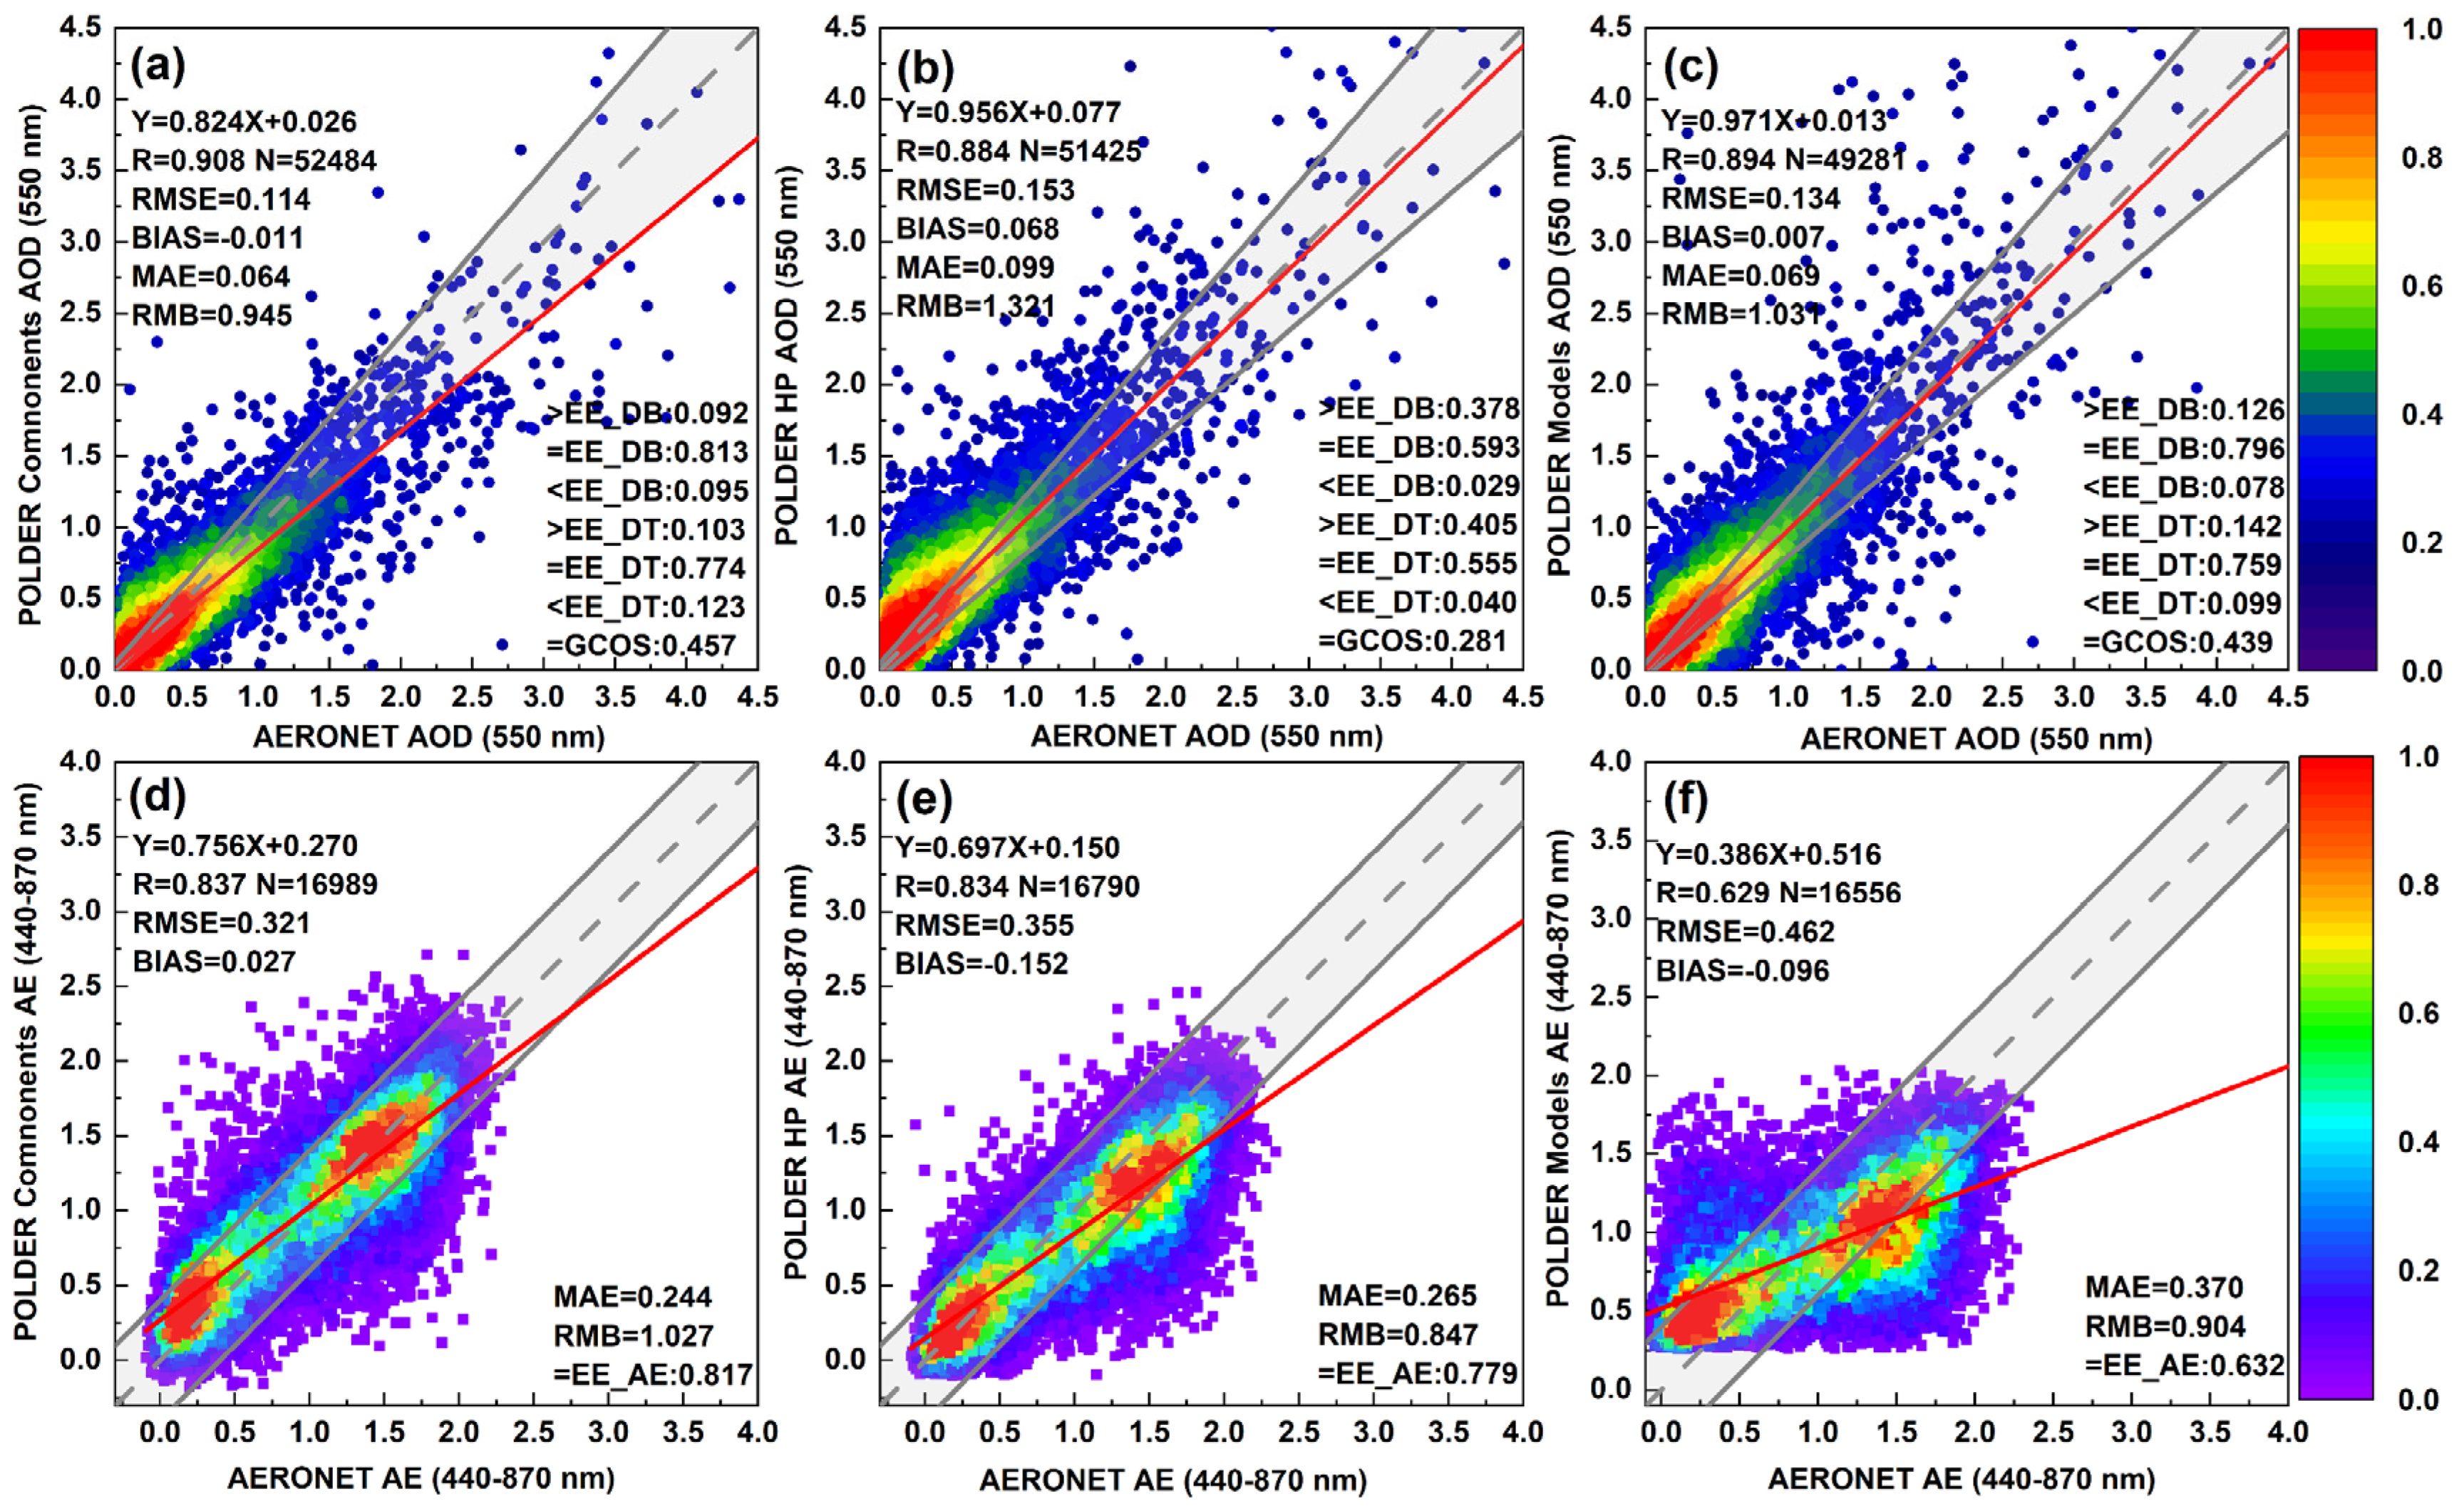
- The GRASP/Components product achieves the lowest RMSE for AOD (0.114) and AE (0.321), outperforming GRASP/HP and GRASP/Models products in most global regions.
- None of the three POLDER-3/GRASP AOD products meet the Global Climate Observing System (GCOS) global stability requirement of 0.02 per decade.
- The GRASP/Components product is recommended as the primary choice for most aerosol-related research applications.
- Caution is required when using POLDER-3/GRASP AOD products in long-term climate and radiative balance studies.
Abstract
1. Introduction
2. Data and Method
2.1. PARASOL/GRASP Aerosol Products
- (1)
- GRASP “High-Precision (HP)”: Utilizes highly precise radiative transfer calculations [10].
- (2)
- GRASP “Optimized”: Employs optimized radiative transfer calculations to balance accuracy and efficiency [10].
- (3)
- GRASP “Models”: Assumes aerosols as external mixtures of several predefined aerosol component types [10].
- (4)
- GRASP “Components”: Models aerosol refractive index using internal mixtures of different aerosol components (including black carbon, brown carbon, organic carbon, etc.) based on the Maxwell Garnett effective approximation [11].
2.2. AERONET Data
2.3. Accuracy Validation Method
2.4. Stability Assessment Method
3. Results and Discussion
3.1. Overall Accuracy
3.1.1. Aerosol Optical Depth
3.1.2. Ångström Exponent (AE)
3.2. Temporal Validation
3.2.1. AOD Temporal Evaluation
3.2.2. AE Temporal Evaluation
3.2.3. AOD Stability Assessment
3.2.4. AE Stability Assessment
3.3. Regional Accuracy Validation
3.3.1. Regional Overall Accuracy of AOD
3.3.2. Regional Overall Accuracy of AE
3.3.3. Regional Stability Assessment
3.4. Site-Scale Comparison of POLDER-3 Aerosol Products
3.4.1. Site-Scale Comparison of AOD
3.4.2. Site-Scale Comparison of AE
3.5. Spatial Distribution Pattern
3.5.1. AOD Spatial Distribution Patterns
3.5.2. AE Spatial Distribution Patterns
4. Conclusions
- (1)
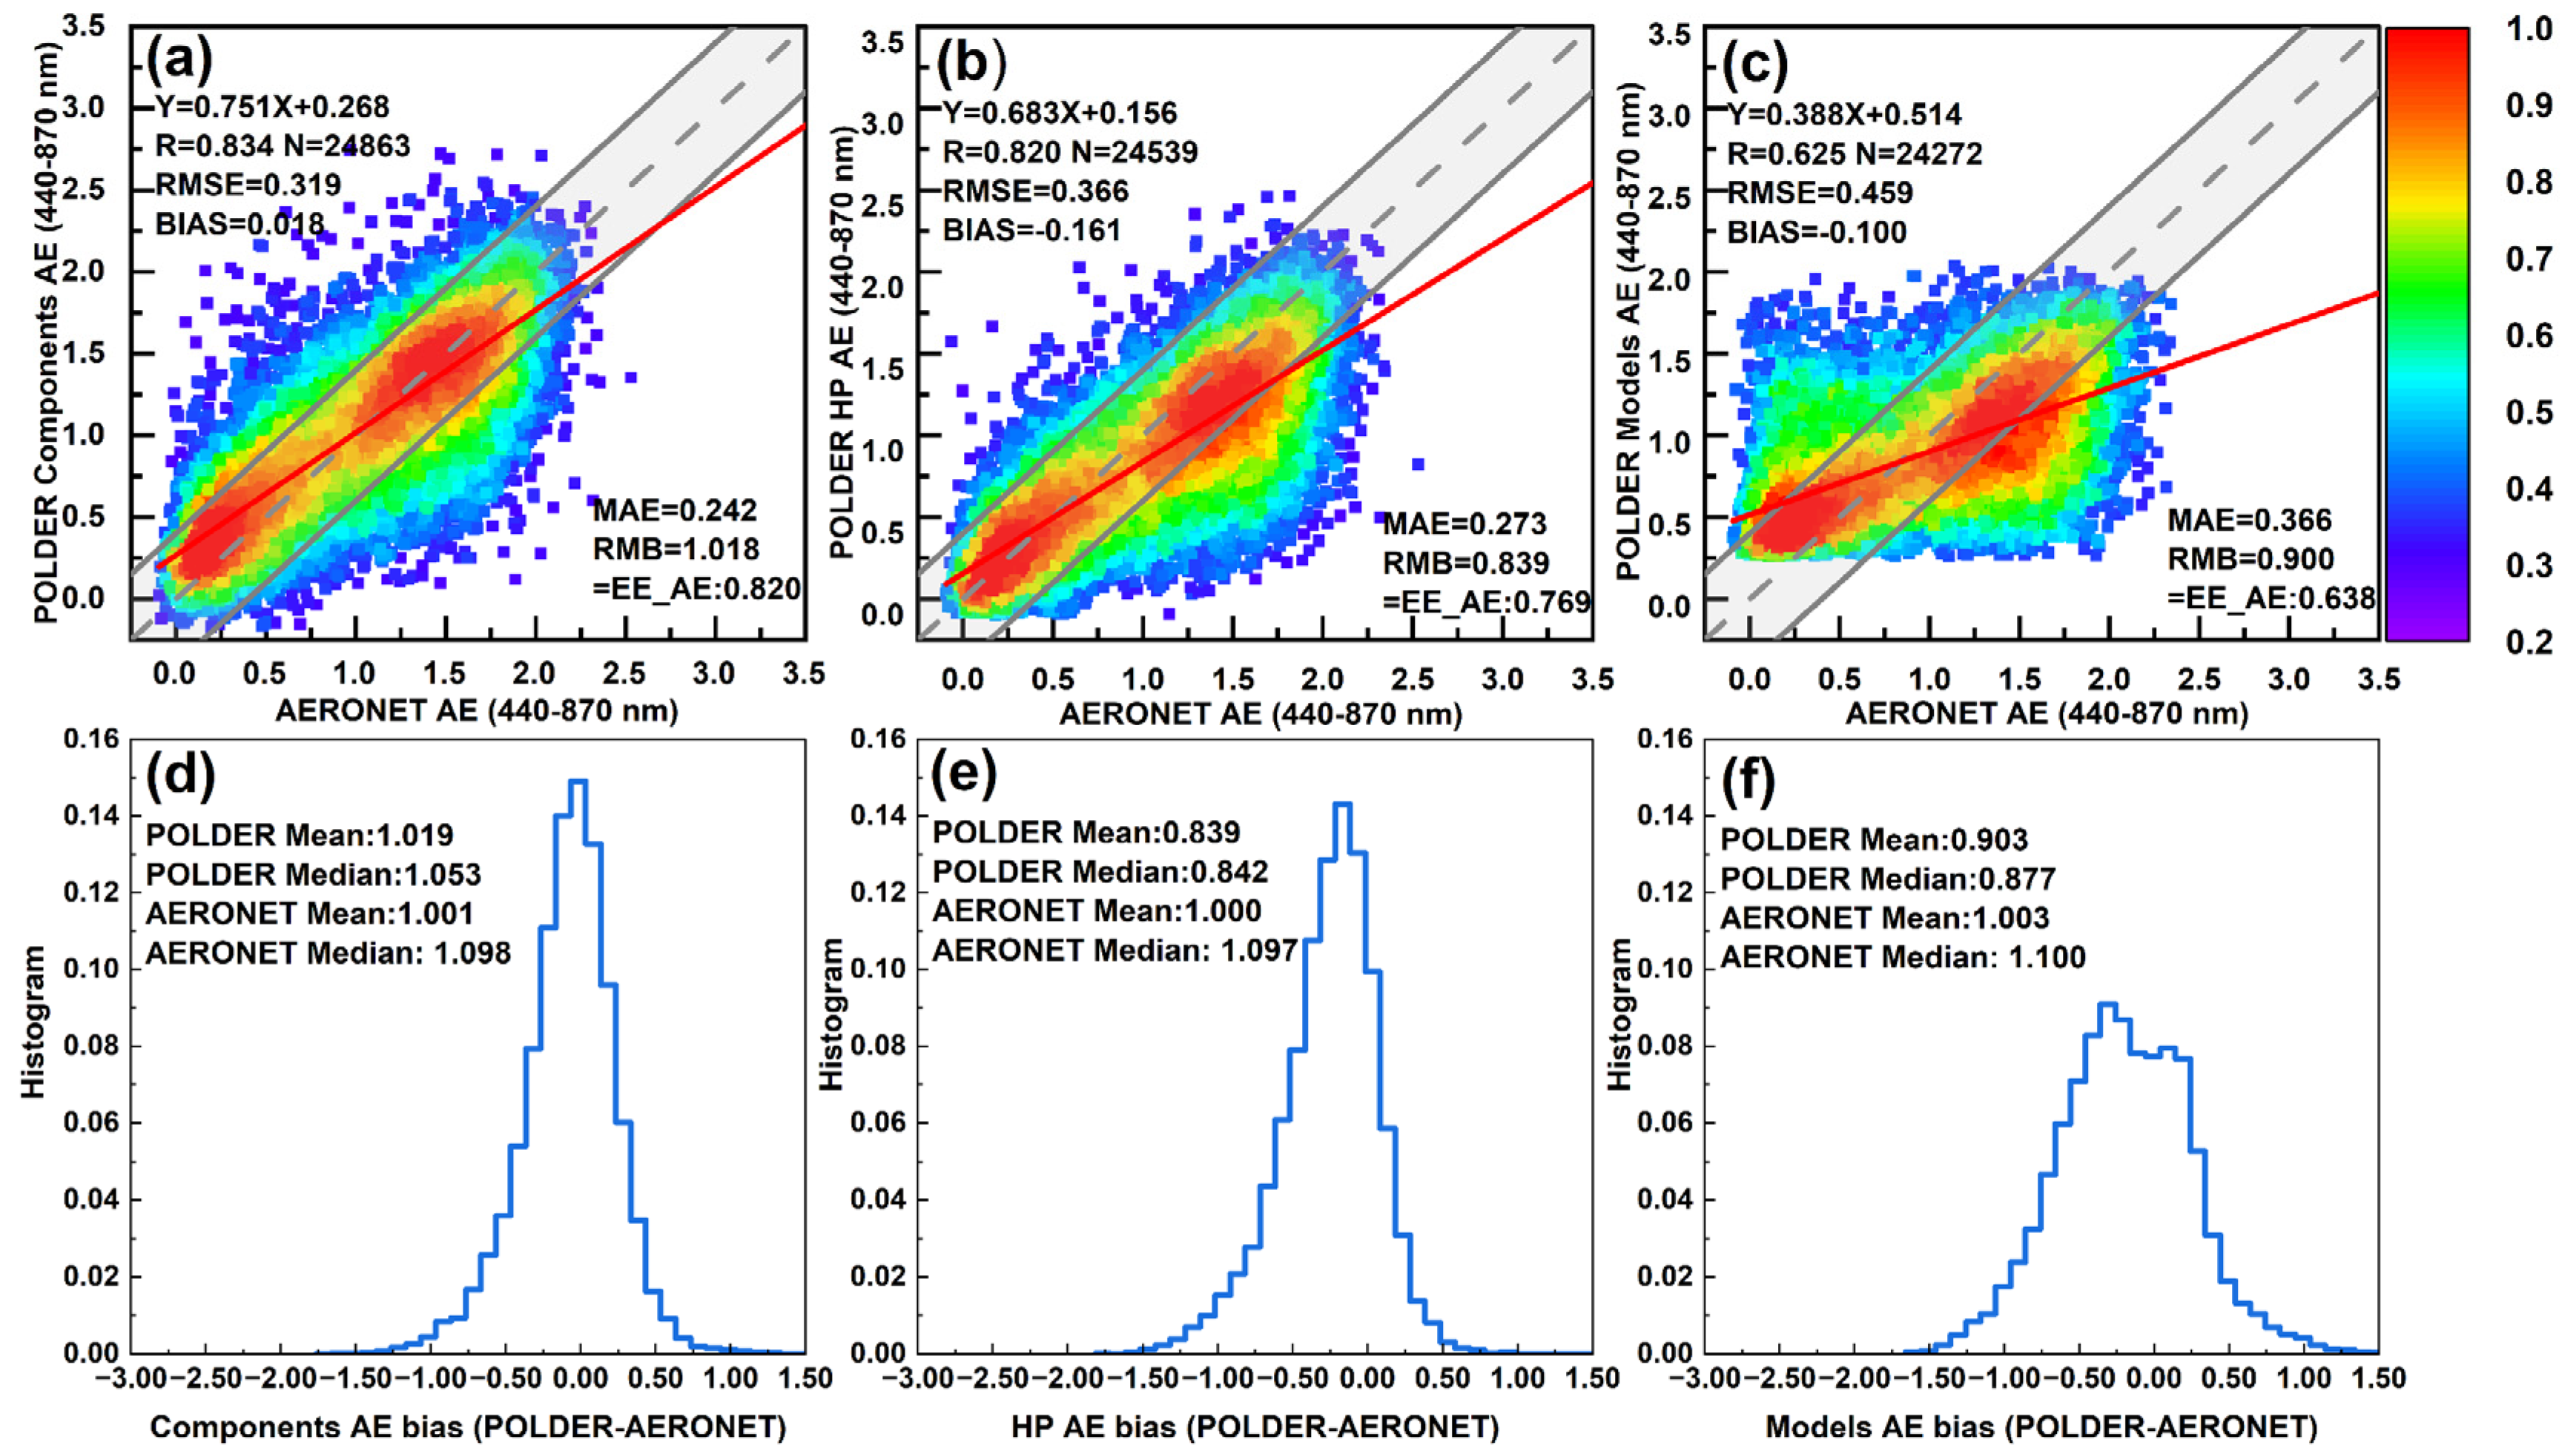
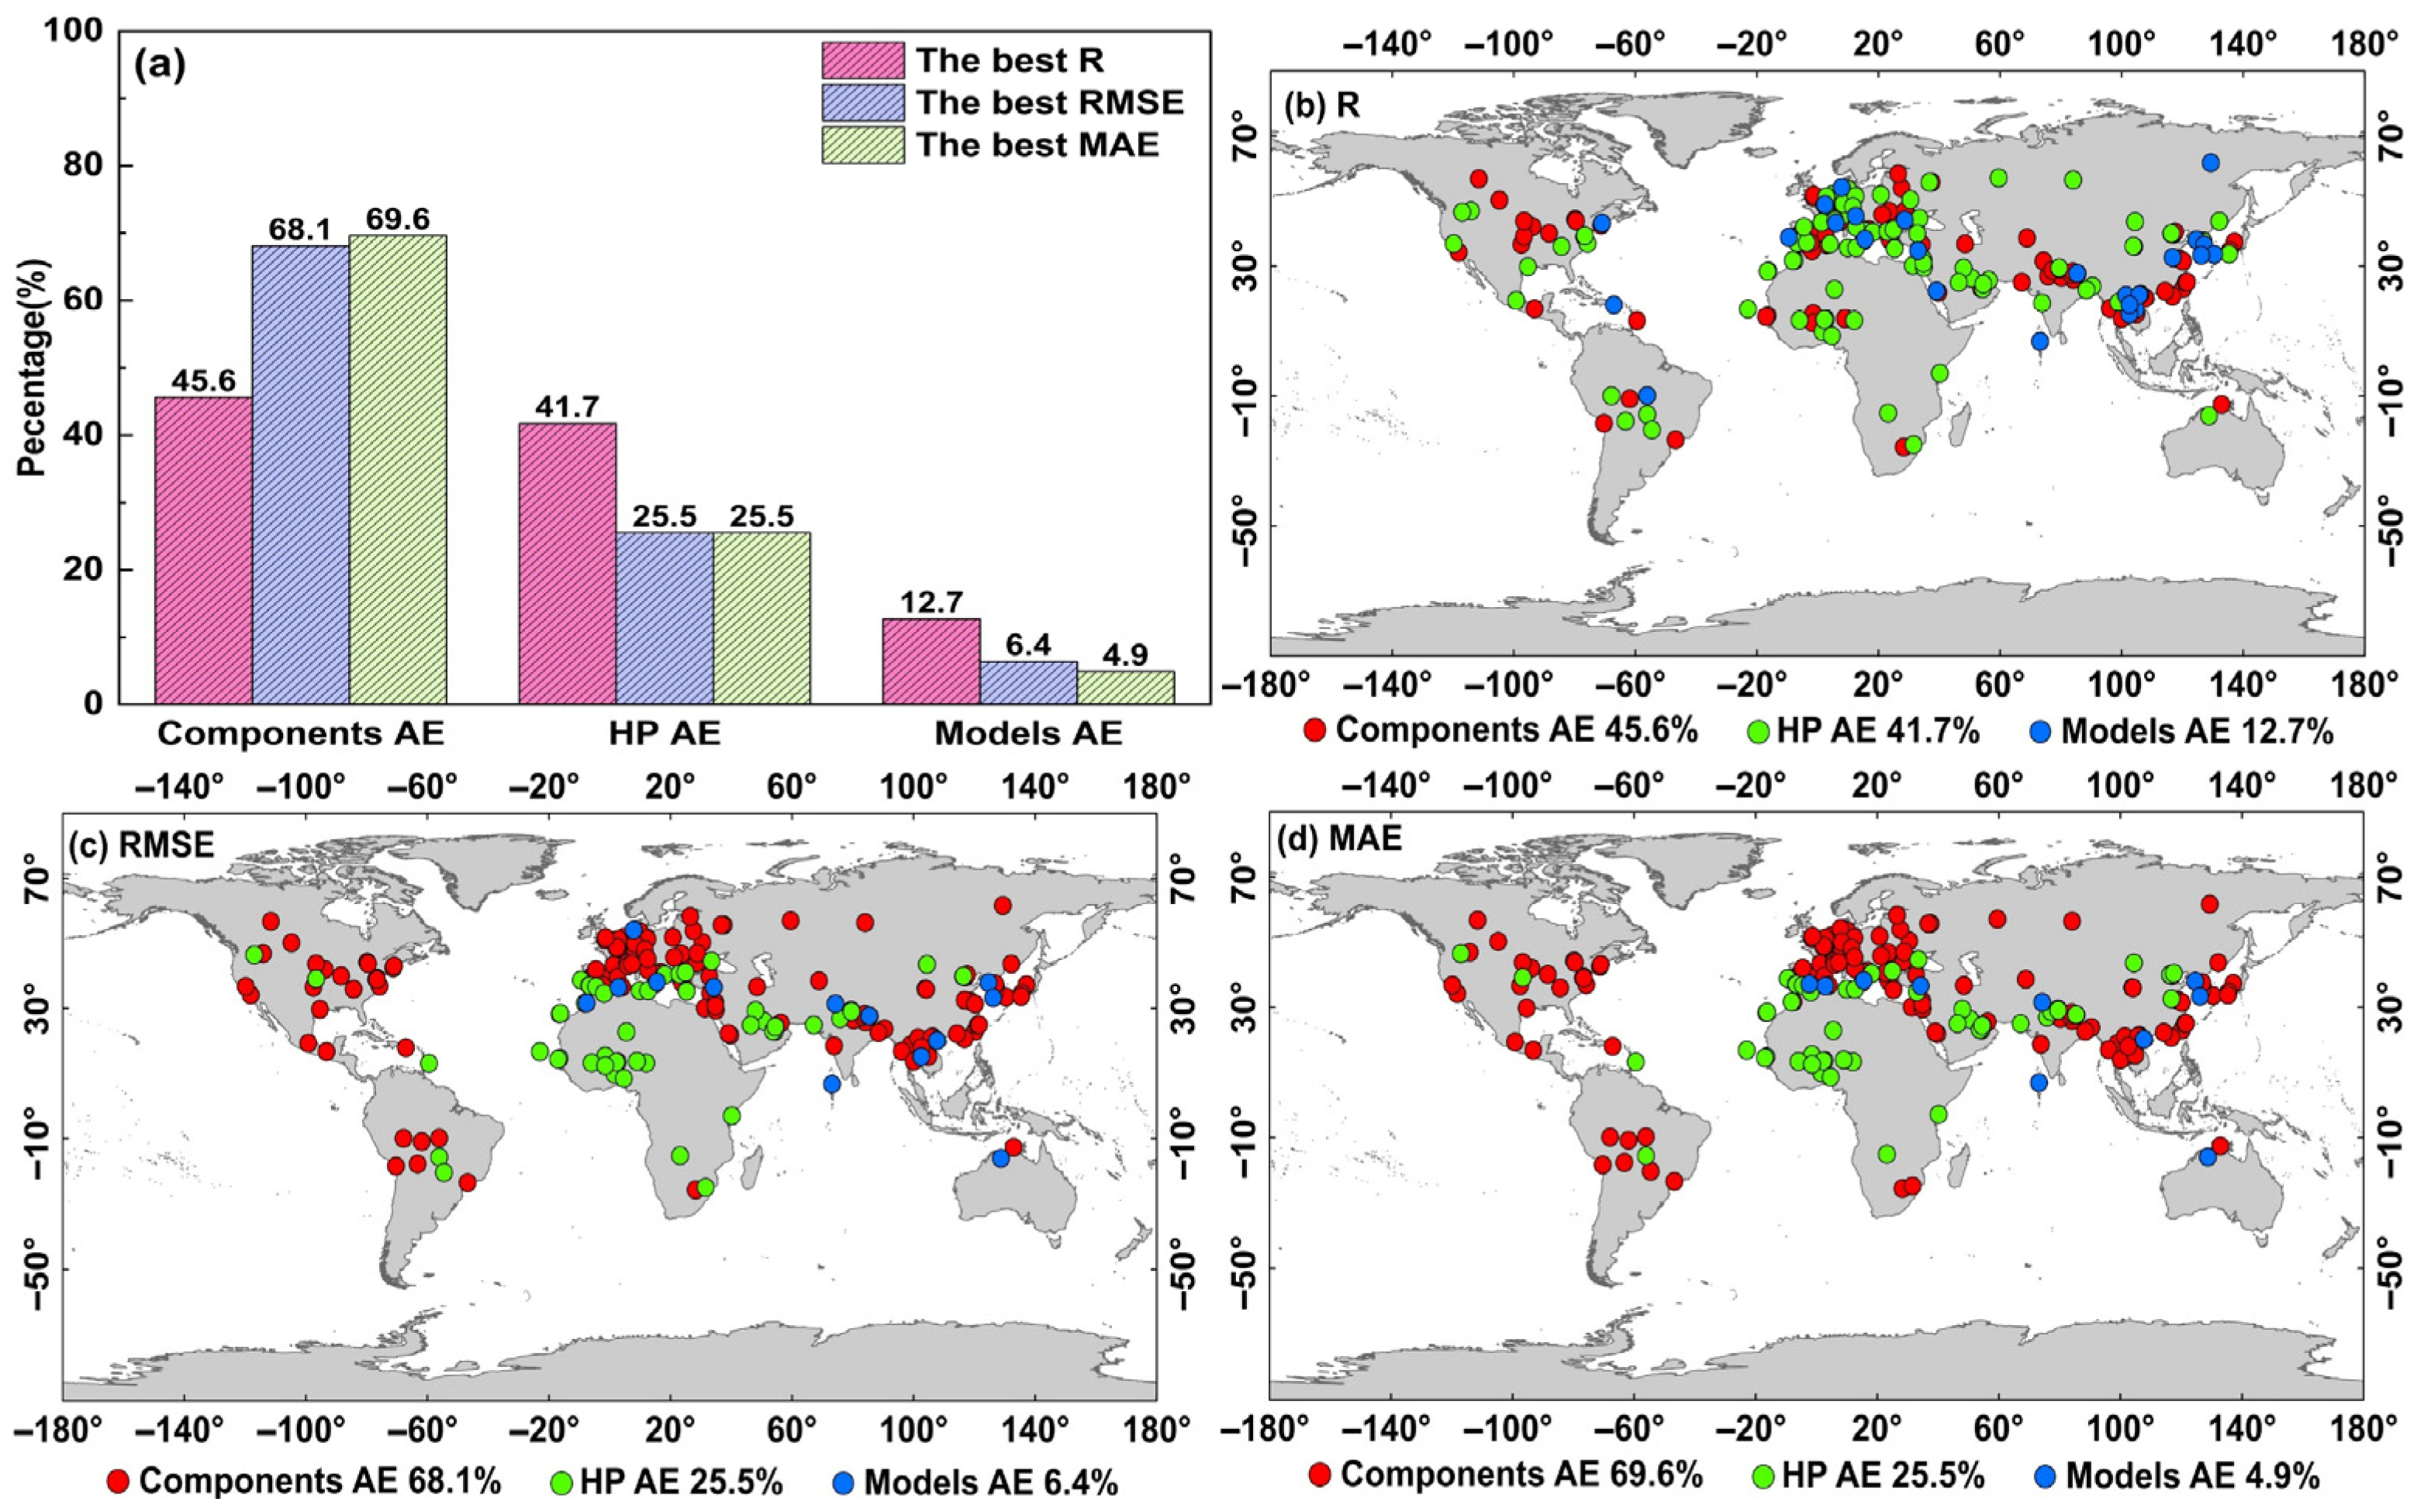
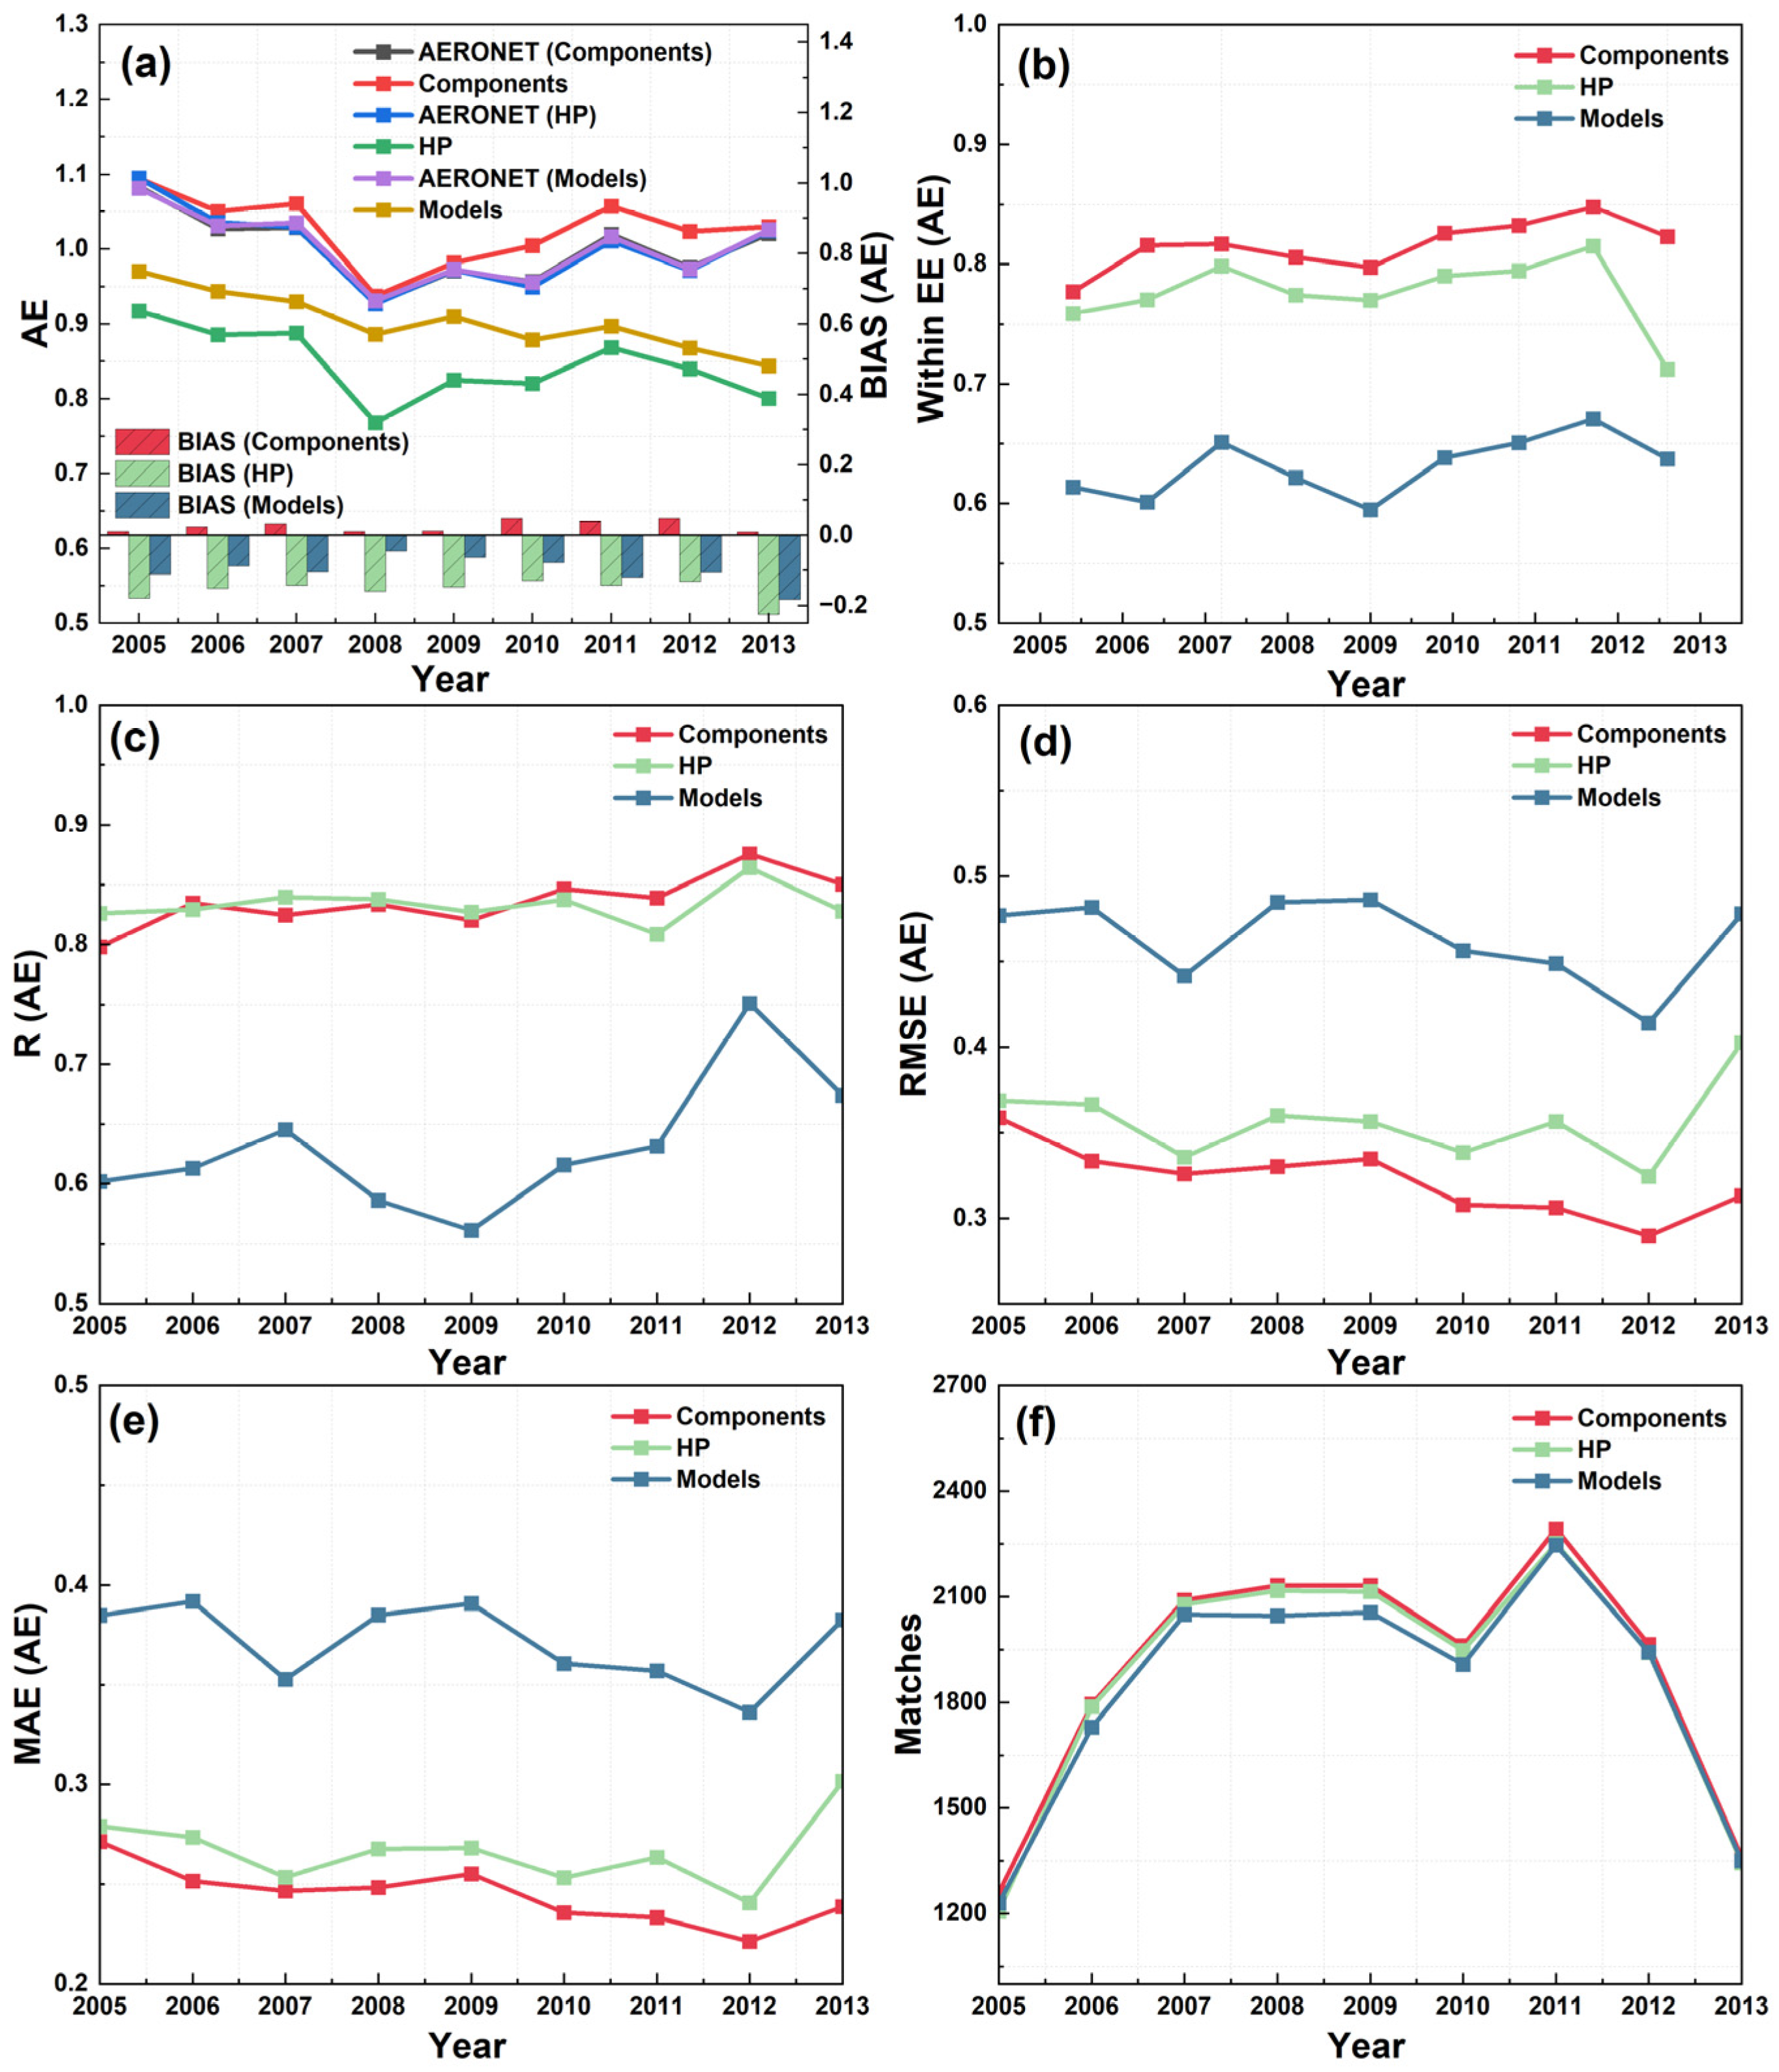
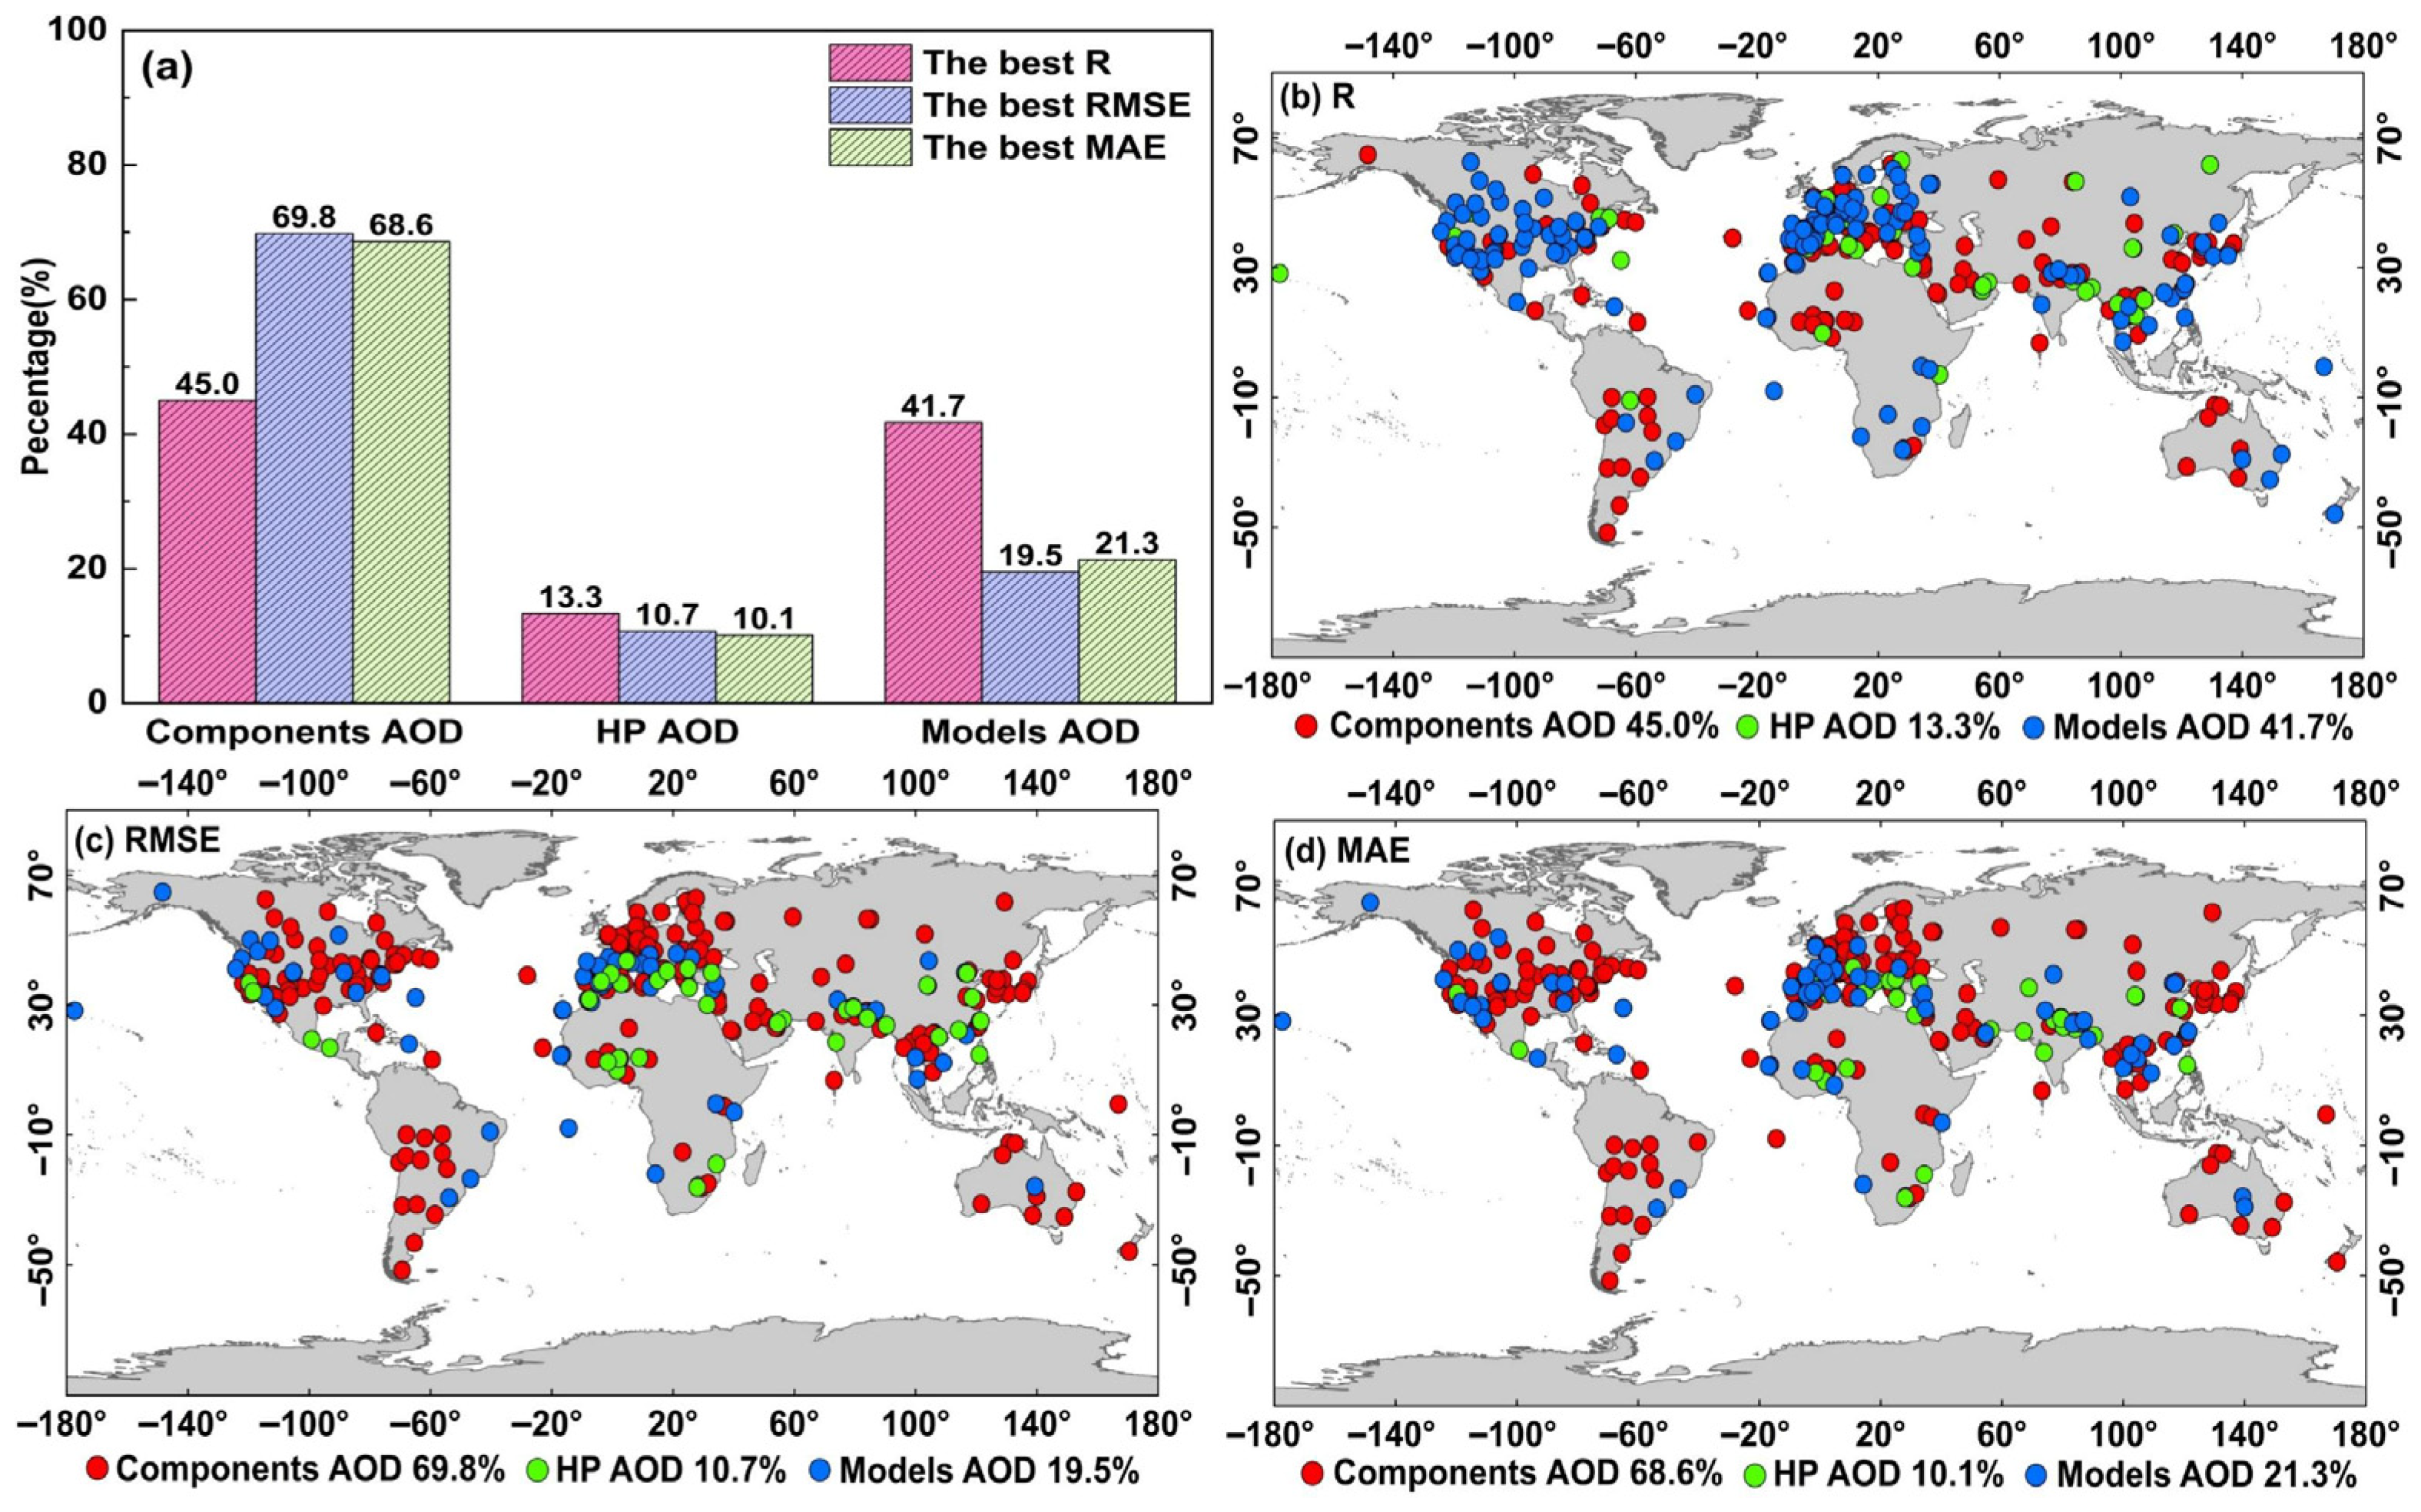
- Global and regional accuracy validation: the overall validation results indicate that the three POLDER-3 GRASP AOD products show good consistency with observations from all AERONET sites and long-term AERONET sites (R > 0.879). Components AOD demonstrates superior overall statistical metrics (BIAS within −0.011, RMSE = 0.114, and Within GCOS = 45.7%), followed by Models AOD (BIAS within 0.009, RMSE < 0.138, and Within GCOS > 43.4%), and the HP AOD showed the worst validation metrics (BIAS within 0.071, RMSE < 0.158, and Within GCOS > 27.6%). The BIAS metric shows that the HP product overestimated AOD. For AE, the Components AE performs best (R > 0.834, RMSE < 0.321, and Within EE_AE > 81.7%), followed by HP AE (R > 0.820, RMSE < 0.366, and Within EE_AE > 76.9%), and Models AE shows relatively lower accuracy (R < 0.629, RMSE > 0.459, and Within EE_AE < 63.8%). Both HP and Models products underestimate the AE (BIAS < −0.1), and the Components product slightly overestimates AE (BIAS = 0.018). Components AOD performs best in 8/10 regions globally, Models AOD performed best in the SEA region, and HP AOD performed best in the IND region. For AE, Components AE performs best in the 8/10 regions globally. In the remaining two regions, the HP AE shows the best performance. The site-by-site RMSE comparison results show that the Components AOD performs best in 69.8% of the sites, and the Components AE performs best in 68.1% of the sites.
- (2)
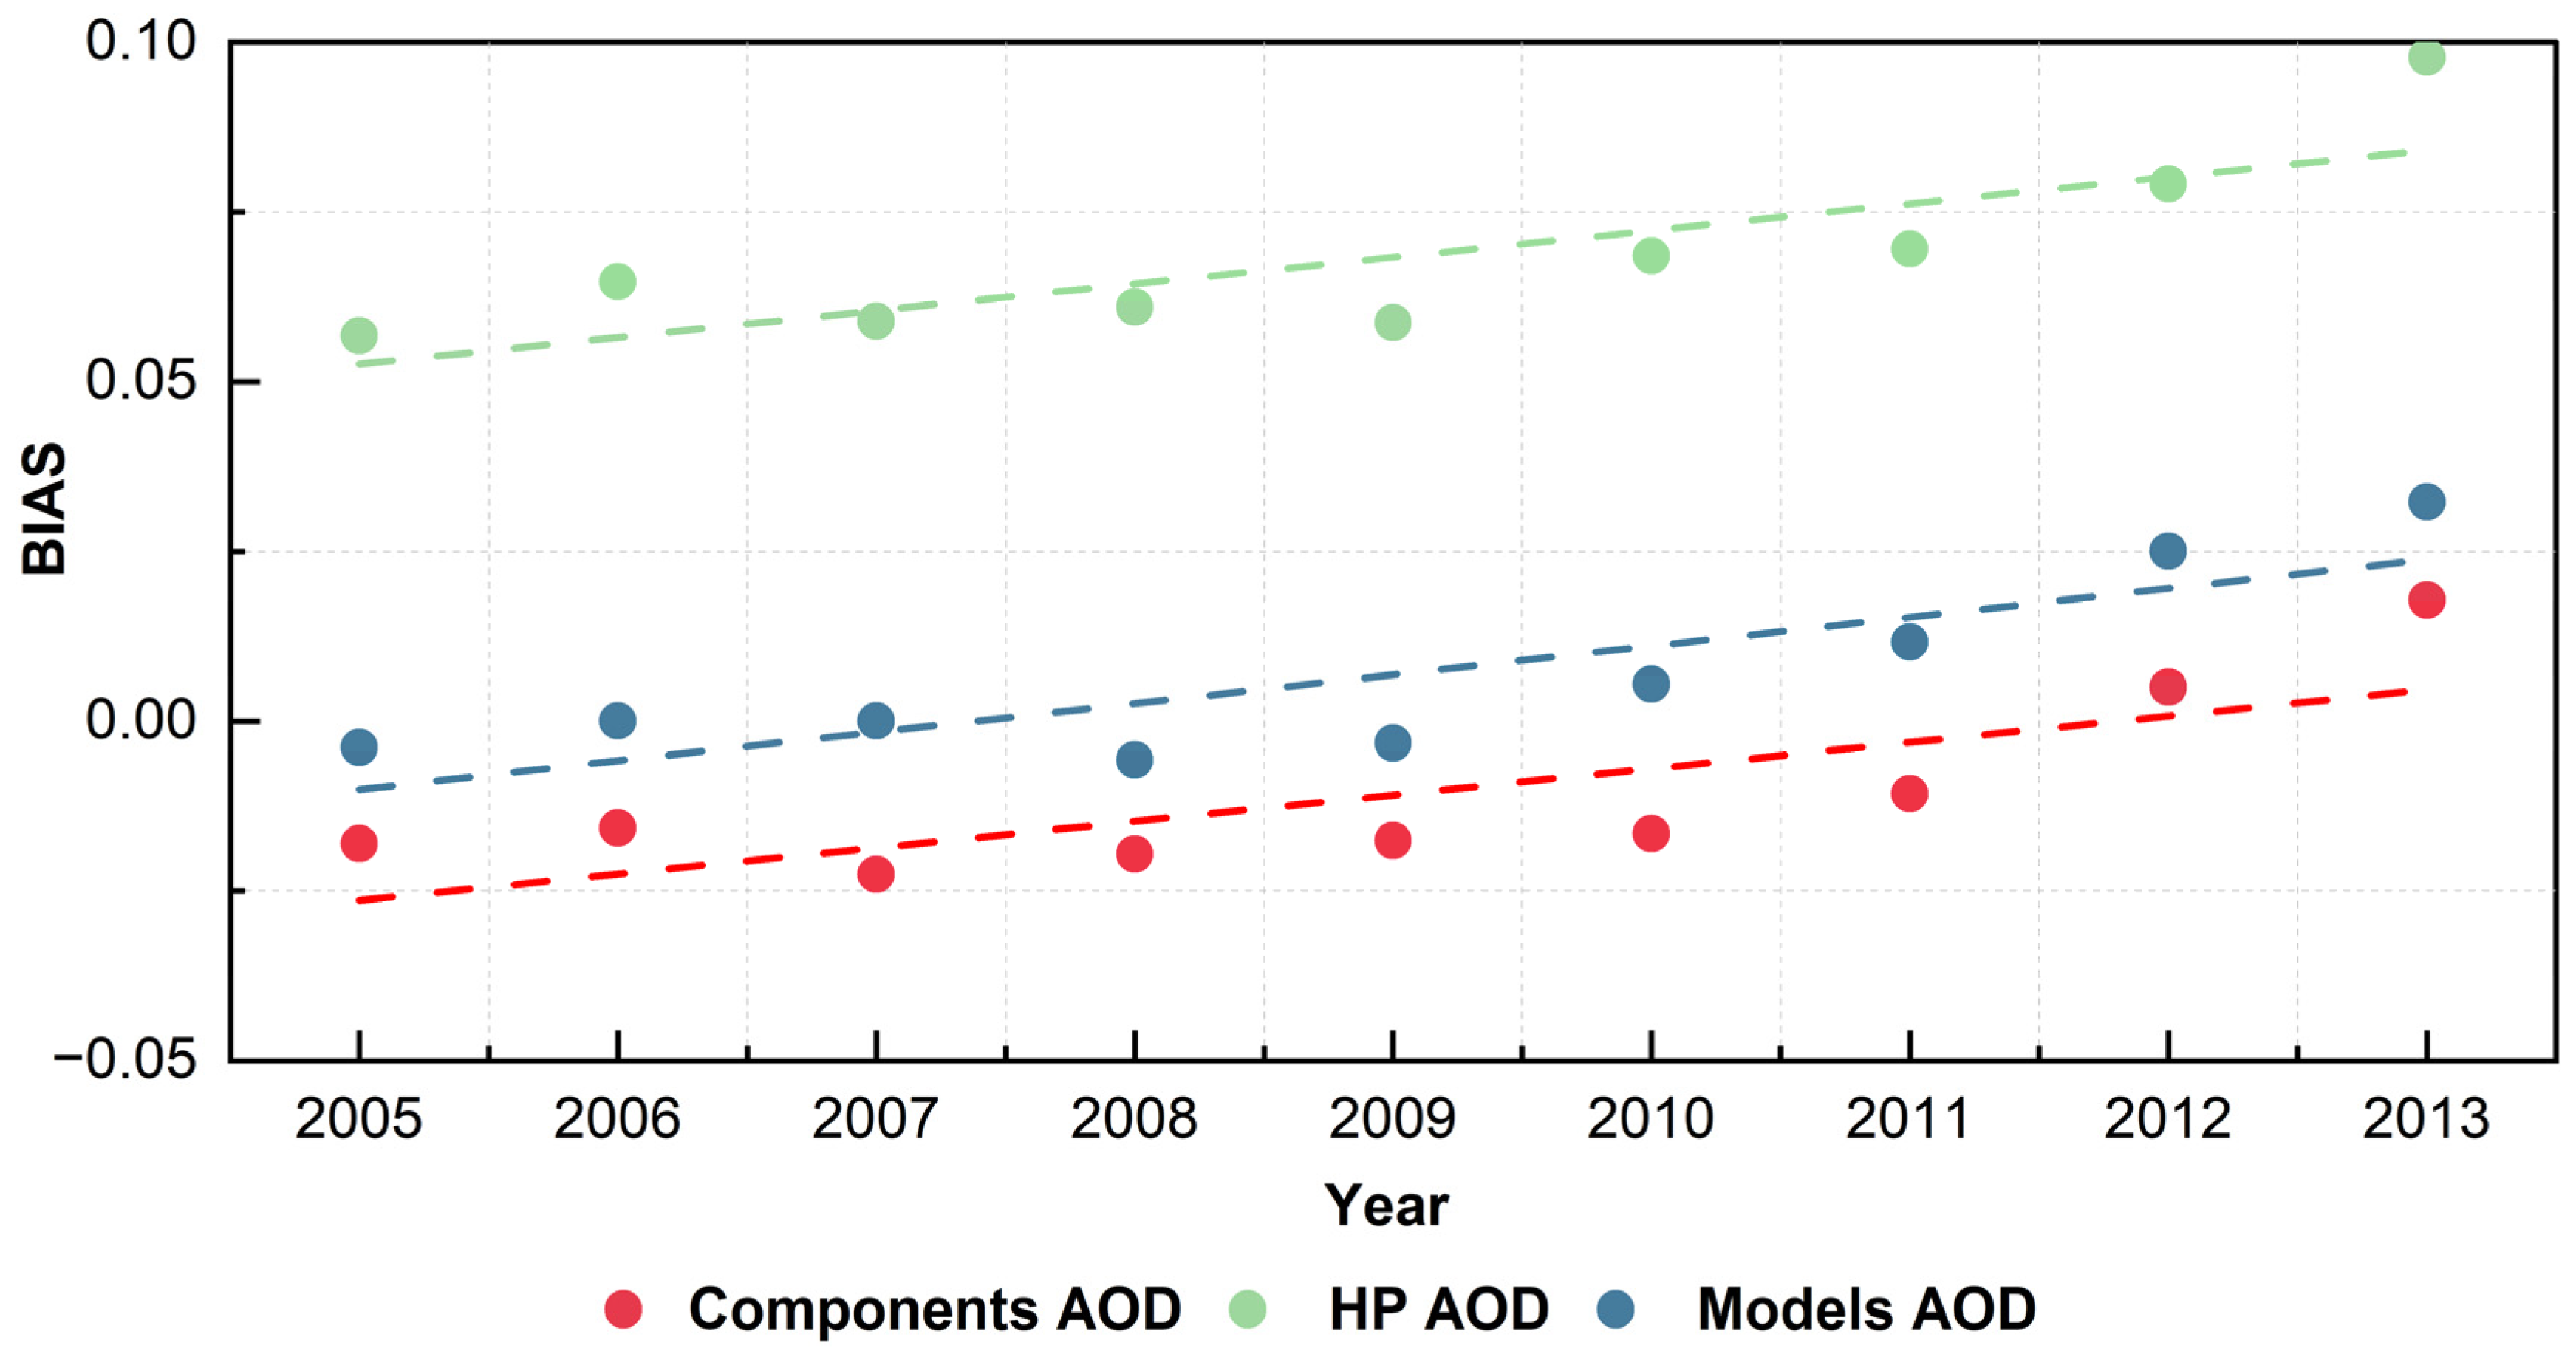
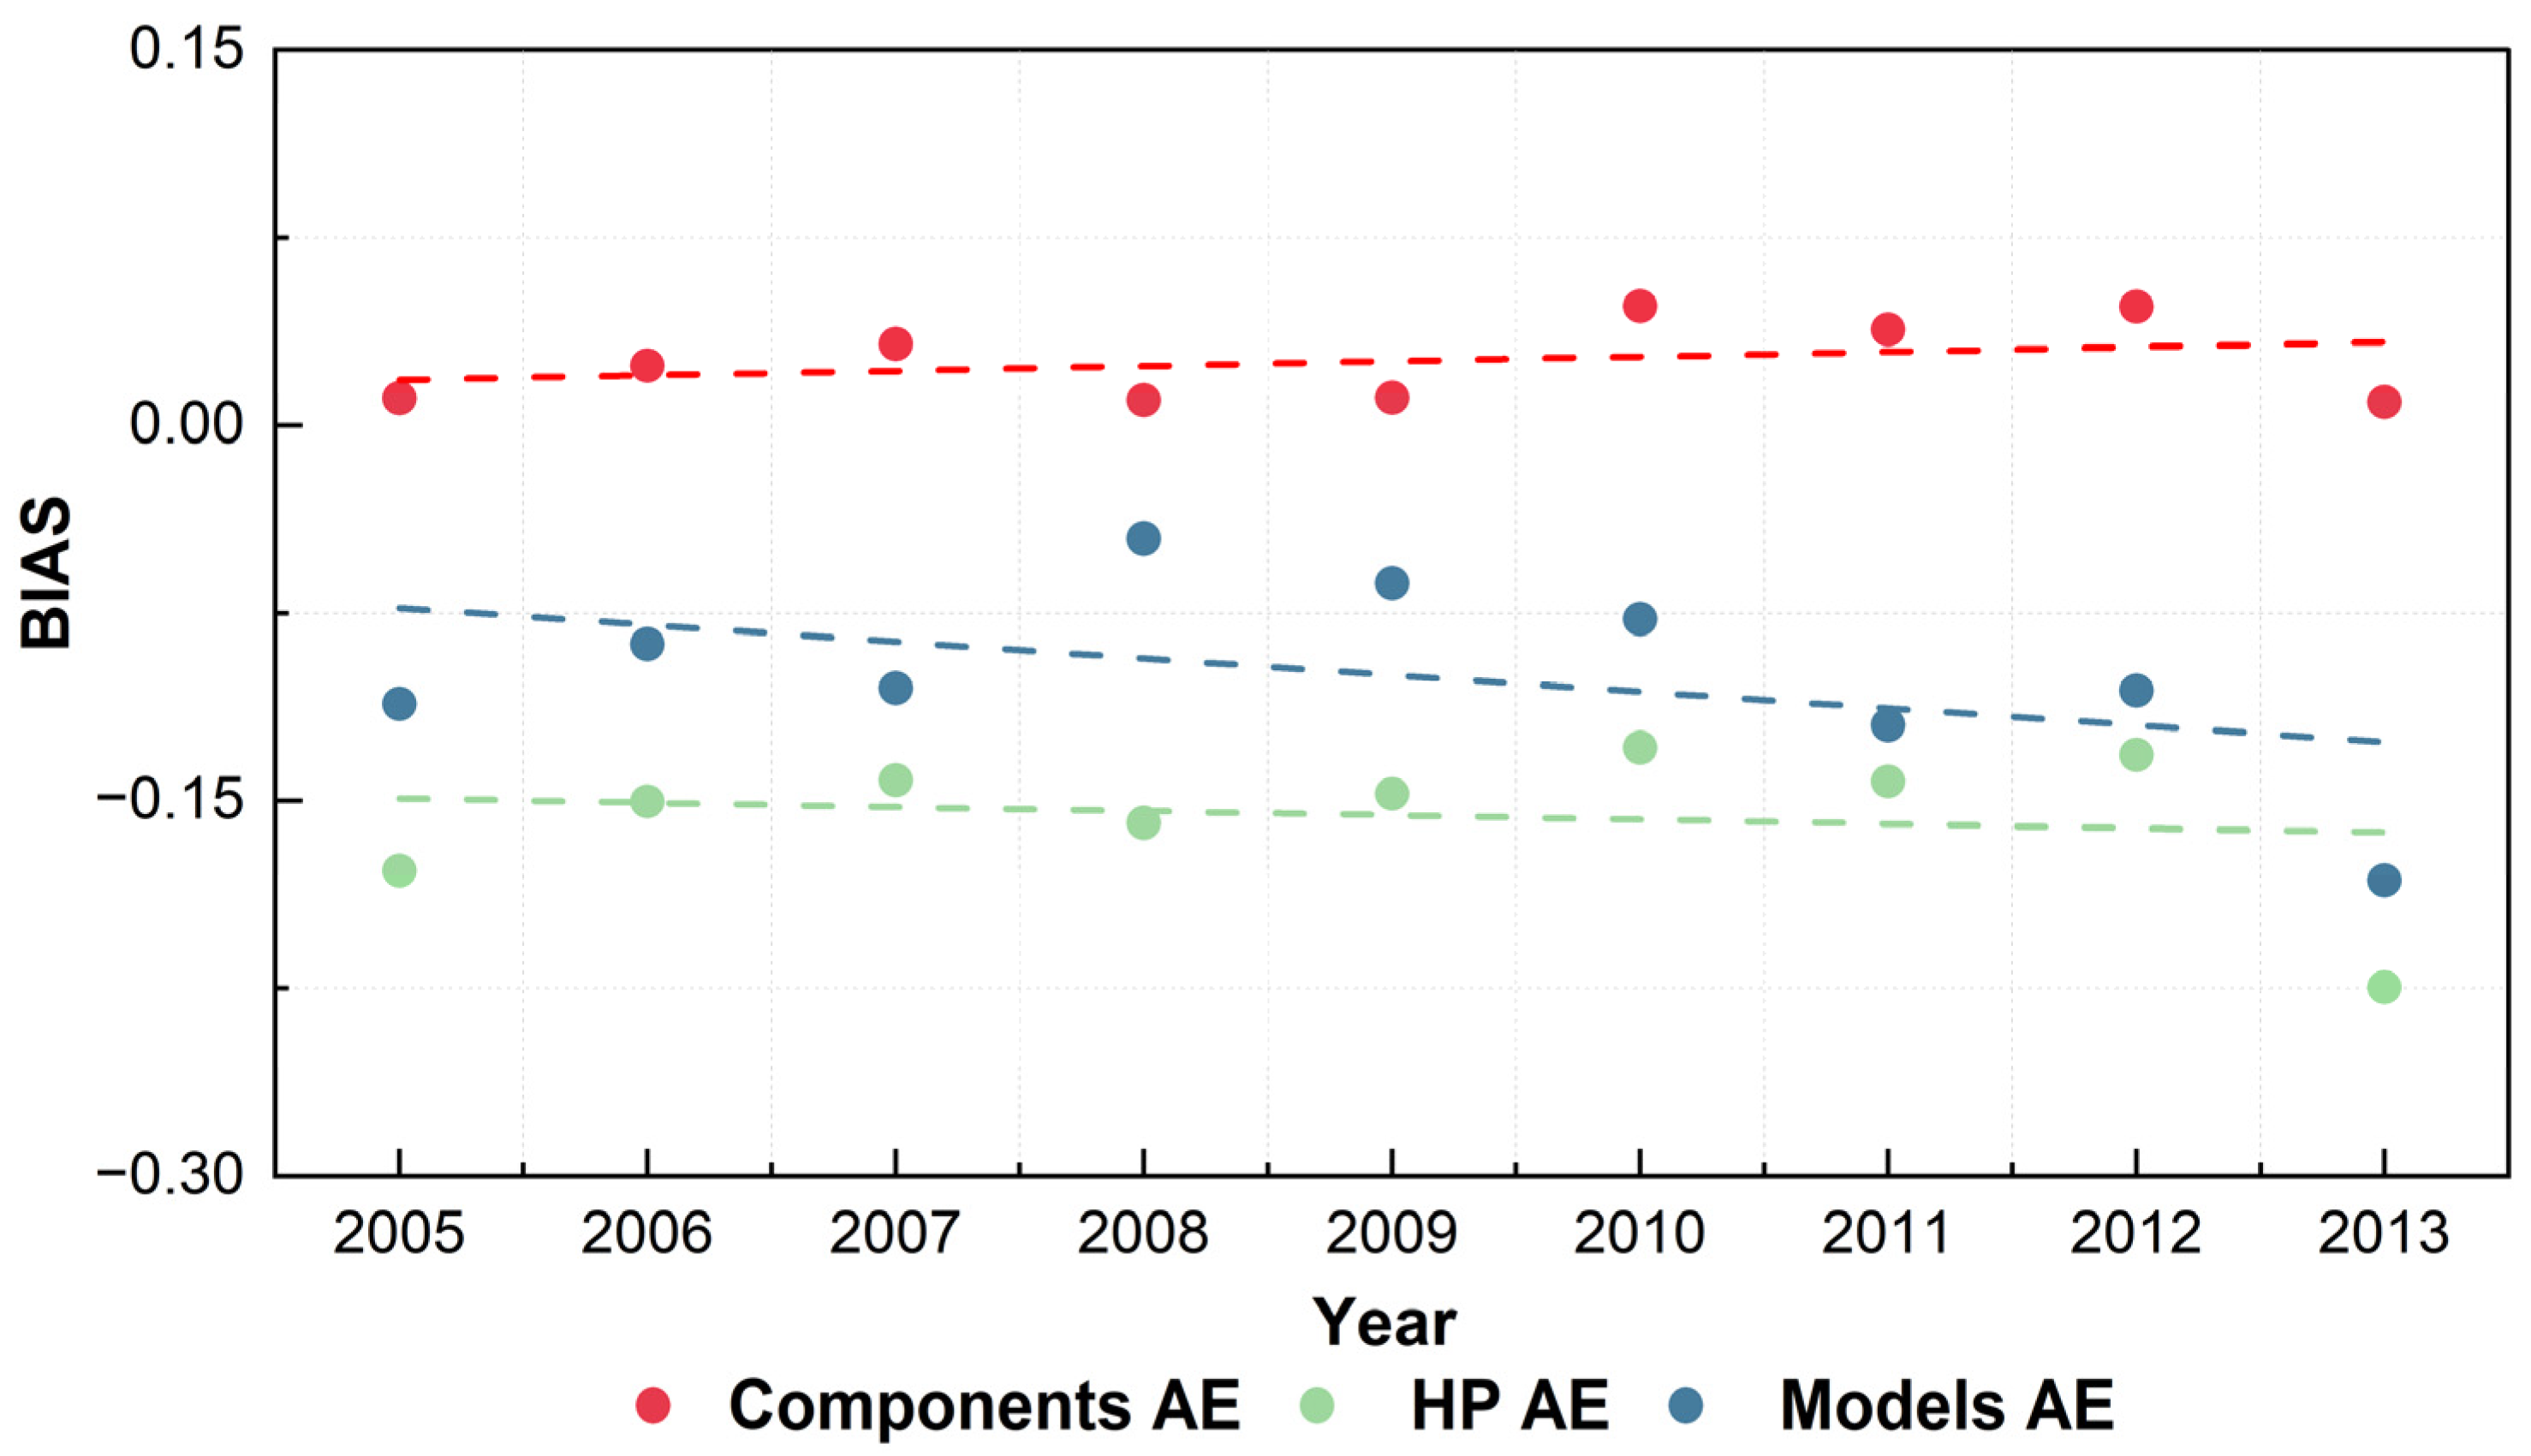
- Global and regional stability assessment: The results show that the stability metrics of the three AOD products range from 0.034 to 0.036 per decade, and none of them meet the GCOS stability requirement (i.e., within 0.02 per decade). However, in the Oceania region, both Components and HP meet the GCOS requirement (0.017 per decade and 0.016 per decade); in the South Africa region, Models AOD meets the GCOS requirement (0.019 per decade); and in the Northeast Asia region, Components and Models AOD meet the GCOS requirement (0.018 per decade and 0.020 per decade). For the AE, the stability metrics are 0.028 per decade for Components, 0.042 per decade for HP, and 0.077 per decade for Models. In this study, slope and standard deviation are used, each with its own advantages. Therefore, it is necessary to combine the two metrics to comprehensively assess stability.
- (3)
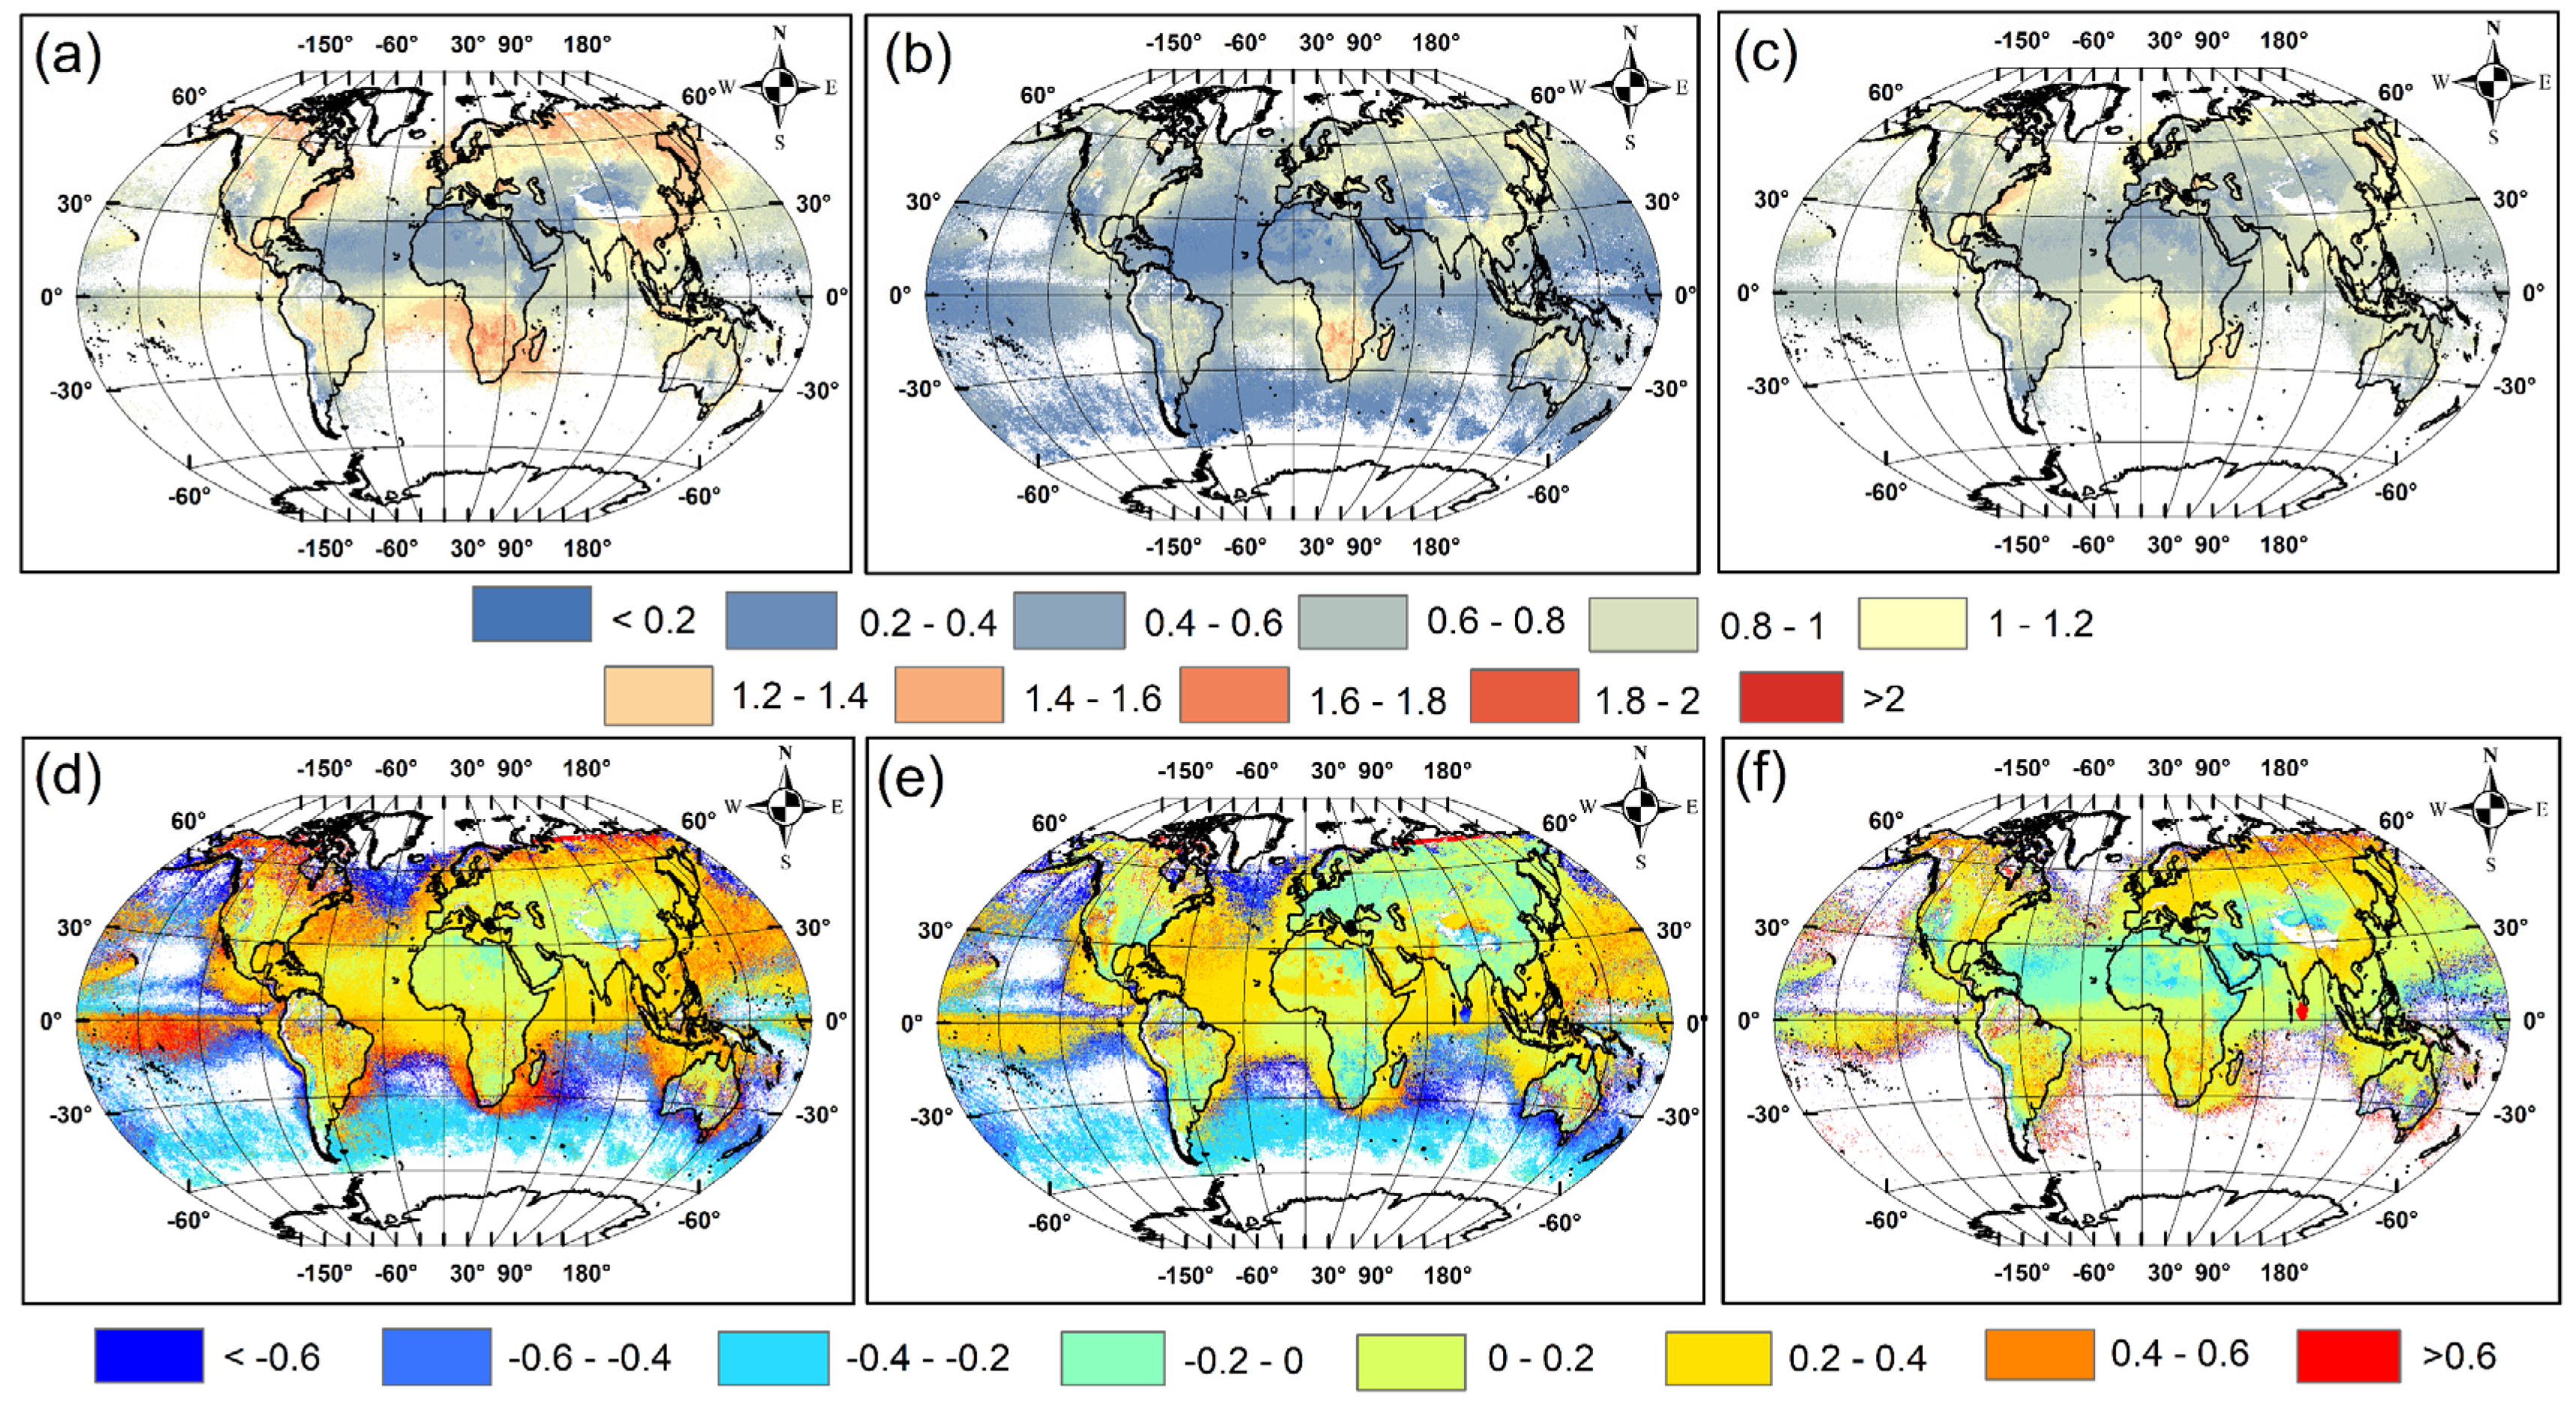
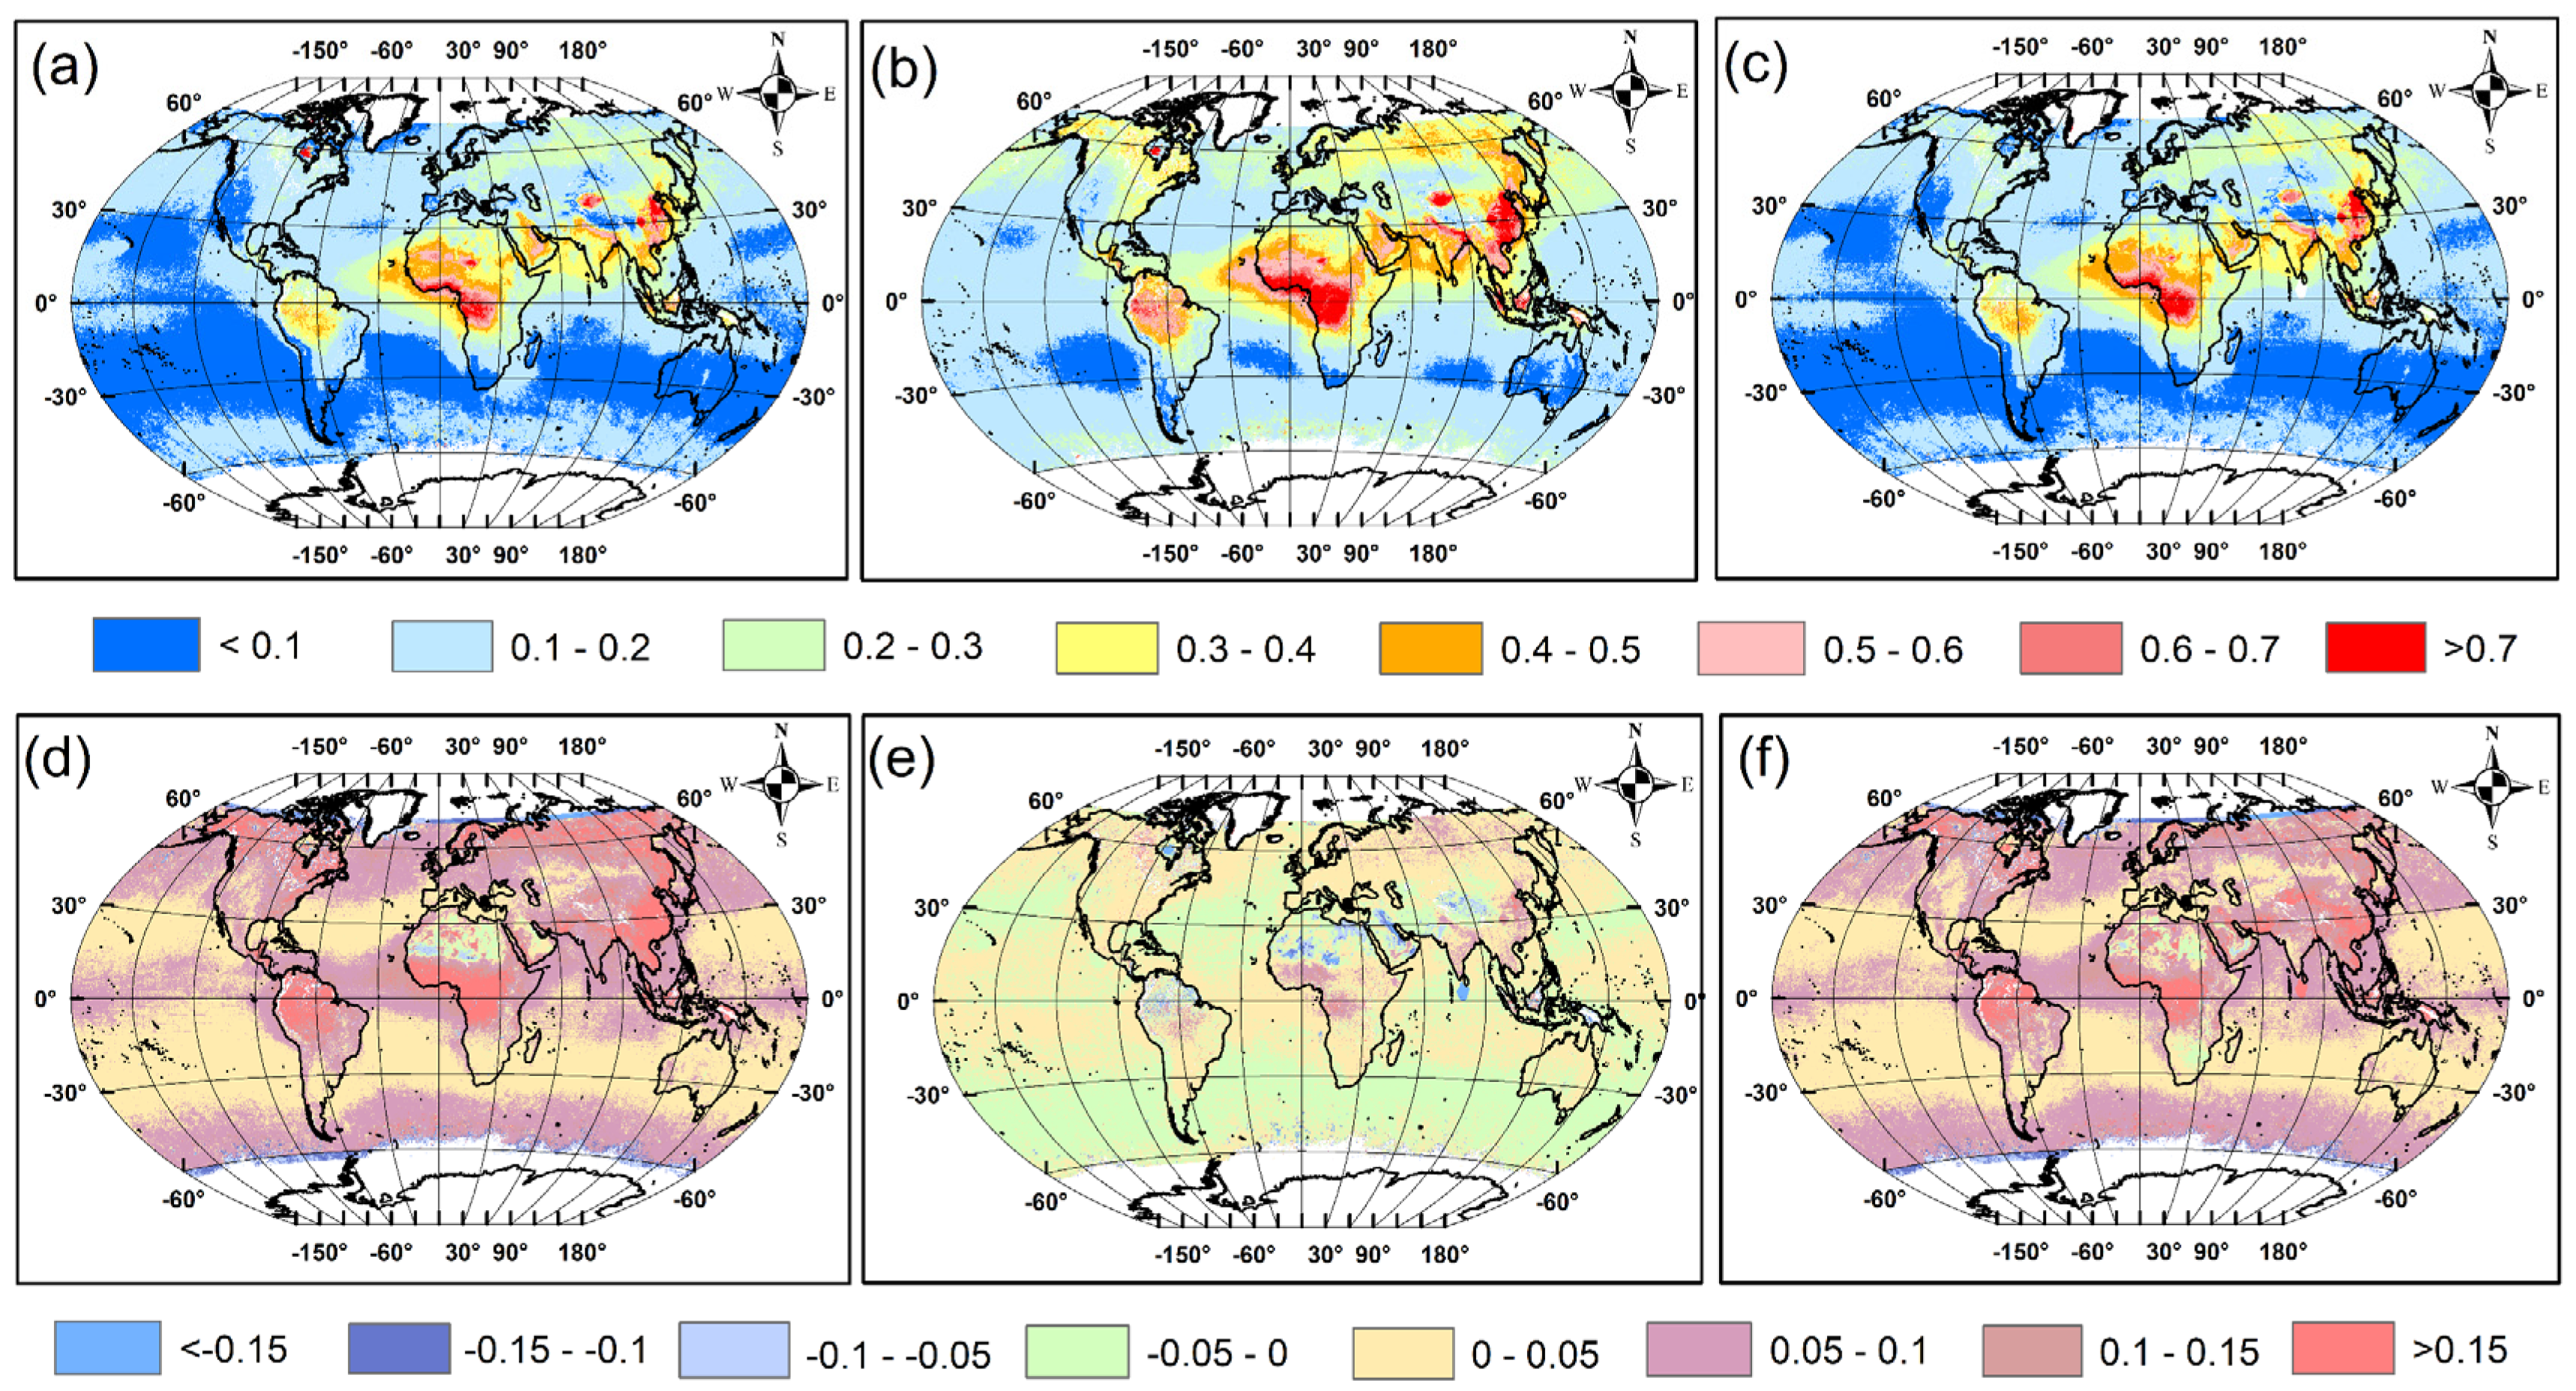
- Regarding spatiotemporal distribution patterns, regions such as North Africa-Middle East, South Africa, and Northeast Asia exhibit relatively high AOD loadings, while North America, Europe, and Oceania generally show lower AOD loadings. The spatial distribution patterns of Components AOD and Models AOD show high consistency, with over 95.84% of pixels exhibiting differences smaller than ±0.05. HP’s AOD difference from the other two products is within ±0.05 in less than 70% of global pixels. Spatial distribution pattern of HP AOD is systematically higher than that of Components AOD and Models AOD, which is consistent with the validation results indicating that HP overestimates AOD. For the AE parameter, the three products showed significant spatial distribution divergence. The difference between Components AE and HP AE is less than ±0.2 (±0.4) at 55.95% (79.32%) of pixels. This indicates inconsistent AE retrievals among GRASP algorithm variants, which is due to the different aerosol model setting strategies of the GRASP algorithms.
- (4)
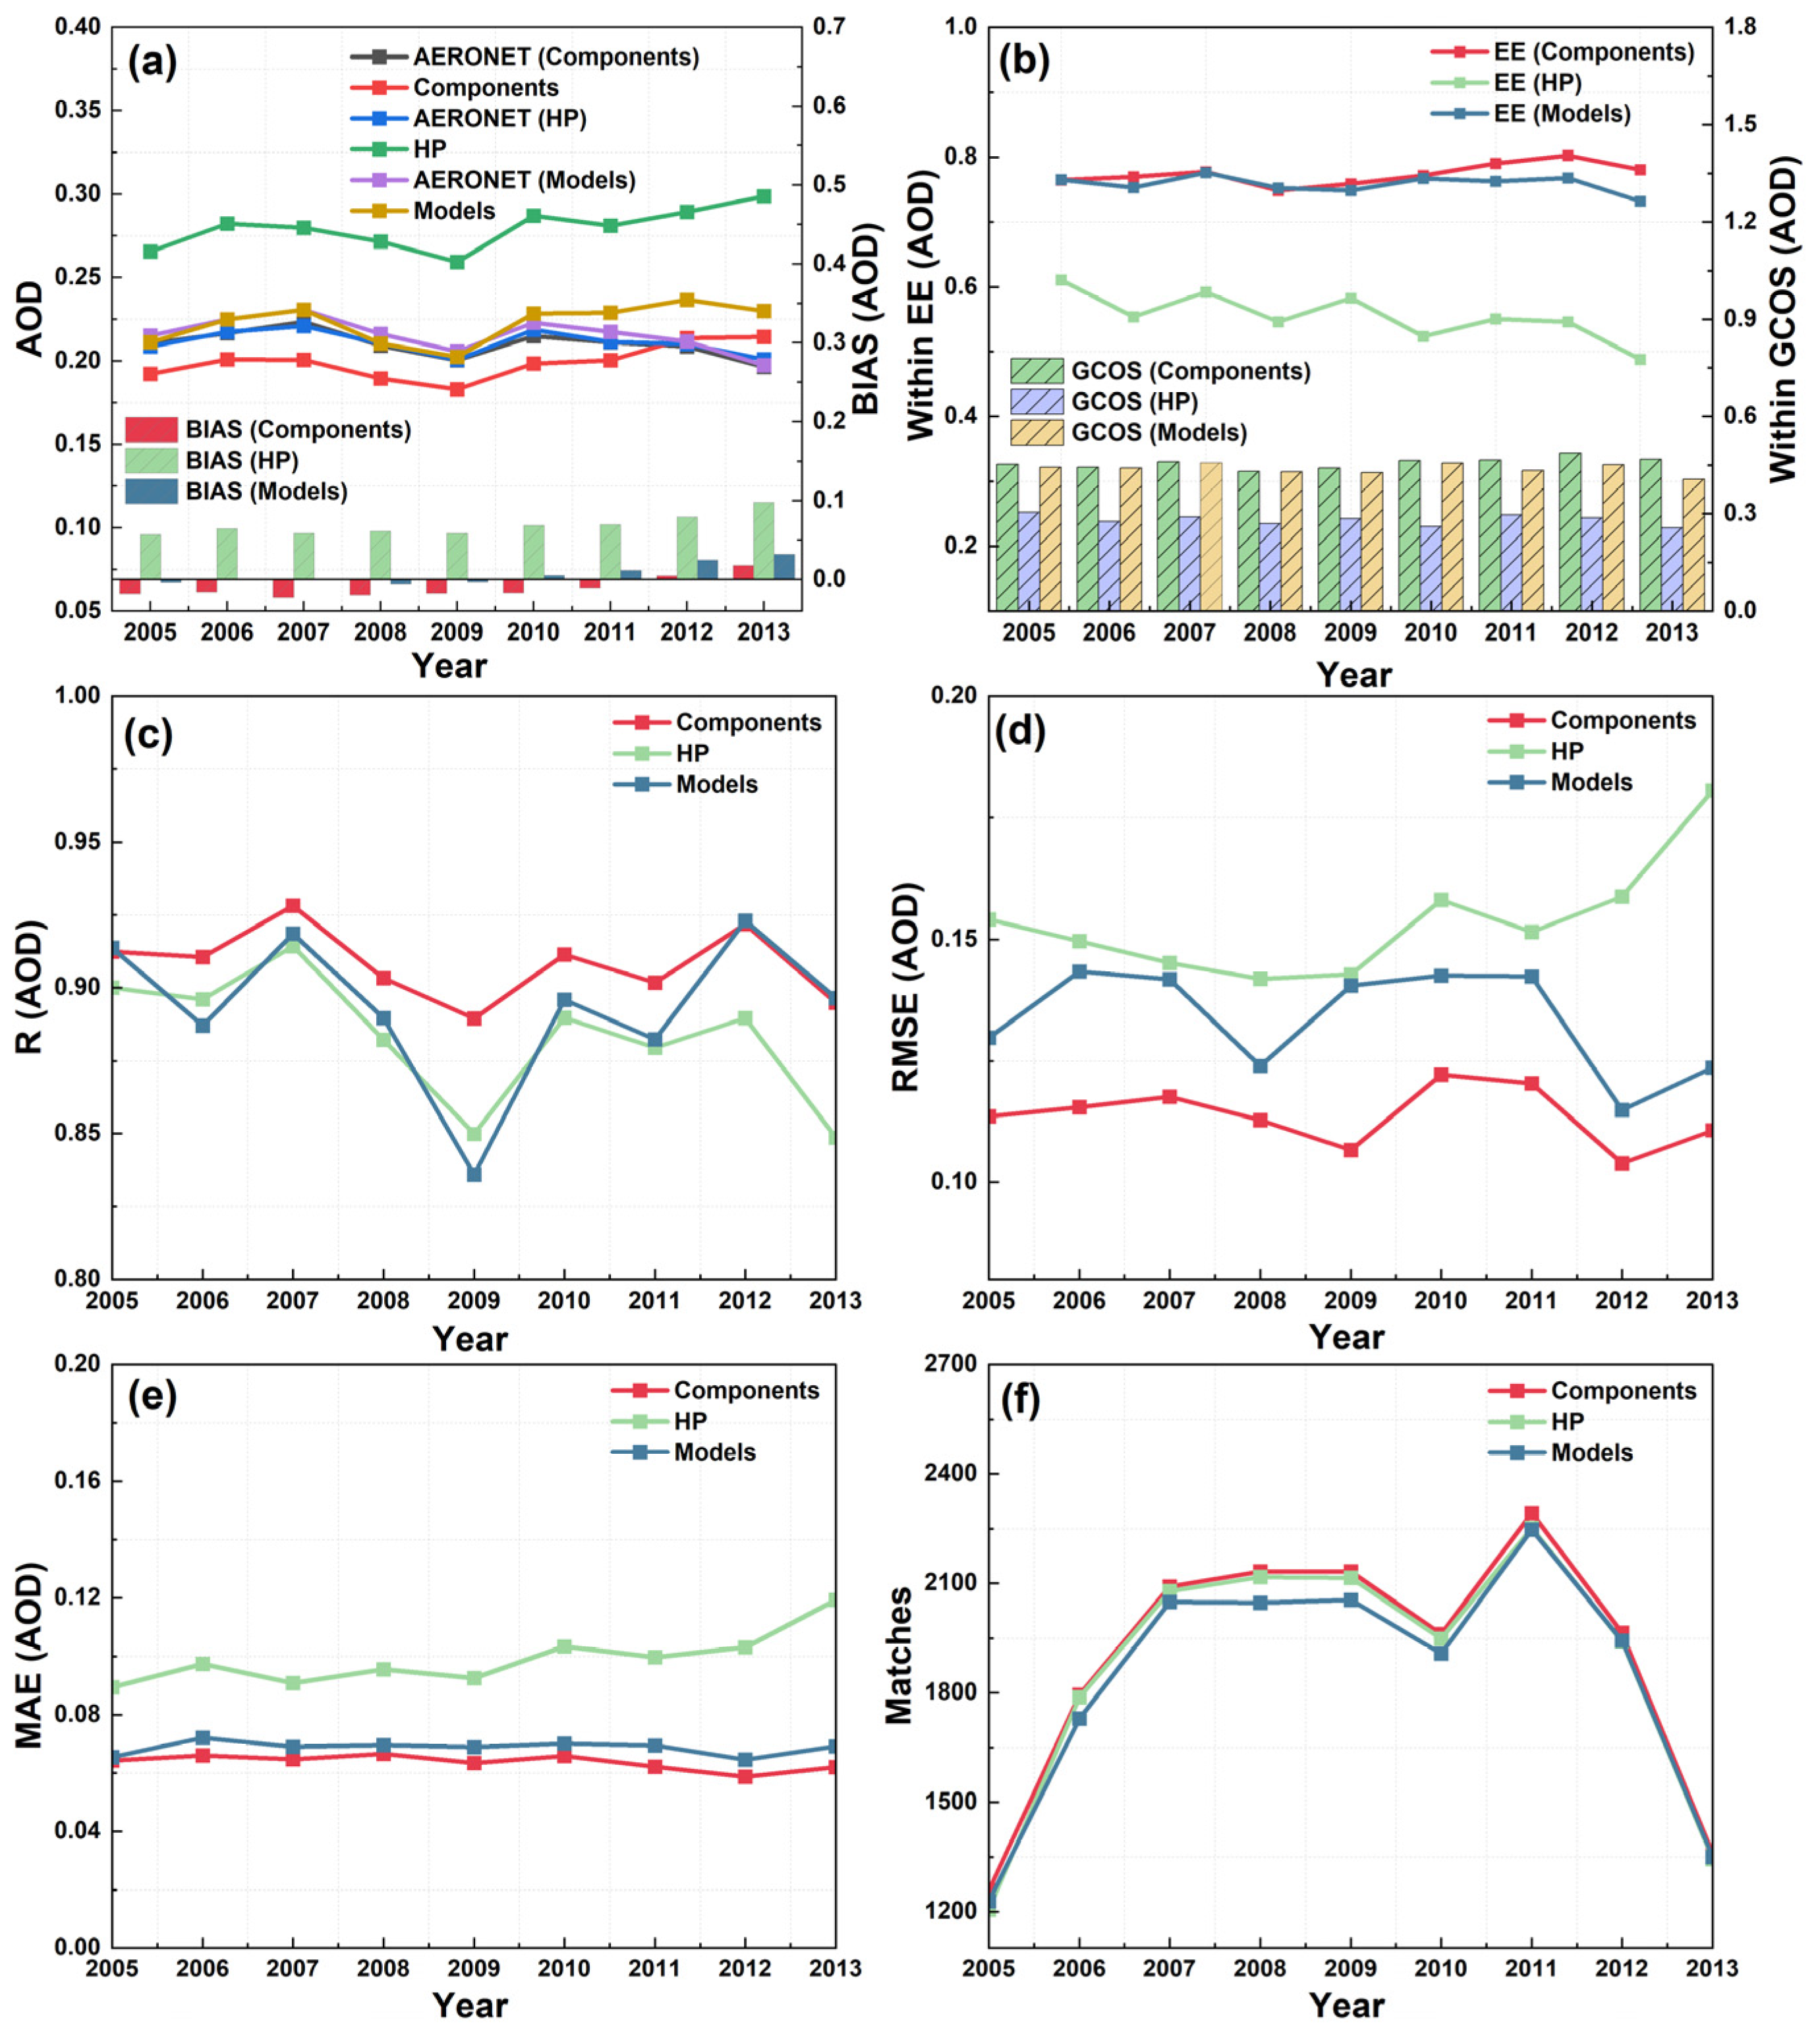
- Product usage recommendation: overall, Component AOD demonstrates the highest validation accuracy globally and across 8 out of 10 regions, making it the recommended choice for the application. Users should exercise caution when applying POLDER-3/GRASP products to long-term trend analyses due to their relatively poor temporal stability. The long-term accuracy variations in these products may obscure true temporal changes in AOD and AE. The time-dependent bias characteristics of different AOD products are highly correlated (R > 0.95), suggesting that the AOD bias may be systematically inherent in the GRASP algorithm or caused by POLDER-3 radiometric calibration errors. The differences in spatial distribution patterns among the three products show higher consistency between Components AOD and Models AOD, suggesting reasonable spatial representativeness. In contrast, the poor agreement in AE among the three products indicates a need to develop a unified GRASP algorithm to improve the accuracy and spatiotemporal representation of AE retrieval.
Supplementary Materials
Author Contributions
Funding
Data Availability Statement
Acknowledgments
Conflicts of Interest
References
- Yang, X.; Wang, Y.; Zhao, C.; Fan, H.; Yang, Y.; Chi, Y.; Shen, L.; Yan, X. Health risk and disease burden attributable to long-term global fine-mode particles. Chemosphere 2022, 287, 132435. [Google Scholar] [CrossRef]
- Li, J.; Carlson, B.E.; Yung, Y.L.; Lv, D.; Hansen, J.; Penner, J.E.; Liao, H.; Ramaswamy, V.; Kahn, R.A.; Zhang, P.; et al. Scattering and absorbing aerosols in the climate system. Nat. Rev. Earth Environ. 2022, 3, 363–379. [Google Scholar] [CrossRef]
- Jia, H.; Quaas, J.; Kroese, W.; van Diedenhoven, B.; Gryspeerdt, E.; Böhm, C.; Block, K.; Hasekamp, O. Optimal choice of proxy for cloud condensation nuclei reduces uncertainty in aerosol-cloud-climate forcing. Sci. Adv. 2026, 12, eaea4828. [Google Scholar] [CrossRef]
- Su, X.; Cao, M.; Wang, L.; Gui, X.; Zhang, M.; Huang, Y.; Zhao, Y. Validation, inter-comparison, and usage recommendation of six latest VIIRS and MODIS aerosol products over the ocean and land on the global and regional scales. Sci. Total Environ. 2023, 884, 163794. [Google Scholar] [CrossRef]
- Su, X.; Wang, L.; Gui, X.; Yang, L.; Li, L.; Zhang, M.; Qin, W.; Tao, M.; Wang, S.; Wang, L. Retrieval of total and fine mode aerosol optical depth by an improved MODIS Dark Target algorithm. Environ. Int. 2022, 166, 107343. [Google Scholar] [CrossRef]
- Dubovik, O.; Li, Z.; Mishchenko, M.I.; Tanré, D.; Karol, Y.; Bojkov, B.; Cairns, B.; Diner, D.J.; Espinosa, W.R.; Goloub, P.; et al. Polarimetric remote sensing of atmospheric aerosols: Instruments, methodologies, results, and perspectives. J. Quant. Spectrosc. Radiat. Transf. 2019, 224, 474–511. [Google Scholar] [CrossRef]
- Gu, H.; Zhang, Y.; Fan, C.; Li, Z.; Hou, W.; Liu, Z.; Xie, Y.; Xu, H.; Zhang, L.; Ma, J. A Comprehensive Analysis of Ultraviolet Remote Sensing for Aerosol Layer Height Retrieval from Multi-Angle Polarization Satellite Measurements. Remote Sens. 2022, 14, 6258. [Google Scholar] [CrossRef]
- Li, Z.; Hou, W.; Hong, J.; Zheng, F.; Luo, D.; Wang, J.; Gu, X.; Qiao, Y. Directional Polarimetric Camera (DPC): Monitoring aerosol spectral optical properties over land from satellite observation. J. Quant. Spectrosc. Radiat. Transf. 2018, 218, 21–37. [Google Scholar] [CrossRef]
- Zhang, Z.; Li, Z.; Fu, G.; Hasekamp, O.; Fan, C.; Qie, L.; Xie, Y.; Li, L.; Ji, Z.; Liu, Q. Global Aerosol Retrieval Over Land Using the Chinese Satellite Polarimeter DPC-2/GF-5(02). IEEE Trans. Geosci. Remote Sens. 2025, 63, 4113314. [Google Scholar] [CrossRef]
- Dubovik, O.; Lapyonok, T.; Litvinov, P.; Herman, M.; Fuertes, D.; Ducos, F.; Torres, B.; Derimian, Y.; Huang, X.; Lopatin, A.; et al. GRASP: A versatile algorithm for characterizing the atmosphere. SPIE Newsroom. 2014. [Google Scholar] [CrossRef]
- Li, L.; Dubovik, O.; Derimian, Y.; Schuster, G.L.; Lapyonok, T.; Litvinov, P.; Ducos, F.; Fuertes, D.; Chen, C.; Li, Z.; et al. Retrieval of aerosol components directly from satellite and ground-based measurements. Atmos. Chem. Phys. 2019, 19, 13409–13443. [Google Scholar] [CrossRef]
- Chen, C.; Dubovik, O.; Fuertes, D.; Litvinov, P.; Lapyonok, T.; Lopatin, A.; Ducos, F.; Derimian, Y.; Herman, M.; Tanré, D.; et al. Validation of GRASP algorithm product from POLDER/PARASOL data and assessment of multi-angular polarimetry potential for aerosol monitoring. Earth Syst. Sci. Data 2020, 12, 3573–3620. [Google Scholar] [CrossRef]
- Jin, S.; Ma, Y.; Chen, C.; Dubovik, O.; Hong, J.; Liu, B.; Gong, W. Performance evaluation for retrieving aerosol optical depth from the Directional Polarimetric Camera (DPC) based on the GRASP algorithm. Atmos. Meas. Tech. 2022, 15, 4323–4337. [Google Scholar] [CrossRef]
- Chen, C.; Lei, X.; Liu, Z.; Gu, H.; Dubovik, O.; Litvinov, P.; Fuertes, D.; Cao, Y.; Yu, H.; Xiang, G.; et al. Development of Level 2 aerosol and surface products from cross-track scanning polarimeter POSP on board the GF-5(02) satellite. Earth Syst. Sci. Data 2025, 17, 3497–3519. [Google Scholar] [CrossRef]
- Zhang, X.; Li, L.; Chen, C.; Chen, X.; Dubovik, O.; Derimian, Y.; Gui, K.; Zheng, Y.; Zhao, H.; Zhang, L.; et al. Validation of the aerosol optical property products derived by the GRASP/Component approach from multi-angular polarimetric observations. Atmos. Res. 2021, 263, 105802. [Google Scholar] [CrossRef]
- Wei, Y.; Li, Z.; Zhang, Y.; Chen, C.; Dubovik, O.; Zhang, Y.; Xu, H.; Li, K.; Chen, J.; Wang, H.; et al. Validation of POLDER GRASP aerosol optical retrieval over China using SONET observations. J. Quant. Spectrosc. Radiat. Transf. 2020, 246, 106931. [Google Scholar] [CrossRef]
- Li, L.; Che, H.; Derimian, Y.; Dubovik, O.; Luan, Q.; Li, Q.; Huang, X.; Zhao, H.; Gui, K.; Zheng, Y.; et al. Climatology of Fine and Coarse Mode Aerosol Optical Thickness Over East and South Asia Derived From POLDER/PARASOL Satellite. J. Geophys. Res.-Atmos. 2020, 125, e2020JD032665. [Google Scholar] [CrossRef]
- Jia, H.; Ma, X.; Yu, F.; Quaas, J. Significant underestimation of radiative forcing by aerosol–cloud interactions derived from satellite-based methods. Nat. Commun. 2021, 12, 3649. [Google Scholar] [CrossRef]
- Lyapustin, A.; Wang, Y.; Choi, M.; Xiong, X.; Angal, A.; Wu, A.; Doelling, D.R.; Bhatt, R.; Go, S.; Korkin, S.; et al. Calibration of the SNPP and NOAA 20 VIIRS sensors for continuity of the MODIS climate data records. Remote Sens. Environ. 2023, 295, 113717. [Google Scholar] [CrossRef]
- Román, M.O.; Justice, C.; Paynter, I.; Boucher, P.B.; Devadiga, S.; Endsley, A.; Erb, A.; Friedl, M.; Gao, H.; Giglio, L.; et al. Continuity between NASA MODIS Collection 6.1 and VIIRS Collection 2 land products. Remote Sens. Environ. 2024, 302, 113963. [Google Scholar] [CrossRef]
- Fougnie, B. Improvement of the PARASOL Radiometric In-Flight Calibration Based on Synergy Between Various Methods Using Natural Targets. IEEE Trans. Geosci. Remote Sens. 2016, 54, 2140–2152. [Google Scholar] [CrossRef]
- Su, X.; Wei, Y.; Wang, L.; Zhang, M.; Jiang, D.; Feng, L. Accuracy, stability, and continuity of AVHRR, SeaWiFS, MODIS, and VIIRS deep blue long-term land aerosol retrieval in Asia. Sci. Total Environ. 2022, 832, 155048. [Google Scholar] [CrossRef] [PubMed]
- Sayer, A.M.; Hsu, N.C.; Lee, J.; Kim, W.V.; Dutcher, S.T. Validation, Stability, and Consistency of MODIS Collection 6.1 and VIIRS Version 1 Deep Blue Aerosol Data Over Land. J. Geophys. Res.-Atmos. 2019, 124, 4658–4688. [Google Scholar] [CrossRef]
- Huang, G.; Su, X.; Wang, L.; Wang, Y.; Cao, M.; Wang, L.; Ma, X.; Zhao, Y.; Yang, L. Evaluation and analysis of long-term MODIS MAIAC aerosol products in China. Sci. Total Environ. 2024, 948, 174983. [Google Scholar] [CrossRef]
- Deschamps, P.; Bréon, F.; Leroy, M.; Podaire, A.; Bricaud, A.; Buriez, J.; Seze, G. The POLDER mission: Instrument characteristics and scientific objectives. IEEE Trans. Geosci. Remote Sens. 2002, 32, 598–615. [Google Scholar] [CrossRef]
- Dubovik, O.; Fuertes, D.; Litvinov, P.; Lopatin, A.; Lapyonok, T.; Doubovik, I.; Xu, F.; Ducos, F.; Chen, C.; Torres, B. A Comprehensive Description of Multi-term LSM for applying multiple a priori constraints in problems of atmospheric remote sensing: GRASP algorithm, concept, and applications. Front. Remote Sens. 2021, 2, 706851. [Google Scholar] [CrossRef]
- Dubovik, O.; Herman, M.; Holdak, A.; Lapyonok, T.; Tanré, D.; Deuzé, J.L.; Ducos, F.; Sinyuk, A.; Lopatin, A. Statistically optimized inversion algorithm for enhanced retrieval of aerosol properties from spectral multi-angle polarimetric satellite observations. Atmos. Meas. Tech. 2011, 4, 975–1018. [Google Scholar] [CrossRef]
- Sinyuk, A.; Holben, B.N.; Eck, T.F.; Giles, D.M.; Slutsker, I.; Korkin, S.; Schafer, J.S.; Smirnov, A.; Sorokin, M.; Lyapustin, A. The AERONET Version 3 aerosol retrieval algorithm, associated uncertainties and comparisons to Version 2. Atmos. Meas. Tech. 2020, 13, 3375–3411. [Google Scholar] [CrossRef]
- Giles, D.M.; Sinyuk, A.; Sorokin, M.G.; Schafer, J.S.; Smirnov, A.; Slutsker, I.; Eck, T.F.; Holben, B.N.; Lewis, J.R.; Campbell, J.R.; et al. Advancements in the Aerosol Robotic Network (AERONET) Version 3 database—Automated near-real-time quality control algorithm with improved cloud screening for Sun photometer aerosol optical depth (AOD) measurements. Atmos. Meas. Tech. 2019, 12, 169–209. [Google Scholar] [CrossRef]
- Holben, B.N.; Eck, T.F.; Slutsker, I.; Smirnov, A.; Sinyuk, A.; Schafer, J.; Giles, D.; Dubovik, O. AERONET’s Version 2.0 quality assurance criteria. In Remote Sensing of the Atmosphere and Clouds; SPIE: Bellingham, WA, USA, 2006; Volume 6408, pp. 134–147. [Google Scholar]
- Wagner, F.; Silva, A.M. Some considerations about Ångström exponent distributions. Atmos. Chem. Phys. 2008, 8, 481–489. [Google Scholar] [CrossRef]
- Ichoku, C.; Chu, D.A.; Mattoo, S.; Kaufman, Y.J.; Remer, L.A.; Tanré, D.; Slutsker, I.; Holben, B.N. A spatio-temporal approach for global validation and analysis of MODIS aerosol products. Geophys. Res. Lett. 2002, 29, MOD1-1–MOD1-4. [Google Scholar] [CrossRef]
- Levy, R.C.; Remer, L.A.; Kleidman, R.G.; Mattoo, S.; Ichoku, C.; Kahn, R.; Eck, T.F. Global evaluation of the Collection 5 MODIS dark-target aerosol products over land. Atmos. Chem. Phys. 2010, 10, 10399–10420. [Google Scholar] [CrossRef]
- Sawyer, V.; Levy, R.C.; Mattoo, S.; Cureton, G.; Shi, Y.; Remer, L.A. Continuing the MODIS Dark Target Aerosol Time Series with VIIRS. Remote Sens. 2020, 12, 308. [Google Scholar] [CrossRef]
- Popp, T.; De Leeuw, G.; Bingen, C.; Brühl, C.; Capelle, V.; Chedin, A.; Clarisse, L.; Dubovik, O.; Grainger, R.; Griesfeller, J. Development, production and evaluation of aerosol climate data records from European satellite observations (Aerosol_cci). Remote Sens. 2016, 8, 421. [Google Scholar] [CrossRef]
- Hsu, N.C.; Jeong, M.J.; Bettenhausen, C.; Sayer, A.M.; Hansell, R.; Seftor, C.S.; Huang, J.; Tsay, S.C. Enhanced Deep Blue aerosol retrieval algorithm: The second generation. J. Geophys. Res.-Atmos. 2013, 118, 9296–9315. [Google Scholar] [CrossRef]
- GCOS. Systematic Observation Requirements for Satellite-Based Products for Climate. 2011 Update Supplemetnatl Details to the Satellite 39 Based Component Og the Implementation Plan for the Global Observing System for Climate in Support of the UNFCCC (2010 Update); World Meteorological Organisation: Geneva, Switzerland, 2011. [Google Scholar]
- Wang, L.; Su, X.; Wang, Y.; Cao, M.; Lang, Q.; Li, H.; Sun, J.; Zhang, M.; Qin, W.; Li, L.; et al. Towards long-term, high-accuracy, and continuous satellite total and fine-mode aerosol records: Enhanced Land General Aerosol (e-LaGA) retrieval algorithm for VIIRS. ISPRS-J. Photogramm. Remote Sens. 2024, 214, 261–281. [Google Scholar] [CrossRef]
- Su, X.; Huang, G.; Wang, L.; Wei, Y.; Ma, X.; Wang, L.; Feng, L. Validation and Comparison of Long-Term Accuracy and Stability of Global Reanalysis and Satellite Retrieval AOD. Remote Sens. 2024, 16, 3304. [Google Scholar] [CrossRef]
- Feng, L.; Su, X.; Wang, L.; Jiang, T.; Zhang, M.; Wu, J.; Qin, W.; Chen, Y. Accuracy and error cause analysis, and recommendations for usage of Himawari-8 aerosol products over Asia and Oceania. Sci. Total Environ. 2021, 796, 148958. [Google Scholar] [CrossRef]
- Sayer, A.M.; Hsu, N.C.; Lee, J.; Kim, W.V.; Dubovik, O.; Dutcher, S.T.; Huang, D.; Litvinov, P.; Lyapustin, A.; Tackett, J.L.; et al. Validation of SOAR VIIRS Over-Water Aerosol Retrievals and Context Within the Global Satellite Aerosol Data Record. J. Geophys. Res.-Atmos. 2018, 123, 13496–13526. [Google Scholar] [CrossRef]








| Product | Slope | Standard Deviation | Mean |
|---|---|---|---|
| Components AOD | 0.039 | 0.030 | 0.035 |
| HP AOD | 0.039 | 0.029 | 0.034 |
| Models AOD | 0.042 | 0.030 | 0.036 |
| Product | Slope | Standard Deviation | Mean |
|---|---|---|---|
| Components AE | 0.019 | 0.036 | 0.028 |
| HP AE | −0.017 | 0.066 | 0.042 |
| Models AE | −0.067 | 0.087 | 0.077 |
| Region | Product (AOD) | Number | R | RMSE | BIAS | MAE | RMB | =EE DT | =EE DB | =GCOS |
|---|---|---|---|---|---|---|---|---|---|---|
| CSA | Components | 3566 | 0.959 | 0.104 | −0.007 | 0.059 | 0.964 | 77.5% | 80.0% | 50.1% |
| HP | 3580 | 0.945 | 0.165 | 0.061 | 0.092 | 1.334 | 58.8% | 62.3% | 30.9% | |
| Models | 3295 | 0.951 | 0.175 | 0.019 | 0.073 | 1.098 | 75.2% | 78.5% | 46.6% | |
| ENA | Components | 5884 | 0.735 | 0.096 | 0.024 | 0.054 | 1.205 | 76.9% | 79.6% | 49.7% |
| HP | 5287 | 0.665 | 0.174 | 0.119 | 0.126 | 2.028 | 33.3% | 35.9% | 15.4% | |
| Models | 5659 | 0.772 | 0.105 | 0.042 | 0.062 | 1.355 | 71.5% | 73.9% | 43.6% | |
| EUR | Components | 15,300 | 0.818 | 0.078 | −0.003 | 0.049 | 0.982 | 82.2% | 85.6% | 48.4% |
| HP | 15,297 | 0.787 | 0.106 | 0.052 | 0.072 | 1.334 | 63.9% | 67.6% | 32.9% | |
| Models | 14,269 | 0.817 | 0.089 | 0.010 | 0.052 | 1.065 | 80.8% | 83.9% | 46.8% | |
| IND | Components | 2063 | 0.867 | 0.170 | −0.080 | 0.117 | 0.836 | 63.2% | 71.3% | 27.8% |
| HP | 2037 | 0.844 | 0.168 | 0.000 | 0.110 | 1.001 | 67.3% | 75.9% | 31.3% | |
| Models | 2016 | 0.821 | 0.815 | −0.053 | 0.118 | 0.892 | 66.4% | 73.3% | 31.2% | |
| NAME | Components | 11,006 | 0.914 | 0.118 | −0.032 | 0.076 | 0.885 | 71.3% | 77.0% | 36.6% |
| HP | 10,817 | 0.862 | 0.165 | 0.059 | 0.106 | 1.211 | 58.2% | 63.0% | 27.5% | |
| Models | 10,357 | 0.871 | 0.151 | −0.020 | 0.082 | 0.930 | 70.7% | 75.9% | 37.1% | |
| NEA | Components | 4714 | 0.919 | 0.209 | −0.035 | 0.112 | 0.918 | 70.4% | 76.1% | 38.6% |
| HP | 4686 | 0.911 | 0.240 | 0.124 | 0.177 | 1.288 | 34.7% | 39.4% | 15.8% | |
| Models | 4627 | 0.909 | 0.222 | 0.026 | 0.112 | 1.060 | 71.0% | 75.9% | 38.2% | |
| OCE | Components | 1644 | 0.835 | 0.051 | 0.007 | 0.034 | 1.096 | 86.5% | 88.2% | 60.2% |
| HP | 1605 | 0.740 | 0.065 | 0.023 | 0.044 | 1.324 | 76.4% | 77.9% | 47.9% | |
| Models | 1457 | 0.841 | 0.060 | 0.008 | 0.038 | 1.118 | 84.5% | 86.0% | 57.3% | |
| SA | Components | 840 | 0.807 | 0.076 | −0.015 | 0.049 | 0.907 | 85.0% | 88.0% | 46.3% |
| HP | 715 | 0.690 | 0.118 | 0.045 | 0.071 | 1.250 | 71.5% | 74.4% | 41.8% | |
| Models | 821 | 0.799 | 0.084 | 0.006 | 0.050 | 1.034 | 82.8% | 85.5% | 50.3% | |
| SEA | Components | 1328 | 0.886 | 0.153 | −0.025 | 0.094 | 0.933 | 69.1% | 74.9% | 38.0% |
| HP | 1204 | 0.855 | 0.219 | 0.122 | 0.156 | 1.319 | 43.3% | 49.8% | 16.9% | |
| Models | 1196 | 0.890 | 0.151 | 0.006 | 0.090 | 1.015 | 71.5% | 77.3% | 39.5% | |
| WNA | Components | 6139 | 0.692 | 0.076 | 0.006 | 0.039 | 1.077 | 85.2% | 87.1% | 58.4% |
| HP | 6197 | 0.690 | 0.110 | 0.067 | 0.076 | 1.804 | 53.7% | 55.5% | 29.9% | |
| Models | 5583 | 0.736 | 0.084 | 0.011 | 0.043 | 1.123 | 82.8% | 85.0% | 54.0% |
| Region | Product (AE) | Number | R | RMSE | BIAS | MAE | RMB | =EE AE |
|---|---|---|---|---|---|---|---|---|
| CSA | Components | 800 | 0.812 | 0.361 | −0.126 | 0.276 | 0.906 | 77.0% |
| HP | 788 | 0.840 | 0.437 | −0.303 | 0.348 | 0.776 | 62.6% | |
| Models | 727 | 0.695 | 0.511 | −0.304 | 0.450 | 0.780 | 44.0% | |
| ENA | Components | 777 | 0.533 | 0.451 | −0.153 | 0.349 | 0.902 | 65.3% |
| HP | 683 | 0.487 | 0.631 | −0.476 | 0.539 | 0.696 | 36.9% | |
| Models | 756 | 0.338 | 0.699 | −0.531 | 0.608 | 0.662 | 30.4% | |
| EUR | Components | 3883 | 0.699 | 0.356 | −0.085 | 0.262 | 0.938 | 78.1% |
| HP | 3896 | 0.703 | 0.436 | −0.286 | 0.345 | 0.791 | 66.4% | |
| Models | 3799 | 0.594 | 0.543 | −0.397 | 0.451 | 0.709 | 48.4% | |
| IND | Components | 1850 | 0.868 | 0.240 | 0.084 | 0.182 | 1.096 | 90.3% |
| HP | 1836 | 0.817 | 0.260 | −0.032 | 0.199 | 0.963 | 88.8% | |
| Models | 1829 | 0.634 | 0.336 | 0.009 | 0.261 | 1.010 | 79.7% | |
| NAME | Components | 5316 | 0.785 | 0.311 | 0.156 | 0.252 | 1.337 | 80.9% |
| HP | 5237 | 0.820 | 0.234 | 0.007 | 0.175 | 1.015 | 91.8% | |
| Models | 5193 | 0.566 | 0.442 | 0.277 | 0.351 | 1.597 | 69.0% | |
| NEA | Components | 2799 | 0.772 | 0.268 | 0.024 | 0.203 | 1.022 | 89.0% |
| HP | 683 | 0.487 | 0.631 | −0.476 | 0.539 | 0.696 | 80.0% | |
| Models | 2740 | 0.664 | 0.334 | −0.163 | 0.265 | 0.853 | 79.9% | |
| OCE | Components | 107 | 0.777 | 0.358 | 0.081 | 0.281 | 1.059 | 73.8% |
| HP | 99 | 0.760 | 0.400 | 0.131 | 0.307 | 1.097 | 77.8% | |
| Models | 104 | 0.686 | 0.408 | −0.162 | 0.326 | 0.880 | 67.3% | |
| SA | Components | 250 | 0.705 | 0.438 | 0.167 | 0.331 | 1.165 | 68.4% |
| HP | 250 | 0.865 | 0.300 | −0.094 | 0.214 | 0.908 | 85.6% | |
| Models | 253 | 0.766 | 0.364 | −0.060 | 0.278 | 0.942 | 78.3% | |
| SEA | Components | 843 | 0.607 | 0.277 | −0.073 | 0.204 | 0.949 | 86.5% |
| HP | 805 | 0.649 | 0.413 | −0.324 | 0.337 | 0.773 | 65.8% | |
| Models | 772 | 0.579 | 0.443 | −0.362 | 0.387 | 0.749 | 56.5% | |
| WNA | Components | 364 | 0.722 | 0.376 | −0.088 | 0.279 | 0.942 | 77.2% |
| HP | 393 | 0.820 | 0.431 | −0.299 | 0.352 | 0.798 | 63.9% | |
| Models | 383 | 0.594 | 0.586 | −0.412 | 0.503 | 0.726 | 37.3% |
| Region | Product | Slope | Standard Deviation | Mean |
|---|---|---|---|---|
| CSA | Components | 0.018 | 0.030 | 0.024 |
| HP | −0.042 | 0.067 | 0.055 | |
| Models | −0.053 | 0.067 | 0.060 | |
| ENA | Components | 0.038 | 0.028 | 0.033 |
| HP | 0.034 | 0.030 | 0.032 | |
| Models | 0.032 | 0.023 | 0.028 | |
| EUR | Components | 0.046 | 0.034 | 0.040 |
| HP | 0.021 | 0.023 | 0.022 | |
| Models | 0.053 | 0.036 | 0.045 | |
| IND | Components | 0.106 | 0.079 | 0.093 |
| HP | 0.101 | 0.084 | 0.093 | |
| Models | 0.129 | 0.091 | 0.110 | |
| NAME | Components | 0.059 | 0.048 | 0.054 |
| HP | 0.080 | 0.067 | 0.074 | |
| Models | 0.068 | 0.052 | 0.060 | |
| NEA | Components | 0.005 | 0.031 | 0.018 |
| HP | 0.023 | 0.024 | 0.024 | |
| Models | 0.019 | 0.021 | 0.020 | |
| OCE | Components | 0.015 | 0.019 | 0.017 |
| HP | 0.002 | 0.029 | 0.016 | |
| Models | 0.026 | 0.024 | 0.025 | |
| SA | Components | 0.011 | 0.032 | 0.022 |
| HP | 0.064 | 0.048 | 0.056 | |
| Models | −0.001 | 0.036 | 0.019 | |
| SEA | Components | 0.062 | 0.053 | 0.058 |
| HP | −0.036 | 0.065 | 0.051 | |
| Models | 0.072 | 0.061 | 0.067 | |
| WNA | Components | 0.041 | 0.028 | 0.035 |
| HP | 0.043 | 0.031 | 0.037 | |
| Models | 0.042 | 0.030 | 0.036 |
| Region | Product | Slope | Standard Deviation | Mean |
|---|---|---|---|---|
| CSA | Components | 0.231 | 0.227 | 0.229 |
| HP | 0.146 | 0.202 | 0.174 | |
| Models | 0.328 | 0.241 | 0.285 | |
| ENA | Components | 0.066 | 0.109 | 0.088 |
| HP | −0.008 | 0.149 | 0.079 | |
| Models | −0.059 | 0.134 | 0.097 | |
| EUR | Components | −0.054 | 0.112 | 0.083 |
| HP | −0.066 | 0.153 | 0.110 | |
| Models | −0.167 | 0.157 | 0.162 | |
| IND | Components | −0.034 | 0.068 | 0.051 |
| HP | −0.148 | 0.134 | 0.141 | |
| Models | −0.199 | 0.173 | 0.186 | |
| NAME | Components | 0.095 | 0.070 | 0.083 |
| HP | 0.066 | 0.072 | 0.069 | |
| Models | −0.020 | 0.086 | 0.053 | |
| NEA | Components | −0.073 | 0.069 | 0.071 |
| HP | −0.118 | 0.112 | 0.115 | |
| Models | −0.046 | 0.073 | 0.060 | |
| OCE | Components | −0.310 | 0.539 | 0.425 |
| HP | −0.512 | 0.961 | 0.737 | |
| Models | −0.583 | 0.421 | 0.502 | |
| SA | Components | 0.346 | 0.327 | 0.337 |
| HP | 0.068 | 0.176 | 0.122 | |
| Models | 0.542 | 0.393 | 0.468 | |
| SEA | Components | −0.055 | 0.059 | 0.057 |
| HP | −0.253 | 0.248 | 0.251 | |
| Models | 0.000 | 0.101 | 0.051 | |
| WNA | Components | −0.231 | 0.218 | 0.225 |
| HP | −0.102 | 0.200 | 0.151 | |
| Models | −0.251 | 0.262 | 0.257 |
Disclaimer/Publisher’s Note: The statements, opinions and data contained in all publications are solely those of the individual author(s) and contributor(s) and not of MDPI and/or the editor(s). MDPI and/or the editor(s) disclaim responsibility for any injury to people or property resulting from any ideas, methods, instructions or products referred to in the content. |
© 2026 by the authors. Licensee MDPI, Basel, Switzerland. This article is an open access article distributed under the terms and conditions of the Creative Commons Attribution (CC BY) license.
Share and Cite
Ma, X.; Su, X.; Li, Y.; Yang, Y. Global Accuracy, Stability, and Consistency Assessment and Usage Recommendations of POLDER/PARASOL GRASP Aerosol Products. Remote Sens. 2026, 18, 1633. https://doi.org/10.3390/rs18101633
Ma X, Su X, Li Y, Yang Y. Global Accuracy, Stability, and Consistency Assessment and Usage Recommendations of POLDER/PARASOL GRASP Aerosol Products. Remote Sensing. 2026; 18(10):1633. https://doi.org/10.3390/rs18101633
Chicago/Turabian StyleMa, Xiaoyu, Xin Su, Yingshuang Li, and Yihong Yang. 2026. "Global Accuracy, Stability, and Consistency Assessment and Usage Recommendations of POLDER/PARASOL GRASP Aerosol Products" Remote Sensing 18, no. 10: 1633. https://doi.org/10.3390/rs18101633
APA StyleMa, X., Su, X., Li, Y., & Yang, Y. (2026). Global Accuracy, Stability, and Consistency Assessment and Usage Recommendations of POLDER/PARASOL GRASP Aerosol Products. Remote Sensing, 18(10), 1633. https://doi.org/10.3390/rs18101633