Article

TriFusion-CD: Tri-Source Fusion for Robust Remote Sensing Change Detection Under Pseudo-Change Interference


School of Computer Science and Engineering, North Minzu University, Yinchuan 750021, China
*
Author to whom correspondence should be addressed.
Remote Sens. 2026, 18(10), 1572; https://doi.org/10.3390/rs18101572
Submission received: 26 March 2026 / Revised: 5 May 2026 / Accepted: 11 May 2026 / Published: 14 May 2026

Highlights

What are the main findings?
  • We propose TriFusion-CD, a tri-branch remote sensing change detection framework that integrates global semantic guidance from MobileSAM, detail-sensitive change features from CLIP-RN50, and a frequency–text structural–semantic prior to improve robustness against appearance-induced pseudo-changes.
  • Extensive experiments on SYSU-CD, JL1-CD, and CDD show that TriFusion-CD achieves the best IoU/F1 results among the compared methods, while also yielding stronger boundary alignment and more spatially coherent change regions.
What are the implications of the main findings?
  • The results indicate that integrating foundation-model semantics with frequency-derived structural information is an effective strategy for suppressing pseudo-changes and improving reliable change localization in complex high-resolution remote sensing scenes.
  • The proposed attention-guided fusion and decoding design provides a practical framework for producing more complete and less fragmented change masks, with potential value for real-world remote sensing monitoring tasks under challenging imaging variations.

Abstract

Remote sensing change detection (RSCD) is often disturbed by nuisance appearance variations, which can introduce pseudo-changes and degrade the reliability of predicted change masks. Robust change localization therefore requires that such spurious responses be suppressed while the structural integrity of change regions in complex, high-resolution scenes is maintained. We propose TriFusion-CD, a tri-branch framework that fuses complementary sources of information for reliable change localization. The first branch uses MobileSAM to provide global semantic guidance that promotes spatially coherent predictions. The second branch adopts the CLIP-ResNet50 image encoder with a change-aware enhancement module to extract detail-sensitive change features. The third branch performs frequency decomposition and interacts frequency features with CLIP text embeddings via cross-attention, producing a structural–semantic prior to suppress appearance-induced pseudo-changes. We further design a Semantic Attention Fusion Module (SAFM) to inject MobileSAM semantics into CLIP change features through cross-attention with learnable residual scaling. In addition, an Attention-Modulated Decoder (AMD) translates the fused guidance into multi-scale attention maps and performs progressive top-down refinement, extracting more spatially complete change regions. On the challenging SYSU-CD, JL1-CD, and CDD datasets, which exhibit diverse change patterns and frequent appearance-induced pseudo-changes, TriFusion-CD achieves 72.48% IoU/84.04% F1 on SYSU-CD, 66.04% IoU/79.54% F1 on JL1-CD, and 96.41% IoU/98.17% F1 on CDD, demonstrating strong performance.

1. Introduction

Remote sensing change detection (RSCD) aims to identify changes within the same geographical area by comparing multiple images acquired at different time intervals [1]. RSCD techniques have been widely applied across diverse fields, including natural resource mapping, ecological environment assessment, urban expansion monitoring, and disaster relief management. With the intensification of human activities and the increasing demand for refined territorial governance, RSCD has also emerged as an important technical means for identifying human-induced land-surface disturbances and supporting regulatory oversight. Typical applications include detecting unauthorized construction, monitoring illegal land excavation activities, and identifying illegal garbage dumping, where timely and accurate change information is essential for effective supervision and subsequent intervention [2].
Despite its broad applicability, RSCD remains challenging in practice due to the complex and heterogeneous imaging conditions of remote sensing scenarios [3]. Apparent differences between bi-temporal images may arise not only from real land-cover changes but also from nuisance factors such as seasonal phenology [4], illumination variation [5], atmospheric conditions [6], sensor differences [7], and viewpoint changes [8]. These factors often introduce “pseudo-changes” that can significantly distort the inferred change map. Moreover, high-resolution remote sensing imagery contains abundant fine structures, which requires change detection models to maintain accurate boundary localization while preserving global contextual consistency.
Before the prevalence of deep learning, remote sensing change detection was predominantly addressed using handcrafted features derived from complex feature extractors. However, the limited expressiveness of such traditional features substantially degrades change detection accuracy and makes them susceptible to variations in acquisition and environmental conditions, including seasonal changes, illumination conditions, satellite sensors, and solar altitude angle [9]. In contrast, deep learning-based methods exhibit strong feature extraction capability along with high accuracy and robustness, and have therefore become the leading choice for remote sensing change detection today [10]. Encoder–decoder frameworks are widely adopted in CNN-based deep learning change detection (DLCD) due to their ability to identify changed areas effectively and efficiently in an end-to-end manner. However, their performance is often constrained by the limited receptive fields (RFs) of convolutional operations, which can lead to suboptimal change detection results [11]. This limitation can be alleviated by Transformer architectures that excel at global context modeling, albeit with substantial computational overhead. To balance accuracy and efficiency, many recent DLCD approaches integrate CNNs with Transformers, leveraging local feature extraction alongside long-range dependency modeling [12,13]. In contrast, a more elegant and rigorous alternative is to employ Mamba architectures, which provide strengthened global information modeling with reduced computational complexity and improved scalability relative to Transformer-based designs [2,14].
More recently, visual foundation models (VFMs) such as CLIP and the Segment Anything Model (SAM) have attracted increasing attention due to their transferability enabled by web-scale pretraining. Foundation models (FMs) can facilitate cross-domain knowledge reuse and reduce dependence on large task-specific datasets [15], which is particularly appealing for RSCD, for which dense annotations are expensive and scarce. However, most VFMs are pretrained on natural-image corpora and may exhibit non-negligible domain biases when transferred to remote sensing imagery (RSIs) [16]. Recently, RS-specific foundation models (FMs) have been developed to better accommodate the spectral and temporal characteristics of remote sensing imagery (RSIs) [17].

1.1. Related Work

1.1.1. Change Detection Methods Based on Ordinary Deep Learning Networks

With the rapid advancement of deep learning (DL) technology, it has demonstrated substantial potential and wide-ranging application prospects in the field of change detection (CD). Owing to its strong capabilities in feature representation learning and pattern recognition, DL has introduced novel solutions and methodologies for CD. Daudt et al. [18] were the first to incorporate fully convolutional networks into remote sensing change detection (RSCD), proposing three distinct change-detection architectures that employ Siamese-extended fully convolutional networks to process bitemporal inputs. From the perspective of multi-scale fusion, IFN [19] introduces a deeply supervised image fusion framework that integrates raw-image deep features and difference features via attention-guided feature aggregation, thereby improving boundary preservation and reducing fusion inconsistency. Transformer-based CD architectures have been explored for their potential to better capture long-range spatiotemporal dependencies that pose a challenge for standard convolutions. BiT [11] compresses bitemporal features into a compact set of semantic tokens and performs context modeling in token space for accurate change detection. ChangeFormer [20] further unifies a hierarchically structured Transformer encoder with a Multi-Layer Perception (MLP) decoder within a Siamese network architecture, enabling efficient rendering of the multi-scale, long-range details required for accurate CD.
Although CNN-based and Transformer-based methods have achieved strong performance, convolutional neural network architectures suffer from an inherent limitation: their restricted receptive fields make it difficult to capture long-range dependencies among pixels [21]. However, the computational complexity of applying Transformers to image processing scales quadratically with the number of image patches [22,23]. ChangeMamba [14] pioneers the introduction of Mamba into remote sensing CD and designs task-specific mechanisms to model spatiotemporal relationships for multiple CD settings. To address the tendency of Mamba-based models to overlook fine local details in dense prediction, CDMamba [24] further integrates global and local information through dedicated modules, improving fine-grained change delineation. Nevertheless, most “ordinary” deep learning CD methods are still predominantly optimized by fitting task-specific models on limited annotated datasets, which places substantial demands on feature extraction robustness [25].

1.1.2. Change Detection Methods Based on Visual Foundation Models

Recently, visual foundation models (VFMs) such as CLIP [26] and the Segment Anything Model (SAM) [27] have attracted considerable research attention. Pretrained on web-scale datasets, these models aim to learn universal feature representations with strong transferability across diverse downstream tasks. However, because most VFMs are primarily trained on natural-image corpora, they can exhibit non-negligible domain biases when applied to remote sensing (RS) scenarios [28]. To better accommodate the spectral and temporal characteristics of remote sensing imagery (RSIs), several RS-specific foundation models (FMs) have been developed, including a geospatial FM [29], SpectralGPT [30], and SkySense [31]. These FMs facilitate training-free feature embedding for multispectral, multitemporal, and multimodal RS data, thereby supporting a range of downstream applications, including change detection (CD). Nonetheless, as these FMs are typically pretrained to capture context intrinsic to RSIs rather than the application-specific context of CD, their direct use for CD remains insufficient. Consequently, effective deployment in CD still generally requires integrating CD-specific modules and conducting fully supervised fine-tuning [17].
FMs enable cross-domain knowledge transfer and sharing, thereby reducing the reliance on task-specific training data [32,33]. Building on this capability, several studies have attempted to fine-tune or adapt foundation models for downstream tasks involving natural images and have reported encouraging results [34,35,36,37]. In this context, BAN proposes a universal framework—bi-temporal adapter networks (BANs)—for tuning and adapting foundation models to the change detection (CD) task. By bridging and integrating a foundation model with customized CD-specific models or modules, BAN can substantially enhance the performance of existing CD models while introducing only a small number of additional learnable parameters [38]. Similarly, ChangeCLIP introduces a multimodal framework, termed ChangeCLIP, for change detection in remote sensing imagery by leveraging multimodal vision–language information [39]. In parallel, SAM-CD seeks to exploit the strong and general semantic extraction capability of SAM to improve CD accuracy and to mitigate dependence on large-scale training samples [40].
Nevertheless, the use of MobileSAM and CLIP-RN50 in remote sensing change detection still requires careful consideration. Although MobileSAM is more lightweight than the original SAM, its segmentation quality may degrade in complex remote sensing scenes with small objects, weak boundaries, dense spatial structures, or cluttered backgrounds. Moreover, introducing an additional semantic encoder may still increase computational cost, which limits its applicability to latency-sensitive or edge-device scenarios. Fully fine-tuning such a pre-trained model on limited change detection annotations may also increase the risk of overfitting. In this study, MobileSAM is therefore not used as an independent mask generator. Instead, only its high-level semantic features are adopted as auxiliary guidance and are injected into the CLIP-RN50 change-aware representation through the proposed Semantic Attention Fusion Module with cross-attention and learnable residual scaling. Meanwhile, parameter-efficient adaptation is adopted by freezing most pre-trained parameters and introducing lightweight trainable components, thereby reducing the risk of overfitting.
CLIP-RN50 also has inherent limitations for remote sensing change detection. Since CLIP is mainly pre-trained on natural image–text pairs, its visual representations may suffer from domain bias when transferred to overhead remote sensing imagery. In addition, CLIP-RN50 is not originally designed for bi-temporal change localization, and its extracted features do not explicitly model change-specific discrepancies or boundary-sensitive structures. To mitigate these limitations, we introduce a Change-Aware Enhancement Module to jointly model subtraction-based numerical differences and cosine-similarity-based feature discrepancies between bi-temporal images. Furthermore, the frequency-text branch provides structural-semantic attention guidance, while MobileSAM-derived semantic features complement the CLIP-RN50 branch with high-level semantic context. Therefore, the proposed framework does not directly rely on MobileSAM or CLIP-RN50 as standalone predictors, but integrates them through task-oriented fusion modules for robust remote sensing change detection.
Although recent foundation-model-based change-detection methods have achieved promising progress, most of them mainly focus on a specific aspect of foundation-model utilization, such as CLIP-based vision–language representation learning, general foundation-model adaptation, or SAM-based semantic feature extraction. In contrast, the proposed TriFusion-CD is designed as a problem-oriented tri-source fusion framework for robust remote sensing change detection under pseudo-change interference. Its novelty lies not in simply combining existing foundation models, but in constructing complementary guidance from three different perspectives: detail-sensitive change representations from CLIP-RN50 [26], global semantic guidance from MobileSAM [41], and a frequency–text structural–semantic prior. Specifically, a MobileSAM branch provides high-level semantic guidance to improve spatial coherence, while a CLIP image branch with a change-aware enhancement module extracts detail-sensitive change features from bi-temporal imagery. In parallel, a frequency branch applies octave convolution to decompose multi-level visual features into high-frequency and low-frequency components [42], and then aligns the resulting frequency representation with CLIP text embeddings through cross-modal interaction to form a structural–semantic prior. The semantic guidance from MobileSAM is further injected into the CLIP feature stream through the Semantic Attention Fusion Module, while the frequency–text prior is converted into multi-scale attention maps that guide an Attention-Modulated Decoder for progressive top-down refinement and final mask prediction.
The main contributions of this paper are summarized as follows:
  • We propose TriFusion-CD, a tri-branch remote sensing change detection framework that integrates global semantic guidance from MobileSAM, detail-sensitive visual representations from CLIP-RN50, and a structural–semantic prior derived from frequency–text interaction, thereby providing a unified architecture for robust change localization in remote sensing imagery.
  • We introduce a frequency–text cross-modal interaction mechanism that decomposes multi-level features into low-frequency and high-frequency components and then modulates the resulting frequency representations via cross-attention with CLIP text embeddings, thereby providing a structural–semantic prior to suppress appearance-induced pseudo-changes.
  • We propose a Semantic Attention Fusion Module (SAFM) that adaptively injects high-level semantic context from MobileSAM into the high-level change-aware feature of the CLIP-RN50 branch via cross-attention and learnable residual scaling, thereby enhancing the fused representation for subsequent change localization.
  • We design an Attention-Modulated Decoder (AMD) that performs progressive top-down multi-scale fusion, in which features at each decoding stage are residually gated by the corresponding predicted attention map to emphasize change-relevant regions. The gated features are further refined by Swin Transformer-based decoding blocks, thereby yielding more spatially complete change regions.
  • We introduce a Fragmentation Consistency Score (FCS) that quantifies the consistency between predicted and ground-truth change masks by comparing their numbers of foreground connected components under eight-connectivity. FCS provides an additional perspective for evaluating the spatial coherence and fragmentation characteristics of predicted change regions.

2. Materials and Methods

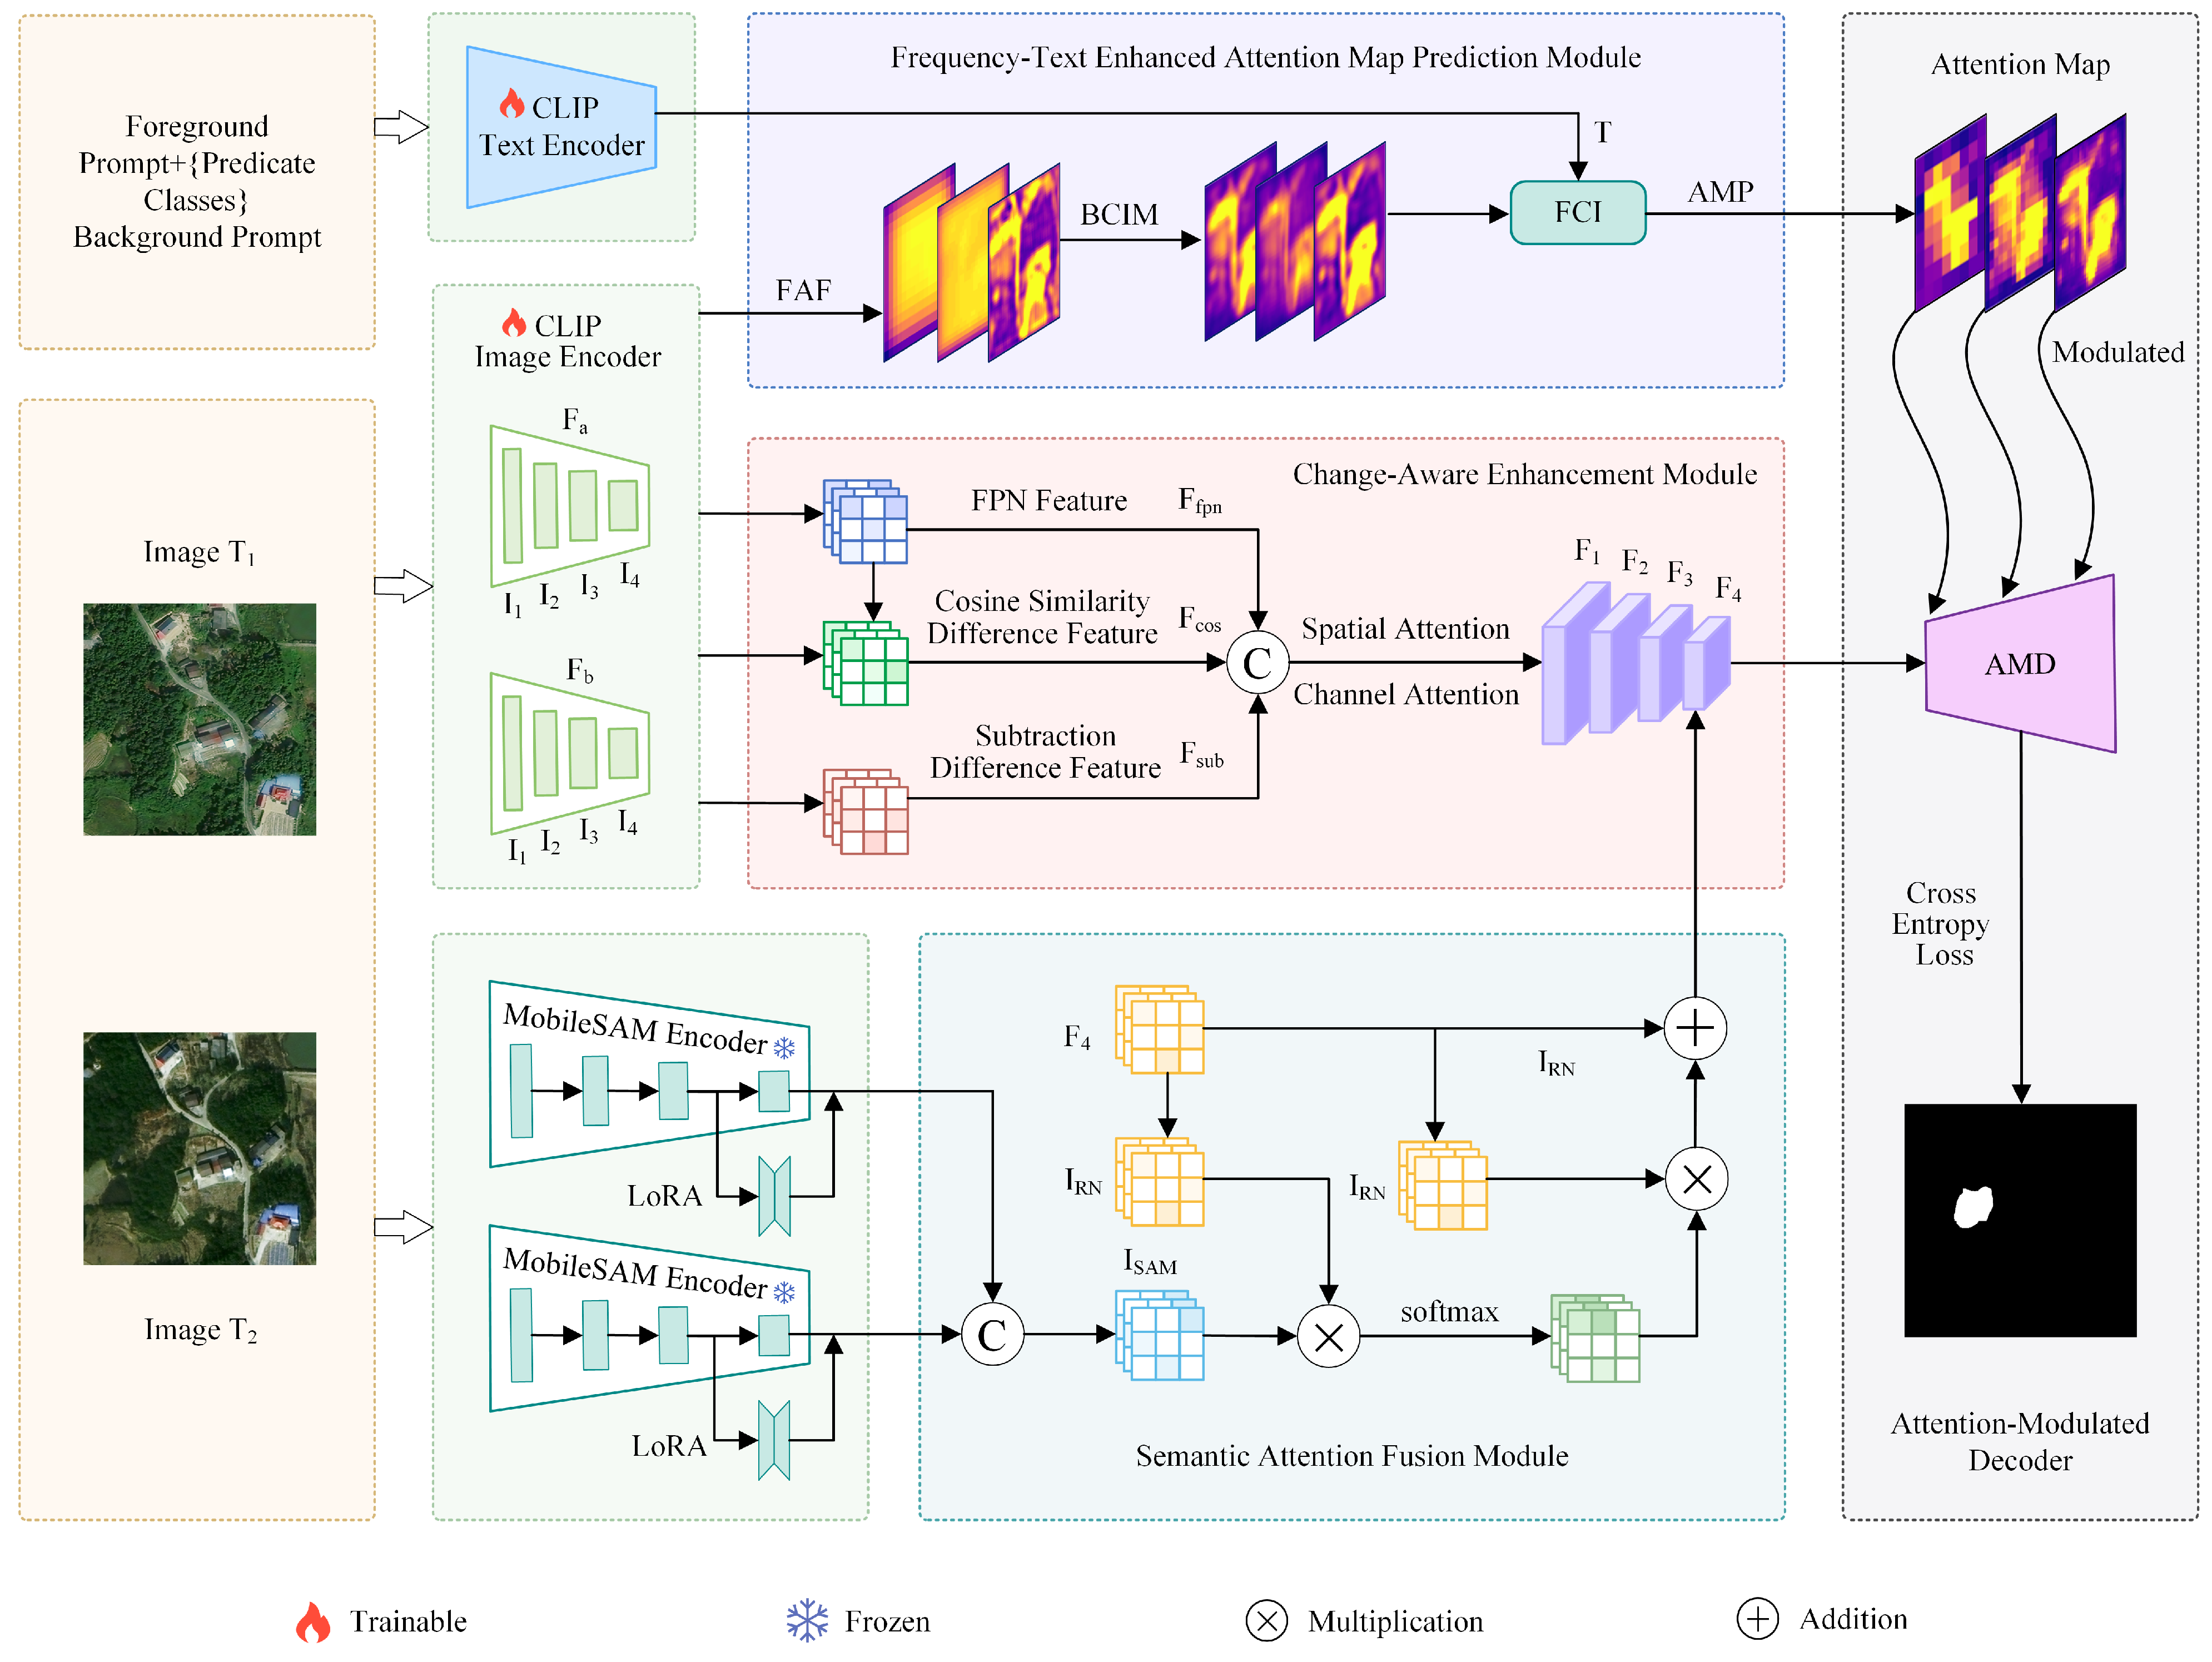
This paper presents a novel change detection (CD) network, termed TriFusion-CD. As shown in Figure 1, the framework consists of three branches that provide complementary guidance for reliable change localization. The first branch leverages MobileSAM to extract robust global semantic features, which helps improve spatial coherence [43,44]. The second branch uses the CLIP image encoder (ResNet50 backbone) together with a change-aware enhancement design to extract detail-sensitive change features. MobileSAM provides global semantic and structural information and can capture broader spatial context via its transformer-based encoder, complementing ResNet50 features that emphasize local details [45,46,47]. The third branch applies octave convolution to split the CLIP-RN50 multi-level feature maps into high-frequency and low-frequency components [42]. These frequency components are then aligned with CLIP text embeddings to form a structural–semantic prior. This prior is further translated into multi-scale attention guidance, which is used to modulate the decoder features during progressive mask prediction. To further clarify the overall computational flow of the proposed framework, Algorithm 1 summarizes the logical workflow of TriFusion-CD.

2.1. MobileSAM Branch

2.1.1. MobileSAM

MobileSAM is a lightweight variant of SAM which has substantially fewer parameters but maintains a comparable performance. To inject domain-specific knowledge efficiently, we adopt LoRA, as shown in Figure 1, which freezes the pre-trained weights and introduces small trainable low-rank matrices into transformer blocks [48]. This strategy reduces the dependence on full fine-tuning and lowers the risk of overfitting. Moreover, since shallow layers in segmentation models typically capture local textures whereas deeper layers encode richer global context [49,50,51], we fine-tune only the last block of the image encoder to obtain more discriminative features for improved object–background discrimination in cluttered scenes.
Algorithm 1 Overall workflow of the proposed TriFusion-CD
Require: 
Bi-temporal remote sensing images X a and X b ; constructed foreground and background prompts P fg and P bg ; ground-truth change mask Y, only used during training.
Ensure: 
Predicted change map M.
       Stage I:
Multi-source Feature Encoding
  1:
Extract multi-level visual features from X a and X b using the CLIP image encoder:
{ I a 1 , I a 2 , I a 3 , I a 4 } = E CLIP ( X a ) , { I b 1 , I b 2 , I b 3 , I b 4 } = E CLIP ( X b ) .
  2:
Extract high-level semantic features from X a and X b using the MobileSAM encoder:
S = E MobileSAM ( X a , X b ) .
  3:
Encode the constructed prompts using the CLIP text encoder:
T = E text ( P fg , P bg ) .
       Stage II:
Multi-source Feature Enhancement and Guidance Construction
  4:
Generate multi-level change-aware features using CAE:
{ F 1 , F 2 , F 3 , F 4 } = CAE { I a l } l = 1 4 , { I b l } l = 1 4 .
  5:
Inject MobileSAM semantic guidance into the high-level CLIP change feature using SAFM:
F 4 s = SAFM ( F 4 , S ) .
  6:
Decompose lower-level CLIP features into frequency-aware representations using FAF:
{ X 1 , X 2 , X 3 } = FAF { I a l , I b l } l = 1 3 .
  7:
Perform bidirectional cross-granularity interaction among frequency features:
F f = BCIM ( X 1 , X 2 , X 3 ) .
  8:
Perform frequency-text cross-modal interaction:
Z = FCI ( F f , T ) .
  9:
Predict multi-scale attention maps:
{ A 1 , A 2 , A 3 } = AMP ( Z ) .
       Stage III:
Attention-guided Mask Prediction
10:
Decode the enhanced change features using AMD:
D 3 = Concat f ( F 4 A 1 + F 4 ) , F 3 ,
D 2 = Concat f ( D 3 A 2 + D 3 ) , F 2 ,
D 1 = Concat f ( D 2 A 3 + D 2 ) , F 1 .
11:
Predict the change logits:
Y ^ = Conv 1 × 1 c l s ( D 1 ) , Y ^ R 2 × H × W .
12:
Generate the final binary change map:
M = Argmax ( Y ^ ) .
13:
During training, optimize the model using the cross-entropy loss between Y ^ and Y.

2.1.2. Semantic Attention Fusion Module (SAFM)

This module leverages the advantages of MobileSAM to enhance ResNet50’s capacity for holistic structural comprehension and semantic content interpretation. As shown in Figure 1, the computational procedure is outlined as follows:
output = γ softmax ( W SAM I SAM I RN T d ) I RN + I RN
Here, I RN represents the high-level feature map F 4 extracted by the Change-Aware Enhancement Module, and I SAM denotes the high-level feature map derived from the MobileSAM encoder. The matrix W SAM denotes a learnable linear projection applied to I SAM to map its channel dimension into the same embedding space as I RN , where d corresponds to the shared channel dimension between I SAM and I RN . A learnable parameter γ is introduced to adaptively integrate the rich global semantic features extracted by the MobileSAM encoder into the features obtained from ResNet50. This design enhances the fused representation by integrating high-level semantic context from the MobileSAM branch with the change-aware feature representation from the CLIP branch.

2.2. CLIP Branch

Change-Aware Enhancement Module (CAE)

Extracting discriminative difference features from bi-temporal RSIs is central to change detection [52]. Many methods construct change representations using direct subtraction or concatenation. However, concatenation mainly merges bi-temporal features, and the model must implicitly learn difference information through backpropagation, which may not sufficiently emphasize change-sensitive information [39]. Although subtraction-based difference representations can capture important change information, they may also introduce pseudo-changes arising from seasonal variations, illumination differences, atmospheric conditions, or viewpoint shifts, and may fail to preserve details present in the original images [53].
To address these issues, as shown in Figure 1, CAE integrates two complementary types of difference information: (1) subtraction-based numerical differences and (2) cosine-similarity-based semantic discrepancies in high-dimensional feature space. This design is developed by adapting the differential features compensation (DFC) strategy in ChangeCLIP [39], which jointly models subtraction-based and cosine-similarity-based discrepancy representations to enhance change-sensitive features. Unlike ChangeCLIP, we further incorporate channel attention (CA) and spatial attention (SA) in the final fusion stage to adaptively aggregate these difference representations [54]. The CAE is defined as:
F sub = σ ( abs ( F a F b ) )
F fpn = FPN ( concat ( F a , F b ) )
φ = x 1 x 2 max ( x 1 2 · x 2 2 , ε ) , x 1 F a , x 2 F b , ε = 1 × 10 8
F cos = F fpn × ϕ ( 1 φ ( F a , F b ) )
F X = SA ( CA ( concat ( F fpn , F sub , F cos ) ) )
Among them, F a and F b are the bi-temporal features extracted by CLIP. σ denotes a convolution block that refines the subtraction features. F sub is the subtraction-based difference map. ϕ denotes the sigmoid function, φ computes cosine similarity, and F cos is the cosine-similarity-based difference map. An FPN integrates multi-level features to produce F fpn . CA and SA denote channel attention and spatial attention, respectively, which adaptively fuse the three difference representations. F X denotes the final fused output feature of the CAE module. By jointly modeling subtraction differences, fused representations, and similarity-based discrepancies, CAE provides more informative change representations. The attention mechanism further adjusts the contribution of each representation according to the salience of changed regions, which strengthens sensitivity to changes and improves overall robustness in RSCD.

2.3. Frequency Branch

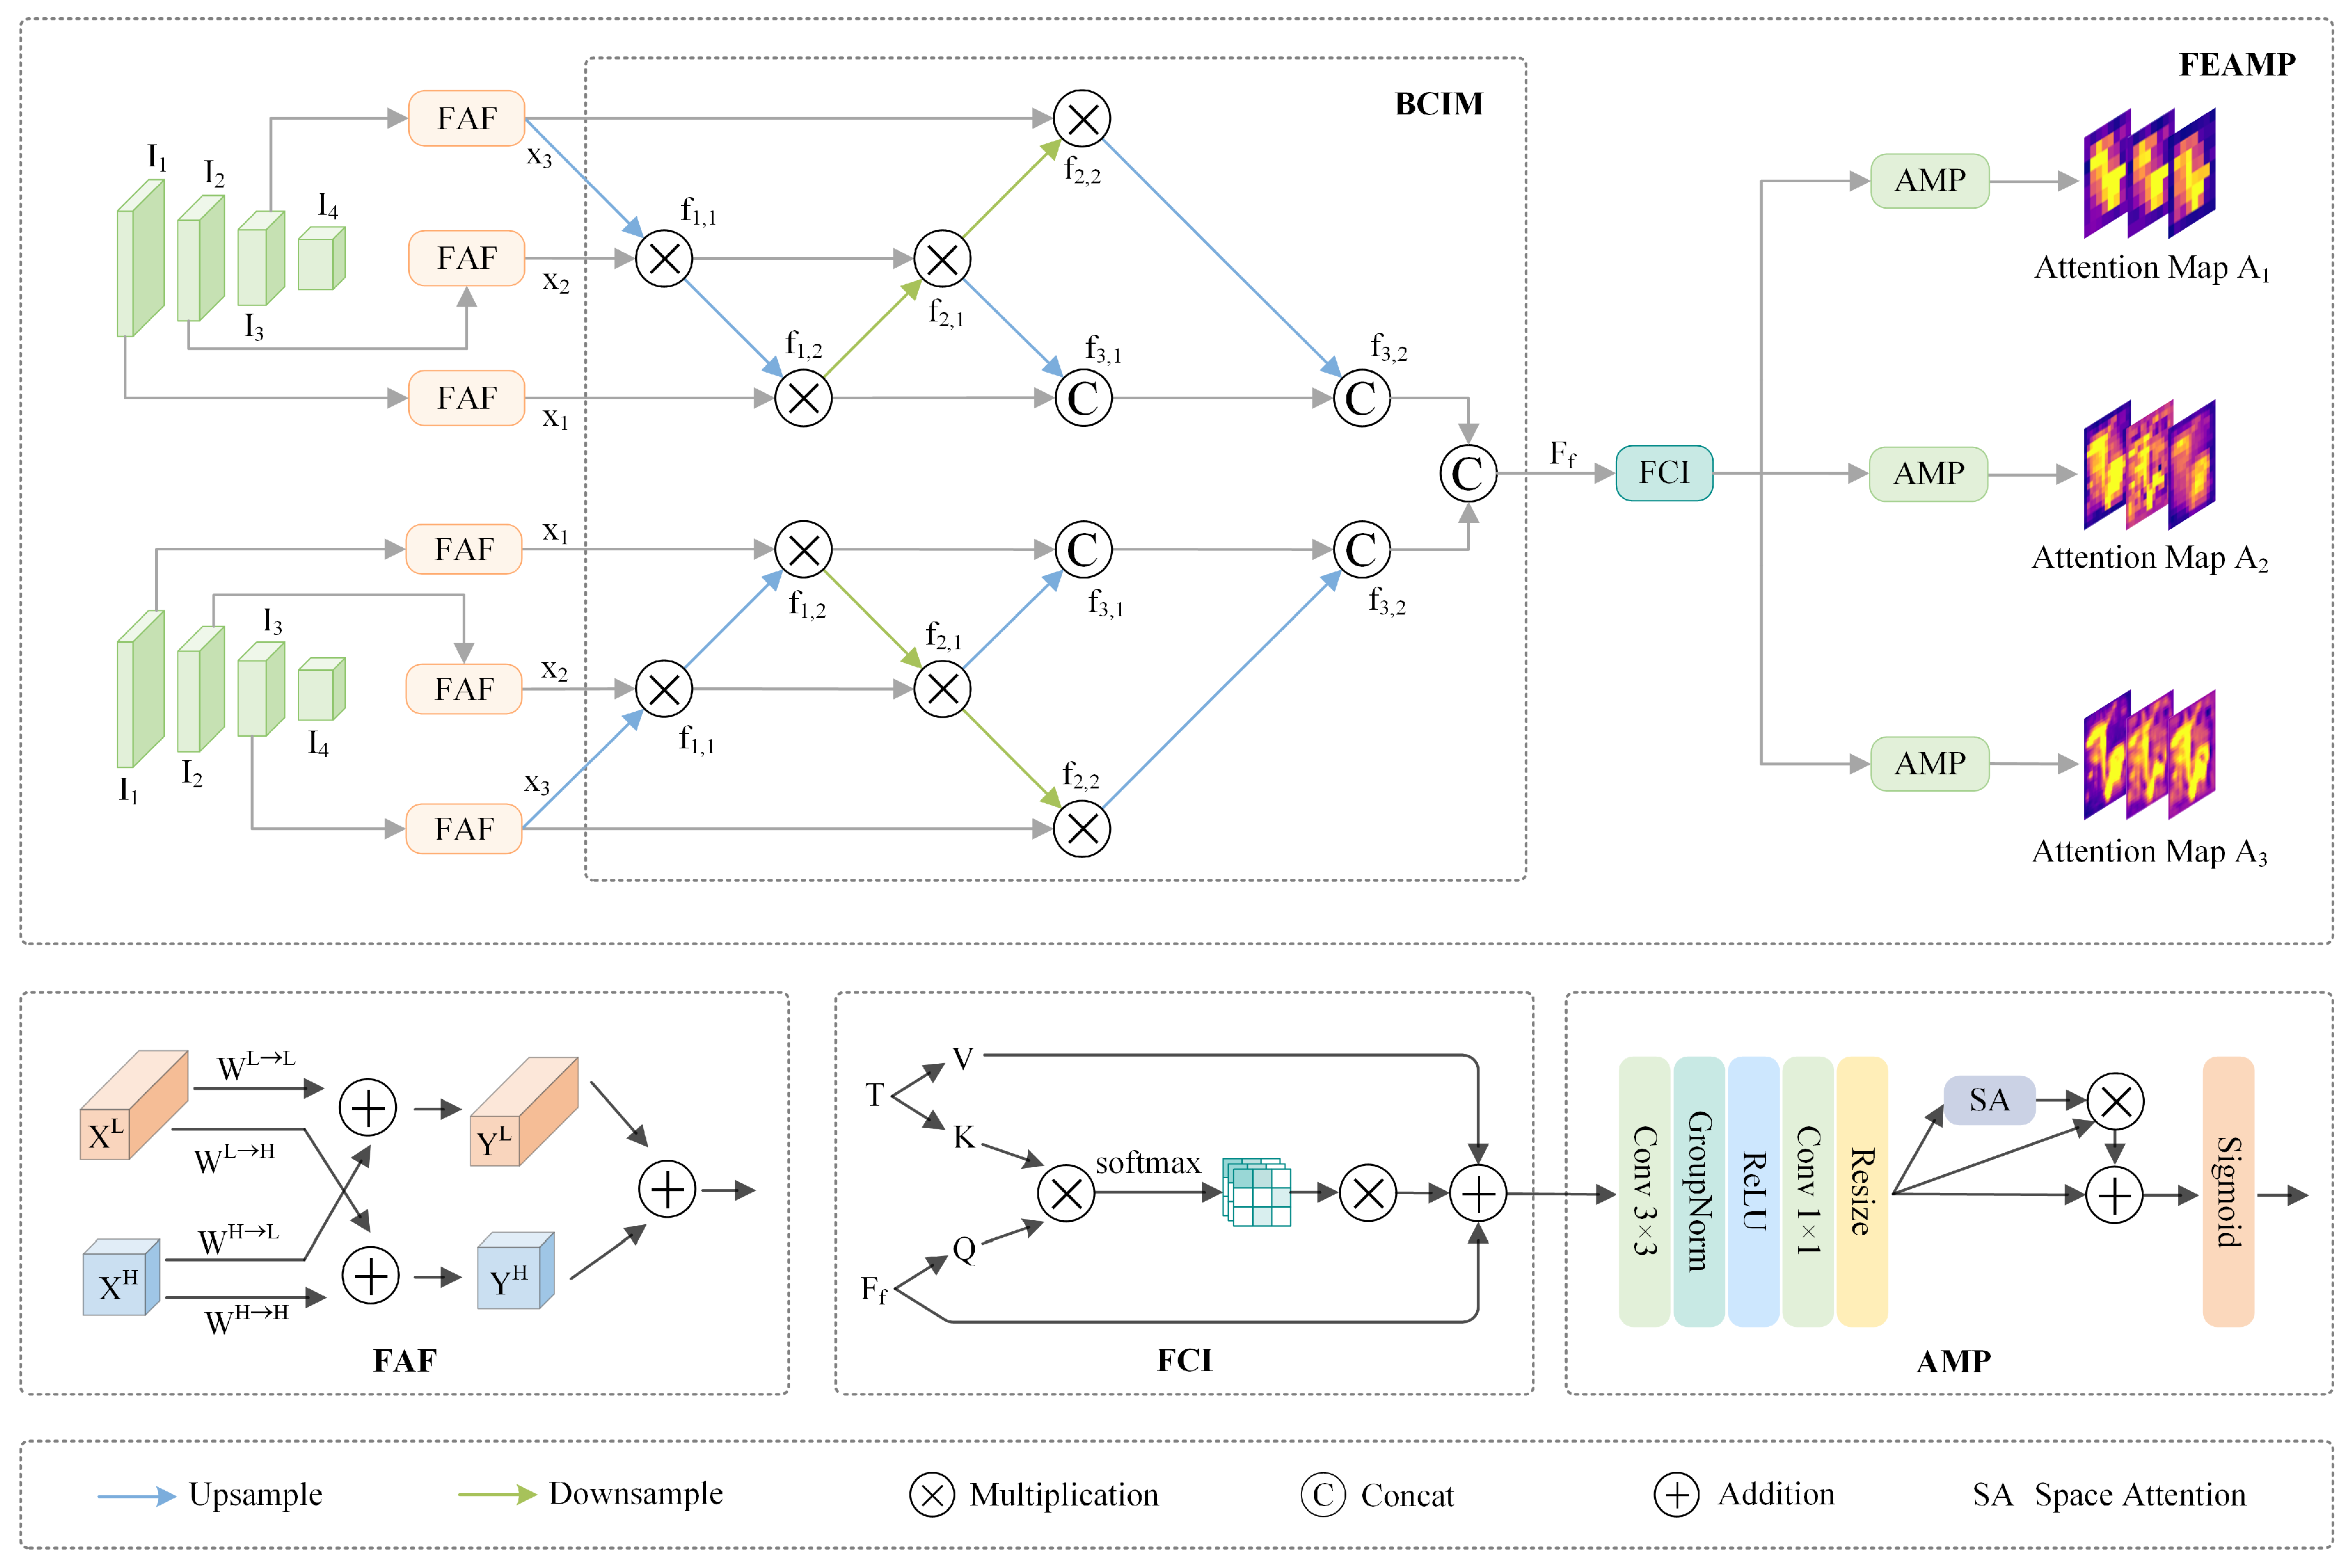
Frequency-domain signals have been widely used in various computer vision tasks. In this work, we employ octave convolution to decompose the output features of convolutional layers into high-frequency (HF) and low-frequency (LF) components. LF features correspond to pixels with subtle intensity variations and typically capture the main structure of an object. In contrast, HF components emphasize pixels with sharp brightness changes, such as contours between the foreground and background, thereby providing boundary-sensitive details and enhancing the global information of the image [55,56]. Building on these complementary frequency representations, we introduce the Frequency-Text Enhanced Attention Map Prediction Module (FEAMP), which serves as the core component of the frequency branch, as illustrated in Figure 2. FEAMP comprises four components: a Frequency-Aware Fusion module, a Bidirectional Cross-Granularity Interaction Module, a Frequency-Text Cross-Modal Interaction module, and an Attention Map Prediction module. Together, these components generate multi-scale attention maps that serve as explicit spatial priors for the subsequent decoder.

2.3.1. Frequency-Aware Fusion Module (FAF)

In this work, we use octave convolution in FAF to decompose convolutional features into HF and LF distributions. Compared with DCT-based frequency processing, octave convolution can effectively reduce blockiness artifacts and can also take advantage of the computational speed of GPUs [57].
Specifically, as shown in Figure 2, FAF is applied to the feature maps { I 1 , I 2 , I 3 } from the first three layers of the CLIP image encoder. For each input feature map, let X R c × h × w , where h, w, and c represent height, width, and channels, respectively. The FAF applies octave convolution to divide the extracted features into high-frequency components X H R ( 1 α ) c × h × w and low-frequency components X L R α c × h 2 × w 2 . Here, α [ 0 , 1 ] denotes the proportion of low-frequency channels. In our implementation, FAF is independently applied to the three feature levels { I 1 , I 2 , I 3 } . The three octave convolution modules do not share convolutional weights. The channel allocation hyperparameter α is uniformly set to 0.5 for all three levels. This parameter is treated as a predefined hyperparameter rather than a learnable parameter. A larger α assigns more channels to the low-frequency branch, which can enhance contextual representation but may reduce the capacity for high-frequency detail preservation. In contrast, a smaller α preserves more high-frequency channels but may weaken low-frequency semantic context modeling. Therefore, α = 0.5 is adopted to balance local structural details and global contextual information. To better utilize the features, octave convolution performs both intra-frequency information updating and inter-frequency information exchange. The output Y = { Y H , Y L } is computed as:
Y H = f ( X H ; W H H ) + upsample ( f ( X L ; W L H ) , 2 )
Y L = f ( X L ; W L L ) + f ( pool ( X H , 2 ) ; W H L )
where Y H and Y L denote the HF and LF output features, respectively. f ( X ; W ) denotes a convolution with parameters W, pool ( X , k ) is an average pooling operation with kernel size k × k and stride k, and upsample ( X , k ) is an upsampling operation by a factor of k via nearest interpolation.

2.3.2. Bidirectional Cross-Granularity Interaction Module (BCIM)

As shown in Figure 2, FAF extracts multi-level high-frequency and low-frequency feature representations from different backbone stages. These features differ in spatial granularity and semantic abstraction, and thus contain complementary information across hierarchical levels. However, conventional single-direction aggregation schemes may not fully exploit such cross-level complementarity. To address this issue, we design a bidirectional cross-granularity interaction module that models hierarchical dependencies through both top-down and bottom-up cross-scale interactions. Specifically, the top-down pathway injects coarse semantic context from deeper features into shallower representations to enhance their contextual awareness, whereas the bottom-up pathway feeds fine-grained spatial details from shallow features back to deeper representations to improve structural and boundary sensitivity. Through this bidirectional interaction, the module promotes more effective fusion of semantic context and local detail, thereby yielding more discriminative frequency features for the subsequent frequency–text interaction and attention-map prediction stages.
The process of the bidirectional cross-granularity interaction module can be described as follows:
f 1 , 1 = x 2 Upsample ( x 3 ) , f 1 , 2 = x 1 Upsample ( f 1 , 1 ) , f 2 , 1 = f 1 , 1 Downsample ( f 1 , 2 ) , f 2 , 2 = x 3 Downsample ( f 2 , 1 ) , f 3 , 1 = cat f 1 , 2 , Upsample ( f 2 , 1 ) , f 3 , 2 = cat f 3 , 1 , Upsample ( f 2 , 2 ) )
where x 1 represents the low-level frequency domain feature, x 2 denotes the mid-level frequency domain feature, and x 3 corresponds to the high-level frequency domain feature. The Upsample(·) and Downsample(·) operations adjust feature map resolution to maintain dimensional consistency across network levels. The symbol ⊗ indicates element-wise multiplication, which is used to combine feature maps at different levels.

2.3.3. Frequency-Text Cross-Modal Interaction Module (FCI)

CLIP combines images with text, where language encodes rich semantic and logical relationships, thereby providing additional context and semantic information and enhancing the model’s semantic understanding of images. Following ChangeCLIP, we construct the textual prompts using a predefined vocabulary of 56 common remote sensing categories. This vocabulary covers typical land-cover and land-use objects frequently observed in remote sensing imagery, including natural environments, transportation facilities, recreational areas, residential and building regions, commercial and industrial areas, and other man-made structures. For each temporal image, CLIP is used to perform zero-shot category estimation over the 56-category vocabulary, and the categories are ranked according to their confidence scores. It should be noted that the category prediction used for prompt construction is performed before model training and inference. The top nine categories with the highest confidence are then selected as the predicted semantic categories of the image patch. This top nine setting follows ChangeCLIP to maintain consistency with the established prompt construction strategy and provides a practical balance between semantic coverage and noise suppression. Specifically, remote sensing image patches often contain multiple land-cover objects, and selecting too few categories may omit useful scene semantics, whereas selecting too many categories may introduce low-confidence or irrelevant categories and weaken the discriminative semantic guidance. The selected categories are concatenated as “Predicted Classes” and inserted into the foreground prompt template “remote sensing image foreground objects, Predicted Classes”, while the background prompt is fixed as “remote sensing image background objects”. These prompts are then encoded by the CLIP text encoder to obtain the textual embeddings T used in the subsequent cross-modal interaction. Frequency-domain information provides both structural details and global contextual understanding. By allowing frequency characteristics to interact with CLIP textual embeddings, the model can integrate visual–linguistic features and enhance semantic representation. To this end, we propose the Frequency-Text Cross-Modal Interaction Module (FCI), as shown in Figure 2. The calculation steps of the module are as follows:
Q = W f F f
K = W t 1 T
V = W t 2 T
output = γ softmax ( Q K T d ) V + F f
where F f denotes the BCIM processed and flattened frequency-domain features. W f , W t 1 , and W t 2 are different linear projection weights. d is the channel dimension of F f and T; the learnable parameter γ modulates the intensity of textual semantic influence exerted on frequency-domain characteristics. Through this interaction, the module injects textual semantic information into the frequency-domain representation to obtain a text-enhanced frequency feature. The resulting feature is then fed into the attention map prediction module to generate multi-scale spatial attention maps, which subsequently provide guidance for the decoder in emphasizing change-relevant regions and suppressing pseudo-changes.

2.3.4. Attention Map Prediction Module (AMP)

To obtain an explicit spatial prior from the text-enhanced frequency representation, as shown in Figure 2, we predict multi-scale spatial attention maps from the fused frequency–text feature map. Let Z denote the reshaped fused frequency–text feature map. For each decoder stage, AMP first transforms Z through a 3 × 3 convolution, Group Normalization, ReLU activation, and a 1 × 1 convolution, and then resizes the resulting feature map to the spatial resolution required by the corresponding decoding stage:
A ˜ = Resize Conv 1 × 1 ( ReLU ( GN ( Conv 3 × 3 ( Z ) ) ) ) ,
Next, a spatial attention operator is applied to A ˜ , and the resulting response is used to modulate A ˜ in an element-wise manner. A residual connection is further introduced to preserve the original activation:
A = σ γ A ˜ SA ( A ˜ ) + A ˜ ,
where SA ( · ) denotes the Spatial Attention operation, ⊗ represents element-wise multiplication, γ is a learnable scalar controlling the modulation strength, and σ ( · ) is the sigmoid function that normalizes the values into [ 0 , 1 ] . In this way, AMP produces three stage-aligned attention maps { A 1 , A 2 , A 3 } , which are used to guide the subsequent Attention-Modulated Decoder for hierarchical multi-scale fusion.

2.4. Attention-Modulated Decoder

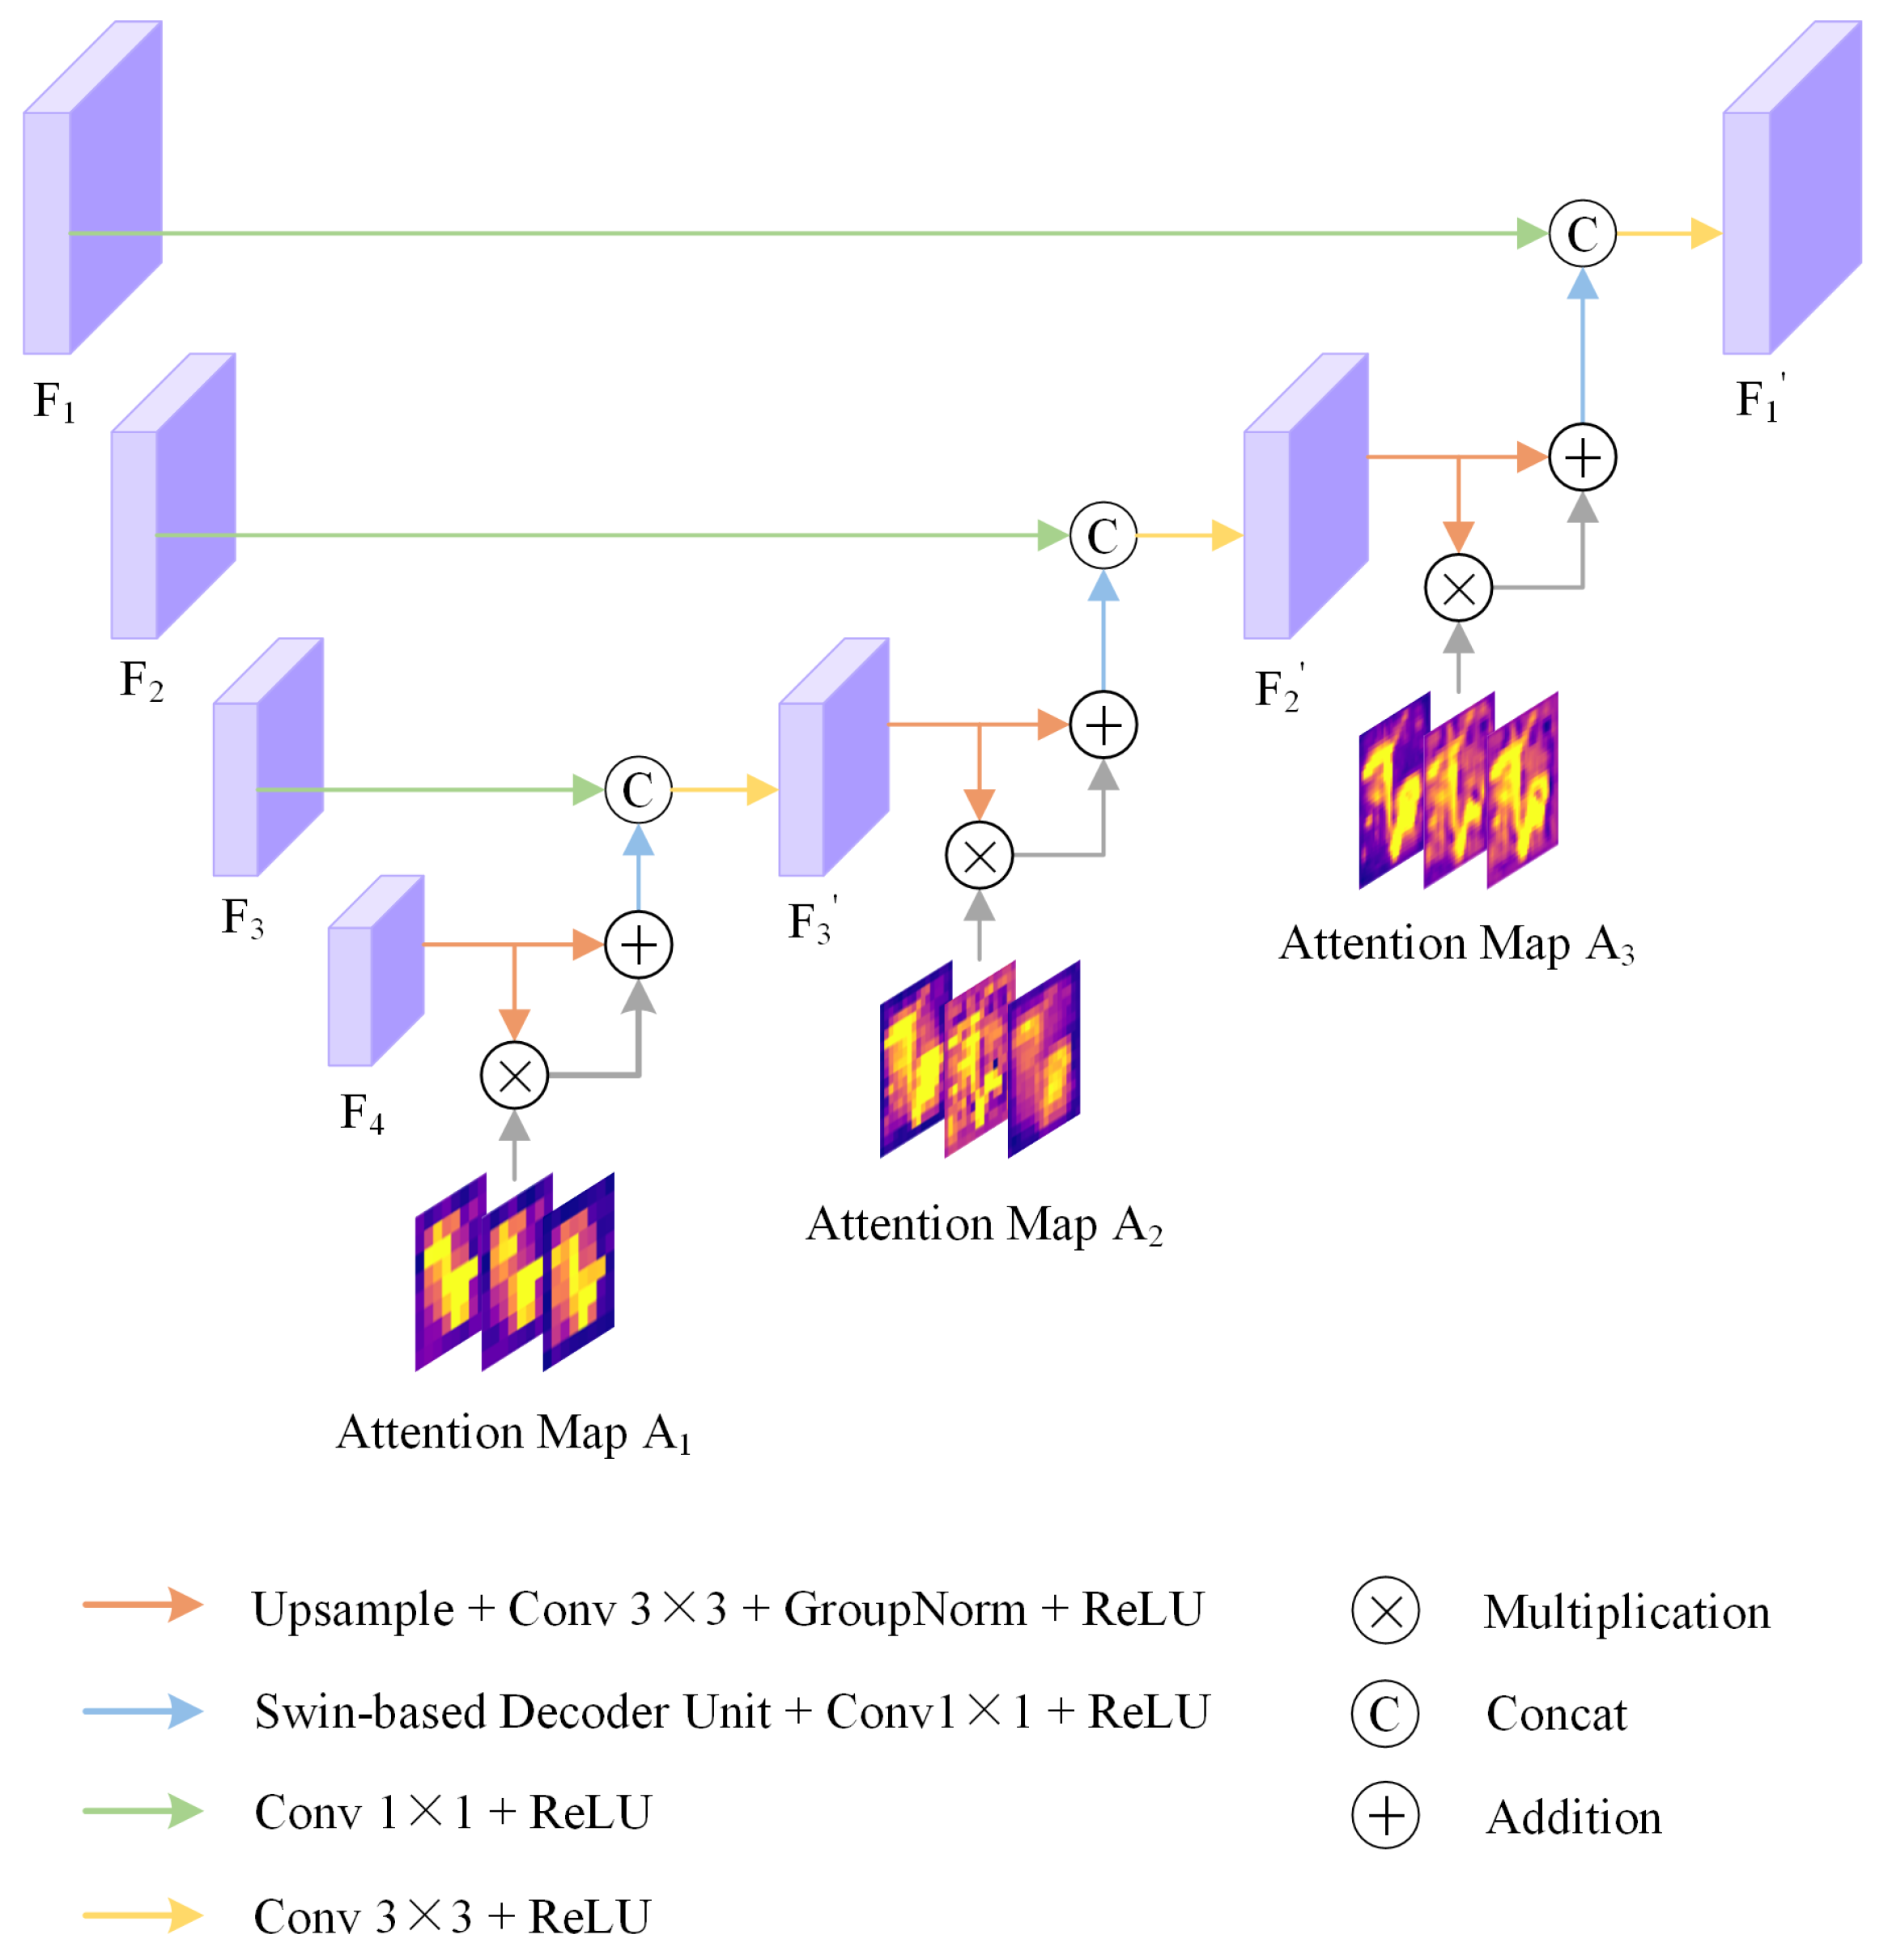
Based on the three predicted attention maps { A 1 , A 2 , A 3 } , we design an Attention-Modulated Decoder (AMD) to hierarchically integrate encoder features { F 4 , F 3 , F 2 , F 1 } in a top-down manner. As shown in Figure 3, at each decoding stage, the current feature is first residually modulated by the corresponding attention map to emphasize change-relevant regions. The modulated feature is then refined by f ( · ) , which denotes a Swin-based decoder unit. Specifically, each unit contains two consecutive Swin Transformer blocks, where the first block uses regular window-based self-attention and the second block uses shifted-window self-attention. The window size is set to 7, the number of attention heads is 2, and the MLP expansion ratio is 4. The refined feature is then fused with the next shallower encoder feature. At the coarsest scale, the deepest feature F 4 is first modulated by A 1 and then fused with F 3 :
F 3 = concat f ( F 4 A 1 + F 4 ) , F 3 .
Here, concat ( · ) indicates channel-wise concatenation, and ⊗ denotes element-wise multiplication, which is used to reweight the feature map by the corresponding attention map for spatially adaptive modulation.
The intermediate and final decoding stages follow the same principle: the current feature is reweighted by the corresponding attention map and processed by f ( · ) , and then fused with a shallower encoder feature:
F 2 = concat f ( F 3 A 2 + F 3 ) , F 2 ,
F 1 = concat f ( F 2 A 3 + F 2 ) , F 1 .
In this way, F 1 integrates high-level semantic information with fine-grained spatial details from shallow layers, while being progressively modulated by the multi-level attention maps predicted from frequency–text features, yielding a unified representation for the final prediction head.
Finally, the decoder output F 1 is transformed into the pixel-wise prediction map by a 1 × 1 convolutional classifier:
Y ^ = Conv 1 × 1 cls ( F 1 ) ,
where Conv 1 × 1 cls ( · ) denotes the classification layer, and Y ^ represents the logits of the final change detection map.
Overall, AMD enhances the decoding process in three aspects. First, the predicted attention maps provide stage-specific spatial guidance, enabling the decoder to emphasize change-relevant regions during feature propagation. Second, the hierarchical top-down fusion strategy progressively combines high-level semantic context with fine-grained spatial information from shallow layers. Third, the Swin Transformer-based decoding block strengthens contextual modeling within each stage, which helps produce change regions that are more spatially coherent and structurally complete.

2.5. Experimental Setup

All experiments were implemented in PyTorch 2.0.0 with CUDA 11.8 and conducted on an Ubuntu 20.04 system equipped with NVIDIA GeForce RTX 4090 GPUs (NVIDIA Corporation, Santa Clara, CA, USA). For model optimization, the AdamW optimizer was adopted with an initial learning rate of 3 × 10 5 and a weight decay of 0.01 . The batch size was set to 8, and all models were trained for 200 epochs. The loss function was cross-entropy, which was computed only on the decoder output during training. For SYSU-CD and CDD, image pairs with a spatial size of 256 × 256 were used during both training and testing. For JL1-CD, image patches of 256 × 256 were used as network inputs during training. During testing, sliding-window inference was adopted with a crop size of 256 × 256 and a stride of 128 × 128 . The MobileSAM branch and the CLIP-RN50 branch were initialized with the officially released pre-trained weights of MobileSAM and CLIP-RN50, respectively. Data augmentation was applied to the training set, including random translation, random rotation, and random brightness and contrast adjustment.

2.6. Datasets

SYSU-CD: The SYSU-CD dataset contains 20,000 pairs of 256 × 256 aerial images captured in Hong Kong from 2007 to 2014. It covers diverse change types, including urban construction, suburban expansion, groundwork, vegetation changes, road expansion, and maritime construction. We use 12,000 image pairs for training, 4000 for validation, and 4000 for testing [58].
JL1-CD: JL1-CD is a high-resolution, comprehensive change detection dataset with 5000 pairs of satellite images collected in China from early 2022 to the end of 2023, covering regions such as Shandong, Ningxia, Anhui, Hebei, and Hunan. The images have sub-meter spatial resolution (0.5–0.75 m) and a size of 512 × 512 pixels. The dataset includes a wide range of human-induced and natural surface features, such as buildings, roads, hardened surfaces, woodlands, grasslands, croplands, water bodies, and photovoltaic (PV) panels. Following an 80%:20% split, we use 4000 pairs for training and 1000 pairs for testing [59].
CDD: CDD is a remote sensing dataset of satellite images. It shows the same areas at different times, mainly to capture seasonal changes. The images were collected from Google Earth, with spatial resolutions ranging from 0.03 m to 1 m. All images are randomly cropped to 256 × 256 pixels. After cropping, the dataset is split into training, validation, and test sets. The training set has 10,000 image pairs, and the validation and test sets each have 3000 image pairs. CDD is used to evaluate change detection models on the same area over time. It covers different change types, such as urban construction, vegetation variation, and water-body changes, so it can test model performance in multiple scenes [60].

2.7. Benchmark Methods

We compared the proposed TriFusion-CD with a series of advanced RSCD methods, including CNN-based methods, transformer-based methods, and foundation model-based methods.
FC-EF [18]: A U-Net-inspired fully convolutional early-fusion network that concatenates the two input images along the channel dimension and uses an encoder–decoder with skip connections to produce a pixel-wise change map.
IFN [19]: A deeply supervised, two-stream CNN architecture that fuses bi-temporal features through attention-guided multi-level feature integration and a difference discrimination network, enabling precise and boundary-preserving change detection in high-resolution imagery.
SNUNet-CD [61]: SNUNet-CD is a densely connected Siamese network designed for change detection. It mitigates the loss of localization information in the deep layers of the network by enabling compact information transmission between the encoder and decoder, as well as between decoders.
BIT [11]: An efficient bitemporal-image transformer that compresses each temporal feature map into a few semantic tokens, models long-range space–time context in token space, and reprojects the context-rich tokens back to refine pixel features for accurate change detection.
ChangeFormer [20]: A transformer-based Siamese network architecture for Change Detection. The method unifies hierarchically structured transformer encoder with Multi-Layer Perception decoder in a Siamese network architecture to efficiently render multi-scale long-range details required for accurate CD.
TinyCD [62]: A lightweight and effective change detection model. TinyCD uses a Siamese U-Net architecture exploiting low-level features in a globally temporal and locally spatial way to achieve change detection.
Changer [63]: Changer emphasizes the importance of feature interaction in change detection and enhances the modeling of cross-temporal feature relationships through a series of alternating interaction layers within the feature extractor.
BAN [38]: A foundation-model adaptation framework for remote-sensing change detection that uses a frozen foundation model alongside a bi-temporal adapter branch to transfer general knowledge for improved change prediction.
ChangeCLIP [39]: A multimodal vision–language change detection framework that introduces CLIP into remote sensing change detection. It constructs textual prompts from predicted remote sensing categories and jointly exploits image and text representations.
EFI-SAM [35]: A SAM-based efficient feature integration network for remote sensing change detection. It uses an adaptive Mobile SAM encoder enhanced by a random Fourier features adaptor to improve the extraction of general remote sensing features.

2.8. Evaluation Metrics

We evaluate the proposed method using eight indicators: Intersection-over-Union (IoU), precision (P), recall (R), F1 score (F1), overall accuracy (OA), Kappa coefficient (Kappa), Boundary IoU (Intersection-over-Union), and Fragmentation Consistency Score (FCS). In change detection, a higher precision indicates fewer false detections (i.e., fewer false positives), while a higher recall indicates fewer missed changes (i.e., fewer false negatives). IoU, F1, and OA provide a comprehensive assessment of pixel-level detection performance, where larger values indicate better results [64]. In addition, Kappa measures the agreement between the predicted and ground-truth masks after correcting for chance agreement, thereby providing a complementary evaluation of classification consistency. These metrics are computed as follows:
IoU = TP TP + FP + FN
P = TP TP + FP
R = TP TP + FN
F 1 = 2 PR P + R
OA = TP + TN TP + TN + FP + FN
where TP is the number of true positives, FP is the number of false positives, TN is the number of true negatives, and FN is the number of false negatives.
The Kappa coefficient is defined as:
E = ( TP + FP ) ( TP + FN ) + ( FN + TN ) ( FP + TN ) ( TP + TN + FP + FN ) 2 ,
Kappa = OA E 1 E ,
where E denotes the expected agreement by chance. A larger Kappa value indicates stronger consistency between the prediction and the ground truth after correcting for random agreement.
Boundary IoU (Intersection-over-Union) is a segmentation evaluation measure focused on boundary quality. Let G be the ground-truth binary mask and P the predicted binary mask; let G d and P d denote the boundary regions (pixels within distance d of each mask’s contour) [65]. Boundary IoU is defined as:
BoundaryIoU ( G , P ) = G d G P d P G d G P d P
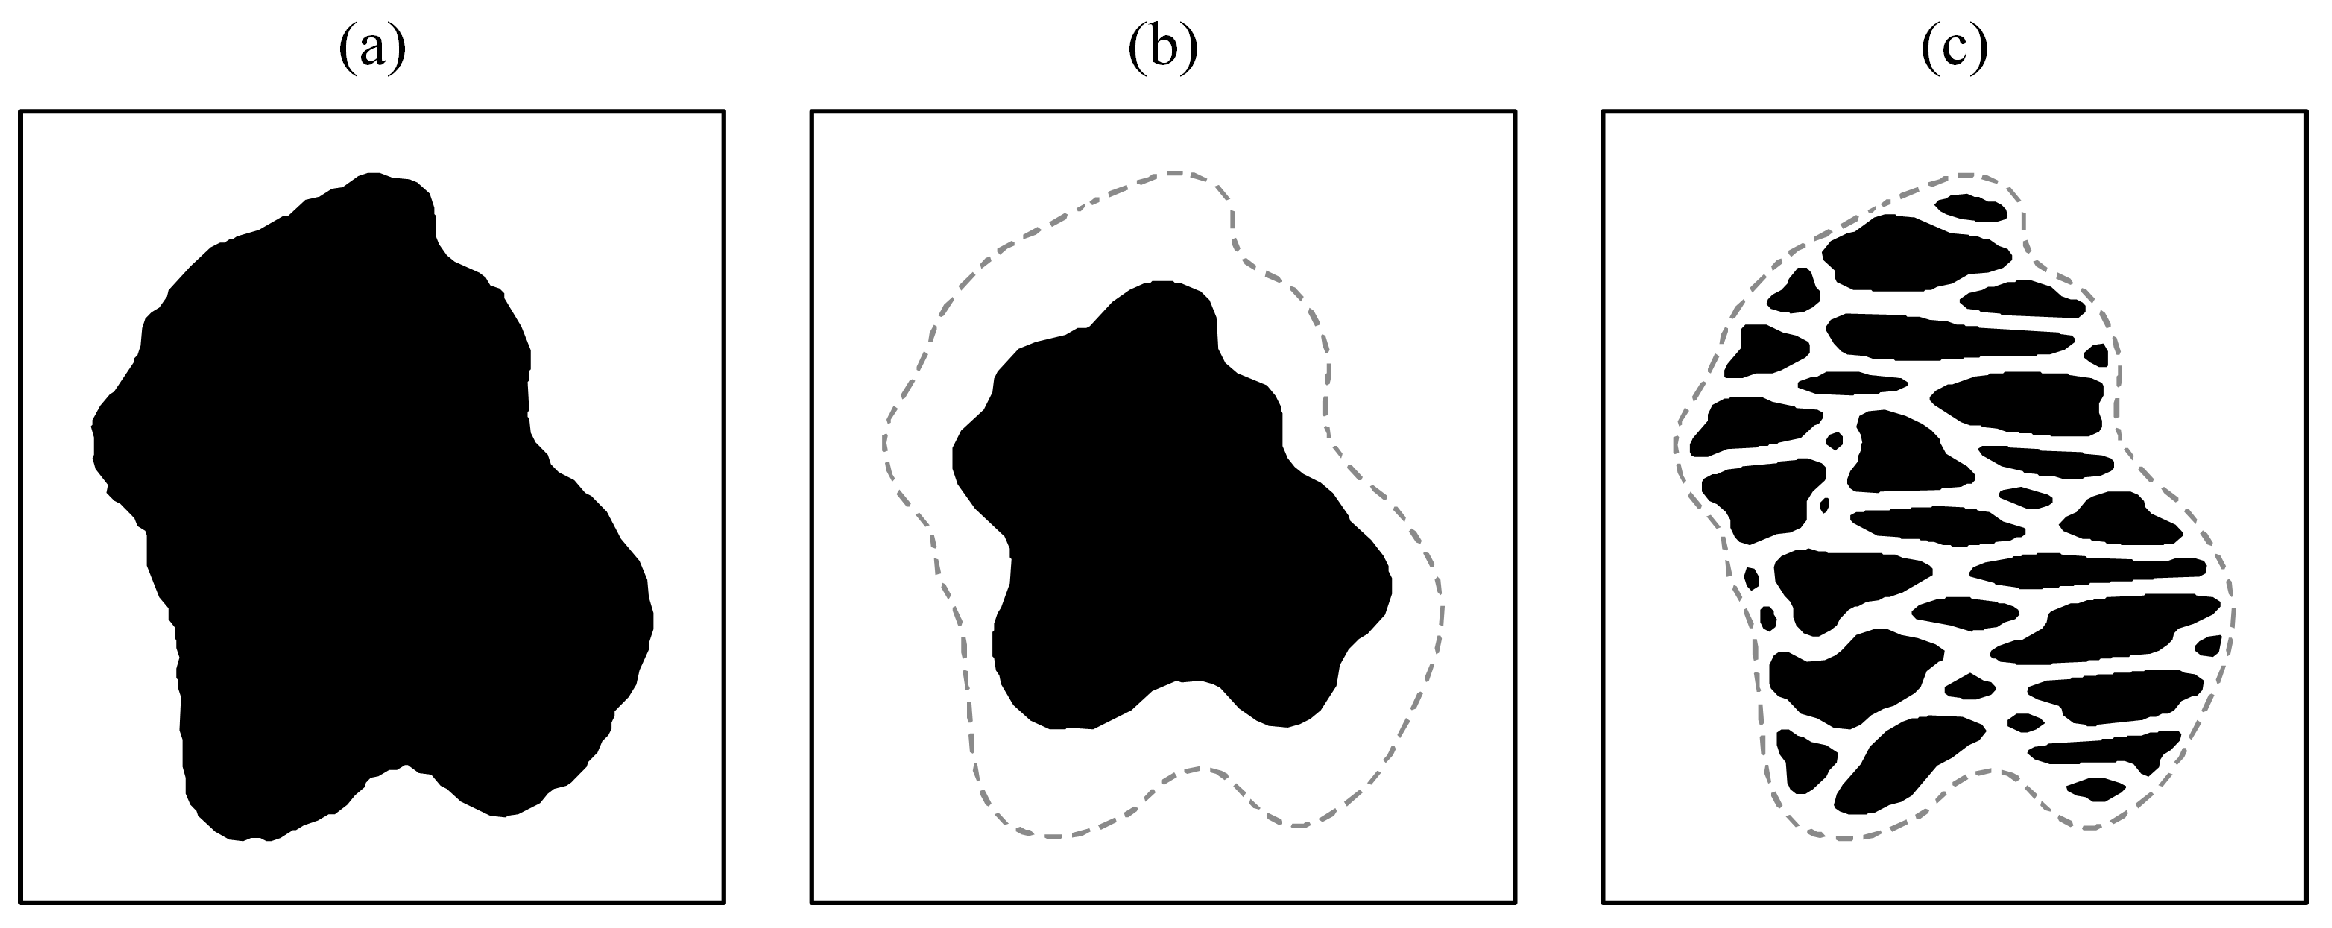
In practice, overlap-based metrics such as IoU and F1 mainly evaluate the pixel-level agreement between the predicted mask and the ground truth. However, they may not fully reflect the fragmentation structure of the predicted change regions. As illustrated in Figure 4, the black pixels represent changed areas and the white pixels represent unchanged areas. The gray dashed contours in Figure 4b,c denote the ground-truth boundary extracted from Figure 4a. Although the two predictions may have comparable overlap with the ground-truth region, Figure 4b preserves a single connected change region, whereas Figure 4c splits the changed area into multiple disconnected fragments. This example shows that overlap-based metrics alone cannot sufficiently describe the fragmentation consistency of predicted masks. Therefore, we introduce the Fragmentation Consistency Score (FCS) to quantify whether the predicted mask has a foreground connected-component count consistent with that of the ground truth.
Let Ω = { 1 , , H } × { 1 , , W } denote the discrete two-dimensional image domain. Given a ground-truth binary change mask G : Ω { 0 , 1 } and a predicted binary change mask P : Ω { 0 , 1 } , their foreground pixel sets are defined as
S G = { ( i , j ) Ω G ( i , j ) = 1 } , S P = { ( i , j ) Ω P ( i , j ) = 1 } .
For two foreground pixels u = ( i , j ) and v = ( m , n ) , they are considered eight-connected if | i m | 1 , | j n | 1 , and u v . This definition means that horizontal, vertical, and diagonal neighboring foreground pixels are assigned to the same connected relation.
For a generic foreground pixel set S { S G , S P } , a foreground connected component C S is defined as a maximal subset of foreground pixels such that, for any two pixels u , v C , there exists a sequence of pixels ( u 1 , u 2 , , u L ) with u 1 = u , u L = v , and conn 8 ( u l , u l + 1 ) = True for l = 1 , , L 1 . Therefore, the foreground pixels in the ground-truth and predicted masks can be decomposed into disjoint eight-connected components:
C 8 ( S G ) = { C G 1 , C G 2 , , C G N g } , C 8 ( S P ) = { C P 1 , C P 2 , , C P N p } .
Here,
N g = | C 8 ( S G ) | , N p = | C 8 ( S P ) |
denote the numbers of foreground connected components in the ground-truth and predicted masks, respectively.
FCS is defined as:
FCS = 100 × 1 N p N g N p + N g + 1
A larger FCS indicates that the predicted mask’s connected-region count is closer to the ground truth. The constant “+1” is included only to avoid division by zero when N p = N g = 0 .

3. Results

3.1. Quantitative Analysis and Visual Results

Table 1 summarizes the quantitative comparison on SYSU-CD, JL1-CD, and CDD. The proposed TriFusion-CD achieves the best IoU and F1 on all three datasets, obtaining 72.48% IoU/84.04% F1 on SYSU-CD, 66.04% IoU/79.54% F1 on JL1-CD, and 96.41% IoU/98.17% F1 on CDD. It also achieves the highest OA and Kappa values across the three datasets, indicating strong pixel-level classification accuracy and chance-corrected agreement. In this comparison, the strongest competing method is defined as the method with the highest IoU and F1 on each dataset. Under this criterion, ChangeCLIP is the strongest competitor on SYSU-CD and CDD, while ChangeFormer is the strongest competitor on JL1-CD. Compared with these strongest competitors, TriFusion-CD improves IoU/F1 by +1.46/+0.98 percentage points over ChangeCLIP on SYSU-CD, +0.60/+0.43 percentage points over ChangeFormer on JL1-CD, and +0.55/+0.28 percentage points over ChangeCLIP on CDD. In terms of Kappa, TriFusion-CD also improves over the corresponding strongest competitors by +1.13, +0.44, and +0.33 percentage points on SYSU-CD, JL1-CD, and CDD, respectively. These results demonstrate that the proposed method maintains consistent advantages across datasets with different scene characteristics.
A closer examination of precision and recall further clarifies the performance differences. On SYSU-CD, ChangeCLIP obtains higher precision than recall (Prec./Rec. = 85.64%/80.62%), whereas TriFusion-CD slightly reduces precision to 84.59% but improves recall to 83.51%. This suggests that TriFusion-CD detects more true changed pixels while maintaining a comparable false-detection level. On JL1-CD, ChangeFormer is also precision-dominant (81.78%/76.61%), while TriFusion-CD shows a more balanced precision–recall profile (80.64%/78.48%). On CDD, both ChangeCLIP and TriFusion-CD achieve high precision and recall. Compared with ChangeCLIP, TriFusion-CD further increases precision–recall from 97.70%/98.08% to 97.97%/98.38%, respectively. Overall, TriFusion-CD maintains a relatively balanced precision–recall profile while achieving higher IoU/F1.
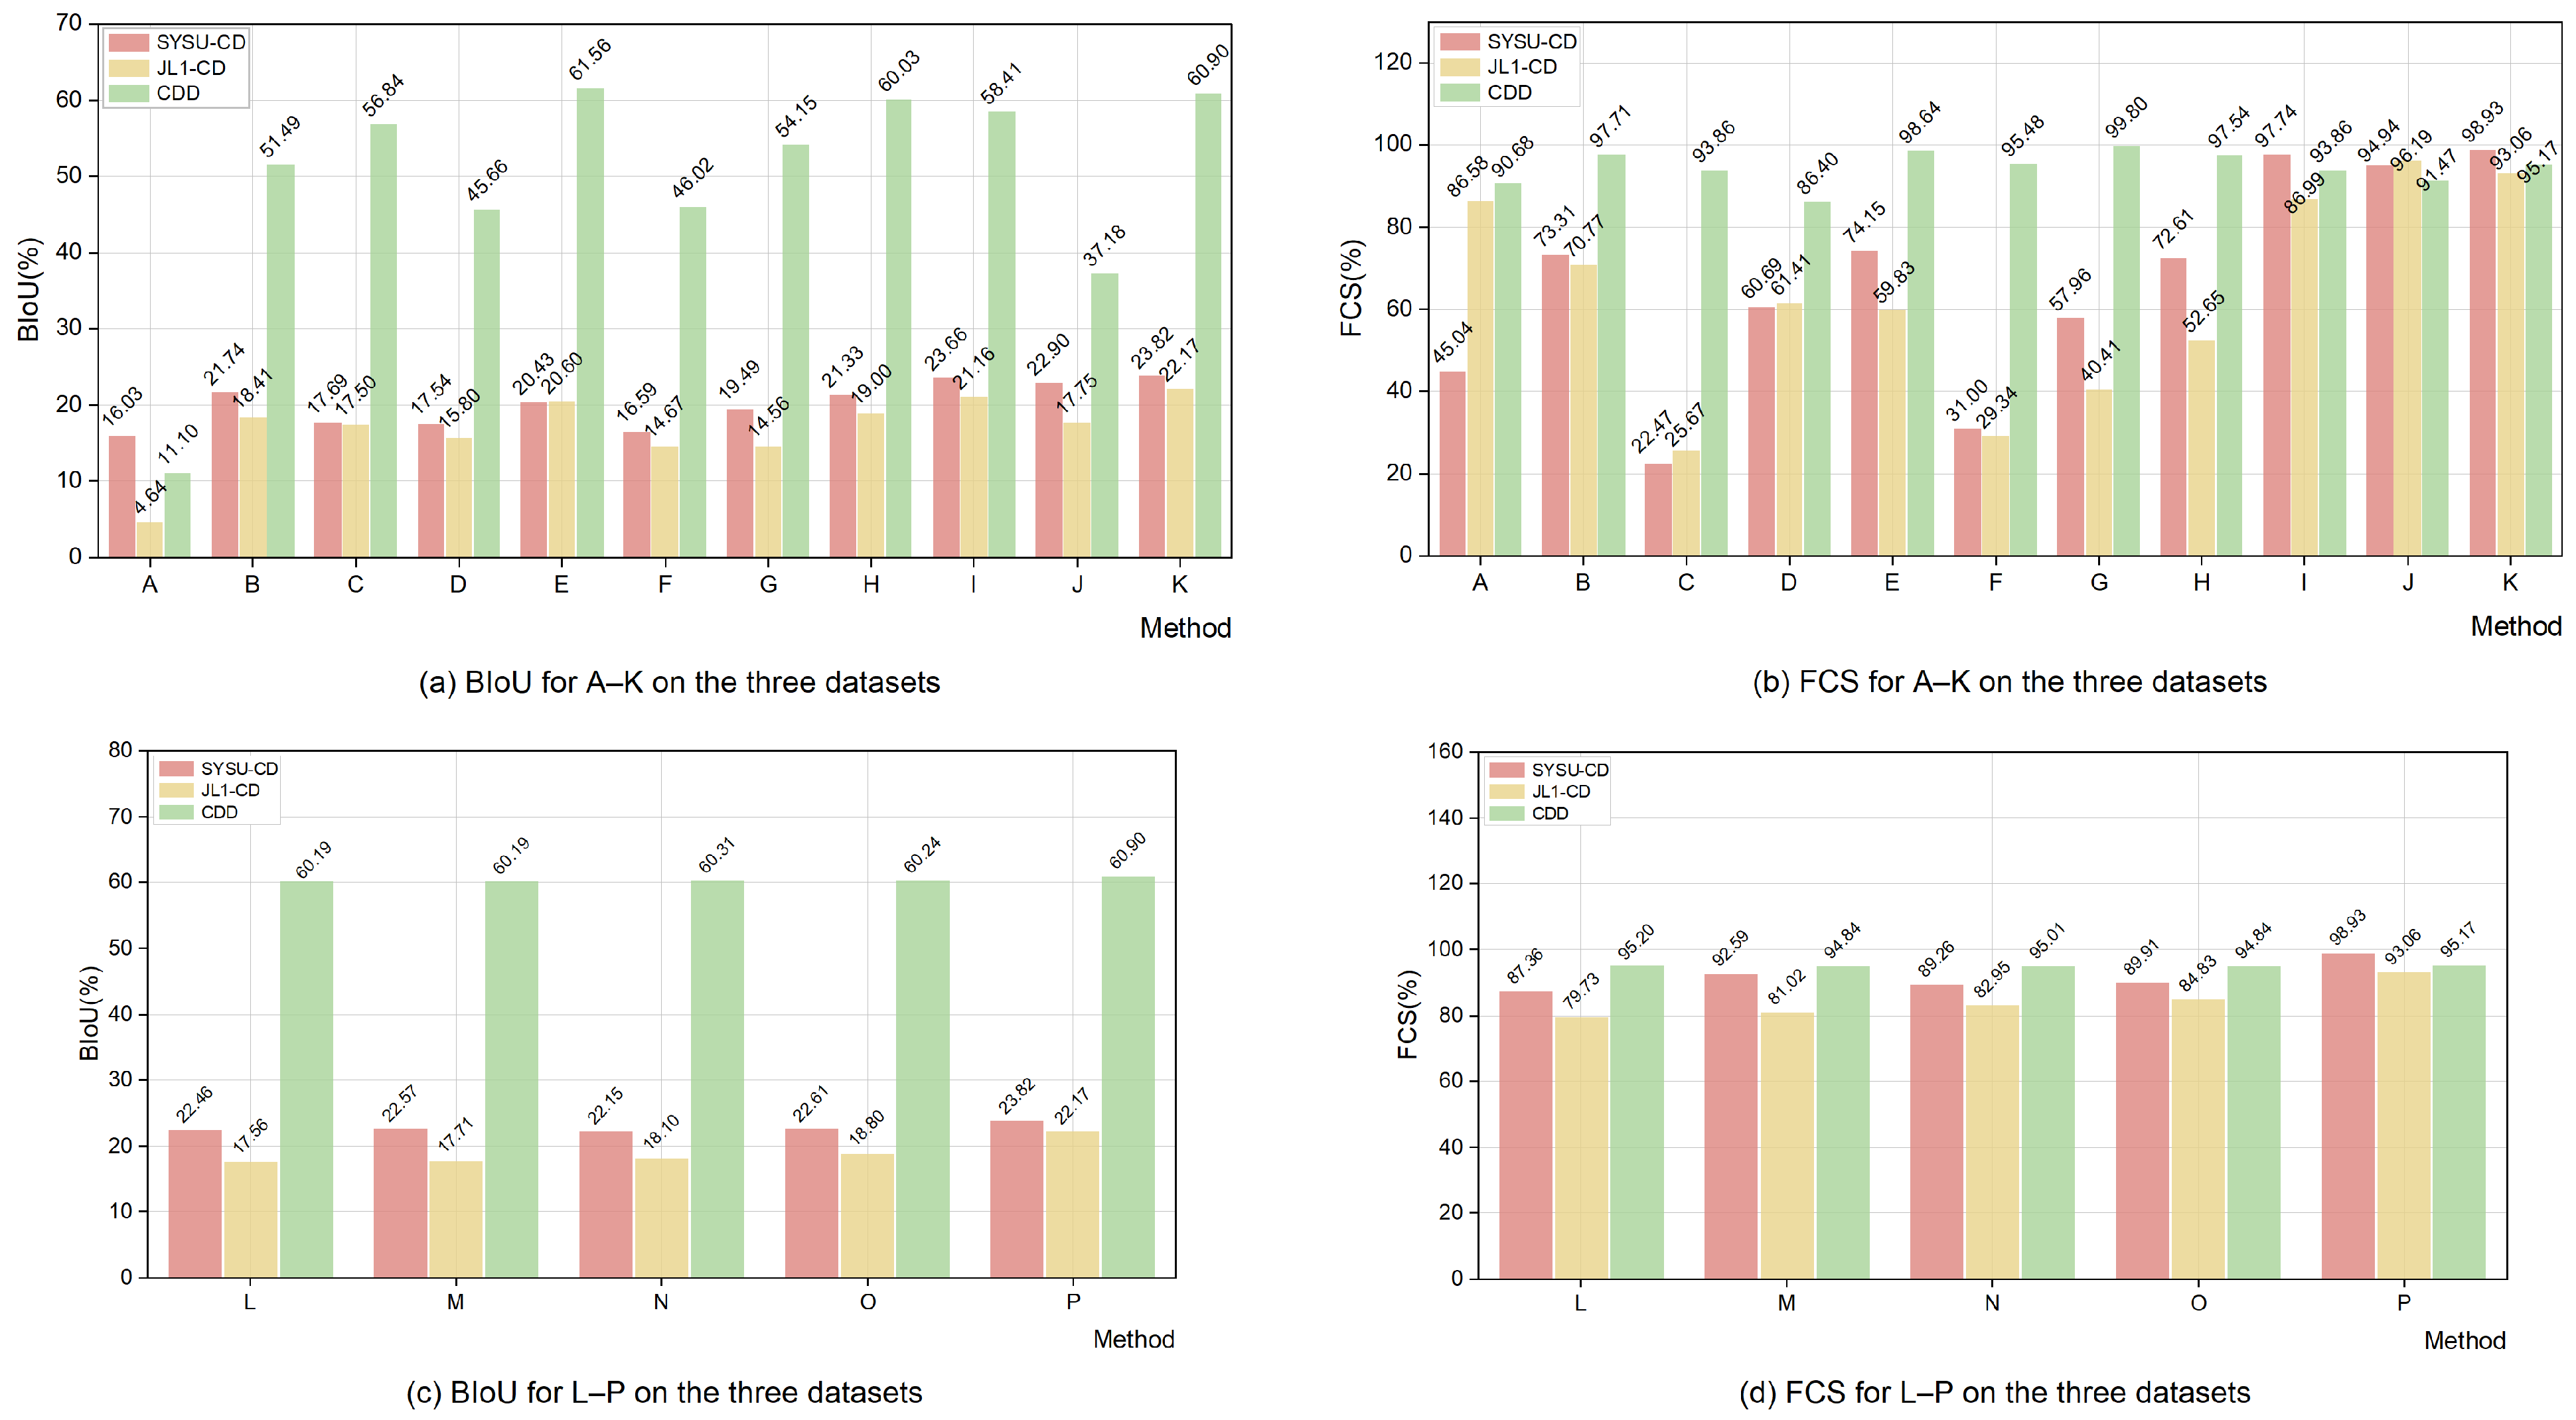
In Figure 5a, boundary quality is evaluated using Boundary IoU (BIoU, %) on SYSU-CD, JL1-CD, and CDD. TriFusion-CD achieves the highest BIoU on SYSU-CD (23.82%) and JL1-CD (22.17%). On CDD, TriFusion-CD reaches 60.90%, which is very close to the best result (ChangeFormer, 61.56%) and slightly higher than BAN (60.03%). Overall, TriFusion-CD ranks first on two datasets and remains competitive on CDD, indicating consistently strong boundary alignment under the BIoU metric.
In Figure 5b, the fragmentation consistency score (FCS, %) is used to evaluate the consistency between the predicted and ground-truth masks in terms of foreground connected components. TriFusion-CD achieves the highest FCS on SYSU-CD, reaching 98.93%, followed by ChangeCLIP with 97.74%. On JL1-CD, EFI-SAM obtains the best FCS of 96.19%, while TriFusion-CD achieves 93.06% and remains at a relatively high level among the compared methods. On CDD, most methods obtain high FCS values; Changer achieves the best result of 99.80%, followed by ChangeFormer and IFN, whereas TriFusion-CD obtains 95.17%. Therefore, although TriFusion-CD does not consistently achieve the highest FCS on all datasets, it still maintains high fragmentation consistency while obtaining the best IoU and F1 in Table 1. This result indicates that FCS and IoU/F1 reflect different aspects of prediction quality. FCS focuses more on the consistency of the number of foreground connected regions rather than pixel-level overlap accuracy; therefore, it should be interpreted as a complementary structural evaluation metric together with pixel-level metrics such as IoU and F1.
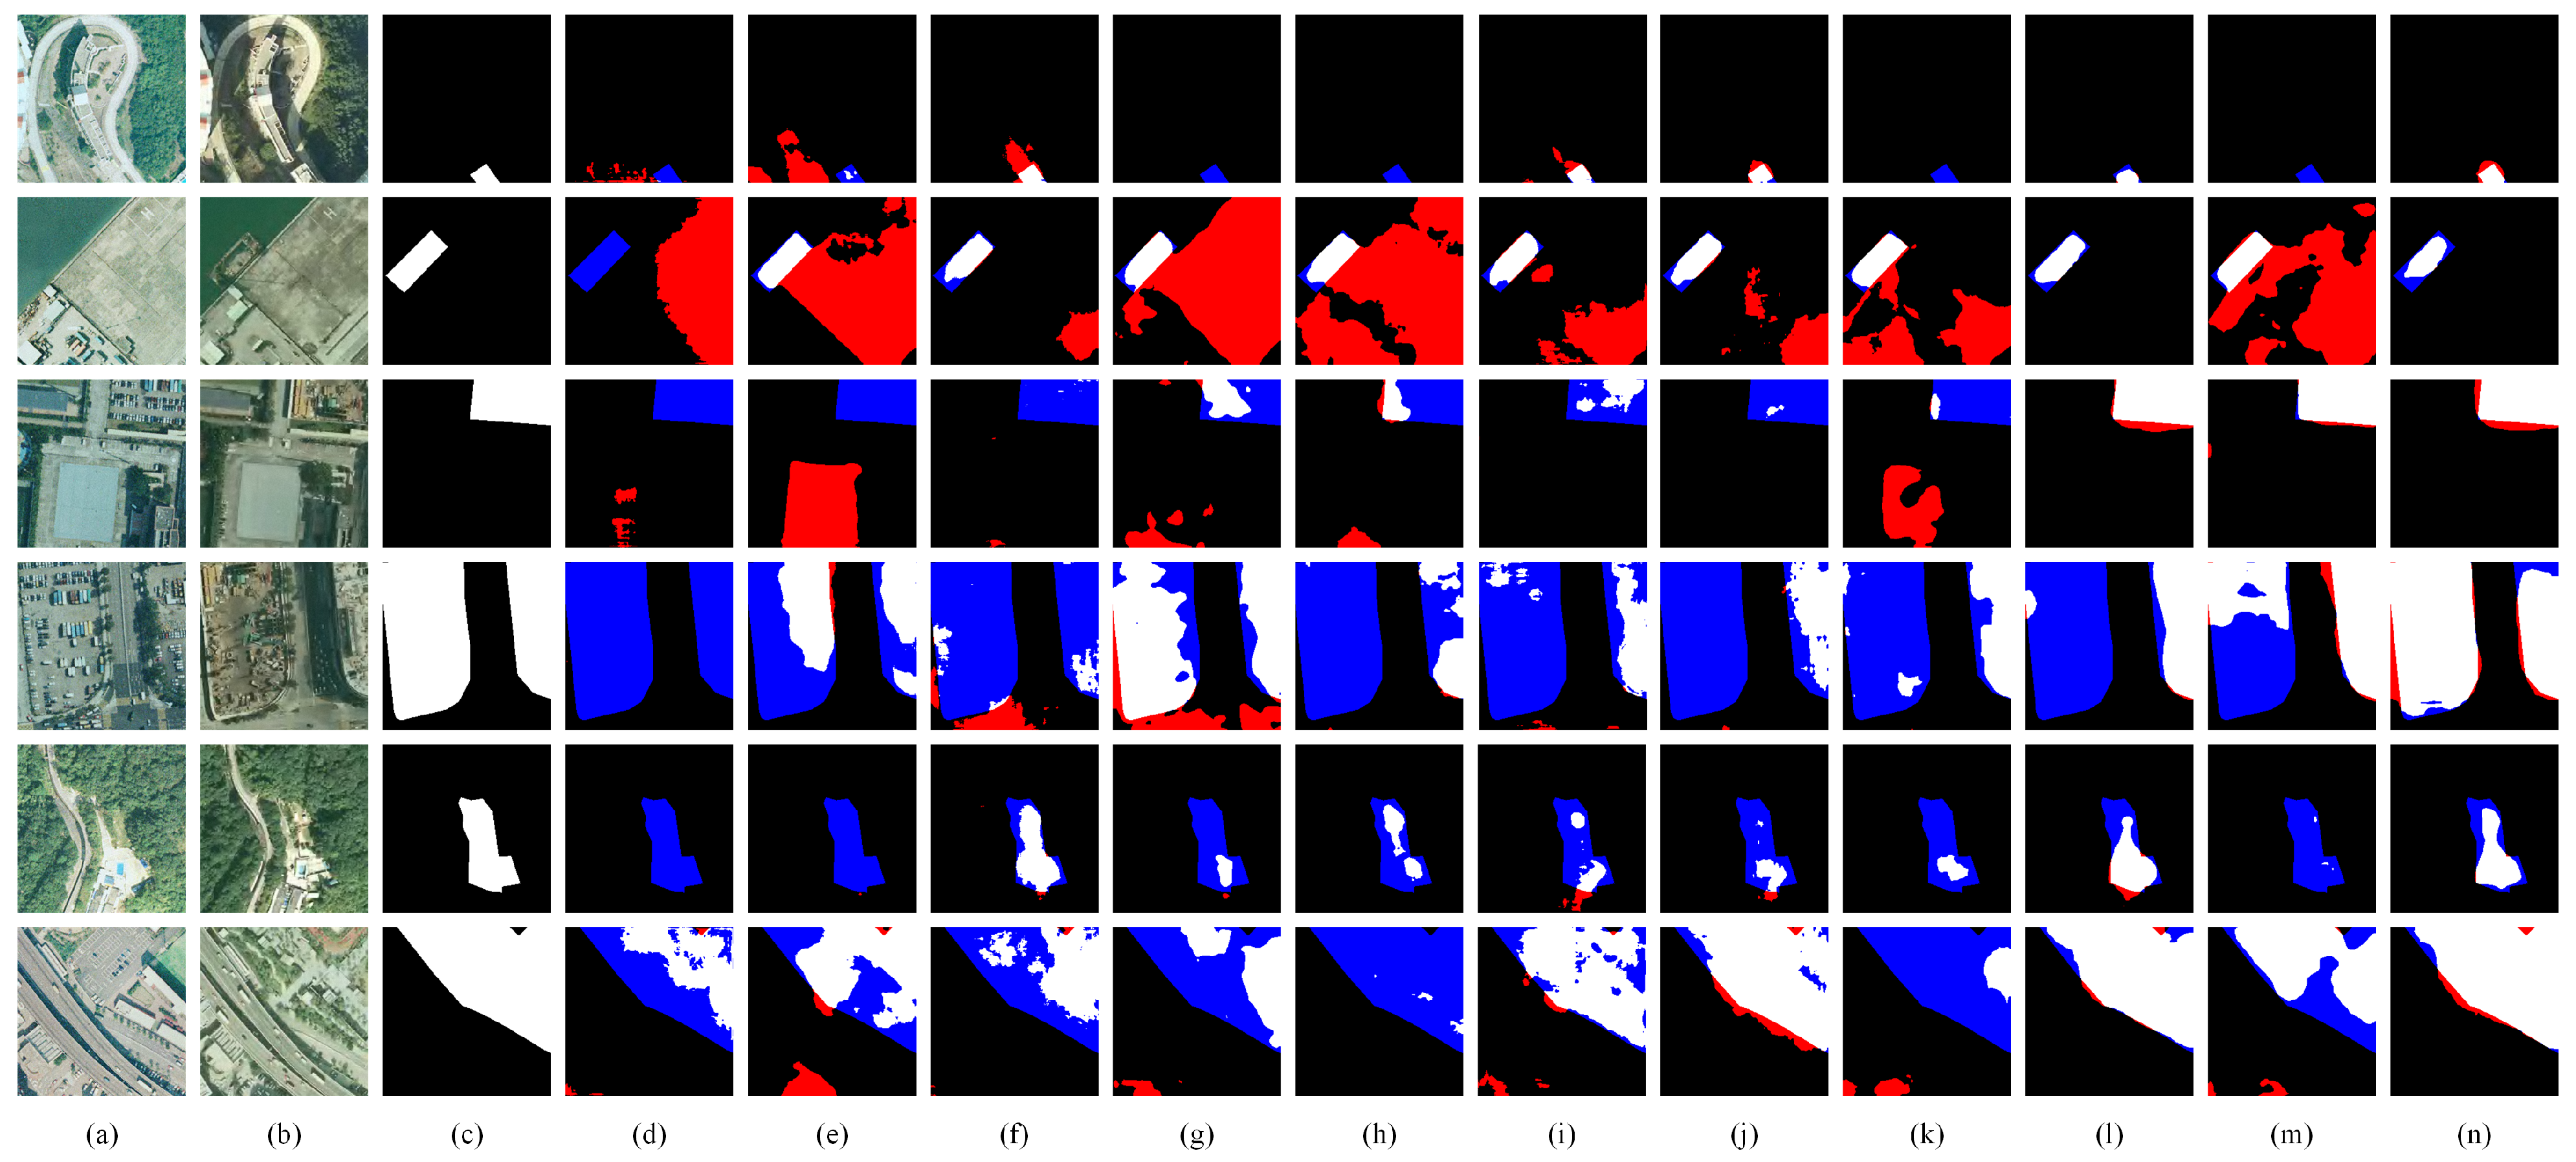
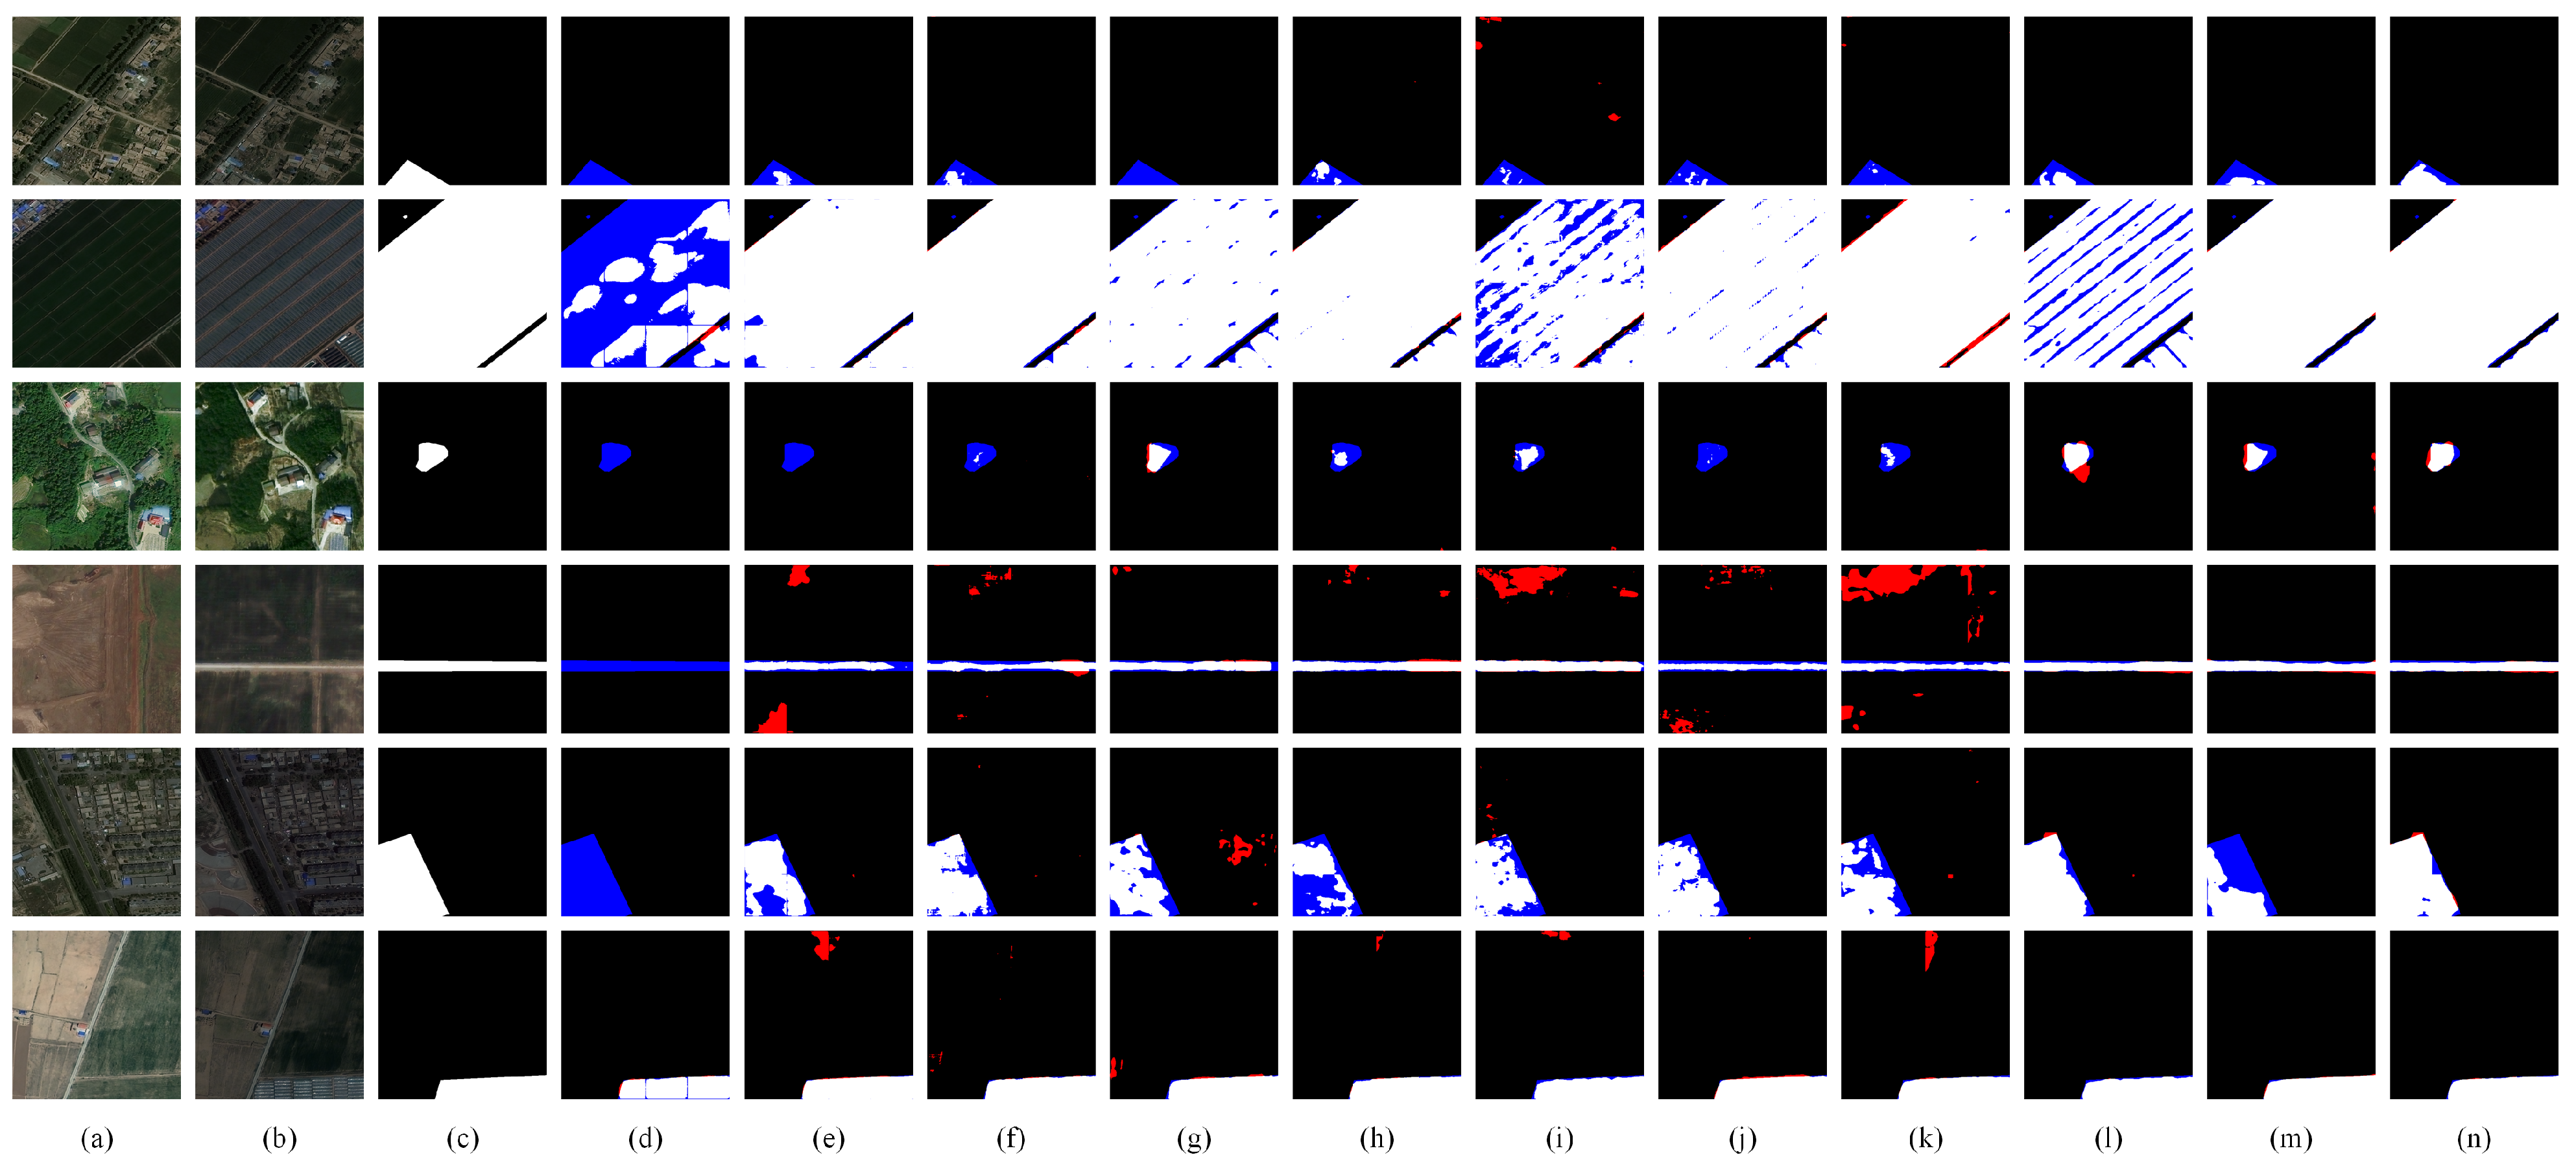
Beyond the quantitative comparisons, the visual results in Figure 6 and Figure 7 provide more intuitive evidence. The change masks produced by TriFusion-CD are spatially more coherent, clearer object boundaries, and stronger intra-region consistency, and they align closely with the ground-truth annotations. Notably, the method effectively suppresses pseudo-changes, thereby reducing spurious detections caused by appearance variations.

3.2. Ablation Study

Table 2 reports the ablation results on SYSU-CD, JL1-CD, and CDD by progressively extending the baseline configuration (CLIP branch + FPNHead) with the frequency branch (Fre), the MobileSAM branch (SAM), and the proposed Attention-Modulated Decoder (AMD). Adding Fre alone yields modest gains, improving IoU/F1 by +0.53%/+0.36% on SYSU-CD and +0.43%/+0.33% on JL1-CD, while adding SAM alone improves IoU/F1 by +0.23%/+0.16% on SYSU-CD and +0.85%/+0.65% on JL1-CD. Using Fre and SAM together leads to larger improvements (SYSU-CD: +0.91%/+0.62%; JL1-CD: +1.56%/+1.18%), indicating that the two branches provide complementary benefits. Replacing the FPNHead in the Baseline+Fre+SAM setting with AMD offers the largest further boost over this setting (SYSU-CD: +1.34%/+0.91%; JL1-CD: +1.90%/+1.38%; CDD: +0.19%/+0.09%), resulting in overall improvements of +2.25%/+1.53% on SYSU-CD, +3.46%/+2.56% on JL1-CD, and +0.21%/+0.11% on CDD relative to the baseline, which highlights the importance of decoder refinement for converting enhanced representations into higher-quality change predictions.
Table 3 further provides a fine-grained module-level ablation analysis of SAFM, BCIM, and FCI on SYSU-CD and JL1-CD. Compared with the variants without each specific module, the full TriFusion-CD consistently achieves higher IoU and F1 on both datasets, indicating that all three submodules contribute positively to change-region overlap and overall change detection quality. Specifically, removing SAFM decreases IoU/F1 by 1.75%/1.18% on SYSU-CD and 0.59%/0.42% on JL1-CD, suggesting that the semantic guidance from MobileSAM is beneficial for enhancing change localization. Removing BCIM also reduces IoU/F1 by 1.57%/1.06% on SYSU-CD and 0.50%/0.36% on JL1-CD, which supports the effectiveness of bidirectional cross-granularity interaction in exploiting multi-level frequency features. In addition, removing FCI leads to IoU/F1 drops of 1.01%/0.68% on SYSU-CD and 0.31%/0.22% on JL1-CD, confirming that the interaction between frequency features and textual semantics provides useful auxiliary guidance.
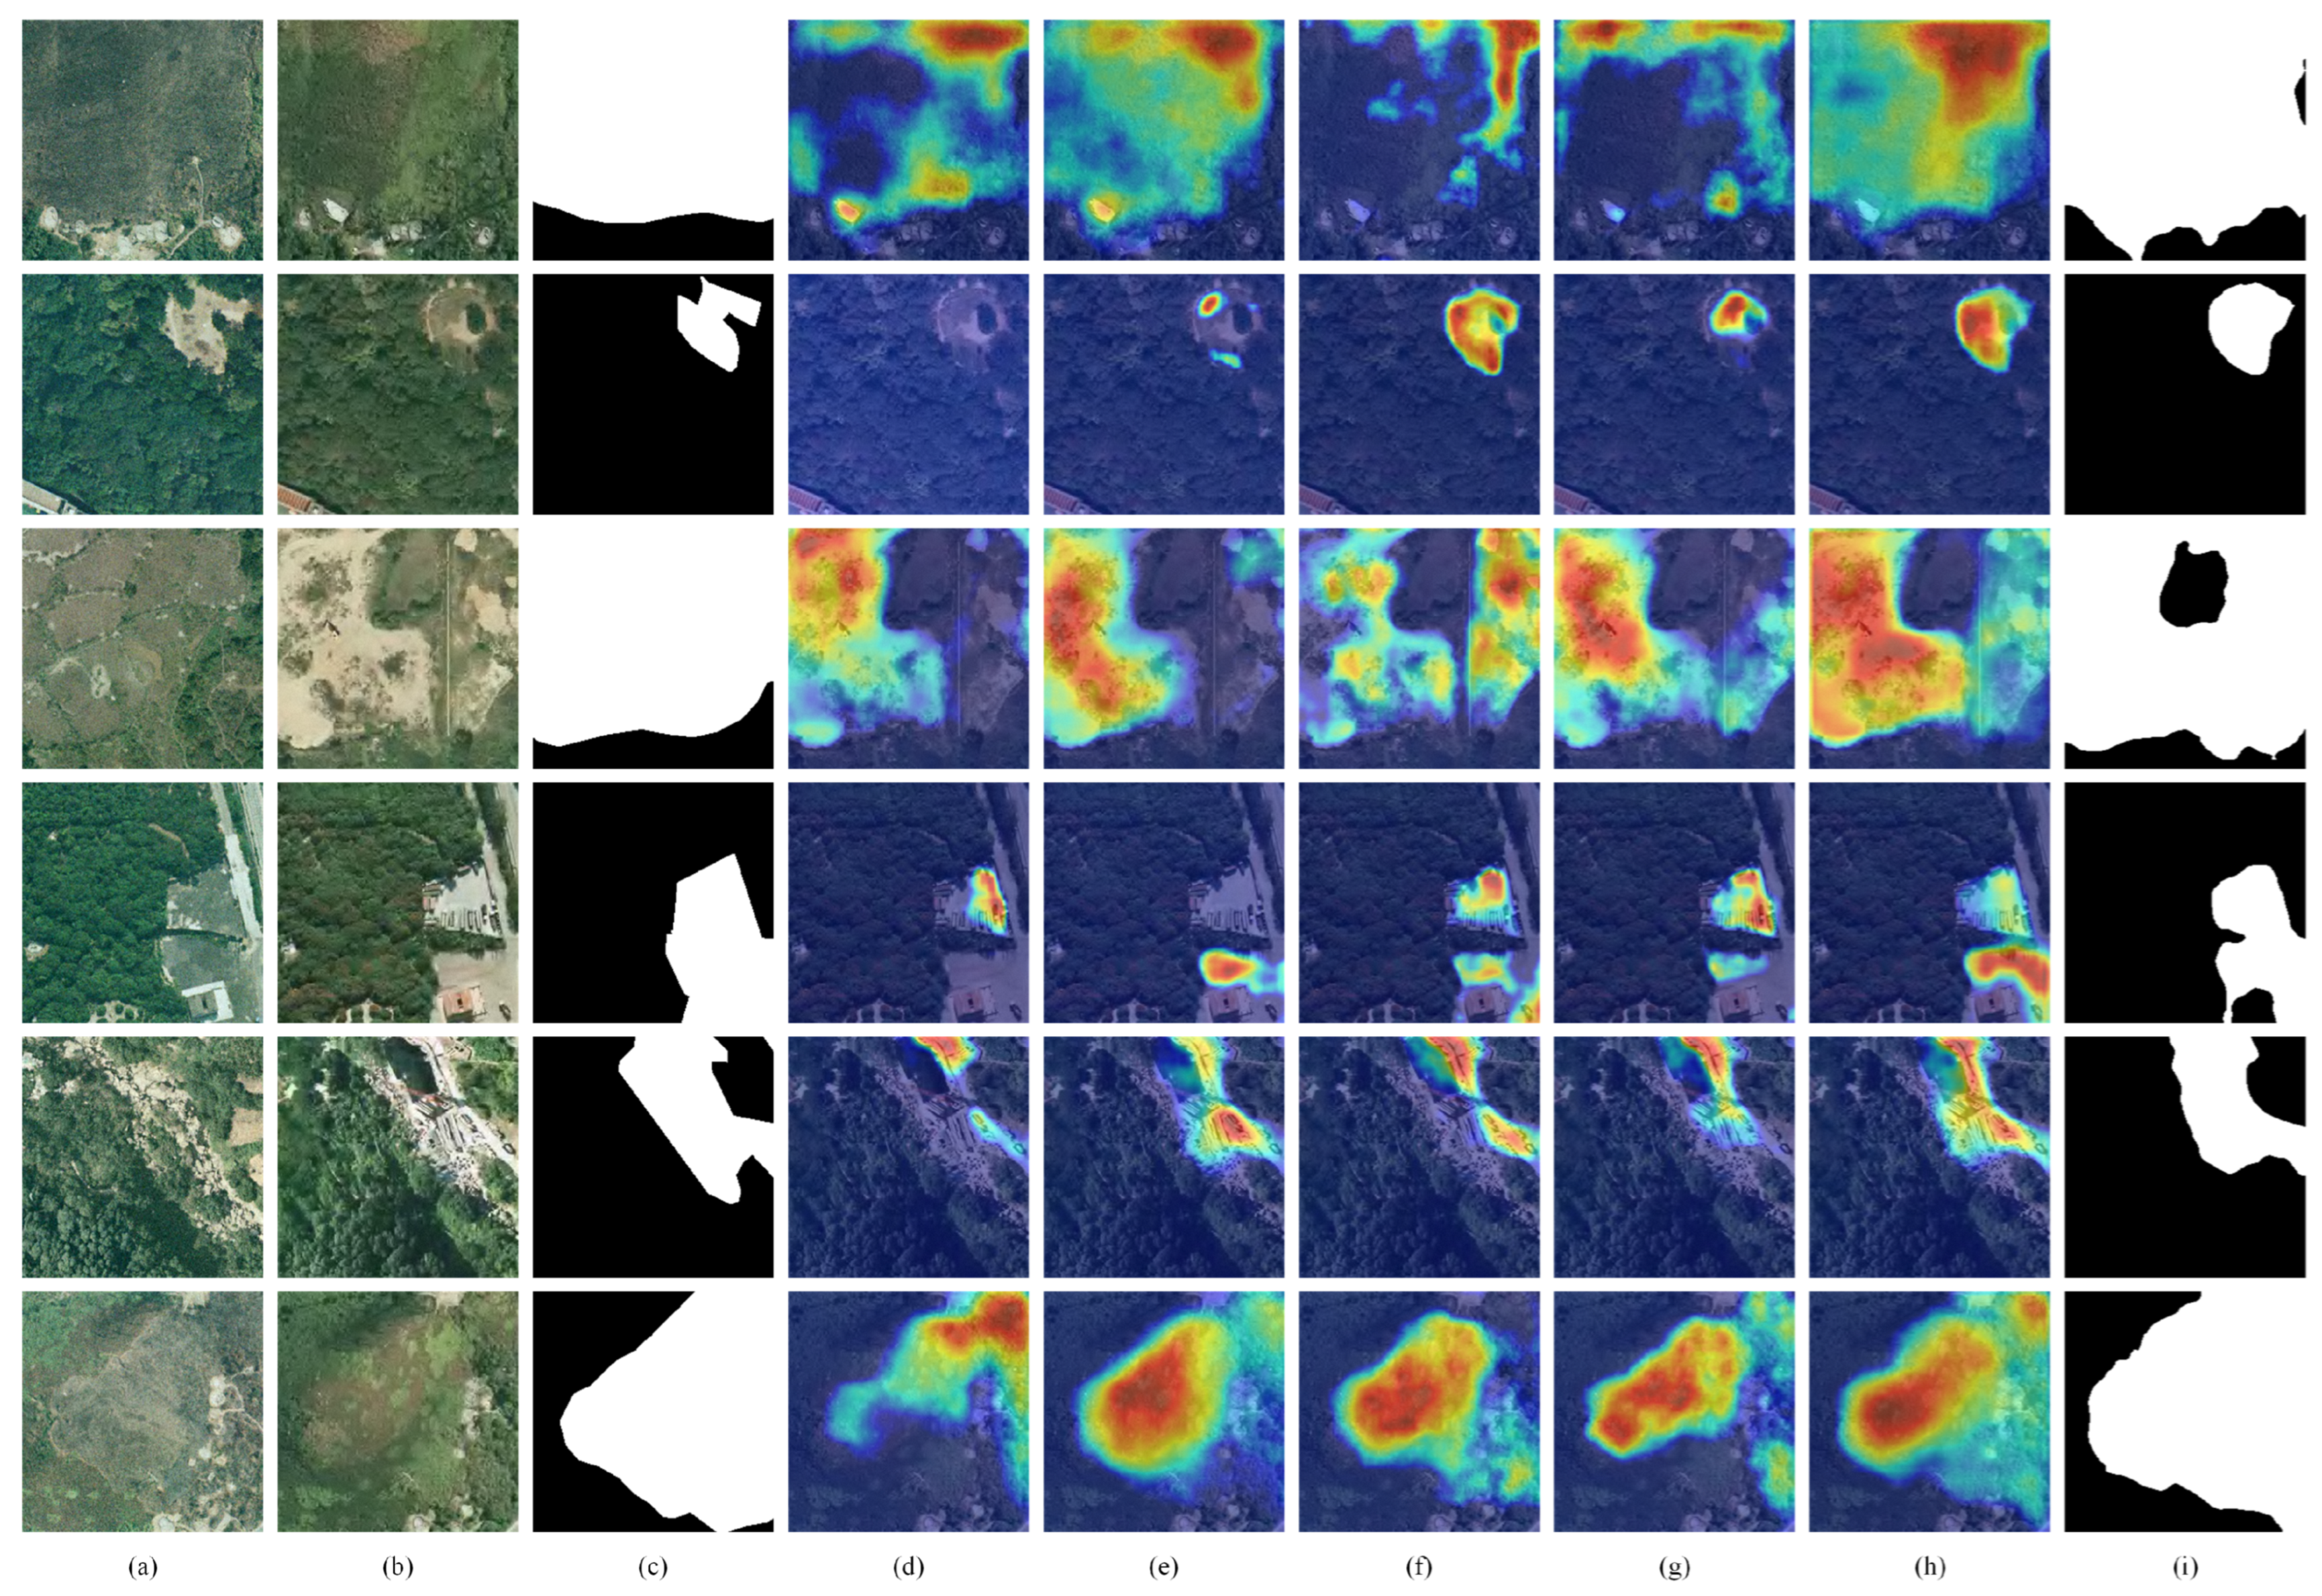
To further analyze the role of each component, we visualize feature responses using Grad-CAM, with representative examples shown in Figure 8. The visualizations suggest that the Fre branch and the SAM branch focus on different change-relevant patterns, supporting their complementarity. This complementarity is better exploited when the proposed AMD performs hierarchical, attention-guided fusion and refinement, enabling effective integration of the complementary information. Quantitatively, Figure 5c and Figure 5d show that replacing FPNHead with AMD improves BIoU by +1.21%, +3.37%, and +0.66% percentage points on SYSU-CD, JL1-CD, and CDD, respectively, and improves FCS by +9.02%, +8.23%, and +0.33% percentage points on the three datasets, leading to more spatially coherent predictions with sharper boundaries.

3.3. Computational Cost Comparison

To assess the computational cost of the proposed method, we further compare the number of parameters, FLOPs, and inference time of TriFusion-CD with representative baseline methods. As shown in Table 4, TriFusion-CD has 157.97 M parameters, 95.25 G FLOPs, and an inference time of 63.98 ms. Compared with representative non-foundation model-based change detection methods, TriFusion-CD has more parameters, higher FLOPs, and a longer inference time. Compared with foundation model-based methods, TriFusion-CD has fewer parameters and lower FLOPs than BAN, whose parameters and FLOPs are 232.40 M and 290.37 G, respectively. However, TriFusion-CD shows a longer inference time than BAN, ChangeCLIP, and EFI-SAM.
Overall, TriFusion-CD achieves stronger change detection performance at the cost of increased inference latency. Therefore, it is more suitable for accuracy-oriented remote sensing change detection scenarios where reliable change localization is prioritized. For applications involving real-time processing or large-scale image deployment, further lightweight designs are still necessary.

4. Discussion

Table 1 shows that TriFusion-CD achieves the best overall performance across all three benchmarks. These consistent gains indicate that the proposed fusion strategy remains effective under different scene types and change patterns. In the main benchmark comparison, TriFusion-CD also exhibits a more favorable precision–recall trade-off. Specifically, relative to strong baselines, it reduces missed change regions while keeping false detections under control, thereby improving IoU/F1 without being overly conservative.
Boundary and fragmentation evaluations provide additional evidence about mask quality. TriFusion-CD attains the highest Boundary IoU on SYSU-CD and JL1-CD and remains competitive on CDD. For fragmentation consistency, it ranks first on SYSU-CD, while its FCS on JL1-CD and CDD are lower than the best competing methods but still within a high range. In the ablation results, replacing the baseline decoder with AMD yields clear improvements in both BIoU and FCS across datasets, supporting the role of attention-guided multi-scale refinement in improving boundary alignment and spatial coherence.
The ablation study further clarifies the contribution of each component. Adding the frequency branch or the MobileSAM branch alone provides modest gains, while combining them leads to larger improvements, suggesting that the two branches contribute complementary information. The largest additional gain comes from introducing AMD on top of the combined setting, and the full model achieves the best performance on all three datasets in Table 2. Qualitative results also show that TriFusion-CD produces more coherent masks with clearer boundaries and fewer spurious detections in challenging scenes.
It is also worth noting that SYSU-CD contains several dataset-specific challenges, including noisy observations in the first-temporal image (T1), complex background variations, and intra-temporal similarity among different land-cover regions. These factors make the benchmark more difficult because noisy textures in T1 may introduce unreliable bi-temporal differences, while visually similar regions within the same temporal image can increase the risk of false alarms and missed detections. Nevertheless, TriFusion-CD achieves the best IoU, F1, OA, and Kappa on SYSU-CD. From the visual results in Figure 6, TriFusion-CD produces more coherent change regions and fewer obvious false-positive and false-negative responses in several challenging SYSU-CD samples. This observation suggests that the proposed fusion strategy is beneficial for improving robustness under noisy and highly similar intra-temporal appearances.
The results on CDD can be attributed to both the dataset characteristics and the complementary nature of different evaluation metrics. As shown in Table 2, the baseline already achieves 96.20% IoU and 98.06% F1 on CDD, leaving limited room for further improvement. Moreover, CDD mainly contains seasonal changes and relatively clear land-cover variations, such as urban construction, vegetation variation, and water-body changes, which can already be effectively captured by the baseline. In contrast, the frequency–text branch is more directly designed to suppress short-term appearance-induced pseudo-changes. Meanwhile, the CDD results also show that FCS and IoU/F1 reflect different aspects of prediction quality. Although Changer achieves the highest FCS on CDD, TriFusion-CD obtains the best IoU and F1 scores. This is because FCS measures the consistency between the predicted and ground-truth numbers of foreground connected components, whereas IoU and F1 mainly depend on pixel-level overlap. Therefore, small isolated components or slight splitting of changed regions may reduce FCS even when the main changed areas are accurately covered. This indicates that FCS should be interpreted as a complementary fragmentation consistency metric rather than a standalone measure of overall accuracy.
Although TriFusion-CD employs multiple feature extraction sources, the proposed framework is not a simple concatenation of heterogeneous features. To alleviate potential feature redundancy, the frequency branch decomposes CLIP features into high- and low-frequency components and further performs bidirectional cross-granularity interaction, so that structural details and semantic context are selectively exploited rather than repeatedly accumulated. In addition, the frequency-text representation is converted into multi-scale attention maps, which are used as spatial priors to modulate decoder features instead of being directly concatenated with all visual features.
The balance among different feature sources is controlled by several adaptive fusion mechanisms. In the CAE module, channel and spatial attention are used to aggregate subtraction-based, FPN-based, and cosine-similarity-based difference representations. In SAFM and FCI, learnable residual scaling parameters are introduced to adjust the strength of MobileSAM semantic guidance and textual semantic guidance, respectively. Moreover, AMD performs stage-specific attention modulation during top-down decoding, enabling the network to emphasize change-relevant regions while suppressing less informative responses.
We also acknowledge that using multiple encoders and a transformer-based decoder inevitably increases computational cost. Thus, the proposed method is more suitable for accuracy-oriented remote sensing change detection scenarios, while lightweight variants will be explored in future work.

5. Conclusions

This paper presents TriFusion-CD, a tri-branch remote sensing change detection framework that combines complementary sources of information to improve robustness under complex imaging variations. Specifically, the MobileSAM branch provides global semantic guidance to support spatially coherent localization, the CLIP branch extracts detail-sensitive change representations through change-aware enhancement, and the frequency branch introduces a frequency–text interaction to form an explicit structural–semantic prior for suppressing appearance-induced pseudo-changes. To effectively integrate these sources, the proposed Semantic Attention Fusion Module injects MobileSAM semantics into CLIP-based change features via attention-guided residual fusion, while the Attention-Modulated Decoder converts frequency–text guidance into multi-scale attention maps and performs progressive top-down refinement to enhance boundary delineation and intra-region consistency.
Overall, the proposed approach provides a unified framework for reliable change localization by integrating three complementary sources of information. Comparative experiments on public benchmark datasets demonstrate that TriFusion-CD achieves superior change detection performance, exhibiting clear advantages in preserving the integrity of the extracted change regions while effectively suppressing spurious changes. Future work will focus on extending the current formulation beyond binary localization toward semantic or open-vocabulary change understanding, and on developing more efficient variants to reduce computational overhead while preserving the complementarity among the three sources of guidance.

Author Contributions

Conceptualization, J.W. and Q.Y.; methodology, J.W. and R.Z.; software, J.W.; validation, J.W., Q.Y. and R.Z.; formal analysis, J.W.; investigation, J.W.; resources, J.W.; data curation, J.W. and N.X.; writing—original draft preparation, J.W.; writing—review and editing, J.W., Q.Y. and R.Z.; visualization, J.W. and N.X.; supervision, J.W. and Q.Y.; project administration, J.W. and Q.Y.; funding acquisition, Q.Y. All authors have read and agreed to the published version of the manuscript.

Funding

This work was supported in part by the Key Research and Development Program of Ningxia, China, under Grant 2026BEG02053; in part by the High-Level Talent Program (Natural Science) of North Minzu University under Grant 2025BG226; and in part by the Natural Science Foundation of Ningxia Province of China under Grant 2023AAC03818.

Data Availability Statement

The raw data supporting the conclusions of this article will be made available by the authors on request.

Conflicts of Interest

The authors declare no conflicts of interest.

References

  1. Kaur, G.; Afaq, Y. Developments in deep learning for change detection in remote sensing: A review. Trans. GIS 2024, 28, 223–257. [Google Scholar] [CrossRef]
  2. Peng, D.; Liu, M.; Zhang, Y.; Guan, H. Toward Label-Efficient Deep Learning Change Detection for Remote Sensing Imagery: A Comprehensive Review. Photogramm. Rec. 2025, 40, e70021. [Google Scholar] [CrossRef]
  3. Chen, J.; Hou, D.; He, C.; Liu, Y.; Guo, Y.; Yang, B. Change detection with cross-domain remote sensing images: A systematic review. IEEE J. Sel. Top. Appl. Earth Obs. Remote Sens. 2024, 17, 11563–11582. [Google Scholar] [CrossRef]
  4. Yang, B.; Qin, L.; Liu, J.; Liu, X. UTRNet: An unsupervised time-distance-guided convolutional recurrent network for change detection in irregularly collected images. IEEE Trans. Geosci. Remote Sens. 2022, 60, 4410516. [Google Scholar] [CrossRef]
  5. Cheng, G.; Huang, Y.; Li, X.; Lyu, S.; Xu, Z.; Zhao, H.; Zhao, Q.; Xiang, S. Change detection methods for remote sensing in the last decade: A comprehensive review. Remote Sens. 2024, 16, 2355. [Google Scholar] [CrossRef]
  6. Wei, J.; Sun, K.; Li, W.; Li, W.; Gao, S.; Miao, S.; Tan, Y.; Cui, W.; Duan, Y. Cross-visual style change detection for remote sensing images via representation consistency deep supervised learning. Remote Sens. 2025, 17, 798. [Google Scholar] [CrossRef]
  7. Li, W.; Ma, G.; Zhang, H.; Chen, P.; Wang, D.; Chen, R. Multi-scenario building change detection in remote sensing images using CNN-Mamba hybrid network and consistency enhancement learning. Expert Syst. Appl. 2025, 298, 129843. [Google Scholar] [CrossRef]
  8. Wei, J.; Sun, K.; Li, W.; Li, W.; Gao, S.; Miao, S.; Zhou, Q.; Liu, J. Robust change detection for remote sensing images based on temporospatial interactive attention module. Int. J. Appl. Earth Obs. Geoinf. 2024, 128, 103767. [Google Scholar] [CrossRef]
  9. Jiang, H.; Peng, M.; Zhong, Y.; Xie, H.; Hao, Z.; Lin, J.; Ma, X.; Hu, X. A survey on deep learning-based change detection from high-resolution remote sensing images. Remote Sens. 2022, 14, 1552. [Google Scholar] [CrossRef]
  10. Yu, C.; Yang, H.; Ma, L.; Yang, J.; Jin, Y.; Zhang, W.; Wang, K.; Zhao, Q. Deep learning-based change detection in remote sensing: A comprehensive review. IEEE J. Sel. Top. Appl. Earth Obs. Remote Sens. 2025, 18, 24415–24437. [Google Scholar] [CrossRef]
  11. Chen, H.; Qi, Z.; Shi, Z. Remote sensing image change detection with transformers. IEEE Trans. Geosci. Remote Sens. 2021, 60, 5607514. [Google Scholar] [CrossRef]
  12. Jiang, M.; Chen, Y.; Dong, Z.; Liu, X.; Zhang, X.; Zhang, H. Multiscale fusion CNN-transformer network for high-resolution remote sensing image change detection. IEEE J. Sel. Top. Appl. Earth Obs. Remote Sens. 2024, 17, 5280–5293. [Google Scholar] [CrossRef]
  13. Yang, J.; Wan, H.; Shang, Z. Enhanced hybrid CNN and transformer network for remote sensing image change detection. Sci. Rep. 2025, 15, 10161. [Google Scholar] [CrossRef] [PubMed]
  14. Chen, H.; Song, J.; Han, C.; Xia, J.; Yokoya, N. ChangeMamba: Remote sensing change detection with spatiotemporal state space model. IEEE Trans. Geosci. Remote Sens. 2024, 62, 4409720. [Google Scholar] [CrossRef]
  15. Zhu, X.X.; Xiong, Z.; Wang, Y.; Stewart, A.J.; Heidler, K.; Wang, Y.; Yuan, Z.; Dujardin, T.; Xu, Q.; Shi, Y. On the foundations of Earth foundation models. Commun. Earth Environ. 2026, 7, 103. [Google Scholar] [CrossRef]
  16. Huo, C.; Chen, K.; Zhang, S.; Wang, Z.; Yan, H.; Shen, J.; Hong, Y.; Qi, G.; Fang, H.; Wang, Z. When remote sensing meets foundation model: A survey and beyond. Remote Sens. 2025, 17, 179. [Google Scholar] [CrossRef]
  17. Ding, L.; Hong, D.; Zhao, M.; Chen, H.; Li, C.; Deng, J.; Yokoya, N.; Bruzzone, L.; Chanussot, J. A survey of sample-efficient deep learning for change detection in remote sensing: Tasks, strategies, and challenges. IEEE Geosci. Remote Sens. Mag. 2025, 13, 164–189. [Google Scholar] [CrossRef]
  18. Daudt, R.C.; Le Saux, B.; Boulch, A. Fully convolutional siamese networks for change detection. In 2018 25th IEEE International Conference on Image Processing (ICIP); IEEE: Piscataway, NJ, USA, 2018; pp. 4063–4067. [Google Scholar]
  19. Zhang, C.; Yue, P.; Tapete, D.; Jiang, L.; Shangguan, B.; Huang, L.; Liu, G. A deeply supervised image fusion network for change detection in high resolution bi-temporal remote sensing images. ISPRS J. Photogramm. Remote Sens. 2020, 166, 183–200. [Google Scholar] [CrossRef]
  20. Bandara, W.G.C.; Patel, V.M. A transformer-based siamese network for change detection. In IGARSS 2022—2022 IEEE International Geoscience and Remote Sensing Symposium; IEEE: Piscataway, NJ, USA, 2022; pp. 207–210. [Google Scholar]
  21. Zhu, Z.; Xu, M.; Bai, S.; Huang, T.; Bai, X. Asymmetric non-local neural networks for semantic segmentation. In Proceedings of the IEEE/CVF International Conference on Computer Vision; IEEE: Piscataway, NJ, USA, 2019; pp. 593–602. [Google Scholar]
  22. Vaswani, A.; Shazeer, N.; Parmar, N.; Uszkoreit, J.; Jones, L.; Gomez, A.N.; Kaiser, Ł.; Polosukhin, I. Attention is all you need. In Advances in Neural Information Processing Systems; Curran Associates, Inc.: Red Hook, NY, USA, 2017; Volume 30. [Google Scholar]
  23. Liu, Z.; Lin, Y.; Cao, Y.; Hu, H.; Wei, Y.; Zhang, Z.; Lin, S.; Guo, B. Swin transformer: Hierarchical vision transformer using shifted windows. In Proceedings of the IEEE/CVF International Conference on Computer Vision; IEEE: Piscataway, NJ, USA, 2021; pp. 10012–10022. [Google Scholar]
  24. Zhang, H.; Chen, K.; Liu, C.; Chen, H.; Zou, Z.; Shi, Z. CDMamba: Incorporating local clues into mamba for remote sensing image binary change detection. IEEE Trans. Geosci. Remote Sens. 2025, 63, 4405016. [Google Scholar] [CrossRef]
  25. Hou, X.; Bai, Y.; Xie, Y.; Li, Y.; Shang, C.; Shen, Q. Language-Guided Change Detection for high-resolution remote sensing imagery with limited labelled data. Knowl.-Based Syst. 2025, 326, 113994. [Google Scholar] [CrossRef]
  26. Radford, A.; Kim, J.W.; Hallacy, C.; Ramesh, A.; Goh, G.; Agarwal, S.; Sastry, G.; Askell, A.; Mishkin, P.; Clark, J.; et al. Learning transferable visual models from natural language supervision. In International Conference on Machine Learning; PmLR: New York, NY, USA, 2021; pp. 8748–8763. [Google Scholar]
  27. Kirillov, A.; Mintun, E.; Ravi, N.; Mao, H.; Rolland, C.; Gustafson, L.; Xiao, T.; Whitehead, S.; Berg, A.C.; Lo, W.Y.; et al. Segment anything. In Proceedings of the IEEE/CVF International Conference on Computer Vision; IEEE: Piscataway, NJ, USA, 2023; pp. 4015–4026. [Google Scholar]
  28. Ji, W.; Li, J.; Bi, Q.; Liu, T.; Li, W.; Cheng, L. Segment anything is not always perfect: An investigation of sam on different real-world applications. Mach. Intell. Res. 2024, 21, 617–630. [Google Scholar] [CrossRef]
  29. Mendieta, M.; Han, B.; Shi, X.; Zhu, Y.; Chen, C. Towards geospatial foundation models via continual pretraining. In Proceedings of the IEEE/CVF International Conference on Computer Vision; IEEE: Piscataway, NJ, USA, 2023; pp. 16806–16816. [Google Scholar]
  30. Hong, D.; Zhang, B.; Li, X.; Li, Y.; Li, C.; Yao, J.; Yokoya, N.; Li, H.; Ghamisi, P.; Jia, X.; et al. SpectralGPT: Spectral remote sensing foundation model. IEEE Trans. Pattern Anal. Mach. Intell. 2024, 46, 5227–5244. [Google Scholar] [CrossRef]
  31. Guo, X.; Lao, J.; Dang, B.; Zhang, Y.; Yu, L.; Ru, L.; Zhong, L.; Huang, Z.; Wu, K.; Hu, D.; et al. Skysense: A multi-modal remote sensing foundation model towards universal interpretation for earth observation imagery. In Proceedings of the IEEE/CVF Conference on Computer Vision and Pattern Recognition; IEEE: Piscataway, NJ, USA, 2024; pp. 27672–27683. [Google Scholar]
  32. Vemulapalli, R.; Pouransari, H.; Faghri, F.; Mehta, S.; Farajtabar, M.; Rastegari, M.; Tuzel, O. Knowledge Transfer from Vision Foundation Models for Efficient Training of Small Task-specific Models. In International Conference on Machine Learning; PmLR: New York, NY, USA, 2024; pp. 49345–49367. [Google Scholar]
  33. Tan, Y.; Zhang, E.; Li, Y.; Huang, S.L.; Zhang, X.P. Transferability-guided cross-domain cross-task transfer learning. IEEE Trans. Neural Netw. Learn. Syst. 2024, 36, 2423–2436. [Google Scholar] [CrossRef]
  34. Hu, S.; Bian, Y.; Chen, B.; Song, H.; Zhang, K. Language-Guided Semantic Clustering for Remote Sensing Change Detection. Sensors 2024, 24, 7887. [Google Scholar] [CrossRef] [PubMed]
  35. Huang, J.; Bao, J.; Xia, M.; Yuan, X. SAM-based efficient feature integration network for remote sensing change detection: A case study on Macao sea reclamation. IEEE J. Sel. Top. Appl. Earth Obs. Remote Sens. 2025, 18, 16916–16928. [Google Scholar] [CrossRef]
  36. Wu, Z.; Zan, L.; Chen, Z.; Cai, M.; Li, Y.; Wang, Z.; Xie, J.; Shi, X. A Remote Sensing Image Change Detection Network with Feature Constraints From a Visual Foundation Model. IEEE J. Sel. Top. Appl. Earth Obs. Remote Sens. 2025, 18, 28939–28956. [Google Scholar] [CrossRef]
  37. Qin, Y.; Wang, C.; Fan, Y.; Pan, C. SAM2-CD: Remote sensing image change detection with SAM2. IEEE J. Sel. Top. Appl. Earth Obs. Remote Sens. 2025, 18, 24575–24587. [Google Scholar] [CrossRef]
  38. Li, K.; Cao, X.; Meng, D. A new learning paradigm for foundation model-based remote-sensing change detection. IEEE Trans. Geosci. Remote Sens. 2024, 62, 5610112. [Google Scholar] [CrossRef]
  39. Dong, S.; Wang, L.; Du, B.; Meng, X. ChangeCLIP: Remote sensing change detection with multimodal vision-language representation learning. ISPRS J. Photogramm. Remote Sens. 2024, 208, 53–69. [Google Scholar] [CrossRef]
  40. Ding, L.; Zhu, K.; Peng, D.; Tang, H.; Yang, K.; Bruzzone, L. Adapting segment anything model for change detection in VHR remote sensing images. IEEE Trans. Geosci. Remote Sens. 2024, 62, 5611711. [Google Scholar] [CrossRef]
  41. Zhang, C.; Han, D.; Qiao, Y.; Kim, J.U.; Bae, S.H.; Lee, S.; Hong, C.S. Faster segment anything: Towards lightweight sam for mobile applications. arXiv 2023, arXiv:2306.14289. [Google Scholar] [CrossRef]
  42. Chen, Y.; Fan, H.; Xu, B.; Yan, Z.; Kalantidis, Y.; Rohrbach, M.; Yan, S.; Feng, J. Drop an octave: Reducing spatial redundancy in convolutional neural networks with octave convolution. In Proceedings of the IEEE/CVF International Conference on Computer Vision; IEEE: Piscataway, NJ, USA, 2019; pp. 3435–3444. [Google Scholar]
  43. Strudel, R.; Garcia, R.; Laptev, I.; Schmid, C. Segmenter: Transformer for semantic segmentation. In Proceedings of the IEEE/CVF International Conference on Computer Vision; IEEE: Piscataway, NJ, USA, 2021; pp. 7262–7272. [Google Scholar]
  44. Jiang, W.; Sun, Y.; Lei, L.; Kuang, G.; Ji, K. AdaptVFMs-RSCD: Advancing Remote Sensing Change Detection from binary to semantic with SAM and CLIP. ISPRS J. Photogramm. Remote Sens. 2025, 230, 304–317. [Google Scholar] [CrossRef]
  45. Mei, L.; Ye, Z.; Xu, C.; Wang, H.; Wang, Y.; Lei, C.; Yang, W.; Li, Y. SCD-SAM: Adapting segment anything model for semantic change detection in remote sensing imagery. IEEE Trans. Geosci. Remote Sens. 2024, 62, 5626713. [Google Scholar] [CrossRef]
  46. Lu, Y.; Huang, Q. Drst-net: A dual-branch feature fusion network combining resnet50 and swin transformer for welding light strip recognition. Appl. Sci. 2025, 15, 2016. [Google Scholar] [CrossRef]
  47. He, K.; Zhang, X.; Ren, S.; Sun, J. Deep residual learning for image recognition. In Proceedings of the IEEE Conference on Computer Vision and Pattern Recognition; IEEE: Piscataway, NJ, USA, 2016; pp. 770–778. [Google Scholar]
  48. Hu, E.J.; Shen, Y.; Wallis, P.; Allen-Zhu, Z.; Li, Y.; Wang, S.; Wang, L.; Chen, W. LoRA: Low-Rank Adaptation of Large Language Models. In Proceedings of the International Conference on Learning Representations, Virtual, 25–29 April 2022. [Google Scholar]
  49. Shan, Z.; Liu, Y.; Zhou, L.; Yan, C.; Wang, H.; Xie, X. Ros-sam: High-quality interactive segmentation for remote sensing moving object. In Proceedings of the Computer Vision and Pattern Recognition Conference; IEEE: Piscataway, NJ, USA, 2025; pp. 3625–3635. [Google Scholar]
  50. Ji, D.; Wang, H.; Tao, M.; Huang, J.; Hua, X.S.; Lu, H. Structural and statistical texture knowledge distillation for semantic segmentation. In Proceedings of the IEEE/CVF Conference on Computer Vision and Pattern Recognition; IEEE: Piscataway, NJ, USA, 2022; pp. 16876–16885. [Google Scholar]
  51. Zhu, L.; Ji, D.; Zhu, S.; Gan, W.; Wu, W.; Yan, J. Learning statistical texture for semantic segmentation. In Proceedings of the IEEE/CVF Conference on Computer Vision and Pattern Recognition; IEEE: Piscataway, NJ, USA, 2021; pp. 12537–12546. [Google Scholar]
  52. Tan, X.; Chen, G.; Zhang, X.; Wang, T.; Wang, J.; Wang, K.; Miao, T. TripleS: Mitigating multi-task learning conflicts for semantic change detection in high-resolution remote sensing imagery. ISPRS J. Photogramm. Remote Sens. 2025, 230, 374–401. [Google Scholar] [CrossRef]
  53. Hou, X.; Bai, Y.; Li, Y.; Shang, C.; Shen, Q. High-resolution triplet network with dynamic multiscale feature for change detection on satellite images. ISPRS J. Photogramm. Remote Sens. 2021, 177, 103–115. [Google Scholar] [CrossRef]
  54. Woo, S.; Park, J.; Lee, J.Y.; Kweon, I.S. Cbam: Convolutional block attention module. In Proceedings of the European Conference on Computer Vision (ECCV); Springer: Berlin/Heidelberg, Germany, 2018; pp. 3–19. [Google Scholar]
  55. Ma, J.; Xie, G.S.; Zhao, F.; Li, Z. AFANet: Adaptive frequency-aware network for weakly-supervised few-shot semantic segmentation. IEEE Trans. Multimed. 2025, 27, 4018–4028. [Google Scholar] [CrossRef]
  56. Tang, Z.; Niu, X.; Rong, L.; Zhang, Y.; Bi, Y.; Ru, N.; Li, L.; Chai, N.; Zhou, T. Frequency-enhanced contextual conversion network for esophageal lesion segmentation. Pattern Recognit. 2025, 171, 112235. [Google Scholar] [CrossRef]
  57. Cong, R.; Sun, M.; Zhang, S.; Zhou, X.; Zhang, W.; Zhao, Y. Frequency perception network for camouflaged object detection. In Proceedings of the 31st ACM International Conference on Multimedia; Association for Computing Machinery: New York, NY, USA, 2023; pp. 1179–1189. [Google Scholar]
  58. Shi, Q.; Liu, M.; Li, S.; Liu, X.; Wang, F.; Zhang, L. A deeply supervised attention metric-based network and an open aerial image dataset for remote sensing change detection. IEEE Trans. Geosci. Remote Sens. 2021, 60, 5604816. [Google Scholar] [CrossRef]
  59. Liu, Z.; Zhu, R.; Gao, L.; Zhou, Y.; Ma, J.; Gu, Y. JL1-CD: A new benchmark for remote sensing change detection and a robust multi-teacher knowledge distillation framework. arXiv 2025, arXiv:2502.13407. [Google Scholar] [CrossRef]
  60. Lebedev, M.; Vizilter, Y.V.; Vygolov, O.; Knyaz, V.A.; Rubis, A.Y. Change detection in remote sensing images using conditional adversarial networks. Int. Arch. Photogramm. Remote Sens. Spat. Inf. Sci. 2018, 42, 565–571. [Google Scholar] [CrossRef]
  61. Fang, S.; Li, K.; Shao, J.; Li, Z. SNUNet-CD: A densely connected Siamese network for change detection of VHR images. IEEE Geosci. Remote Sens. Lett. 2021, 19, 8007805. [Google Scholar] [CrossRef]
  62. Codegoni, A.; Lombardi, G.; Ferrari, A. TINYCD: A (not so) deep learning model for change detection. Neural Comput. Appl. 2023, 35, 8471–8486. [Google Scholar] [CrossRef]
  63. Fang, S.; Li, K.; Li, Z. Changer: Feature interaction is what you need for change detection. IEEE Trans. Geosci. Remote Sens. 2023, 61, 5610111. [Google Scholar] [CrossRef]
  64. Cai, B.; Song, Y. Spatial-Temporal Feature Interaction and Multiscale Frequency-domain Fusion Network for Remote Sensing Change Detection. IEEE J. Sel. Top. Appl. Earth Obs. Remote Sens. 2025, 18, 25640–25653. [Google Scholar] [CrossRef]
  65. Cheng, B.; Girshick, R.; Dollár, P.; Berg, A.C.; Kirillov, A. Boundary IoU: Improving object-centric image segmentation evaluation. In Proceedings of the IEEE/CVF Conference on Computer Vision and Pattern Recognition; IEEE: Piscataway, NJ, USA, 2021; pp. 15334–15342. [Google Scholar]
Figure 1. Overview of the proposed TriFusion-CD.
Remotesensing 18 01572 g001
Figure 2. Overview of the Frequency-Text Enhanced Attention Map Prediction Module.
Remotesensing 18 01572 g002
Figure 3. Overview of the Attention-Modulated Decoder.
Remotesensing 18 01572 g003
Figure 4. Illustration of fragmentation consistency. The black pixels represent changed areas, the white pixels represent unchanged areas, and the gray dashed contours denote the ground-truth boundary. (a) Ground-truth change mask. (b) Prediction with a single connected change region. (c) Prediction with multiple disconnected fragments.
Remotesensing 18 01572 g004
Figure 5. Boundary quality and fragmentation consistency evaluation on SYSU-CD, JL1-CD, and CDD using Boundary IoU (BIoU, %) and fragmentation consistency score (FCS, %). A: FC-EF; B: IFN; C: SNUNet-CD; D: BIT; E: ChangeFormer; F: TinyCD; G: Changer; H: BAN; I: ChangeCLIP; J: EFI-SAM; K: TriFusion-CD; L: Baseline; M: Baseline + Fre; N: Baseline + SAM; O: Baseline + SAM + Fre; P: Baseline + SAM + Fre + AMD (TriFusion-CD). (a) BIoU for A–K on the three datasets. (b) FCS for A–K on the three datasets. (c) BIoU for L–P on the three datasets. (d) FCS for L–P on the three datasets.
Remotesensing 18 01572 g005
Figure 6. Visualization results of different methods on the SYSU-CD dataset. (a) ImgA; (b) ImgB; (c) Label; (d) FC-EF; (e) IFN; (f) SNUNet-CD; (g) BIT; (h) ChangeFormer; (i) TinyCD; (j) Changer; (k) BAN; (l) ChangeCLIP; (m) EFI-SAM; (n) TriFusion-CD. True positives (TPs) are represented by white pixels, while true negatives (TNs) are black. False positives (FPs) are red and false negatives (FNs) are blue.
Remotesensing 18 01572 g006
Figure 7. Visualization results of different methods on the JL1-CD dataset. (a) ImgA; (b) ImgB; (c) Label; (d) FC-EF; (e) IFN; (f) SNUNet-CD; (g) BIT; (h) ChangeFormer; (i) TinyCD; (j) Changer; (k) BAN; (l) ChangeCLIP; (m) EFI-SAM; (n) TriFusion-CD. True positives (TPs) are represented by white pixels, while true negatives (TNs) are black. False positives (FPs) are red and false negatives (FNs) are blue.
Remotesensing 18 01572 g007
Figure 8. Visual presentation of the ablation study results on the SYSU-CD dataset. (a) ImgA; (b) ImgB; (c) Label; (d) Baseline; (e) Baseline + Fre; (f) Baseline + SAM; (g) Baseline + SAM + Fre; (h) Baseline + SAM + Fre + AMD (TriFusion-CD); (i) TriFusion-CD results.
Remotesensing 18 01572 g008
Table 1. Comparison results on the CD test sets. The best results are highlighted in bold. All scores are reported as percentages (%).
MethodSYSU-CD
OA/IoU/F1/Prec/Rec/Kappa
JL1-CD
OA/IoU/F1/Prec/Rec/Kappa
CDD
OA/IoU/F1/Prec/Rec/Kappa
FC-EF88.24/56.83/72.48/80.89/65.64/65.1092.84/27.45/43.08/84.80/28.87/40.2393.99/55.21/71.14/87.26/60.05/67.91
IFN91.19/67.90/80.88/82.80/79.05/75.1695.69/60.97/75.76/80.38/71.64/73.4098.73/90.14/94.81/95.85/93.80/94.09
SNUNet-CD90.53/66.15/79.63/80.81/78.48/73.4695.59/60.04/75.03/80.16/70.52/72.6299.15/93.26/96.51/97.28/95.76/96.03
BIT88.54/62.07/76.60/73.88/79.52/69.0395.45/59.18/74.35/78.97/70.25/71.8798.72/90.11/94.80/94.81/94.79/94.07
ChangeFormer91.47/68.03/80.98/85.46/76.94/75.5096.20/65.44/79.11/81.78/76.61/77.0299.35/94.85/97.36/97.61/97.11/96.99
TinyCD89.80/65.04/78.82/77.25/80.46/72.1195.11/56.59/72.28/77.32/67.86/69.6198.91/91.49/95.56/95.85/95.27/94.93
Changer91.55/68.24/81.12/85.73/76.98/75.7095.42/59.33/74.48/78.14/71.14/71.9799.16/93.42/96.60/96.89/96.30/96.12
BAN92.02/69.54/82.03/87.43/77.27/76.9396.06/63.68/77.81/82.53/73.60/75.6599.30/94.44/97.14/97.65/96.63/96.74
ChangeCLIP92.24/71.02/83.06/85.64/80.62/78.0395.95/64.32/78.29/78.85/77.73/76.0699.50/95.86/97.89/97.70/98.08/97.60
EFI-SAM91.64/69.33/81.89/83.70/80.16/76.4695.81/64.44/78.38/76.04/80.86/76.0697.99/86.12/92.54/89.00/96.37/91.38
TriFusion-CD92.52/72.48/84.04/84.59/83.51/79.1696.21/66.04/79.54/80.64/78.48/77.4699.57/96.41/98.17/97.97/98.38/97.93
Table 2. Ablation study results on the CD test sets. All scores are reported as percentages (%). Baseline denotes the CLIP branch with FPNHead, Fre denotes the frequency branch, SAM denotes the MobileSAM branch, and TriFusion-CD refers to the full configuration consisting of Baseline, Fre, SAM, and AMD.
MethodSYSU-CD
OA/IoU/F1/Prec/Rec
JL1-CD
OA/IoU/F1/Prec/Rec
CDD
OA/IoU/F1/Prec/Rec
Baseline91.80/70.23/82.51/83.03/82.0095.78/62.58/76.98/78.83/75.2299.54/96.20/98.06/97.99/98.14
Baseline + Fre92.23/70.76/82.87/86.25/79.7595.55/63.01/77.31/74.14/80.7599.54/96.21/98.07/97.97/98.17
Baseline + SAM92.00/70.46/82.67/84.55/80.8795.82/63.43/77.63/77.97/77.2999.55/96.25/98.09/97.99/98.19
Baseline + SAM + Fre92.32/71.14/83.13/86.27/80.2296.00/64.14/78.16/80.21/76.2099.55/96.22/98.08/97.96/98.19
Baseline + SAM + Fre + AMD92.52/72.48/84.04/84.59/83.5196.21/66.04/79.54/80.64/78.4899.57/96.41/98.17/97.97/98.38
Table 3. Fine-grained module-level ablation study of key submodules on the CD test sets. W/O represents the network without the corresponding specific module. All scores are reported as percentages (%).
MethodSYSU-CD
OA/IoU/F1/Prec/Rec
JL1-CD
OA/IoU/F1/Prec/Rec
W/O SAFM92.21/70.73/82.86/86.15/79.8196.22/65.45/79.12/82.21/76.25
W/O BCIM92.14/70.91/82.98/84.81/81.2296.06/65.54/79.18/78.57/79.81
W/O FCI92.28/71.47/83.36/84.80/81.9796.24/65.73/79.32/82.06/76.76
TriFusion-CD92.52/72.48/84.04/84.59/83.5196.21/66.04/79.54/80.64/78.48
Table 4. Comparison of computational complexity and inference time of different methods. Params, FLOPs, and inference time are measured under the same input setting.
MethodParams (M)FLOPs (G)Inference Time (ms)
FC-EF1.353.242.09
IFN36.0078.987.62
SNUNet-CD3.0111.736.78
BIT2.998.758.70
ChangeFormer3.852.4610.44
TinyCD0.291.456.17
Changer11.395.966.36
BAN232.40290.3735.06
ChangeCLIP117.5441.4729.59
EFI-SAM5.846.1737.14
TriFusion-CD157.9795.2563.98
Disclaimer/Publisher’s Note: The statements, opinions and data contained in all publications are solely those of the individual author(s) and contributor(s) and not of MDPI and/or the editor(s). MDPI and/or the editor(s) disclaim responsibility for any injury to people or property resulting from any ideas, methods, instructions or products referred to in the content.