Article

Comparative Assessment of YUNYAO and COSMIC-2 Radio Occultation Bending-Angle Observations

1
State Key Laboratory of Climate System Prediction and Risk Management (CPRM), Institute of Climate Application Research (ICAR), Nanjing University of Information Science and Technology, Nanjing 210044, China
2
School of Atmospheric Sciences, Nanjing University of Information Science and Technology, Nanjing 210044, China
3
School of Artificial Intelligence, Nanjing University of Information Science and Technology, Nanjing 210044, China
4
Tianjin Yunyao Aerospace Technology Co., Ltd., Tianjin 300350, China
5
CMA Earth System Modeling and Prediction Centre (CEMC), China Meteorological Administration, Beijing 100081, China
*
Author to whom correspondence should be addressed.
These authors contributed equally to this work and should be regarded as co-first authors.
Remote Sens. 2026, 18(10), 1566; https://doi.org/10.3390/rs18101566
Submission received: 3 April 2026 / Revised: 9 May 2026 / Accepted: 11 May 2026 / Published: 14 May 2026
(This article belongs to the Section Atmospheric Remote Sensing)

Highlights

What are the main findings?
  • YUNYAO provides near-global coverage with a significantly higher observation density compared to COSMIC-2.
  • Within their overlap region, the bending-angle quality of YUNYAO is broadly comparable to that of COSMIC-2; however, when horizontally averaged, YUNYAO exhibits a smaller relative bias than COSMIC-2 below 30 km.
What are the implications of the main findings?
  • YUNYAO’s near-global and denser coverage fills key gaps in COSMIC-2 sampling, demonstrating its significant potential as a robust data source for numerical weather prediction (NWP).
  • The smaller relative bias of YUNYAO bending-angle observations below 30 km suggests potential for enhanced accuracy when assimilated into NWP systems.

Abstract

GNSS radio occultation (RO) measurements are essential to global Earth observation systems. The YUNYAO constellation offers dense global coverage, high vertical resolution, and all-sky capabilities. This study proposes an improved bending-angle observation operator and presents a comprehensive evaluation of YUNYAO’s bending-angle observations against those from COSMIC-2 for December 2024. Our results indicate that YUNYAO achieves near-global coverage and provides substantially more observations than COSMIC-2. Within their region of overlap, the bending-angle quality of YUNYAO is broadly comparable to that of COSMIC-2, though YUNYAO shows a more pronounced negative relative bias above 30 km. In the vertical profile obtained by horizontally averaging the relative bias, YUNYAO exhibits a smaller bias than COSMIC-2 below 30 km. For both RO constellations, bending angles retrieved from Galileo signals exhibit a smaller relative bias than those retrieved from GLONASS in the upper atmosphere. Finally, performance differences are also evident among YUNYAO’s individual receivers.

1. Introduction

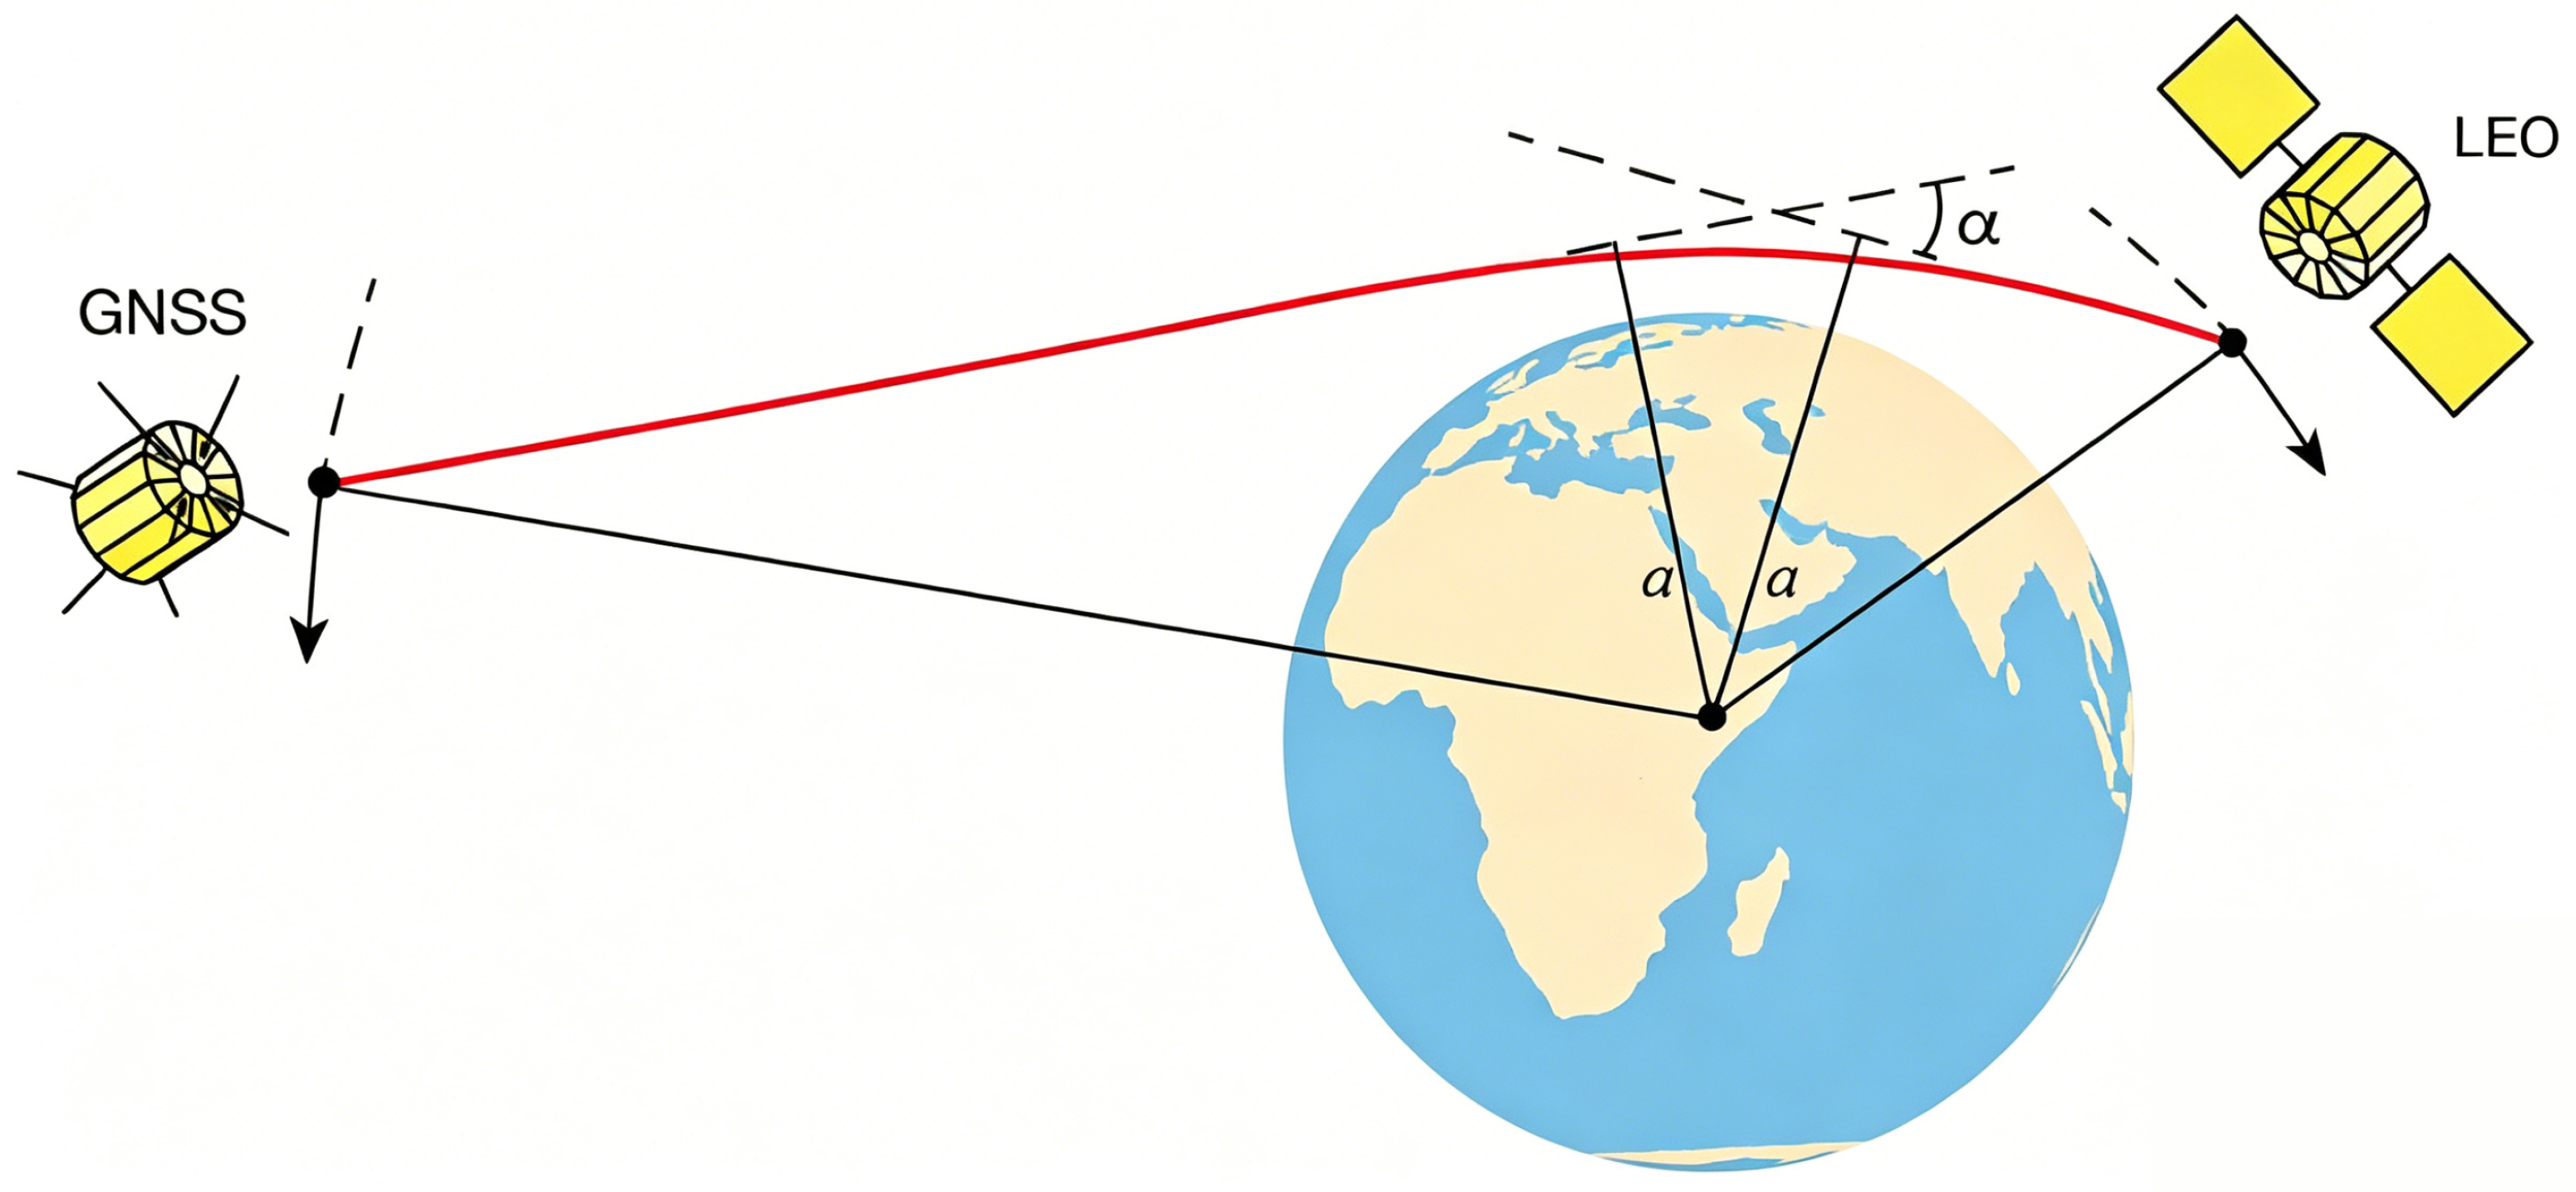
The remote sensing technique that combines GNSS and radio occultation (RO) has become an essential component of the modern Earth Observation System (EOS), and has been extensively applied to meteorology, climatology, and environmental surveillance [1]. The GNSS RO remote sensing is based on the refraction phenomenon when radio waves pass through the non-uniform atmospheric medium. As shown in Figure 1, satellites in the low earth orbit (LEO) receive the radio signals emitted from GNSS satellites. The ray path is deflected owing to the spatially varying refractivity when the radio passes obliquely through the atmospheric medium with a vertical gradient [2,3]. This provides the basis for retrieving the vertical profile of atmospheric parameters. The high-sensitivity receiver on board the LEO satellite accurately measures the phase delay and Doppler frequency shift which are used to obtain the bending angle of the ray. Based on the assumption of spherical symmetry of the atmosphere, the vertical profile of the atmospheric refractivity can be retrieved from the bending angle profile via the Abel integral transform. Furthermore, the key thermal parameters such as temperature, pressure, and water vapor pressure can be derived [4,5].
One key advance of the modern GNSS RO remote sensing is the application of dual-band measurements. By simultaneously receiving signals from two different frequencies (L1 + L2 or L1 + L5), the ionosphere delay can be effectively eliminated or significantly mitigated by the linear combination using the dispersion characteristics of ionosphere, therefore the accuracy and robustness of retrieved atmospheric parameters are improved substantially [6]. The GNSS RO remote sensing features (1) high accuracy: unlike passive observations, radio occultation’s geometric phase delay measurements require no bias correction for direct assimilation; (2) high vertical resolution: its vertical resolution can reach 100 m and is superior to most passive remote sensing techniques; (3) global coverage: oceanic, polar, and desert regions where conventional observations are scarce can be covered; (4) all-sky observability: the attenuation induced by cloud, rain, and aerosol is negligible; (5) low cost: leverages existing GNSS satellites as signal sources [7]. In general, the quality of GNSS RO observations approximates that of sounding, but the number and coverage of the former far exceed those of the latter.
Launched in 2006, the Constellation Observing System for Meteorology, Ionosphere, and Climate (COSMIC) mission aimed to improve weather forecasting, monitor climate change, and study space weather by deploying six microsatellites that used GPS radio occultation to provide global, high-accuracy atmospheric profiles [8]. The COSMIC-2 RO receiver satellites were launched in June 2019 to replace the COSMIC constellation. The Tri-GNSS Radio Occultation System (TGRS) receivers onboard COSMIC-2 satellites can track the radio signals from GPS, GLONASS, and Galileo satellites. Their higher signal-to-noise ratio results in more than 85% of all soundings penetrating below the 1-km height, compared to 80% of all COSMIC soundings based on an initial assessment [9]. The six COSMIC-2 satellites with 24 orbital inclination provide dense RO soundings over tropics and subtropics to strengthen the monitoring and forecast of tropical weather systems such as typhoon [10]. The approximately 5000 daily RO profiles from COSMIC-2 are assimilated into numerical weather prediction (NWP) models to improve their forecasts. Notably, the assimilation of these observations leads to improved analysis over the tropics and a reduction in hurricane track errors [10].
In recent years, the rise of commercial aerospace has injected new momentum into the GNSS RO field. The commercial CubeSat constellation developed by Spire Global features: (1) the capability to receive signals from all four major GNSS constellations; (2) the use of nanosatellites to enable low-cost, high-density observations; and (3) rapid hardware iteration to facilitate compatibility with emerging GNSS systems. Previous studies have shown that assimilating Spire RO observations can improve global NWP forecast skill and Spire RO satellites complement both other RO missions and passive sounders [11]. Ref. [12] assesses the accuracy of the Tianmu-1 ocean surface wind and land soil moisture products and demonstrates the mission’s utility for monitoring tropical cyclones. The assimilation of Tianmu-1 refractivity observations substantially reduces the track error of Typhoon Gaemi (2024) by improving the storm’s inner-core thermal structure and the large-scale steering flow [13]. YUNYAO is a commercial GNSS RO mission developed by Yunyao Aerospace. As of April 2026, 47 lightweight satellites (18 of which are used in this study) compatible with all four major GNSS constellations have been launched into the YUNYAO constellation, making it the largest commercial RO constellation in China. YUNYAO produces tens of thousands of profiles daily and provides near-global, all-weather, high-vertical-resolution observations [14]. Xu et al. [15] evaluated YUNYAO refractivity against European Centre for Medium-Range Weather Forecasts (ECMWF) Reanalysis v5 (ERA5) using only eight satellites, without comparing bending angles to other RO missions. A comprehensive assessment of YUNYAO bending angles, including global coverage, geographic and vertical bias relative to COSMIC-2, and performance across GNSS signals, is still lacking. This study fills this gap by thoroughly comparing YUNYAO bending angles against those from COSMIC-2, detailing spatial coverage, bias characteristics, and error sources using data from 18 YUNYAO LEO satellites.

2. Data and Methods

2.1. GNSS RO Observations and GFS Analysis

Table 1 presents a summary of the YUNYAO and COSMIC-2 RO profile data used in this study. The YUNYAO RO data are obtained from Tianjin Yunyao Aerospace Technology Co., Ltd., Tianjin, China (https://www.tjyyspace.com/dataserve, accessed on 10 May 2026), while the COSMIC-2 RO data are freely available from the COSMIC Data Analysis and Archive Center (CDAAC; https://www.cosmic.ucar.edu/, accessed on 10 May 2026). To eliminate or reduce the impact of background field errors, National Centers for Environmental Prediction (NCEP) Global Forecast System (GFS) analysis fields are used in this study. The GFS analysis incorporates satellite, radar, and in-situ observations through the GDAS (Global Data Assimilation System). It is available every six hours (at Coordinated Universal Time (UTC) 00:00, 06:00, 12:00, and 18:00) and can be downloaded from Amazon Web Services (AWS) (https://registry.opendata.aws/noaa-gfs-bdp-pds, accessed on 10 May 2026). The GFS employs a quasi-uniform cubed-sphere mesh with a horizontal resolution of approximately 13 km and has 127 vertical levels up to 1 Pa (about 80 km), which is essential for the bending angle observation operator that requires the background to extend to a great height.

2.2. Bending Angle Observation Operator

The observation operator maps the state variables (background) from model space to observation space. This enables a direct comparison between the simulated observation and the actual observation, thereby measuring the discrepancy between the simulation and the observation. The bending angle is the primary retrieval from the raw GNSS RO observations and is sensitive to the large gradient of water vapor in the lower troposphere. Assuming spherical symmetry, the refractivity is the retrieval from the bending angle by the Abel integral transform which can introduce additional errors. Thus, the bending angle is closer to the raw observation than the refractivity. Refractivity assimilation exhibits degraded performance over the tropical regions [16] and produces negative bias under super-refraction conditions [17]. The 1D observation operator of the bending angle assumes spherical symmetry, that is the refractivity varies only with height, and transforms the refractivity profile to the bending angle by the Abel integral using only the vertical atmospheric profile at the tangent point [18].
The bending angle [7]
α = 2 a r 0 d ln n d r d r ( n r ) 2 a 2 = x : = n r 2 a a d ln n d x d x x 2 a 2 ln   n 10 6 N 2 a × 10 6 a d N d x d x x 2 a 2
where n = 1 + 10 6 N is refractive index, N is the refractivity, r is the distance between the center of symmetry and a point on the ray path, x is the refractional radius, and x 0 = n r 0 = a is the impact parameter. Note that the last equation in (1) uses this approximation ln n = ln ( 1 + 10 6 N ) 10 6 N since ln ( 1 + y ) y if y 1 .
Using a variable transform x : = a 2 + s 2 to avoid the singularity associated with a zero denominator in (1) when x = a , the integral in (1) is approximated using the trapezoidal rule by [17] as follows
α = 2 a × 10 6 a d N d x d x x 2 a 2 = x : = a 2 + s 2 2 a × 10 6 0 d N d x s d s x = 2 a × 10 6 d N d x s 0 1 x 0 + 2 i = 1 d N d x s i 1 x i Δ s 2 2 a × 10 6 d N d x s 0 1 x 0 + 2 i = 1 n s d N d x s i 1 x i Δ s 2
where Δ s and n s are the grid spacing and number of grid points of the s grid, respectively; and s i = Δ s × i where i = 0 , , n s . By assuming d N d x s i = 0 when i > n s , the infinite sum in the above quadrature is truncated.
The refractivity N can be approximated assuming a CO2 concentration of 0.0375% [19]:
N = 77.6890 × p T 6.3938 × e T + 3.75463 × 10 5 × e T 2
where p is the total pressure in hPa, T is the temperature in K, e is the water vapor pressure in hPa. This study uses (3) to calculate the refractivity N and then uses the modified Akima piecewise cubic interpolation in Section 2.2.1 and the Gauss-Legendre quadrature in Section 2.2.2 to compute the bending angle α .

2.2.1. Modified Akima Piecewise Cubic Interpolation

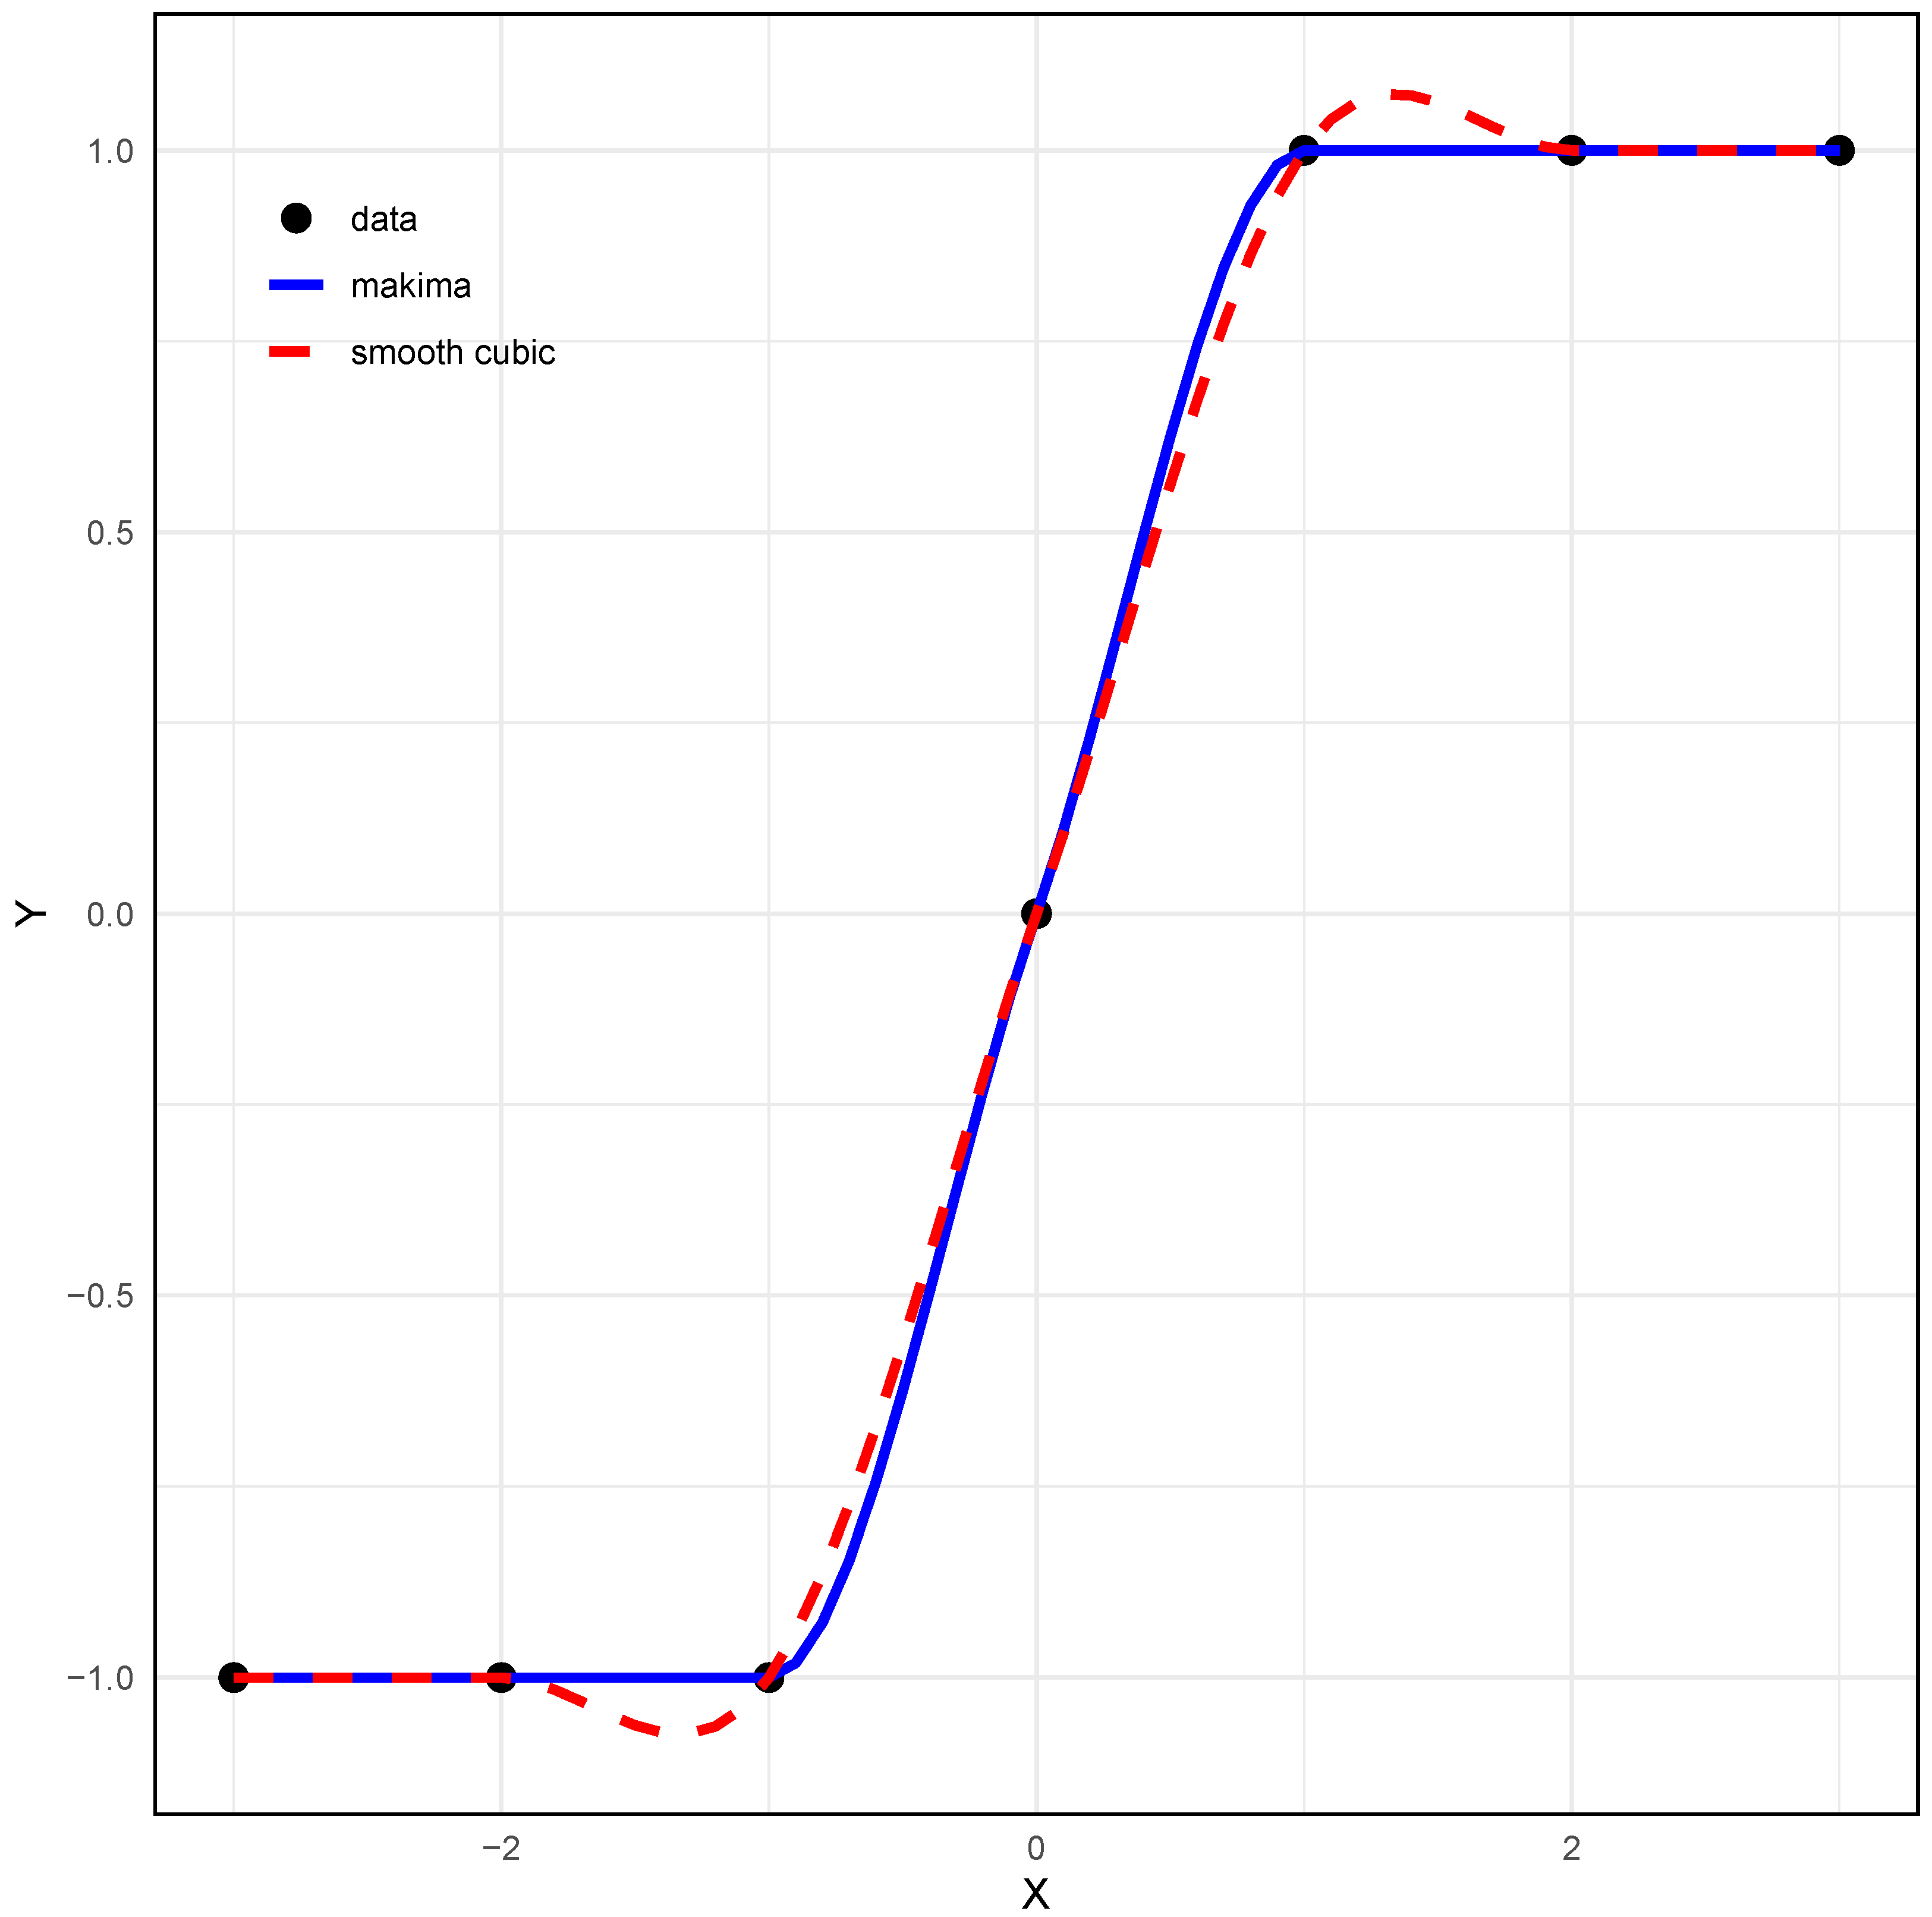
The smooth cubic interpolation is used by [17] to fit the refractivity N to find the derivative d N d x by assuming N varies smoothly. The refractivity N usually varies smoothly, but this may not be true in the lower troposphere where the water vapor might vary sharply, especially over tropical region. Figure 2 shows that the smooth cubic interpolation produces overshoots and undershoots near the sharp jump.
This study adopts this modified Akima piecewise cubic interpolation to calculate the derivative d N d x . For each interval [ x i , x i + 1 ) where i = 1 , , m 1 and m is the number of grid points, the piecewise cubic interpolation finds a cubic polynomial which not only passes the points ( x i , y i ) and ( x i + 1 , y i + 1 ) ; but also has specific derivatives d i and d i + 1 at x i and x i + 1 , respectively. Let δ i = y i + 1 y i x i + 1 x i be the slope of the interval [ x i , x i + 1 ) . Akima [20] proposed the derivative at x i as
d i = | δ i + 1 δ i | δ i 1 + | δ i 1 δ i 2 | δ i | δ i + 1 δ i | + | δ i 1 δ i 2 | = w 1 w 1 + w 2 δ i 1 + w 2 w 1 + w 2 δ i
where w 1 = | δ i + 1 δ i | and w 2 = | δ i 1 δ i 2 | . When both δ i + 1 = δ i and δ i 1 = δ i 2 in which case both numerator and denominator are zero, the derivative is calculated as d i = δ i 1 + δ i 2 . The derivatives at the end points need the slopes beyond the end points which are extrapolated as
δ 0 = 2 δ 1 δ 2 δ 1 = 2 δ 0 δ 1 δ m = 2 δ m 1 δ m 2 δ m + 1 = 2 δ m δ m 1 .
Cleve Moler and his colleague Cosmin Ionita [21] improved the Akima’s method by defining the weights as
w 1 = | δ i + 1 δ i | + | δ i + 1 + δ i | 2 w 2 = | δ i 1 δ i 2 | + | δ i 1 + δ i 2 | 2
with d i = 0 if w 1 + w 2 = 0 which indicates y i 2 = y i 1 = y i = y i + 1 = y i + 2 . The Akima piecewise cubic interpolation with this modified weights is called the modified Akima piecewise cubic interpolation (Makima).
Thus, the cubic polynomial and the derivative in the interval [ x i , x i + 1 ) are
y = p 0 + p 1 ( x x i ) + p 2 ( x x i ) 2 + p 3 ( x x i ) 3 d y d x = p 1 + 2 p 2 ( x x i ) + 3 p 3 ( x x i ) 2
where
p 0 = y i p 1 = d i p 2 = 3 δ i 2 d i d i + 1 x i + 1 x i p 3 = d i + d i + 1 2 δ i ( x i + 1 x i ) 2

2.2.2. Gauss-Legendre Quadrature

The computation of the bending angle requires a priori estimate (background) of model states extending to a great height where the background may exhibit substantial uncertainties. As mentioned before, the water vapor in the lower troposphere especially over tropical region might vary sharply. The Gauss-Legendre quadrature [22] has finer grids near two ends to take into account these situations and might yield more accurate computation of the bending angle.
The Gauss-Legendre quadrature for the integral
x 0 x 1 f ( x ) d x = x : = x 1 x 0 2 y + x 0 + x 1 2 x 1 x 0 2 1 1 f x 1 x 0 2 y + x 0 + x 1 2 d y = x 1 x 0 2 i = 1 m w i f x 1 x 0 2 y i + x 0 + x 1 2
is exact for polynomials of degree 2 m 1 where the abscissas y i and the associated weights w i are the roots and derivatives of the Legendre polynomial P m ( y ) , respectively. Application of the Gauss-Legendre quadrature to the second equation in (2) yields
α = 2 a × 10 6 0 d N d x s d s x 2 a × 10 6 0 s 1 d N d x s d s x 2 a × 10 6 s 1 2 i = 1 m w i d N d x 1 x s = s 1 2 y i + s 1 2 , x = a 2 + s 2
where s 1 = 800,000 in this study.

2.3. Quality Control

The quality control algorithm used in this study is based on the one employed in the Gridpoint Statistical Interpolation (GSI; [23]) system for the identification and rejection of poor observations:
1.
super-refraction: if the background vertical gradient of refractivity below 5 km exceeds 0.5 × 157 N-unit/km near the observation and the observed bending angle is larger than 0.03 radians, or exceeds 0.75 × 157 N-unit/km near the observation and the observation is inside or close to the background super-refraction; the observation is rejected.
2.
gross check: if the observation altitude is higher than 55 km or beyond the background altitude range, the background d N d x > 0 , the background bending angle exceeds 0.05 radians, or the innovation α o α b exceeds five times the observation error, the observation is rejected.
3.
relative innovation threshold: if the relative innovation α o α b α o exceeds 0.02 times the corresponding cutoff value in Table 2, the observation is rejected.

2.4. Evaluation Metrics

To quantitatively compare the bending angle between YUNYAO RO and COSMIC-2 RO, the following metrics are used in this study:
Bias 
is the difference between the observed bending angle and the simulated bending angle by the observation operator. The bias is usually called Observation Minus Background (OMB) in the data assimilation community. The mean and standard deviation of the bias within a box are
μ b = 1 L i = 1 L α i o α i b σ b = 1 L 1 i = 1 L α i o α i b μ b 2
where i is the index of the observation, α i o is the observed bending angle, and α i b is the simulated bending angle, and L is the number of observation within a box.
Relative bias 
is the ratio between the bias and the corresponding simulated bending angle.
The mean and standard deviation of the relative bias in percent within a box are
μ r b = 1 L i = 1 L α i o α i b α i b × 100 σ r b = 1 L 1 i = 1 L α i o α i b α i b × 100 μ r b 2 .

3. Results

3.1. Horizontal Observational Coverage

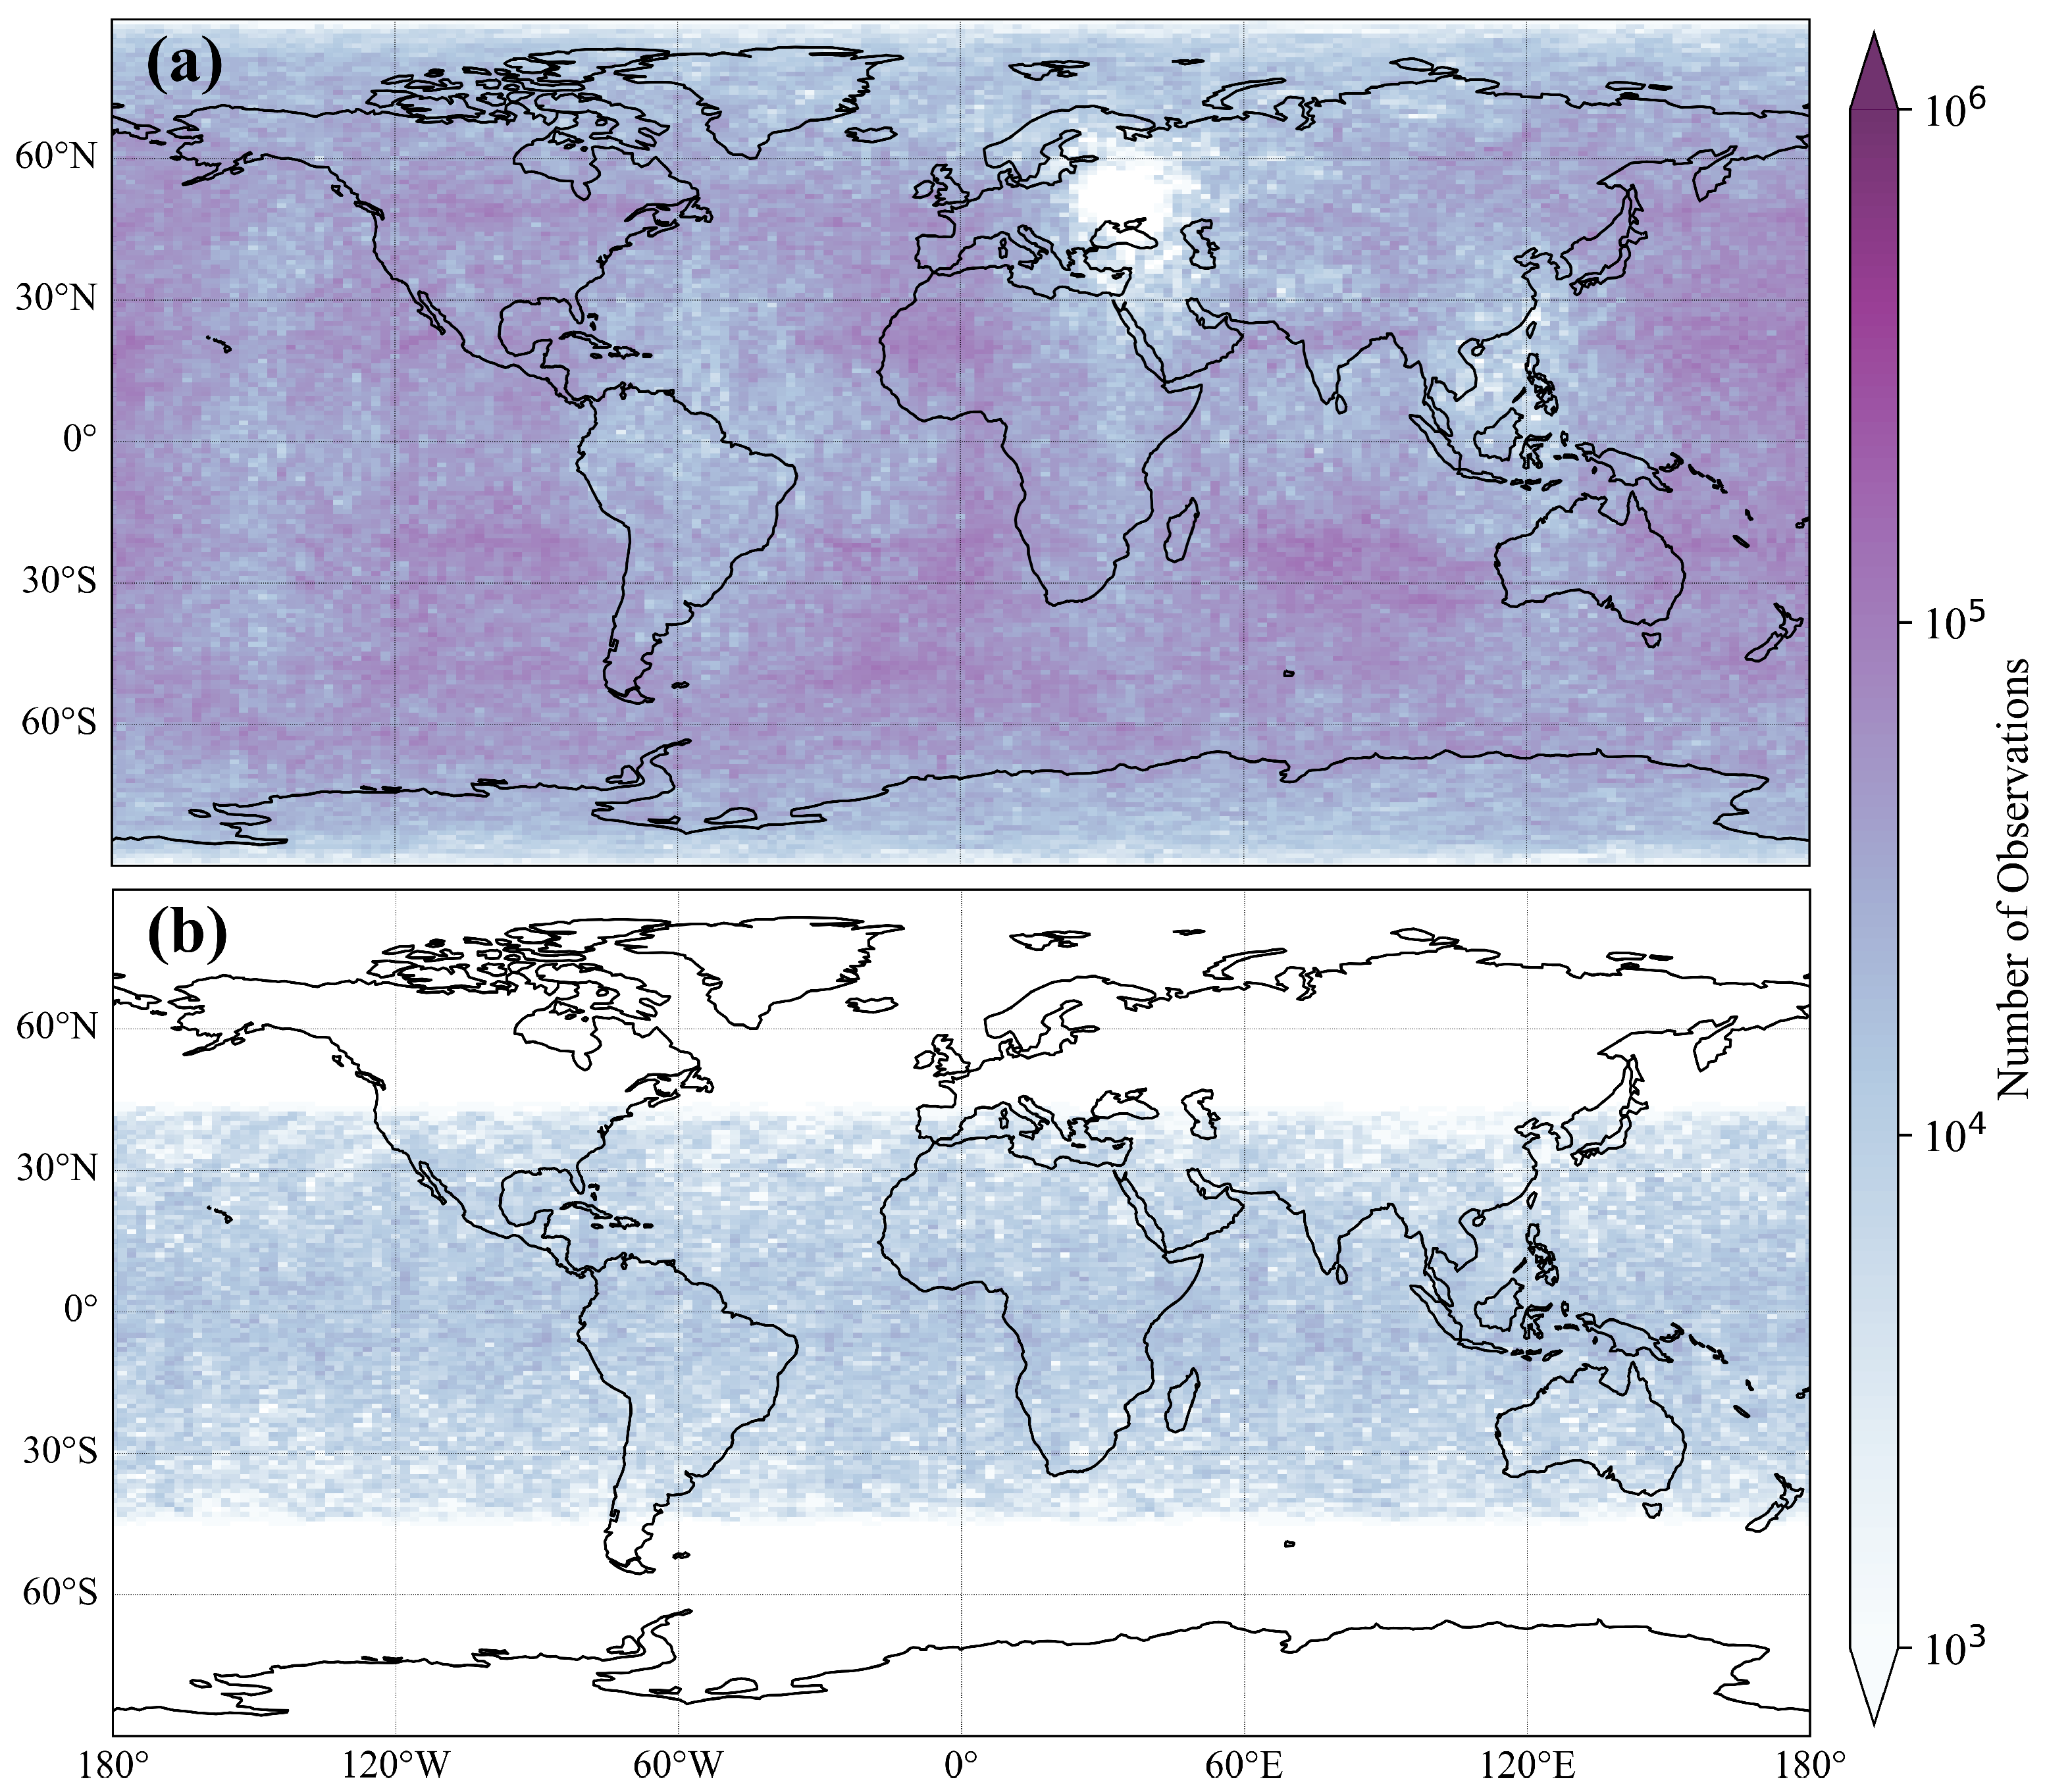
The YUNYAO constellation produces about 25,178 daily profiles, whereas COSMIC-2 produces about 5687 daily profiles—roughly three times fewer, consistent with YUNYAO having three times as many satellites. In addition, each YUNYAO profile contains more observations than each COSMIC-2 profile. Figure 3 shows the global distribution of the number of observations (after quality control) within each 1 × 2 (latitude × longitude) grid box for the YUNYAO and COSMIC-2 constellations in December 2024.
With 18 LEO satellites, the YUNYAO constellation provides dense global observations. The number of observations per box mostly exceeds 10 4 . However, YUNYAO observations are not uniformly distributed. Two regions exhibit relatively sparse coverage: Southeast Asia, followed by South America and the adjacent South Atlantic Ocean. The complete absence of observations over Eastern Europe is due to the disruption of GNSS RO signals caused by the war in Ukraine. The sparse coverage in Southeast Asia and South America can be attributed to different factors. YUNYAO satellites rely primarily on ground stations located within China; specific onboard operations are required before entering the visibility airspace of these ground stations and during data transmission, which temporarily reduces observation counts. This predominantly explains the sparse observations over Southeast Asia. In contrast, ionospheric scintillation may be the primary cause of sparse observations over South America. According to Nguyen et al. [24], South America accounts for 22.6% of total ionospheric irregularities.
By contrast, the COSMIC-2 constellation consists of six LEO satellites in a 24 inclination orbit, covering tropical and subtropical regions from 45°S to 45°N [25]. COSMIC-2 observations are denser near the equator than at higher latitudes and, interestingly, are more uniform, lacking the distinct sparse regions observed for YUNYAO over Southeast Asia and South America.

3.2. Bias Characteristics

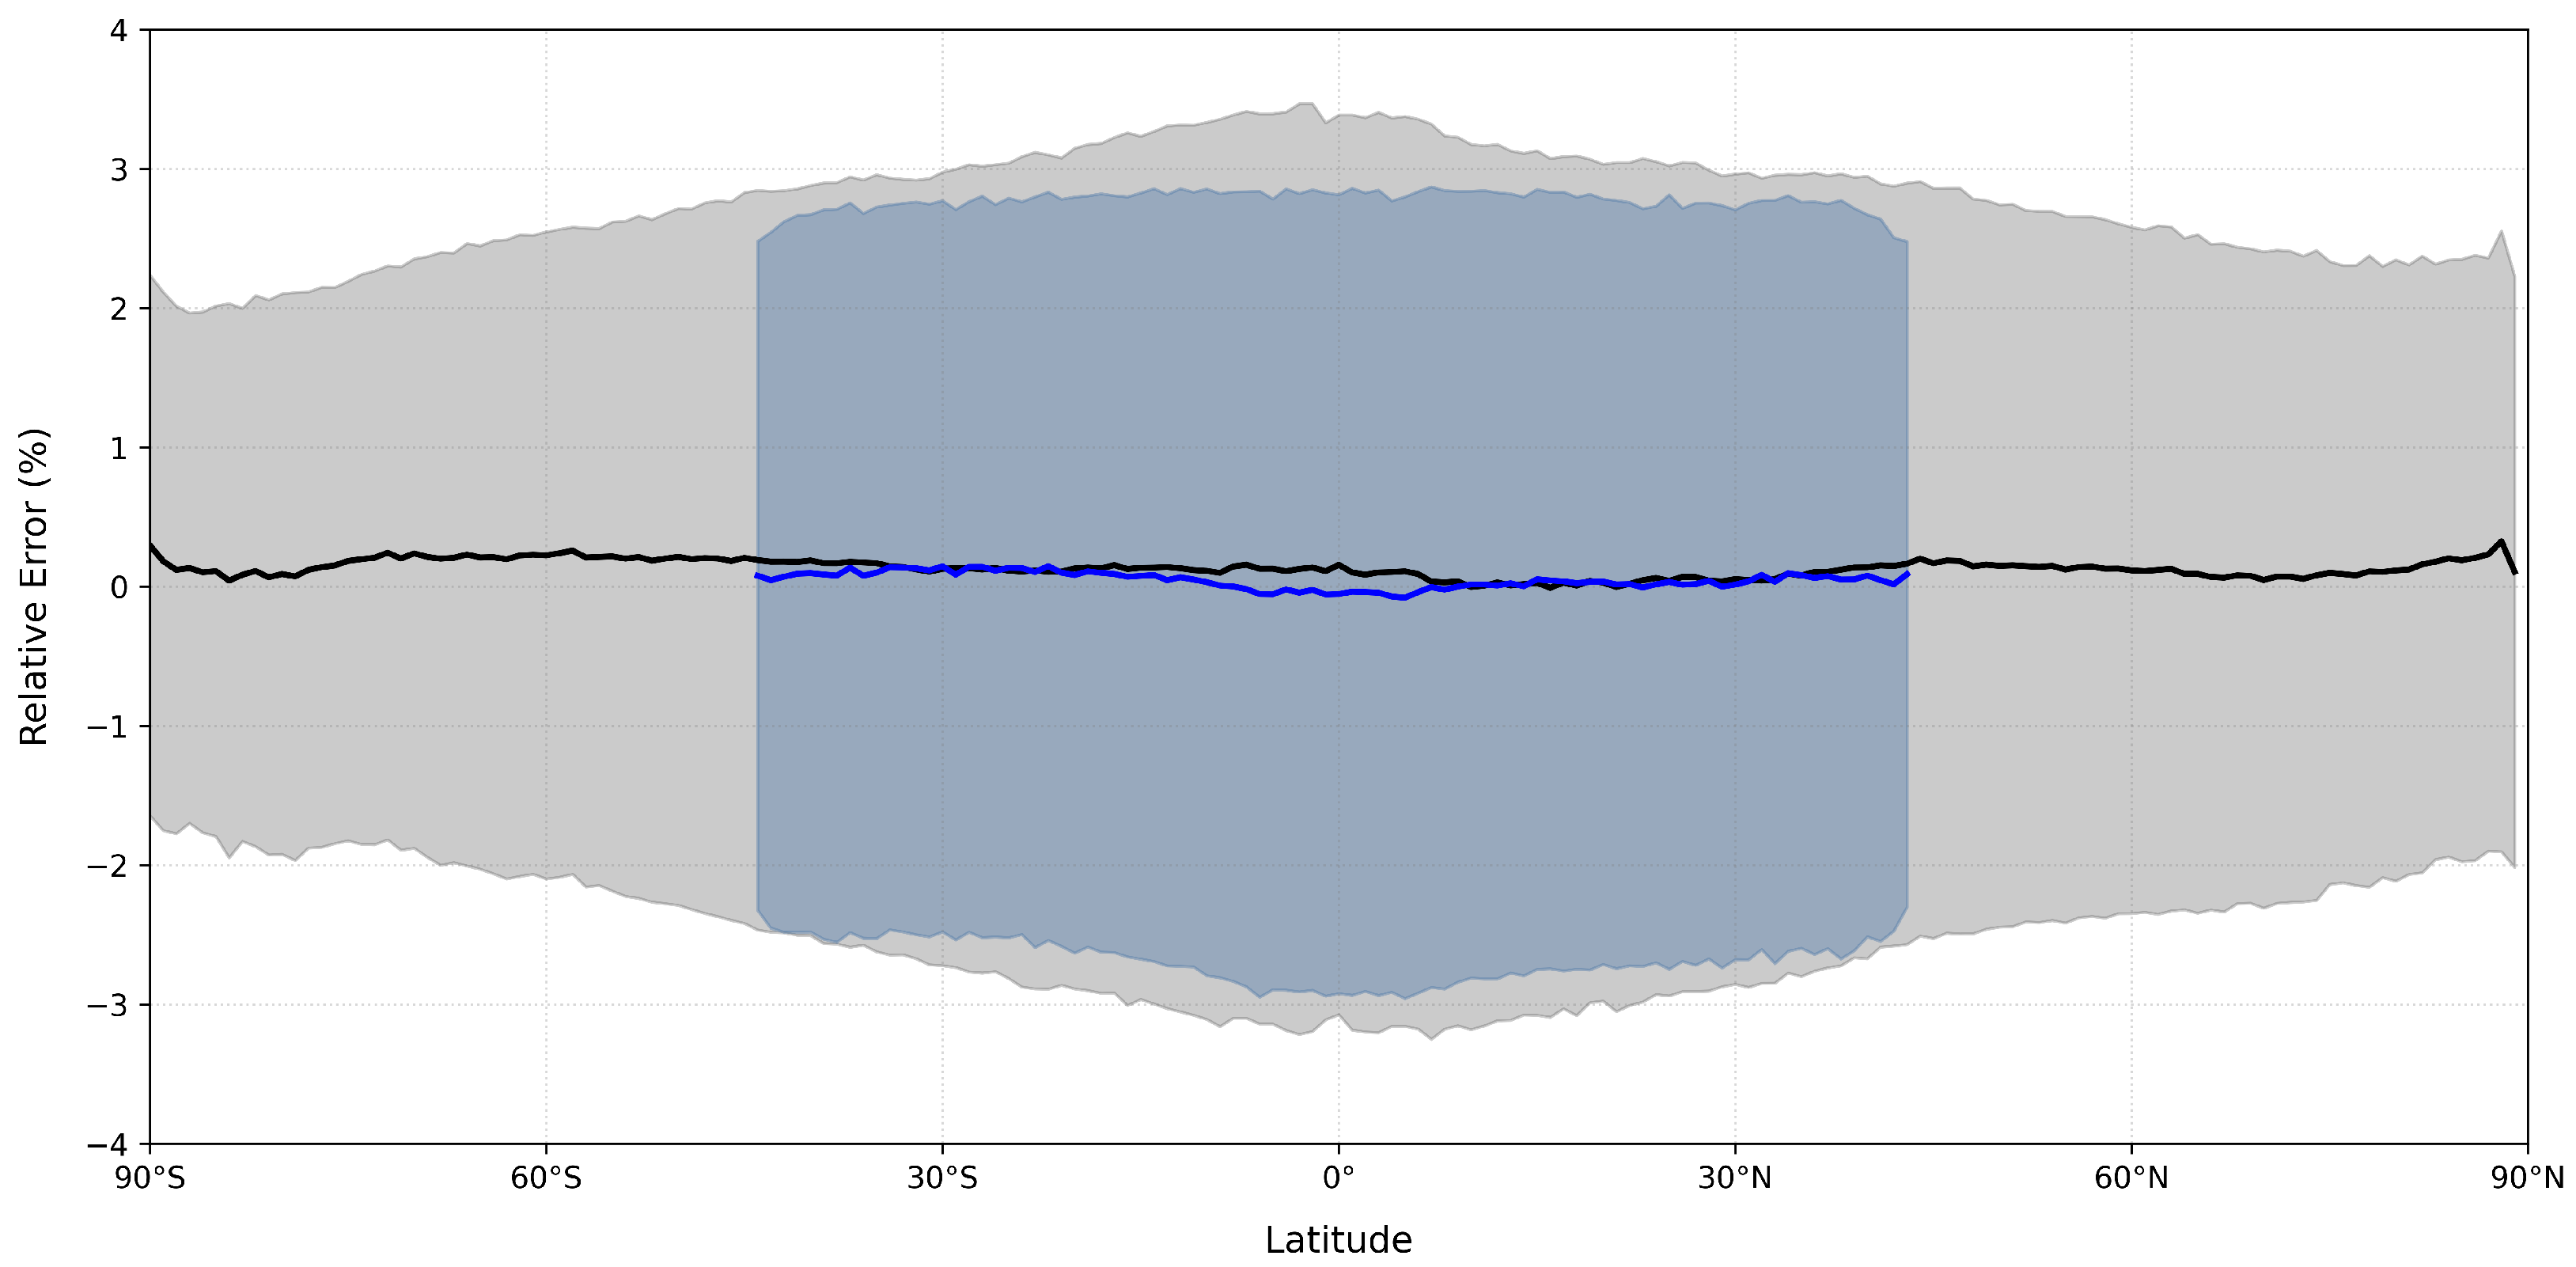
For the YUNYAO constellation, it can be seen from Figure 4 that the mean relative bias exhibits a small positive bias and there is no significant latitudinal dependence. The standard deviation of relative bias is spindle-shaped: it gradually decreases from the equator toward both poles. The SD in the Arctic is larger than that in the Antarctic. The ionospheric irregularities in the Arctic (32.4%) are highest [24] and may contribute to the large SD in the Arctic. The large SD in the tropical region may be due to the high ionospheric irregularities in Southeast Asia (4.7%) and South America (22.6%). However, the SD in the tropical region is significantly larger than that in the Arctic where the ionospheric irregularities are most severe. Therefore, the ionospheric irregularities may not be the only source accounting for the large SD in the tropical region. Water vapor abundance and frequent convection in tropical region pose a great challenge for not only GNSS RO measurements but also numerical models. Thus, the large SD in the tropical region may arise from the large uncertainty in either GNSS RO measurements or the background. To distinguish between the impacts of ionospheric irregularity or water vapor impacts, we will compare the bias and its standard deviation among different layers in the following sections. For COSMIC-2, the mean relative bias is close to zero. The standard deviation of relative bias of COSMIC-2 is smaller than that of YUNYAO and varies even more smoothly from the equator to both sides (up to 45°S or 45°N).
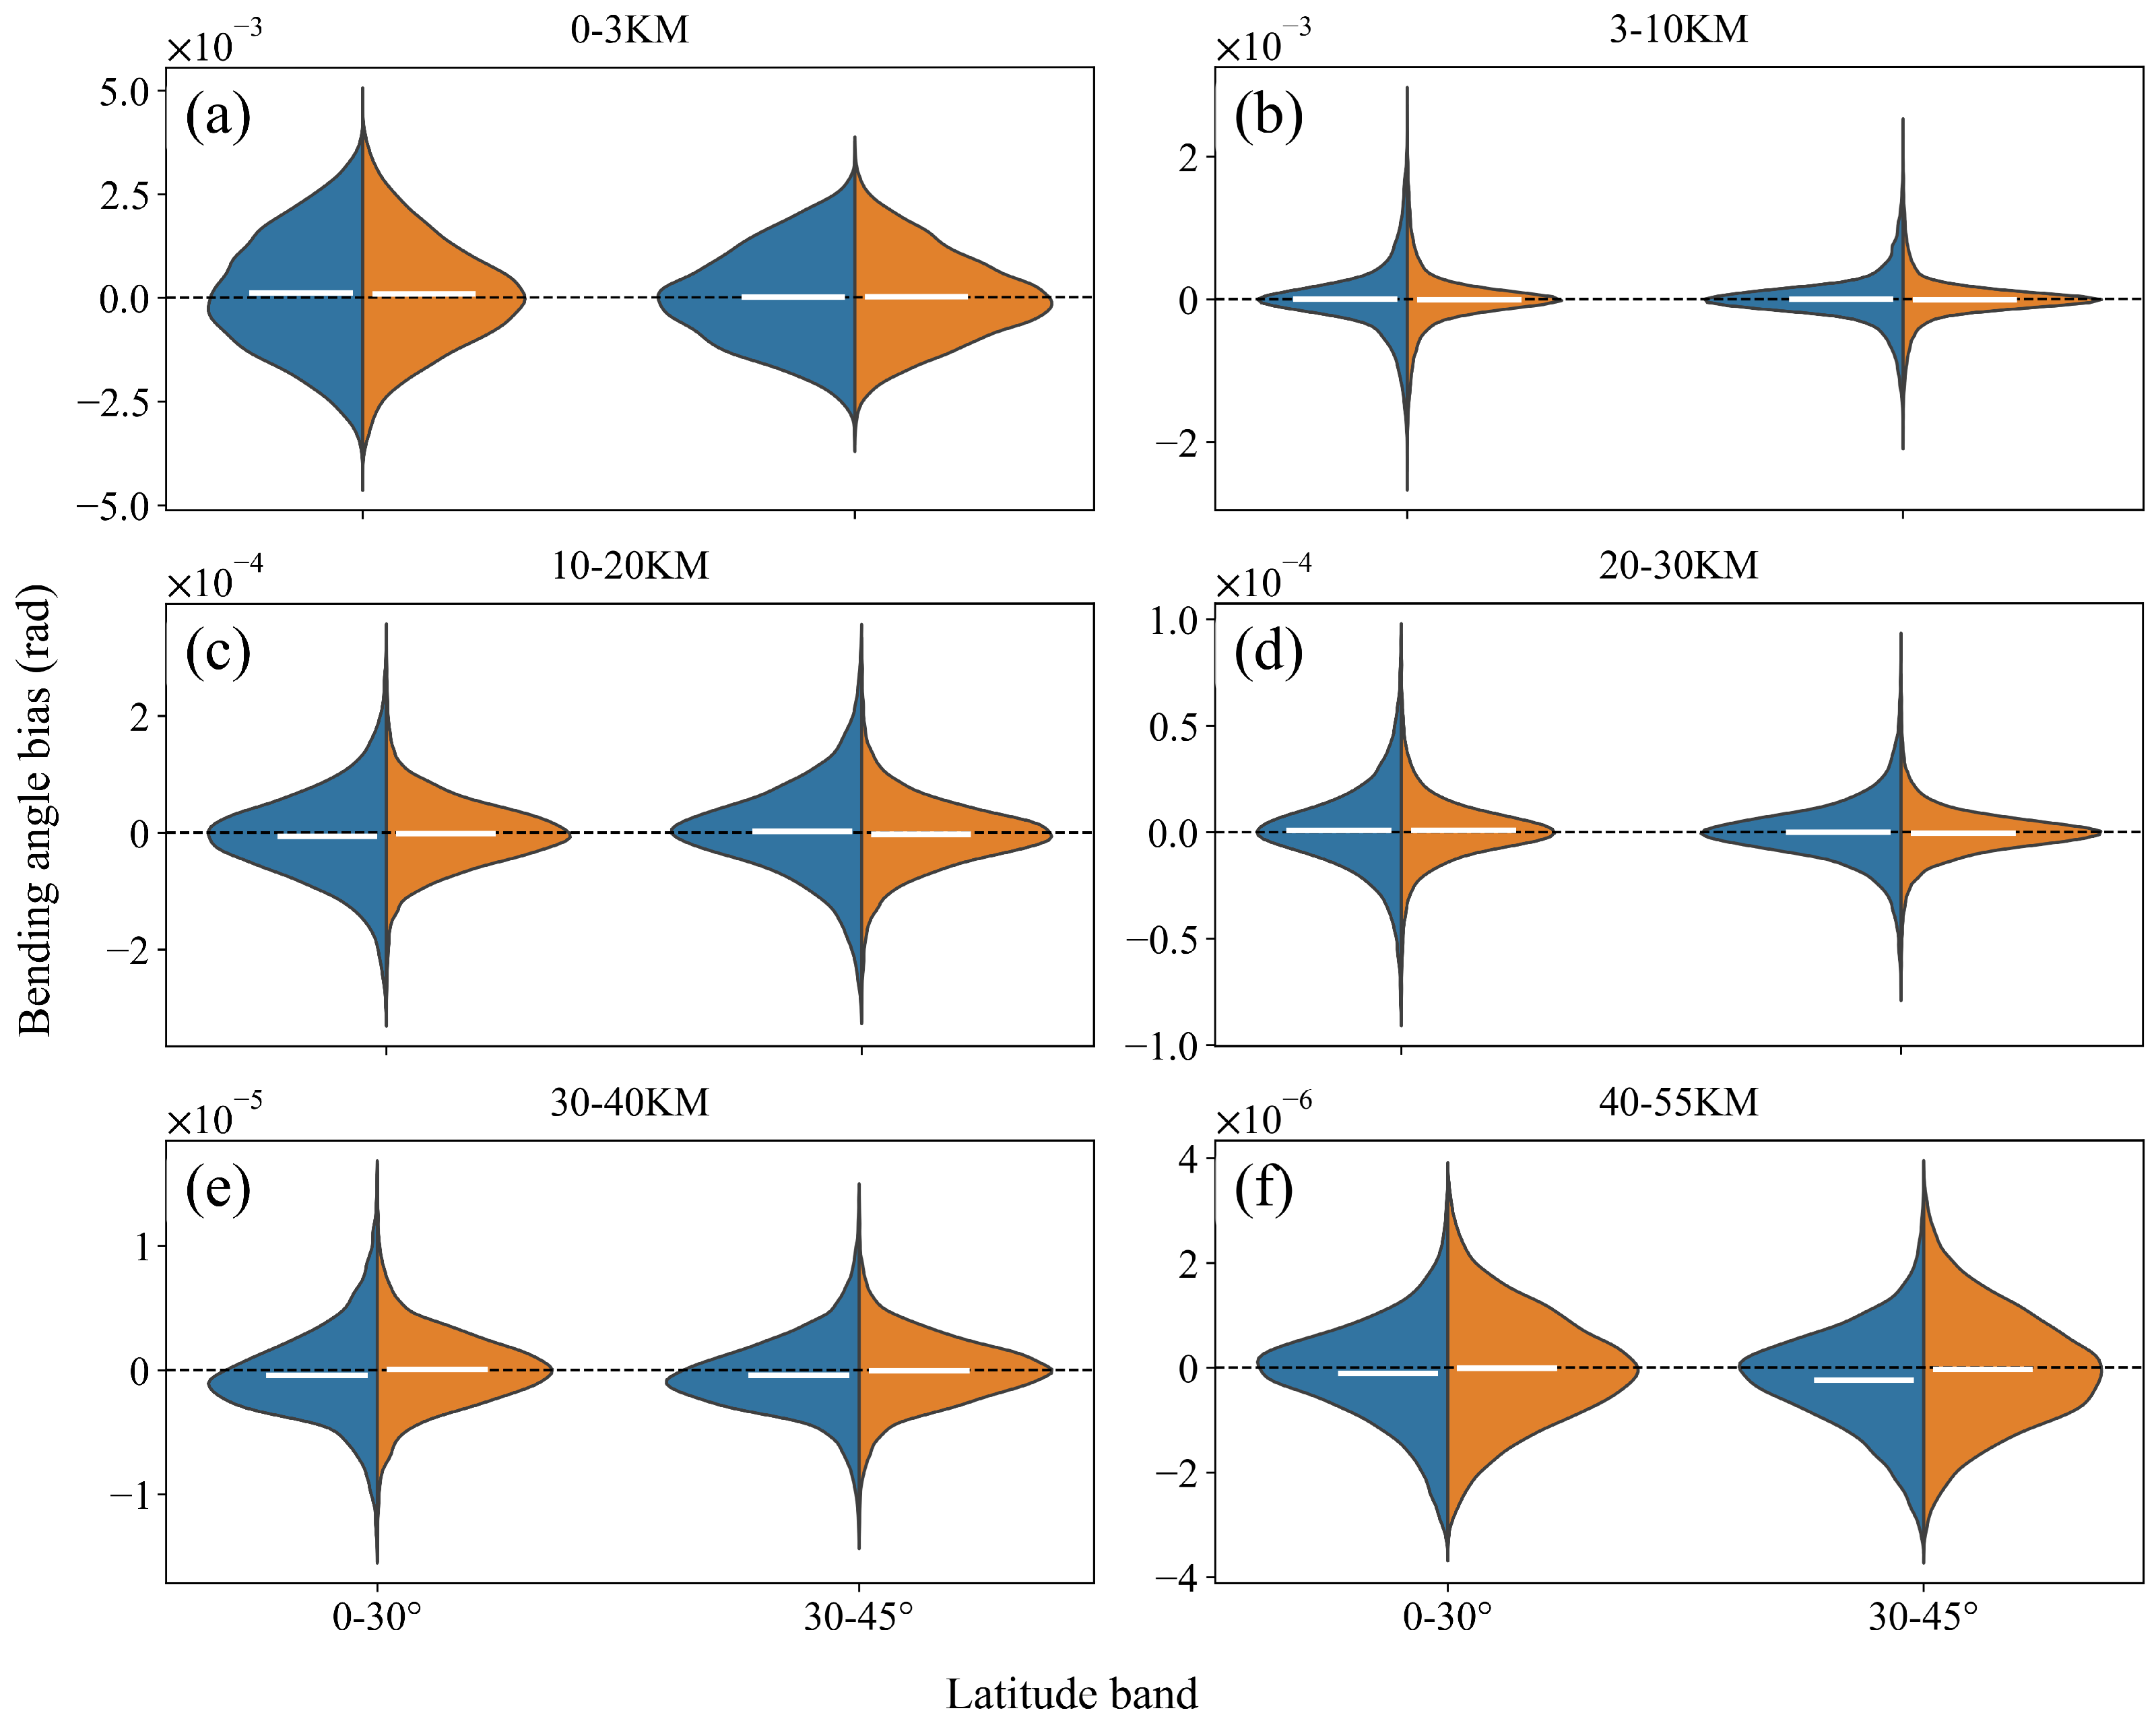
The violin plots in Figure 5 show the bias of bending angles in different layers for two latitudinal zones between YUNYAO and COSMIC-2 constellations. It is worth noting that the biases in different altitude layers are of different orders of magnitude. Thus, the dispersion of the bias in different layers cannot be compared directly from the visual difference in the width of the bell shape in the corresponding distribution of the bias in Figure 5. The detailed comparison among different layers will be presented in Section 3.4.
It can be seen from Figure 5 that the distributions of the bias in different layers for both YUNYAO and COSMIC-2 constellations share many similar characteristics. The standard deviations of the bias in different layers are summarized in Table 3 from which it is evident that the YUNYAO constellation has larger dispersion in bias than the COSMIC-2 constellation except for the layer above 40 km. The dispersion in bias for both constellations decreases with altitude as the bending angle generally decreases with altitude. The distributions of the bias over the tropical and subtropical regions are similar for both constellations. But the dispersion in bias below 40 km over the tropical region is larger than over the subtropical regions for both constellations because of the more multipaths caused by the strong gradient of the abundant water vapor over the tropical region. The bias almost clusters close to zero for both the YUNYAO and COSMIC-2 constellations. The mean is around zero but the YUNYAO constellation exhibits apparently negative mean above 30 km, especially above 40 km in the latitudinal zone of 30 S 45 S 30 N 45 N (Figure 5e,f). The large bias above 30 km in the YUNYAO constellation might be from the impact of the residual ionospheric delay, residual ionospheric phase error, the error in precise orbit determination (POD), or the background error in the mid-to-upper stratosphere, but it is interesting that its dispersion above 40 km is apparently smaller than that in the COSMIC-2 constellation.
In summary, the COSMIC-2 constellation demonstrates excellent performance over the tropical region, this is consistent with the previous study [26]. The data quality of the YUNYAO constellation between 3 km and 30 km is comparable to that of the COSMIC-2 constellation. But its bias and dispersion are slightly larger than those of the COSMIC-2 constellation. The finding highlights the importance of sophisticated quality control and error estimation for the assimilation of bending angle observations, tailored to constellations, altitude layers, and regions.

3.3. Bias in Latitude-Height Cross-Section

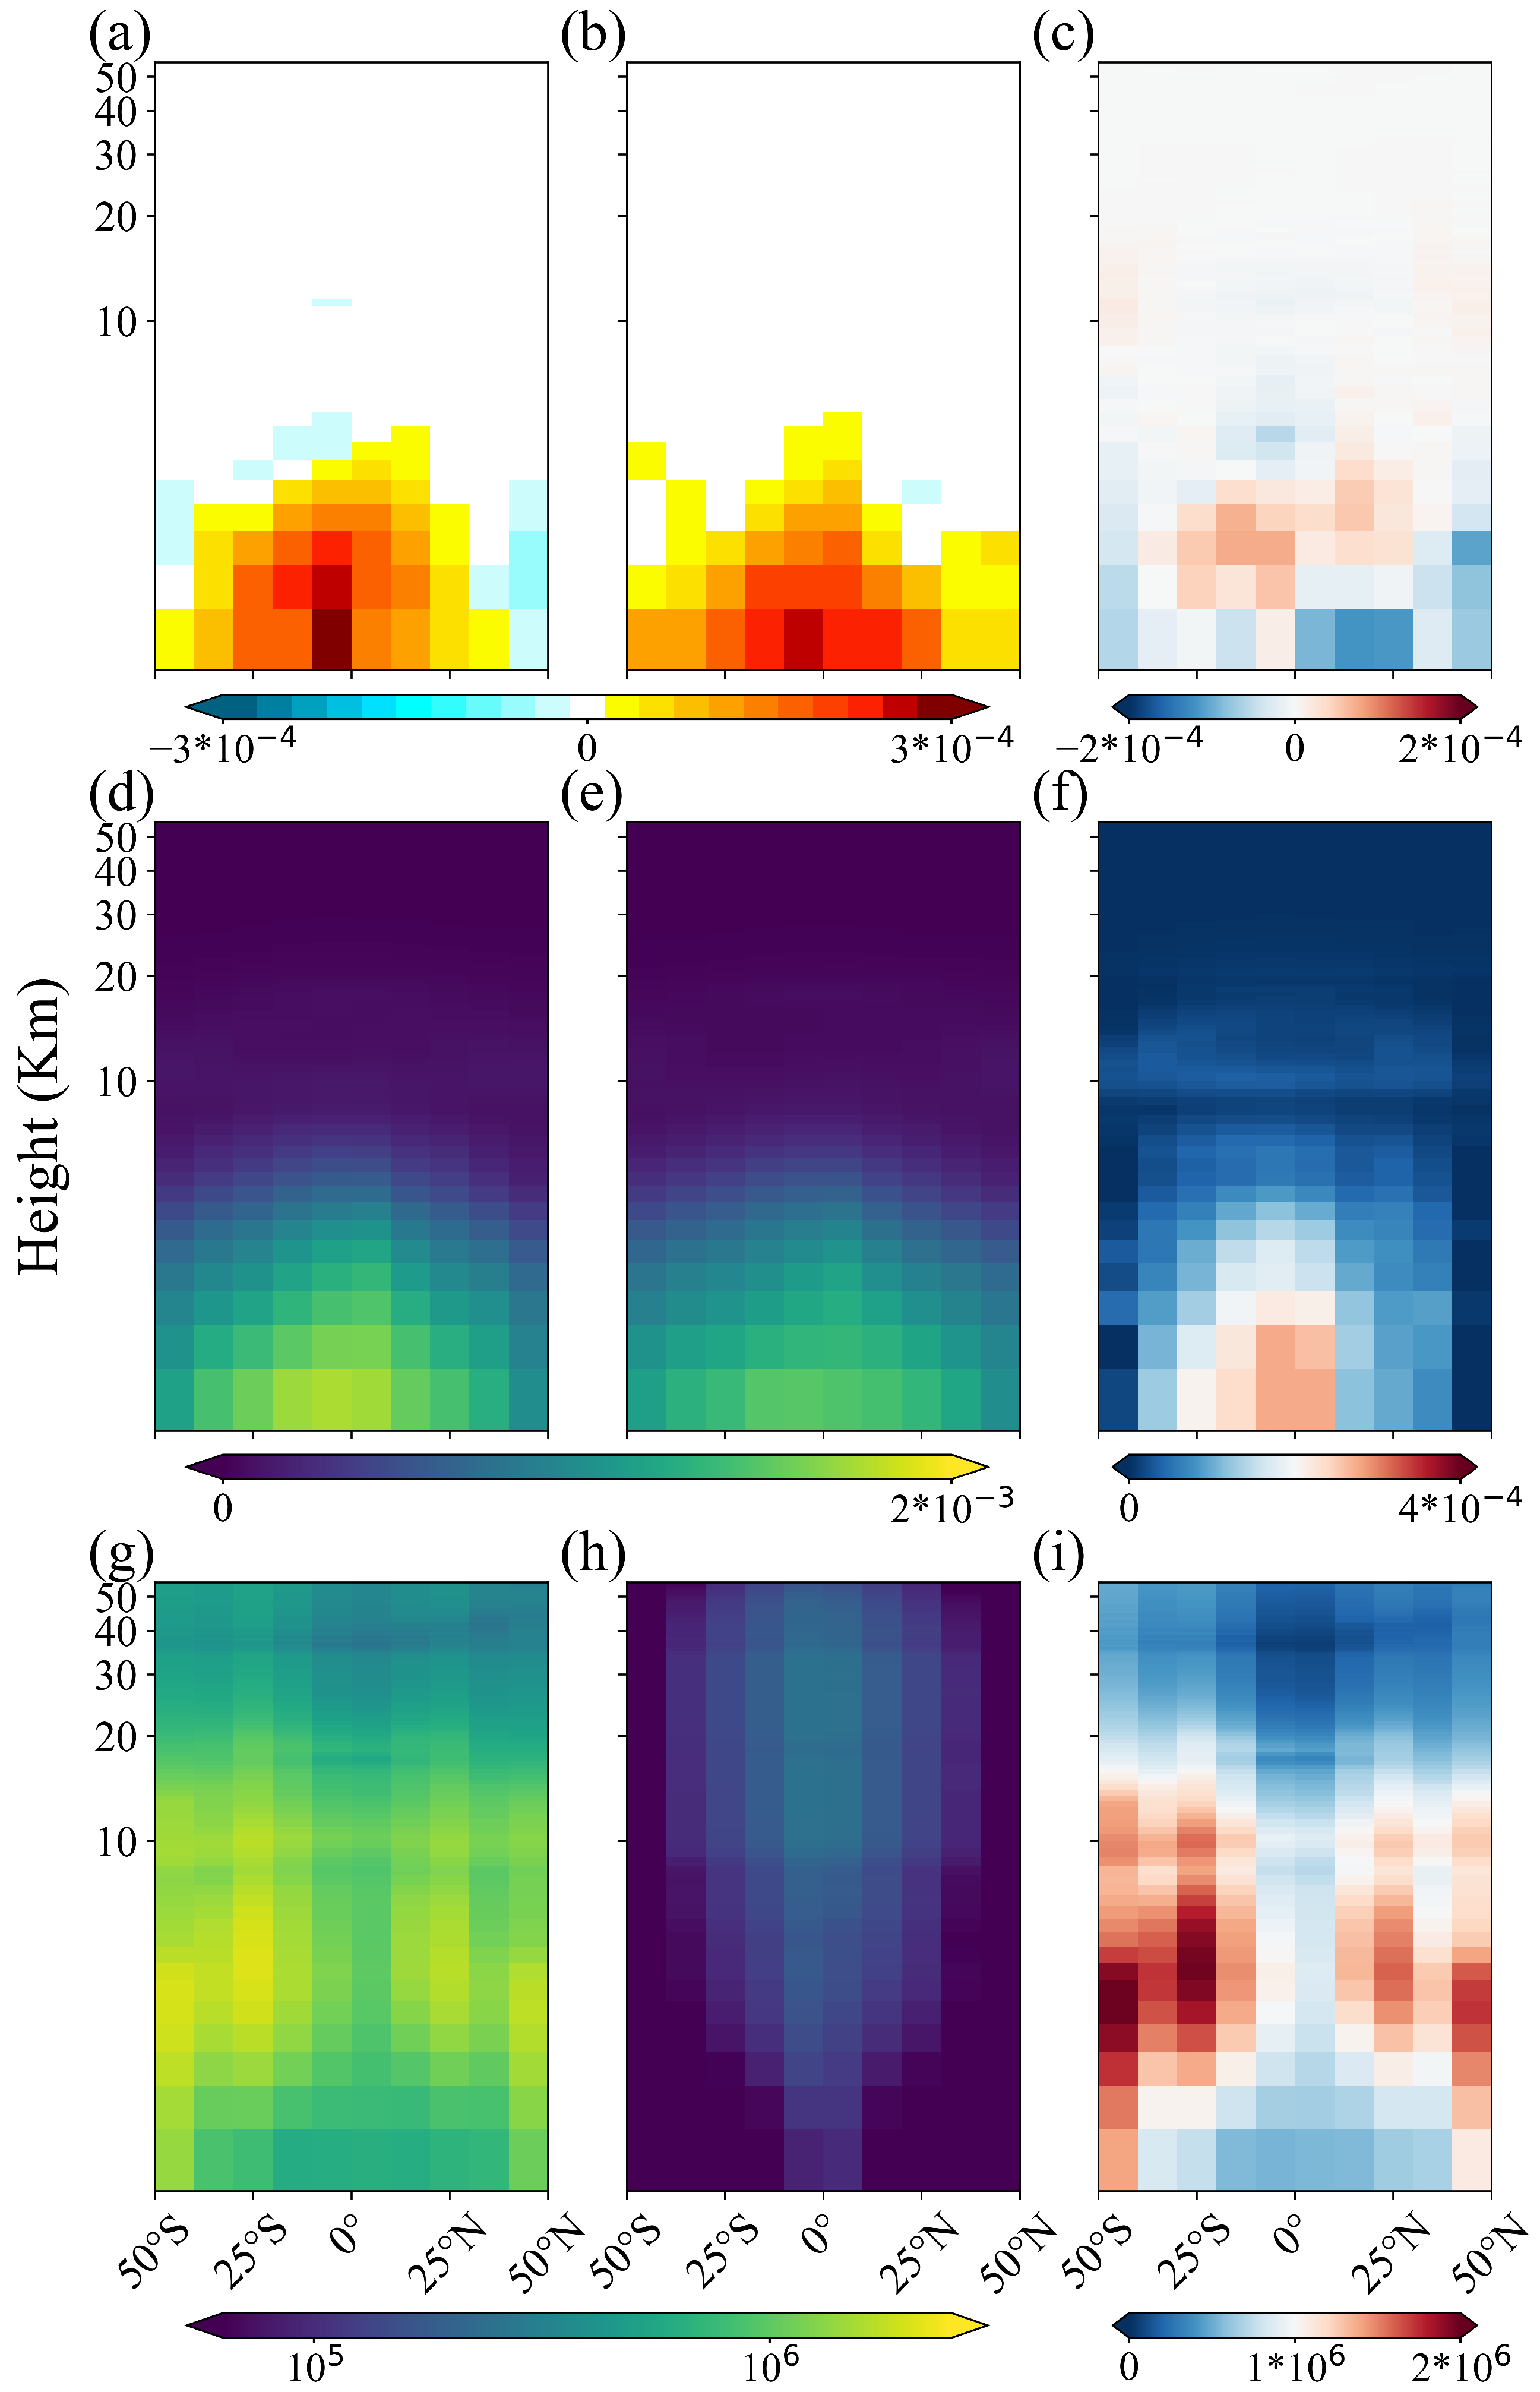
Figure 6a,b shows that the bias for both YUNYAO and COSMIC-2 constellations exhibits systematic positive bias up to 2 × 10 4 in lower troposphere (<5 km), especially in South Equatorial Belt owing to the frequent convections during Southern Hemisphere summer. When RO rays penetrate thick air masses with small-scale moisture perturbations, the Doppler shift spectrum broadens due to multipath effects and exhibits complex multi-peak structures, leading to systematic biases in the retrieved bending angle. The YUNYAO (COSMIC-2) constellation has slightly negative (positive) bias in the zone of 40 N 50 N . The COSMIC RO observations below 2 km in the subtropical eastern Pacific where ducting conditions also prevail exhibit significant negative bending angle biases [27]. The magnitude of bias decreases as the altitude increases. Figure 6c shows that the bias of the YUNYAO constellation is larger than that of COSMIC-2 at altitudes from 1.5 km to 3.5 km over the tropical region ( 30 S 30 N ). Below 1.5 km over the latitudinal zone of 30 S 30 N , or below 3.5 km over the latitudinal zone beyond 35 S or 35 N , the YUNYAO constellation demonstrates smaller bias than the COSMIC-2 constellation. There is no distinguishable difference in bias between both constellations for other altitudes.
The standard deviation of bias is large near the surface at the equator, and gradually decreases toward higher altitudes and latitudes for both YUNYAO and COSMIC-2 constellations (Figure 6d,e). The YUNYAO constellation usually exhibits larger standard deviation than the COSMIC-2 constellation in lower troposphere over the tropical region. This is consistent with the results in the previous Section 3.2 (Figure 6f).
The YUNYAO constellation has an order of magnitude more observations within a box of 10 in latitude × 500 m in altitude than the COSMIC-2 constellation (Figure 6g–i). Comparing with itself, the YUNYAO constellation has more observations at altitudes from 2 km to 20 km while has less observations above 20 km, below 2 km, and in the whole column near the equator ( 10 S 10 N ). Interestingly, the density of observations of COSMIC-2 constellation exhibits a stalactite-chandelier-shaped distribution, that is, the hanging columns gradually become shorter and the density of observations becomes thinner away from the equator (Figure 6h). Below 10 km, the number of observations in each hanging column decreases apparently with decreasing altitudes.
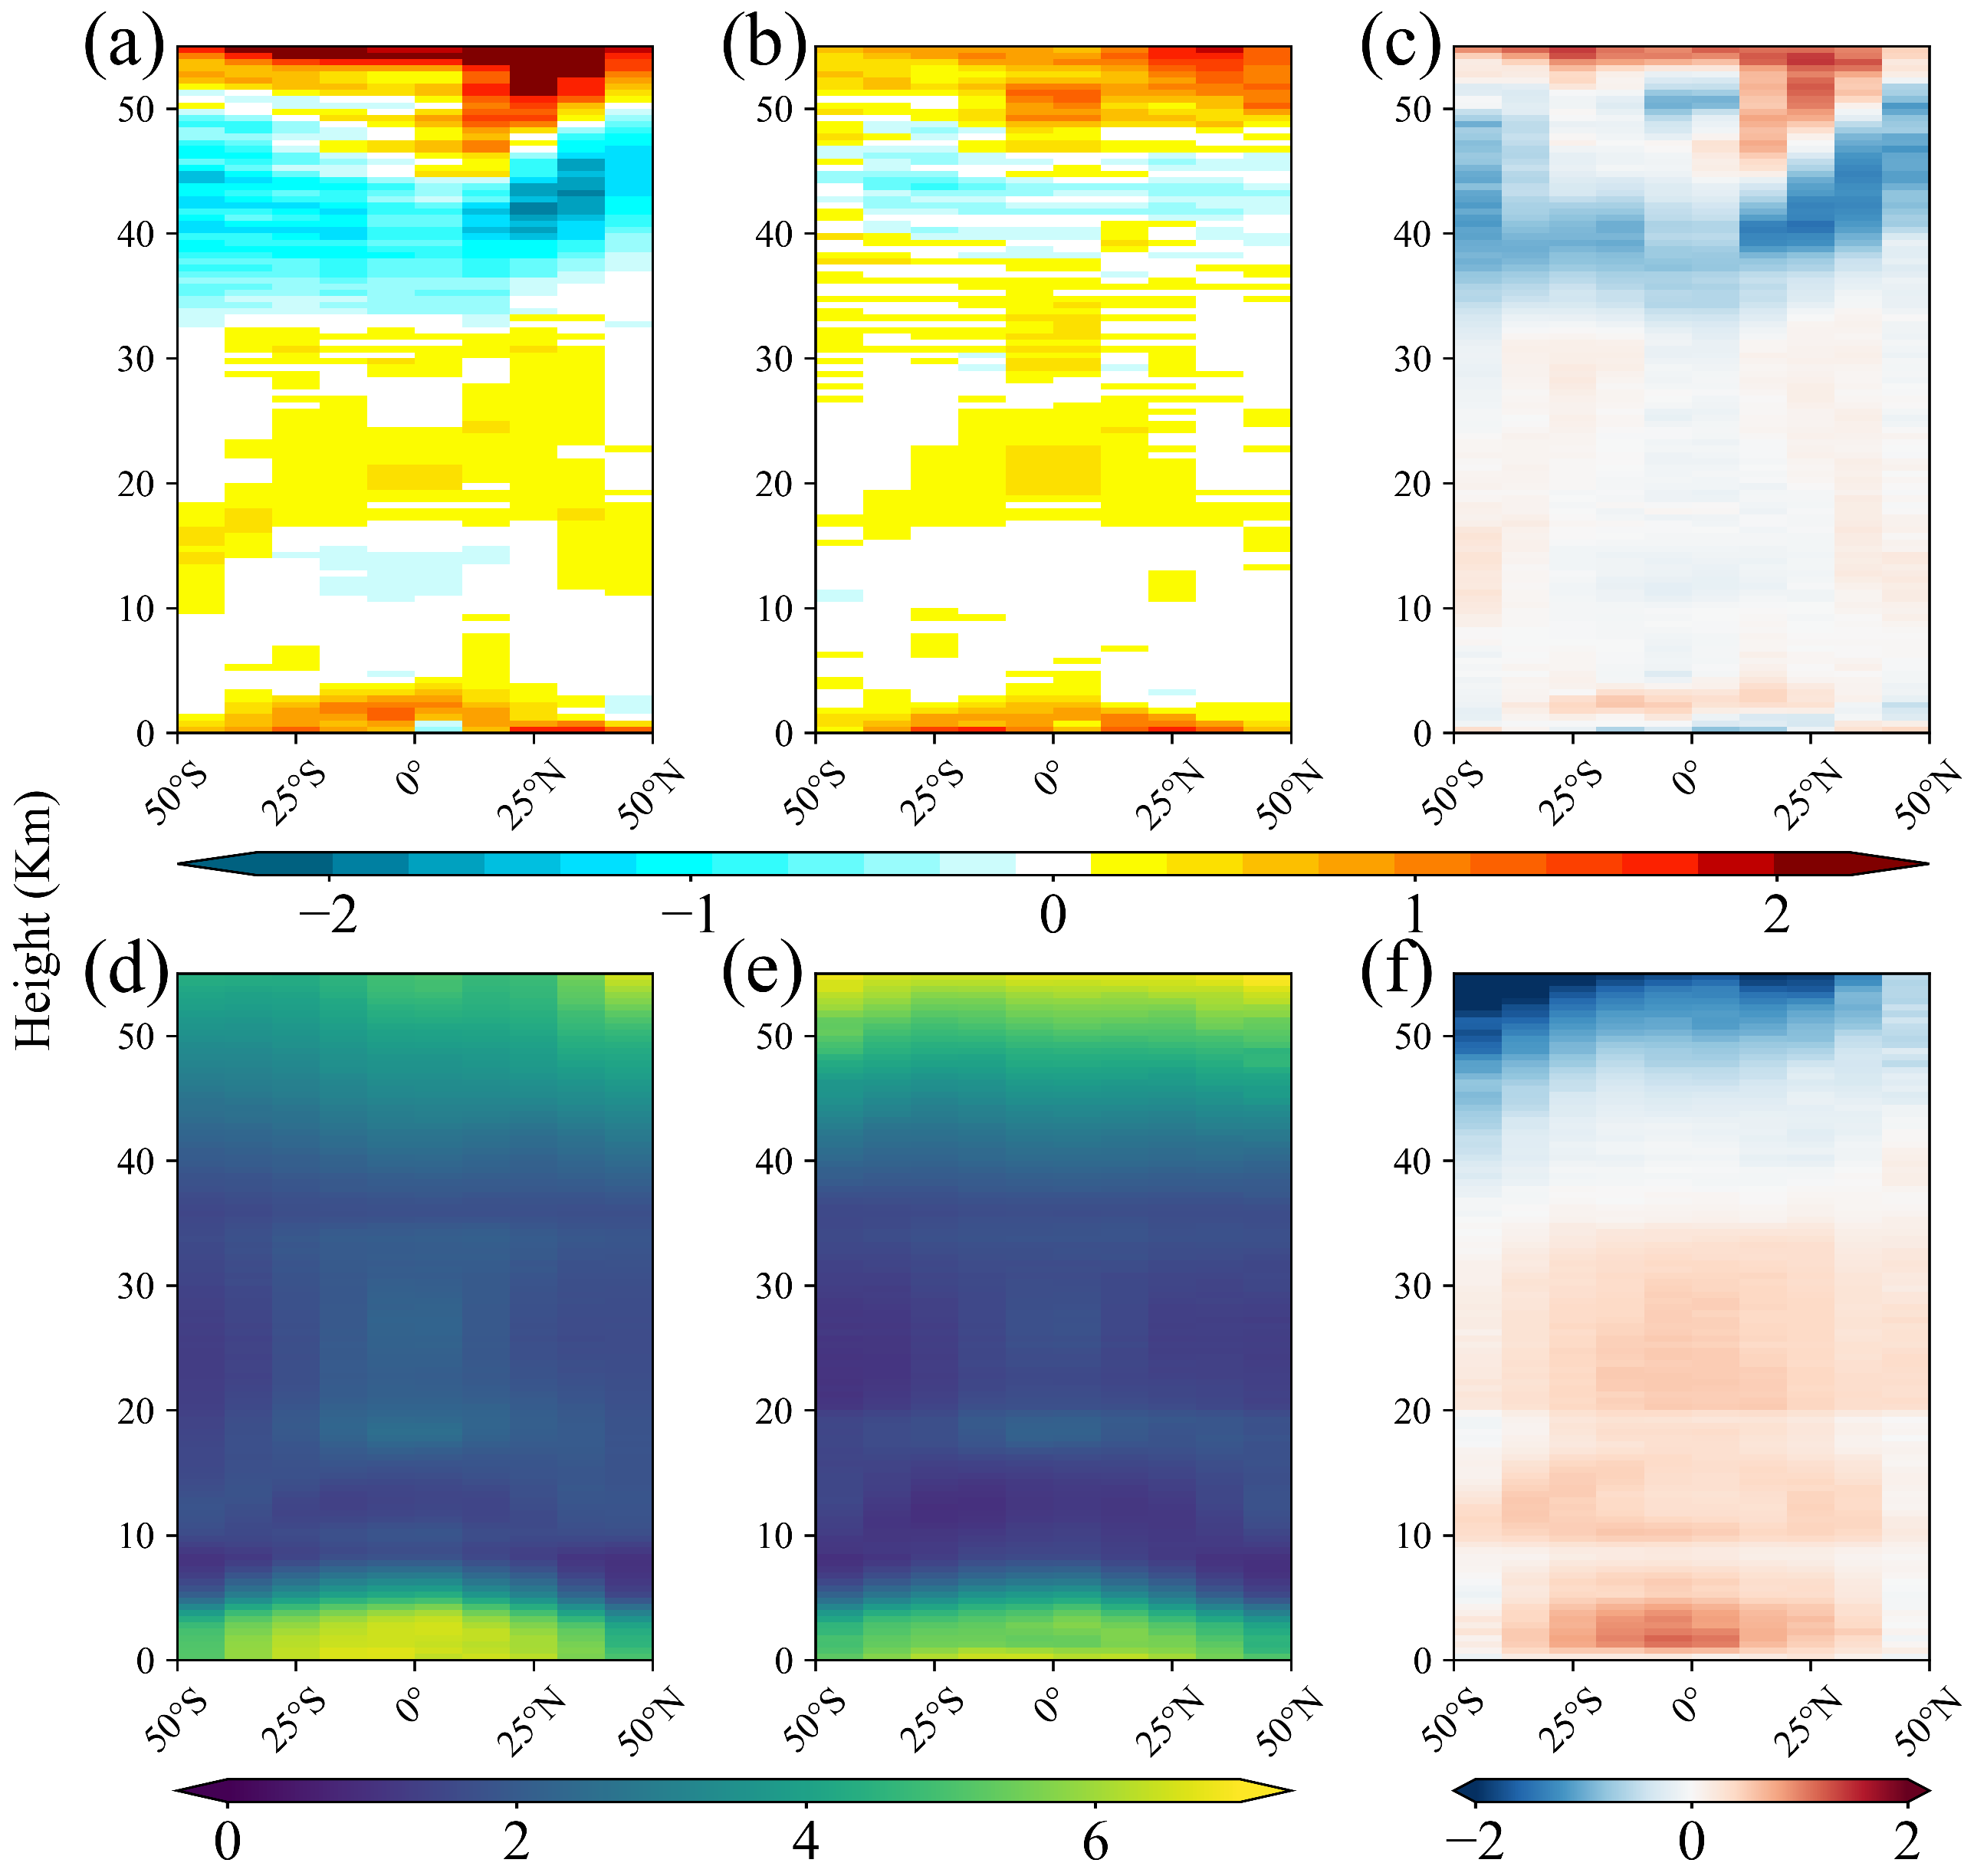
Figure 7 shows that the relative bias exhibits a similar pattern in both YUNYAO and COSMIC-2 constellations. Large positive relative bias appears in lower troposphere (<3 km) and above stratosphere (>48 km), particularly the positive relative bias in the YUNYAO constellation is significantly larger than in the COSMIC-2 constellation above stratosphere. The negative relative bias appears at altitude from 30 km to 48 km for the YUNYAO constellation and at altitudes from 39 km to 48 km for the COSMIC-2 constellation, but the magnitude of negative relative bias in the YUNYAO constellation is evidently larger than that in the COSMIC-2 constellation. End-to-end simulations have shown that residual ionospheric errors in the middle and upper stratosphere maintain a negative bias with magnitudes ranging from 3 × 10 5 to 5 × 10 5 rad, even after the classical dual-frequency ionospheric correction [28]. These magnitudes are consistent with the white area at altitudes around 40 km in Figure 6a,b, the sign is consistent with the negative bias at altitudes around 40 km in Figure 7a,b. In upper troposphere and lower stratosphere, there is slightly positive relative bias in the YUNYAO constellation (10 km to 32 km) and in the COSMIC-2 constellation (15 km to 38 km).
It can be seen from Figure 7d,e that the standard deviation of relative bias is larger below 5 km. From middle troposphere to the whole stratosphere, the standard deviation of relative bias is smaller. Above the stratosphere, the standard deviation of relative bias becomes larger again. Figure 7f shows that the standard deviation of relative bias of the YUNYAO constellation is larger (smaller) than that of the COSMIC-2 constellation below (above) 40 km.
The large relative bias in the lower troposphere may be related to the processing of signals under super-refraction or ducting conditions. The observed positive bias in this region is consistent with the noise-induced positive bias described by Sokolovskiy et al. [29], which occurs during the inversion of low signal-to-noise-ratio signals that penetrate deep into the lower troposphere—a region often characterized by super-refractive conditions. The large positive relative bias above 50 km might be the combined effect of the residual ionospheric delay, residual ionospheric phase error, or the error in precise orbit determination (POD) of LEO satellites. The negative relative bias between 33 km and 50 km in the YUNYAO constellation is evident. The dual-frequency linear combination based on dispersive medium characteristics can only eliminate the first-order term of ionospheric refraction. It cannot remove the second-order and higher-order terms caused by the geomagnetic field, nor the residual ionospheric errors resulting from the two GNSS signals following slightly different paths in the ionosphere. In the upper stratosphere and mesosphere above 40 km, these uneliminated ionospheric residuals are precisely the main source of errors in the neutral atmospheric bending angle [30].

3.4. Bias in Different Layers

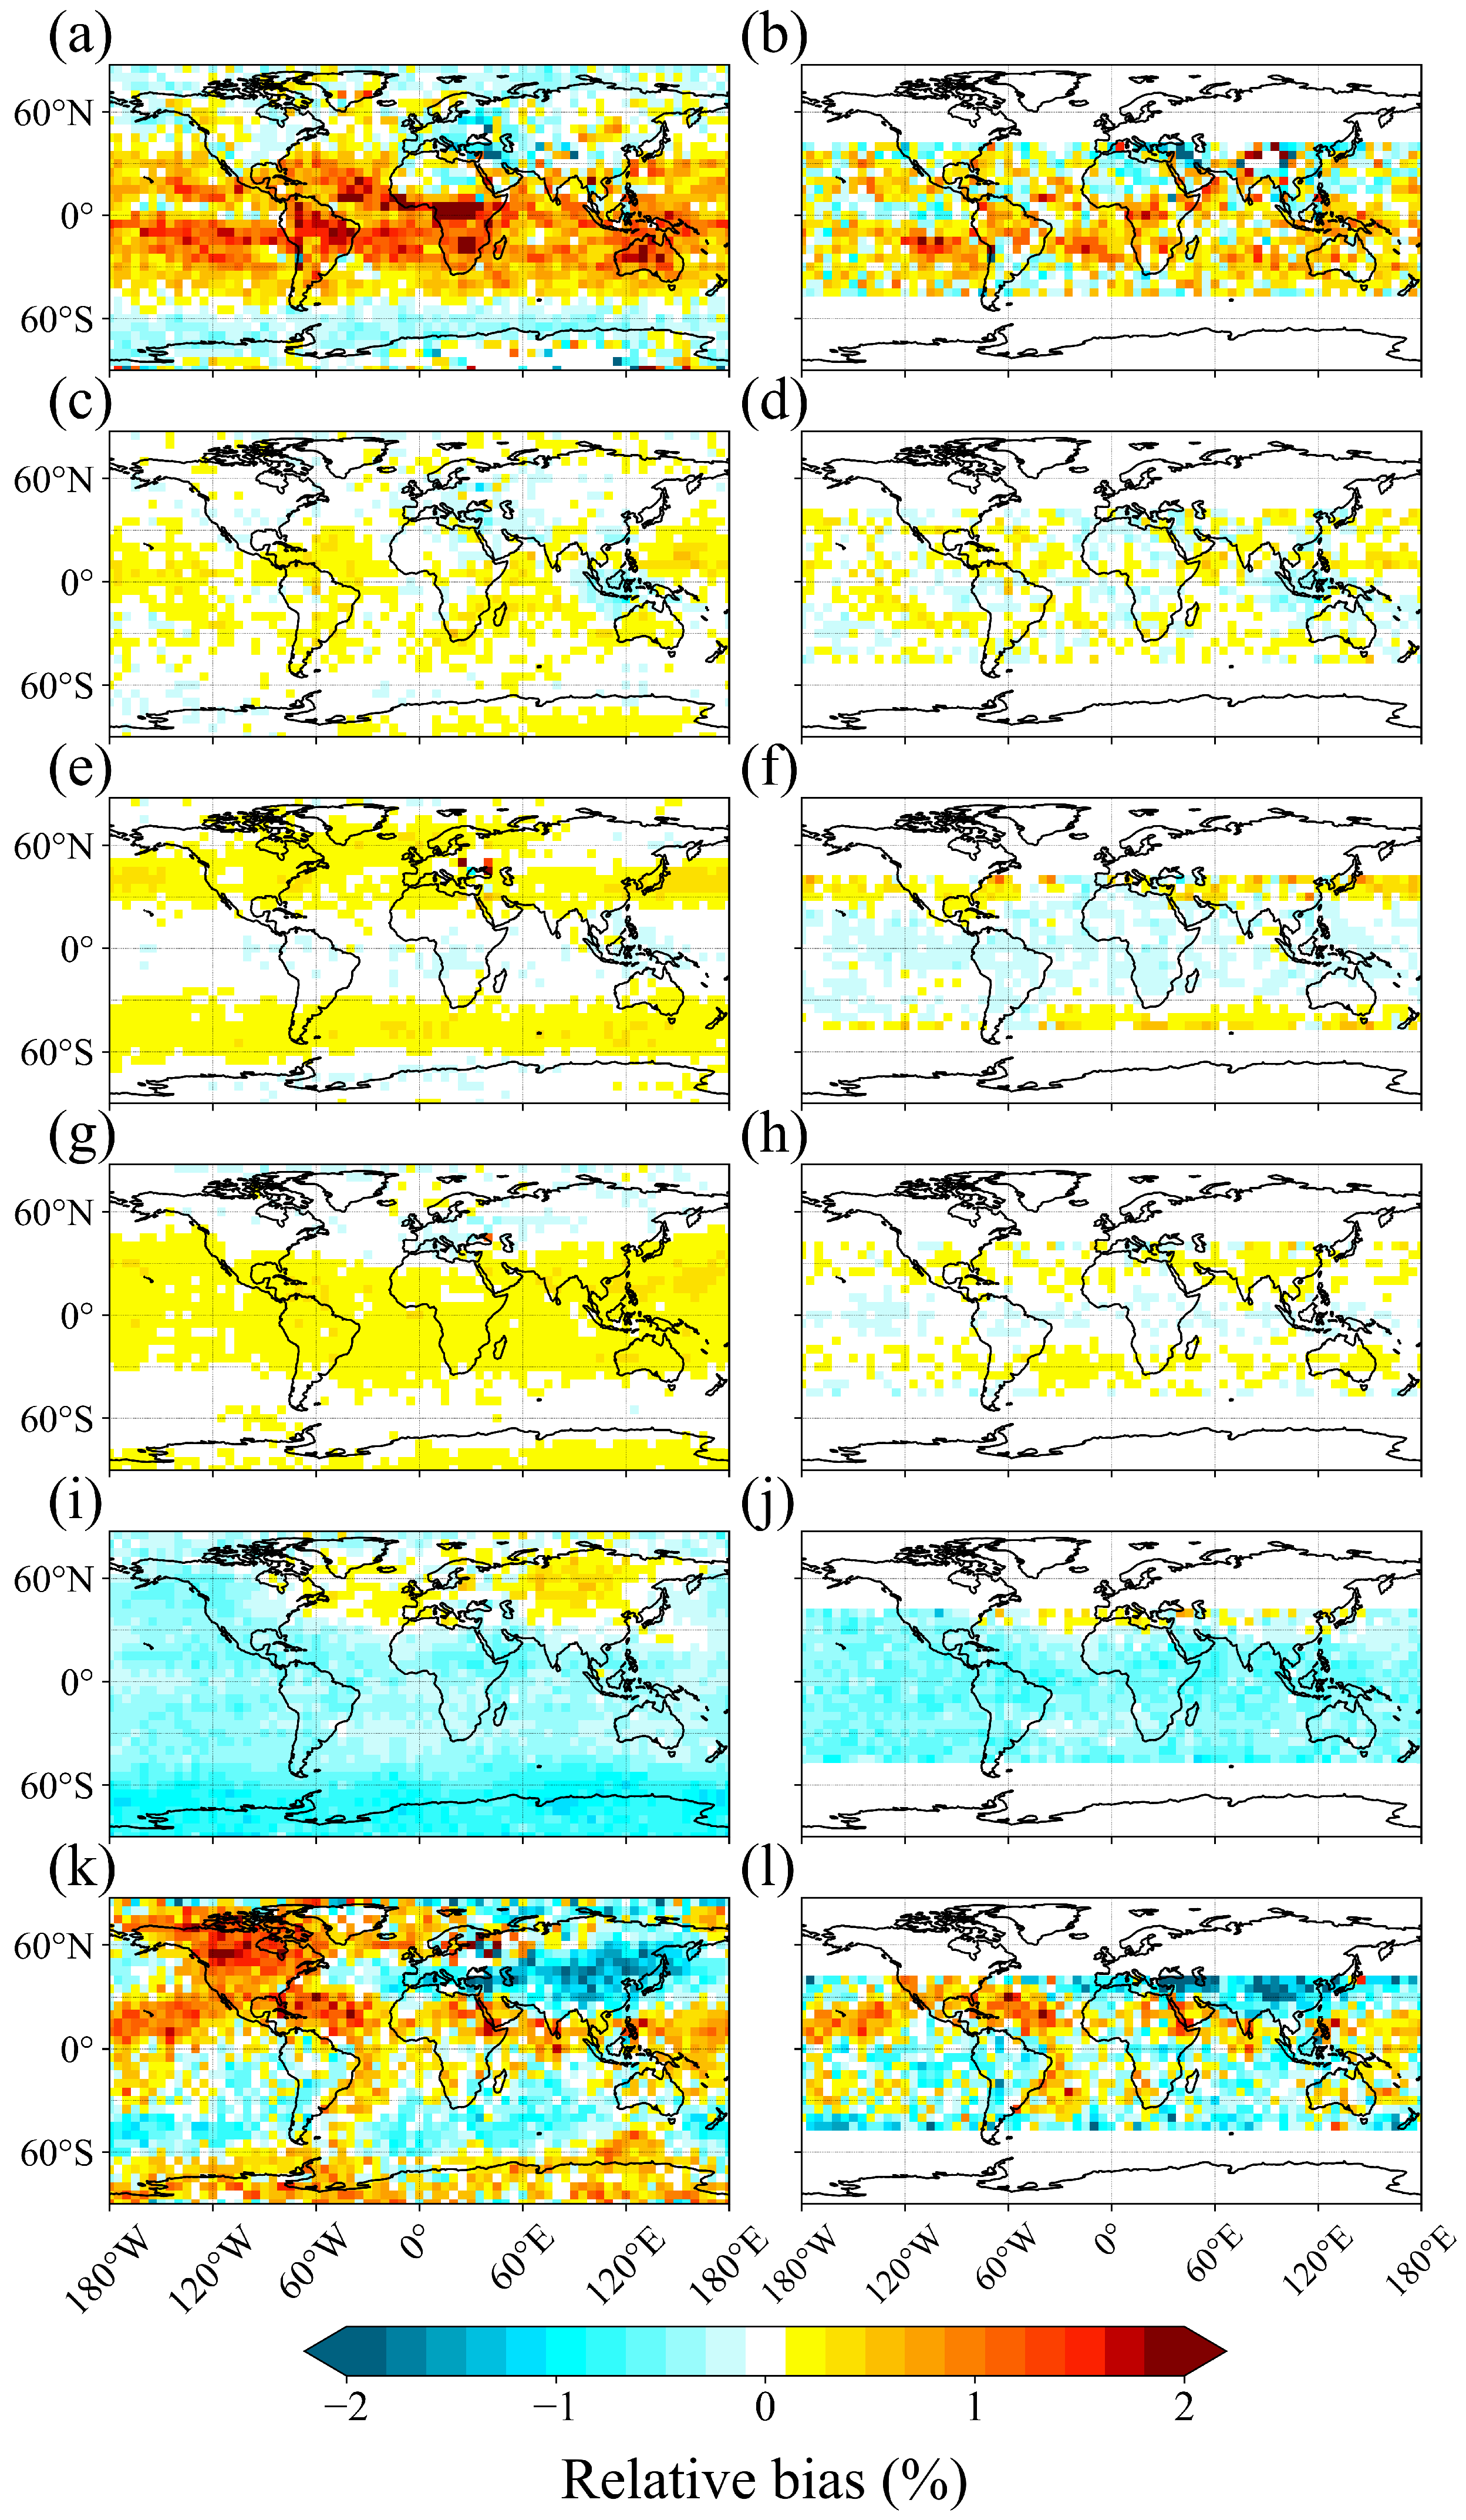
Figure 8 shows the relative bias is large over the subtropical and tropical region below 3 km. The difference between YUNYAO and COSMIC-2 constellations shows no discernible pattern (Figure 8b), it is still evident that the relative bias in the YUNYAO constellation is larger than in the COSMIC-2 constellation. Between 3 km and 10 km, the positive relative bias mainly happens over the tropical region (Figure 8c) and is substantially smaller than that below 3 km. The positive relative bias shifts to middle latitudes between 10 km and 20 km (Figure 8e) and difference between YUNYAO and COSMIC-2 constellations becomes negative (Figure 8f), this is consistent with the conclusion the YUNYAO constellation has smaller relative bias than the COSMIC-2 constellation at these altitudes (Figure 7c). The large relative bias shifts back to the tropical region between 20 km and 30 km (Figure 8g) and the difference between YUNYAO and COSMIC-2 constellations is marginal (Figure 8h). The relative bias mainly becomes negative over the globe between 30 km and 40 km (Figure 8i). Within this altitude range, the ionospheric residual is characterized by systematic negative bias, implying that the bending angle retrieved after dual-frequency linear combination is systematically underestimated relative to the true value [28]. However, there is a striking positive relative bias over northern Eurasia and the northern Atlantic. Above 40 km, a negative bias appears over the same region (Figure 8k). The Northern Hemisphere stratospheric polar vortex exhibited exceptional strength during the 2024/2025 winter, resulting in a persistent cold anomaly of 5–15 K in the polar stratosphere [31]. A cold bias in the GFS model [32] leads to a positive bias in refractivity. Since the bending angle is proportional to the refractivity gradient, the simulated bending angle over northern Eurasia is overestimated below (Figure 8i) and underestimated above (Figure 8k) the peak of the intensified refractivity associated with the exceptionally strong polar vortex. The negative difference in relative bias between the two constellations indicates that the magnitude of the negative bias is larger for YUNYAO than for COSMIC-2.

3.5. Bias Among Different GNSS

The YUNYAO constellation receives four GNSS signals: BDS, GPS, Galileo, and GLONASS; while the COSMIC-2 does not receive the BDS. Figure 9 compares the bending angle between YUNYAO and COSMIC-2 constellations retrieved from different GNSS signals.
GPS    
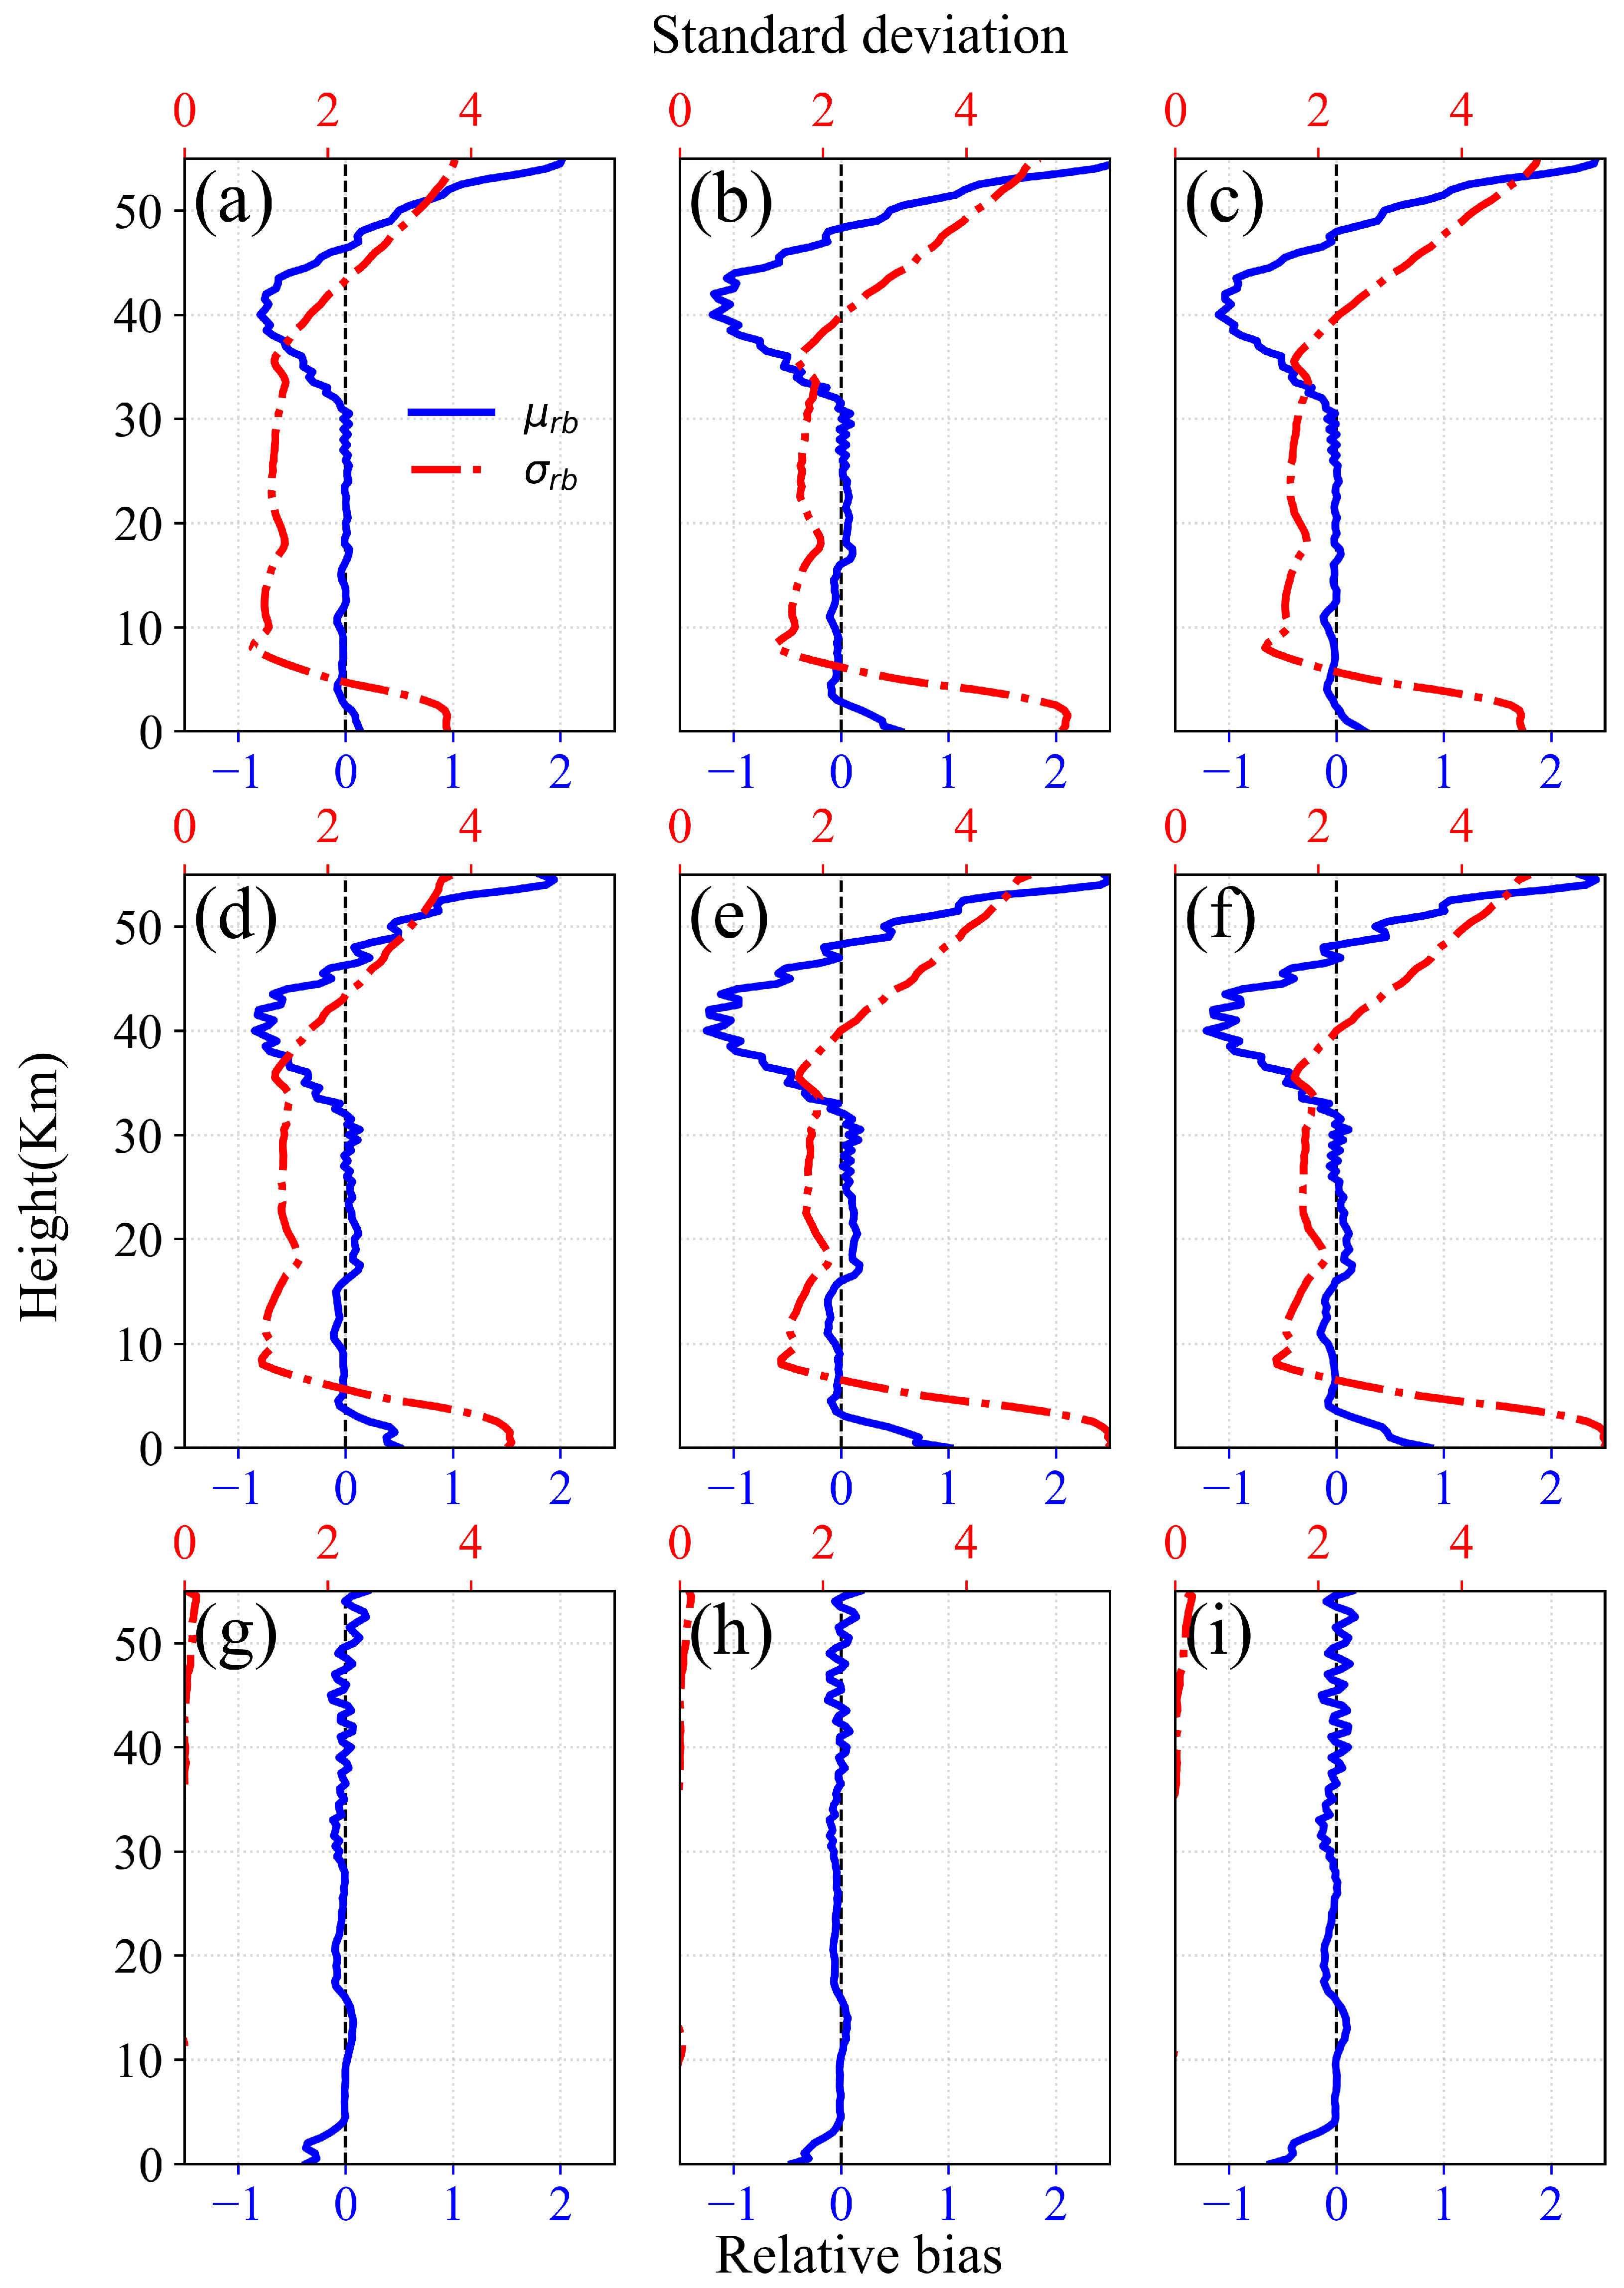
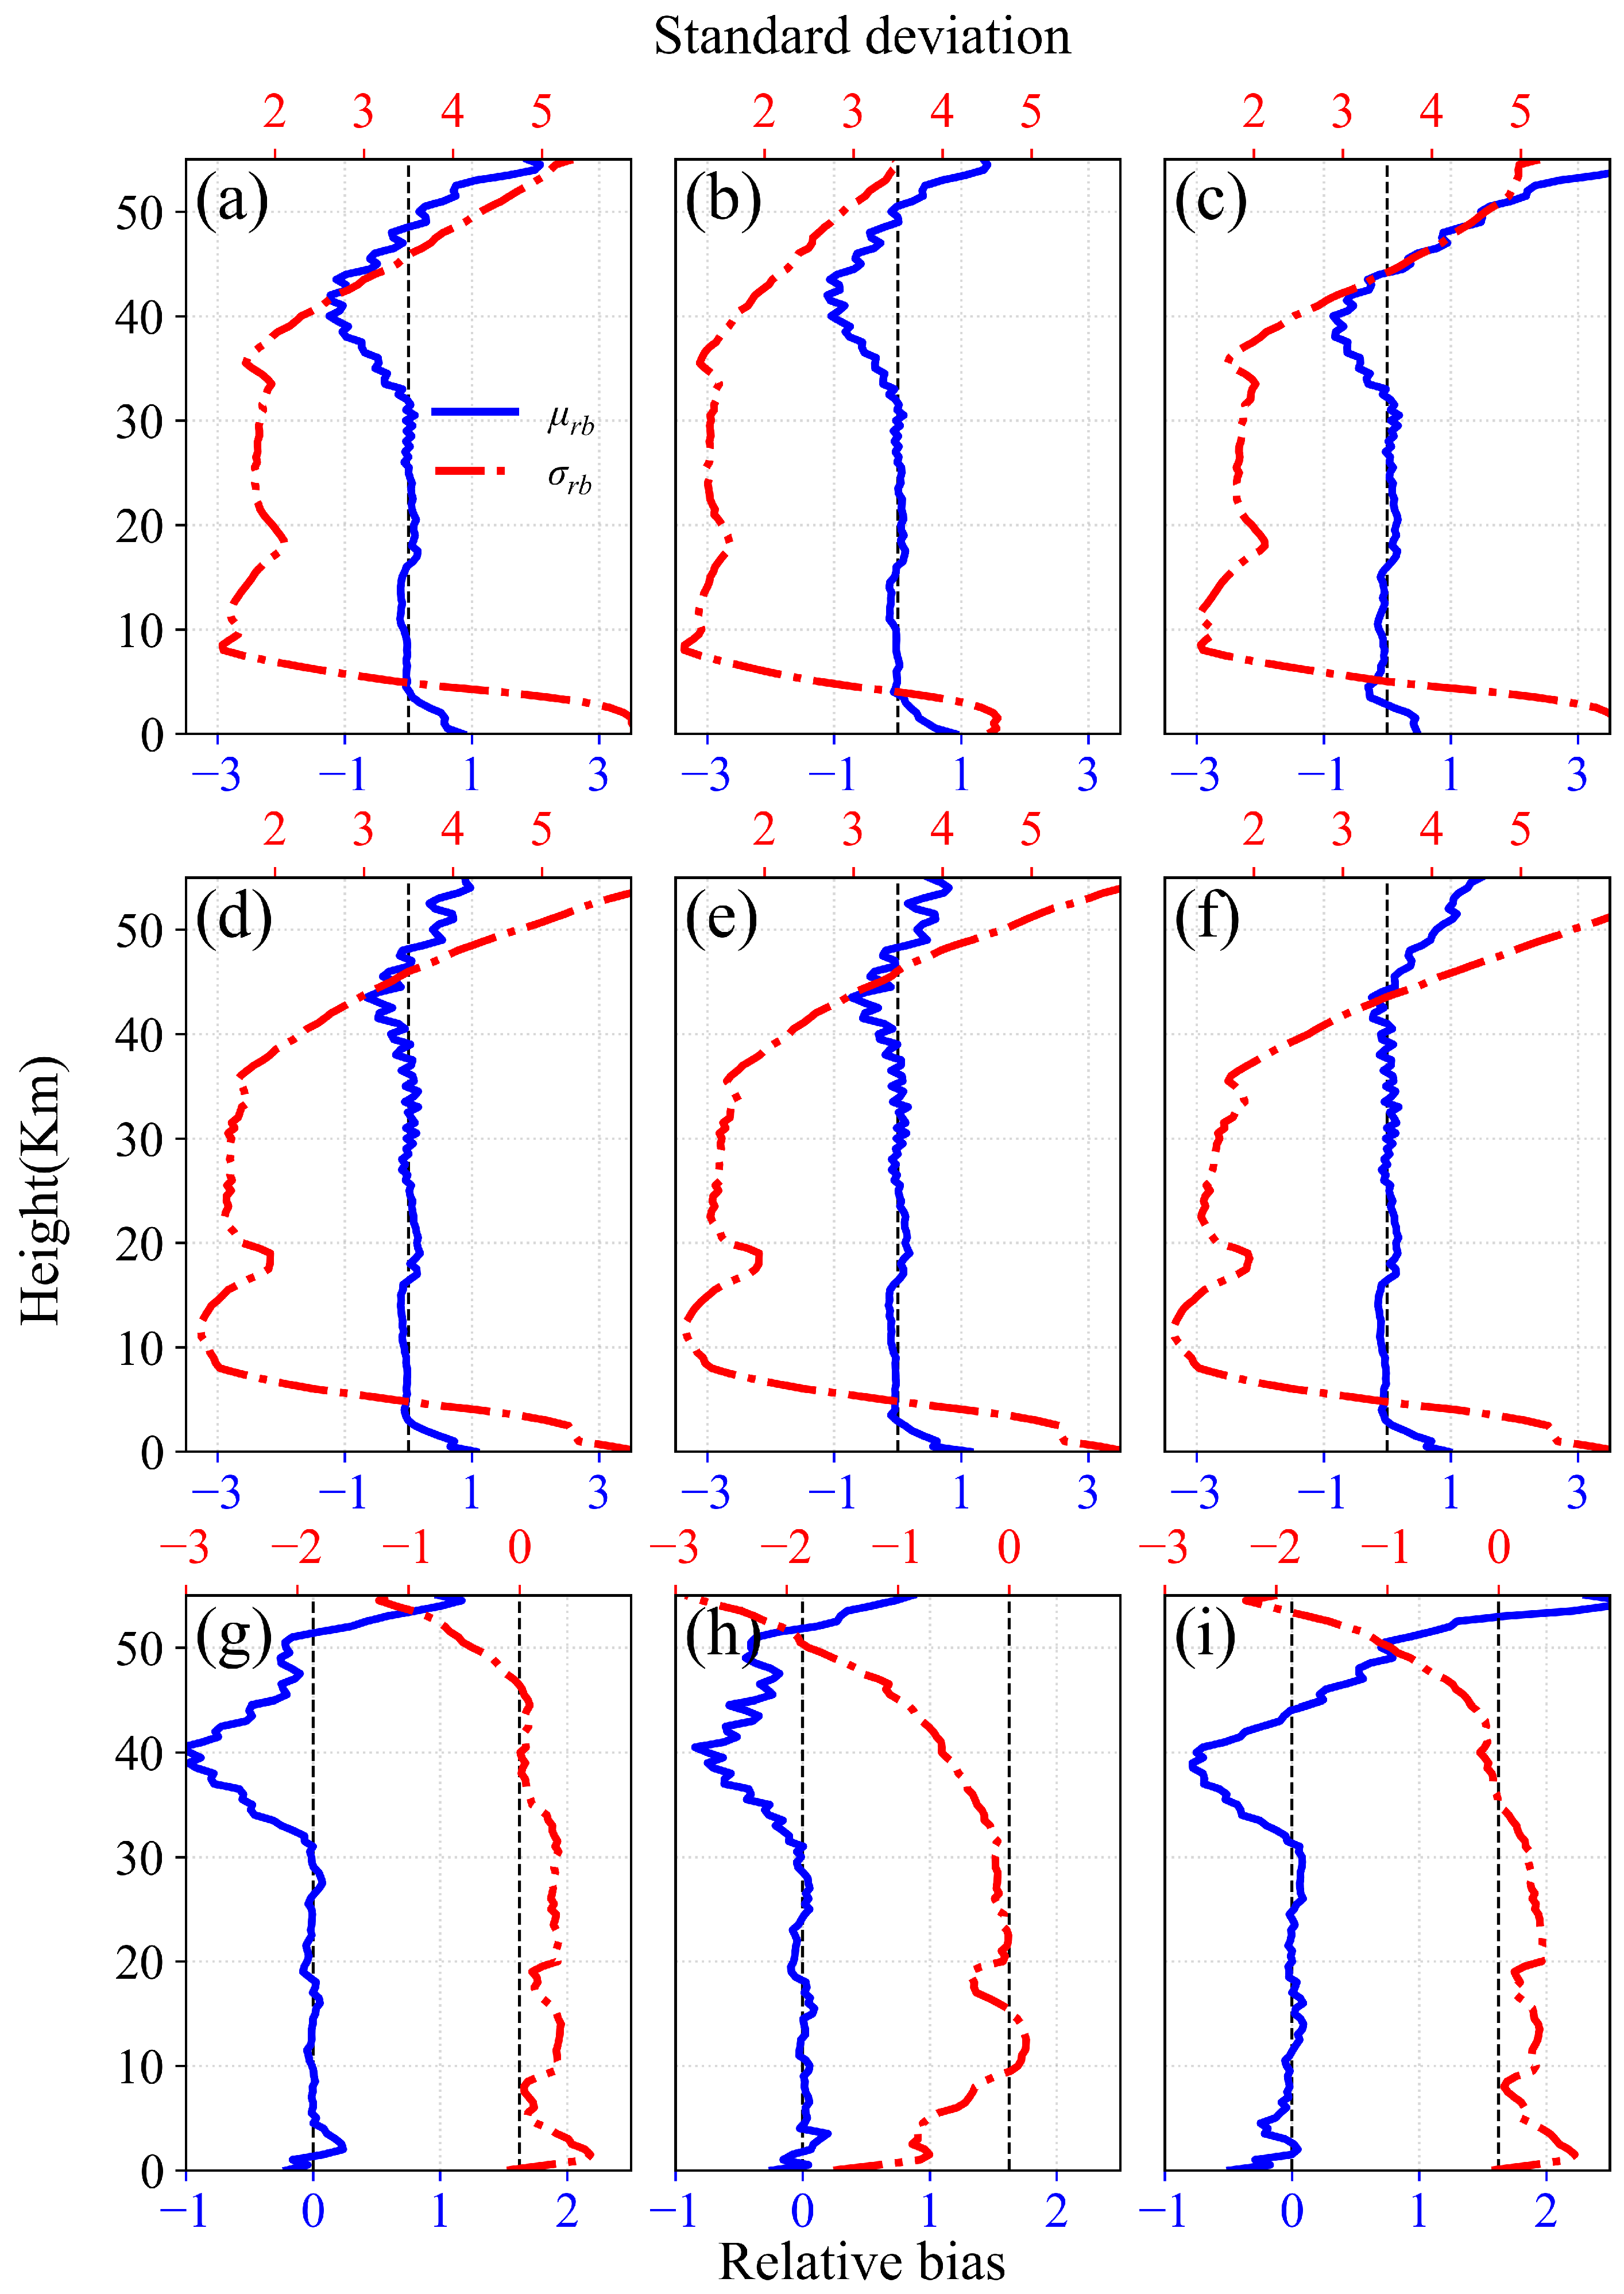
Below 3 km, the COSMIC-2 constellation has larger relative bias than the YUNYAO constellation. Within the altitude range between 3 km and 30 km, the relative bias of both constellations approaches zero, but there is evident positive bias in the COSMIC-2 constellation from 17 km to 25 km. Above 30 km, the relative bias first gradually becomes negative, reaches its minimum of −1.2% (−0.8%) near 40 (43) km, and then slowly increases to 2.1% (0.9%) at 55 km for the YUNYAO (COSMIC-2) constellation (Figure 9a,d). For GPS signal, the COSMIC-2 constellation has smaller relative bias than the YUNYAO constellation above 30 km. The profile of relative bias in the YUNYAO constellation is much smoother than the COSMIC-2 constellation.
The standard deviation of relative bias of the bending angle retrieved from GPS signals gradually decreases from 4.8% (5.5%) near the ground to about 1.3% (1.2%) around 10 km, then maintains its value below 2% up to 37 km, finally increases to 5.3% (beyond 5.5%) at 55 km for the YUNYAO (COSMIC-2) constellation (Figure 9a,d). In short, the YUNYAO constellation has smaller standard deviation of relative bias of the bending angle retrieved from GPS signals than the COSMIC-2 constellation, except for the altitude range between 10 km and 35 km where the former is slightly larger than the latter.
Galileo  
Both the relative bias and its standard deviation of the bending angle retrieved from Galileo signals have similar profiles as from GPS signals for both YUNYAO and COSMIC-2 constellations. The YUNYAO constellation has smaller relative bias of the bending angle retrieved from Galileo signals than from GPS signals (Figure 9a,b). The YUNYAO constellation has smaller standard deviation of relative bias of the bending angle retrieved from Galileo signals than the COSMIC-2 constellation (Figure 9h). The Galileo Passive Hydrogen Maser (PHM) offers superior short-term frequency stability over conventional GPS rubidium clocks. This stability reduces transmitter phase noise, leading to lower data noise levels and more accurate retrieval of upper-atmospheric parameters [33]. Consequently, above 40 km, bending angles derived from Galileo signals show a smaller relative bias than those from GPS, particularly for the YUNYAO constellation.
GLONASS 
In comparison to the positive relative bias from GPS and Galileo, the relative bias of the bending angle retrieved from GLONASS signals is close to zero below 5 km; but is substantially larger above 50 km for the YUNYAO constellation (Figure 9c). For the COSMIC-2 constellation, the relative bias from GLONASS is similar to that from GPS and Galileo signals, but is significantly smaller near 40 km, and increases quickly up to about 1.8% at 55 km (Figure 9f). The standard deviation of relative bias of the bending angle retrieved from GLONASS signals is similar to those from GPS signals for both YUNYAO and COSMIC-2 constellations (Figure 9c,f). Ref. [14] points out that GLONASS shows a pronounced systematic positive bias in radio occultation retrievals above 45 km. The Frequency Division Multiple Access (FDMA) architecture of GLONASS results in complex inter-frequency biases (IFB) among signals from different satellites at the LEO receiver. These hardware delays are highly susceptible to temperature variations in the space environment, and given the extremely weak signal strength in the upper atmosphere, the IFB noise is substantially amplified throughout the retrieval process, thereby constituting a critical bottleneck for GLONASS radio occultation data quality.
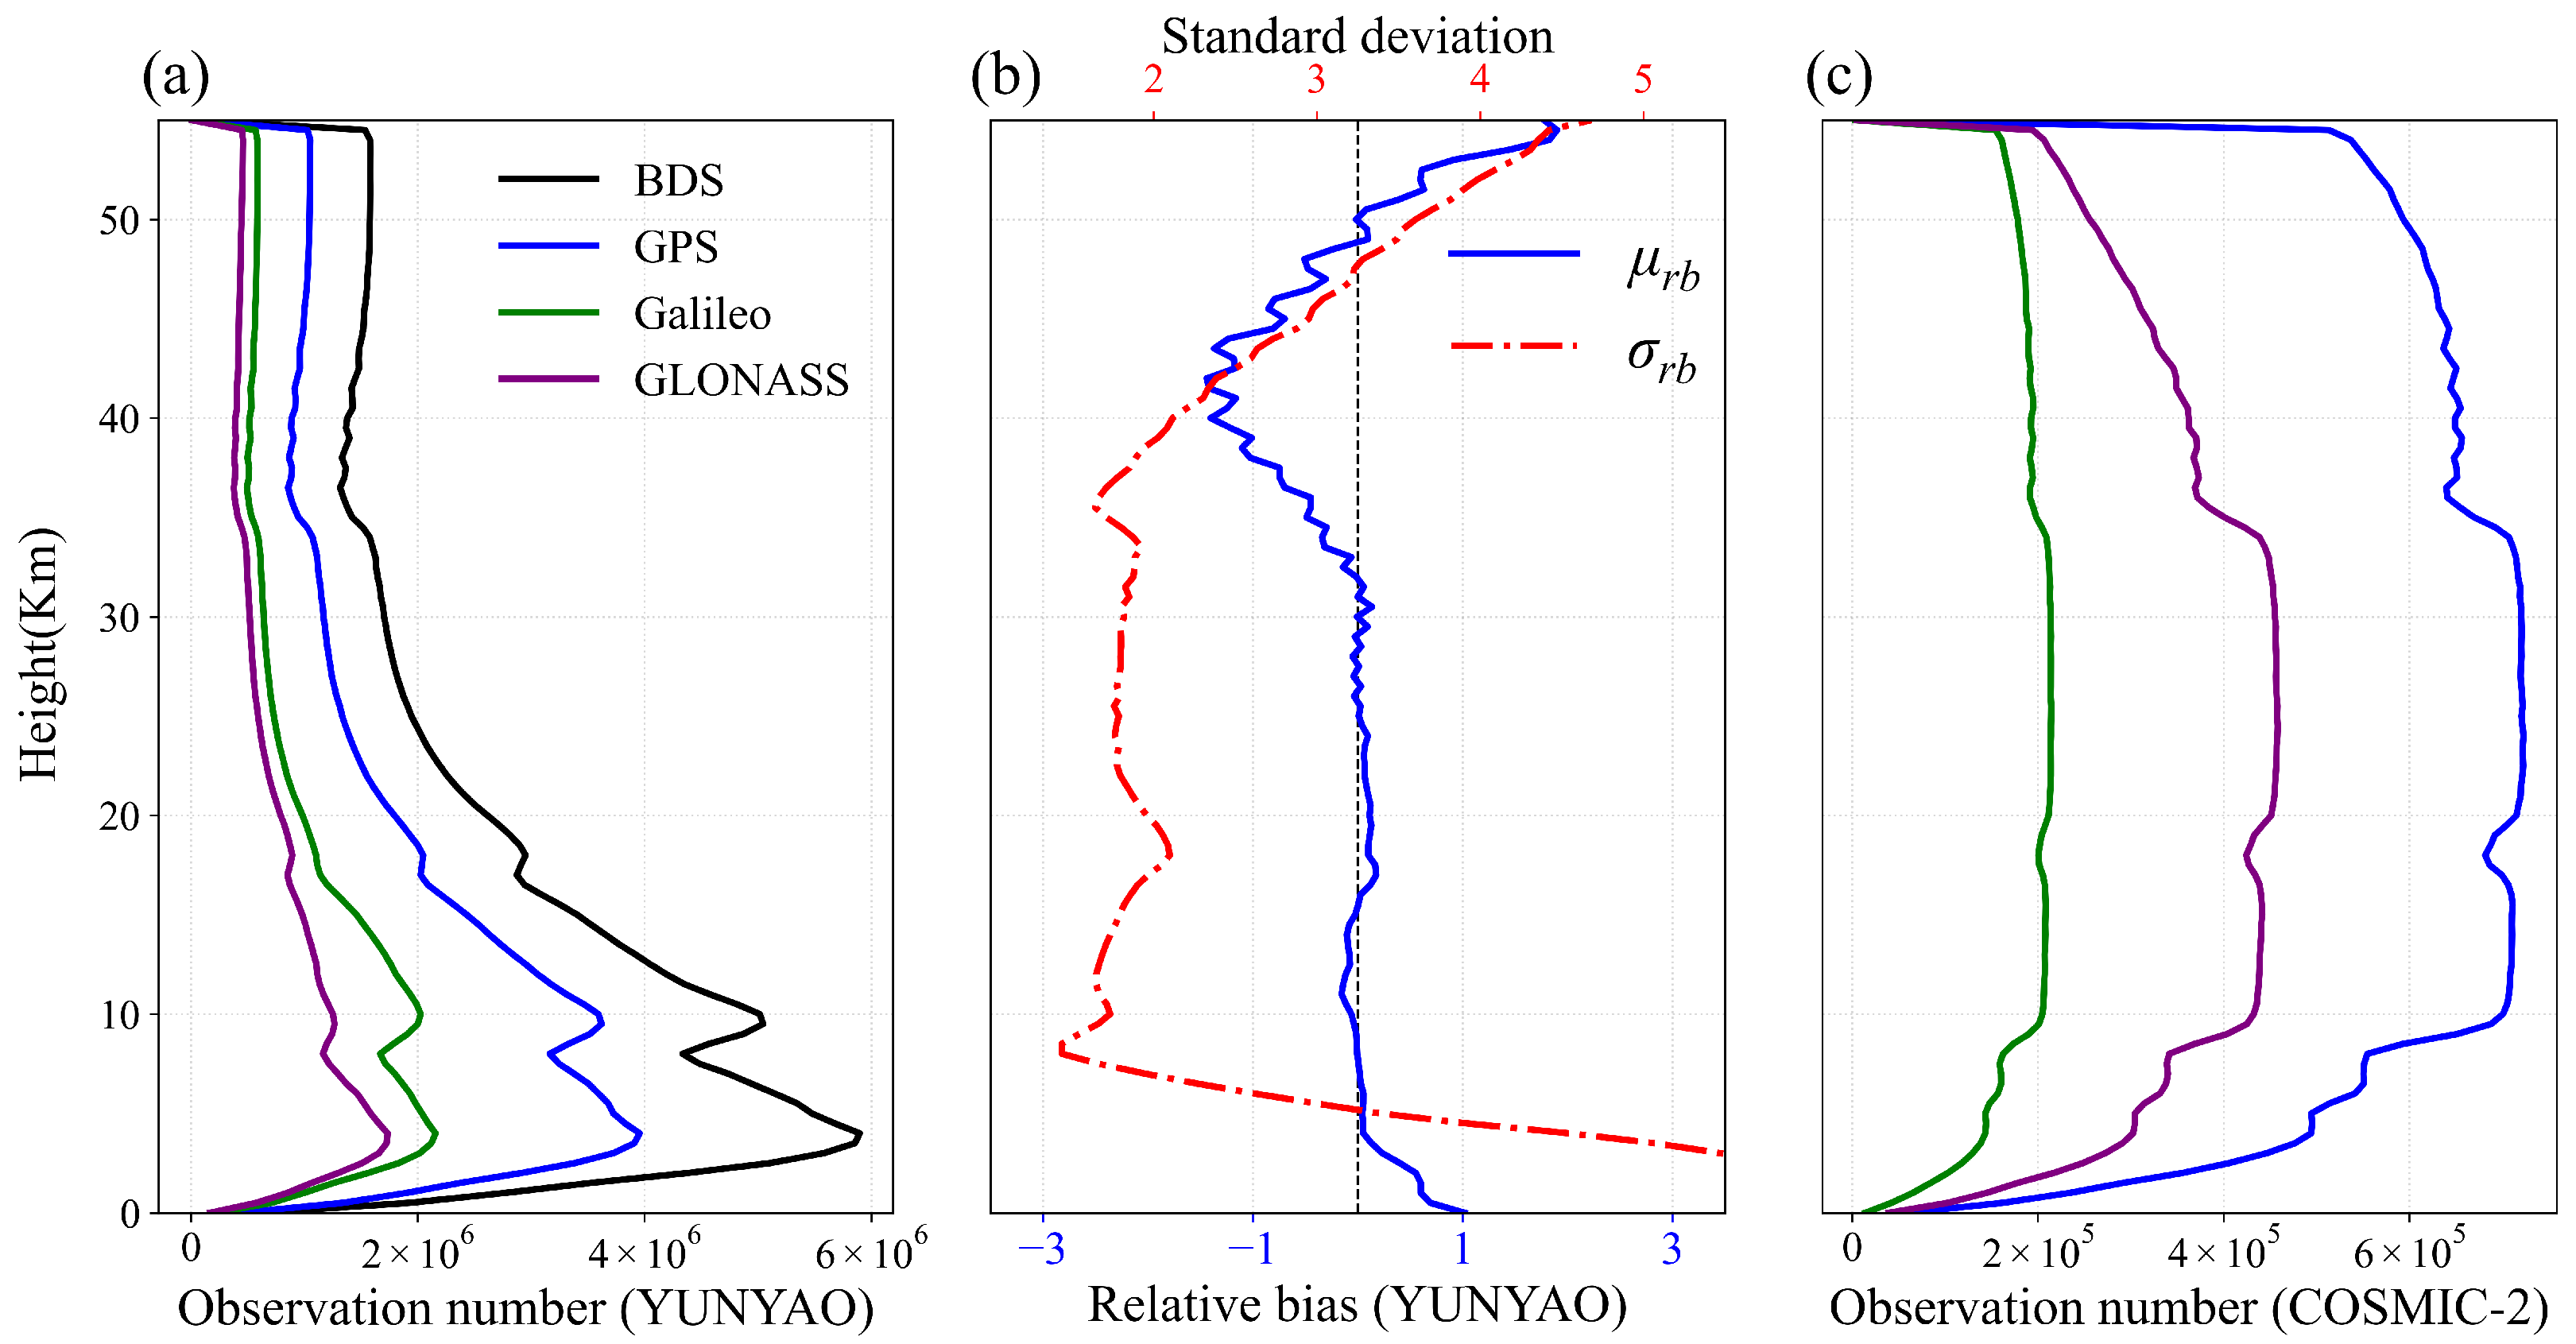
BDS    
The relative bias and standard deviation of bending angles retrieved from BDS (Figure 10b) are similar to those from GPS (Figure 9a) for the YUNYAO constellation. The number of observations for the YUNYAO constellation ranks in increasing order as follows: GLONASS, Galileo, GPS, and BDS. For the COSMIC-2 constellation, the rank is Galileo, GLONASS, and GPS. Interestingly, the observation number of YUNYAO peaks below 10 km, whereas that of COSMIC-2 exhibits a plateau from 10 km to 28 km. YUNYAO has nearly an order of magnitude more observations than COSMIC-2.
In summary, the errors for COSMIC-2 are consistently large in the 10–30 km altitude range, regardless of the GNSS satellite. In the altitude range of 10 to 30 km, the bending angle from the low-inclination COSMIC-2 constellation shows a bias of about 0.15% relative to high-inclination constellations such as Spire and YUNYAO [34].

3.6. Bias Among Different LEO Receivers

The LEO receivers in the YUNYAO constellation exhibit apparent differences in performance. Based on these differences, three groups are defined: the first (Y1) contains the four best receivers, the second (Y2) contains the three worst receivers, and the remaining receivers form the third group (Y3). Figure 11 shows the relative bias characteristics for each group.
Y1 
The Y1 group consists of Y005, Y015, Y016, and Y017 LEO satellites with 97 orbital inclination (Figure 11a). The performance of this group is above the average performance of the whole constellation. The relative bias is close to zero below 5 km, its magnitude above 30 km is less than the average of the whole constellation. The standard deviation of relative bias is the same, specifically, its value is not exceeded 1% and 4% below 5 km and above 30 km, respectively. In summary, this group of LEO satellites has the best performance.
Y2 
The Y2 group consists of Y018, Y019, and Y020 LEO satellites with 50 orbital inclination (Figure 11b). The relative bias of this group is evidently positive below 5 km, reaches −1% near 40 km, and climbs up to beyond 2% at 55 km. The standard deviation of relative bias reaches 5% near ground, and almost goes to 5% at 55 km. In general, this group exhibits suboptimal performance. Low-inclination LEO radio occultation events are predominantly located over tropical and subtropical oceanic regions, where strong water vapor gradients and pronounced temperature inversions cause the occultation rays to experience severe super refraction and ducting effects in the lower atmosphere below 2 km. Consequently, this results in non-uniqueness in the Abel inversion and introduces substantial systematic negative biases in both refractivity and bending angle [27].
Y3 
The Y3 group consists of the remaining LEO satellites in the YUNYAO constellation (Figure 11c). Its performance lies between the first two groups.
The third row in Figure 11 shows the difference between the statistics over the latitudinal ranges of 90°S–90°N and 45°S–45°N. Except below 3 km, the difference is minor, highlighting that orbital inclination is the primary factor driving the distinct performance between the Y1 and Y2 groups. LEO satellites with different inclinations have different geographical sampling regions. Notably, satellites with a 50° inclination naturally concentrate their occultation events over tropical oceans, where strong water vapor gradients and superrefraction occur. Therefore, geographical sampling in the strong water vapor gradients and superrefraction-prone tropical oceans contributes to the increase in positive bias below 3 km over the 45°S–45°N latitudinal range, rather than to performance differences in the middle and upper stratosphere. Many factors account for variations in LEO satellite performance, including differences in hardware, orbital parameters, and degradation in receivers and atomic clocks across launch batches. These subtle variations should be considered to maximize the utility of GNSS RO observations for data assimilation.

4. Discussion

This study systematically compares bending angle observations between the YUNYAO and COSMIC-2 constellations using the proposed bending angle observation operator. The NCEP bending angle observation operator (NBAM) [17], implemented in the GSI, has been widely used in both operational and research settings. The finer resolution of the Gauss-Legendre quadrature makes the proposed operator better at capturing complex structures in the lower troposphere, particularly in the moisture-rich tropical region. Consequently, the proposed operator yields smaller biases than NBAM in the lower troposphere (see Supplementary Figure S1b). Furthermore, the modified Akima interpolation avoids overshoots and undershoots, enhancing robustness against oscillations. As a result, the proposed operator produces slightly smaller biases above 35 km (see Supplementary Figure S1), where bending angle observations are prone to oscillations due to residual ionospheric errors, further demonstrating the accuracy of the proposed algorithm. It is anticipated that the proposed observation operator will find valuable applications in data assimilation.
Bending angles are closer to raw observations than refractivities. Therefore, understanding the quality of bending angle observations is a prerequisite for assimilating these data. With this motivation, this study comprehensively assesses, for the first time, the bias characteristics of bending angle observations in both the YUNYAO and COSMIC-2 constellations. The results demonstrate the quality of YUNYAO bending angle observations. The potential of assimilating YUNYAO radio occultation bending angles for numerical weather prediction using the proposed observation operator will be investigated in future work.
GNSS signal jamming poses a serious threat to civilian GNSS applications, particularly from electronic warfare, especially as the military use of GNSS-navigated weapon systems continues to grow [35]. The GNSS radio occultation technique is largely based on phase measurements; however, RO tracking is adversely affected by a weak signal-to-noise ratio. The number and quality of RO tracking measurements are significantly degraded by jamming. Its impact on GNSS RO measurements over the Eastern European region from the YUNYAO constellation is evident. Urgent measures are therefore required to safeguard GNSS signals and mitigate the detrimental effects of jamming on RO observations for the well-being of humanity.
This study is based on data from a single month (December 2024), which does not capture seasonal or solar cycle variations (e.g., tropospheric moisture, polar vortex dynamics, ionospheric conditions). However, the differential nature of the comparison makes systematic differences unlikely to reverse with season, and December already covers a wide range of atmospheric conditions while the key physical mechanisms are inherently seasonally robust. Therefore, the main conclusions about the relative performance of YUNYAO versus COSMIC-2 are expected to hold. Future work with multi-month consistent data is needed to fully characterize the seasonal behavior of YUNYAO bending angle observations.

5. Conclusions

This study presents a systematic assessment of bending angle observations from the YUNYAO and COSMIC-2 constellations for December 2024. The main conclusions are as follows:
1.
The YUNYAO constellation provides near-global coverage and a substantially larger number of observations than the COSMIC-2 constellation, which covers the tropical and subtropical regions from 45 S to 45 N with a uniform distribution of observations. Although YUNYAO offers near-global coverage, its observations are markedly reduced over Southeast Asia and South America, due respectively to onboard data transmission operations and strong ionospheric scintillation.
2.
Within the overlap region of COSMIC-2 and YUNYAO, the bending-angle quality of YUNYAO is broadly comparable to that of COSMIC-2. Between 3 and 30 km over 45 S 45 N , YUNYAO exhibits slightly larger bias and greater dispersion than COSMIC-2 overall. In the vertical profile obtained by horizontally averaging the relative bias, YUNYAO exhibits a smaller bias than COSMIC-2 below 30 km. Above 30 km, YUNYAO exhibits a more pronounced negative relative bias, likely related to residual ionospheric errors, whereas its dispersion above 40 km is smaller than that of COSMIC-2.
3.
Below 10 km, YUNYAO exhibits a larger positive bias over tropical convective regions but a comparable or smaller bias in subtropical to midlatitude areas compared to COSMIC-2. Between 30 and 40 km, YUNYAO shows a more pronounced negative bias than COSMIC-2, consistent with residual ionospheric errors. However, a striking positive bias appears over northern Eurasia and the northern Atlantic between 30 and 40 km, while a negative bias dominates the same region above 40 km, linked to a cold bias in the background associated with the exceptionally strong polar vortex in December 2024.
4.
The comparison among GNSS constellations and among LEO receivers further reveals clear heterogeneity in data quality. Galileo-derived bending angles outperform their GLONASS counterparts in the upper atmosphere. Additionally, different YUNYAO receiver groups exhibit substantial performance differences, highlighting the need for constellation-specific quality control and error estimation.
The findings demonstrate that the YUNYAO constellation is a valuable addition to the global GNSS-RO observing system. While this study shows clear advantages for YUNYAO over COSMIC-2 in spatial coverage and bias characteristics below 30 km, a direct comparison with other missions featuring more global coverage (e.g., PlanetiQ) is warranted. Future work will focus on assimilating YUNYAO bending angles into NWP systems using the proposed operator.

Supplementary Materials

The following supporting information can be downloaded at: https://www.mdpi.com/article/10.3390/rs18101566/s1, Figure S1: (a) Bias above 30 km for the M&G (blue) and NBAM (red) observation operators. (b) Relative bias (solid line) and its standard deviation (dashed line) for the M&G (red) and NBAM (blue) observation operators. M&G denotes the proposed observation operator in this study.

Author Contributions

Conceptualization, Y.Z.; methodology, Y.Z.; software, Y.Z.; validation, Y.Z.; formal analysis, S.W.; investigation, S.W. and Y.Z.; resources, F.L. and Z.Z.; data curation, Y.Z.; writing—original draft preparation, S.W. and Y.Z.; writing—review and editing, Y.Z. and S.W.; visualization, S.W.; supervision, Y.Z.; project administration, Y.Z. and F.L.; funding acquisition, Y.Z. All authors have read and agreed to the published version of the manuscript.

Funding

This research was funded by the National Natural Science Foundation of China (Grant No. 12241104 and 42275161) and the State Key Laboratory of Climate System Prediction and Risk Management (CPRM) initiative project (Grant No. CPRM-2025-NUIST-012).

Data Availability Statement

The observed and simulated bending angles, along with quality control flags used in this study, are publicly available at https://zenodo.org/records/19491528 (accessed on 10 May 2026) for both the YUNYAO and COSMIC-2 constellations.

Conflicts of Interest

Author Fenghui Li serves as a director of Tianjin Yunyao Aerospace Technology Co., Ltd. The remaining authors declare that the research was conducted in the absence of any commercial or financial relationships that could be construed as a potential conflict of interest.

References

  1. Hajj, G.A.; Kursinski, E.R.; Bertiger, W.I.; Leroy, S.S.; Meehan, T.K.; Romans, L.J.; Schofield, J.T. Initial Results of GPS-LEO Occultation Measurements of Earth’s Atmosphere Obtained with the GPS-MET Experiment. In Proceedings of the GPS Trends in Precise Terrestrial, Airborne, and Spaceborne Applications; Beutler, G., Melbourne, W.G., Hein, G.W., Seeber, G., Eds.; Springer: Berlin/Heidelberg, Germany, 1996; pp. 144–153. [Google Scholar]
  2. Zhran, M. An evaluation of GNSS radio occultation atmospheric profiles from Sentinel-6. Egypt. J. Remote Sens. Space Sci. 2023, 26, 654–665. [Google Scholar] [CrossRef]
  3. Li, X.; Zhang, X.; Li, Y.; Wang, S.; Li, X.; Lu, T. Profiling the Atmosphere Refractivity Using the Airborne GNSS Radio Occultation Sounding. Spacecr. Eng. 2011, 20, 84–89. [Google Scholar]
  4. Deng, N. Accuracy Assessment of the Forward Operator for GNSS RO Data Precessing and Assimilation. Master’s Thesis, University of Chinese Academy of Sciences, Beijing, China, 2022. [Google Scholar]
  5. von Engeln, A.; Nedoluha, G. Retrieval of temperature and water vapor profiles from radio occultation refractivity and bending angle measurements using an Optimal Estimation approach: A simulation study. Atmos. Chem. Phys. 2005, 5, 1665–1677. [Google Scholar] [CrossRef]
  6. Tang, H.; Walter, T.; Blanch, J.; Enge, P.; Chan, F. Flight Test Data Validation of Dual-Frequency GPS Measurement Error Characteristics. In Proceedings of the 22nd International Technical Meeting of the Satellite Division of The Institute of Navigation (ION GNSS 2009), Savannah, GA, USA, 22–25 September 2009; pp. 1637–1644. [Google Scholar]
  7. Kursinski, E.R.; Hajj, G.A.; Schofield, J.T.; Linfield, R.P.; Hardy, K.R. Observing Earth’s atmosphere with radio occultation measurements using the Global Positioning System. J. Geophys. Res. Atmos. 1997, 102, 23429–23465. [Google Scholar] [CrossRef]
  8. Anthes, R.A.; Bernhardt, P.A.; Chen, Y.; Cucurull, L.; Dymond, K.F.; Ector, D.; Healy, S.B.; Ho, S.P.; Hunt, D.C.; Kuo, Y.H.; et al. The COSMIC/FORMOSAT-3 Mission: Early Results. Bull. Am. Meteorol. Soc. 2008, 89, 313–334. [Google Scholar] [CrossRef]
  9. Ho, S.P.; Zhou, X.; Shao, X.; Zhang, B.; Adhikari, L.; Kireev, S.; He, Y.; Yoe, J.G.; Xia-Serafino, W.; Lynch, E. Initial Assessment of the COSMIC-2/FORMOSAT-7 Neutral Atmosphere Data Quality in NESDIS/STAR Using In Situ and Satellite Data. Remote Sens. 2020, 12, 4099. [Google Scholar] [CrossRef]
  10. Miller, W.J.; Chen, Y.; Ho, S.P.; Shao, X. Evaluating the Impacts of COSMIC-2 GNSS RO Bending Angle Assimilation on Atlantic Hurricane Forecasts Using the HWRF Model. Mon. Weather. Rev. 2023, 151, 1821–1847. [Google Scholar] [CrossRef]
  11. Lonitz, K.; Bowler, N.; Hólm, E.; Healy, S. Assimilating Spire and COSMIC-2 data into the IFS. ECMWF Newsl. 2021, 169, 25–32. [Google Scholar] [CrossRef]
  12. Huang, F.; Yin, C.; Liu, Y.; Sun, Y.; Xia, J.; Bai, W. Tianmu-1 Constellation GNSS-R In-Orbit Performance: Spatiotemporal Characteristics, Product Applications, and Polarimetric Features. IEEE Trans. Geosci. Remote Sens. 2025, 63, 5802020. [Google Scholar] [CrossRef]
  13. Yang, S.; Zou, X. Assimilating Tianmu-1 RO Data From a 23-Satellite Constellation to Enhance the Track Forecasts of Typhoon Gaemi (2024). Geophys. Res. Lett. 2025, 52, e2025GL115679. [Google Scholar] [CrossRef]
  14. Yue, H.; Fu, N.; Li, F.; Cheng, Y.; Wu, M.; Guo, P.; Dong, W.; Hu, X.; Wang, F. The Yunyao LEO Satellite Constellation: Occultation Results of the Neutral Atmosphere Using Multi-System Global Navigation Satellites. Remote Sens. 2025, 17, 2851. [Google Scholar] [CrossRef]
  15. Xu, X.; Han, W.; Wang, J.; Gao, Z.; Li, F.; Cheng, Y.; Fu, N. Quality assessment of YUNYAO radio occultation data in the neutral atmosphere. Atmos. Meas. Tech. 2025, 18, 1339–1353. [Google Scholar] [CrossRef]
  16. Zou, X.; Liu, H. Impact multipath quality control improving GPS RO data assimilation in the tropical lower troposphere. Trans. Atmos. Sci. 2020, 43, 116–127. [Google Scholar] [CrossRef]
  17. Cucurull, L.; Derber, J.C.; Purser, R.J. A bending angle forward operator for global positioning system radio occultation measurements. J. Geophys. Res. Atmos. 2013, 118, 14–28. [Google Scholar] [CrossRef]
  18. Healy, S.B.; Thépaut, J.N. Assimilation experiments with CHAMP GPS radio occultation measurements. Q. J. R. Meteorol. Soc. 2006, 132, 605–623. [Google Scholar] [CrossRef]
  19. Rüeger, J.M. Refractive Index Formulae for Electronic Distance Measurements with Radio and Millimetre Waves; Technical Report 109; School of Surveying and Spatial Information Systems, University of New South Wales: Sydney, Australia, 2002. [Google Scholar]
  20. Akima, H. A New Method of Interpolation and Smooth Curve Fitting Based on Local Procedures. J. ACM 1970, 17, 589–602. [Google Scholar] [CrossRef]
  21. Moler, C.B. Makima Piecewise Cubic Interpolation. Cleve’s Corner: Cleve Moler on Mathematics and Computing. 29 April 2019. Available online: https://blogs.mathworks.com/cleve/2019/04/29/makima-piecewise-cubic-interpolation/ (accessed on 10 May 2026).
  22. Gautschi, W. Numerical Analysis, 2nd ed.; Birkhäuser: Boston, MA, USA, 2012. [Google Scholar] [CrossRef]
  23. Kleist, D.T.; Parrish, D.F.; Derber, J.C.; Treadon, R.; Wu, W.S.; Lord, S. Introduction of the GSI into the NCEP Global Data Assimilation System. Weather. Forecast. 2009, 24, 1691–1705. [Google Scholar] [CrossRef]
  24. Nguyen, C.; Oluwadare, S.; Le, N.; Alizadeh, M.; Wickert, J.; Schuh, H. Spatial and Temporal Distributions of Ionospheric Irregularities Derived from Regional and Global ROTI Maps. Remote Sens. 2022, 14, 10. [Google Scholar] [CrossRef]
  25. Yue, X.; Schreiner, W.S.; Pedatella, N.; Anthes, R.A.; Mannucci, A.J.; Straus, P.R.; Liu, J. Space Weather Observations by GNSS Radio Occultation: From FORMOSAT-3/COSMIC to FORMOSAT-7/COSMIC-2. Space Weather 2014, 12, 616–621. [Google Scholar] [CrossRef] [PubMed]
  26. Liu, C.; Kirchengast, G.; Syndergaard, S.; Schwaerz, M.; Danzer, J.; Sun, Y. New Higher-Order Correction of GNSS RO Bending Angles Accounting for Ionospheric Asymmetry: Evaluation of Performance and Added Value. Remote Sens. 2020, 12, 3637. [Google Scholar] [CrossRef]
  27. Feng, X.; Xie, F.; Ao, C.O.; Anthes, R.A. Ducting and Biases of GPS Radio Occultation Bending Angle and Refractivity in the Moist Lower Troposphere. J. Atmos. Ocean. Technol. 2020, 37, 1013–1025. [Google Scholar] [CrossRef]
  28. Liu, C.L.; Kirchengast, G.; Zhang, K.; Norman, R.; Li, Y.; Zhang, S.C.; Fritzer, J.; Schwaerz, M.; Wu, S.Q.; Tan, Z.X. Quantifying residual ionospheric errors in GNSS radio occultation bending angles based on ensembles of profiles from end-to-end simulations. Atmos. Meas. Tech. 2015, 8, 2999–3019. [Google Scholar] [CrossRef]
  29. Sokolovskiy, S.; Rocken, C.; Schreiner, W.; Hunt, D. On the uncertainty of radio occultation inversions in the lower troposphere. J. Geophys. Res. Atmos. 2010, 115, D22. [Google Scholar] [CrossRef]
  30. Angling, M.J.; Elvidge, S.; Healy, S.B. Improved model for correcting the ionospheric impact on bending angle in radio occultation measurements. Atmos. Meas. Tech. 2018, 11, 2213–2224. [Google Scholar] [CrossRef]
  31. Kuchar, A.; Stocker, M.; Bell, A.; Lehner, B.; Kult-Herdin, J.; Chiodo, G.; Sukhodolov, T.; Rozanov, E.; Stober, G.; Rieder, H.E. Was the strengthening of the Northern polar vortex in 2024/2025 associated with the Hunga Tonga eruption? EGUsphere 2026, 2026, 1–25. [Google Scholar] [CrossRef]
  32. Lawrence, Z.D.; Elsbury, D.; Butler, A.H.; Perlwitz, J.; Albers, J.R.; Ciasto, L.M.; Ray, E. Evaluation of Processes Related to Stratosphere–Troposphere Coupling in GEFSv12 Subseasonal Hindcasts. Mon. Weather. Rev. 2023, 151, 1735–1755. [Google Scholar] [CrossRef]
  33. Kiliszek, D.; Korolczuk, K. Impact of Satellite Clock Corrections and Different Precise Products on GPS and Galileo Precise Point Positioning Performance. Sensors 2026, 26, 588. [Google Scholar] [CrossRef]
  34. Anthes, R.; Sjoberg, J.; Starr, J.; Zeng, Z. Evaluation of biases and uncertainties in ROMEX radio occultation observations. Atmos. Meas. Tech. 2025, 18, 6997–7019. [Google Scholar] [CrossRef]
  35. Wu, D.L. GNSS Signal Jamming as Observed From Radio Occultation. IEEE J. Sel. Top. Appl. Earth Obs. Remote Sens. 2024, 17, 8642–8645. [Google Scholar] [CrossRef]
Figure 1. Schematic illustration of the basic principle of GNSS RO.
Remotesensing 18 01566 g001
Figure 2. Comparison between the modified Akima piecewise cubic interpolation and the smooth cubic interpolation for discrete step-like data points (x = −3, −2, −1, 0, 1, 2, 3; y = −1, −1, −1, 0, 1, 1, 1) with a sharp jump at x = 0.
Remotesensing 18 01566 g002
Figure 3. The horizontal map of number of observations after quality control in December of 2024 of the YUNYAO (a) and COSMIC-2 (b) constellations. The number of observations is the number of bending angle observations after quality control within a box of 1 ( latitude ) × 2 ( longitude ) , not the number of profiles within the box.
Remotesensing 18 01566 g003
Figure 4. Latitudinal distributions of the mean (solid lines) and standard deviation (shaded) of the relative bias of the YUNYAO (black line and gray shaded) and COSMIC-2 (blue line and light blue shaded) constellations.
Remotesensing 18 01566 g004
Figure 5. The distribution (shaded) and mean (white bar) of the bias of bending angles in the layer of 0 –3 km (a), 3 –10 km (b), 10 –20 km (c), 20 –30 km (d), 30 –40 km (e), and 40 –55 km (f). The left and right violin plots in each panel are for the latitudinal zone of 30 S 30 N and 30 S 45 S 30 N 45 N , respectively. The left (blue) and right (orange) parts of each violin plot are for the YUNYAO and COSMIC-2 Constellations, respectively. It is worth noting that the biases in different altitude layers are of different orders of magnitude.
Remotesensing 18 01566 g005
Figure 6. Latitude-height cross-section of the bias in rad (a,b), its standard deviation (d,e), and number of observations (g,h) within a box of 10 in latitude × 500 m in altitude for YUNYAO (a,d,g) and COSMIC-2 (b,e,h). The differences of the bias, its standard deviation, and number of observations between YUNYAO and COSMIC-2 are (c,f,i), respectively.
Remotesensing 18 01566 g006
Figure 7. Latitude-height cross-section of the relative bias in percent (a,b) and its standard deviation (d,e) of YUNYAO (a,d) and COSMIC-2 (b,e). The differences of the relative bias and its standard deviation between YUNYAO and COSMIC-2 are (c,f), respectively.
Remotesensing 18 01566 g007
Figure 8. Maps of the relative bias (first column) of YUNYAO and their difference between YUNYAO and COSMIC-2 (second column) at 0–3 km (a,b), 3–10 km (c,d), 10–20 km (e,f), 20–30 km (g,h), 30–40 km (i,j), and 40–55 km (k,l). The statistics are performed within a box of 5 × 5 .
Remotesensing 18 01566 g008
Figure 9. Relative bias (blue line) and its standard deviation (red line) from GPS (a,d,g), Galileo (b,e,h), and GLONASS (c,f,i): (ac) for YUNYAO, (df) for COSMIC-2, and (gi) the difference between YUNYAO and COSMIC-2.
Remotesensing 18 01566 g009
Figure 10. (a) Observation numbers in the YUNYAO constellation from GPS, Galileo, GLONASS, and BDS. (b) YUNYAO relative bias (blue), its standard deviation (red), and zero relative bias (black dotted line) for bending angles retrieved from BDS. (c) Observation numbers in the COSMIC-2 constellation from GPS, Galileo, and GLONASS.
Remotesensing 18 01566 g010
Figure 11. Relative bias (blue solid line), its standard deviation (red dashed line), and zero relative bias (black dotted line) for YUNYAO LEO satellites Y1, Y2, and Y3: (ac) for the 90°S–90°N band; (df) for the 45°S–45°N band; and (gi) the difference between the two bands. Within each row, the three panels correspond to Y1, Y2, and Y3, respectively.
Remotesensing 18 01566 g011
Table 1. Summary of YUNYAO and COSMIC-2 RO data.
YUNYAOCOSMIC-2
period of dataDec 2024Dec 2024
number of satellites186
orbital inclination97.6° or 50°24°
coveragenear-global45°S–45°N
GNSSGPS, GLONASS, Galileo, and BDSGPS, GLONASS, and Galileo
data formatNetCDFNetCDF
number of daily profiles25,1785687
Table 2. The cutoff values depending on the latitude ( l a t in radian), impact height (H in km), and temperature (T in kelvin) for the relative innovation.
HCutoff
>36 c u t o f f 1 c u t o f f 1 = 4.725 + H × ( 0.045 + H × 0.005 ) / 2 c u t o f f 2 = 1.5 + cos ( l a t ) c u t o f f 3 = 1.0 if T 240 ( 0.0025 × T 1.15 ) × T + 133 if T > 240 c u t o f f 4 = 4.0 + 8.0 × cos ( l a t ) / 2
34 –36 ( 36 H ) × c u t o f f 2 + ( H 34 ) × c u t o f f 1 / 2
11–34 c u t o f f 2
9–11 ( 11 H ) × c u t o f f 3 + ( H 9 ) × c u t o f f 2 / 2
6–9 c u t o f f 3
4–6 ( 6 H ) × c u t o f f 4 + ( H 4 ) × c u t o f f 3 / 2
<4 c u t o f f 4
Table 3. Dispersion of the bias in different layers between the YUNYAO and COSMIC-2 constellations.
30 S 30 N 30 S 45 S 30 N 45 N
YUNYAOCOSMIC-2YUNYAOCOSMIC-2
0–3 km 1.4 × 10 3 1.3 × 10 3 1.1 × 10 3 1.1 × 10 3
3–10 km 5.0 × 10 4 4.1 × 10 4 3.6 × 10 4 3.0 × 10 4
10–20 km 7.7 × 10 5 5.8 × 10 5 8.1 × 10 5 6.1 × 10 5
20–30 km 2.0 × 10 5 1.5 × 10 5 1.5 × 10 5 1.2 × 10 5
30–40 km 3.6 × 10 6 3.0 × 10 6 3.1 × 10 6 2.8 × 10 6
40–55 km 9.6 × 10 7 1.1 × 10 6 9.5 × 10 7 1.1 × 10 6
Disclaimer/Publisher’s Note: The statements, opinions and data contained in all publications are solely those of the individual author(s) and contributor(s) and not of MDPI and/or the editor(s). MDPI and/or the editor(s) disclaim responsibility for any injury to people or property resulting from any ideas, methods, instructions or products referred to in the content.