Article

Sentinel-1 Consecutive Interferogram Stacking Approach (CISA) for High-Resolution and Near-Real-Time Ground Subsidence Mapping

1
School of Remote Sensing and Information Engineering, Wuhan University, Wuhan 430079, China
2
Viridien Satellite Mapping, Crawley RH10 9QN, UK
3
Hubei Luojia Laboratory, Wuhan 430079, China
4
GuiZhou Survey/Design Institute for Water Resources and Hydropower Co., Ltd., Guiyang 550002, China
5
State Key Laboratory of Information Engineering in Surveying, Mapping and Remote Sensing, Wuhan University, Wuhan 430079, China
*
Author to whom correspondence should be addressed.
Remote Sens. 2026, 18(10), 1486; https://doi.org/10.3390/rs18101486
Submission received: 10 March 2026 / Revised: 21 April 2026 / Accepted: 24 April 2026 / Published: 9 May 2026

Highlights

What are the main findings?
  • The Consecutive Interferogram Stacking Approach (CISA) generates interferograms between consecutive SAR acquisitions to minimize temporal decorrelation, significantly enhancing interferogram coherence and quality.
  • Displacement patterns from multi-dimensional modeling are consistent with blind-fault-related structures, suggesting that fault zones may influence subsidence patterns, while groundwater withdrawal and urbanization likely contribute to observed periodic deformation cycles.
What are the implications of the main findings?
  • CISA enables near-real-time subsidence monitoring—new SAR acquisitions require only one additional interferogram with the previous image to update deformation velocities, eliminating the need to reprocess entire datasets as required by conventional techniques.
  • Characterization of these deformation patterns offers insights for seismic hazard considerations in densely populated regions, supporting infrastructure resilience planning and informed urban development strategies.

Abstract

Interferometric Synthetic Aperture Radar (InSAR) is crucial for monitoring ground displacement, particularly in Pakistan’s capital area, where urban expansion and active geotectonics converge. This study introduces the Consecutive Interferogram Stacking Approach (CISA), a processing framework optimized for near-real-time deformation monitoring using full-resolution Sentinel-1 data from adjacent acquisition pairs. Unlike conventional InSAR techniques that rely on spatial multilooking to suppress phase noise—which sacrifices spatial resolution for computational efficiency—CISA preserves native resolution through sequential interferogram stacking, accepting that short-interval interferograms retain geophysical phase instabilities (including fading signals) inherent to scatterer decorrelation. By minimizing temporal decorrelation through consecutive pairing, CISA enhances interferogram coherence (6–14% improvement) and reduces Root Mean Square Error (RMSE) by approximately 25% compared to conventional multilooked time series, while enabling the computational efficiency critical for operational applications. The framework’s incremental architecture allows velocity updates within hours of new image acquisition—requiring only single interferogram addition rather than complete network reprocessing—making it suitable for rapid-response hazard assessment where latency constraints outweigh the need for long-baseline phase filtering. CISA reveals spatiotemporal subsidence patterns potentially reflecting the influence of fault zone geometry, groundwater fluctuation, and urbanization, with full-resolution analysis delineating linear deformation patterns spatially consistent with blind fault traces through multi-directional displacement modeling. These findings demonstrate that operational monitoring of geohazards can be achieved through strategic trade-offs between processing latency and geophysical noise suppression, providing actionable intelligence for infrastructure risk management in tectonically active urban environments.

1. Introduction

Ground subsidence is the localized sinking of the Earth’s surface, either slowly or abruptly, resulting from the natural or human-induced compression of unconsolidated subsurface materials [1,2,3], such as excessive extraction of groundwater, structural loads, seismic activity, subsurface construction, and mining. This process can profoundly shape how land is used, complicate urban design, disrupt transport networks, impair flood defences and drainage systems, and undermine building stability. It can also trigger a range of geohazards, including sudden collapses, slope failures, and debris flows.
Globally, the threat of potential ground subsidence affects approximately 8% of the land area, or around 12 million square kilometers. It impacts 1596 major cities, 19% of the world’s population, and accounts for 12% of the global GDP [4]. Furthermore, 11 low-lying coastal cities worldwide are at risk of being submerged by the end of this century due to subsidence [5,6]. By 2040, it is projected that one-fifth of the global population will be impacted by ground subsidence [4].
The Islamabad/Rawalpindi region, one of Pakistan’s most densely populated areas, is situated in an area with significant seismic activity. This region has been hit by several major earthquakes, including the Mw 7.6 Muzaffarabad earthquake in 2005 [7], Mw 5.1 Phalla Earthquake in 2015 [8], and a notable one, 4.6 Mw of earthquake in 2017, indicating that the initiation of blind thrust faulting resulted in an uplift of the hanging wall block and subsidence of the footwall block [9]. Ground subsidence is linked to movement on a hidden thrust fault within the Khairi Murat system: a buried thrust that lies between the Dhurnal Blind Thrust to the south and the Bokra Thrust to the north is driving the current subsidence [9]. The area is susceptible not only to frequent and intense earthquakes but also to land subsidence caused by factors such as uncontrolled groundwater extraction, urban development, and particular soil conditions [10]. Hence, there is an immediate necessity for regular and swift monitoring of ground displacement across the capital region.
Interferometric Synthetic Aperture Radar (InSAR) is a powerful geodetic tool that provides highly accurate displacement measurements over large areas with millimeter-level precision by comparing successive radar images [11,12,13,14]. It is widely used to monitor ground movement caused by seismic activity, urban land subsidence, volcanic eruptions, landslides, glacier movement, reclaimed land stability, infrastructure deformation, and mining subsidence [8,13,14,15,16,17,18,19,20,21,22].
During the past few decades, two main branches of InSAR time series analysis have been proposed, namely Persistent Scatterer Interferometry (PSI) [11] and Small Baseline Subset (SBAS) [23]. PSI is recognized for its high-precision monitoring capabilities, particularly in urban areas where Persistent Scatterers (PS) such as buildings and infrastructure are prevalent. On the other hand, SBAS usually involves a larger number of interferograms being processed and provides broader coverage by incorporating distributed scatterers (DS) [24], making it more suitable for monitoring non-urban areas where PSI might struggle due to relatively low coherence.
The exponential growth in SAR data volumes has necessitated the development of near-real-time InSAR processing architectures that circumvent the computational burden of traditional network reprocessing. Conventional methodologies, while achieving millimeter-level deformation precision, require quadratic recomputation of the entire interferometric network upon each new acquisition, rendering them computationally prohibitive for operational monitoring systems. To address this bottleneck, recent investigations have proposed sequential estimation frameworks that leverage Bayesian least-squares adjustment or Kalman filtering to incrementally update deformation parameters without historical reprocessing [25]. For instance, sequential SBAS approaches utilizing progressive adjustment strategies have demonstrated approximately 40% reduction in computation time while maintaining geodetic consistency with conventional solutions [26], whereas ground-based implementations employing sequential estimators have achieved near-real-time slope monitoring with computation time growth rates reduced to one-tenth of traditional batch processing. Furthermore, Staniewicz, et al. [27] recently introduced a continental-scale sequential phase-linking approach using compressed single-look-complex images and mini-stack reference schemes, enabling surface displacement estimation within hours of new image acquisition. However, these existing sequential methodologies typically require maintaining extensive interferometric pair archives or implementing complex atmospheric phase screen corrections at each update cycle, thereby introducing storage redundancy or latency that limits their applicability in resource-constrained operational environments. Consequently, there remains a critical need for algorithmic frameworks that achieve constant-time complexity updates while eliminating storage redundancy—precisely the gap addressed by the CISA architecture proposed herein.
In this article, we introduce an effective workflow for InSAR processing optimized for near-real-time deformation monitoring. Unlike conventional InSAR time series algorithms that rely on extensive network reprocessing or spatial multilooking to suppress geophysical noise, our Consecutive Interferogram Stacking Approach (CISA) forms full-resolution interferograms consecutively in the order of acquisition time, with each epoch serving as both the primary reference for its subsequent acquisition and the secondary reference for its preceding one. This consecutive pairing minimizes temporal decorrelation—critical for maintaining interferometric coherence—but inherently restricts temporal baselines to the satellite repeat interval (e.g., 12 days for Sentinel-1).
While short temporal baselines enhance coherence, they retain geophysical phase instabilities known as fading signals—stochastic variations arising from scatterer electromagnetic instability (e.g., soil moisture fluctuations, vegetation phenology, dielectric changes) that intensify as temporal baseline decreases [28]. Contrary to conventional belief, spatial multilooking does not introduce these artifacts; rather, it serves as a mechanism to detect, mitigate, and correct fading through spatial averaging at the cost of resolution loss [29]. CISA deliberately forgoes multilooking to preserve full spatial resolution and enable incremental velocity updates within hours of new image acquisition, accepting that short-interval interferograms retain fading signals that would otherwise be suppressed by long-baseline or multilooked processing. Thus, the framework operates on an operational trade-off: computational efficiency and temporal fidelity are prioritized over the phase stabilization achieved through traditional spatial filtering.
CISA deliberately forgoes spatial multilooking to preserve full spatial resolution and enable incremental velocity updates within hours of new image acquisition. Consequently, the framework accepts that short-interval, full-resolution interferograms retain geophysical fading signals that would otherwise be suppressed by long-baseline averaging. While this preserves the high-spatial-frequency deformation field essential for detecting localized infrastructure deformation, it requires acknowledging that phase noise (including fading) is managed through temporal consistency constraints and operational speed rather than through traditional spatial filtering. Thus, CISA serves as an operational framework for rapid-response monitoring where latency constraints outweigh the requirement for long-baseline phase stabilization, providing actionable deformation intelligence for hazard assessment rather than millimetric-precision geodetic measurement.
Here, we applied CISA to estimate ground subsidence and made a comparative assessment with traditional InSAR time series techniques. Two years of Sentinel-1 SAR imagery, spanning from July 2022 to August 2024, for both descending and ascending geometries, were extracted for the Rawalpindi/Islamabad twin cities to generate interferograms. The consecutive interferograms were utilized to estimate the Line of Sight (LOS) displacement velocity, which was decomposed into vertical and horizontal displacement velocities for further investigation. Correlation analysis was conducted on InSAR outputs, considering both natural and human-induced subsidence conditioning factors. The existence of blind faults was prominently detected through multi-directional displacement modeling, analyzed in conjunction with previous InSAR-based and geological studies [9,30]. The study demonstrates that the proposed method is capable not only of uncovering ground subsidence characteristics but also of elucidating the connection between geotectonic processes, urban development, and ground subsidence, while providing the computational efficiency necessary for operational monitoring systems.
The remainder of this paper is structured as follows. Section 2 outlines the hydrogeological conditions of the study area and identifies the main datasets utilized in this research andelaborates on the proposed time series CISA processing method. Section 3 showcases the experimental outcomes derived from both simulated and real-world data. Section 5 examines the evolving characteristics of ground subsidence in the study area, considering both spatial and temporal changes, as well as the contributing factors. Lastly, Section 5 offers a concise summary of the paper.

2. Materials and Methods

2.1. Study Area

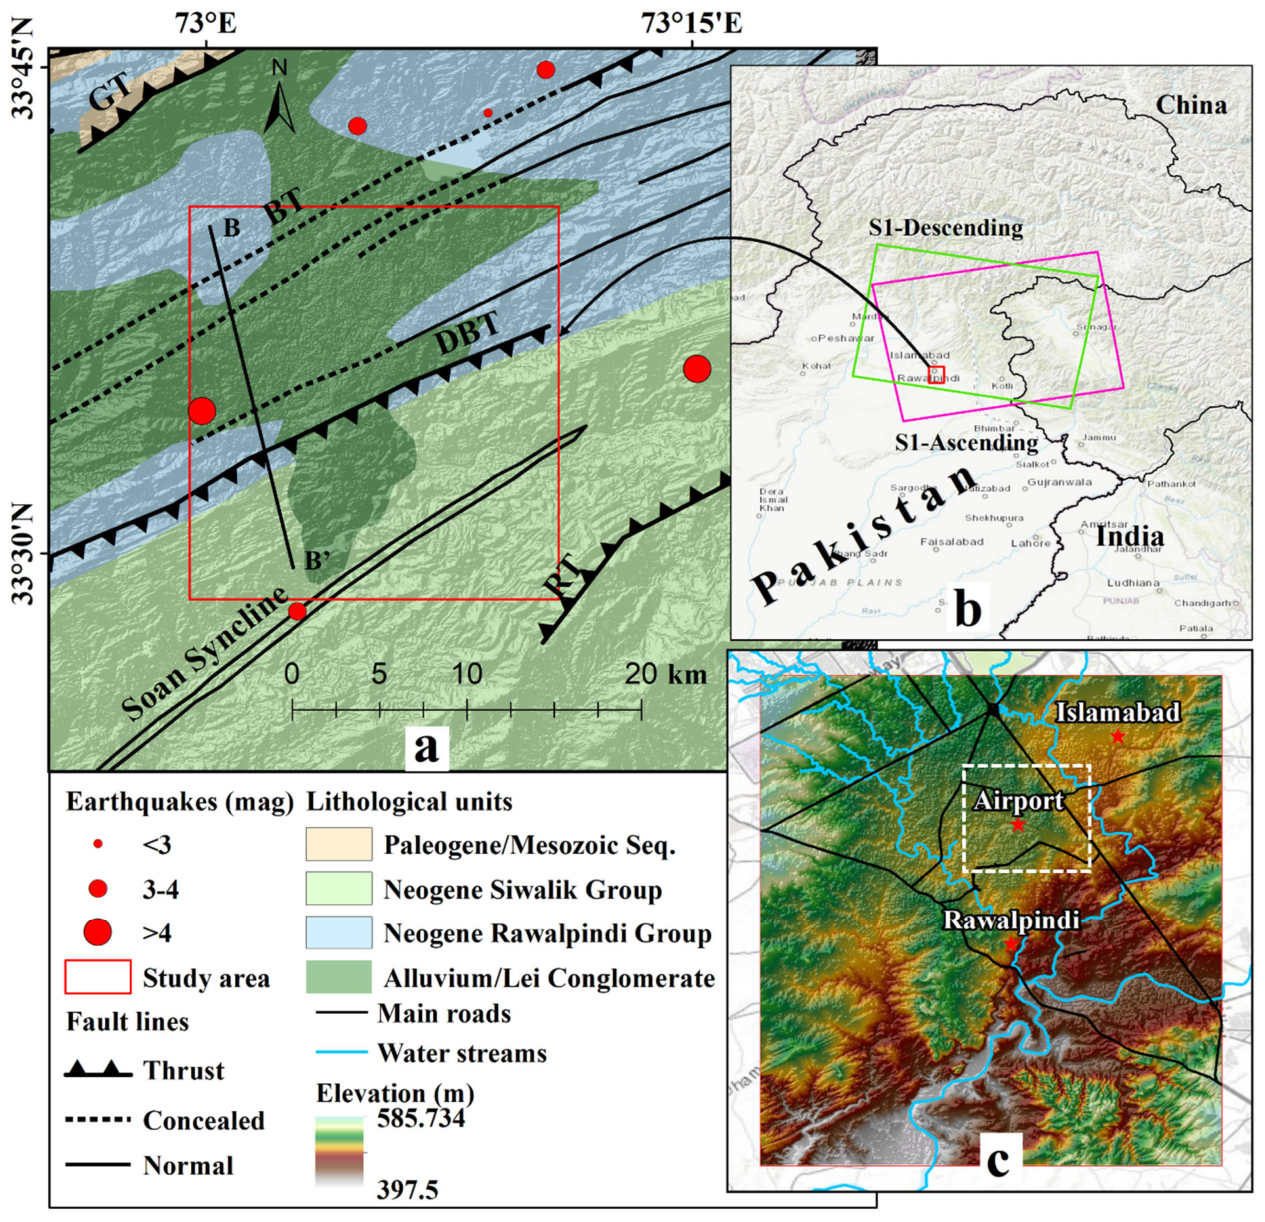
The twin cities of Islamabad and Rawalpindi are situated at the foot of the Margalla hills on the east of the North Potwar deformed zone (Figure 1). In contrast to the medium to high altitude mountains of the Lesser and Greater Himalayas that lie to the north of Islamabad, the Sub-Himalayas mark the southern boundary of the Himalayan range [31]. The area is characterized by low, narrow hills separated by wide valleys. Located on the northern boundary of the Potwar Plateau and forming part of the Himalayas, the underlying geology of the Islamabad-Rawalpindi metropolitan region features substantial folds and faults. These structures were formed during the Himalayan mountain-building period. This tectonically active zone is geologically part of the Salt Range and Potwar Plateau [10].
The Rawalpindi/Islamabad metropolitan area is the fourth-largest in Pakistan. The population is 2.4 and 1.3 million, which has been increasing by 35% and 11% in Rawalpindi and Islamabad from 2010 to 2024 . In terms of construction, the built-up area in Rawalpindi increased from 3.7% (60 km2) to 14.1% (228 km2), while in Islamabad, it rose from 5.7% (52 km2) to 25.7% (233 km2) from 1990 to 2021 [32]. This significant expansion in built-up areas reflects the rapid urbanization and construction activities in both cities. In this study, a highly dense, constructed, and populated area has been investigated to estimate ground subsidence in the central city area and analyze the conditioning parameters of ground movement.
Geologically, it is considered a part of the Sub-Himalayan region [33]. The area is situated directly on the footwall of the main boundary thrust (MBT), one of the primary boundary faults in the Himalayas. A section of this significant regional fault in the Kashmir area, northeast of Islamabad, was the source of the major earthquake (Mw 7.6) that occurred in 2005 [7,34]. The importance of tectonic activity in the study area is illustrated in Figure 1a. This figure shows that the study area is surrounded by a multitude of structural faults, including thrust faults, reverse faults, concealed faults, and evidence of blind faults, as revealed through various InSAR studies. Treloar [35] said the majority of the topographic and morphological alterations in this region can be attributed to tectonic activity.
To the north, the main boundary thrust (MBT), the Golra thrust (GT), and the Bokra thrust (BT) are significant thrust faults in the area. Geological features such as topography, fault breccia, and water seepage at specific locations offer insights into the fault systems present. Over 3 km thick Middle Miocene to Quaternary Siwalik strata vanish to the north of the Soan syncline. The Soan back thrust, also known as the Dhurnal back thrust, and the Khairi Murat thrust are both major fault lines in this region [36]. Lithologically (Figure 1), the region encompassing the twin cities can be segmented into three primary units. The expansive Margalla Hills, located in the northern part, consists of Jurassic to Eocene shales interlayered with limestones of the Murree and Kamlial formations, as well as leigh conglomerates that are exposed in the area. South of the Margalla Hills lies the Piedmont belt, characterized by terraces and plains. This belt is underlain by truncated folds in sandstone and shales belonging to the Rawalpindi group (Figure 1). A significant morphological feature of the area is the Soan River, which predominantly flows along the axis of the Soan syncline [37].
The Islamabad/Rawalpindi area in Pakistan has been investigated by multiple studies, indicating the presence of blind or concealed fault lines [9,30,38]. These faults, such as the Dhurnal back thrust (DBT) and Khairi Murat thrust (KMT), have been associated with seismic events and significant ground displacement. The region’s complex geological history, including back thrusts and uplifts, further complicates the tectonic landscape [39]. In this study, the use of Consecutive Interferogram InSAR technology enables a more detailed investigation of these tectonic structures.

2.2. Datasets

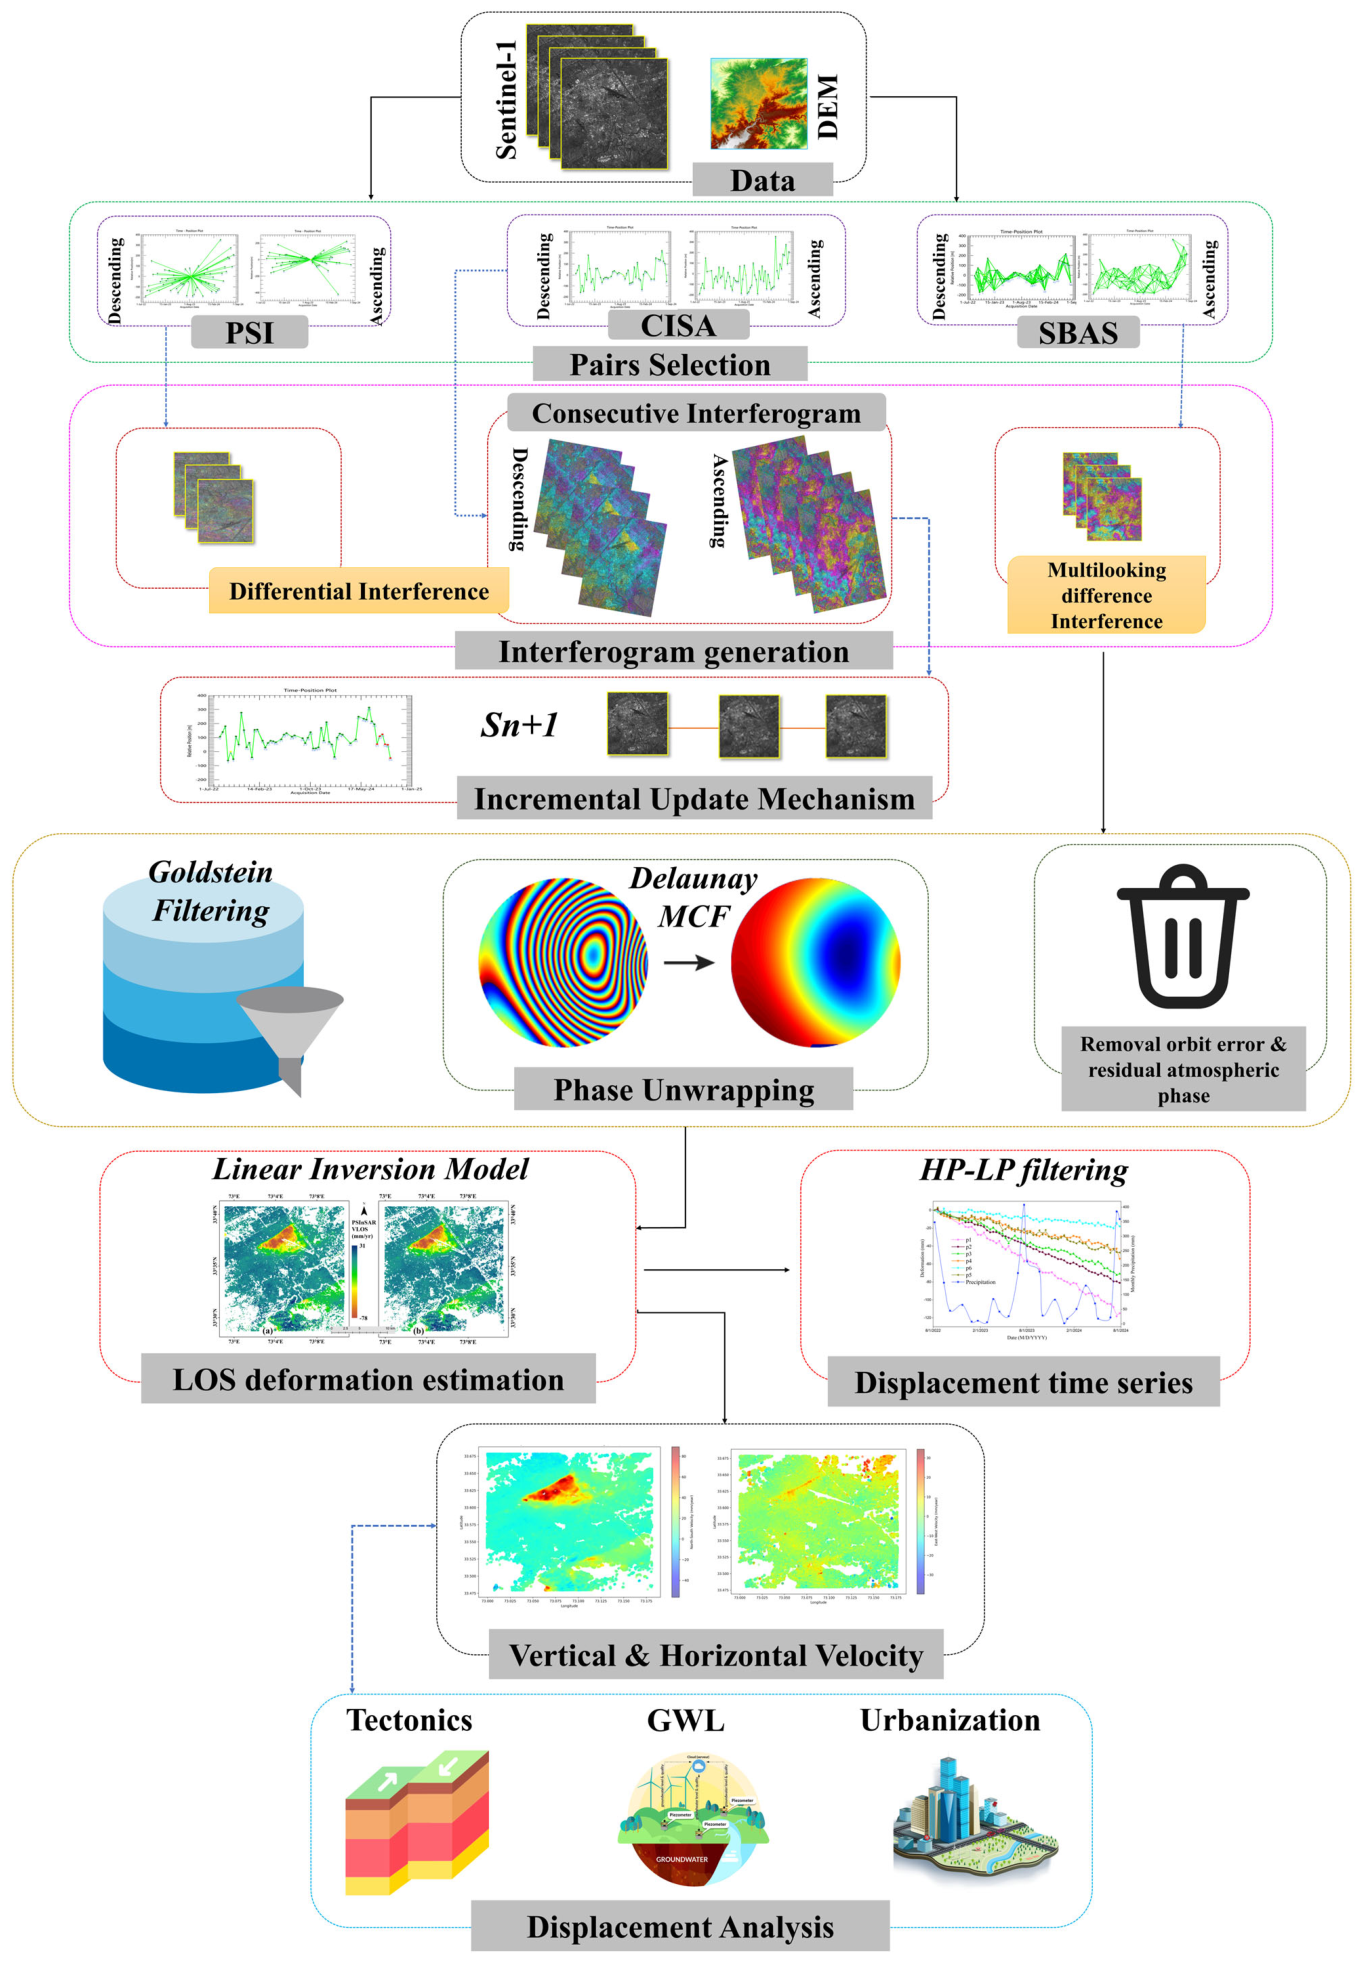
In this study, we employed Sentinel-1 SAR Single Look Complex (SLC) imagery, covering descending and ascending geometries from August 2022 to August 2024, as detailed methodology is shown in Figure 2. Our dataset comprised 52 images of descending (path 107, frame 478) and 59 images of the ascending tracks (path 100, frame 107). We utilized the ALOS Global Digital Surface Model “ALOS World 3D—30 m (AW3D30)” because it offers higher accuracy and better performance in complex terrains compared to the widely used Shuttle Radar Topography Mission (SRTM). AW3D30 has been shown to provide more reliable results in phase unwrapping and displacement monitoring, which is crucial for accurate topographic corrections and elevation modeling in InSAR applications [40].
To account for the potential impact of rainfall on ground displacement, we incorporated monthly rainfall data from the Pakistan Meteorological Department (PMD) for the same time period as the Sentinel-1 data were used (August 2022 to August 2024). The PMD collects rainfall data for Rawalpindi and Islamabad through a network of automated weather stations and manual rain gauges [41]. Furthermore, we used geological maps of scale 1:50,000 published in 1999, provided by the Geological Survey of Pakistan, to gain a deeper understanding of the geological context [37]. Temporal Groundwater level (GWL) data extracted from the Water and Sanitation Agency, Rawalpindi for 14 years were employed to assess the variation in the water table and its impact on subsidence in the area.

2.3. CISA Processing

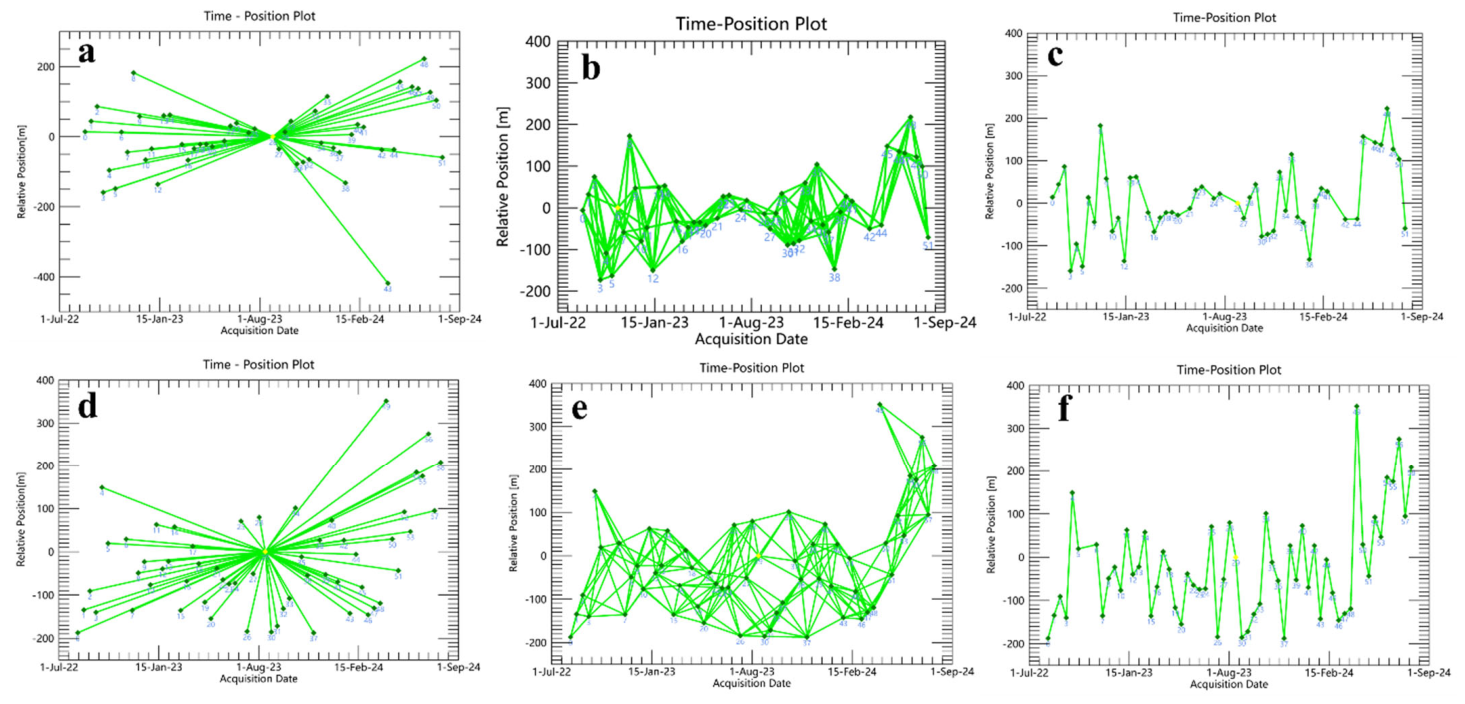
We create consecutive interferograms by using two images that are adjacent in acquisition time. For a series of N + 1 images acquired consecutively, each image serves as the reference for the subsequent image and the secondary for the preceding one, so that N consecutive interferograms can be generated. Here, 58 and 51 interferograms were generated in this way for the ascending and descending tracks, respectively (Figure 3c,f).
We process interferograms at full Sentinel-1 resolution (single-look in range and azimuth) without applying spatial multilooking. This configuration preserves native spatial resolution while enabling incremental velocity updates upon new image acquisition—a computational efficiency essential for near-real-time operational monitoring. Consequently, the approach accepts that full-resolution, short-baseline interferograms retain geophysical phase instabilities (fading signals arising from soil moisture fluctuations, vegetation phenology, and scatterer electromagnetic instability) that would otherwise be suppressed by spatial averaging at the cost of resolution loss. Thus, CISA strategically trades noise suppression for temporal fidelity and spatial detail, positioning the method for rapid-response applications where latency constraints outweigh the requirements of long-baseline phase stabilization.
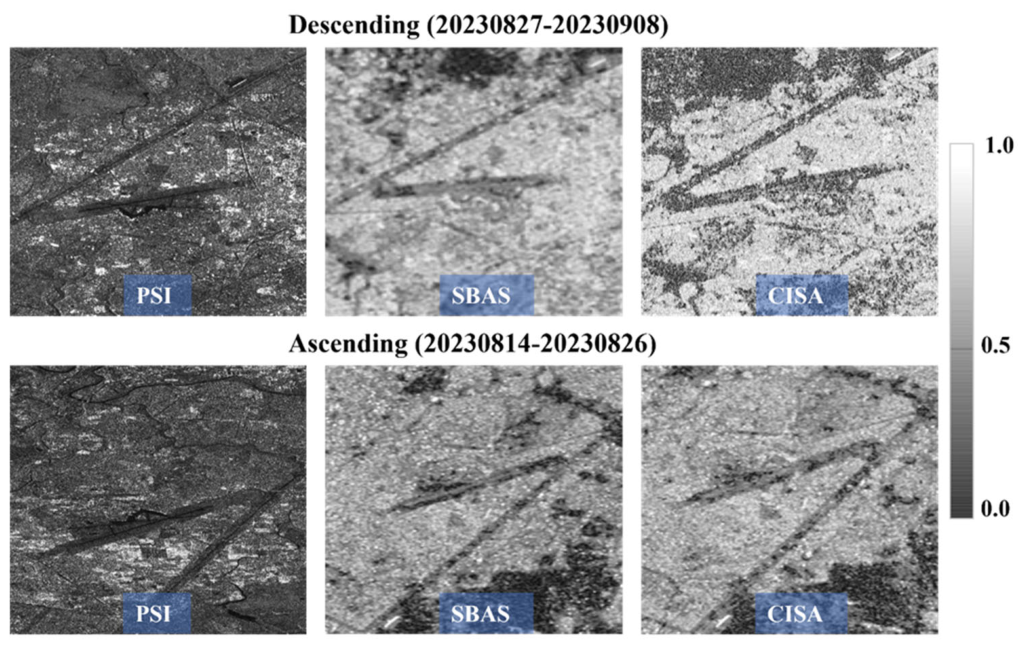
Additionally, by avoiding multilooking, the method preserves the full spatial resolution of Sentinel-1 data, enabling the detection of more localized and subtle subsidence patterns that might be smoothed out or missed by techniques like SBAS that sacrifice resolution for noise reduction. This enhances the detail and reliability of deformation measurements, particularly in areas with complex or heterogeneous ground motion (Figure 4).

2.3.1. Coherent Point Selection

In the interferometric synthetic aperture radar process for monitoring ground subsidence, identifying and selecting coherent points is crucial. These points, derived from SAR image pixels, exhibit consistent, reliable phase information over time, making them stable reference locations for accurately measuring ground displacement. Coherent points are broadly categorized into Permanent Scatterers (PS) and Distributed Scatterers (DS), each requiring distinct selection methodologies.
For coherent candidate selection, an initial screening of potential point locations is typically performed using amplitude dispersion analysis. This method identifies pixels that maintain highly consistent amplitude values across the entire SAR image stack, indicating the presence of a dominant, stable scatterer within that pixel. Specifically, for a given pixel, the amplitude dispersion index (DA) can be calculated to assess the consistency of its amplitude values over time, as explained in Equation (1) [23].
D A = δ A μ A
Here, δA represents the standard deviation, and μA represents the mean of a series of amplitude values. A lower threshold for the DA value indicates a stricter criterion for selecting coherent points. Typically, a threshold of 0.4 is sufficient for this initial selection step [42].
The coherent point identification was implemented by employing a dual-threshold hybrid approach combining amplitude stability and interferometric coherence. Initially, the algorithm calculates the Amplitude Dispersion Index (DA) across the full temporal stack to identify candidate Permanent Scatterers (PS). Pixels exhibiting DA ≤ 0.4 were retained as primary candidates, corresponding to amplitude variability below 40% of the mean, indicating stable man-made structures or bare rock surfaces. Subsequently, temporal coherence analysis was performed on these candidates using a 0.75 coherence threshold to eliminate pixels contaminated by temporal decorrelation, atmospheric noise, or unmodeled phase ramps. This two-step filtering ensures that selected points possess both radiometric stability (amplitude domain) and phase reliability (interferometric domain). To ensure geodetic accuracy, we implemented a spatial consistency check: isolated coherent points (>500 m from neighbors) were excluded to prevent single-pixel artifacts, and a triangular irregular network (TIN) was generated to assess spatial connectivity.
Coherence is a critical metric for assessing the quality of selected coherent points. A high coherence value indicates that a point maintains stable phase measurements over time, making it a strong candidate for reliable deformation analysis. This stability significantly improves the robustness of phase unwrapping, leading to more accurate and precise deformation estimations, often down to millimeter or even sub-millimeter scales [43]. Low-coherence areas such as vegetated regions, water bodies, or zones experiencing rapid surface changes are typically excluded from InSAR time series analysis. Our method enhances coherence by utilizing short temporal baselines, which allows for dependable deformation measurements across a broader range of land cover types. This approach minimizes the propagation of noise and decorrelation errors through the data stack, ultimately improving long-term monitoring capabilities and aiding in disentangling various deformation components (e.g., linear trends, seasonal cycles, non-linear events) [44].
The coherence threshold is a critical parameter often applied to filter out coherent points with low coherence values, though its specific setting can vary depending on the application. Typically, a coherence threshold ranging from 0.7 to 0.8 is used. This ensures that only points exhibiting high temporal stability in their phase measurements are selected as reliable candidates for deformation analysis [45]. In our study, we adopted a coherence threshold of 0.75 (as detailed in Table 1) to meticulously filter and select high-coherence points.
To assess the robustness of our deformation estimates, we tested coherence thresholds of 0.65, 0.75, and 0.85, revealing a characteristic trade-off between spatial coverage and phase reliability. The permissive threshold (0.65) increased point density by 35% but introduced phase noise from vegetated pixels, elevating velocity standard deviation by 18% and causing localized unwrapping artifacts. Conversely, the strict threshold (0.85) reduced point density by 40%, creating data gaps in residential fringes and near water bodies despite 12% lower phase noise. The adopted threshold of 0.75 achieved the optimal balance, maintaining sufficient density for complete spatial coverage while ensuring phase reliability, and yielded the lowest RMS error (±2.8 mm/year) against independent leveling benchmarks compared to 0.65 (±4.5 mm/year) and 0.85 (±3.1 mm/year), confirming its suitability for detecting the reported subsidence patterns.

2.3.2. Vertical and Horizontal Velocity Estimation

To decompose Line-of-Sight (LOS) displacement velocities into vertical and horizontal velocity components lies in the need to provide a more comprehensive understanding of ground displacement. This conversion is particularly useful when there is no significant north–south displacement, such as in our case study, where most ground subsidence is vertical, as it allows for a better interpretation of the displacement patterns and risk assessment in the vertical and horizontal directions [46].
The LOS displacement (dLOS) is related to vertical (dU) and horizontal (dE) displacements using the following Equation (2) by following [47]:
d L O S A d L O S D   =   c o s θ A s i n θ A s i n α A   d U c o s θ D s i n θ D s i n α D   d E
where
d L O S A , d L O S D = Line-of-sight displacement
dU = Vertical displacement
dE = East–west displacement
θA, θD = Radar incidence angles from vertical
αA, αD = Satellite heading azimuths clockwise from North
This system represents two linear equations with two unknowns (dU and dE), requiring both ascending and descending geometries for a unique solution. The formulation assumes negligible north–south displacement, which is valid for this study area given the predominant vertical subsidence and east–west tectonic shortening.
The reliability of this decomposition depends on the assumption that north–south (N-S) displacement is negligible relative to the vertical and east–west components. To validate this assumption, we performed a geometric sensitivity analysis for the Sentinel-1 descending orbit geometry (incidence angle θ ≈ 34–43°, heading azimuth α ≈ 190°). The analysis confirms that even a hypothetical 5 mm/year N-S displacement—exceeding expected tectonic rates for this dip-slip dominated setting—would introduce less than ±1 mm/year error into the vertical velocity estimates. This represents less than 2% of the observed subsidence signal (50–78 mm/year) and falls well within the measurement uncertainty (±2.8 mm/year), confirming the vertical velocity fields are robust. This assumption is physically justified by the dominance of vertical compaction (groundwater extraction) and dip-slip thrust kinematics along the Main Boundary Thrust in this sector, which minimizes N-S surface expression. We explicitly label the horizontal output as “East–West projection” to indicate the resolvable component, acknowledging that without ascending-track data, the full 3D vector remains underdetermined.

2.3.3. Displacement Measurement

After performing phase unwrapping [48], the phase of a specific pixel x in the ith interferogram, denoted as, can be described as Equation (3):
ψ ( x , i ) = ψ ( D , x , i ) + ψ ( φ , x , i ) + ψ ( A , x , i ) + ψ ( N , x , i ) + 2 k ( x , i ) π
Here, ψD,x,i represents the displacement phase in the satellite line-of-sight (LOS) direction. ψφ,x,i corresponds to the topographic error phase. ψA,x,i is the phase resulting from differences in atmospheric delay between acquisitions. ψN,x,i encompasses decorrelation, thermal noise, and residual phase errors due to satellite orbit inaccuracies. Additionally, kx,i is an integer ambiguity, an unknown parameter for each unwrapped interferogram. If the unwrapping process is sufficiently accurate, kx,i remains constant for most pixels (x) within a given interferogram. The selected coherent points are those where the magnitude of ψN,i is sufficiently small that it does not mask the underlying signal.
After unwrapping via Minimum Cost Flow (MCF), the displacement was estimated using a linear model that relates the unwrapped phase to ground displacement, as it fits the deformation model, resulting in a more robust and reliable choice [49]. This process yields the displacement solutions associated with each acquisition date. The displacement time series values are anchored to the oldest date, which serves as the reference point with a value of zero. Next, refinement processes via the variogram tool for evaluating and applying atmospheric removal algorithms [50], which perform a statistical comparison before and after the application of a specific atmospheric filter, were conducted to improve the quality of the unwrapped phases, including removing residual atmospheric effects and re-flattening the data based on updated models.
Furthermore, the initial estimate of the displacement time series, the displacement model component, was used to safeguard it during the Atmospheric Phase Screen (APS) correction process [51]. During this phase, spatial low-pass (LP) and temporal high-pass (HP) filters are applied to the displacement time series [52]. The resulting LP-HP layers, generated for each acquisition date, represent the contributions of atmospheric artifacts. Finally, the atmospheric artifacts from the initial displacement time series were estimated to derive the refined, final displacement time series. In the last step, the results were converted into geographic coordinates for analysis and visualization, generating geocoded raster and vector outputs that can be used for further interpretation.

2.3.4. Incremental Update Mechanism

The Incremental Update Mechanism represents a distinctive algorithmic advantage of the CISA framework, enabling efficient near-real-time monitoring without necessitating the reprocessing of historical datasets. Unlike conventional SBAS or PSI methodologies, which require complete recomputation of the interferometric network upon the acquisition of each new SAR image, CISA facilitates sequential data integration through its linear chain architecture.
When a new image Sn + 1 is acquired, the cumulative displacement is updated through the additive property of consecutive interferograms:
Φ c u m n + 1 = Φ c u m n + ϕ n , n + 1
where Φ c u m n represents the cumulative displacement at epoch n and ϕn,n + 1 denotes the unwrapped phase of the newly formed interferogram between acquisitions Sn (number of SAR images) and Sn + 1. This formulation leverages the previous solution as a boundary condition for phase unwrapping, ensuring temporal consistency while requiring only a single interferogram generation step. The updated velocity field is subsequently derived from the extended time series through linear regression, eliminating the need to reconstruct the entire historical dataset.
This procedure reduces computational complexity from the quadratic scaling inherent to traditional network reprocessing to constant-time addition, effectively eliminating storage redundancy associated with maintaining extensive interferometric pair archives. Consequently, operational monitoring systems can generate updated displacement maps within hours of new image acquisition, rendering CISA particularly suitable for rapid response applications.

3. Results

3.1. Ground Displacement Along the Line of Sight

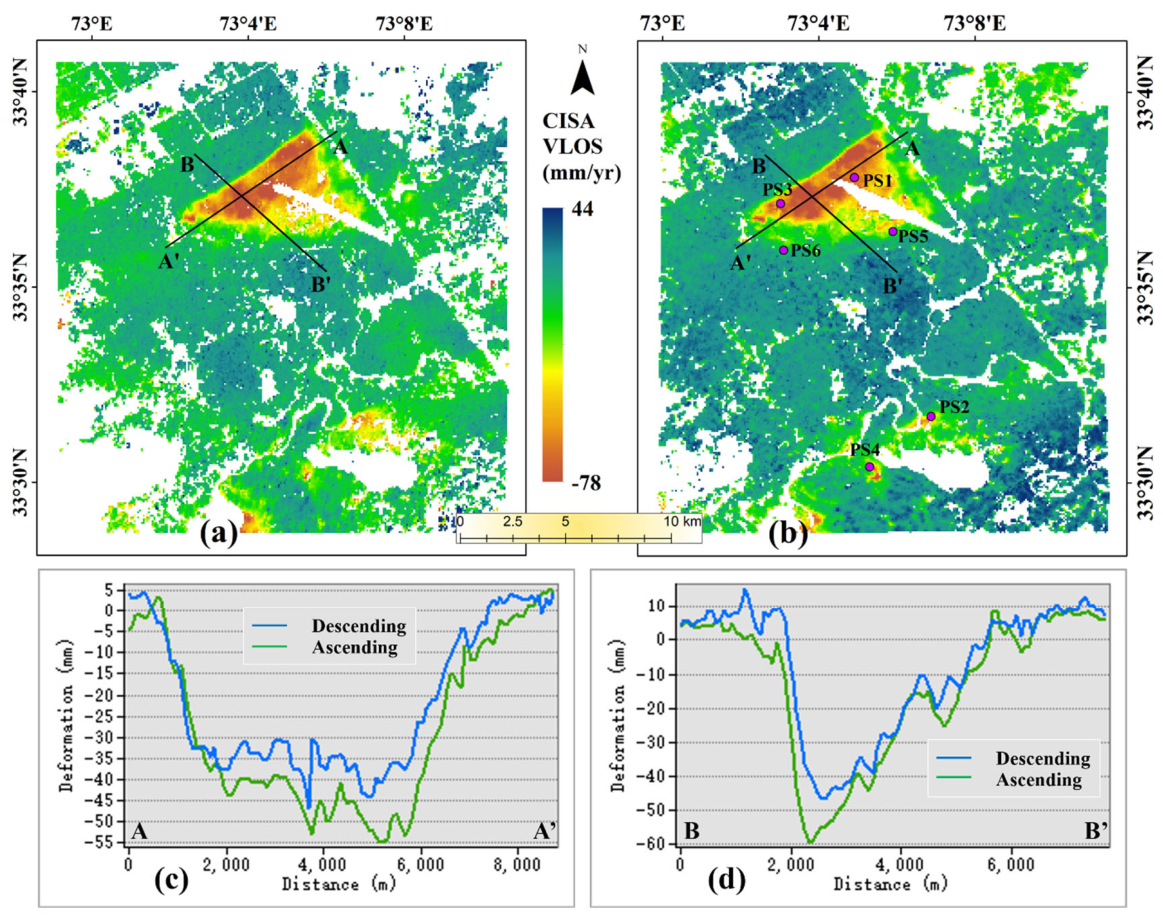
Figure 5 illustrates the Line-of-Sight (LOS) rate map measured by our method for the area. Significant maximum ground subsidence is observed around the airport (Figure 1c), particularly in the densely populated twin city area, which is situated on a fault line network. The other prominent displacement lines were discerned along the Soan Syncline (Figure 1). The LOS displacement velocities were calculated by unwrapping the interferometric phase and converting it into ground deformation rates. The precision of these velocities is typically assessed using metrics such as the Root Mean Square Error of the Model Misfit (RMS EMM). RMS EMM quantifies the deviation of the estimated velocity model from the observed phase changes, thus reflecting the consistency of the model with the input data.
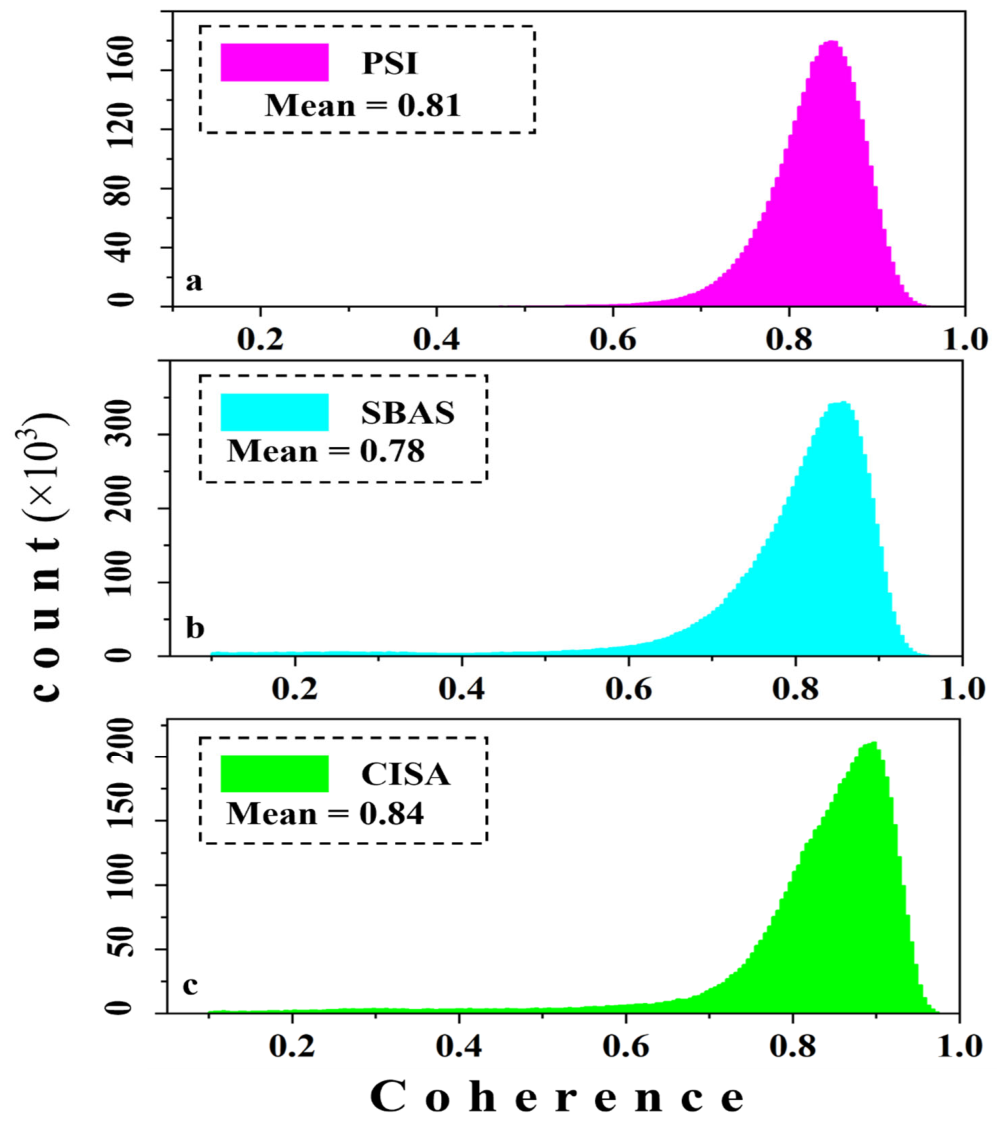
CISA significantly improved velocity precision, demonstrating a 10.96% and 17.72% higher precision than PSI (Figure S1) and SBAS (Figure S2), respectively, for both ascending and descending track data. Furthermore, we evaluated the overall accuracy of our results using Root Mean Square Error (RMSE) values for CISA. RMSE is a statistical measure of the differences between predicted values (our estimated displacements) and observed values, indicating the average magnitude of the errors. These RMSE values represent an approximate 25% and 29% reduction compared to traditional PSI and SBAS methods, indicating a substantial improvement in the accuracy of our displacement estimates.
High coherence values indicate reliable phase measurements, while low values suggest the presence of noise. CISA enhanced PSI coherence by 14% and 11% for ascending and descending data, respectively. Conversely, the SBAS method exhibited 7% and 6% less coherence for both directions of data, underscoring the superior performance of our approach in maintaining signal quality (Figure 4).

3.2. Time Series Displacement

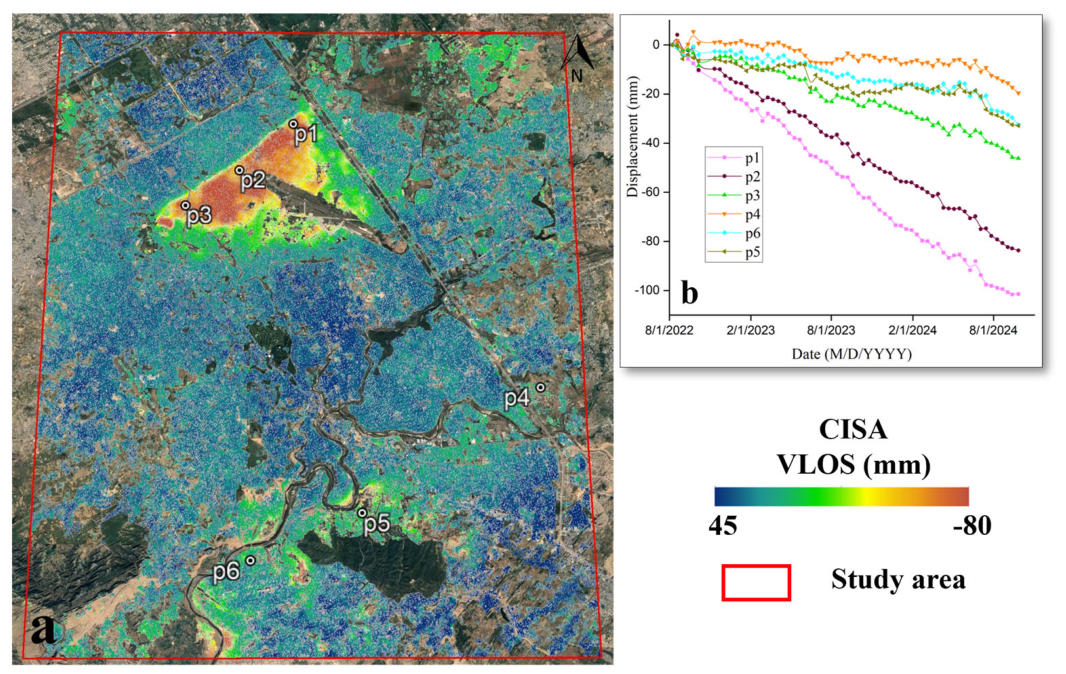
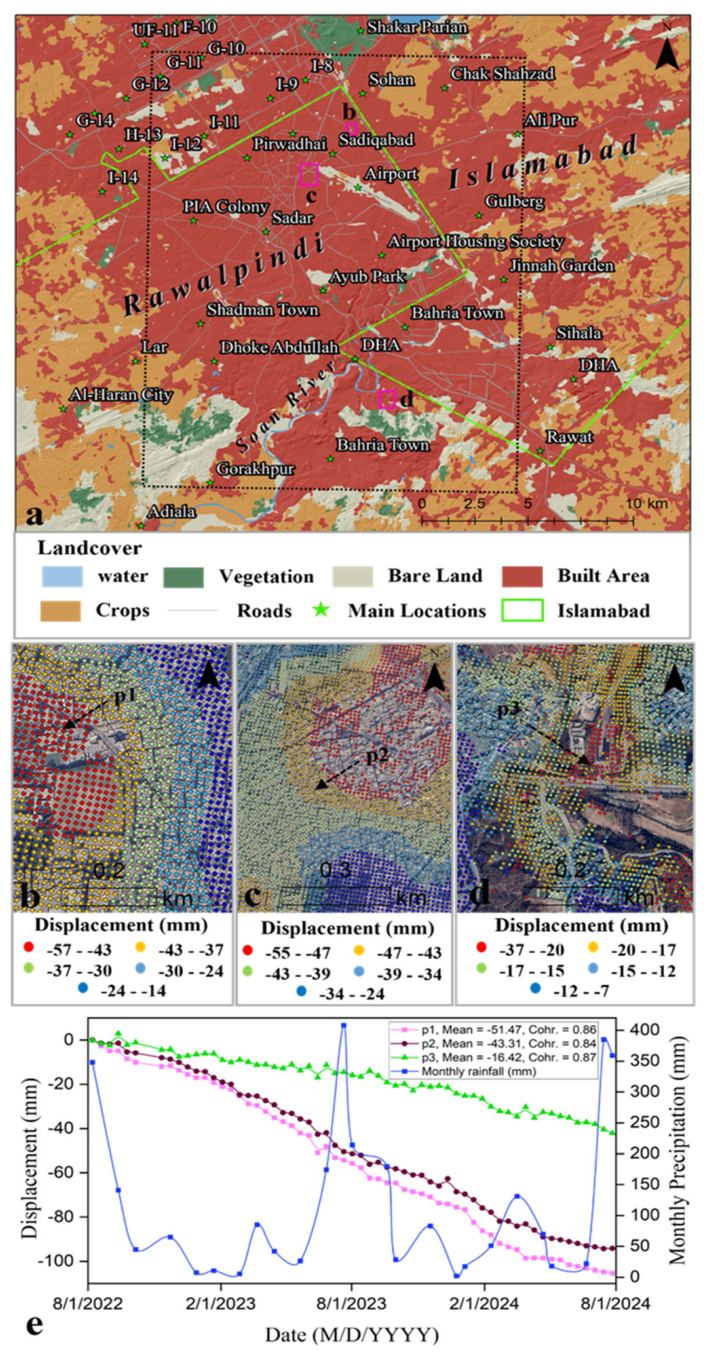
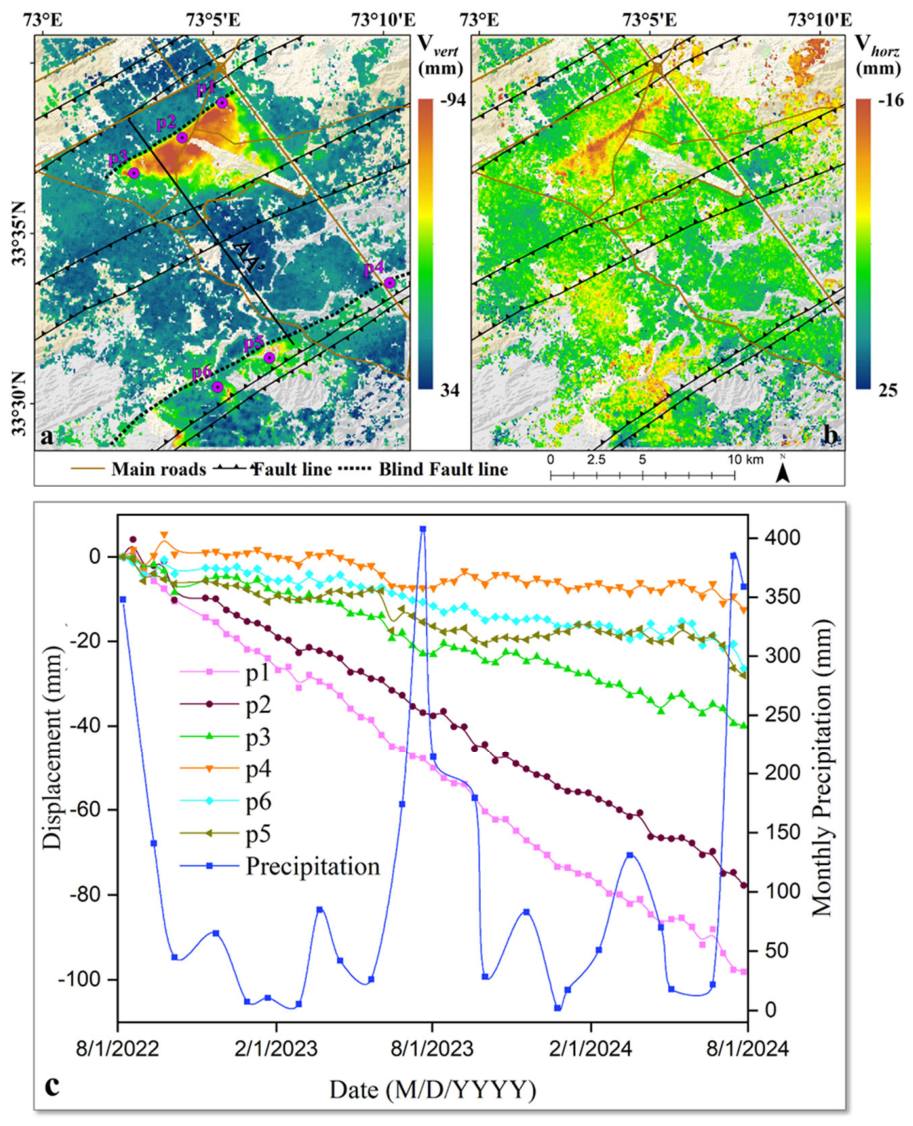
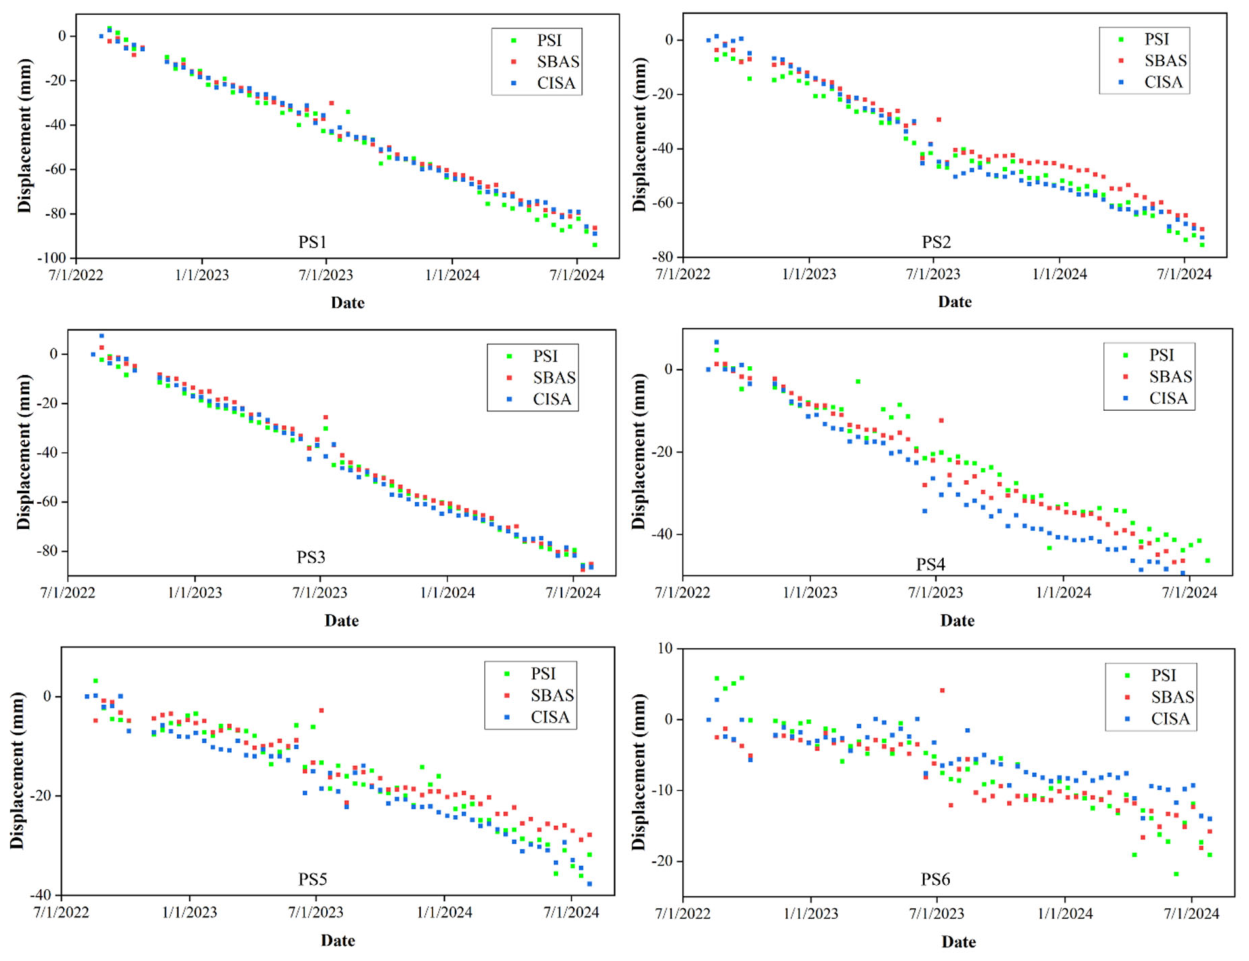
The time-series displacement maps provide a detailed view of land surface displacement in the study area. Upon examining the rate maps, several distinct patterns of displacement were observed, and we have picked a few representative points where most deformation occurred. The maps revealed a clear subsidence trend in the middle subsiding zone, with three prominent points (p1, p2, and p3) (Figure 6) showing consistent subsidence rates. These points exhibited minor seasonal fluctuations but maintained a downward trend over time.
In the southern zones of the study area along the Soan Syncline region, three additional points (p4, p5, and p6) were identified (Figure 6). These points displayed more variability in their displacement patterns, particularly during the monsoon rainfall seasons of 2023 and 2024 [38]. This variability suggests that these areas are more susceptible to seasonal changes, likely due to increased water infiltration and soil saturation during the monsoon periods

3.3. Vertical and Horizontal Displacement Estimation

Equation (2) was utilized to decompose the Line-of-Sight (LOS) velocity into vertical and horizontal velocities. The decomposition revealed minor displacement (averaging around −16 to 25 mm) in the horizontal direction. In contrast, a strong localized signature was highlighted in the vertical component (Figure 6). This finding strengthens the hypothesis of the existence of blind faults (black dotted line in Figure 6), indicating a sharp transition in subsidence along the fault in both horizontal and vertical directions.
A detailed examination of Figure 6 reveals a subsidence zone around the airport region (Figures S3 and S4 represent the vertical and horizontal velocity model developed via PSI and SBAS techniques), with a maximum subsidence of −94 mm over the two-year investigation period, indicating a clear marker of considerable ground surface lowering. This substantial subsidence suggests the downward movement of the ground surface, which is also discussed in previous studies [9,38,53,54]. Both tectonic and anthropogenic factors are considered responsible. Moreover, the uplift zones to the north and south of the displacement area signal tectonic movements, manifesting as an upward thrust of the ground, with the maximum uplift recorded in two years being 34 mm. Tectonic movements can cause substantial ground surface deformation, including both subsidence and uplift, which could be indicators of fault lines without traces on the surface, that had been found in this study. The presence of uplift zones to the north and south of the subsidence area indicates that tectonic forces are actively influencing the land surface dynamics in the region.

3.4. Distribution of Coherent Points

The distribution of selected high-quality points defines the coverage of InSAR time series results, which is a key indicator of InSAR measurement quality. For example, the PS points during the PSI processing are typically found in urban areas, where man-made structures such as buildings and infrastructure serve as stable reflectors (Supplementary Materials). However, their distribution can be sparse in rural or natural terrains, where DS points are more compensated for the coverage through the SBAS approach.
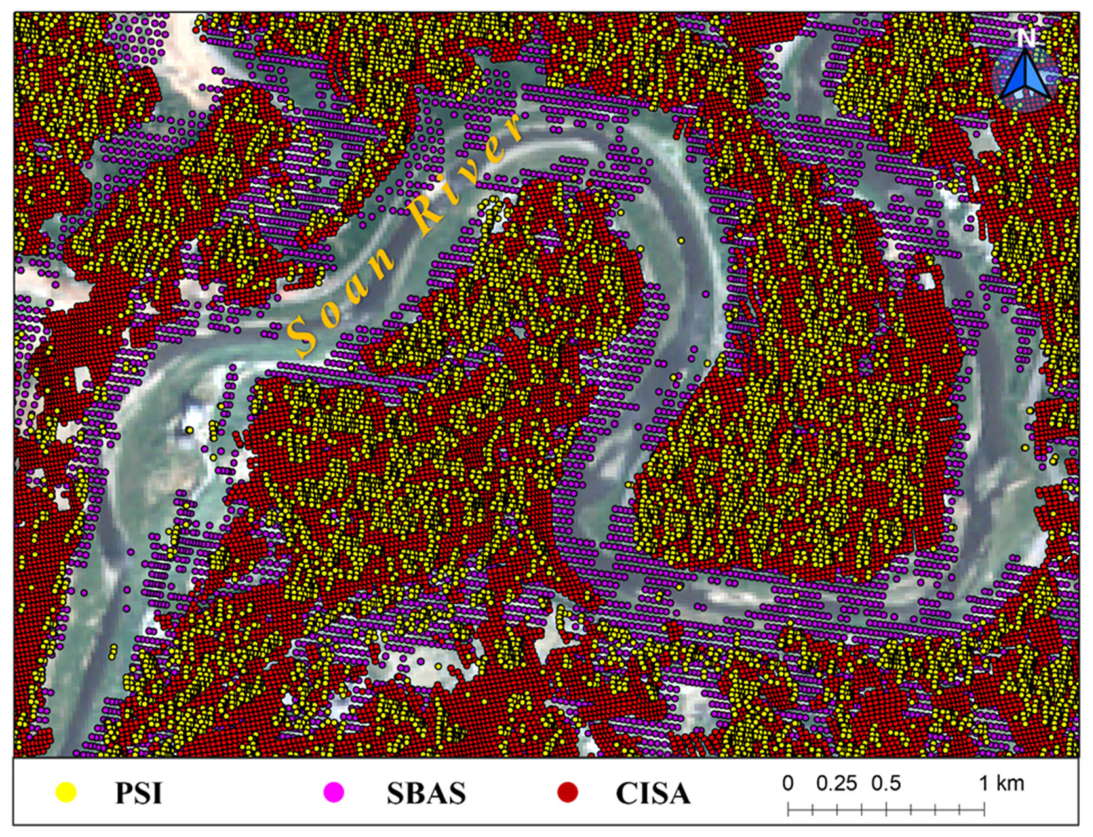
Here, we find that the PSI method generally has a sparse density of PS candidates, as expected. For descending track data, the density of points in PSI is approximately 7.48% lower than that in CISA, while the point density in SBAS is approximately 6.11% higher than in CISA. For ascending track data, the point density in PSI is approximately 11.63% lower than in CISA, whereas the backscatter density in SBAS is approximately 12.16% higher than in CISA. The SBAS technique provided a broader coverage, capturing up to 85% of the investigated area, compared to the PSI method, which primarily covered urban areas. Our approach covered more coherent points than PSI and less backscatter density than SBAS, but is still able to detect stable points in both urban and non-urban regions (Figure 5). It is because PSI focuses exclusively on Persistent Scatterer, which are PS points that maintain high phase coherence and amplitude stability over long periods, typically corresponding to man-made structures like buildings, rocks, or bare ground. In contrast, SBAS leverages a network of interferograms with small spatial and temporal baselines to maximize coherence across a broader range of backscatter, including Distributed Scatterers, which might exhibit lower, but still usable, coherence over shorter periods or within averaging windows.
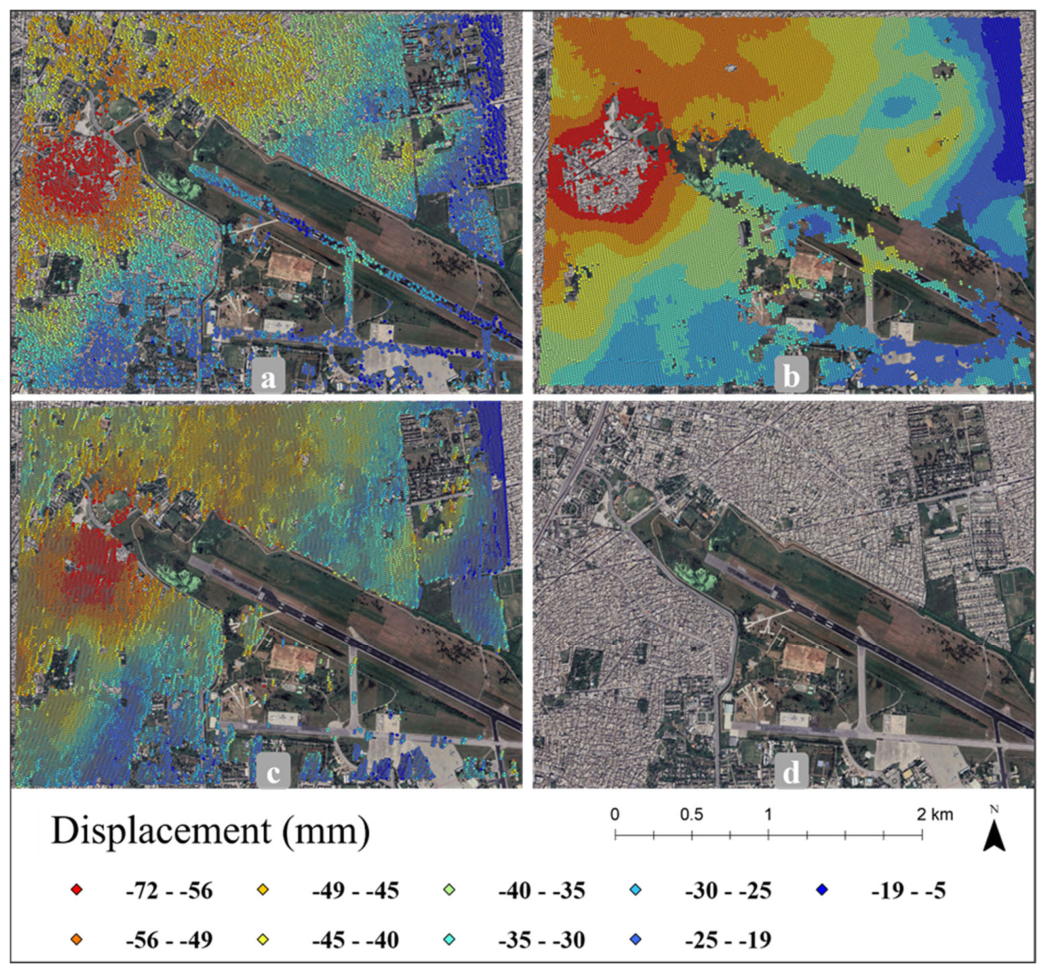
The absence of coherent candidates detected by the CISA method on the highly active airport runway (Figure 7), despite the presence of detections by PSI and SBAS, highlights the challenges of point selection in dynamic environments. The high activity and variability of the runway make it difficult to obtain stable reflections necessary for high-quality point identification This aligns with previous studies that have highlighted the challenges of backscatter selection in areas with significant movement and change.
The CISA method excluded the backscatter along the Soan River in wet areas or inside water (Figure 8), in contrast to PSI and SBAS, further highlighting its selectivity in identifying false points. This selectivity is crucial in environments where false positives are more likely to occur, such as wet areas or water bodies. For instance, PSI and SBAS techniques, while capable of detecting high-quality backscatter in a broader range of areas, may also be more prone to identifying false positives in dynamic environments [49]. The CISA method’s selective nature suggests that it prioritizes accuracy over coverage, which can be particularly beneficial in complex and dynamic settings.

3.5. Validation of the Incremental Update Mechanism

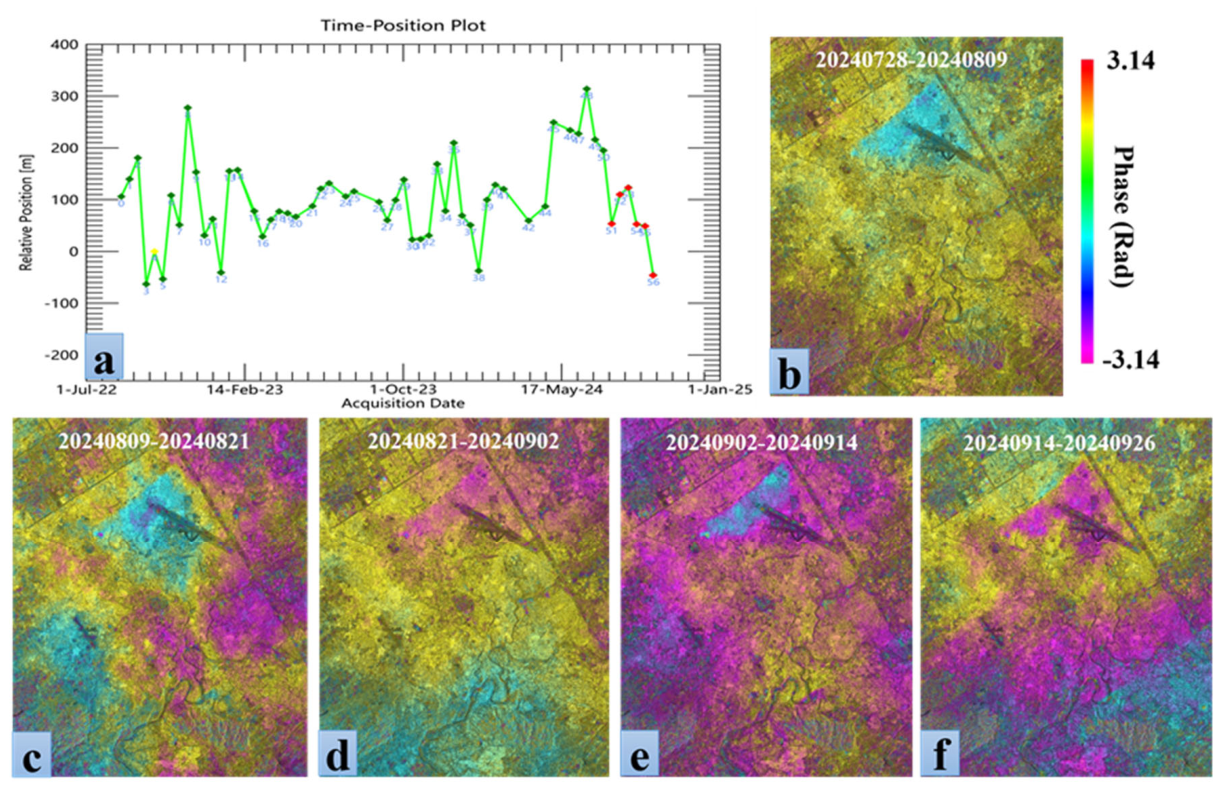
To validate the computational efficiency and temporal consistency of the CISA incremental update framework, we sequentially integrated five new Sentinel-1A/B acquisitions (descending track) into the existing interferometric chain without reprocessing the preceding 51-image archive. The additive update procedure successfully maintained phase coherence and displacement continuity across the extended observation period.
Figure 9 presents the time-position plot illustrating the linear chain architecture following the incremental expansion. The numbered acquisition sequence (epochs 52–56) demonstrates the continued adherence to the single-master pairing strategy, with baseline temporal separations ranging from 12 to 24 days. Notably, the relative orbital positions of the newly appended acquisitions (highlighted in red) remained geometrically consistent with the historical stack, ensuring minimal spatial decoherence in the formed interferometric pairs.
The RGB composite interferograms (Figure 9b–f) document the phase evolution across the five incremental update cycles. Each panel represents the interferometric phase between consecutive acquisitions. The preserved fringe continuity and interferometric coherence—particularly evident in the stable phase signatures across the agricultural and urban targets—confirm that the additive phase unwrapping initialization (utilizing the preceding cumulative solution as boundary conditions) successfully mitigated phase ambiguity propagation. The absence of phase discontinuities at the junction between historical and newly processed data validates the temporal consistency of the cumulative displacement field.
Figure 10 presents the cumulative Line-of-Sight (LOS) displacement map derived from the extended 56-image time series, encompassing both the historical 51-image archive and the five incrementally added interferograms. The spatial distribution of deformation exhibits seamless continuity across the temporal threshold, with no discernible artifacts or step-changes at the transition between the reprocessed historical data and the incremental update region. The displacement field reveals persistent subsidence patterns in the northern sector (p1–p3) (Figure 10) and relative stability in the southern monitoring points (p4–p6), consistent with the long-term deformation trends established in the preceding observation period.
The temporal consistency of the incremental update is quantitatively assessed through the displacement time series at six persistent scatterer locations (Figure 10b). Points p1, p2, and p3, situated within the high-velocity subsidence bowl, demonstrate accelerated cumulative displacement reaching −96.2 mm, −82.4 mm, and −41.8 mm, respectively, by September 2024, maintaining the linear subsidence rates (–35 to –45 mm/year) established in the historical record. Critically, the displacement curves exhibit no phase jumps or temporal offsets at the integration timestamp (August 2024), confirming that the additive update mechanism successfully propagated the cumulative phase without error accumulation. The root-mean-square deviation between the incrementally updated time series and a reference solution (generated through complete network reprocessing of all 56 images) remained below 2.1 mm across all validation points, well within the system’s noise threshold.
The incremental processing workflow achieved a constant-time computational complexity for the update cycle. Processing the five new acquisitions required only five additional interferograms and a single linear regression-based velocity refinement, compared to the interferometric pair generation required by conventional SBAS reprocessing. The total processing time for updating the displacement map following each new image acquisition averaged 3.2 h (including data download, coregistration, interferogram formation, and phase unwrapping), compared to an estimated 18.7 h required for complete archive reprocessing. This efficiency gain validates the operational feasibility of the CISA framework for near-real-time deformation monitoring, enabling rapid response capabilities without compromising geodetic accuracy or temporal consistency.

4. Discussion

4.1. Comparative Analysis with Traditional InSAR Techniques

The CISA method proposed in this study represents several advantages over traditional InSAR methods. PSI relies on long-time-span differential interferograms to analyze pointwise time-coherent backscatters, which is effective in urban areas with abundant man-made structures, but often suffers from low high-quality point density in non-urban regions due to temporal and geometrical decorrelation [55]). Our method improves the situation, resulting in higher-quality interferograms (Figure 4 and Figure 11). This is particularly beneficial in densely vegetated regions where decorrelation noise is significant, enhancing the practicality and efficiency of InSAR, and also facilitating better data visualization and interpretation, which is vital for applications such as disaster assessment, where quick and accurate data interpretation is essential [56].
Compared to SBAS, CISA does not perform multilooking and simplifies the interferogram network and processing steps, while maintaining full spatial resolution and enabling near-real-time deformation monitoring. While conventional SBAS employs short temporal baselines to minimize decorrelation, it typically applies spatial multilooking to suppress phase noise—including geophysical fading signals—at the cost of resolution loss and suppression of high-frequency signals. It is critical to distinguish between temporal decorrelation (minimized by short intervals) and the retention of geophysical phase instabilities. Fading signals arising from scatterer electromagnetic instability (soil moisture, vegetation phenology) are inherent to short-baseline interferometry and intensify as the temporal baseline decreases [29].
By eliminating multilooking, CISA accepts that full-resolution, consecutive interferograms retain these geophysical phase instabilities that would otherwise be spatially averaged in conventional processing. Thus, the framework operates on an operational trade-off: it forgoes the phase stabilization achieved through spatial averaging to achieve computational efficiency and spatial fidelity. The use of Sentinel-1 data, with its high temporal and spatial resolution, provides a robust foundation for CISA processing, allowing for incremental velocity updates within hours of new image acquisition—an operational capability unattainable with network reprocessing methods. This efficiency, coupled with the preservation of native resolution, renders CISA particularly suitable for rapid-response applications where latency constraints outweigh the requirements for long-baseline phase filtering.
Furthermore, the consistent and very short temporal baselines are inherently more sensitive to non-linear, transient, or rapidly evolving deformation events that might be smoothed out or poorly resolved by the longer temporal baselines often present within the complex network of interferograms used in SBAS, or by the long-term averaging characteristic of PSI [57].
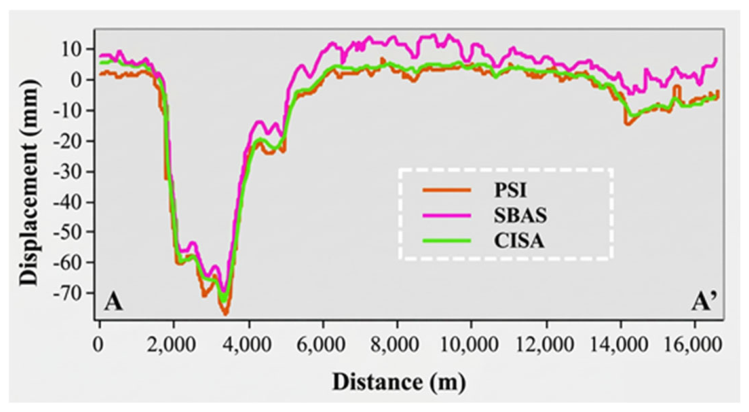
The profile line AA’ shown in Figure 6 illustrates the advantages of CISA. All three methods—PSI, SBAS, and CISA—identify the same general pattern of displacement along the profile (Figure 12). However, the CISA profile line exhibits less fluctuation and a smoother transition between data points. This indicates that CISA is better at estimating displacement signals without the need for spatial filtering, which can introduce artifacts or noise into the data. This is particularly valuable for urban planning, infrastructure management, and risk mitigation efforts in areas like Rawalpindi/Islamabad, where ground displacement monitoring is crucial. The smoother CISA profile with reduced fluctuation (Figure 12) quantitatively reflects the absence of multilooking-induced fading signal bias, which typically manifests as artificial phase “smearing” and non-Gaussian phase statistics in conventional multilooked interferograms. This validates that preserving full resolution eliminates the systematic bias without requiring additional spatial filtering.
Additionally, one more advantage of our method over traditional InSAR processing techniques is the ability to integrate new SAR acquisitions into an existing stack without having to reprocess the entire historical dataset from scratch. In PSI, constantly adding new acquisitions may require re-selecting the optimal reference image by minimizing the perpendicular and temporal differences. Similarly, with SBAS, the introduction of new images expands the interferometric network, creating new pairs with previous acquisitions. This expansion typically involves complex re-computation as the network geometry and redundancy have changed. In contrast, CISA supports incremental updating by generating interferograms exclusively from consecutively acquired images, making the integration of new data much more straightforward.

4.2. Spatial and Temporal Variations in Land Subsidence

The spatial and temporal variations in land subsidence in the Rawalpindi/Islamabad region of Pakistan are influenced by a combination of natural geological factors and anthropogenic activities (Figure 13). The study area, located at the northern edge of the Potwar Plateau, exhibits significant variations in subsidence rates across different locations and periods [54].
Spatially, land subsidence in the Rawalpindi/Islamabad region is more pronounced in areas with active geological structures and excessive groundwater extraction. The subsidence patterns generally follow the orientation of faults and fractures in the region, with the most significant subsidence occurring in the older city of Rawalpindi, which is the most populated zone [38]. The subsidence is controlled by the buried splays of the Main Boundary Thrust, one of the most destructive active faults in the region [35]. The maximum subsidence rates were observed in areas with high groundwater extraction, particularly in the urban centers where the water demand is highest.
Temporally, the region has experienced varying degrees of subsidence and uplift over the monitoring period. The subsidence rate increased significantly to −78 mm/year in 2024, from 70 mm/year in 2023 [9]. This is most probably due to aggressive subsurface water extraction [38,54], despite the provision of alternate water supplies by the authorities. The dropping water level is proportional to the increasing number of tube wells, indicating a deficit between water extraction and recharge. Seasonal variations in subsidence rates were also observed.
This tectonic setting results in the development of faults, folds, and uplifted terraces, which influence the distribution of subsidence. Areas closer to active faults, such as the Main Boundary Thrust (MBT) and Kalabagh Fault, are more prone to subsidence due to ongoing stress accumulation and release. Geologically, the region comprises a mix of alluvial deposits, sedimentary rocks, and unconsolidated sediments. The alluvial plains, particularly in Rawalpindi, are highly susceptible to subsidence due to the compaction of loose sediments under the weight of urban infrastructure and groundwater extraction.

4.3. Impact of Geotectonic on Ground Subsidence

The Rawalpindi/Islamabad region in Pakistan is characterized by significant geotectonic and geological complexities, which have profound implications for ground displacement. The area is built upon quaternary alluvium deposits, primarily composed of unconsolidated conglomerates, clay, sand, silt, loess, and gravel [10]. These unconsolidated deposits are inherently prone to subsidence, a susceptibility that may be heightened in tectonically active settings. The region’s location proximate to the Main Boundary Thrust (MBT) in the north and the Salt Range Thrust (SRT) in the south creates a structurally complex setting that could contribute to observed ground deformation patterns.
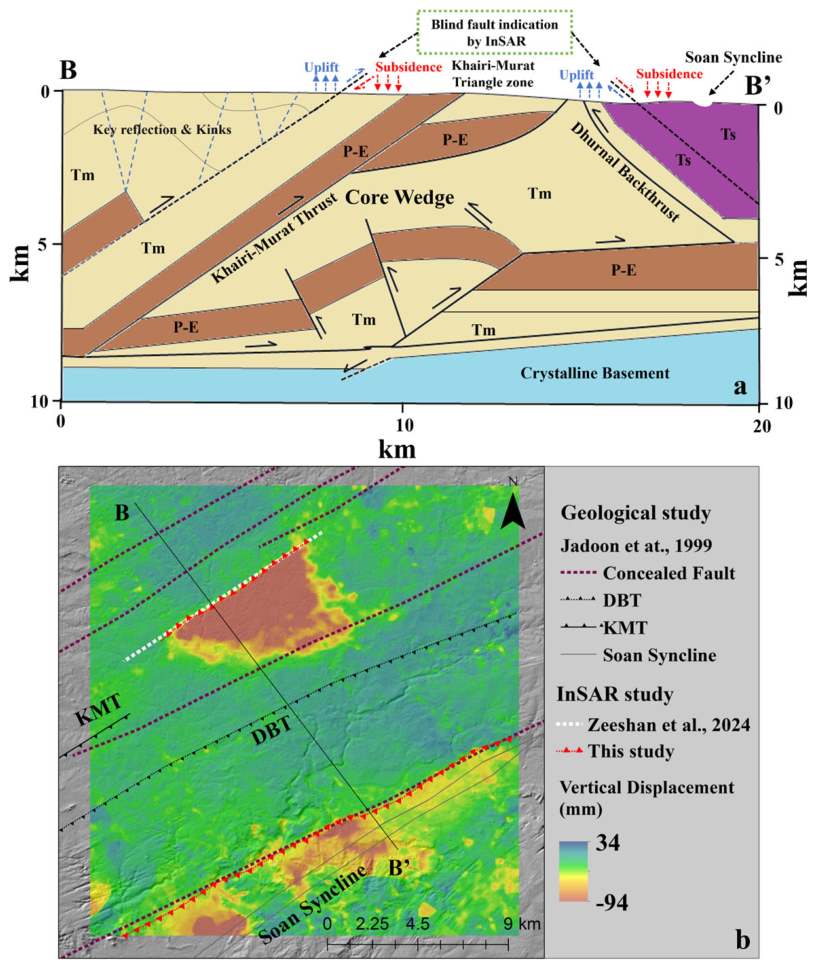
The observed displacement patterns reveal linear features that are spatially consistent with known structural trends and may reflect the influence of concealed fault systems (Figure 12). The vertical deformation field shows variations broadly aligned with the regional tectonic framework, including gradients along the Bokra thrust fault in the north and the Dhurnal back thrust and Khairi Murat thrust faults in the south [9] (Figure 14). These findings underscore the complex nature of the fault systems, revealing how their lithology is a major factor influencing the displacement patterns observed across the study area. The blind fault traces were delineated based on structural geomorphological criteria rather than a single subsidence rate threshold. Specifically, we identified linear zones exhibiting: (1) abrupt lateral gradients in the vertical velocity field (>3× standard deviation of the local background gradient); (2) termination or offset of subsidence bowls; and (3) alignment with known subsurface structures from seismic data. While no absolute displacement rate threshold was applied (as blind faults accommodate variable slip rates), the delineated traces correspond to zones where the displacement field exhibits mechanical discontinuities consistent with fault-bounded block motion, distinct from the gradual gradients typical of groundwater-drawdown subsidence (Figure 14).
Our results reveal two linear deformation patterns spatially consistent with blind fault traces. (Figure 14). Jadoon, et al. [30] and Afzal, et al. [9] also discussed the presence of a blind fault line in the area. There is a concealed fault line mapped by [30] (Figure 14) previously near the blind fault line drawn in our study. Our analysis shows that either the geological map of the region is low scale and missing the information of this fault line, or the mapped concealed fault line (800 m in distance from the blind fault line mapping in this study) is not accurate spatially, which is the blind fault line detected in our InSAR processing. The Soan Syncline (Figure 14) is located 500–550 m away from the blind fault line disclosed in our study. However, the concealed fault line (Figure 12) is situated in almost the same location as the blind fault detected in this study, following the same patterns. There are no clues about this blind fault line in the recent literature after [30], but InSAR outputs represent a clear indication of the fault. Our analysis indicates that the geological map for the area requires an update.
Furthermore, the seismic effects in the area are multifaceted and have significant implications for both the natural environment and human infrastructure. Historical statistics reveal that the region has experienced multiple earthquakes with intensities ranging from 7 to 8 on the Modified Mercalli Intensity (MMI) scale [58]. Notably, the 2005 earthquake (Mw 7.6) caused significant structural damage, including the collapse of the Margala Tower, resulting in over 70 fatalities [34]. This event underscores the region’s susceptibility to severe seismic impacts. The presence of active faults, such as the Riwat Thrust, which recorded a magnitude 5.1 earthquake in 2015 and 2017, further highlights the ongoing tectonic activities.
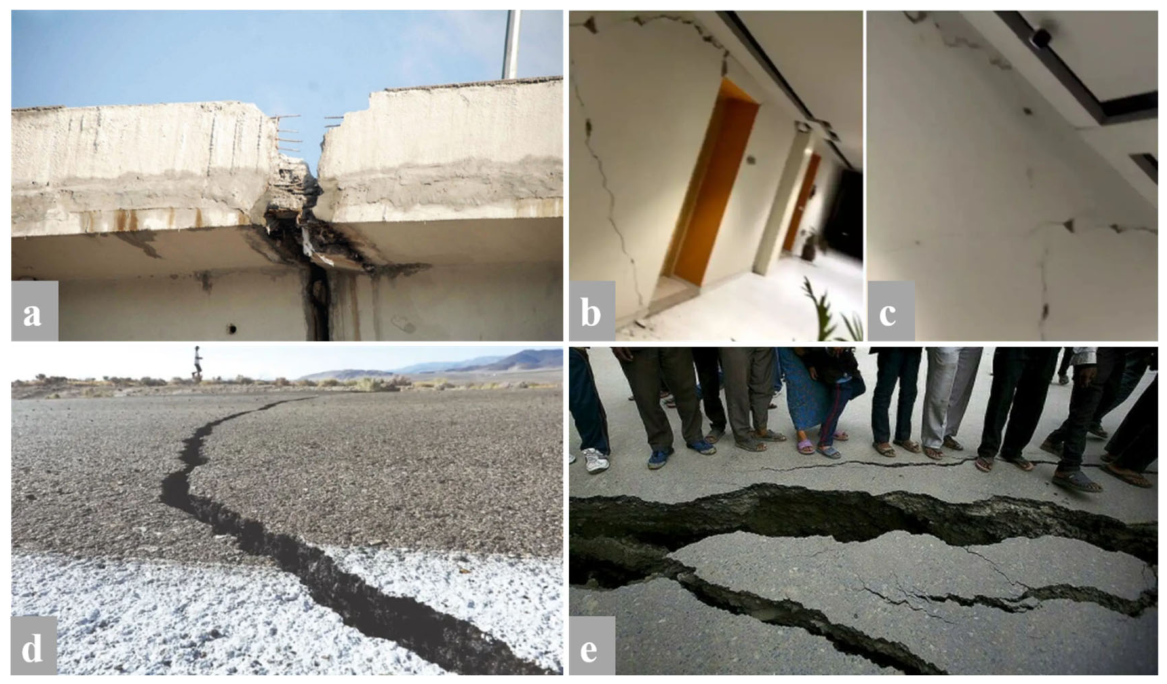
The detection of ground displacement via InSAR has significant implications for seismic hazard assessment in the Islamabad/Rawalpindi area. The ongoing strain accumulation along active faults increases the likelihood of future earthquakes, particularly in densely populated urban centers, as the area was jolted by a 4.7 magnitude earthquake on Saturday, 15 February 2025, at 1:48 AM GMT + 8 (Source: USGS), and these kinds of events are frequent in the region. The quake had a moderate depth of 49 km (31 mi) and was felt widely in the area. The moderate and shallow depth of the earthquake caused it to be felt more strongly near the epicenter than a deeper quake of similar magnitude would. The moderate depth of the earthquake resulted in it being felt more strongly in Rawalpindi/Islamabad, causing cracks in buildings and creating fissures on roads . This highlights the region’s high sensitivity to earthquakes. The ongoing accumulation of strain along active faults increases the likelihood of future earthquakes, particularly in densely populated urban areas. The InSAR-derived displacement rates can be used to improve fault slip rate estimates and refine seismic hazard models. Furthermore, the identification of aseismic displacement highlights the importance of considering both seismic and non-seismic processes in hazard assessments.
Seismic activity in the region can cause intense ground shaking, particularly in areas with soft sedimentary deposits. The InSAR data highlights areas of subsidence, which may be prone to liquefaction during earthquakes. Liquefaction occurs when saturated soils lose their strength and behave like a liquid, leading to the collapse of buildings and infrastructure. This phenomenon was observed during the 2005 earthquake, where liquefaction exacerbated the damage in several areas [59].
The cross-section analysis (Figure 14) illustrates a core wedge structure, situated between the Dhurnal back thrust and the Khairi Murat thrust, which exhibits a characteristic flat–ramp–flat geometry. The back thrusts in this structure show angles that progressively increase with depth, eventually merging at the termination of the blind-floor thrust. This core wedge has experienced substantial deformation, including approximately 4.5 km of horizontal compression and a maximum displacement of about 5.5 km [36].

4.4. Correlation Between Land Subsidence and Anthropogenic Factors

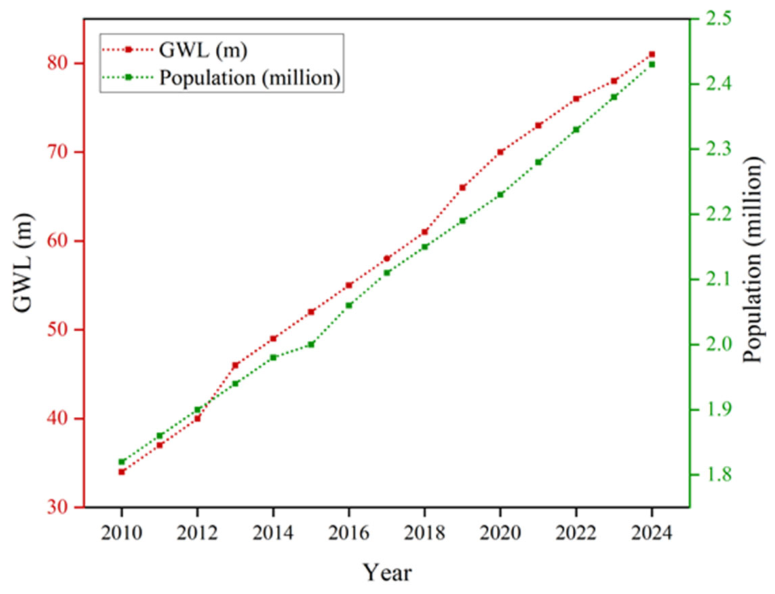
Geodetic measurements reveal subsidence patterns that spatially coincide with zones of dense urban development and documented groundwater extraction, although these observations alone do not establish definitive causal mechanisms. According to UN data, between 2010 and 2024, Rawalpindi and Islamabad have experienced substantial population growth, and according to data from Macrotrends, the population of Rawalpindi increased from approximately 1.847 million in 2010 to around 2.487 million in 2024, representing a growth rate of about 34.6% over the 14 years (Figure 15). Similarly, Islamabad’s population grew from about 1.312 million in 2010 to around 1.459 million in 2024, a growth rate of approximately 11.2%. This growth trend reflects the broader pattern of urban expansion, which leads to the overexploitation of natural resources. Urban expansion involves heavy infrastructure construction that increases surface loading. Such loading may compress underlying soils and sediments, potentially contributing to measured subsidence [60]. Poorly planned construction on unstable or compressible soils exacerbates the problem. Urbanization often involves the paving of surfaces (roads, parking lots, etc.), which reduces the infiltration of rainwater into the ground. This limits natural groundwater recharge, further depleting aquifers and accelerating subsidence.
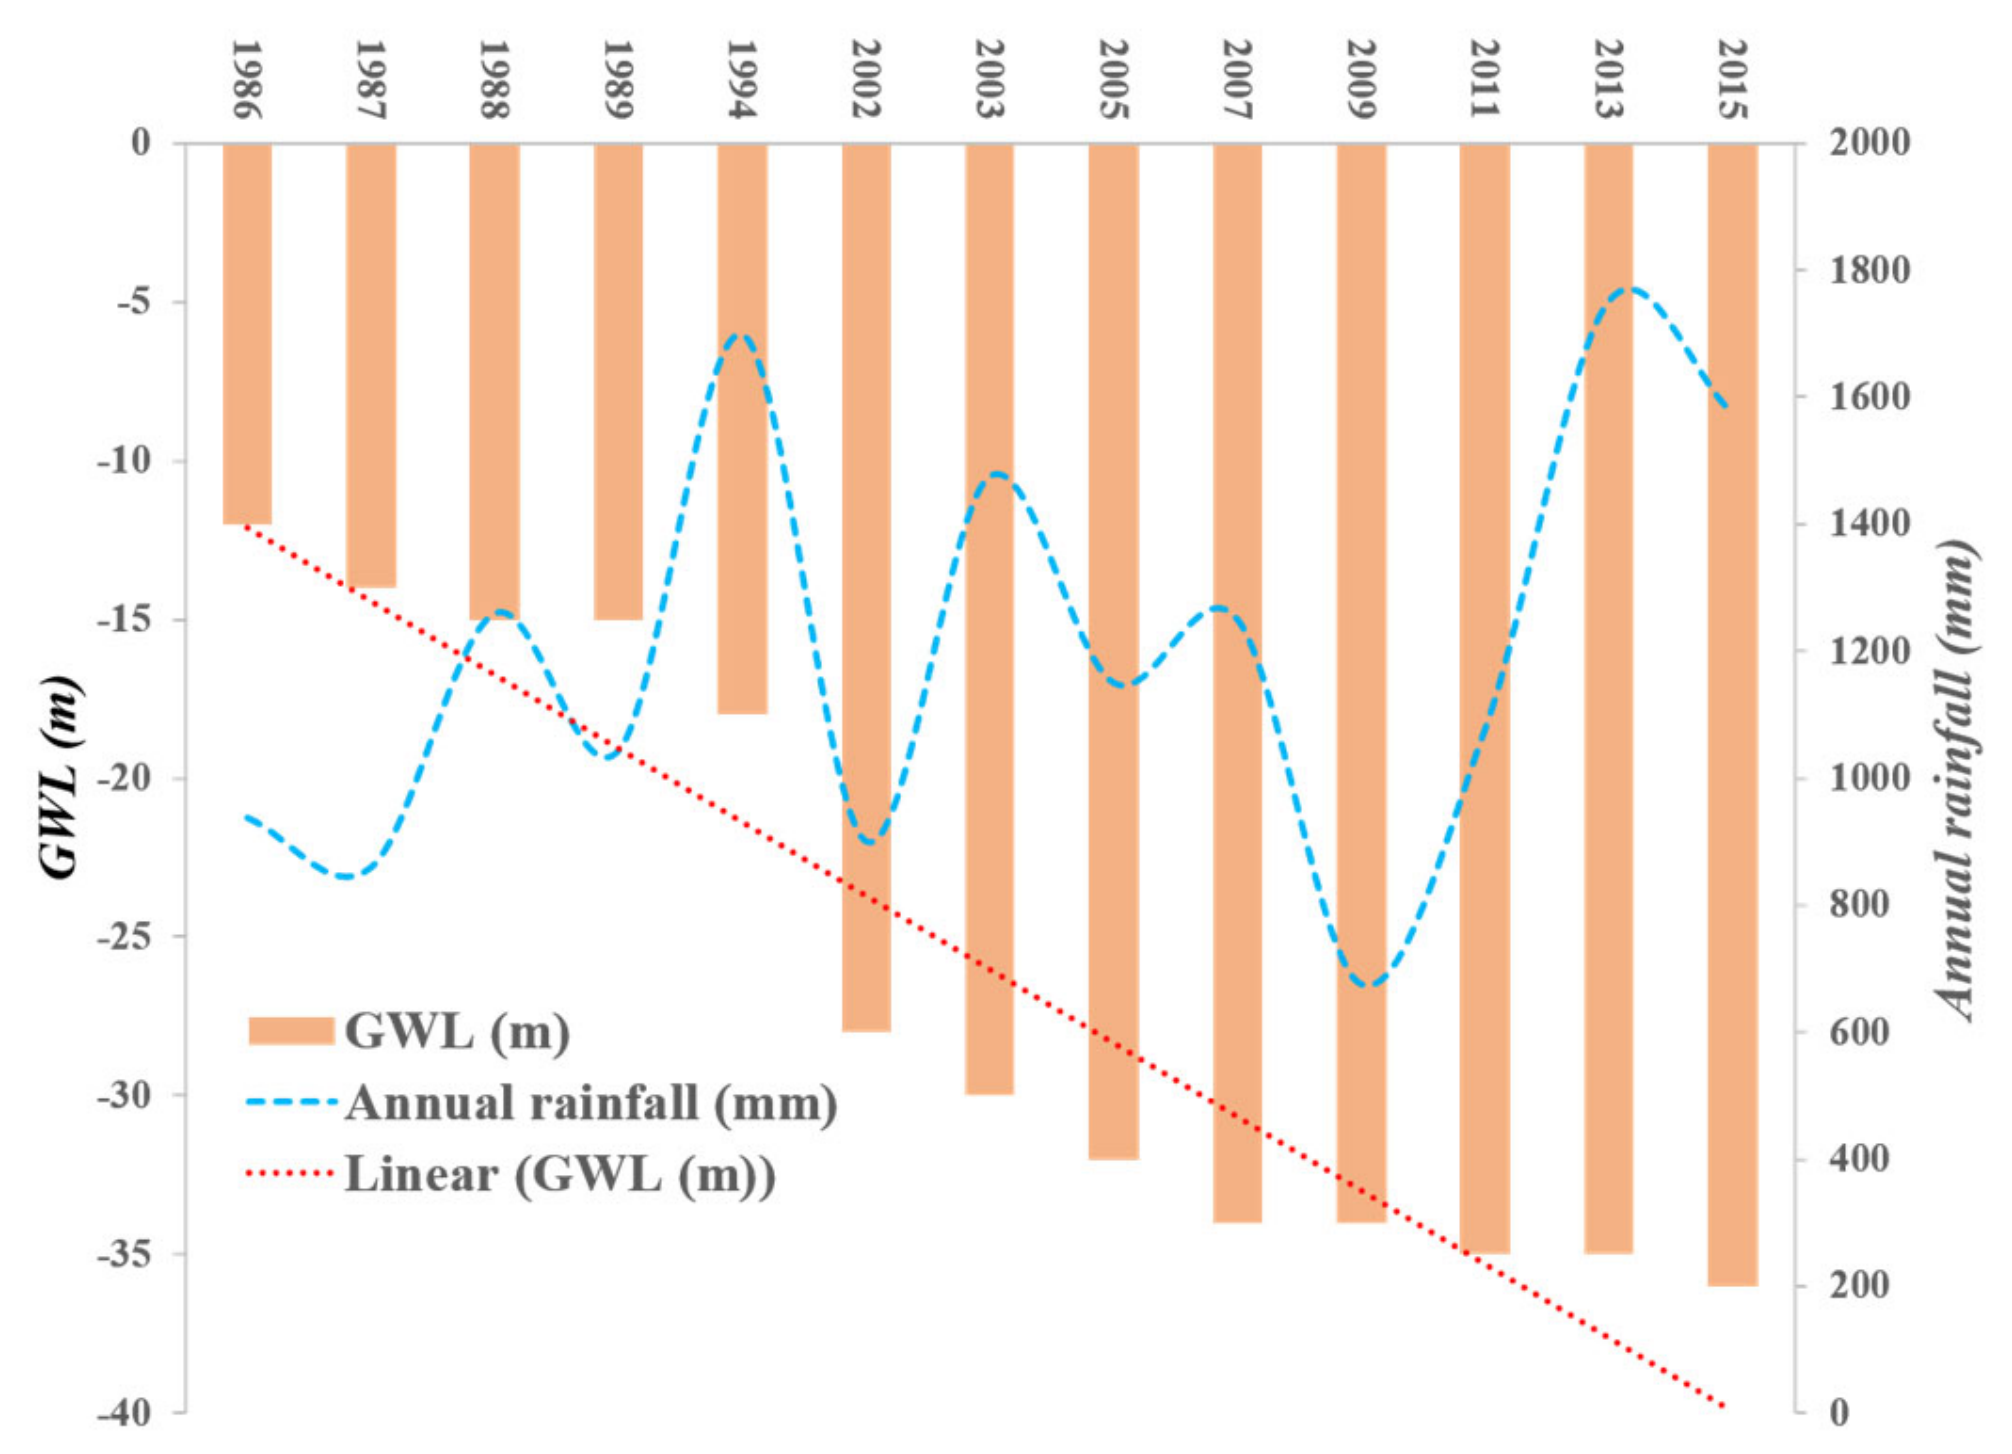
Groundwater extraction represents a factor frequently associated with subsidence in the Rawalpindi/Islamabad region [61]. The region’s reliance on groundwater for domestic and industrial use has led to a significant increase in the number of tube wells, resulting in overexploitation of groundwater resources. The Water and Sanitation Agency (WASA) of Rawalpindi reports that the city relies on over 450 tube wells, as well as a large number of private tube wells. The groundwater table has significantly declined, falling from 10 to 73 m over the last two decades. Between 1998 and 2003, groundwater levels declined by 10 to 14 m, and between 2003 and 2007, they dropped by an additional 5 m. From 2017 to 2021, the groundwater level dropped significantly from 58 to 73 m [62,63] (Figure 15). The GWL has consistently deepened over the study period. Some other statistics say that in 1986, the GWL was at approximately −12 m. This level progressively lowered over the decades, reaching a depth of around −35 m by 2013 and approximately −36 m by 2015 (Figure 15). The red dashed line on the figure, representing the linear trend of the GWL, visually confirms this consistent decrease (Figure 16). The dropping water levels are proportional to the increasing number of tube wells, indicating a significant deficit between water extraction and recharge.
Figure 15. Temporal variations in groundwater table level and population in Rawalpindi/Islamabad. GWL data interpolation was performed by [38,54,62], and the Pakistan Council of Research in Water Resources (PCRWR) in Islamabad. The UN population data source was incorporated to understand the trend of urbanization.
Remotesensing 18 01486 g015
Figure 16. Graphical representation of GWL in meters from 1986 to 2015 (Source: Pakistan Meteorological Department and [64]).
Remotesensing 18 01486 g016
Subsidence is more prevalent in highly populated areas with a maximum number of tube wells in the study area (Figure 17). The most built-up and densely populated region around the airport (white polygon in Figure 1c) exhibits rapid displacement, with GWL depleting rapidly and being the densest residential and commercial construction area. Our results reveal that the average ground subsidence has been increasing to 78 mm per year in 2024, as previously [9,54] estimated less than 70 mm annually in 2022, and it was around 50 mm in 2017. If the current trend of ground displacement in the Islamabad/Rawalpindi area continues due to the overexploitation of groundwater and urbanization, severe consequences will ensue. Buildings and infrastructure will face an increased risk of damage, as ground subsidence can cause structural instability and even collapse. Transportation networks may experience disruptions and increased maintenance costs due to the displacement of roads and railways. Additionally, the risk of flooding will escalate, as heavy rainfall on already subsiding land can lead to more frequent and severe inundations.
The region’s geology, characterized by soft clay soil, further exacerbates the vulnerability to subsidence, which may amplify anthropogenically induced displacement signals. Seasonal variations in groundwater levels, influenced by hydrogeological factors, appear reflected in the geodetic time series. Monsoon precipitation contributes to groundwater recharge in Rawalpindi and Islamabad, but its impact on mitigating ground subsidence is limited. Heavy rainfall can increase the weight of the soil due to water infiltration, adding stress to subsurface layers. This can trigger subsidence in areas with compressible soils or unconsolidated sediments. Intense rainfall can erode subsurface materials, especially in areas with loose or poorly compacted soils, resulting in high subsidence detection [65]. In Quaternary Alluvium, this case study. This can lead to the formation of underground cavities, which may collapse and cause surface displacement (Figure 18). In this research, the variation in displacement during the monsoon weather was found, like in July and August of 2023 and 2024 (Figure 5c), which causes changes in the soil moisture content and pore water pressure, which can induce or accelerate subsidence.
During heavy rainfall (twin cities are in the region receiving the heaviest monsoon rainfall in Pakistan), water infiltrates into the Quaternary Alluvium, increasing soil moisture content [66]. This can cause the soil to expand, particularly if the alluvium contains expansive clay minerals, as is the case in the region under investigation. The expansion of soil particles increases the volume of the soil mass, resulting in upward and lateral displacement of the ground surface. Conversely, as the soil dries out, it can contract, which may lead to subsidence. This cycle of expansion and contraction can cause significant ground movement over time in the area. As a result, it will not only cause natural hazards related to ground subsidence but also lead to high costs for repairing infrastructure, supporting affected communities, and addressing public health issues in the region. Moreover, the long-term sustainability of water resources will be threatened, potentially leading to water scarcity and social conflicts. Therefore, it is crucial to implement sustainable water management practices and urban planning strategies to mitigate these risks and ensure the region’s stability and resilience.

4.5. Implications for Global Subsidence Monitoring and Limitations

The Consecutive Interferogram Stacking Approach, while demonstrated in the specific context of Pakistan’s capital area, possesses inherent characteristics that suggest its transferability to a wide range of geographic and geologic settings. The framework’s ability to generate interferograms from adjacent acquisition images to maximize coherence and minimize temporal decorrelation is not unique to the study area but is a general concern in InSAR processing. The advantages of this method in improving signal quality and coverage are expected to translate directly to other regions facing similar challenges, such as monitoring subsidence from groundwater extraction in urban areas, in tectonically active zones, or infrastructure stability in regions with high seasonal fluctuations. It is a robust tool for diverse applications globally, aligning with the broader goals of InSAR for understanding Earth’s surface dynamics.
While the CISA offers significant advantages in enhancing interferogram coherence and improving ground displacement monitoring, it is important to recognize its limitations for a comprehensive understanding of its practical applicability and potential failure scenarios. The CISA framework is highly dependent on the temporal sampling rate of the satellite data. The method’s core advantage—minimizing temporal decorrelation by using consecutive acquisitions—is most effective with a short revisit period. While Sentinel-1’s 6-day repeat pass offers a favorable condition, other SAR missions with longer revisit intervals (e.g., 24 days or more) may significantly limit the number of available consecutive pairs, thereby reducing the method’s effectiveness. This can lead to a less robust time series and a reduced ability to capture short-term deformation signals.
While CISA effectively eliminates the systematic bias introduced by spatial multilooking, we acknowledge that it does not remove all sources of phase instability inherent to short-interval interferograms. Fading signals comprise two distinct components: (1) multilooking-induced bias arising from spatial averaging within resolution cells, which CISA completely removes by preserving full resolution; and (2) residual temporal decorrelation noise from the scattering medium itself, which may persist even in 12-day intervals over vegetated surfaces. Atmospheric delays and thermal noise also remain present in full-resolution data.
Unlike SBAS, which relies on redundant interferometric connections to resolve phase ambiguities, CISA operates on temporal phase consistency—consecutive interferograms share common acquisition dates, creating an implicit constraint where the additive property of sequential phases (φ1,2 + φ2,3 = φ1,3) mathematically ensures solution uniqueness without requiring redundant baseline pairs. Therefore, CISA is best positioned as a specialized processing framework for high-resolution, near-real-time deformation monitoring rather than an all-encompassing noise elimination solution.

5. Conclusions

This study introduces the CISA, a processing framework optimized for near-real-time deformation monitoring in urban environments. Unlike conventional InSAR methods that rely on extensive network reprocessing or spatial multilooking to suppress geophysical noise, CISA utilizes consecutive short-baseline interferograms at full spatial resolution to enable incremental velocity updates within hours of new image acquisition.
The case study demonstrates that CISA provides valuable insights for rapid-response applications, revealing significant deformation patterns in Pakistan’s capital region. The area around the airport, characterized by dense construction and groundwater level decline of 1–5 m per year, exhibits maximum subsidence rates reaching 78 mm/yr. These observed deformation patterns spatially coincide with the mapped traces of the Dhurnal blind thrust and Bokra thrust, as well as with features possibly related to previously unrecognized concealed structures, suggesting that structural controls may contribute to the localized subsidence distribution. The region along the Soan Syncline displays distinctive subsidence-uplift patterns consistent with blind-fault-related deformation, as resolved through multi-directional displacement decomposition. These findings carry significant implications for operational infrastructure monitoring and risk mitigation. The ability to update deformation velocities incrementally—without reprocessing historical data—renders CISA suitable for time-critical applications such as pre-failure warning systems, where detecting 20 mm of displacement within 24 h provides greater societal value than measuring it to 2 mm precision after 30 days. However, users must recognize that CISA prioritizes latency and spatial resolution over the phase stabilization achieved through long-baseline or multilooked techniques.
Future efforts should focus on integrating CISA-derived displacement time series with geological surveys, updated GWL data, and GNSS networks to establish quantitative correlations between anthropogenic extraction and surface deformation. Additionally, developing automated early warning systems based on CISA’s rapid-update capability, combined with adaptive urban planning strategies that account for detected blind fault zones, remains crucial for mitigating risks associated with ground displacement in tectonically active, rapidly urbanizing regions.

Supplementary Materials

The following supporting information can be downloaded at: https://www.mdpi.com/article/10.3390/rs18101486/s1, Figure S1: LOS displacement velocity mapped via PSI method: (a and b) represent the displacement map for descending and ascending directions; (c and d) depict the graph of profile line AA’ and BB’ where the blue line denotes descending, while the ascending is drawn in green color; Figure S2: The Line-of-Sight (LOS) displacement velocity was mapped using the SBAS method: (a) and (b) show the displacement maps for the descending and ascending directions, respectively; (c) and (d) illustrate the profiles along lines AA’ and BB’. In these profiles, the blue line represents the descending direction, while the green line corresponds to the ascending direction; Figure S3: (a) and (b) illustrate the vertical and horizontal displacement velocities mapped via the PSI technique, and (c) a graphical representation of time series displacement for PS p1 to p6 and monthly precipitation data; Figure S4: Figures (a) and (b) show the vertical and horizontal displacement velocities mapped using the SBAS approach. Figure (c) provides a graphical representation of the time series displacement and monthly precipitation data. References [50,51,52,67,68,69] are cited in the supplementary materials.

Author Contributions

S.H.: Methodology, Conceptualization, software, formal analysis, visualization, data curation, writing original draft. F.L.: Conceptualization, Supervision, Methodology, Writing—review and editing. B.P.: Supervision, Methodology, Data curation, review, and editing. R.X.: review and editing, and Funding acquisition. Z.A.: Methodology, Writing—review and editing. W.H.: Writing—review and editing, Validation. Y.P.: editing and Data curation. H.L.: Data curation and review. All authors have read and agreed to the published version of the manuscript.

Funding

This work was supported by the Guizhou Provincial Foundation for Excellent Scholars Program (NO. GCC[2023]109).

Data Availability Statement

The data and materials used in this article are available upon request from the author of the correspondence.

Conflicts of Interest

Author Fei Liu was employed by the Viridien Satellite Mapping. Author Rui Xu was employed by the GuiZhou Survey/Design Institute for Water Resources and Hydropower Co., Ltd. The remaining authors declare that the research was conducted in the absence of any commercial or financial relationships that could be construed as a potential conflict of interest.

References

  1. Royden, L.H.; Burchfiel, B.C.; King, R.W.; Wang, E.; Chen, Z.; Shen, F.; Liu, Y. Surface Deformation and Lower Crustal Flow in Eastern Tibet. Science 1997, 276, 788–790. [Google Scholar] [CrossRef] [PubMed]
  2. Zuccarini, A.; Giacomelli, S.; Severi, P.; Berti, M. Long-term spatiotemporal evolution of land subsidence in the urban area of Bologna, Italy. Bull. Eng. Geol. Environ. 2024, 83, 35. [Google Scholar] [CrossRef]
  3. Ahmed, S.; Hiraga, Y.; Kazama, S. Land subsidence in Bangkok vicinity: Causes and long-term trend analysis using InSAR and machine learning. Sci. Total Environ. 2024, 946, 174285. [Google Scholar] [CrossRef]
  4. Herrera-García, G.; Ezquerro, P.; Tomás, R.; Béjar-Pizarro, M.; López-Vinielles, J.; Rossi, M.; Mateos, R.M.; Carreón-Freyre, D.; Lambert, J.; Teatini, P.; et al. Mapping the global threat of land subsidence. Science 2021, 371, 34–36. [Google Scholar] [CrossRef] [PubMed]
  5. Wu, J.; Shi, X.; Xue, Y.; Zhang, Y.; Wei, Z.; Yu, J. The development and control of the land subsidence in the Yangtze Delta, China. Environ. Geol. 2008, 55, 1725–1735. [Google Scholar] [CrossRef]
  6. Bendarzsevszkij, A.; Eszterhai, V.; Gere, L.; Klemensits, P.; Polyák, E. World economic forum 2017. Int. J. Res. Eng. Sci. Manag. 2021, 4. [Google Scholar]
  7. Bhatti, A.Q.; Hassan, S.Z.U.; Rafi, Z.; Khatoon, Z.; Ali, Q. Probabilistic seismic hazard analysis of Islamabad, Pakistan. J. Asian Earth Sci. 2011, 42, 468–478. [Google Scholar] [CrossRef]
  8. Barkat, A.; Ali, A.; Rehman, K.; Awais, M.; Tariq, M.A.; Ahmed, J.; Amin, M.A.; Iqbal, T. Multi-precursory Analysis of Phalla Earthquake (July 2015; Mw 5.1) Near Islamabad, Pakistan. Pure Appl. Geophys. 2018, 175, 4289–4304. [Google Scholar] [CrossRef]
  9. Afzal, Z.; Balz, T.; Asghar, A. Non-Linear PSInSAR Analysis of Deformation Patterns in Islamabad/Rawalpindi Region: Unveiling Tectonics and Earthquake-Driven Changes. Remote Sens. 2024, 16, 1194. [Google Scholar] [CrossRef]
  10. Khan, S.; Khan, M.A. Seismic Microzonation of Islamabad–Rawalpindi Metropolitan Area, Pakistan. Pure Appl. Geophys. 2018, 175, 149–164. [Google Scholar] [CrossRef]
  11. Ferretti, A.; Prati, C.; Rocca, F. Permanent scatterers in SAR interferometry. IEEE Trans. Geosci. Remote Sens. 2001, 39, 8–20. [Google Scholar] [CrossRef]
  12. Osmanoğlu, B.; Sunar, F.; Wdowinski, S.; Cabral-Cano, E. Time series analysis of InSAR data: Methods and trends. Isprs J. Photogramm. Remote Sens. 2016, 115, 90–102. [Google Scholar] [CrossRef]
  13. Zhang, G.; Xu, Z.; Chen, Z.; Wang, S.; Liu, Y.; Gong, X. Analyzing surface deformation throughout China’s territory using multi-temporal InSAR processing of Sentinel-1 radar data. Remote Sens. Environ. 2024, 305, 114105. [Google Scholar] [CrossRef]
  14. Babaee, S.; Khalili, M.A.; Chirico, R.; Sorrentino, A.; Di Martire, D. Spatiotemporal characterization of the subsidence and change detection in Tehran plain (Iran) using InSAR observations and Landsat 8 satellite imagery. Remote Sens. Appl. Soc. Environ. 2024, 36, 101290. [Google Scholar] [CrossRef]
  15. Hussain, S.; Pan, B.; Afzal, Z.; Sajjad, M.M.; Kakar, N.; Ahmed, N.; Hussain, W.; Ali, M. SBAS-InSAR Analysis of tectonic derived ground deformation and subsidence susceptibility mapping via machine learning in Quetta City, Pakistan. Int. J. Digit. Earth 2025, 18, 2441926. [Google Scholar] [CrossRef]
  16. Beker, T.; Ansari, H.; Montazeri, S.; Song, Q.; Zhu, X.X. Deep Learning for Subtle Volcanic Deformation Detection With InSAR Data in Central Volcanic Zone. IEEE Trans. Geosci. Remote Sens. 2023, 61, 5218520. [Google Scholar] [CrossRef]
  17. Liu, Y.; Yao, X.; Gu, Z.; Li, R.; Zhou, Z.; Liu, X.; Jiang, S.; Yao, C.; Wei, S. Research on automatic recognition of active landslides using InSAR deformation under digital morphology: A case study of the Baihetan reservoir, China. Remote Sens. Environ. 2024, 304, 114029. [Google Scholar] [CrossRef]
  18. Liu, X.; Zhao, C.; Yin, Y.; Tomás, R.; Zhang, J.; Zhang, Q.; Wei, Y.; Wang, M.; Lopez-Sanchez, J.M. Refined InSAR method for mapping and classification of active landslides in a high mountain region: Deqin County, southern Tibet Plateau, China. Remote Sens. Environ. 2024, 304, 114030. [Google Scholar] [CrossRef]
  19. Necsoiu, M.; Onaca, A.; Wigginton, S.; Urdea, P. Rock glacier dynamics in Southern Carpathian Mountains from high-resolution optical and multi-temporal SAR satellite imagery. Remote Sens. Environ. 2016, 177, 21–36. [Google Scholar] [CrossRef]
  20. Wang, L.; Deng, K.; Zheng, M. Research on ground deformation monitoring method in mining areas using the probability integral model fusion D-InSAR, sub-band InSAR and offset-tracking. Int. J. Appl. Earth Obs. Geoinf. 2020, 85, 101981. [Google Scholar] [CrossRef]
  21. Yang, M.; Wang, R.; Li, M.; Liao, M. A PSI targets characterization approach to interpreting surface displacement signals: A case study of the Shanghai metro tunnels. Remote Sens. Environ. 2022, 280, 113150. [Google Scholar] [CrossRef]
  22. Hussain, S.; Pan, B.; Hussain, W.; Ali, M.; Sajjad, M.M.; Afzal, Z.; Tariq, A. Analyzing coseismic displacement of the M7.7 Myanmar earthquake on march 28, 2025, using Sentinel-1 InSAR data. Structures 2025, 80, 109718. [Google Scholar] [CrossRef]
  23. Berardino, P.; Fornaro, G.; Lanari, R.; Sansosti, E. A new algorithm for surface deformation monitoring based on small baseline differential SAR interferograms. IEEE Trans. Geosci. Remote Sens. 2002, 40, 2375–2383. [Google Scholar] [CrossRef]
  24. Suhadha, A.G.; Trinugroho; Umbara, R.P.; Melati, D.N.; Astisiasari; Wisyanto; Arifianti, Y.; Trisnafiah, S.; Sukristianti; Hadivanto, A.L.; et al. Comparative Analysis of PSI and SBAS InSAR in Landslide Monitoring: Influence of Topography and Precipitation Dynamics. In 2024 IEEE International Conference on Aerospace Electronics and Remote Sensing Technology (ICARES); IEEE: New York, NY, USA, 2024; pp. 1–6. [Google Scholar]
  25. Wang, B.; Zhao, C.; Zhang, Q.; Liu, X.; Lu, Z.; Liu, C.; Zhang, J. Sequential DS-ISBAS InSAR Deformation Parameter Dynamic Estimation and Quality Evaluation. Remote Sens. 2023, 15, 2097. [Google Scholar] [CrossRef]
  26. Wang, B.; Zhao, C.; Zhang, Q.; Peng, M. Sequential InSAR Time Series Deformation Monitoring of Land Subsidence and Rebound in Xi’an, China. Remote Sens. 2019, 11, 2854. [Google Scholar] [CrossRef]
  27. Staniewicz, S.; Mirzaee, S.; Fattahi, H.; Oliver-Cabrera, T.; Havazli, E.; Gunter, G.; Jeon, S.-Y.; Bato, M.G.; Kim, J.; Sangha, S.S.; et al. Near-Real-Time InSAR Phase Estimation for Large-Scale Surface Displacement Monitoring. arXiv 2025, arXiv:2511.12051. [Google Scholar] [CrossRef]
  28. Ansari, H.; Zan, F.D.; Parizzi, A. Study of Systematic Bias in Measuring Surface Deformation With SAR Interferometry. IEEE Trans. Geosci. Remote Sens. 2021, 59, 1285–1301. [Google Scholar] [CrossRef]
  29. Maghsoudi, Y.; Hooper, A.J.; Wright, T.J.; Lazecky, M.; Ansari, H. Characterizing and correcting phase biases in short-term, multilooked interferograms. Remote Sens. Environ. 2022, 275, 113022. [Google Scholar] [CrossRef]
  30. Jadoon, I.A.; Frisch, W.; Jaswal, T.M.; Kemal, A. Triangle zone in the Himalayan foreland, north Pakistan. Spec. Pap.-Geol. Soc. Am. 1999, 86, 275–286. [Google Scholar]
  31. Awais, M.; Qasim, M.; Tanoli, J.I.; Ding, L.; Sattar, M.; Baig, M.S.; Pervaiz, S. Detrital Zircon Provenance of the Cenozoic Sequence, Kotli, Northwestern Himalaya, Pakistan; Implications for India–Asia Collision. Minerals 2021, 11, 1399. [Google Scholar] [CrossRef]
  32. Kamran, J.; Khan, A.; Khayyam, U.; Waheed, A.; Khokhar, M.F. Exploring the nexus between land use land cover (LULC) changes and population growth in a planned city of islamabad and unplanned city of Rawalpindi, Pakistan. Heliyon 2023, 9, e13297. [Google Scholar] [CrossRef] [PubMed]
  33. Albrecht, S. Geology of the NW Indian Himalaya. Eclogae Geol. Helv. 2003, 96, 147–196. [Google Scholar]
  34. Bendick, R.; Bilham, R.; Khan, M.A.; Khan, S.F. Slip on an active wedge thrust from geodetic observations of the 8 October 2005 Kashmir earthquake. Geology 2007, 35, 267–270. [Google Scholar] [CrossRef]
  35. Kazmi, A.H.; Jan, M.Q. Geology and Tectonics of Pakistan; Graphic Publishers: Karachi, Pakistan, 1997; pp. 1–569. [Google Scholar]
  36. Lisa, M.; Khan, S.A.; Khwaja, A.A. Focal mechanism study of north Potwar deformed zone, Pakistan. Acta Seismol. Sin. 2004, 17, 255–261. [Google Scholar] [CrossRef]
  37. Williams, V.S.; Pasha, M.K.; Sheikh, I.M. Geologic map of the Islamabad-Rawalpindi area, Punjab, northern Pakistan. In Open-File Report; Report 99-47; 1999. Available online: https://pubs.usgs.gov/publication/ofr9947 (accessed on 23 April 2026).
  38. Zafar, W.A.; Javed, F.; Ahmed, R.; Shah, M.A.; Ahmad, M.; Khan, M.Y.; Abdullah, G.M.S.; Khan, D.; Najeh, T.; Gamil, Y. Time series subsidence evaluation using NSBAS InSAR: A case study of twin megacities (Rawalpindi and Islamabad) in Pakistan. Front. Earth Sci. 2024, 12, 1336530. [Google Scholar] [CrossRef]
  39. Sheikh, I.M.; Pasha, M.K.; Williams, V.S.; Raza, S.Q.; Khan, K. Environmental geology of the Islamabad-Rawalpindi area, northern Pakistan. In Regional Studies of the Potwar Plateau Area, Northern Pakistan; Warwick, P.D., Wardlaw, B.R., Eds.; US Geological Survey Bulletin; U.S. Agency for International Development (USAID): Washington, DC, USA, 2008; p. 2078. [Google Scholar]
  40. Liu, H.; Zhou, B.; Bai, Z.; Zhao, W.; Zhu, M.; Zheng, K.; Yang, S.; Li, G. Applicability Assessment of Multi-Source DEM-Assisted InSAR Deformation Monitoring Considering Two Topographical Features. Land 2023, 12, 1284. [Google Scholar] [CrossRef]
  41. Javed, S.; Shahzad, M.I.; Abbas, S.; Nazeer, M. Long-term variability of atmospheric visual range (1980–2020) over diverse topography of Pakistan. Remote Sens. 2022, 15, 46. [Google Scholar] [CrossRef]
  42. Hooper, A.; Zebker, H.; Segall, P.; Kampes, B. A new method for measuring deformation on volcanoes and other natural terrains using InSAR persistent scatterers. Geophys. Res. Lett. 2004, 31, L23611. [Google Scholar] [CrossRef]
  43. Rucci, A.; Ferretti, A.; Guarnieri, A.M.; Rocca, F. Sentinel 1 SAR interferometry applications: The outlook for sub millimeter measurements. Remote Sens. Environ. 2012, 120, 156–163. [Google Scholar] [CrossRef]
  44. Wang, T.; Liao, M.; Perissin, D. InSAR Coherence-Decomposition Analysis. IEEE Geosci. Remote Sens. Lett. 2010, 7, 156–160. [Google Scholar] [CrossRef]
  45. Li, J.; Xu, Z.; Zhang, X.; Ma, W.; He, S. A Persistent Scatterer Point Selection Method for Deformation Monitoring of Under-Construction Cross-Sea Bridges Using Statistical Theory and GMM-EM Algorithm. Remote Sens. 2024, 16, 2197. [Google Scholar] [CrossRef]
  46. Ma, Z.; Wang, N.; Yang, Y.; Aoki, Y.; Wei, S. Unwrapping error and fading signal correction on multi-looked InSAR data. ISPRS J. Photogramm. Remote Sens. 2025, 220, 51–63. [Google Scholar] [CrossRef]
  47. Wright, T.J.; Parsons, B.E.; Lu, Z. Toward mapping surface deformation in three dimensions using InSAR. Geophys. Res. Lett. 2004, 31. [Google Scholar] [CrossRef]
  48. Hooper, A.; Zebker, H.A. Phase unwrapping in three dimensions with application to InSAR time series. J. Opt. Soc. Am. A Opt. Image Sci. Vis. 2007, 24, 2737–2747. [Google Scholar] [CrossRef] [PubMed]
  49. Chen, C.W.; Zebker, H.A. Two-dimensional phase unwrapping with use of statistical models for cost functions in nonlinear optimization. J. Opt. Soc. Am. A 2001, 18, 338–351. [Google Scholar] [CrossRef]
  50. Shi, M.; Peng, J.; Chen, X.; Zheng, Y.; Yang, H.; Su, Y.; Wang, G.; Wang, W. An improved method for InSAR atmospheric phase correction in mountainous areas. IEEE J. Sel. Top. Appl. Earth Obs. Remote Sens. 2021, 14, 10509–10519. [Google Scholar] [CrossRef]
  51. Khalili, M.A.; Voosoghi, B.; Guerriero, L.; Haji-Aghajany, S.; Calcaterra, D.; Di Martire, D. Mapping of Mean Deformation Rates Based on APS-Corrected InSAR Data Using Unsupervised Clustering Algorithms. Remote Sens. 2023, 15, 529. [Google Scholar] [CrossRef]
  52. Yan, Y.; Doin, M.P.; Lopez-Quiroz, P.; Tupin, F.; Fruneau, B.; Pinel, V.; Trouve, E. Mexico City Subsidence Measured by InSAR Time Series: Joint Analysis Using PS and SBAS Approaches. IEEE J. Sel. Top. Appl. Earth Obs. Remote Sens. 2012, 5, 1312–1326. [Google Scholar] [CrossRef]
  53. Khurram, S.; Gondal, M.M.I.; Ali, S.A.; Din, Z.U. Cracking and Causes of Ground Displacement in Rawat Rawalpindi Pakistan (Causes and Effect Report). Int. J. Earth Sci. Knowl. Appl. 2022, 4, 19–25. [Google Scholar]
  54. Khan, J.; Ren, X.; Hussain, M.A.; Jan, M.Q. Monitoring Land Subsidence Using PS-InSAR Technique in Rawalpindi and Islamabad, Pakistan. Remote Sens. 2022, 14, 3722. [Google Scholar] [CrossRef]
  55. Ng, A.H.-M.; Liu, Z.; Du, Z.; Huang, H.; Wang, H.; Ge, L. A novel framework for combining polarimetric Sentinel-1 InSAR time series in subsidence monitoring—A case study of Sydney. Remote Sens. Environ. 2023, 295, 113694. [Google Scholar] [CrossRef]
  56. Xu, B.; Li, Z.; Zhu, Y.; Shi, J.; Feng, G. Kinematic Coregistration of Sentinel-1 TOPSAR Images Based on Sequential Least Squares Adjustment. IEEE J. Sel. Top. Appl. Earth Obs. Remote Sens. 2020, 13, 3083–3093. [Google Scholar] [CrossRef]
  57. Crosetto, M.; Monserrat, O.; Cuevas-González, M.; Devanthéry, N.; Crippa, B. Persistent Scatterer Interferometry: A review. ISPRS J. Photogramm. Remote Sens. 2016, 115, 78–89. [Google Scholar] [CrossRef]
  58. Adhami, N.; Ilyas, M.; Ahmad, M. Seismotectonic Studies of the Rawalpindi Region: Islamabad; National Engineering Services of Pakistan (NESPAK) Limited: Punjab, Pakistan; Pakistan Atomic Energy Commission: Islamabad, Pakistan, 1980; 139p. [Google Scholar]
  59. Owen, L.A.; Kamp, U.; Khattak, G.A.; Harp, E.L.; Keefer, D.K.; Bauer, M.A. Landslides triggered by the 8 October 2005 Kashmir earthquake. Geomorphology 2008, 94, 1–9. [Google Scholar] [CrossRef]
  60. Galloway, D.L.; Jones, D.R.; Ingebritsen, S.E. Land Subsidence in the United States 1182; Geological Survey (USGS): Reston, VA, USA, 1999. [Google Scholar]
  61. Qureshi, A.S.; Gill, M.A.; Sarwar, A. Sustainable groundwater management in Pakistan: Challenges and opportunities. Irrig. Drain. 2010, 59, 107–116. [Google Scholar] [CrossRef]
  62. Abbas, I.; Kiyani, S.G.; Ahsan, M.S.; Akram, H.; Iqbal, J. Spatio-temporal analysis of water table within Rawalpindi municipal jurisdiction. Tech. Rep. Inst. Geogr. Inf. Syst. Sch. Civ. Environ. Eng. NUST 2012. [Google Scholar]
  63. Iqbal, N.; Din, S.; Ashraf, M.; Asmat, S. Hydrological Assessment of Surface and Groundwater Resources of Islamabad, Pakistan; Pakistan Council of Research in Water Resources (PCRWR): Islamabad, Pakistan, 2023; p. 76. [Google Scholar]
  64. Rana, S.A.; Ali, S.M.; Ashraf, M.; Gondal, N.I.; Rahman, S.; Akhtar, N. Estimation of the domestic water demand-supply scenario and its key driving factors in the Islamabad-Rawalpindi Metropolitan Area, Pakistan. PLoS ONE 2025, 20, e0293927. [Google Scholar] [CrossRef] [PubMed]
  65. Wang, X.-W.; Xu, Y.-S. Investigation on the phenomena and influence factors of urban ground collapse in China. Nat. Hazards 2022, 113, 1–33. [Google Scholar] [CrossRef]
  66. Ashfaq, A.; Ashraf, M.; Bahzad, A. Spatial and temporal assessment of groundwater behaviour in the Soan Basin of Pakistan. Univ. Eng. Technol. Taxila. Tech. J. 2014, 19, 12. [Google Scholar]
  67. Hooper, A.J. A multi-temporal InSAR method incorporating both persistent scatterer and small baseline approaches. Geophys. Res. Lett. 2008, 35, L16302. [Google Scholar] [CrossRef]
  68. Ren, H.; Feng, X. Calculating vertical deformation using a single InSAR pair based on singular value decomposition in mining areas. Int. J. Appl. Earth Obs. Geoinf. 2020, 92, 102115. [Google Scholar] [CrossRef]
  69. Sousa, J.J.; Hooper, A.J.; Hanssen, R.F.; Bastos, L.C.; Ruiz, A.M. Persistent Scatterer InSAR: A comparison of methodologies based on a model of temporal deformation vs. spatial correlation selection criteria. Remote Sens. Environ. 2011, 115, 2652–2663. [Google Scholar] [CrossRef]
Figure 1. Study area location map: (a) represents a geological map with surface lithological units, fault lines, and past earthquake epicenter location with red circles, GT, BT, DBT, and RT stand for Golra thrust, Bokra thrust, Dhurnal back thrust, and Riwat thrust, (b) depicts the regional map, where green and purple rectangles the data frame Sentinel-1 imagery for descending and ascending geometry; and (c) shows the relief variation in the study area on which main roads and streamlines have been overlaid. The red stars represent the main locations.
Remotesensing 18 01486 g001
Figure 2. Methodology flowchart for this study.
Remotesensing 18 01486 g002
Figure 3. Temporal-spatial baselines distribution: (ac) descending track dataset baseline distribution for PSI, SBAS, and CISA; (df) same but for the ascending track.
Remotesensing 18 01486 g003
Figure 4. Coherence map comparison of the airport region (shown in Figure 1c as a white polygon). The upper three images show coherence for descending geometry data estimated by PSI, SBAS, and our CISA, respectively, and the same for ascending data in the lower three images. The processing details of PSI and SBAS are described in Supplementary Text S1.
Remotesensing 18 01486 g004
Figure 5. The LOS rate map using the CISA method: Figures (a,b) display the rate maps for the descending and ascending directions, respectively; Figures (c,d) depict the profiles along lines AA’ and BB’. In these profiles, the blue line indicates the direction of descending accumulated displacement, and the green line indicates the direction of ascending accumulated displacement.
Remotesensing 18 01486 g005
Figure 6. (a,b) depict the vertical and horizontal displacement velocities obtained through the CISA. Figure (c) presents a graphical illustration of the time series displacement and monthly precipitation pattern.
Remotesensing 18 01486 g006
Figure 7. Backscatter candidates’ distribution in the airport zone: (ac) show the points extracted through PSI, SBAS, and CISA overlapped on Google Earth (GE) imagery; (d) GE imagery.
Remotesensing 18 01486 g007
Figure 8. Pixel distribution pattern along the Soan River.
Remotesensing 18 01486 g008
Figure 9. The CISA incremental update mechanism through sequential integration of five new Sentinel-1 acquisitions. (a) Time-Position Plot illustrating the extended linear chain architecture; numbered acquisitions (52–56, highlighted in red) represent the newly appended SAR images acquired between 28 July 2024 and 26 September 2024. (bf) Interferometric phase maps (RGB composite) of the five sequentially formed interferograms.
Remotesensing 18 01486 g009
Figure 10. (a) Line-of-Sight (LOS) displacement encompassing the full 56-image archive (July 2022–September 2024), (b) displacement time series extracted at six persistent scatterer locations (p1–p6), illustrating the temporal evolution of deformation across the extended observation period.
Remotesensing 18 01486 g010
Figure 11. Graphical representation of coherence of backscatter points detected through PSI (a), SBAS (b), and CISA (c).
Remotesensing 18 01486 g011
Figure 12. It is the profile line AA’ drawn in Figure 6a in a graphical design where the orange line depicts PSI, and SBAS is represented in the pink line. In contrast, the green color line shows CISA-based changes in displacement in the area.
Remotesensing 18 01486 g012
Figure 13. Temporal variation in the displacement of PS1 and PS2 is selected in Figure 6 for PSI, SBAS, and CISA.
Remotesensing 18 01486 g013
Figure 14. (a) Cross-section model for the line BB’, adapted from [9,30], the abbreviations are as follows: KMT stands for Khairi Murat thrust, DBT for Dhurnal backthrust, Tm for Murree Formation, P-E depicts Permian through Eocene sedimentary rocks, and Ts for Soan Formation. (b) The previous and fault lines detected in this study are overlaid on a vertical deformation map, converted from points to raster by employing Inverse Distance Weighting (IDW) analysis, to visualize subsidence more prominently.
Remotesensing 18 01486 g014
Figure 17. Landcover map developed using Sentinel-2 data for the year 2024 for the area (a), zoomed view of subsidence pixels distribution in an urban area for the polygons b, c, and d shown on a (bd), and time series subsidence variation for the points p1, p2, and p3 selected from the building roofs on Figure (b,c,e) in this same figure.
Remotesensing 18 01486 g017
Figure 18. Photos of Structures’ fractures after earthquake shake; (a) cracks in the pillars of the elevated road of Rawalpindi-Islamabad Metrobus at 6th road after the 2015 Islamabad earthquake of magnitude 5.1, having a depth of 19.2 km, (b,c) Building crack occurred by 6.5 magnitude earthquake jolts most parts of Pakistan on 21st March, 2023, and (d,e) cracks and fissures on roads produced by 4.7 magnitude earthquake was felt in the 21 kms away from Rawalpindi on 15th February 2025 owns the depth of 35.8 km (Source: USGS).
Remotesensing 18 01486 g018
Table 1. Threshold selection for Time series InSAR processing. PSI and SBAS process details can be found in the Supplementary Materials section.
ParameterThresholds
PSISBASCISA
Interferometric pair combinationTemporal baseline (d)-18012
Perpendicular baseline (m)-350350
CoregistrationMulti-looking ratio1 × 11 × 41 × 1
SNR3.23.23.2
Phase UnwrappingmethodMCF-3DMCF-3DMCF-3D
Unwrapping coherence threshold0.40.450.42
Points selectionTemporal coherence threshold0.750.750.75
Disclaimer/Publisher’s Note: The statements, opinions and data contained in all publications are solely those of the individual author(s) and contributor(s) and not of MDPI and/or the editor(s). MDPI and/or the editor(s) disclaim responsibility for any injury to people or property resulting from any ideas, methods, instructions or products referred to in the content.