


The Spatiotemporal Dynamics and Evolutionary Relationship Between Urbanization and Eco-Environmental Quality: A Case Study in Hangzhou City, China


 ,
,
Abstract
1. Introduction
- (1)
- Integrate ISDD and RSEI to establish a spatiotemporally explicit framework for assessing the ecological effects of urbanization;
- (2)
- Conduct a long-term, high-resolution analysis of urbanization and ecological changes in Hangzhou from 1985 to 2020 using 30 m Landsat imagery;
- (3)
- Reveal spatially differentiated ecological responses across the old city, expansion areas, and suburban areas, and quantify their coordination level, providing scientific support for sustainable urban development.
2. Materials and Methods
2.1. Study Area
2.2. Datasets and Pre-Processing
2.2.1. Impervious Surface Data
2.2.2. Landsat Data
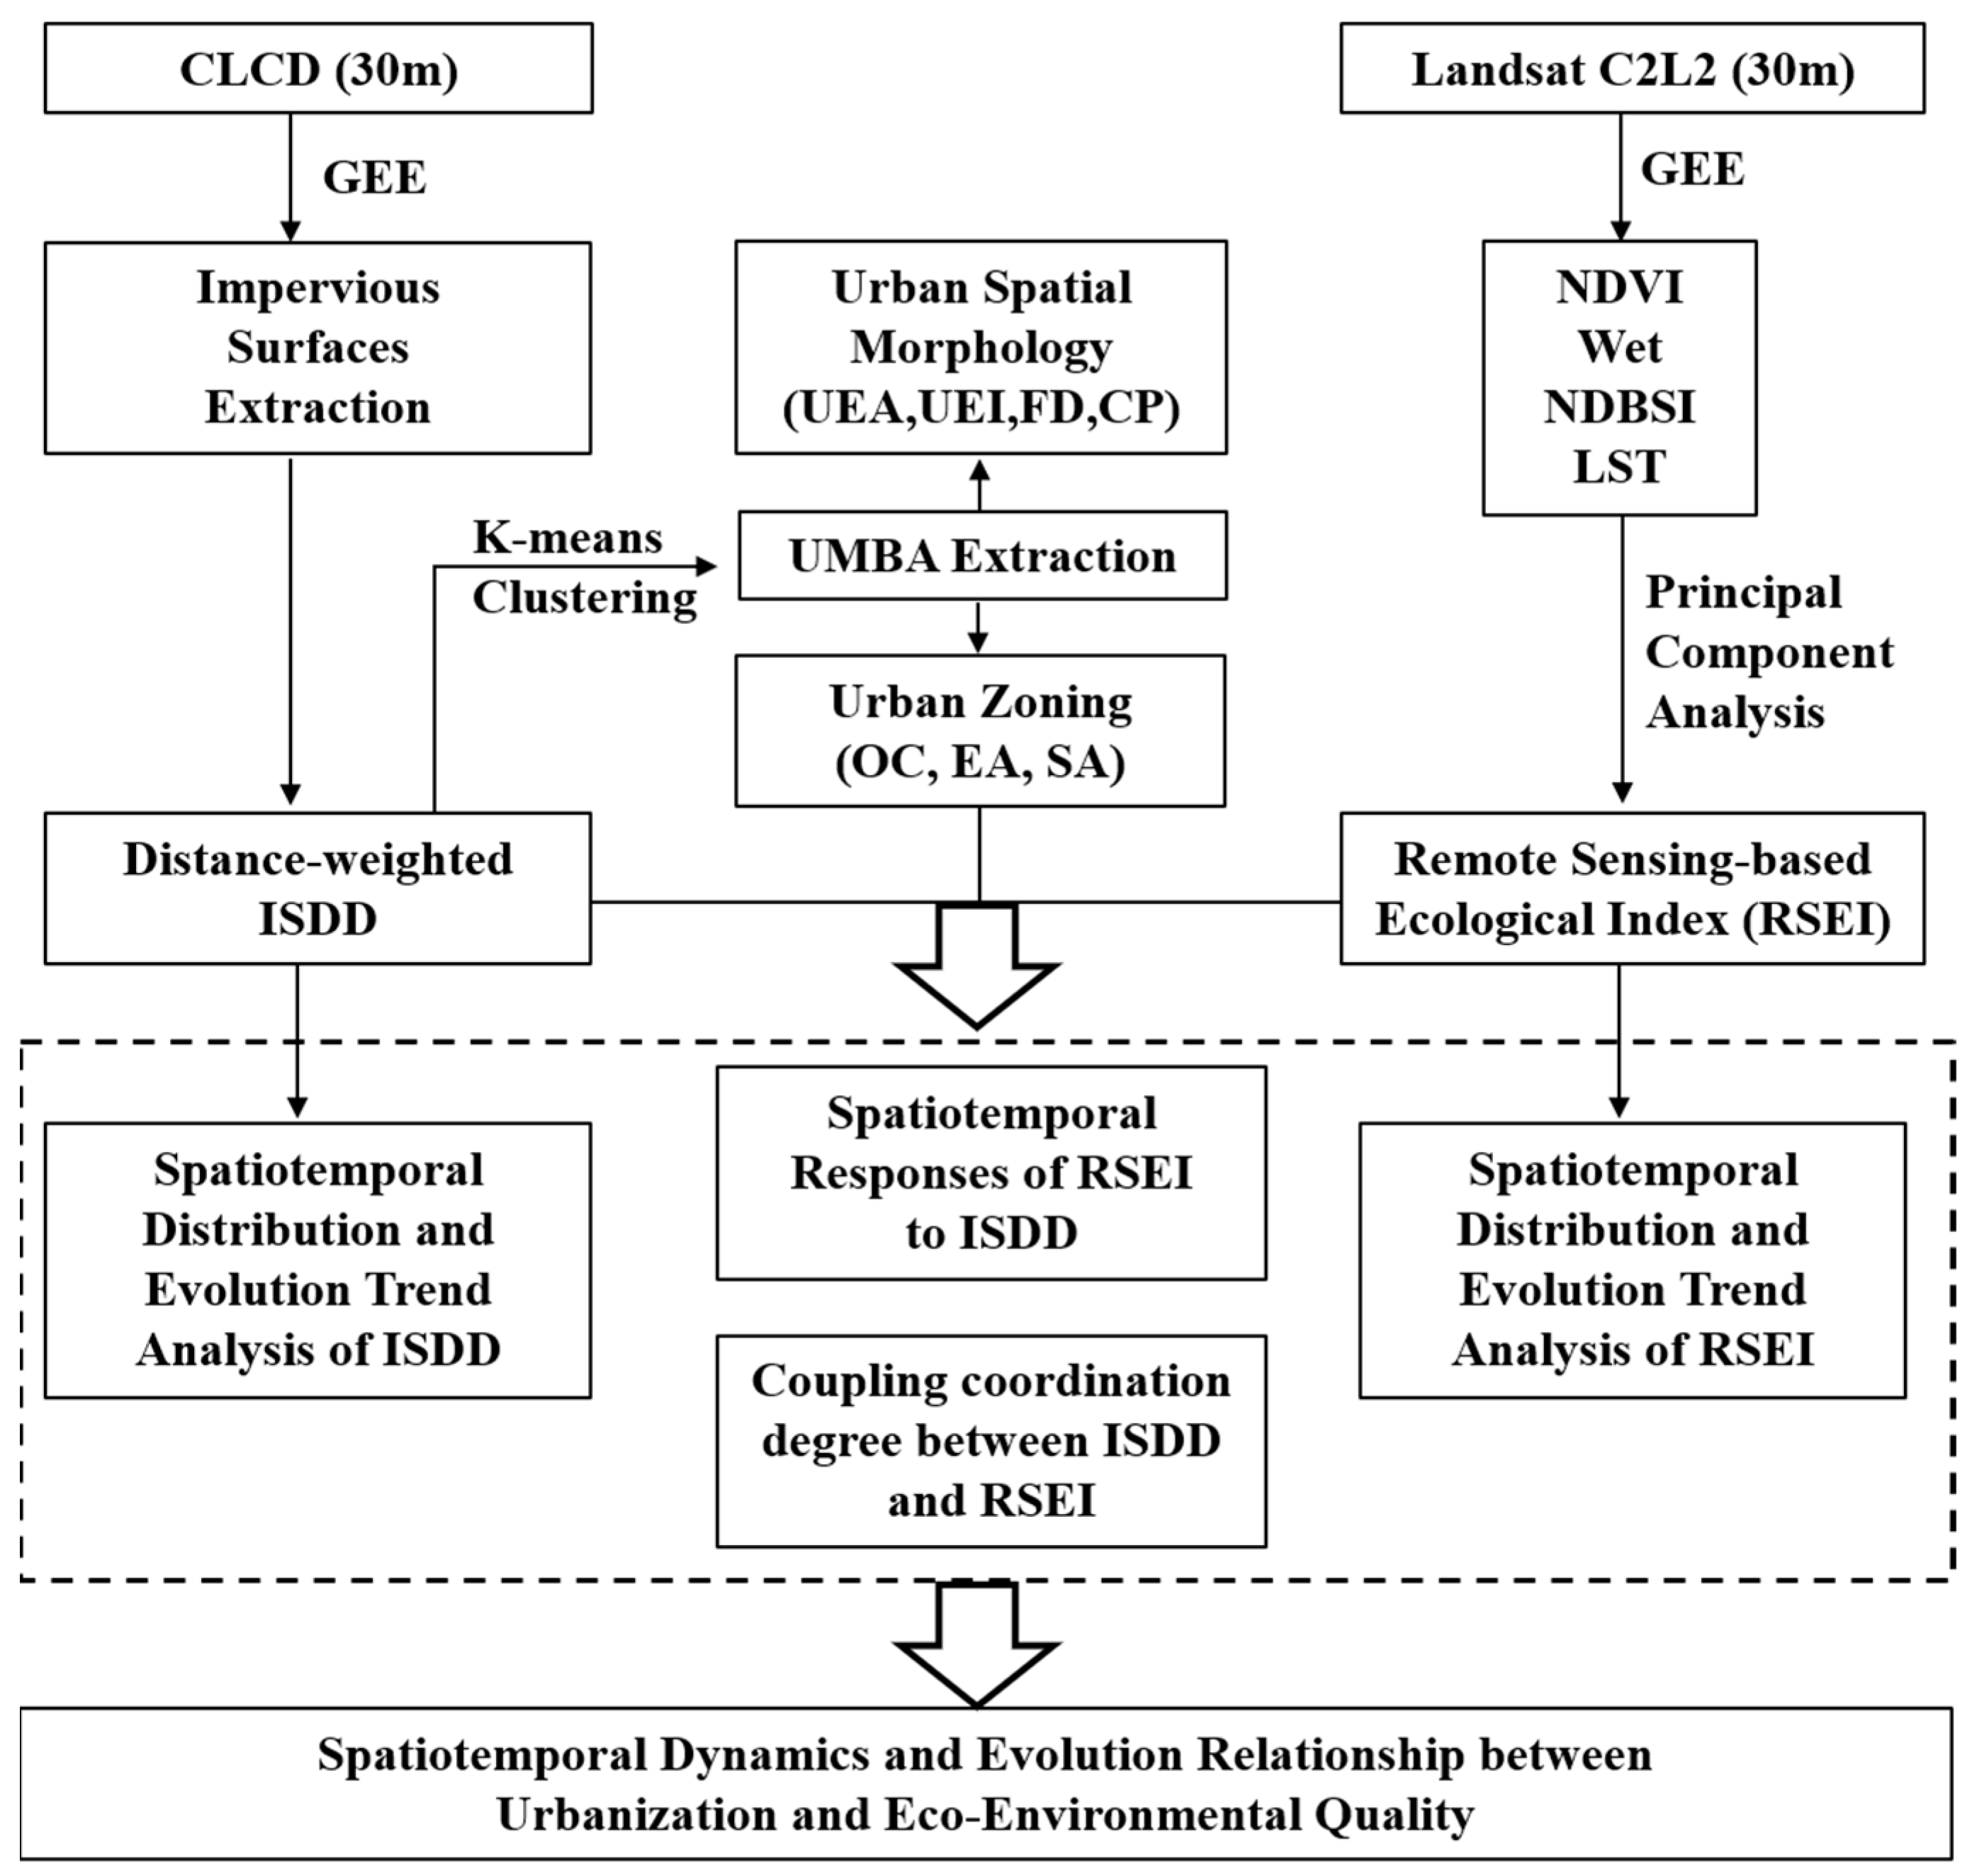
2.3. Methods
2.3.1. Calculation of ISDD
2.3.2. Extraction of UMBA Based on ISDD
2.3.3. Urban Spatial Morphology
2.3.4. Calculation of RSEI
2.3.5. Method for Analyzing Spatiotemporal Evolution Trends
2.3.6. Spatiotemporal Analysis of RSEI Responses to ISDD
2.3.7. CCD Model
3. Results
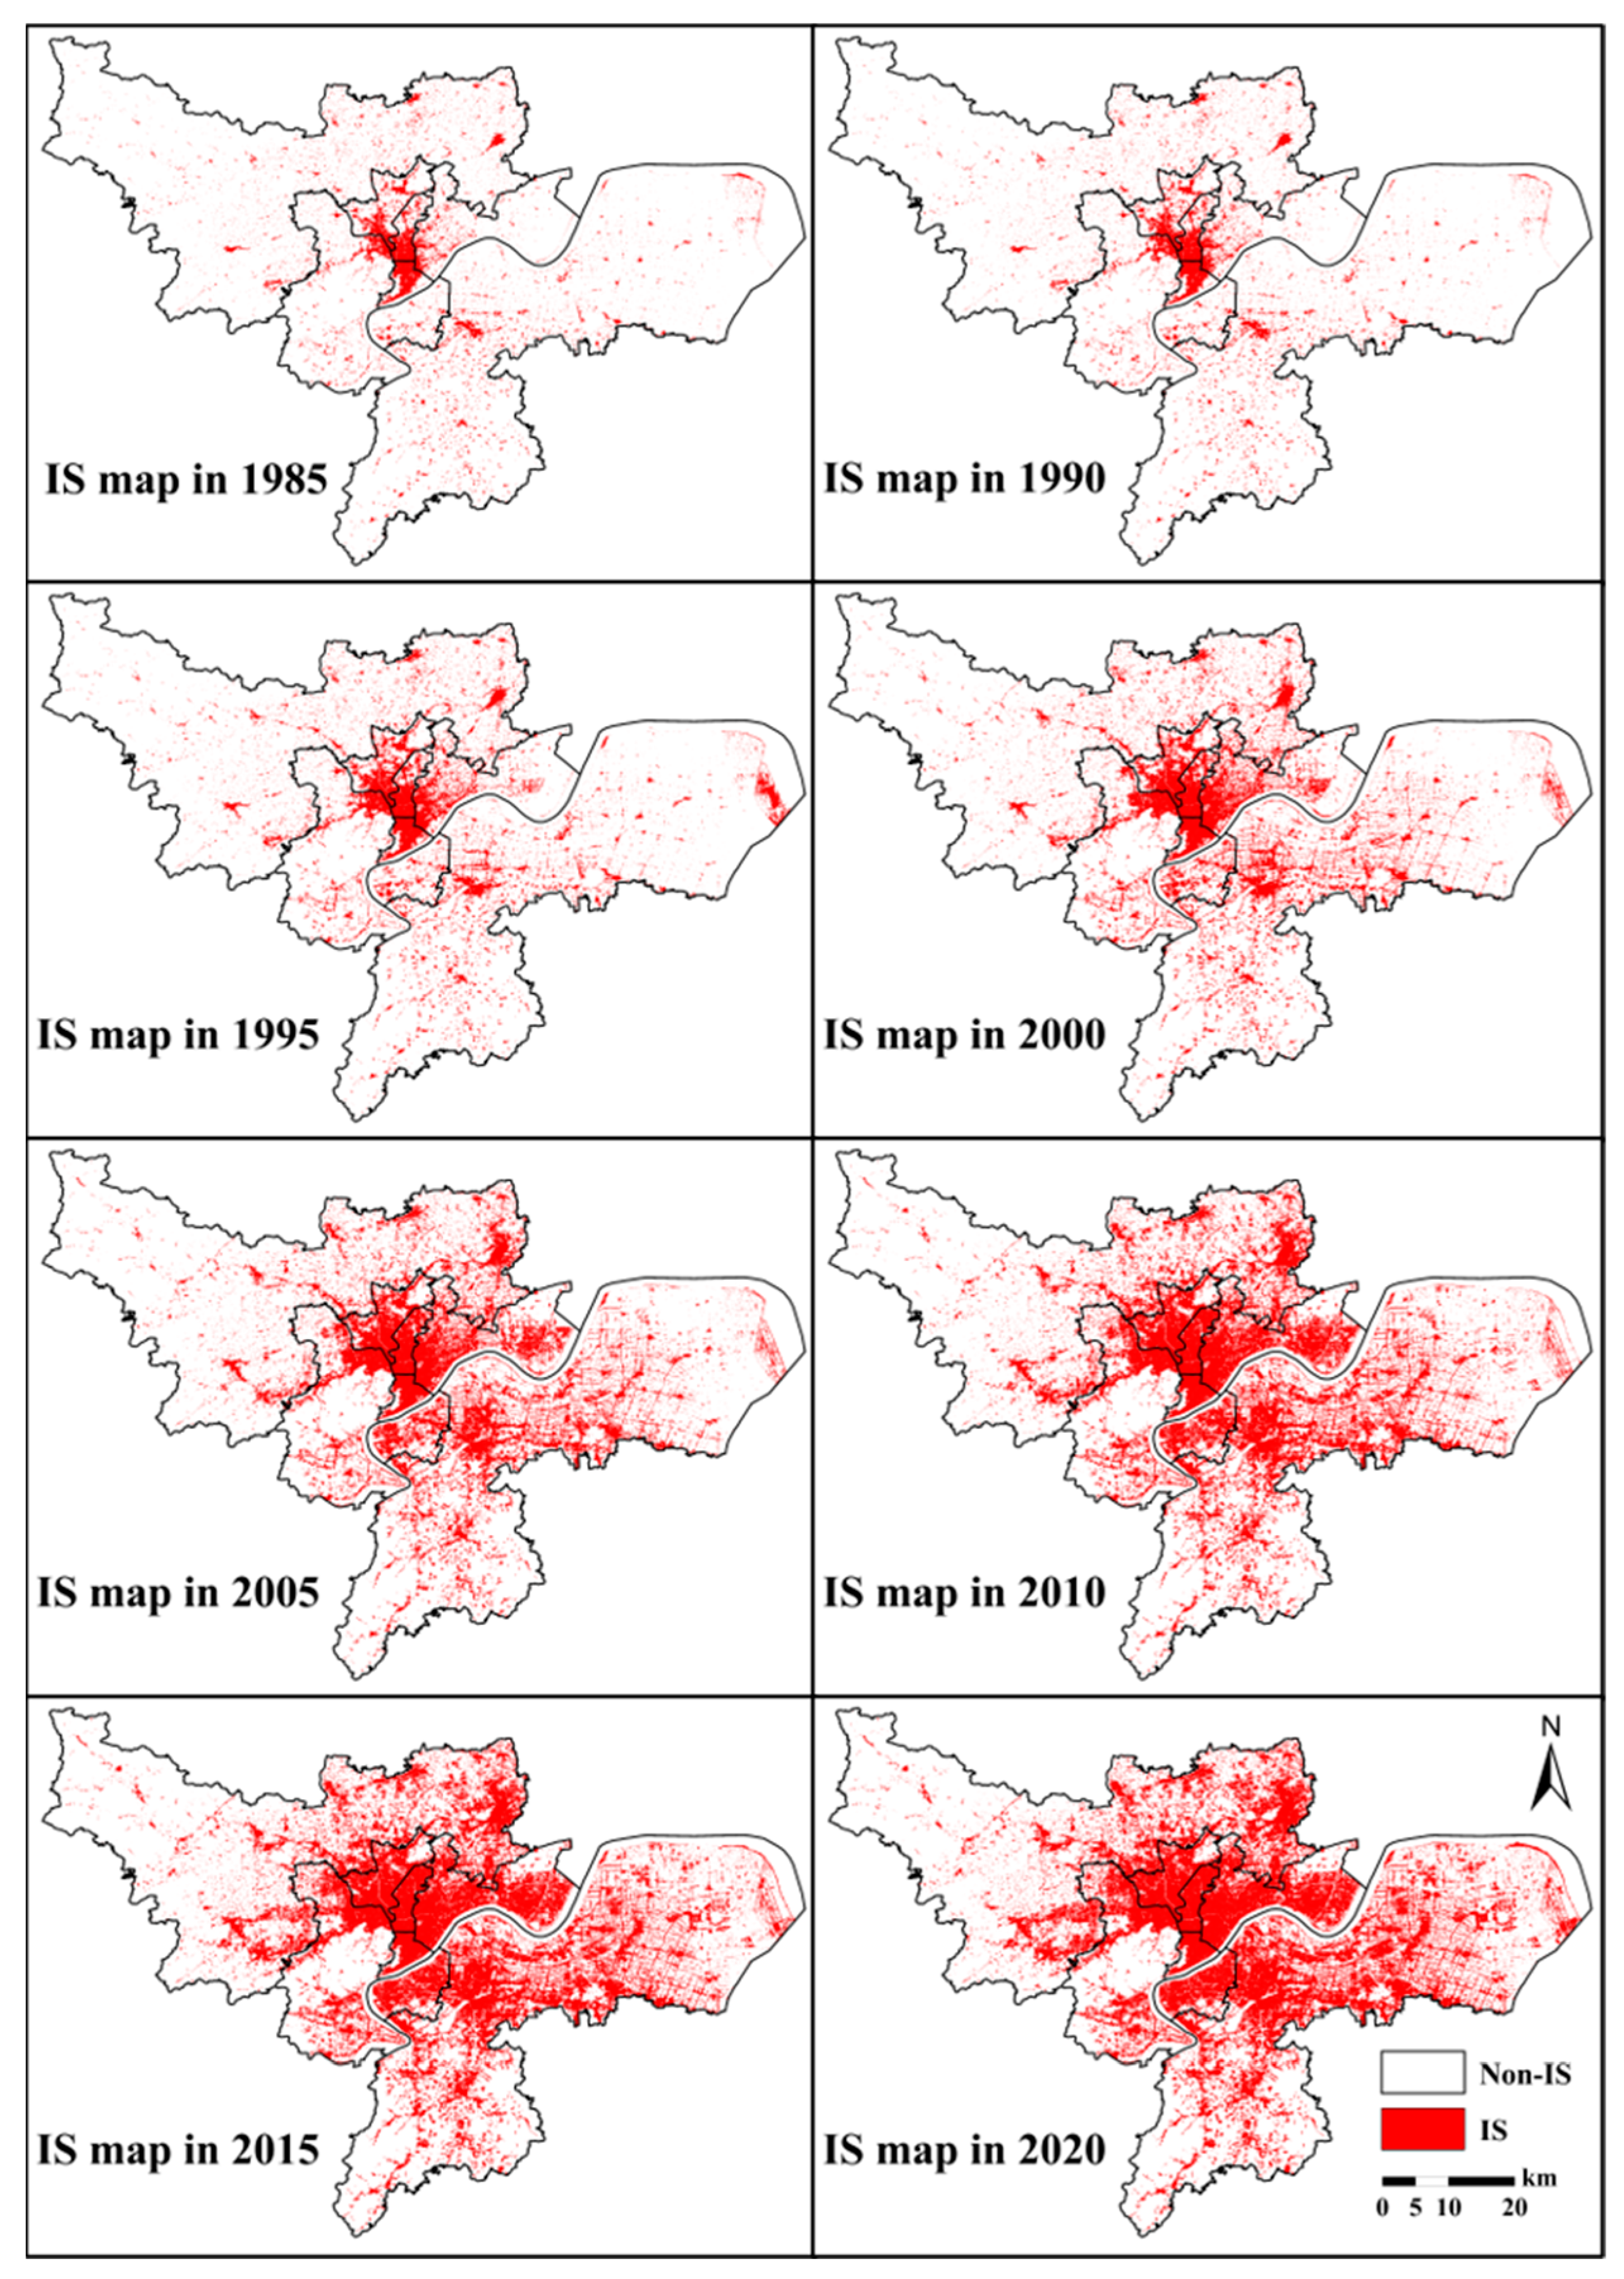
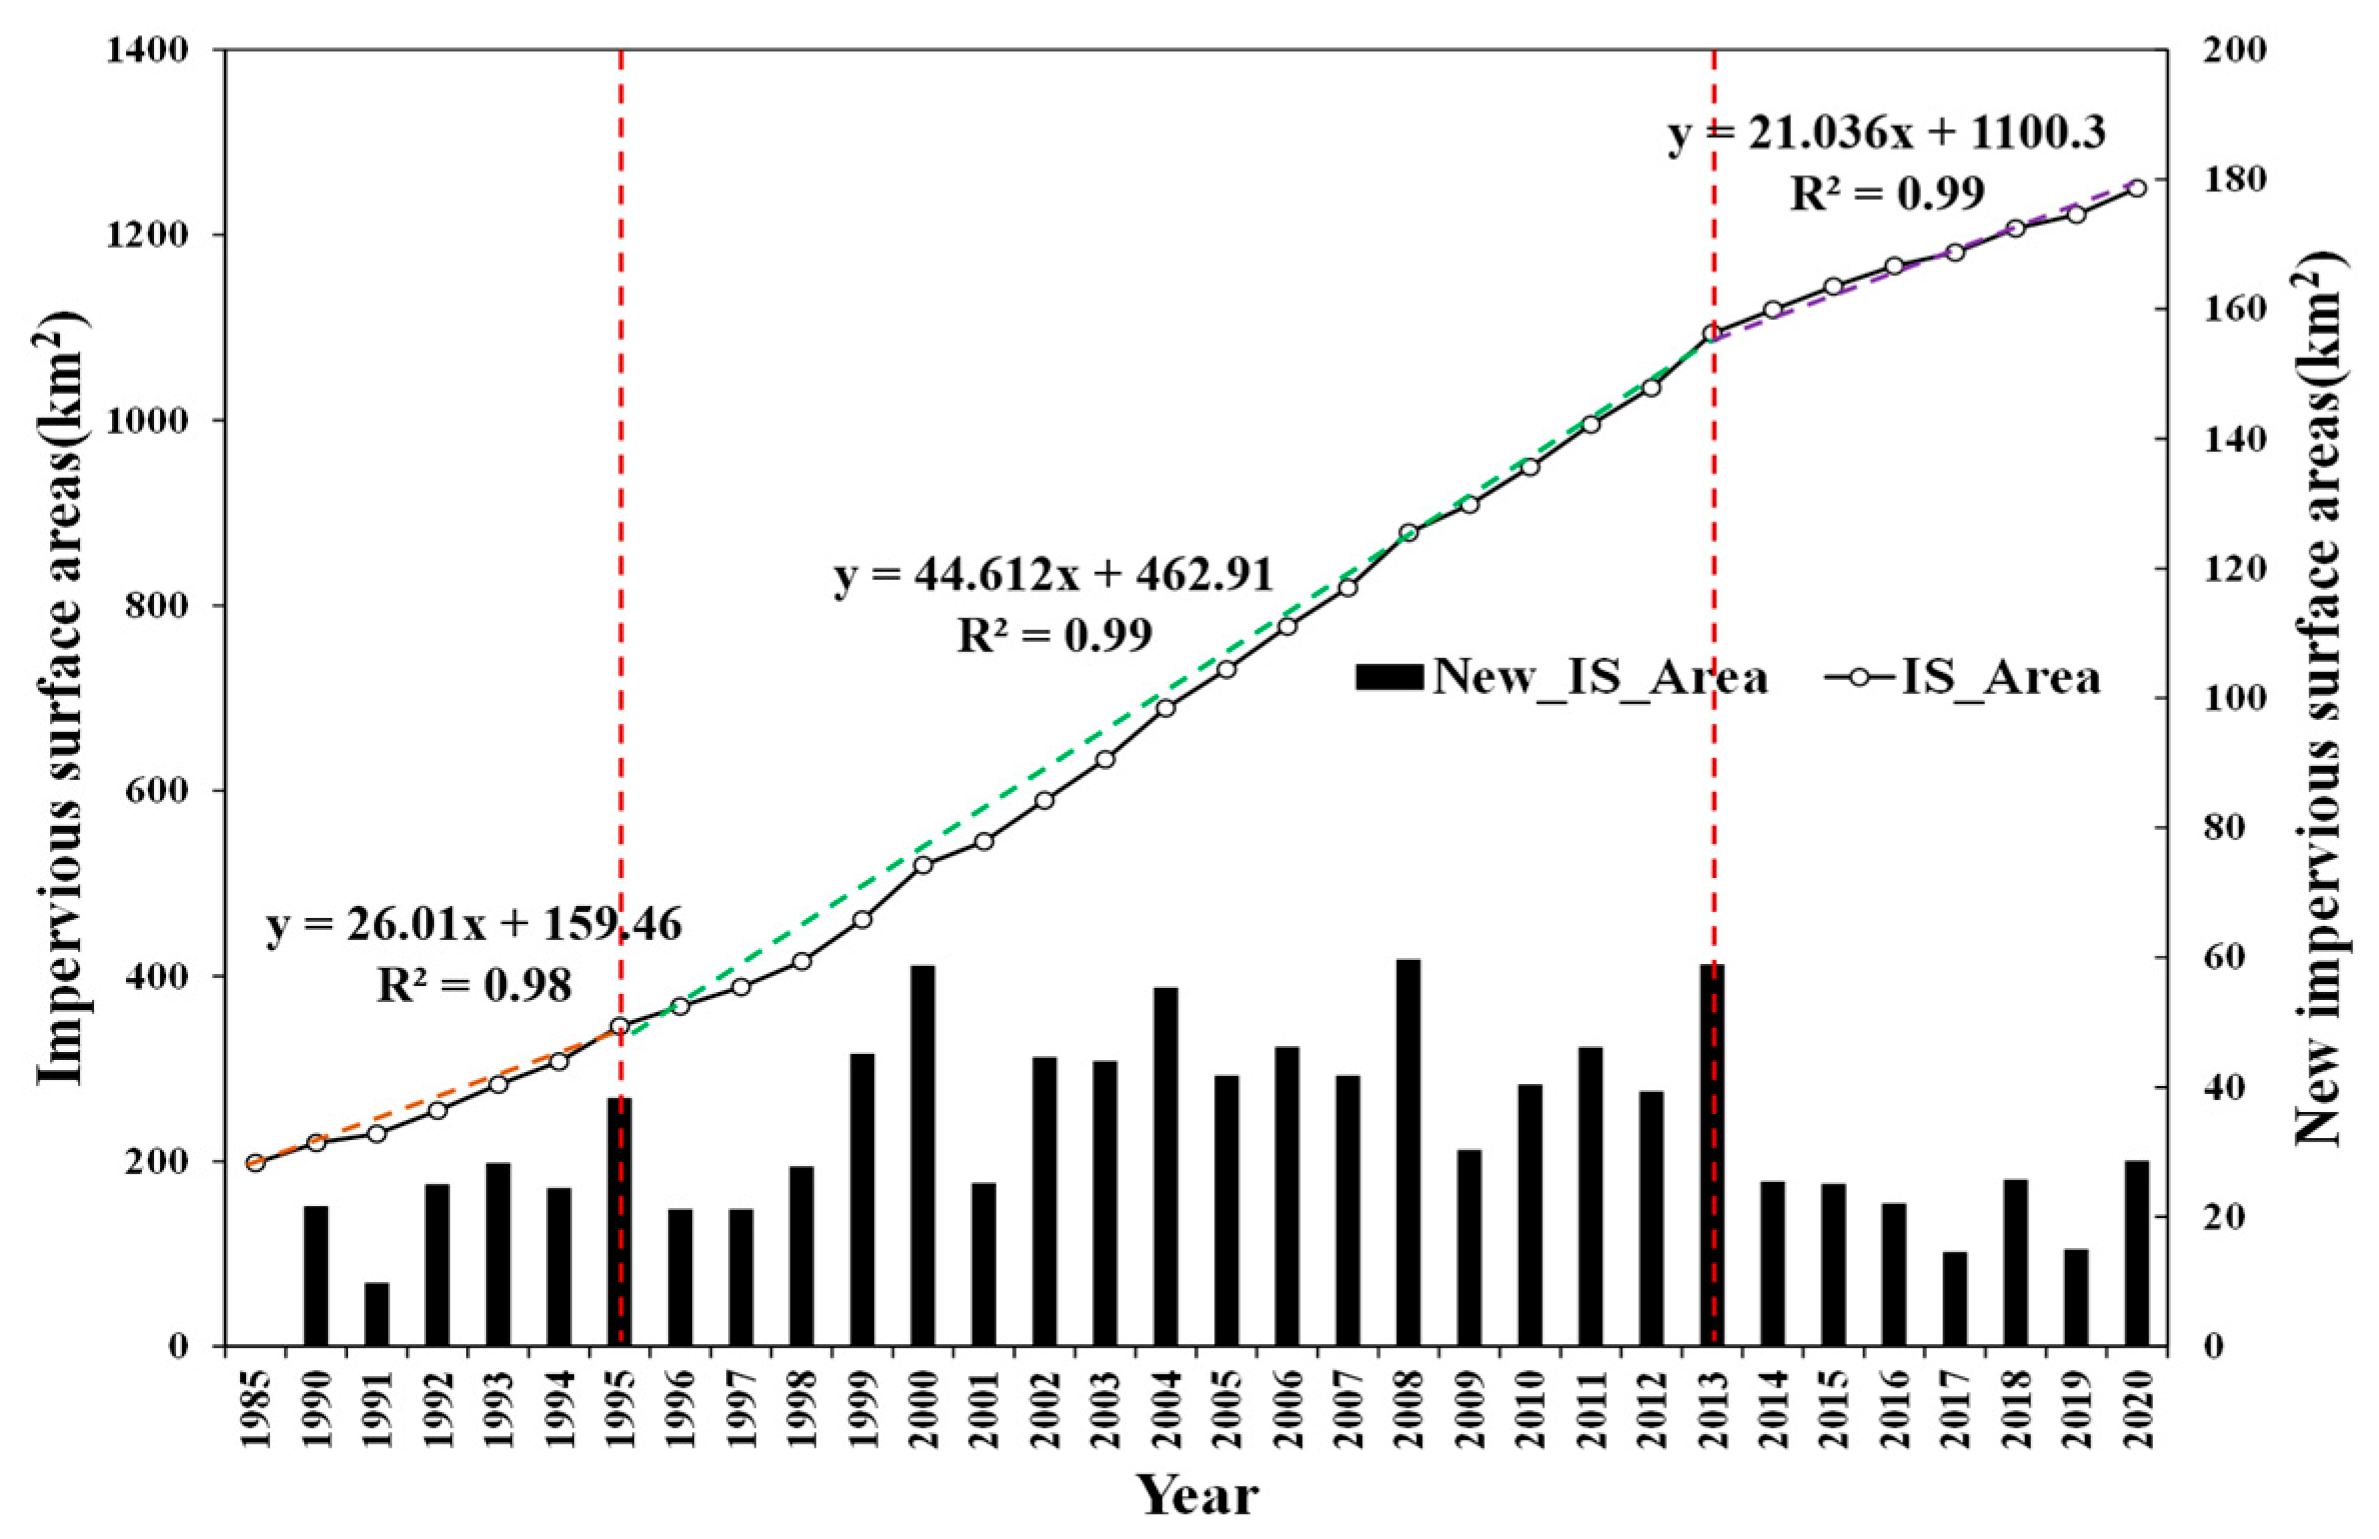
3.1. Spatiotemporal Distribution Characteristics of Impervious Surfaces
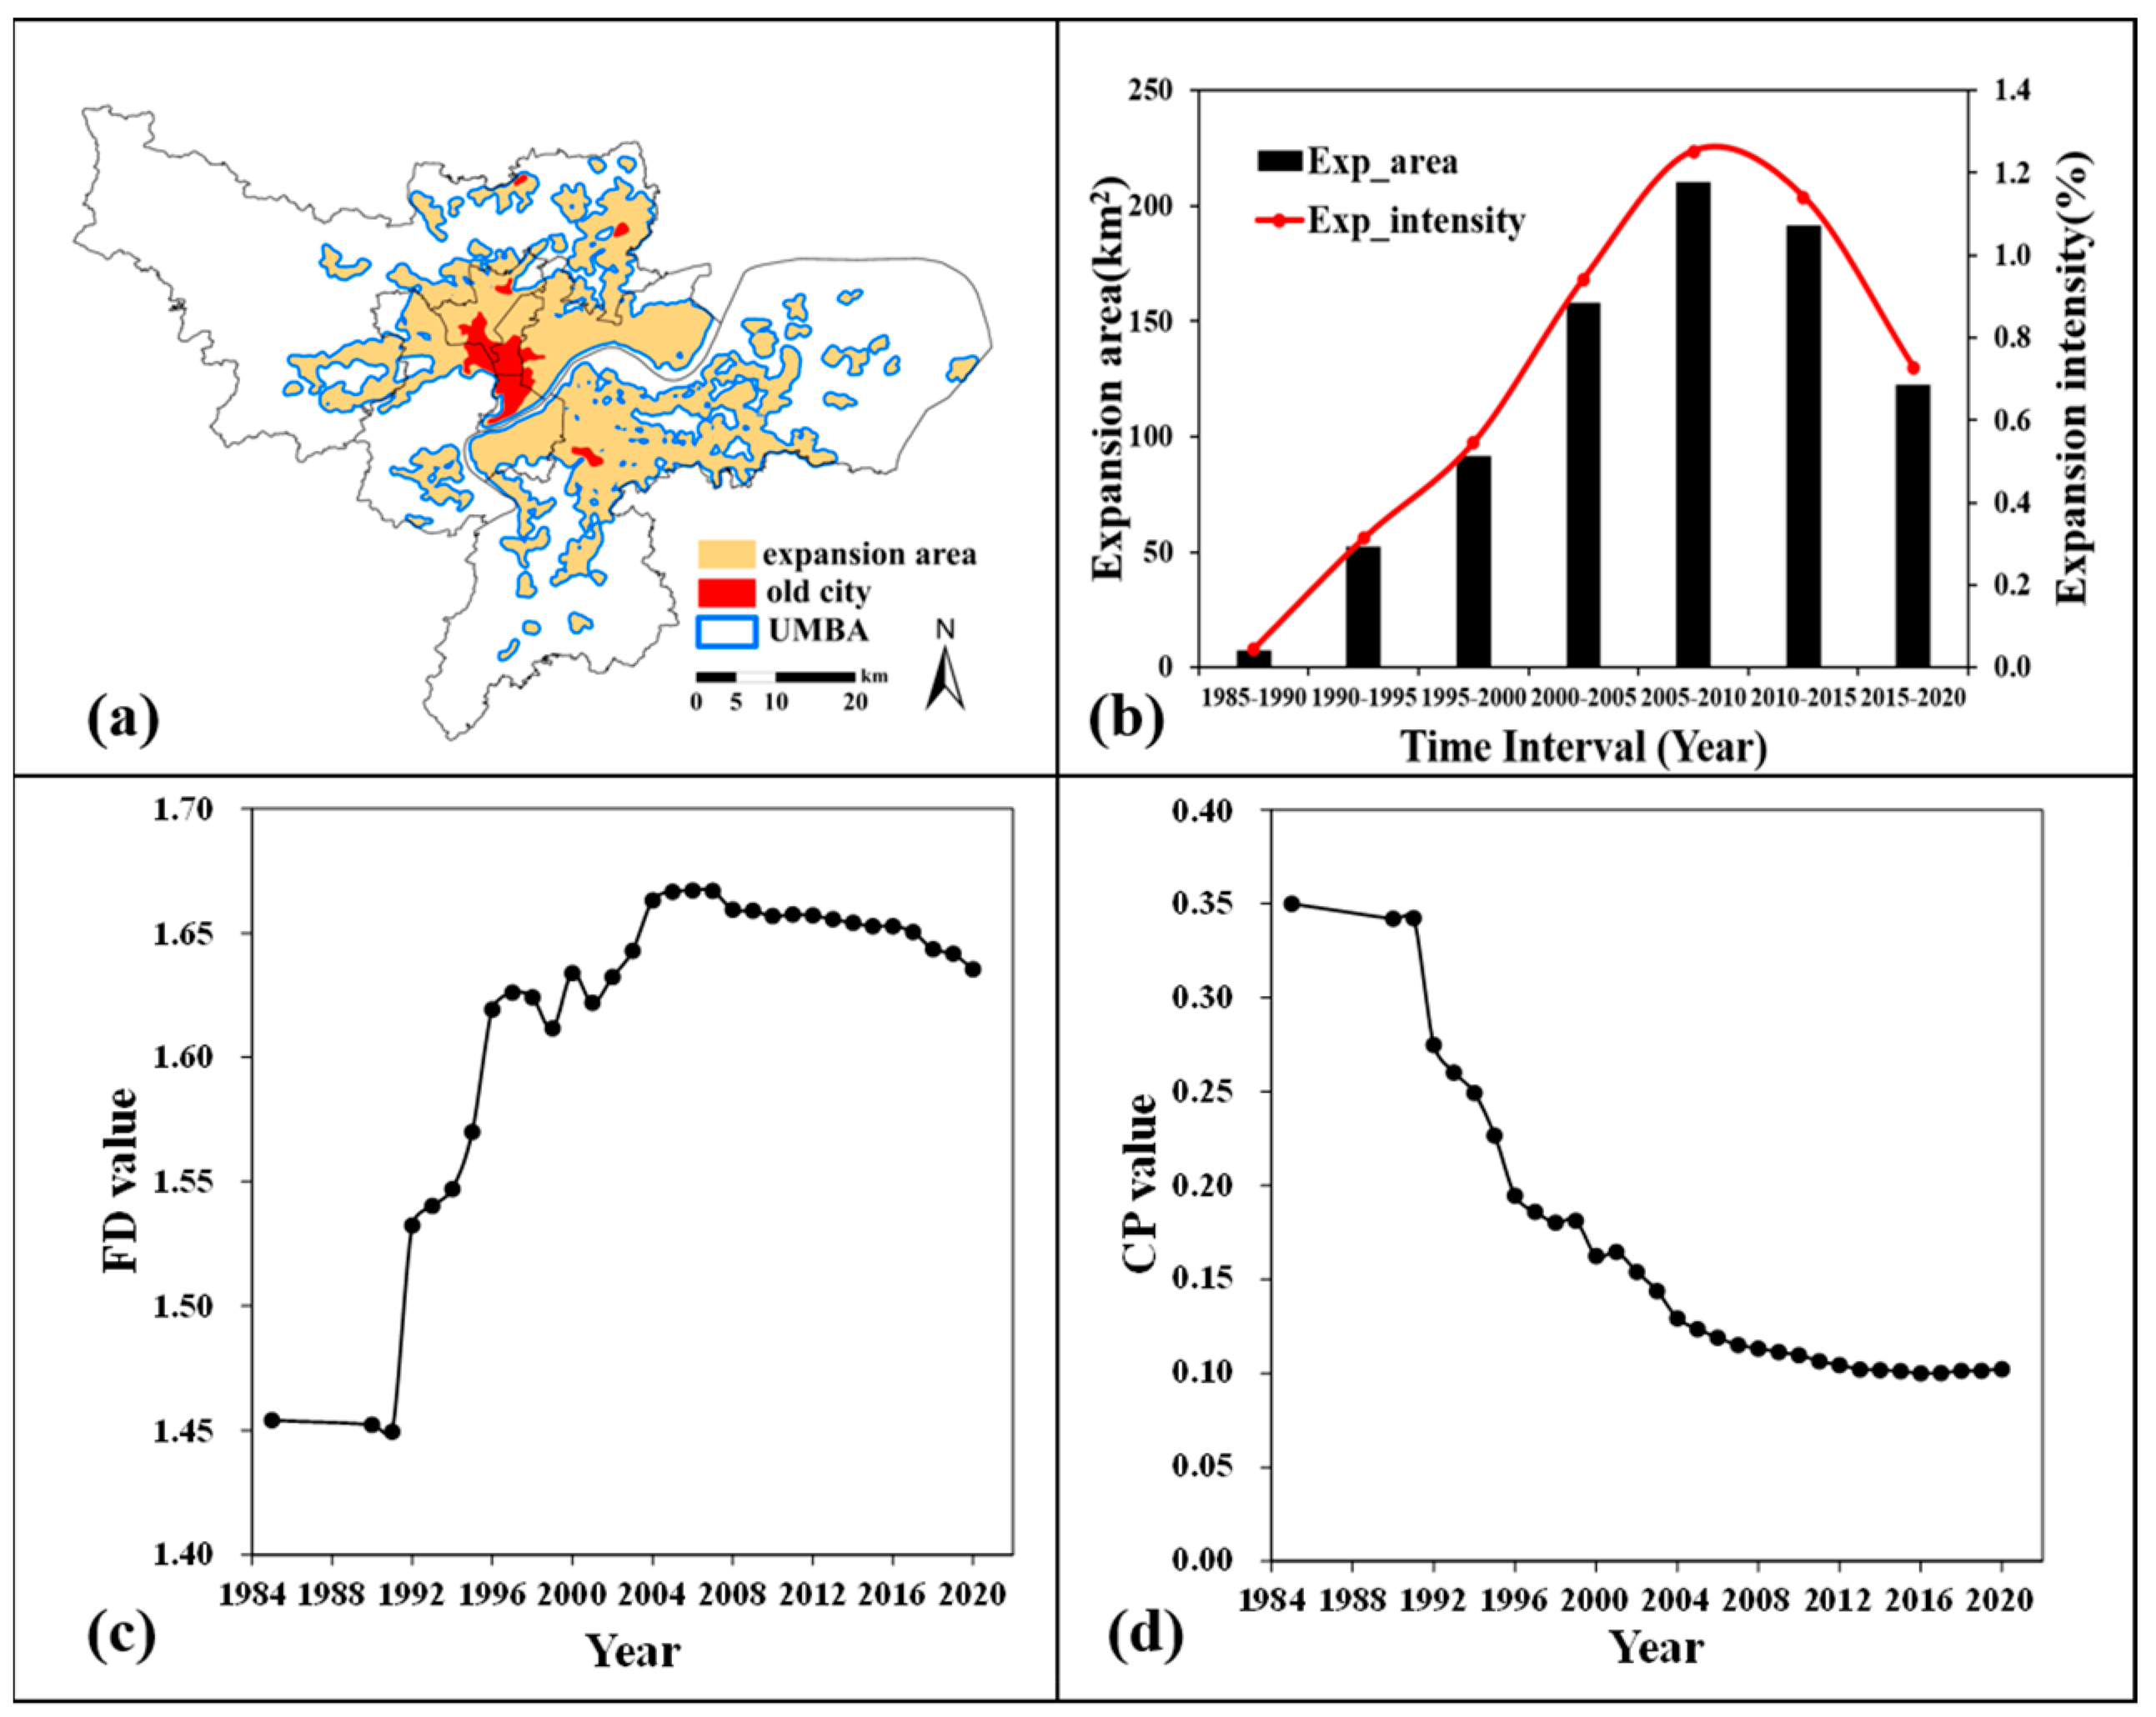
3.2. Impervious Surface Distribution Density and Urban Spatial Morphology
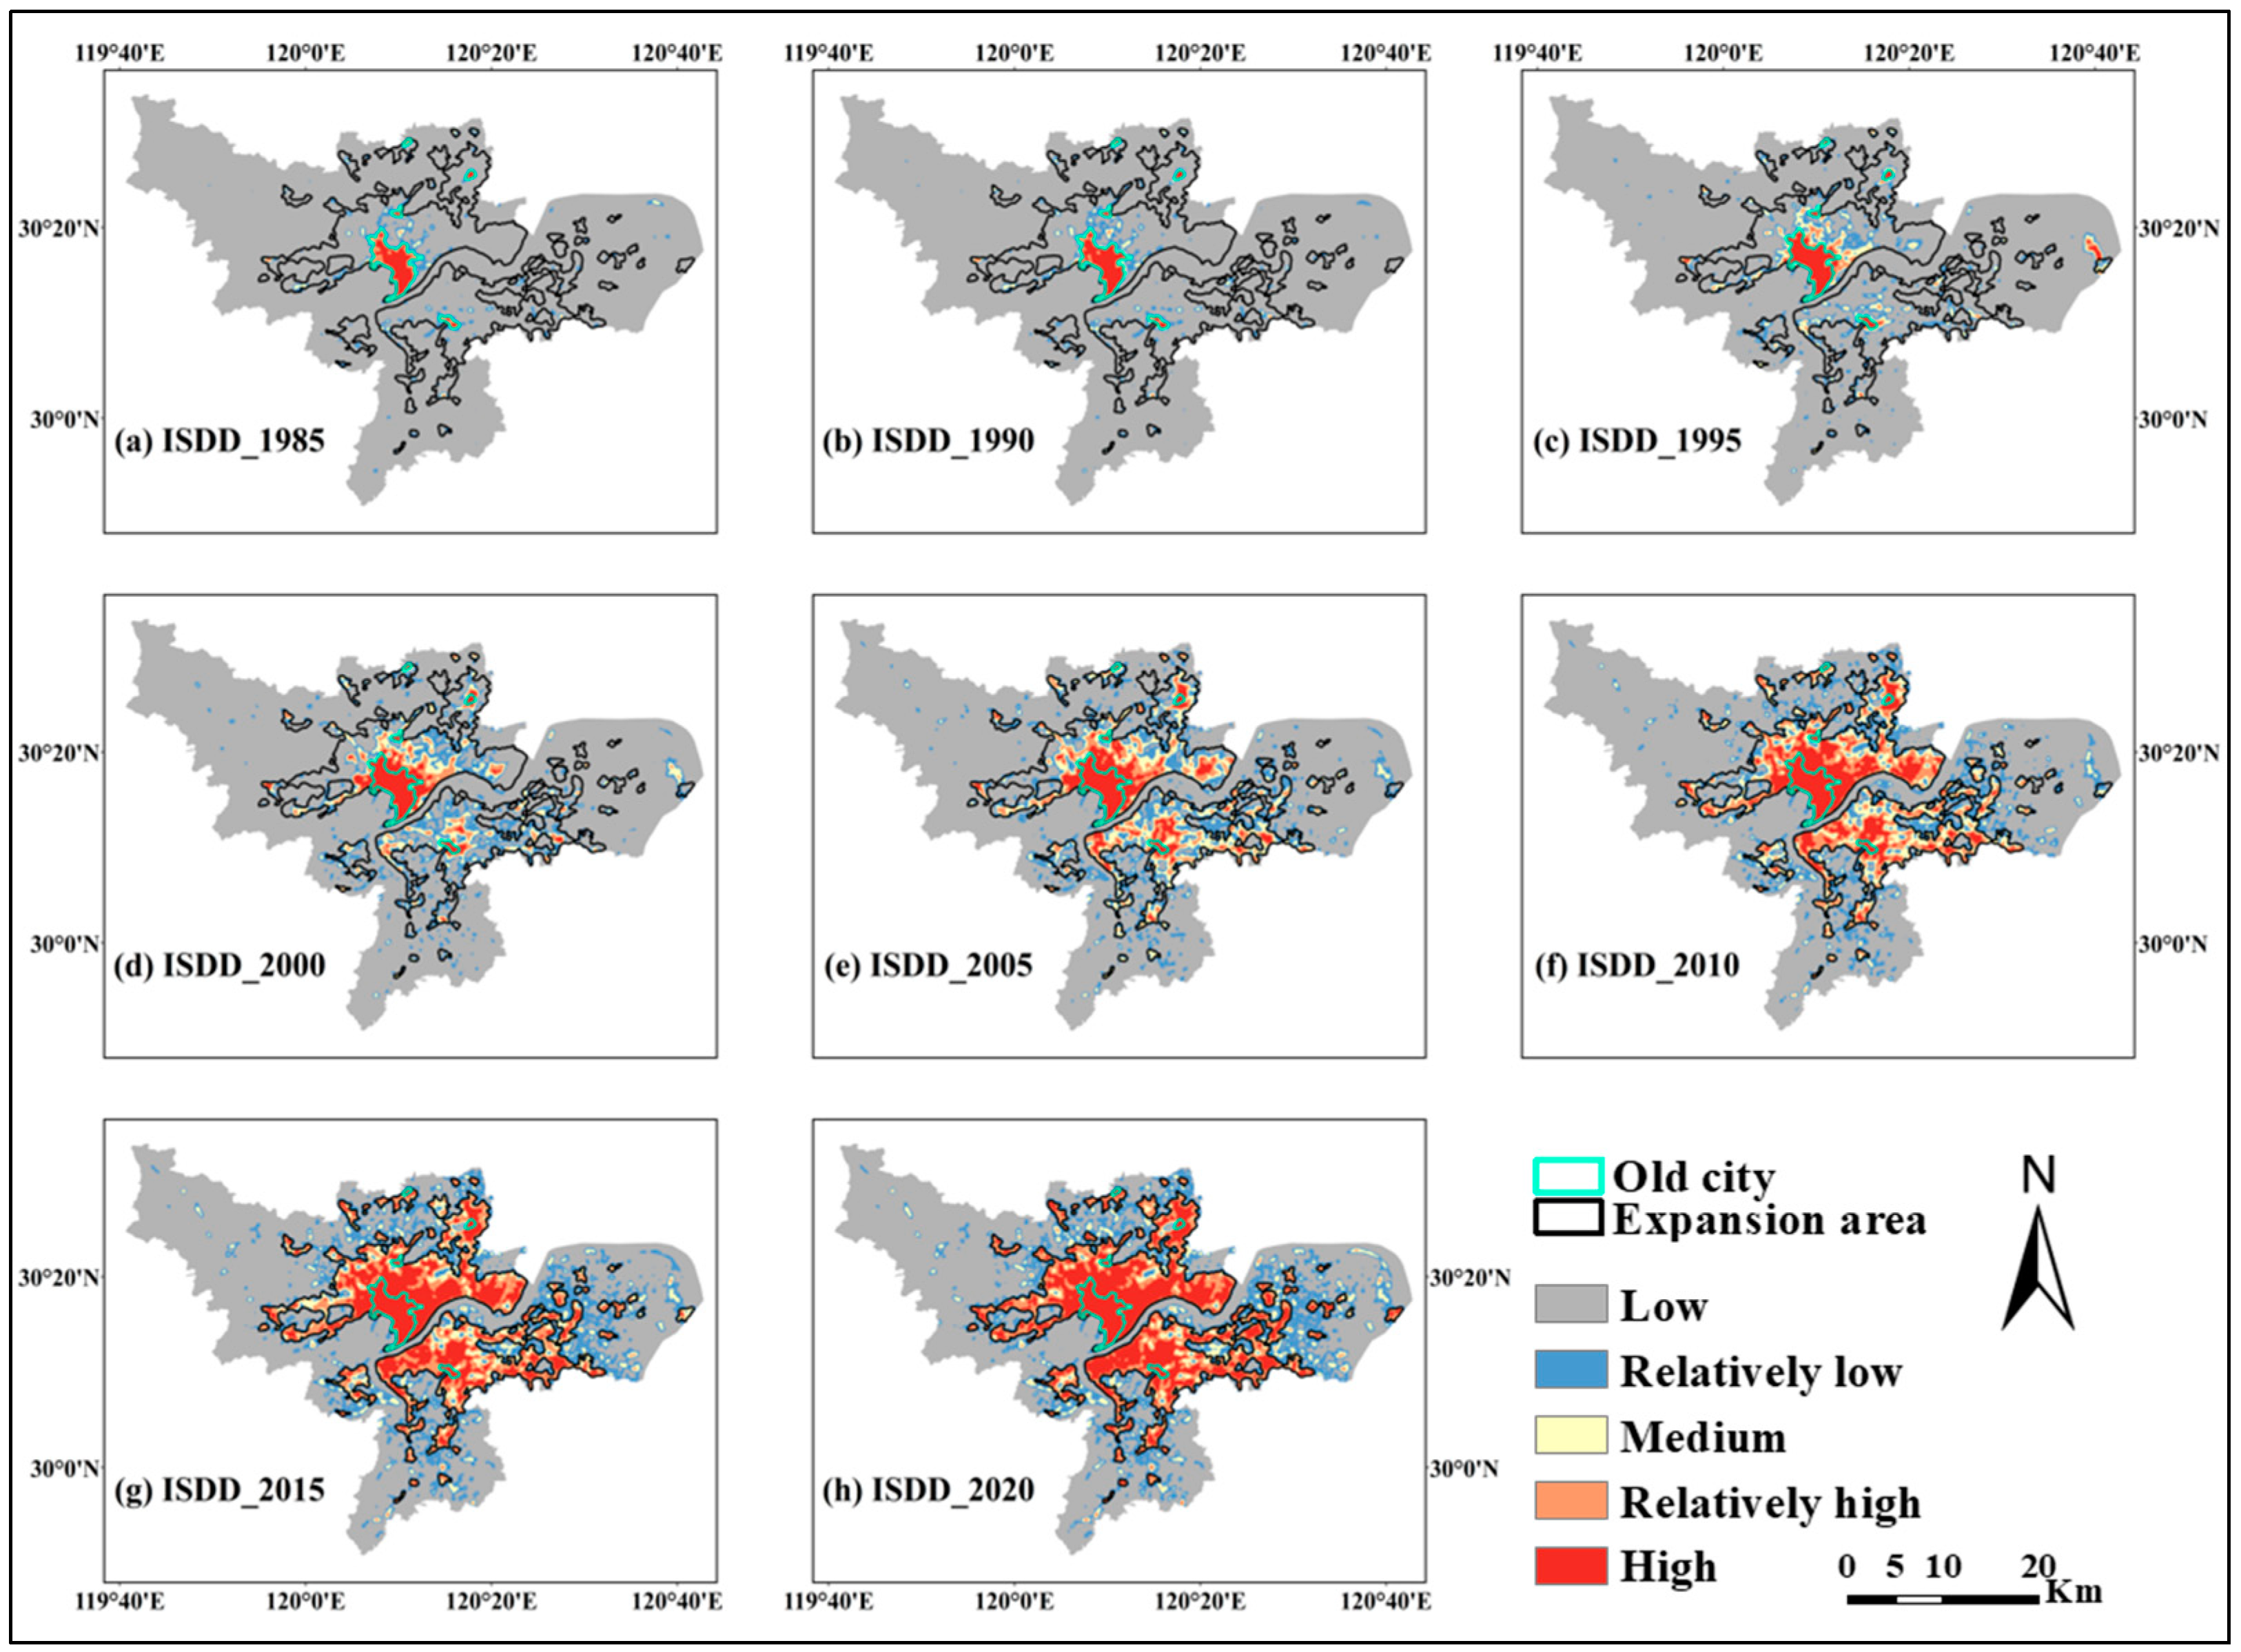
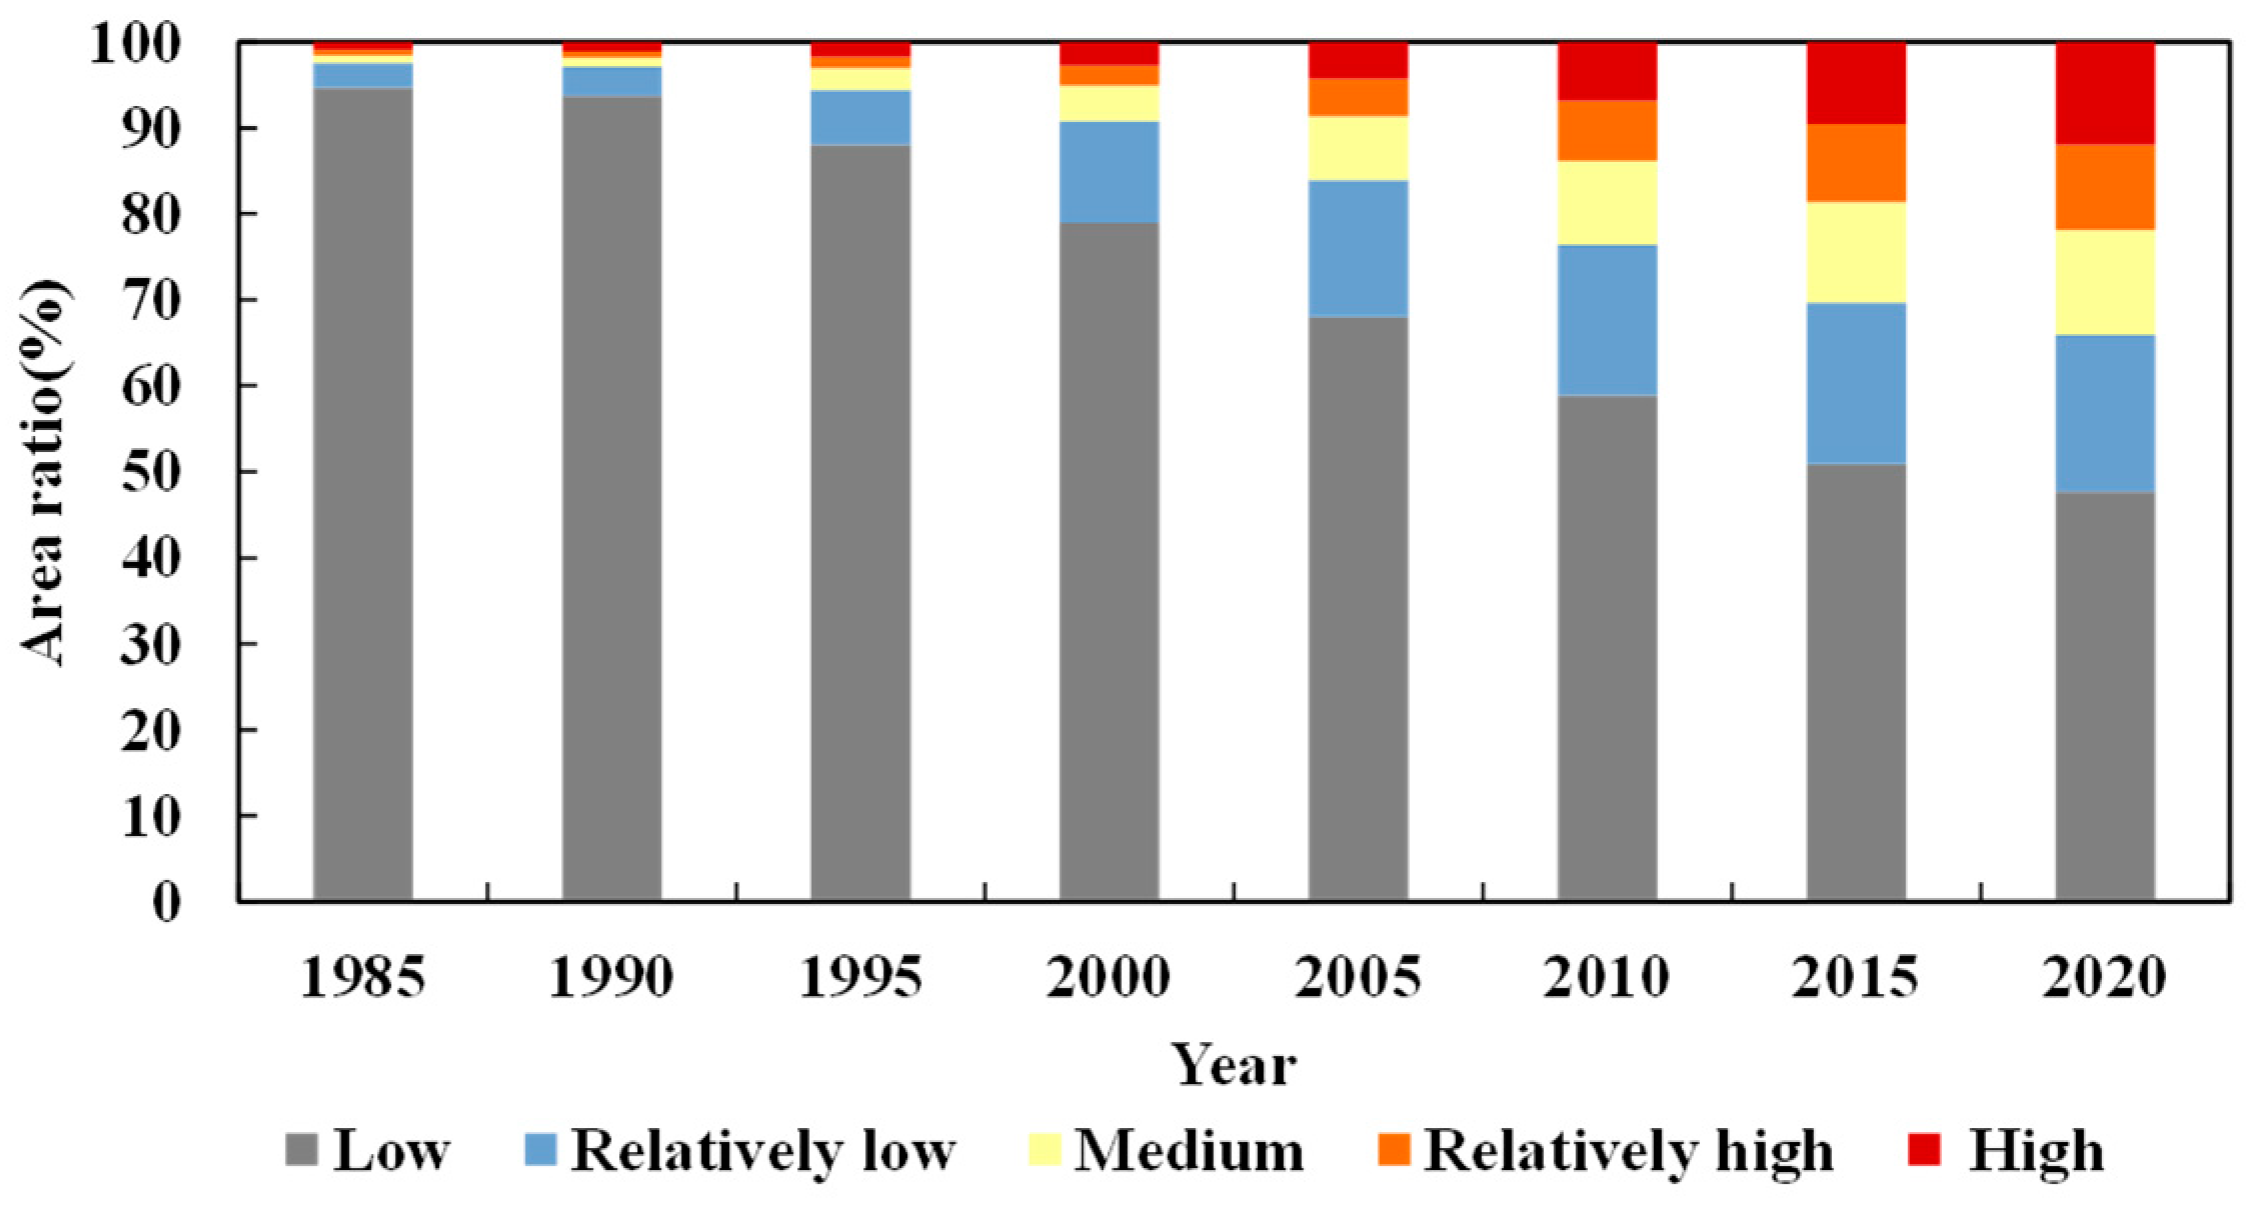
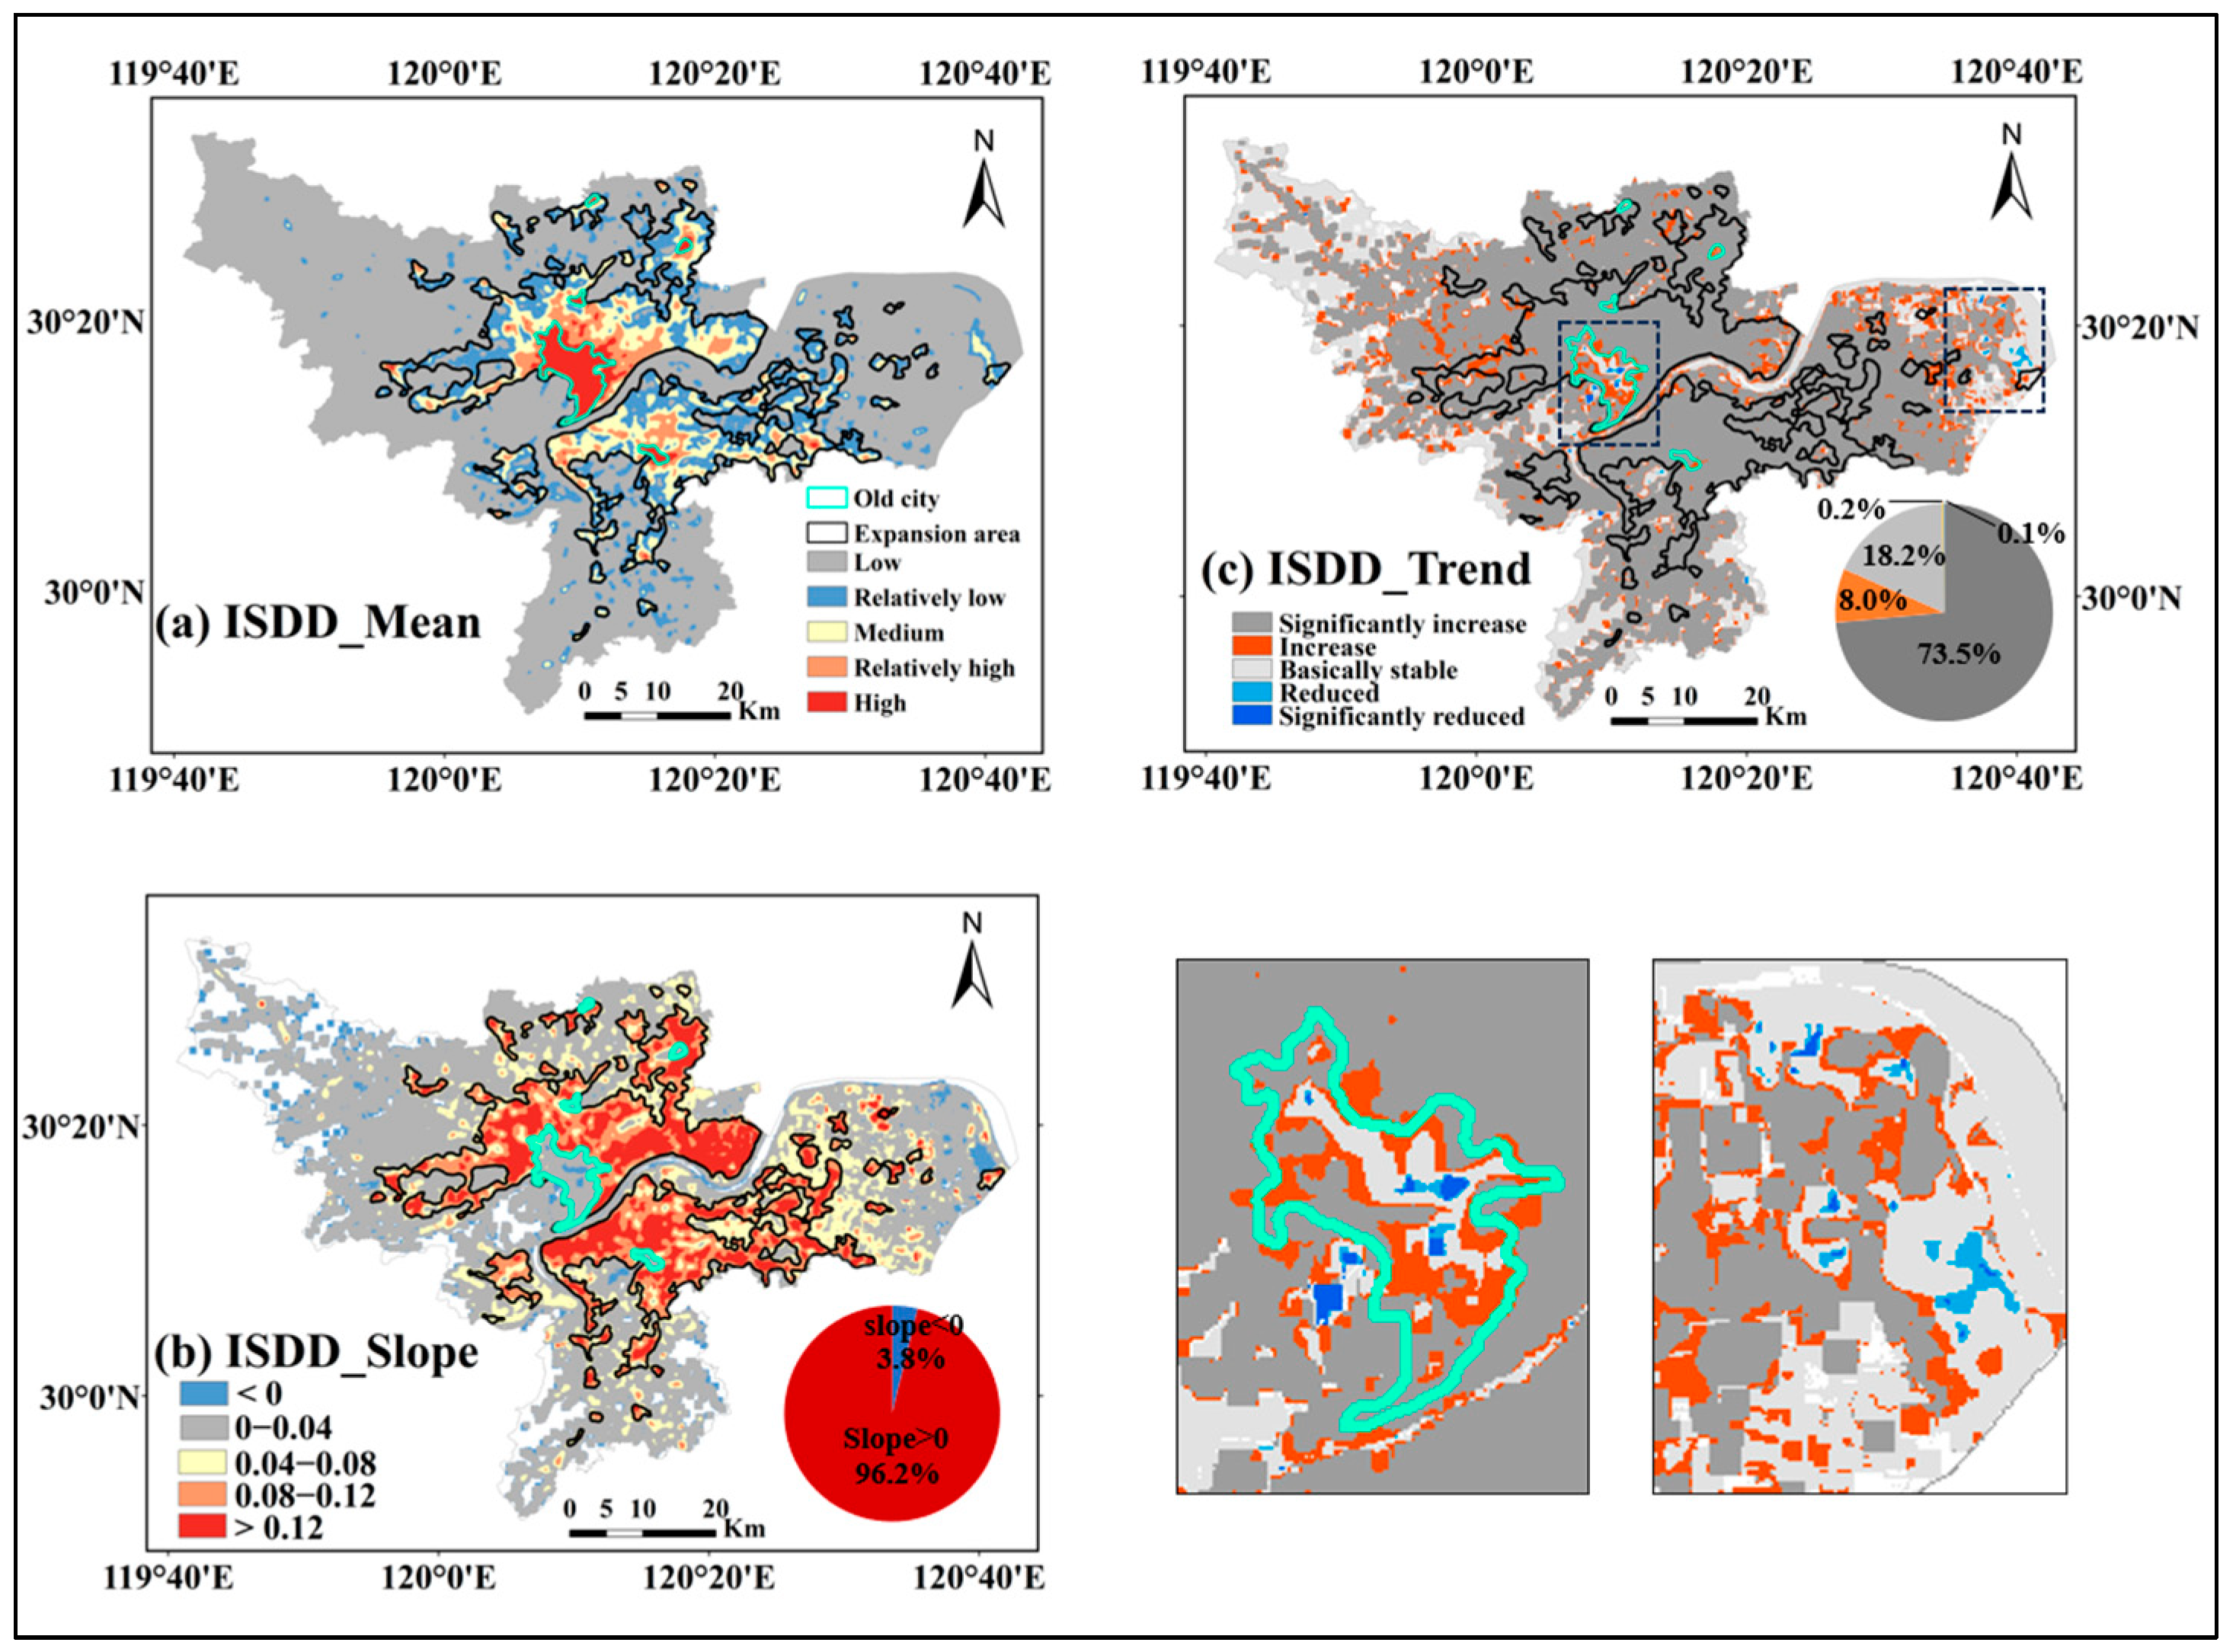
3.3. Spatiotemporal Distribution Characteristics and Evolution Trend of ISDD
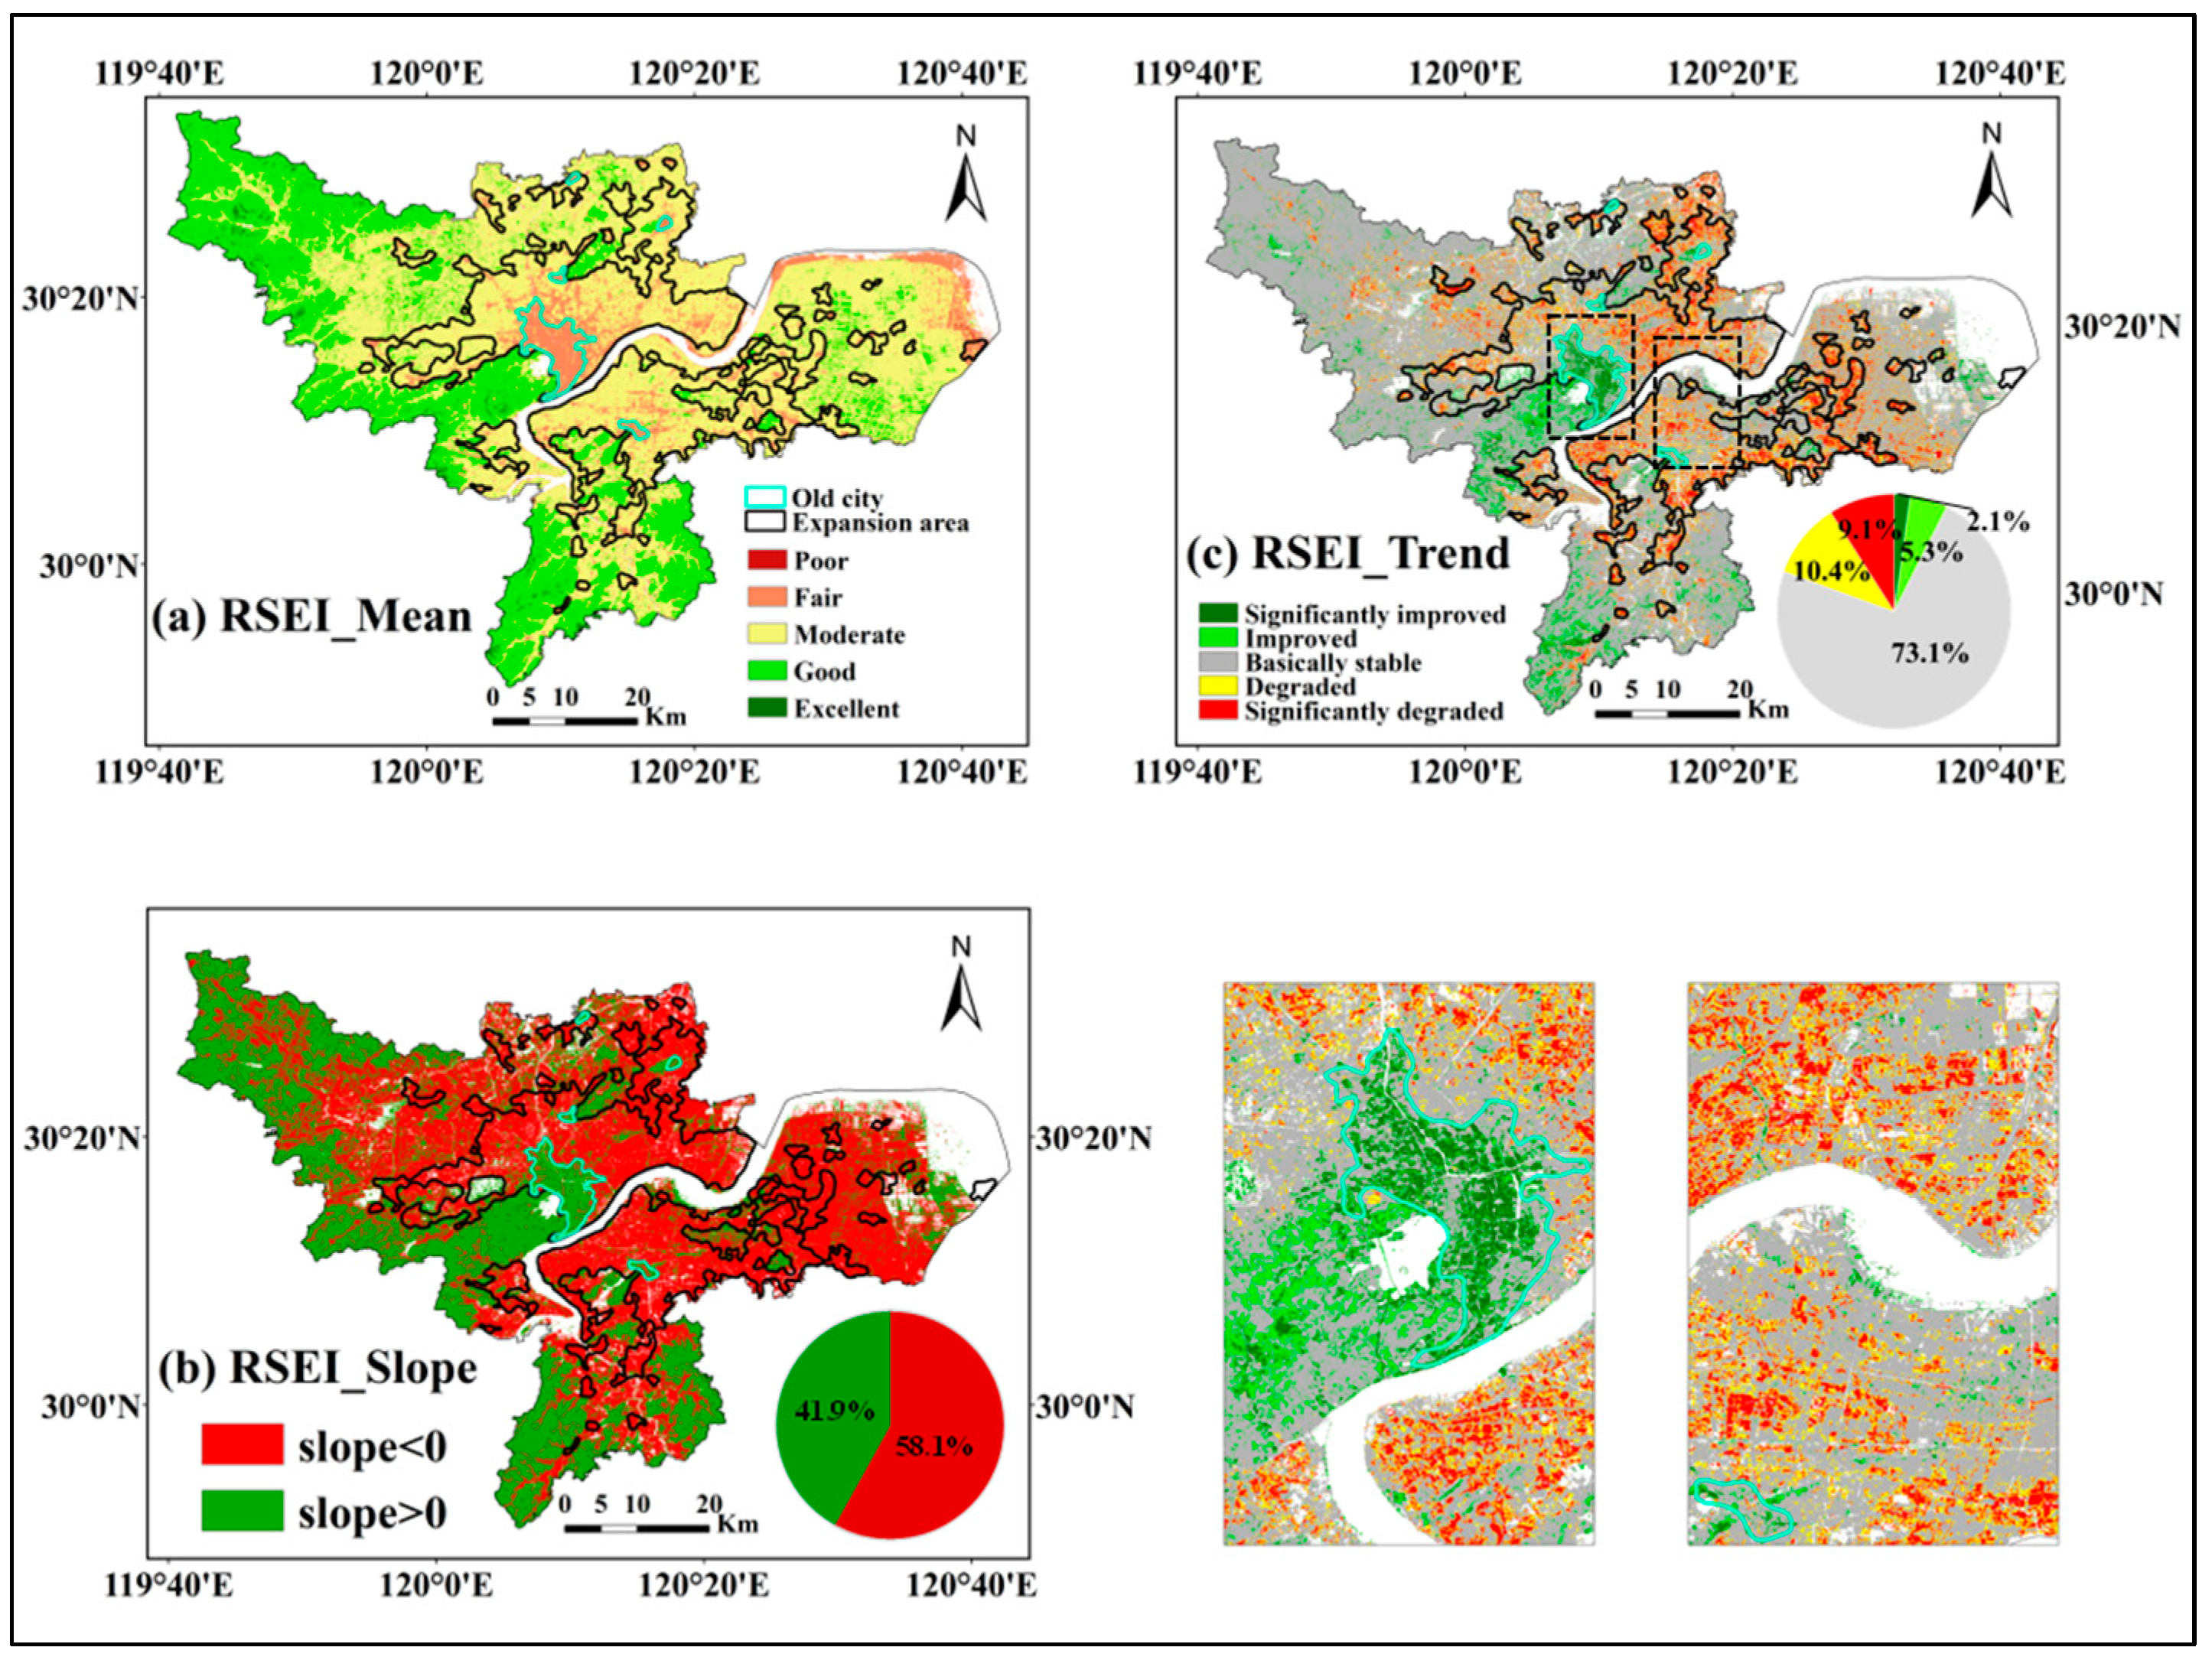
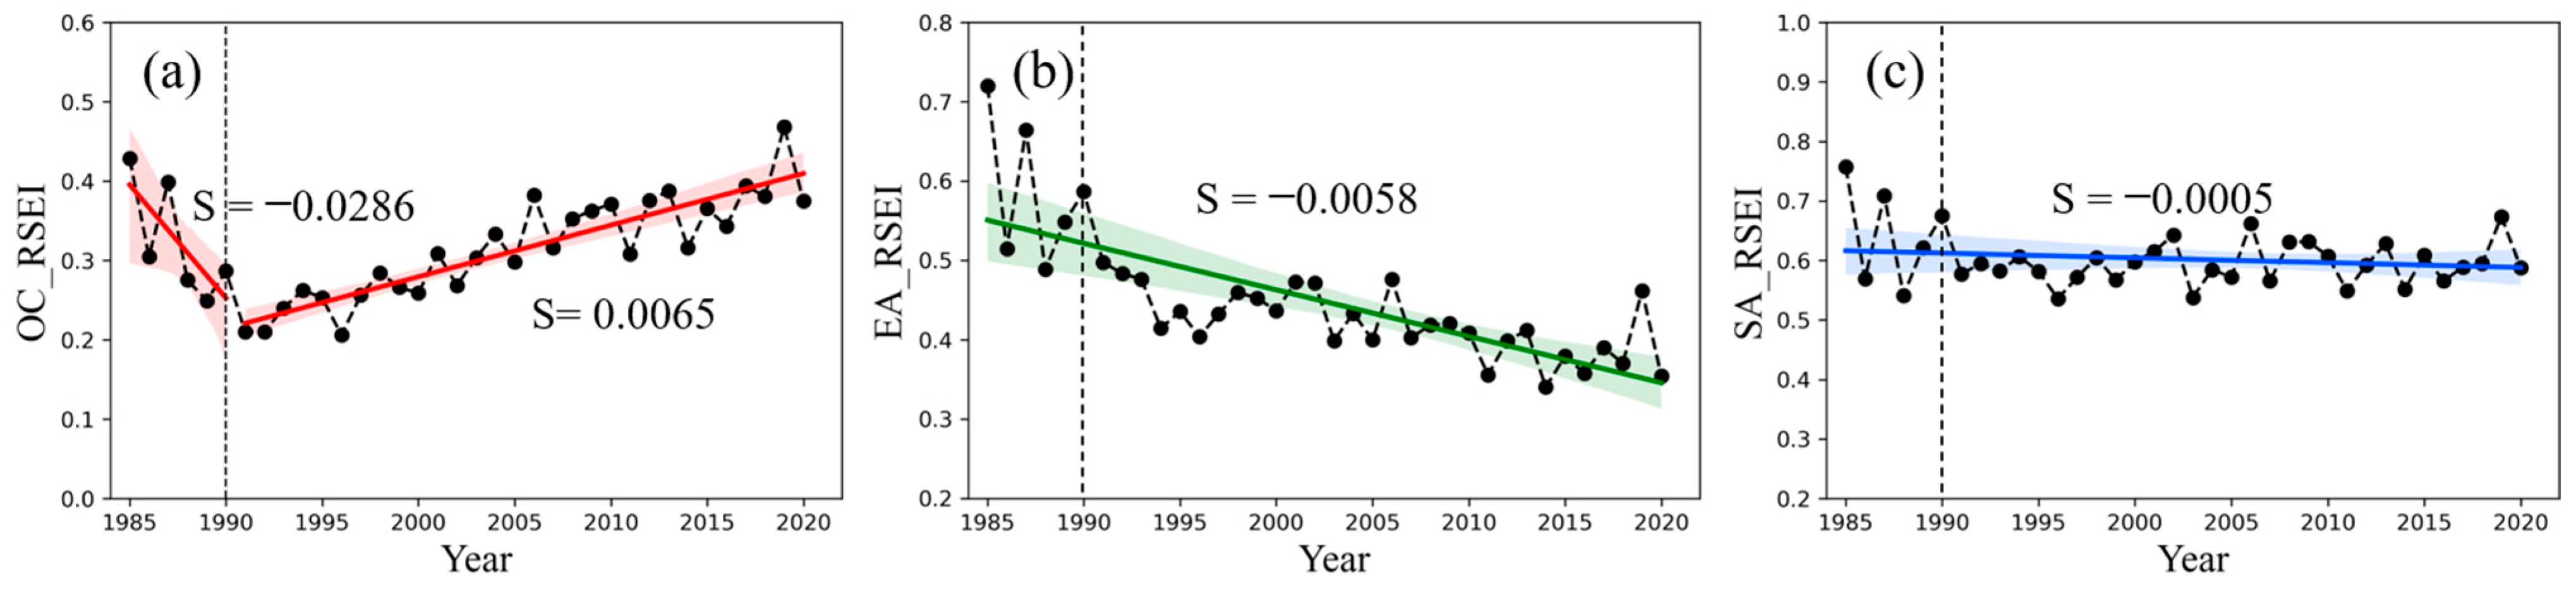
3.4. Spatiotemporal Patterns and Evolutionary Trends of Urban Ecological Quality
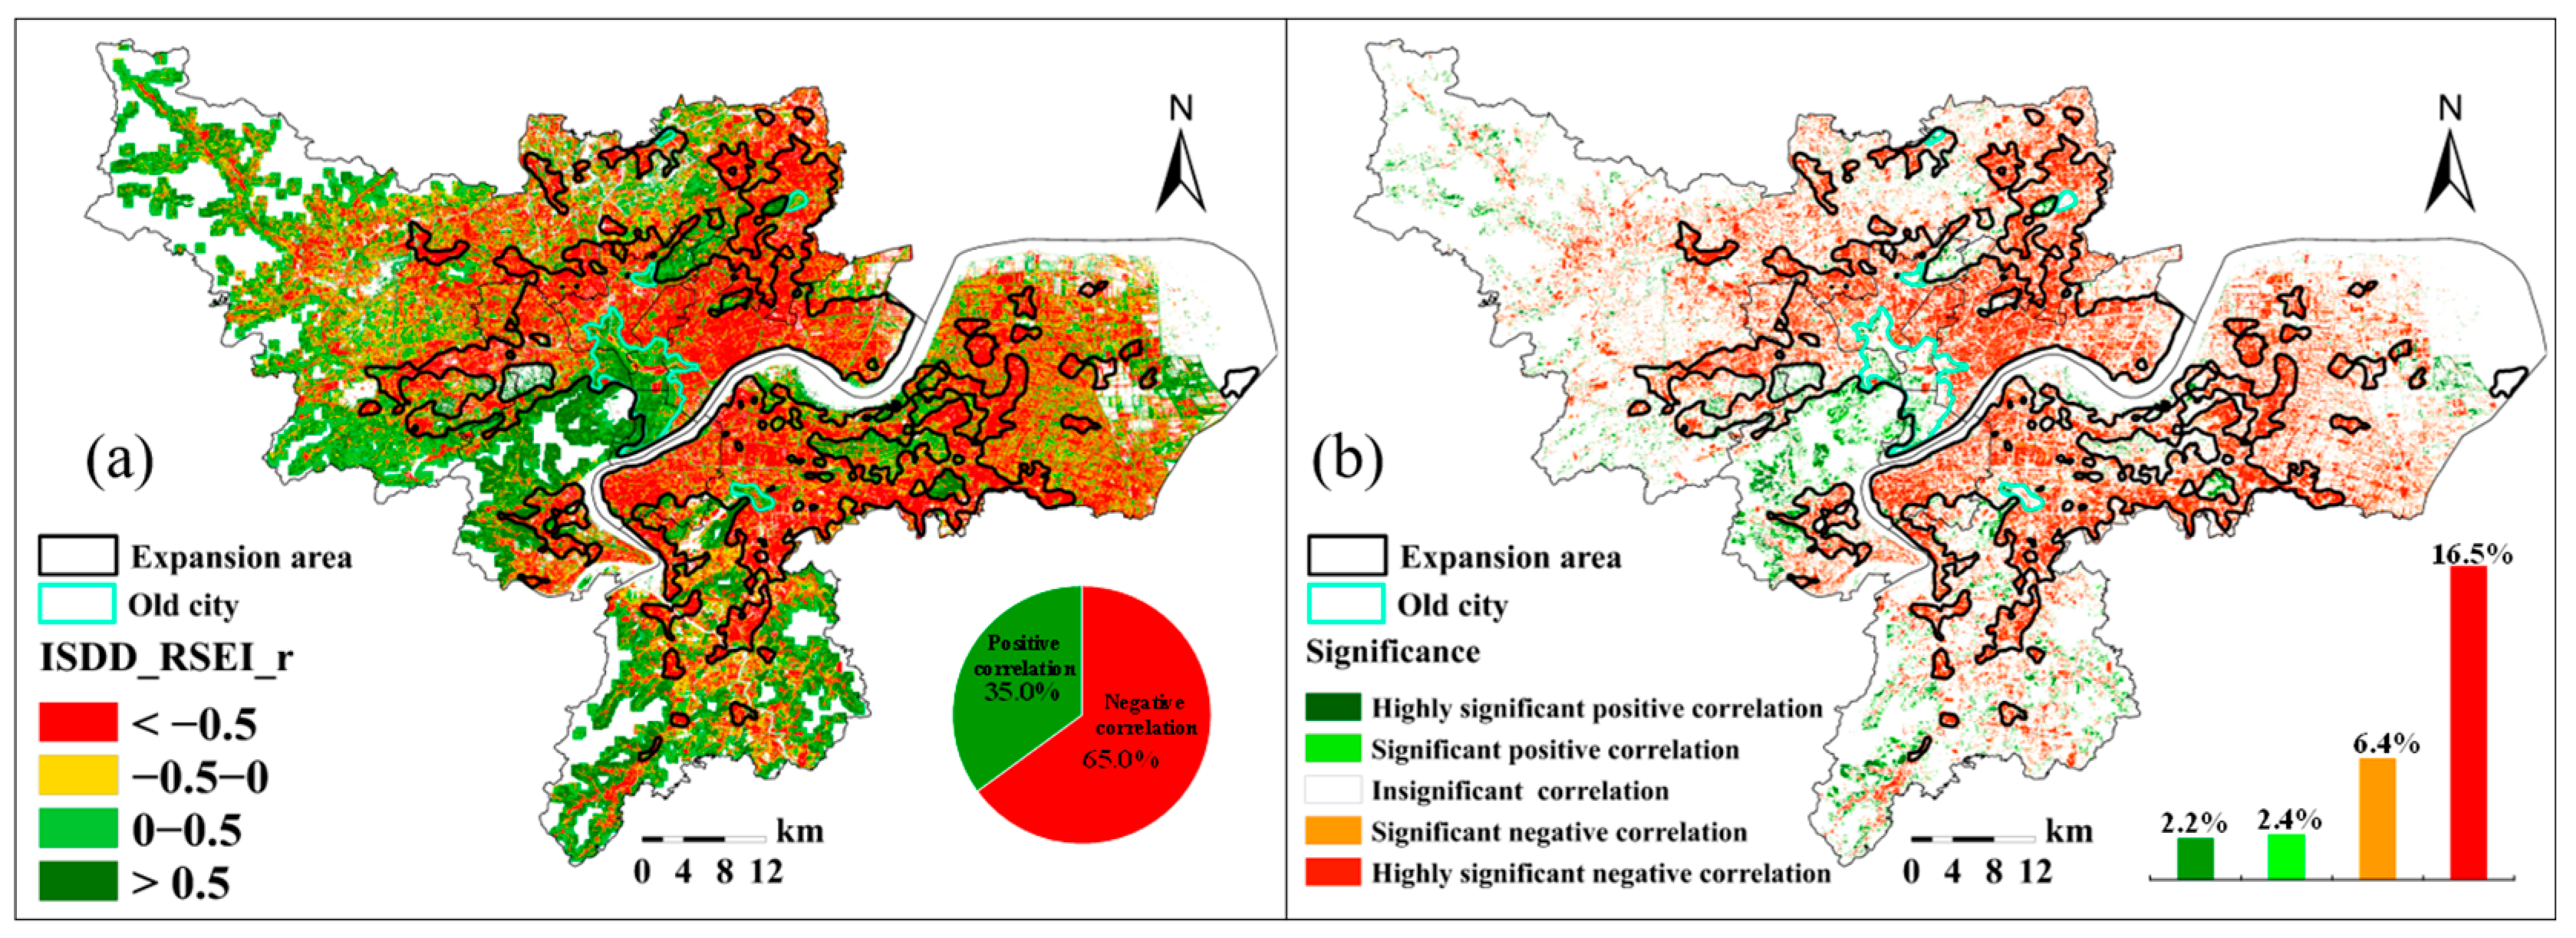
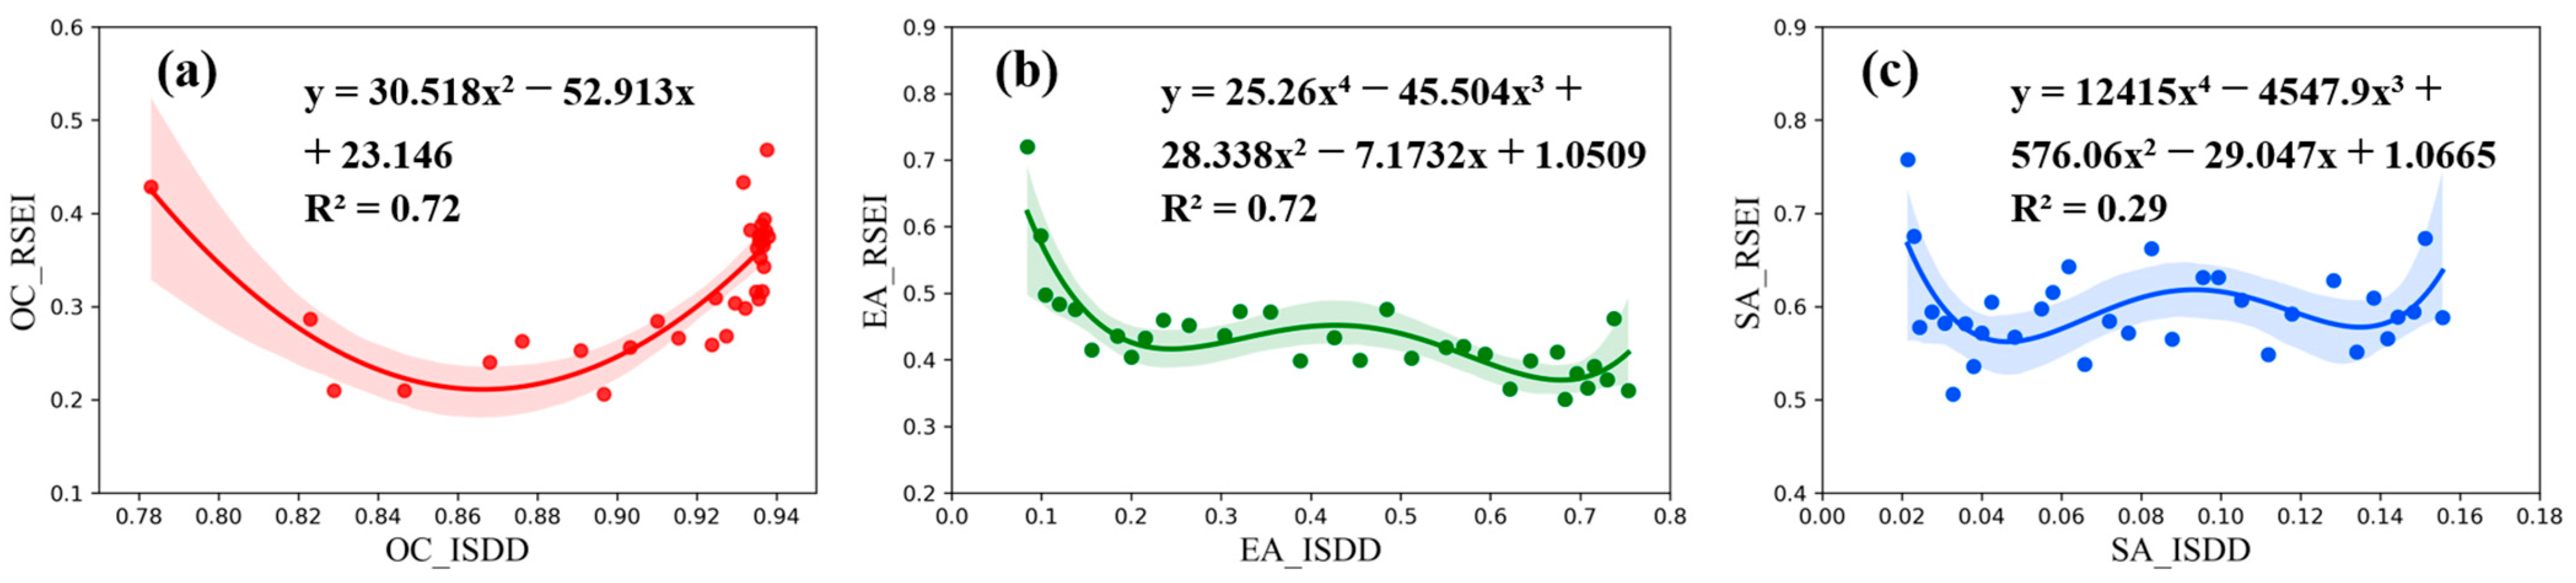
3.5. Spatiotemporal Response of Urban Ecological Environment to Urbanization Intensity
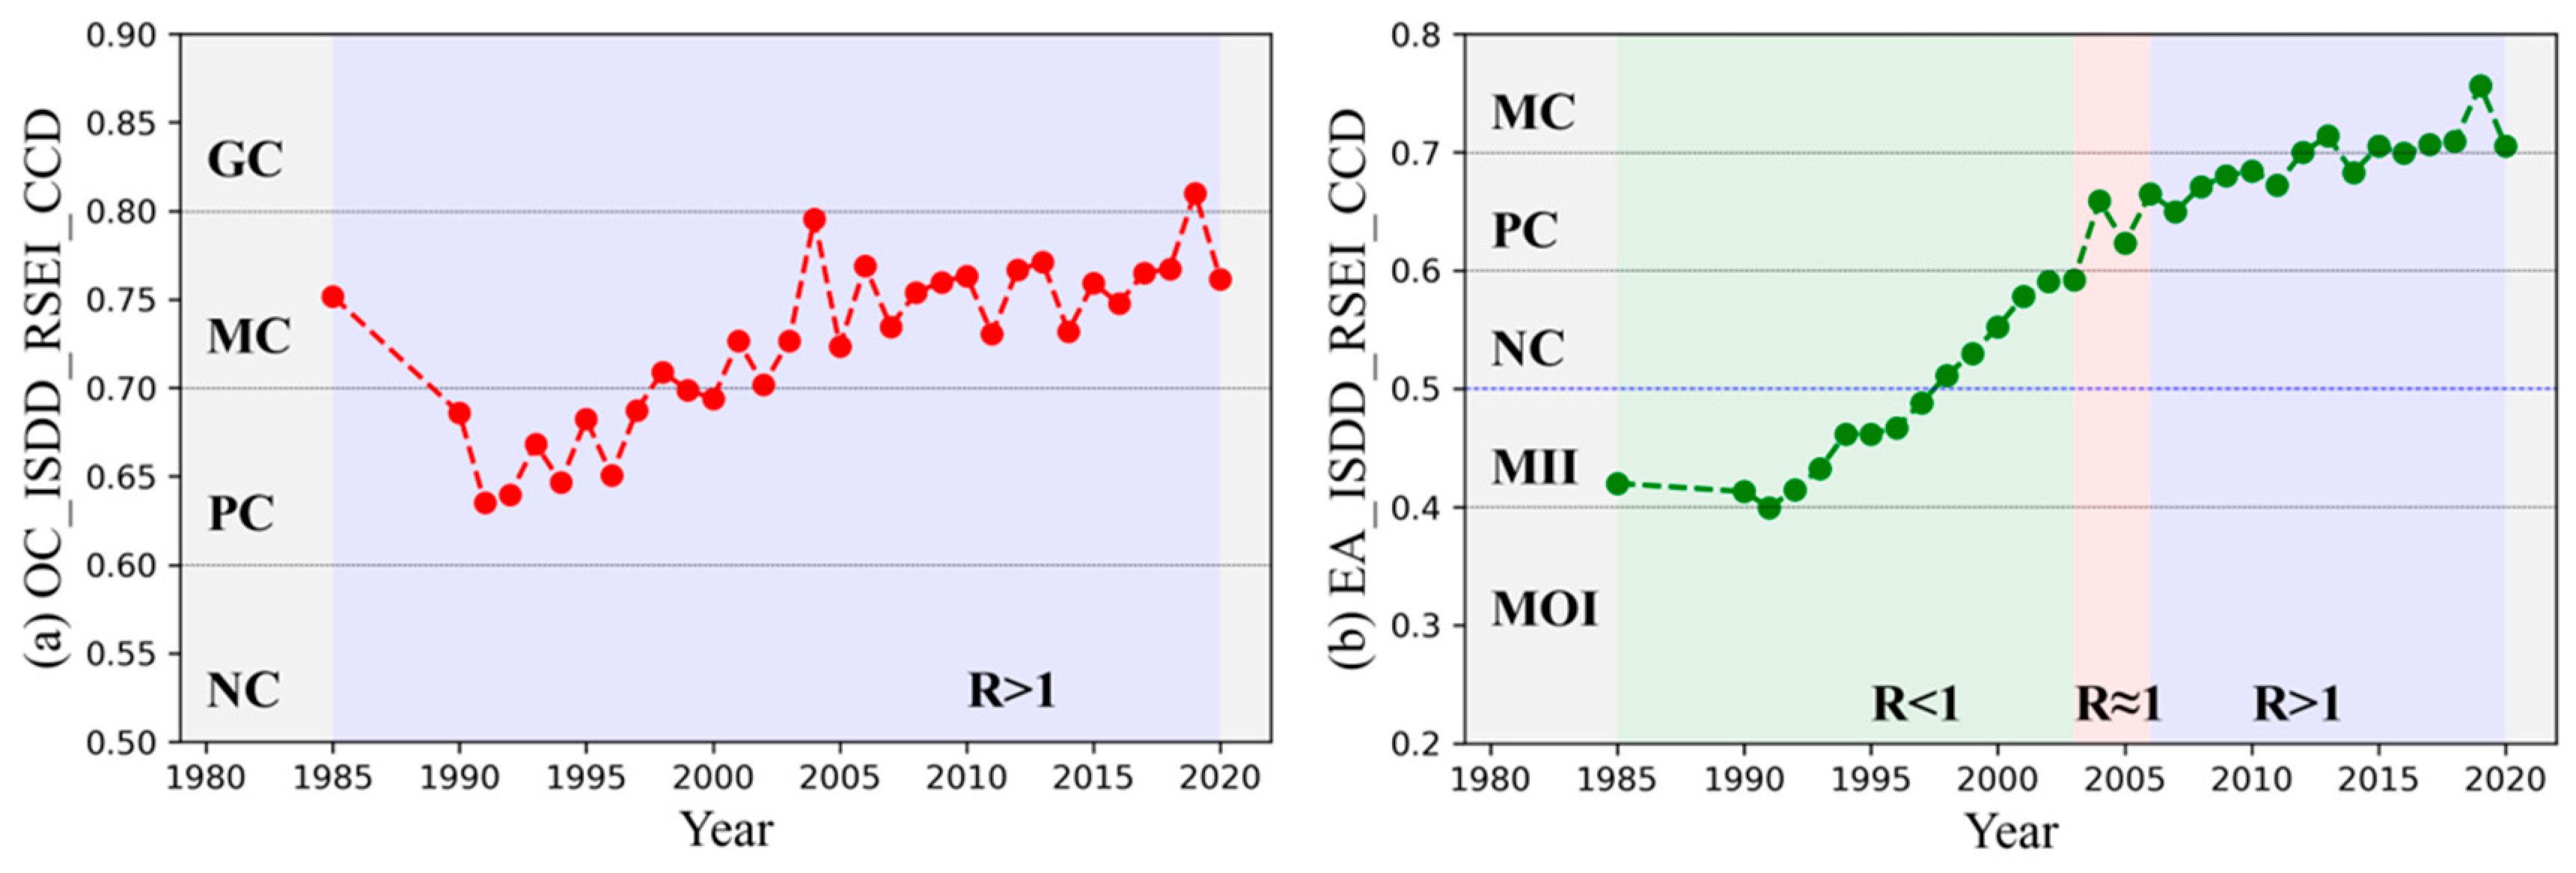
3.6. Results of CCD Between Urbanization and Eco-Environmental Quality
4. Discussion
4.1. Potential Drivers of Eco-Environmental Quality Change
4.2. CCD Model Analysis
4.3. Limitations and Future Prospects
- (1)
- While ISDD is a powerful tool for quantifying urbanization intensity, its effectiveness can be limited by factors such as spatial resolution, boundary effects, and environmental context. To enhance its accuracy and applicability, ISDD can be improved by integrating higher-resolution data, employing adaptive analytical approaches, and linking it with ecological and socioeconomic indicators. Addressing these challenges will strengthen ISDD’s robustness, making it a more effective tool for urban environmental research and the planning of sustainable urban development.
- (2)
- While urbanization is often measured by the expansion of impervious surfaces, it also has significant effects on aquatic environments. The current use of RSEI fails to account for water bodies, which are vital components of urban ecosystems and play critical roles in regulating temperature, supporting biodiversity, and mitigating flooding. In urban areas, where water features are integral to both the urban landscape and environmental quality, the neglect of these areas can result in an incomplete assessment of the overall urbanization impact. Future studies could integrate water quality and quantity indicators into the urbanization analysis. This could be achieved by using additional remote sensing indices specifically designed for monitoring water bodies, such as the normalized difference water index (NDWI), or using hyperspectral imagery to assess water health, including pollution levels, vegetation along shorelines, and changes in water surface area.
4.4. Enlightenment
5. Conclusions
- (1)
- Interannual Trends in ISDD and RSEI: Urbanization has generally contributed to a deterioration in eco-environmental quality in Hangzhou. However, the trends vary spatially: ecological quality in expansion areas has significantly declined, while in the old city, it has markedly improved.
- (2)
- Dynamic Response of Ecological Quality to Urbanization Intensity: The ecological response to urbanization intensity differs by zone. In expansion areas with low urbanization intensity, ecological quality deteriorates as urbanization progresses. Conversely, in the old city, where urbanization intensity is higher, ecological quality improves as urbanization grows.
- (3)
- Coupling Coordination Between ISDD and RSEI: The relationship between urbanization and ecological quality has become more coordinated over time, indicating a shift towards more balanced development that integrates urban growth with environmental sustainability.
Supplementary Materials
Author Contributions
Funding
Data Availability Statement
Acknowledgments
Conflicts of Interest
Abbreviations
| ISDD | Impervious surface distribution density |
| RSEI | Remote Sensing-based Ecological Index |
| CCD | Coupling coordination degree |
| UMBA | Urban Main Built-up Area |
| PCA | Principal Component Analysis |
| NDVI | Normalized difference vegetation index |
| NDBSI | Normalized difference built-up and soil index |
| LST | Land surface temperature |
| UEA | Urban expansion area |
| UEI | Urban expansion intensity |
| FD | Fractal dimension |
| CP | Compactness |
| OC | Old city |
| EA | Expansion area |
| SA | Suburban area |
References
- Ritchie, H.; Roser, M. Urbanization. Our World in Data. 2024. Available online: https://ourworldindata.org/urbanization (accessed on 10 December 2024).
- Uttara, S.; Bhuvandas, N.; Aggarwal, V. Impacts of urbanization on environment. Int. J. Res. Eng. Appl. Sci. 2012, 2, 1637–1645. [Google Scholar]
- Bai, T.; Cheng, J.; Zheng, Z.; Zhang, Q.; Li, Z.; Xu, D. Drivers of eco-environmental quality in China from 2000 to 2017. J. Clean. Prod. 2023, 396, 136408. [Google Scholar] [CrossRef]
- Yue, H.; Liu, Y.; Li, Y.; Lu, Y. Eco-environmental quality assessment in China’s 35 major cities based on remote sensing ecological index. IEEE Access 2019, 7, 51295–51311. [Google Scholar] [CrossRef]
- Chen, W.; Zhang, Y.; Pengwang, C.; Gao, W. Evaluation of urbanization dynamics and its impacts on surface heat islands: A case study of Beijing, China. Remote Sens. 2017, 9, 453. [Google Scholar] [CrossRef]
- Luck, M.; Wu, J. A gradient analysis of urban landscape pattern: A case study from the Phoenix metropolitan region, Arizona, USA. Landsc. Ecol. 2002, 17, 327–339. [Google Scholar] [CrossRef]
- Ma, J.; Wang, J.; He, S.; Zhang, J.; Liu, L.; Zhong, X. Direct and indirect effects of urbanization on vegetation: A survey of Yunnan central urban Economic Circle, China. Ecol. Indic. 2024, 166, 112536. [Google Scholar] [CrossRef]
- Zhang, M.; Du, H.; Zhou, G.; Mao, F.; Li, X.; Zhou, L.; Zhu, D.e.; Xu, Y.; Huang, Z. Spatiotemporal Patterns and Driving Force of Urbanization and Its Impact on Urban Ecology. Remote Sens. 2022, 14, 1160. [Google Scholar] [CrossRef]
- Zhou, X.; Chen, H. Impact of urbanization-related land use land cover changes and urban morphology changes on the urban heat island phenomenon. Sci. Total Environ. 2018, 635, 1467–1476. [Google Scholar] [CrossRef]
- Tian, P.; Liu, Y.; Li, J.; Pu, R.; Cao, L.; Zhang, H. Spatiotemporal patterns of urban expansion and trade-offs and synergies among ecosystem services in urban agglomerations of China. Ecol. Indic. 2023, 148, 110057. [Google Scholar] [CrossRef]
- Li, S.; He, Y.; Xu, H.; Zhu, C.; Dong, B.; Lin, Y.; Si, B.; Deng, J.; Wang, K. Impacts of Urban Expansion Forms on Ecosystem Services in Urban Agglomerations: A Case Study of Shanghai-Hangzhou Bay Urban Agglomeration. Remote Sens. 2021, 13, 1908. [Google Scholar] [CrossRef]
- Zhang, J.; Du, J.; Fang, S.; Sheng, Z.; Zhang, Y.; Sun, B.; Mao, J.; Li, L. Dynamic changes, spatiotemporal differences, and ecological effects of impervious surfaces in the Yellow river basin, 1986–2020. Remote Sens. 2023, 15, 268. [Google Scholar] [CrossRef]
- Zhong, Q.; Ma, J.; Zhao, B.; Wang, X.; Zong, J.; Xiao, X. Assessing spatial-temporal dynamics of urban expansion, vegetation greenness and photosynthesis in megacity Shanghai, China during 2000–2016. Remote Sens. Environ. 2019, 233, 111374. [Google Scholar] [CrossRef]
- Gao, Y.; Zhao, J.; Han, L. Exploring the spatial heterogeneity of urban heat island effect and its relationship to block morphology with the geographically weighted regression model. Sustain. Cities Soc. 2022, 76, 103431. [Google Scholar] [CrossRef]
- Zhang, Y.; Wang, Y.; Ding, N.; Yang, X. Spatial pattern impact of impervious surface density on urban heat island effect: A case study in Xuzhou, China. Land 2022, 11, 2135. [Google Scholar] [CrossRef]
- Kawakubo, F.; Morato, R.; Martins, M.; Mataveli, G.; Nepomuceno, P.; Martines, M. Quantification and analysis of impervious surface area in the Metropolitan Region of São Paulo, Brazil. Remote Sens. 2019, 11, 944. [Google Scholar] [CrossRef]
- Hu, M.; Li, X.; Xu, Y.; Huang, Z.; Chen, C.; Chen, J.; Du, H. Remote sensing monitoring of the spatiotemporal dynamics of urban forest phenology and its response to climate and urbanization. Urban Clim. 2024, 53, 101810. [Google Scholar] [CrossRef]
- Jacobson, C.R. Identification and quantification of the hydrological impacts of imperviousness in urban catchments: A review. J. Environ. Manag. 2011, 92, 1438–1448. [Google Scholar] [CrossRef]
- Weng, Q. Remote sensing of impervious surfaces in the urban areas: Requirements, methods, and trends. Remote Sens. Environ. 2012, 117, 34–49. [Google Scholar] [CrossRef]
- Meng, Q.Y.; Wang, Z.A.; Zhang, L.L.; Sun, Z.H.; Hu, D.; Yang, T.L. Response relationship between urban thermal environment and impervious surface distribution density at multi-spatial scale: A case study of Beijing. Natl. Remote Sens. Bull. 2023, 26, 1789–1801. [Google Scholar] [CrossRef]
- Meng, Q.; Zhang, L.; Sun, Z.; Meng, F.; Wang, L.; Sun, Y. Characterizing spatial and temporal trends of surface urban heat island effect in an urban main built-up area: A 12-year case study in Beijing, China. Remote Sens. Environ. 2018, 204, 826–837. [Google Scholar] [CrossRef]
- Yin, C.; Meng, F.; Guo, L.; Zhang, Y.; Zhao, Z.; Xing, H.; Yao, G. Extraction and Evolution Analysis of Urban Built-Up areas in Beijing, 1984–2018. Appl. Spat. Anal. Policy 2021, 14, 731–753. [Google Scholar] [CrossRef]
- Wang, G.; Peng, W.; Zhang, L.; Xiang, J.; Shi, J.; Wang, L. Quantifying urban expansion and its driving forces in Chengdu, western China. Egypt. J. Remote Sens. Space Sci. 2023, 26, 1057–1070. [Google Scholar] [CrossRef]
- Imhoff, M.L.; Zhang, P.; Wolfe, R.E.; Bounoua, L. Remote sensing of the urban heat island effect across biomes in the continental USA. Remote Sens. Environ. 2010, 114, 504–513. [Google Scholar] [CrossRef]
- Sandholt, I.; Rasmussen, K.; Andersen, J. A simple interpretation of the surface temperature/vegetation index space for assessment of surface moisture status. Remote Sens. Environ. 2002, 79, 213–224. [Google Scholar] [CrossRef]
- Yuan, F.; Bauer, M.E. Comparison of impervious surface area and normalized difference vegetation index as indicators of surface urban heat island effects in Landsat imagery. Remote Sens. Environ. 2007, 106, 375–386. [Google Scholar] [CrossRef]
- Yuan, B.; Fu, L.; Zou, Y.; Zhang, S.; Chen, X.; Li, F.; Deng, Z.; Xie, Y. Spatiotemporal change detection of ecological quality and the associated affecting factors in Dongting Lake Basin, based on RSEI. J. Clean. Prod. 2021, 302, 126995. [Google Scholar] [CrossRef]
- Zhang, Y.; She, J.; Long, X.; Zhang, M. Spatio-temporal evolution and driving factors of eco-environmental quality based on RSEI in Chang-Zhu-Tan metropolitan circle, central China. Ecol. Indic. 2022, 144, 109436. [Google Scholar] [CrossRef]
- Xu, H. A remote sensing urban ecological index and its application. Acta Ecol. Sin 2013, 33, 7853–7862. [Google Scholar]
- Xu, D.; Yang, F.; Yu, L.; Zhou, Y.; Li, H.; Ma, J.; Huang, J.; Wei, J.; Xu, Y.; Zhang, C. Quantization of the coupling mechanism between eco-environmental quality and urbanization from multisource remote sensing data. J. Clean. Prod. 2021, 321, 128948. [Google Scholar] [CrossRef]
- Hu, X.; Xu, H. A new remote sensing index for assessing the spatial heterogeneity in urban ecological quality: A case from Fuzhou City, China. Ecol. Indic. 2018, 89, 11–21. [Google Scholar] [CrossRef]
- Huang, H.; Chen, W.; Zhang, Y.; Qiao, L.; Du, Y. Analysis of ecological quality in Lhasa Metropolitan Area during 1990–2017 based on remote sensing and Google Earth Engine platform. J. Geogr. Sci. 2021, 31, 265–280. [Google Scholar] [CrossRef]
- Firozjaei, M.K.; Fathololoumi, S.; Weng, Q.; Kiavarz, M.; Alavipanah, S.K. Remotely sensed urban surface ecological index (RSUSEI): An analytical framework for assessing the surface ecological status in urban environments. Remote Sens. 2020, 12, 2029. [Google Scholar] [CrossRef]
- Anestis, G.; Stathakis, D. Urbanization trends from global to the local scale. In Geographical Information Science; Elsevier: Amsterdam, The Netherlands, 2024; pp. 357–375. [Google Scholar]
- Sahoo, M.; Sethi, N. The dynamic impact of urbanization, structural transformation, and technological innovation on ecological footprint and PM2.5: Evidence from newly industrialized countries. Environ. Dev. Sustain. 2022, 24, 4244–4277. [Google Scholar] [CrossRef]
- Almulhim, A.I.; Bibri, S.E.; Sharifi, A.; Ahmad, S.; Almatar, K.M. Emerging Trends and Knowledge Structures of Urbanization and Environmental Sustainability: A Regional Perspective. Sustainability 2022, 14, 13195. [Google Scholar] [CrossRef]
- Li, J.; Lei, J.; Li, S.; Yang, Z.; Tong, Y.; Zhang, S.; Duan, Z. Spatiotemporal analysis of the relationship between urbanization and the eco-environment in the Kashgar metropolitan area, China. Ecol. Indic. 2022, 135, 108524. [Google Scholar] [CrossRef]
- McKinney, M.L. Urbanization as a major cause of biotic homogenization. Biol. Conserv. 2006, 127, 247–260. [Google Scholar] [CrossRef]
- Zhao, S.; Da, L.; Tang, Z.; Fang, H.; Song, K.; Fang, J. Ecological consequences of rapid urban expansion: Shanghai, China. Front. Ecol. Environ. 2006, 4, 341–346. [Google Scholar] [CrossRef]
- Mersal, A. Sustainable urban futures: Environmental planning for sustainable urban development. Procedia Environ. Sci. 2016, 34, 49–61. [Google Scholar] [CrossRef]
- Tzoulas, K.; Korpela, K.; Venn, S.; Yli-Pelkonen, V.; Kaźmierczak, A.; Niemela, J.; James, P. Promoting ecosystem and human health in urban areas using Green Infrastructure: A literature review. Landsc. Urban Plan. 2007, 81, 167–178. [Google Scholar] [CrossRef]
- Kanchibhotla, D.; Rao, N.; Harsora, P. Compatibility of Eco-Friendly, Sustainable Living with Urbanization: A Case-study of The Art of Living International Center near Bengaluru. J. Sustain. Dev. 2024, 13, 1–92. [Google Scholar] [CrossRef]
- Fan, P.; Xu, L.; Yue, W.; Chen, J. Accessibility of public urban green space in an urban periphery: The case of Shanghai. Landsc. Urban Plan. 2017, 165, 177–192. [Google Scholar] [CrossRef]
- Kammen, D.M.; Sunter, D.A. City-integrated renewable energy for urban sustainability. Science 2016, 352, 922–928. [Google Scholar] [CrossRef] [PubMed]
- Li, F.; Wang, R.; Paulussen, J.; Liu, X. Comprehensive concept planning of urban greening based on ecological principles: A case study in Beijing, China. Landsc. Urban Plan. 2005, 72, 325–336. [Google Scholar] [CrossRef]
- Zhang, L.; Yang, L.; Zohner, C.M.; Crowther, T.W.; Li, M.; Shen, F.; Guo, M.; Qin, J.; Yao, L.; Zhou, C. Direct and indirect impacts of urbanization on vegetation growth across the world’s cities. Sci. Adv. 2022, 8, eabo0095. [Google Scholar] [CrossRef]
- Luo, X.; Luan, W.; Li, Y.; Xiong, T. Coupling coordination analysis of urbanization and the ecological environment based on urban functional zones. Front. Public Health 2023, 11, 1111044. [Google Scholar] [CrossRef]
- Turrini, T.; Knop, E. A landscape ecology approach identifies important drivers of urban biodiversity. Glob. Change Biol. 2015, 21, 1652–1667. [Google Scholar] [CrossRef]
- Wang, Y.; Zhu, L.; Yang, X.; Zhang, X.; Wang, X.; Pei, J.; Zhou, L.; Luo, Z.; Fang, Q.; Liang, M. Evaluating the conservation priority of key biodiversity areas based on ecosystem conditions and anthropogenic threats in rapidly urbanizing areas. Ecol. Indic. 2022, 142, 109245. [Google Scholar] [CrossRef]
- Xun, B.; Yu, D.; Wang, X. Prioritizing habitat conservation outside protected areas in rapidly urbanizing landscapes: A patch network approach. Landsc. Urban Plan. 2017, 157, 532–541. [Google Scholar] [CrossRef]
- Yang, J.; Huang, X. The 30 m annual land cover dataset and its dynamics in China from 1990 to 2019. Earth Syst. Sci. Data 2021, 13, 3907–3925. [Google Scholar] [CrossRef]
- Tong, Z.; Yang, J.; Liu, Y.; Zhang, Z.; Liu, S.; Lu, Y.; Pang, B.; An, R. Cooling and optimizing urban heat island based on a thermal knowledge-informed multi-type ant colony model. Remote Sens. Environ. 2024, 306, 114138. [Google Scholar] [CrossRef]
- Yin, Z.; Zhou, T.; Li, H.; Xie, S.; Ren, Y. Study on impervious surface change and urban expansion of the Guangdong-Hong kong-Macao Greater Bay Area. Geogr. Geo-Inf. Sci. 2021, 37, 106–113. [Google Scholar]
- Chen, Y.; Zhang, J. Extraction of Urban Built-Up Areas Based on Data Fusion: A Case Study of Zhengzhou, China. ISPRS Int. J. Geo-Inf. 2022, 11, 521. [Google Scholar] [CrossRef]
- Chang, S.; Wang, J.; Zhang, F.; Niu, L.; Wang, Y. A study of the impacts of urban expansion on vegetation primary productivity levels in the Jing-Jin-Ji region, based on nighttime light data. J. Clean. Prod. 2020, 263, 121490. [Google Scholar] [CrossRef]
- Ran, X.; Zhou, X.; Lei, M.; Tepsan, W.; Deng, W. A novel k-means clustering algorithm with a noise algorithm for capturing urban hotspots. Appl. Sci. 2021, 11, 11202. [Google Scholar] [CrossRef]
- Sützl, B.S.; Strebel, D.A.; Rubin, A.; Wen, J.; Carmeliet, J. Urban morphology clustering analysis to identify heat-prone neighbourhoods in cities. Sustain. Cities Soc. 2024, 107, 105360. [Google Scholar] [CrossRef]
- Jiao, L.; Mao, L.; Liu, Y. Multi-order landscape expansion index: Characterizing urban expansion dynamics. Landsc. Urban Plan. 2015, 137, 30–39. [Google Scholar] [CrossRef]
- Jatayu, A.; Rustiadi, E.; Juanda, B.; Pribadi, D.O. Metric-Based Approach for Quantifying Urban Expansion Impact on Urban Form Changes in the JBMUR South Conurbation Corridor. Land 2023, 12, 864. [Google Scholar] [CrossRef]
- Gusso, A.; de Mello, L.E. Fractal dimension of basin boundaries calculated using the basin entropy. Chaos Solitons Fractals 2021, 153, 111532. [Google Scholar] [CrossRef]
- Makido, Y.; Dhakal, S.; Yamagata, Y. Relationship between urban form and CO2 emissions: Evidence from fifty Japanese cities. Urban Clim. 2012, 2, 55–67. [Google Scholar] [CrossRef]
- Xu, H. A remote sensing index for assessment of regional ecological changes. China Environ. Sci. 2013, 33, 889–897. [Google Scholar]
- Wang, X.; Zhang, S.; Zhao, X.; Shi, S.; Xu, L. Exploring the relationship between the eco-environmental quality and urbanization by utilizing sentinel and landsat data: A case study of the Yellow River Basin. Remote Sens. 2023, 15, 743. [Google Scholar] [CrossRef]
- Huete, A.; Didan, K.; Miura, T.; Rodriguez, E.P.; Gao, X.; Ferreira, L.G. Overview of the radiometric and biophysical performance of the MODIS vegetation indices. Remote Sens. Environ. 2002, 83, 195–213. [Google Scholar] [CrossRef]
- Baig, M.H.A.; Zhang, L.; Shuai, T.; Tong, Q. Derivation of a tasselled cap transformation based on Landsat 8 at-satellite reflectance. Remote Sens. Lett. 2014, 5, 423–431. [Google Scholar] [CrossRef]
- Mostafiz, C.; Chang, N.-B. Tasseled cap transformation for assessing hurricane landfall impact on a coastal watershed. Int. J. Appl. Earth Obs. Geoinf. 2018, 73, 736–745. [Google Scholar] [CrossRef]
- Earth Resources Observation and Science (EROS) Center. Landsat 8-9 Operational Land Imager/Thermal Infrared Sensor Level-2, Collection 2 [Dataset]. U.S. Geological Survey. 2020. Available online: https://www.usgs.gov/centers/eros/science/usgs-eros-archive-landsat-archives-landsat-8-9-olitirs-collection-2-level-2 (accessed on 21 September 2023).
- Liu, Y.; Meng, Q.; Zhang, L.; Wu, C. NDBSI: A normalized difference bare soil index for remote sensing to improve bare soil mapping accuracy in urban and rural areas. Catena 2022, 214, 106265. [Google Scholar] [CrossRef]
- Lin, L.; Hao, Z.; Post, C.J.; Mikhailova, E.A. Monitoring Ecological Changes on a Rapidly Urbanizing Island Using a Remote Sensing-Based Ecological Index Produced Time Series. Remote Sens. 2022, 14, 5773. [Google Scholar] [CrossRef]
- Qureshi, S.; Alavipanah, S.K.; Konyushkova, M.; Mijani, N.; Fathololomi, S.; Firozjaei, M.K.; Homaee, M.; Hamzeh, S.; Kakroodi, A.A. A Remotely Sensed Assessment of Surface Ecological Change over the Gomishan Wetland, Iran. Remote Sens. 2020, 12, 2989. [Google Scholar] [CrossRef]
- Zhang, Y.; Jiang, F. Developing a remote sensing-based ecological index based on improved biophysical features. J. Appl. Remote Sens. 2022, 16, 012008. [Google Scholar] [CrossRef]
- Liu, H.; Li, X.; Mao, F.; Zhang, M.; Zhu, D.e.; He, S.; Huang, Z.; Du, H. Spatiotemporal evolution of fractional vegetation cover and its response to climate change based on MODIS data in the subtropical region of China. Remote Sens. 2021, 13, 913. [Google Scholar] [CrossRef]
- Li, X.; Hai, Q.; Zhu, Z.; Zhang, D.; Shao, Y.; Zhao, Y.; Li, H.; Vandansambuu, B.; Ning, X.; Chen, D. Spatial and temporal changes in vegetation cover in the three north protection forest project area supported by GEE cloud platform. Forests 2023, 14, 295. [Google Scholar] [CrossRef]
- Yang, S.; Zhong, L.; Zhou, Y.; Sun, B.; Wang, R.; Sun, Z.; Li, J. Interactions and Conflicts between Urbanization and Greenness: A Case Study from Nanjing, China. Remote Sens. 2024, 16, 2505. [Google Scholar] [CrossRef]
- Li, Y.; Li, X.; Lu, T. Coupled Coordination Analysis between Urbanization and Eco-Environment in Ecologically Fragile Areas: A Case Study of Northwestern Sichuan, Southwest China. Remote Sens. 2023, 15, 1661. [Google Scholar] [CrossRef]
- Xie, Y.; Zhu, Q.; Bai, H.; Luo, P.; Liu, J. Spatio-Temporal Evolution and Coupled Coordination of LUCC and ESV in Cities of the Transition Zone, Shenmu City, China. Remote Sens. 2023, 15, 3136. [Google Scholar] [CrossRef]
- Zou, C.; Zhu, J.; Lou, K.; Yang, L. Coupling coordination and spatiotemporal heterogeneity between urbanization and ecological environment in Shaanxi Province, China. Ecol. Indic. 2022, 141, 109152. [Google Scholar] [CrossRef]
- Gan, L.; Shi, H.; Hu, Y.; Lev, B.; Lan, H. Coupling coordination degree for urbanization city-industry integration level: Sichuan case. Sustain. Cities Soc. 2020, 58, 102136. [Google Scholar] [CrossRef]
- Ren, F.; Yu, X. Coupling analysis of urbanization and ecological total factor energy efficiency—A case study from Hebei province in China. Sustain. Cities Soc. 2021, 74, 103183. [Google Scholar] [CrossRef]
- Zhou, T.; Liu, H.; Gou, P.; Xu, N. Conflict or Coordination? Measuring the relationships between urbanization and vegetation cover in China. Ecol. Indic. 2023, 147, 109993. [Google Scholar] [CrossRef]
- Korkou, M.; Tarigan, A.K.; Hanslin, H.M. The multifunctionality concept in urban green infrastructure planning: A systematic literature review. Urban For. Urban Green. 2023, 85, 127975. [Google Scholar] [CrossRef]
- Kajosaari, A.; Hasanzadeh, K.; Fagerholm, N.; Nummi, P.; Kuusisto-Hjort, P.; Kyttä, M. Predicting context-sensitive urban green space quality to support urban green infrastructure planning. Landsc. Urban Plan. 2024, 242, 104952. [Google Scholar] [CrossRef]
- Zhu, W.; Sun, J.; Yang, C.; Liu, M.; Xu, X.; Ji, C. How to Measure the Urban Park Cooling Island? A Perspective of Absolute and Relative Indicators Using Remote Sensing and Buffer Analysis. Remote Sens. 2021, 13, 3154. [Google Scholar] [CrossRef]
- Hassan, T.; Zhang, J.; Prodhan, F.A.; Pangali Sharma, T.P.; Bashir, B. Surface Urban Heat Islands Dynamics in Response to LULC and Vegetation across South Asia (2000–2019). Remote Sens. 2021, 13, 3177. [Google Scholar] [CrossRef]
- Xiang, S.; Zhou, M.; Huang, L.; Shan, L.; Wang, K. Assessing the dynamic land utilization efficiency and relevant driving mechanism in in-situ urbanized rural areas: A case study of 1979 administrative villages in Hangzhou. Environ. Impact Assess. Rev. 2023, 101, 107111. [Google Scholar] [CrossRef]
- Xia, C.; Zhang, J.; Zhao, J.; Xue, F.; Li, Q.; Fang, K.; Shao, Z.; Li, S.; Zhou, J. Exploring potential of urban land-use management on carbon emissions—A case of Hangzhou, China. Ecol. Indic. 2023, 146, 109902. [Google Scholar] [CrossRef]
- Chen, L.; Zhou, B.; Man, W.; Liu, M. Landsat-based monitoring of the heat effects of urbanization directions and types in Hangzhou City from 2000 to 2020. Remote Sens. 2021, 13, 4268. [Google Scholar] [CrossRef]
- Lu, H.; Wang, R.; Ye, R.; Fan, J. Monitoring Long-Term Spatiotemporal Dynamics of Urban Expansion Using Multisource Remote Sensing Images and Historical Maps: A Case Study of Hangzhou, China. Land 2023, 12, 144. [Google Scholar] [CrossRef]
- Li, L.; Lu, D.; Kuang, W. Examining urban impervious surface distribution and its dynamic change in Hangzhou metropolis. Remote Sens. 2016, 8, 265. [Google Scholar] [CrossRef]
- Zhang, M.; Tan, S.; Zhang, C.; Han, S.; Zou, S.; Chen, E. Assessing the impact of fractional vegetation cover on urban thermal environment: A case study of Hangzhou, China. Sustain. Cities Soc. 2023, 96, 104663. [Google Scholar] [CrossRef]
- Yin, J.; Fu, P.; Cheshmehzangi, A.; Li, Z.; Dong, J. Investigating the changes in urban green-space patterns with urban land-use changes: A case study in Hangzhou, China. Remote Sens. 2022, 14, 5410. [Google Scholar] [CrossRef]


| Index | Explanation | Equation |
|---|---|---|
| NDVI | Represents vegetation cover information | |
| Wet | Represents land surface humidity | Tasseled cap transformation (TCT) component 3 |
| NDBSI | Represents land surface dryness | NDBSI = (IBI + SI)/2 |
| LST | Represents land surface temperature | Landsat collection 2 LST product (single-channel algorithm) |
| Category | CCD Range | Classes | R | Type |
|---|---|---|---|---|
| Uncoordinated development | (0–0.2] | Serious imbalance (SI) | R > 1 R ≈ 1 R < 1 | Ecological development lag Harmonized growth Urbanization growth lag |
| (0.2–0.4] | Moderate imbalance (MOI) | R > 1 R ≈ 1 R < 1 | Ecological development lag Harmonized growth Urbanization growth lag | |
| (0.4–0.5] | Mild imbalance (MII) | R > 1 R ≈ 1 R < 1 | Ecological development lag Harmonized growth Urbanization growth lag | |
| (0.5–0.6] | Near Coordination (NC) | R > 1 R ≈ 1 R < 1 | Ecological development lag Harmonized growth Urbanization growth lag | |
| Transformation development | (0.6–0.7] | Primary Coordination (PC) | R > 1 R≈1 R < 1 | Ecological development lag Harmonized growth Urbanization growth lag |
| (0.7–0.8] | Moderate Coordination (MC) | R > 1 R ≈ 1 R < 1 | Ecological development lag Harmonized growth Urbanization growth lag | |
| Coordinated development | (0.8–1.0] | Good Coordination (GC) | R > 1 R ≈ 1 R < 1 | Ecological development lag Harmonized growth Urbanization growth lag |
Disclaimer/Publisher’s Note: The statements, opinions and data contained in all publications are solely those of the individual author(s) and contributor(s) and not of MDPI and/or the editor(s). MDPI and/or the editor(s) disclaim responsibility for any injury to people or property resulting from any ideas, methods, instructions or products referred to in the content. |
© 2025 by the authors. Licensee MDPI, Basel, Switzerland. This article is an open access article distributed under the terms and conditions of the Creative Commons Attribution (CC BY) license (https://creativecommons.org/licenses/by/4.0/).
Share and Cite
Zhu, D.; Du, H.; Zhou, G.; Hu, M.; Huang, Z. The Spatiotemporal Dynamics and Evolutionary Relationship Between Urbanization and Eco-Environmental Quality: A Case Study in Hangzhou City, China. Remote Sens. 2025, 17, 1567. https://doi.org/10.3390/rs17091567
Zhu D, Du H, Zhou G, Hu M, Huang Z. The Spatiotemporal Dynamics and Evolutionary Relationship Between Urbanization and Eco-Environmental Quality: A Case Study in Hangzhou City, China. Remote Sensing. 2025; 17(9):1567. https://doi.org/10.3390/rs17091567
Chicago/Turabian StyleZhu, Di’en, Huaqiang Du, Guomo Zhou, Mengchen Hu, and Zihao Huang. 2025. "The Spatiotemporal Dynamics and Evolutionary Relationship Between Urbanization and Eco-Environmental Quality: A Case Study in Hangzhou City, China" Remote Sensing 17, no. 9: 1567. https://doi.org/10.3390/rs17091567
APA StyleZhu, D., Du, H., Zhou, G., Hu, M., & Huang, Z. (2025). The Spatiotemporal Dynamics and Evolutionary Relationship Between Urbanization and Eco-Environmental Quality: A Case Study in Hangzhou City, China. Remote Sensing, 17(9), 1567. https://doi.org/10.3390/rs17091567