Article

Landslide Identification in the Yuanjiang Basin of Northwestern Hunan, China, Using Multi-Temporal Polarimetric InSAR with Comparison to Single-Polarization Results

1
The School of Geosciences and Info-Physics, Central South University, Changsha 410083, China
2
Hunan Institute of Geological Disaster Investigation and Monitoring, Changsha 410004, China
3
Hunan Geological Disaster Monitoring, Early Warning and Emergency Rescue Engineering Technology Research Center, Changsha 410004, China
*
Author to whom correspondence should be addressed.
Remote Sens. 2025, 17(9), 1525; https://doi.org/10.3390/rs17091525
Submission received: 18 March 2025 / Revised: 22 April 2025 / Accepted: 23 April 2025 / Published: 25 April 2025

Abstract

:
The Yuanjiang Basin in Northwestern Hunan is a landslide-prone region due to its complex geological features and dense vegetation. Conventional single-polarization muti-temporal InSAR (MT-InSAR) methods often fail in such areas because of severe decorrelation, leading to reduced accuracy and coverage in monitoring. To address these limitations, this study proposes an innovative landslide detection framework using the muti-temporal polarimetric InSAR (MT-PolInSAR) method. This approach improves the density and precision of deformation measurements by optimizing polarimetric and temporal dimensions. Leveraging fully polarimetric ALOS-2 data acquired from May 2021 to June 2022, 32 potential deformation sites were identified, including 18 landslide-prone areas and 8 sites showing other deformation types, with average deformation rates between −4 and −2 cm/year. Field validation confirmed an identification accuracy of 81.25%, demonstrating the robustness of fully polarimetric long-wavelength SAR data for landslide monitoring in densely vegetated regions. This method offers a significant advancement in the detection and assessment of landslide hazards in challenging environments.

Graphical Abstract

1. Introduction

Landslides are among the most common geological hazards, posing significant threats to human life, infrastructure, and economic stability. The Yuanjiang Basin in Northwestern Hunan is particularly susceptible to landslides due to its rugged terrain, complex geological structures, and dense vegetation. Compounded by the increasing frequency of extreme precipitation events driven by climate change, this region has become a hotspot for landslide activity in Hunan Province. Landslides in this area are often widespread, difficult to detect, and occur with little warning, making effective monitoring a critical challenge. The peak landslide season, typically between April and July, disrupts local communities and economic activities, underscoring the urgent need for timely, accurate, and efficient monitoring solutions.
Traditional methods for landslide investigation, such as drilling, trenching, and geophysical surveys, are labor-intensive, time-consuming, and often hazardous. In contrast, Synthetic Aperture Radar Interferometry (InSAR) has emerged as a powerful tool for landslide detection, offering advantages such as all-weather capability, large-scale coverage, and high precision [1,2,3,4]. The two dominant multi-temporal InSAR (MT-InSAR) techniques are Permanent Scatterer InSAR (PS-InSAR) [5,6] and Distributed Scatterer InSAR (DS-InSAR) [7,8]. While PS-InSAR excels in urban environments with stable structures, it struggles in natural settings due to a lack of coherent scatterers. The Small Baseline Subset (SBAS) method [7], introduced in 2002, mitigates temporal decorrelation by selecting interferograms with short temporal and spatial baselines. Over the years, SBAS has been refined through improvements in interferograms selection [9,10], coherent point selection [10,11,12], deformation modeling [13,14], and parameter estimation [15,16]. Despite these advancements, severe decorrelation remains a persistent issue, particularly in vegetated regions. To tackle this challenge, Ferretti et al. [8] proposed the SqueeSAR method in 2011, which reconstructs interferometric phase series using all available interferograms, significantly enhancing phase quality and deformation accuracy. Further efforts to balance computational efficiency and optimization effects led to the development of techniques such as Eigenvalue Decomposition (EVD) [17,18], Least Squares [19,20], and the Expectation-Maximization Interferometry (EMI) method [21]. However, these approaches predominantly rely on single-polarization data, leaving the potential of multi-polarization datasets largely untapped.
The advent of polarimetric SAR satellites has spurred growing interest in multi-temporal polarimetric InSAR techniques (MT-PolInSAR). In 2010, Navarro-Sanchez et al. [22] proposed the Exhaustive Search Polarimetric Optimization (ESPO) method, which optimizes coherence by identifying the optimal polarization channel, thereby improving interferometric phase quality. This method has since been integrated into various single-polarization MT-InSAR techniques [23,24,25,26,27,28,29]. However, its main limitation is low computational efficiency. To address this, researchers developed the Coherency Matrix Decomposition (CMD) method [25,30], the Total Power (TP) method [31], and the Joint-Polarization Phase Linking (JPPL) method [32], which effectively balance optimization efficiency and accuracy. By leveraging multi-polarization information, these methods significantly enhance monitoring quality and spatial coverage, opening new avenues for InSAR applications.
Despite the widespread adoption of MT-InSAR technology for landslide investigations, its application in the Yuanjiang Basin of Hunan Province remains limited. Traditional field-based methods continue to dominate landslide surveys in this region, largely due to the challenges posed by its complex topography and dense vegetation. Multi-polarization data, however, offer a promising solution by providing additional observational redundancy through multiple polarization channels, thereby improving phase observation quality. Moreover, long-wavelength SAR data exhibit strong penetration capabilities, effectively mitigating decorrelation effects. Given these advantages, this study employs fully polarimetric ALOS-2/PALSAR-2 data acquired between May 2021 and June 2022 to conduct a comprehensive landslide survey in the Yuanjiang Basin. A total of 32 deformation sites were successfully identified, including landslide-induced deformations and ground subsidence. This study demonstrates the advantages of multi-polarization methods in enhancing measurement quality and density in regions with complex terrain and dense vegetation, providing valuable insights for disaster prevention and mitigation.

2. Study Area and Datasets
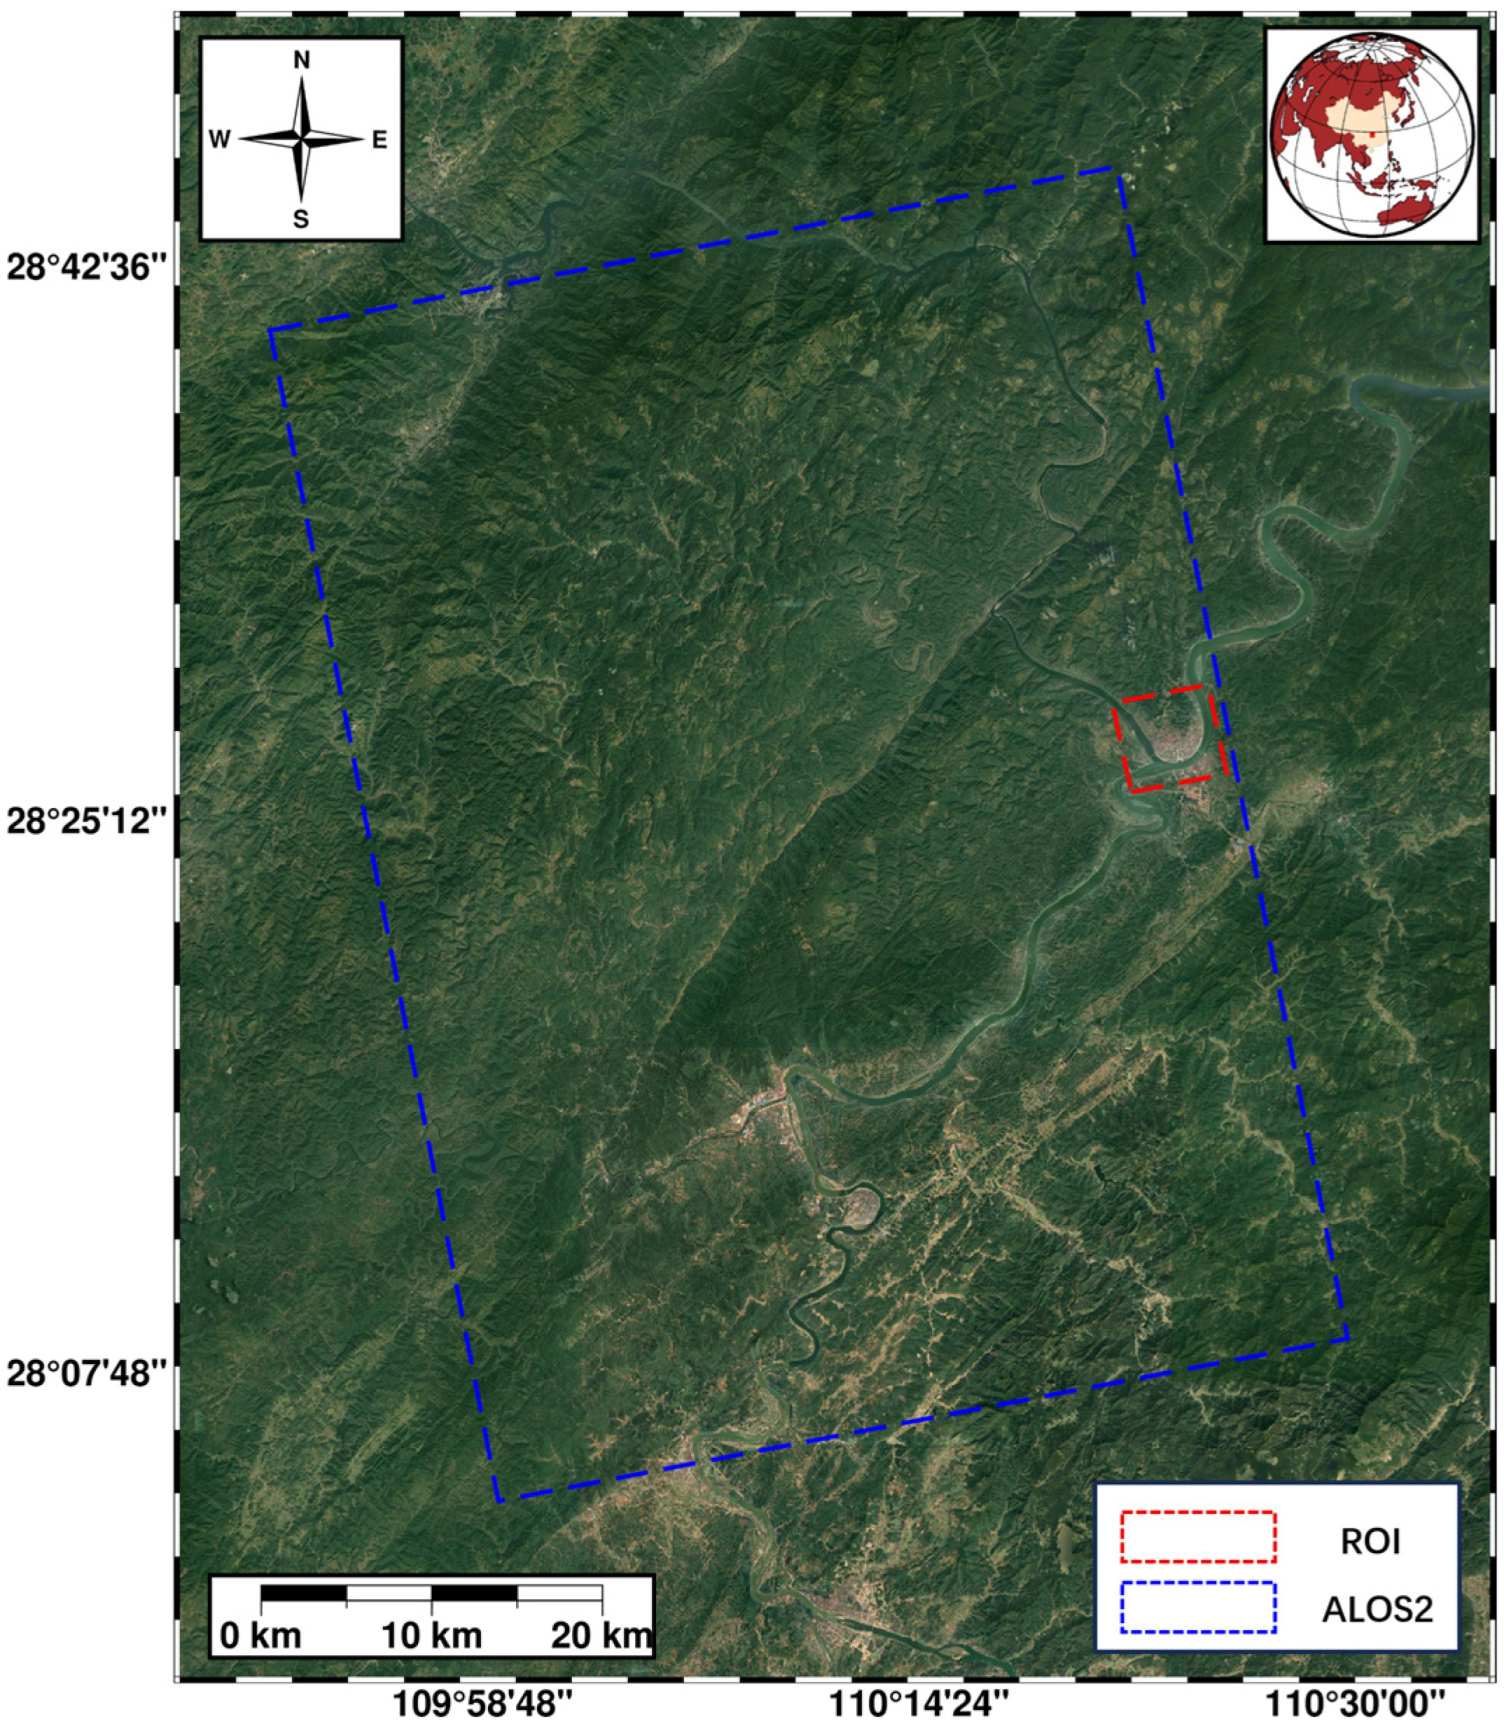
2.1. Study Area

The study area is located in Northwestern Hunan Province, covering latitudes 28°3′N to 28°45′N and longitudes 109°59′E to 110°21′E. This region lies at the junction of the Wuling and Xuefeng mountain ranges, forming part of the middle reaches of the Yuanjiang River. The area features rugged topography and complex geological structures, creating favorable conditions for landslide development. It has a typical subtropical monsoon humid climate, with distinct seasons and abundant rainfall, particularly from April to July. During this period, intense precipitation often triggers landslides, making the region highly susceptible to such hazards. Additionally, the area is also densely vegetated, primarily with evergreen broad-leaved forests. The dense vegetation complicates radar signal coherence, posing significant challenges for landslide monitoring using radar remote sensing. The study area and the coverage of the ALOS-2 satellite imagery are illustrated in Figure 1.

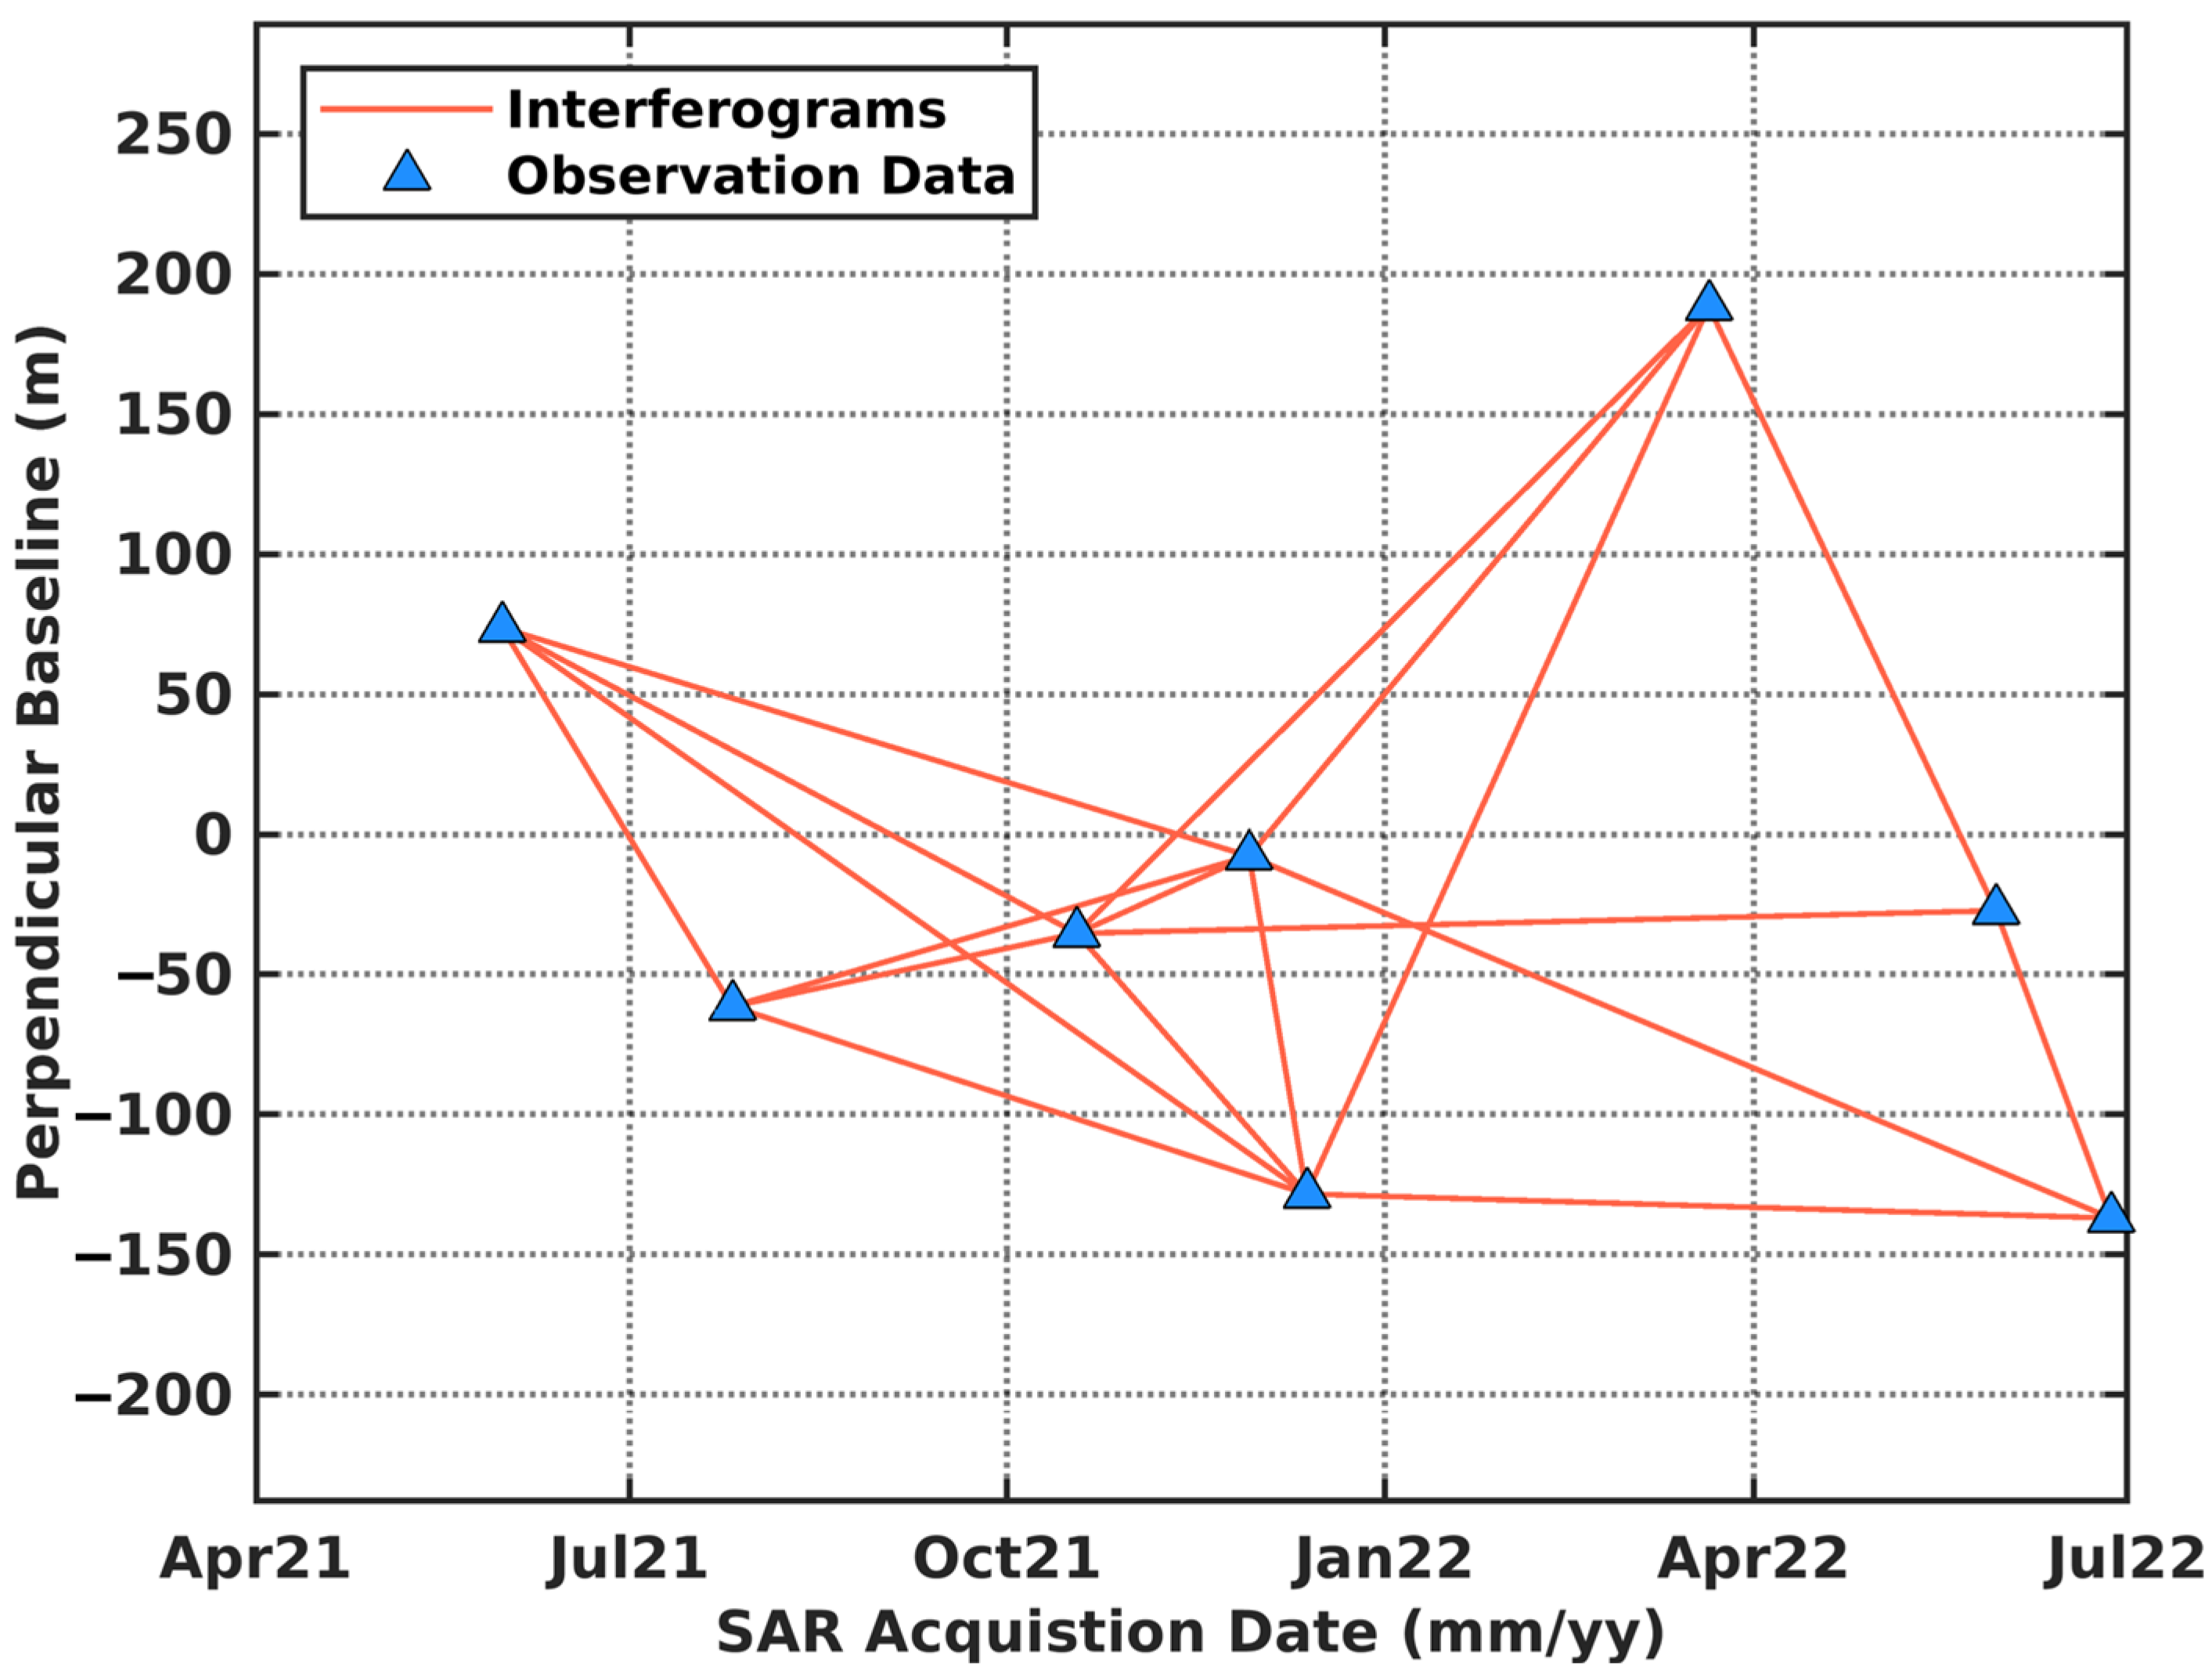
2.2. Experimental Data
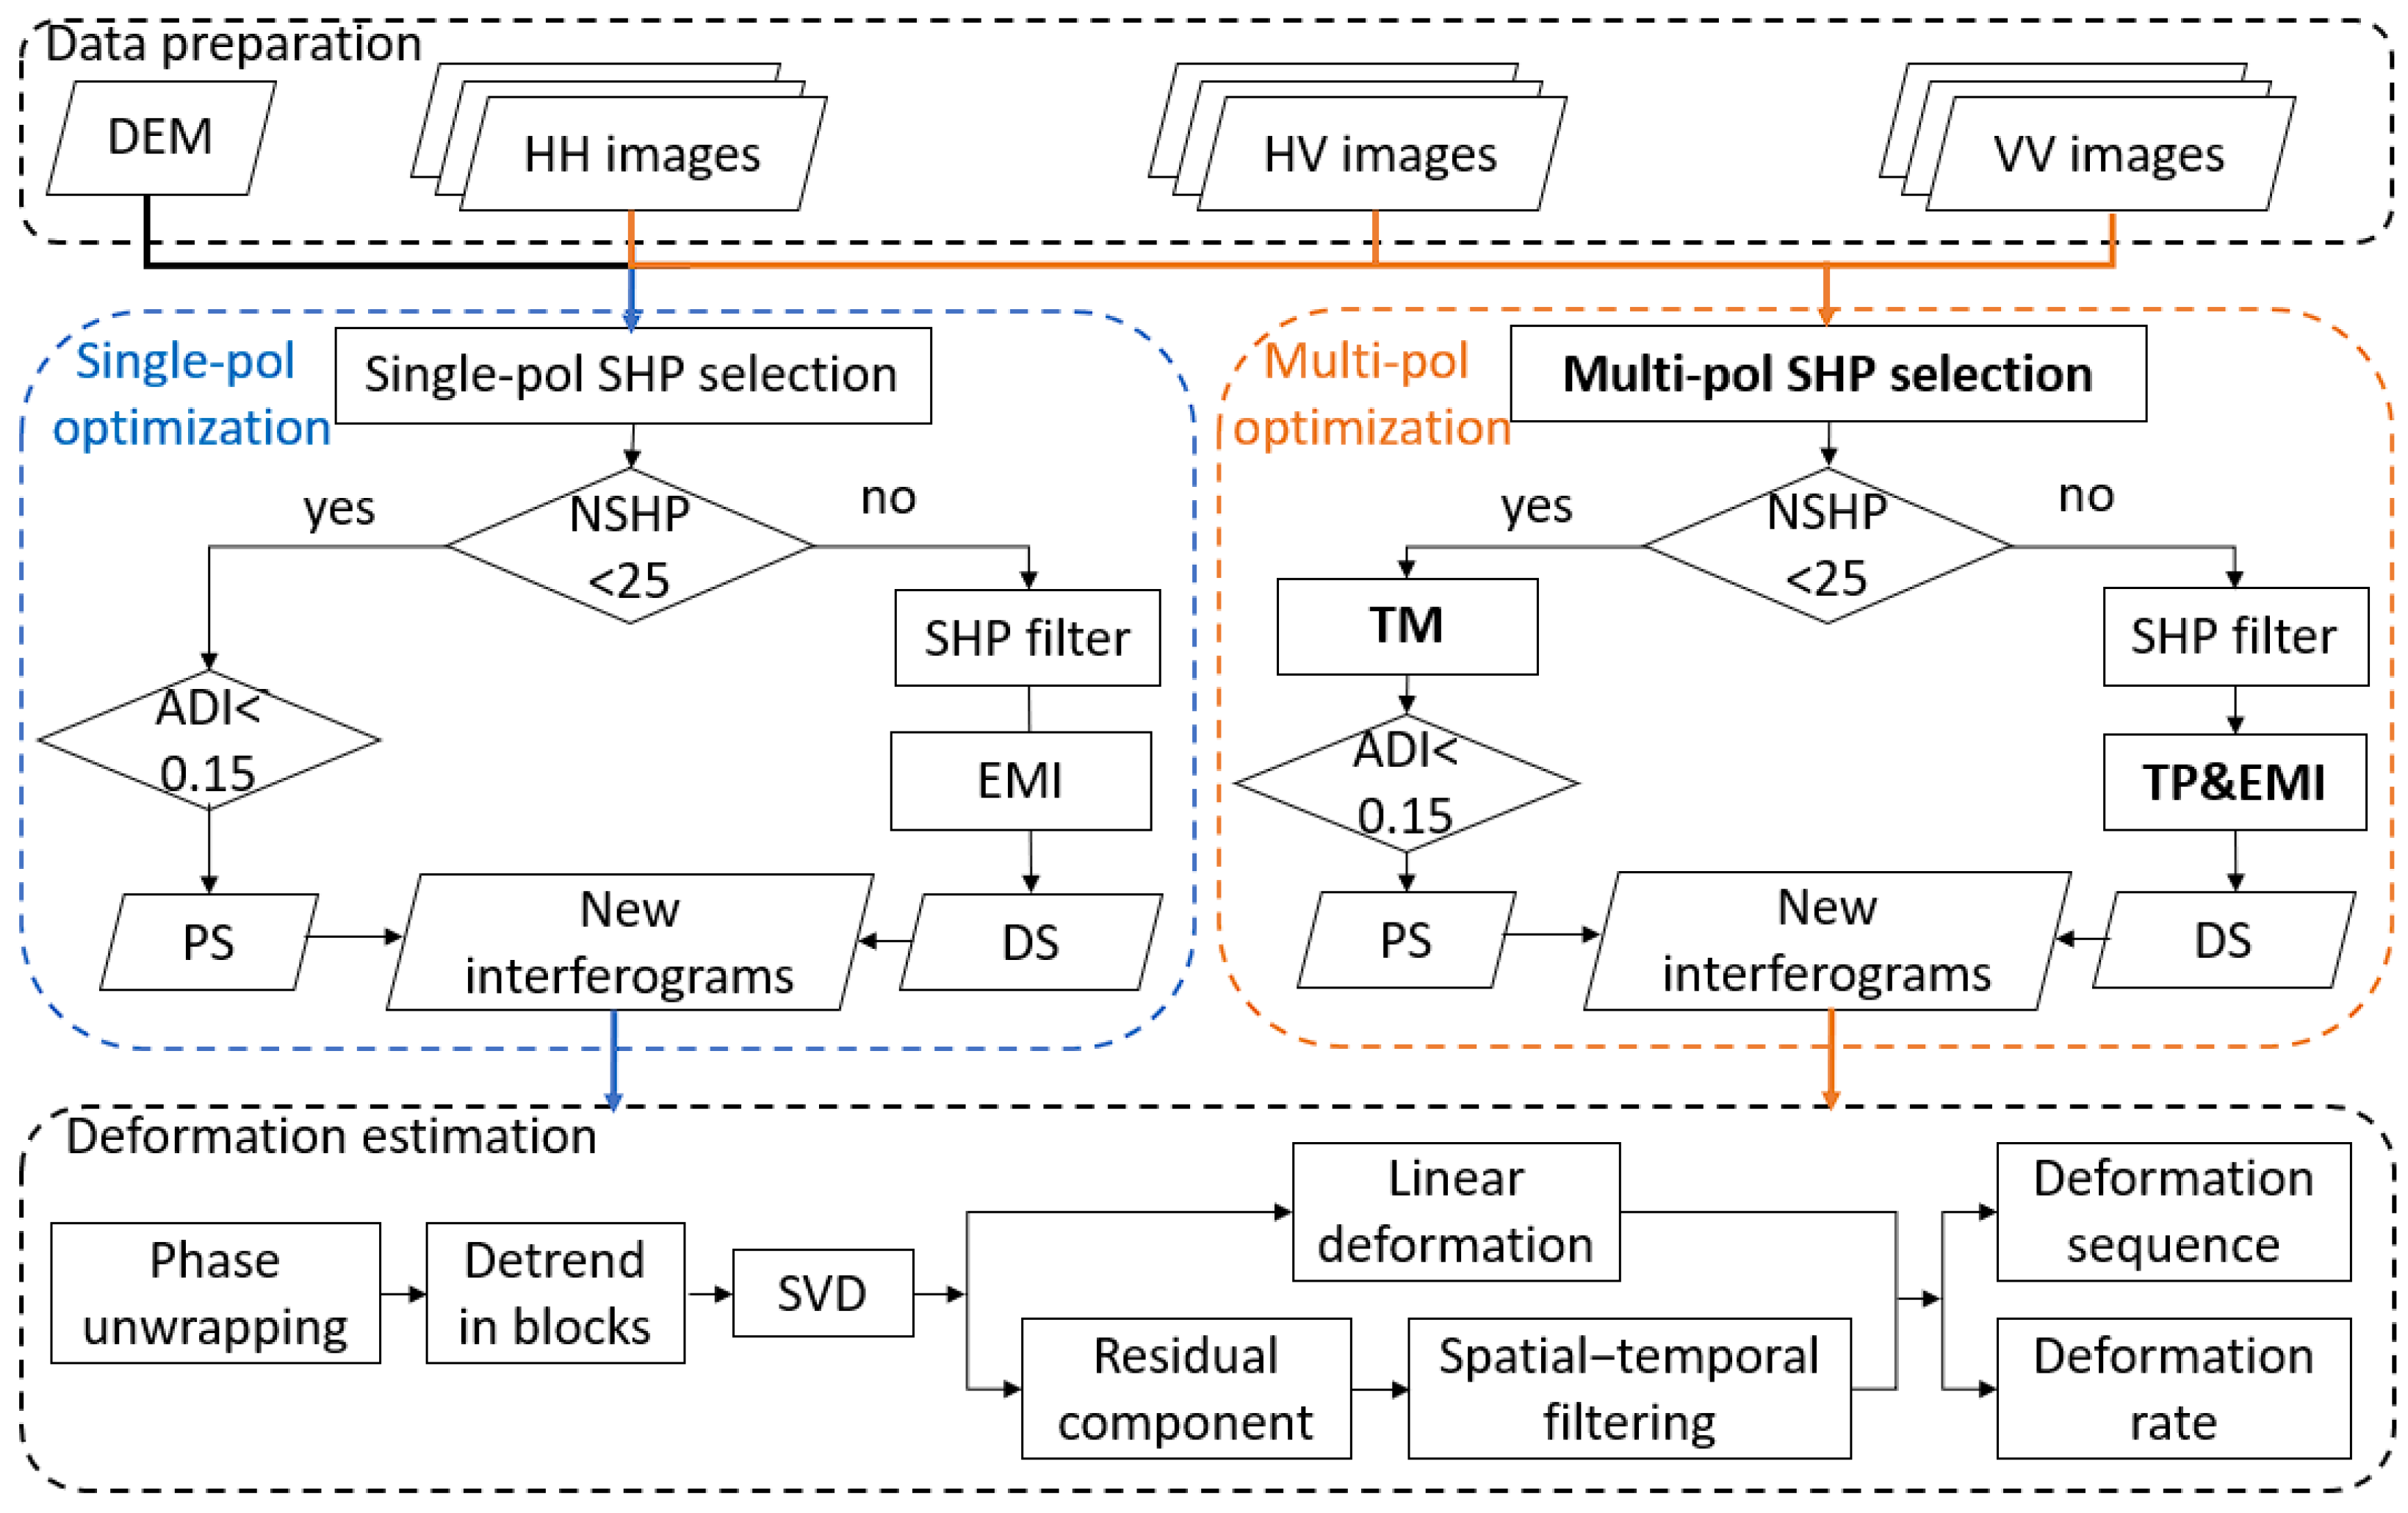
This study utilized eight ascending-orbit fully polarimetric SAR images acquired by the ALOS-2/PALSAR-2 satellite, operated by the Japan Aerospace Exploration Agency (JAXA). The SAR data were collected between 31 May 2021 and 27 June 2022, with detailed parameters listed in Table 1. Additionally, a 30 m resolution AW3D DEM, provided by JAXA, was used for accurate terrain correction and to minimize the impact of topography.

3. Methodology

To highlight the advantages of the proposed MT-PolInSAR method, we also implemented a single-polarization MT-InSAR processing strategy for comparative analysis. The MT-PolInSAR approach was developed as an extension of the single-polarization framework, sharing the same data preparation, interferogram generation, and deformation estimation procedures. The primary differences lie in the point selection and phase optimization modules. For clarity, unless otherwise stated, MT-InSAR in this paper denotes the single-polarization MT-InSAR approach. The complete processing framework is illustrated in Figure 2. The left part illustrates the single-polarization strategy, and the right part represents the enhanced multi-polarization pathway. Presenting both approaches in a unified flowchart facilitates direct comparison and highlights the improvements introduced by the multi-polarization optimization. The following subsections provide detailed descriptions of the two processing strategies.

3.1. Single-Polarization MT-InSAR Method

The MT-InSAR process began with precise co-registration and differential interferometry of the raw SAR images, followed by filtering the interferograms to enhance the quality of the interferometric phase.
To further improve phase coherence, the FaSHPS method [33] was used to identify homogeneous pixels. PS targets were processed separately from DS targets to avoid filtering effects. If a pixel cluster contained fewer than 25 homogeneous pixels, it was classified as a PS target, and only pixels with an Amplitude Dispersion Index (ADI) below 0.15 were retained. Conversely, pixel clusters with more than 25 homogeneous pixels were treated as DS candidates and underwent spatial filtering. The EMI method was then applied to reconstruct the interferometric phase series, and high-coherence targets were selected as final DS targets. Finally, PS and DS were combined to reconstruct short-baseline interferograms for deformation analysis. The spatiotemporal baseline diagram (Figure 3) illustrates the distribution of interferometric pairs with respect to acquisition time and perpendicular baseline, which visualizes interferogram selection.
For deformation inversion, the Minimum Cost Flow (MCF) method [34] was used for phase unwrapping. Given the study area’s complex terrain and large spatial extent, a single model is insufficient to effectively correct topography-related atmospheric phase errors. To address this, a block-based modeling approach [35] was adopted, where the study area was divided into smaller regions, and model parameters were estimated separately to remove atmospheric delays, combined with orbital error correction [36]. Then, the Singular Value Decomposition (SVD) method was employed to solve the time-series deformation equation, followed by spatiotemporal filtering to suppress turbulent atmospheric noise, ultimately yielding the final deformation rate and time-series deformation results.

3.2. MT-PolInSAR Method

Building upon the MT-InSAR framework, the proposed MT-PolInSAR method enhances deformation monitoring performance in densely vegetated and low-coherence areas by exploiting the additional information contained in fully polarimetric SAR data. Specifically, polarization diversity is utilized to refine PS and DS target selection and improve phase optimization accuracy. Within this framework, two key components are adopted to enhance the processing pipeline: the Trace-Moment-Based (TM) method [37] for PS identification and the TP method [31] for phase optimization. These techniques, previously validated in related studies [31,37], are integrated into a unified MT-PolInSAR architecture. The following subsections detail the corresponding optimization strategies.
For fully polarimetric SAR data, the scattering matrix of a single pixel is expressed as a polarization scattering vector:
k = 1 2 [ S H H + S V V    S H H S V V    2 S H V ] T
where S H H and S V V represent the backscattering signal in HH and VV polarization, respectively. For symmetric scatterers, the cross-polarization terms satisfy S H V = S V H .
The polarimetric covariance matrix (PCM) is defined as
T = 1 N N n = 1 k n k n H
where N denotes the number of observation samples and H represents the conjugate transpose. This matrix captures the amplitude, phase, and polarization properties, facilitating a more accurate representation of the target’s scattering behavior. Consequently, it contributes to improved homogeneous pixel identification, PS target selection, and phase optimization.

3.2.1. Homogeneous Pixel Identification

Traditional single-polarization methods rely solely on amplitude information, neglecting phase and polarization characteristics. In contrast, the PCM incorporates amplitude, phase, and polarimetric information, enabling a more comprehensive characterization of target scattering properties and improving the accuracy of homogeneous pixel identification.
Given N SAR images, the scattering vector of each pixel follows a zero-mean complex Gaussian distribution, with the corresponding PCM T obeying a Wishart distribution. To determine whether the PCM of two adjacent pixels originates from the same statistical distribution, a Likelihood Ratio Test (LRT) is applied, facilitating the identification of homogeneous pixels. The test is formulated as follows:
Λ = T i N i T j N j N i T i + N j T j N i + N j N i + N j
where N i and N j represent the number of samples for pixels i and j , respectively, and T i and T j are their corresponding PCM. If Λ exceeds a predefined threshold, the two pixels are considered homogeneous.

3.2.2. PS Target Refinement

In PS target selection, early approaches primarily relied on the Amplitude Dispersion Index (ADI), which is based solely on single-polarization amplitude. However, this approach requires a large number of SAR images to ensure the stability of PS target selection. To address this limitation, the TM method [37], based on the PCM, was adopted in this study for PS selection. This approach not only integrates polarization information but also reduces dependence on the number of SAR acquisitions. The equivalent ADI for the TM is calculated as follows:
A D I T M = 0.5227 / T r Σ 2 1 N N i = 1 T r T i T i T r Σ Σ
where the temporally averaged polarimetric coherence matrix Σ is defined as
Σ = 1 N N i = 1 T i
where N represents the number of SAR images and T r ( g ) denotes the trace operator. Notably, for PS target selection, the PCM does not require multi-look estimation.

3.2.3. Multi-Polarization Phase Optimization

Phase optimization in InSAR processing has conventionally been performed using single-polarization interferometric covariance matrices (ICMs). However, with multi-polarization data, ICMs for different polarization channels can be leveraged to enhance the optimization process. By stacking the ICMs of different polarizations [38], further refinement in phase optimization can be achieved. In one study, a theoretical analysis based on the Cramér–Rao Lower Bound [39] indicated that the phase variance in the fully polarimetric case can be reduced to approximately one-third of that in the single-polarization case; in practice, due to inter-channel correlation and noise, the actual improvement typically ranges from 33% to 100% of the single-polarization phase variance [40,41]. The final ICM is formulated as follows:
C T P = i q K i K i H
where K i = [ S i 1 S i 2 S i N ] T represents the time-series observation vector of the i-th polarization channel and q denotes the number of polarization channels. Then, the single-polarization ICM can be replaced by the optimized ICM for phase reconstruction using the EMI method. Finally, the deformation inversion stage remains consistent with the MT-InSAR, as illustrated in Figure 2.

4. Results

This section presents the deformation results derived from the processed time-series InSAR data. The analysis includes both the spatial distribution of the average deformation rate and the temporal evolution of displacement at selected sites. Here, the average deformation rate refers to the annual velocity along the line-of-sight (LOS) direction, derived from time-series displacement via linear regression and expressed in cm/year. Deformation locations are labeled numerically (e.g., P01–P32) for clarity and ease of reference. The results are organized into two parts: first, the spatial distribution of the mean deformation rate is assessed across the study area, and the accuracy of identified sites is evaluated based on the filed verification; second, detailed time-series deformation profiles are analyzed for representative landslide and subsidence sites, with validation using optical imagery and field surveys.

4.1. Average LOS Deformation Rate in the Study Area

Using the proposed MT-PolInSAR technique, this study derived the annual mean deformation rate for the Yuanjiang Basin in Northwestern Hunan from May 2021 to June 2022 (Figure 4). The results reveal that landslides are primarily concentrated in the northwestern mountainous areas and along the Yuanjiang River, with the deformation rate generally ranging between −4 cm/year and −2 cm/year. The deformation magnitudes are relatively small, and the affected areas are limited. Additionally, the deformation patterns derived from both methods are highly consistent. However, the MT-PolInSAR approach significantly increases the density of monitoring points, demonstrating that ability of multi-polarization technology to enhance interferometric phase quality and mitigate the effects of decorrelation, thereby improving monitoring accuracy.
In addition, the field investigations verify 32 potential deformation sites, including 18 landslide-prone locations, 8 deformation sites caused by human activities, and 6 misidentified points, yielding an overall deformation detection accuracy of 81.25% (Table 2). The 18 landslide-prone sites are primarily located in northwestern mountainous areas, along the Yuanjiang River, and in steep slope regions, where topographic and hydrological conditions contribute to active landslide movements. Among these, ten landslide locations align with previously recorded geological hazard sites [42], while eight newly identified landslides (e.g., P08, P13, P14, P18, P21, P29, P31, and P32) were confirmed on-site as having potential risks, further validating the effectiveness of this method in landslide identification.
Additionally, eight other deformation sites (e.g., P03, P15, P16, P17, P22, P27, P28, and P30) were found to be closely associated with human-induced activities such as earth excavation, soil accumulation, mining operations, and agricultural practices [42], indicating that InSAR methods can effectively detect various types of surface deformation beyond landslide monitoring. Conversely, six sites (e.g., P04, P05, P06, P11, P25, and P26) showed no significant deformation signs during field inspection. This discrepancy may be attributed to surface cover changes, data noise, or limitations of the InSAR technique in specific terrain conditions.

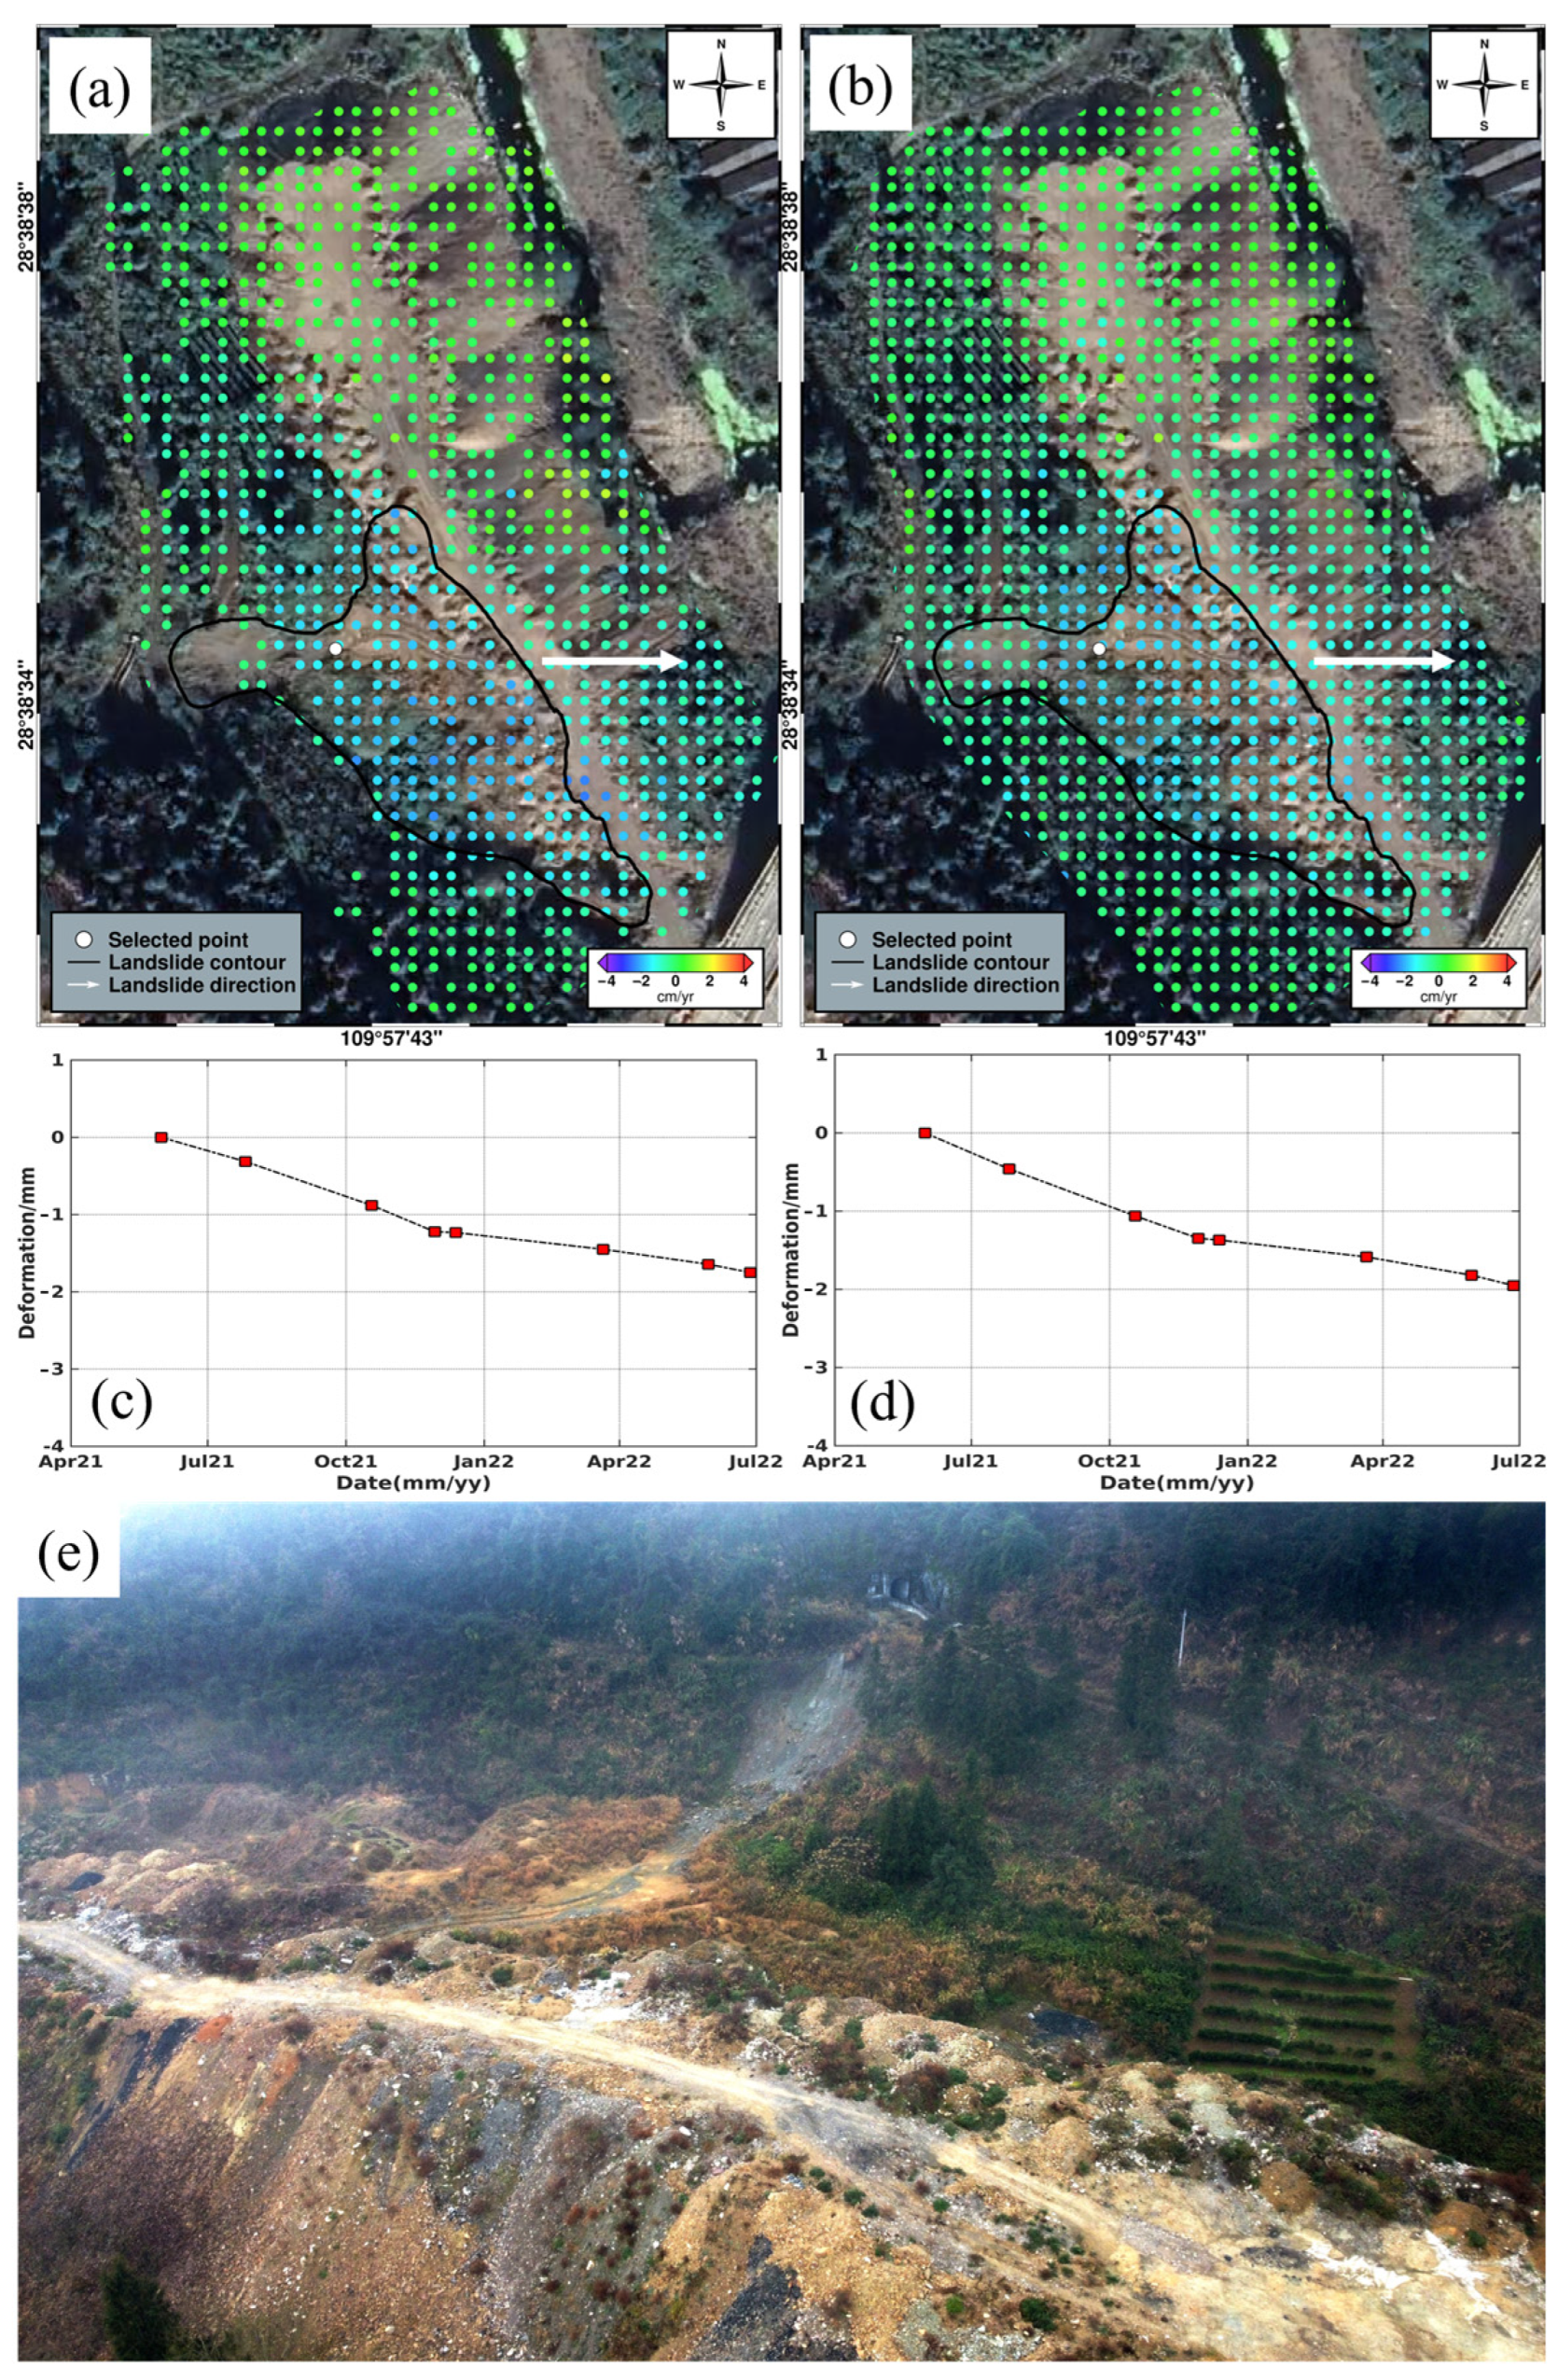
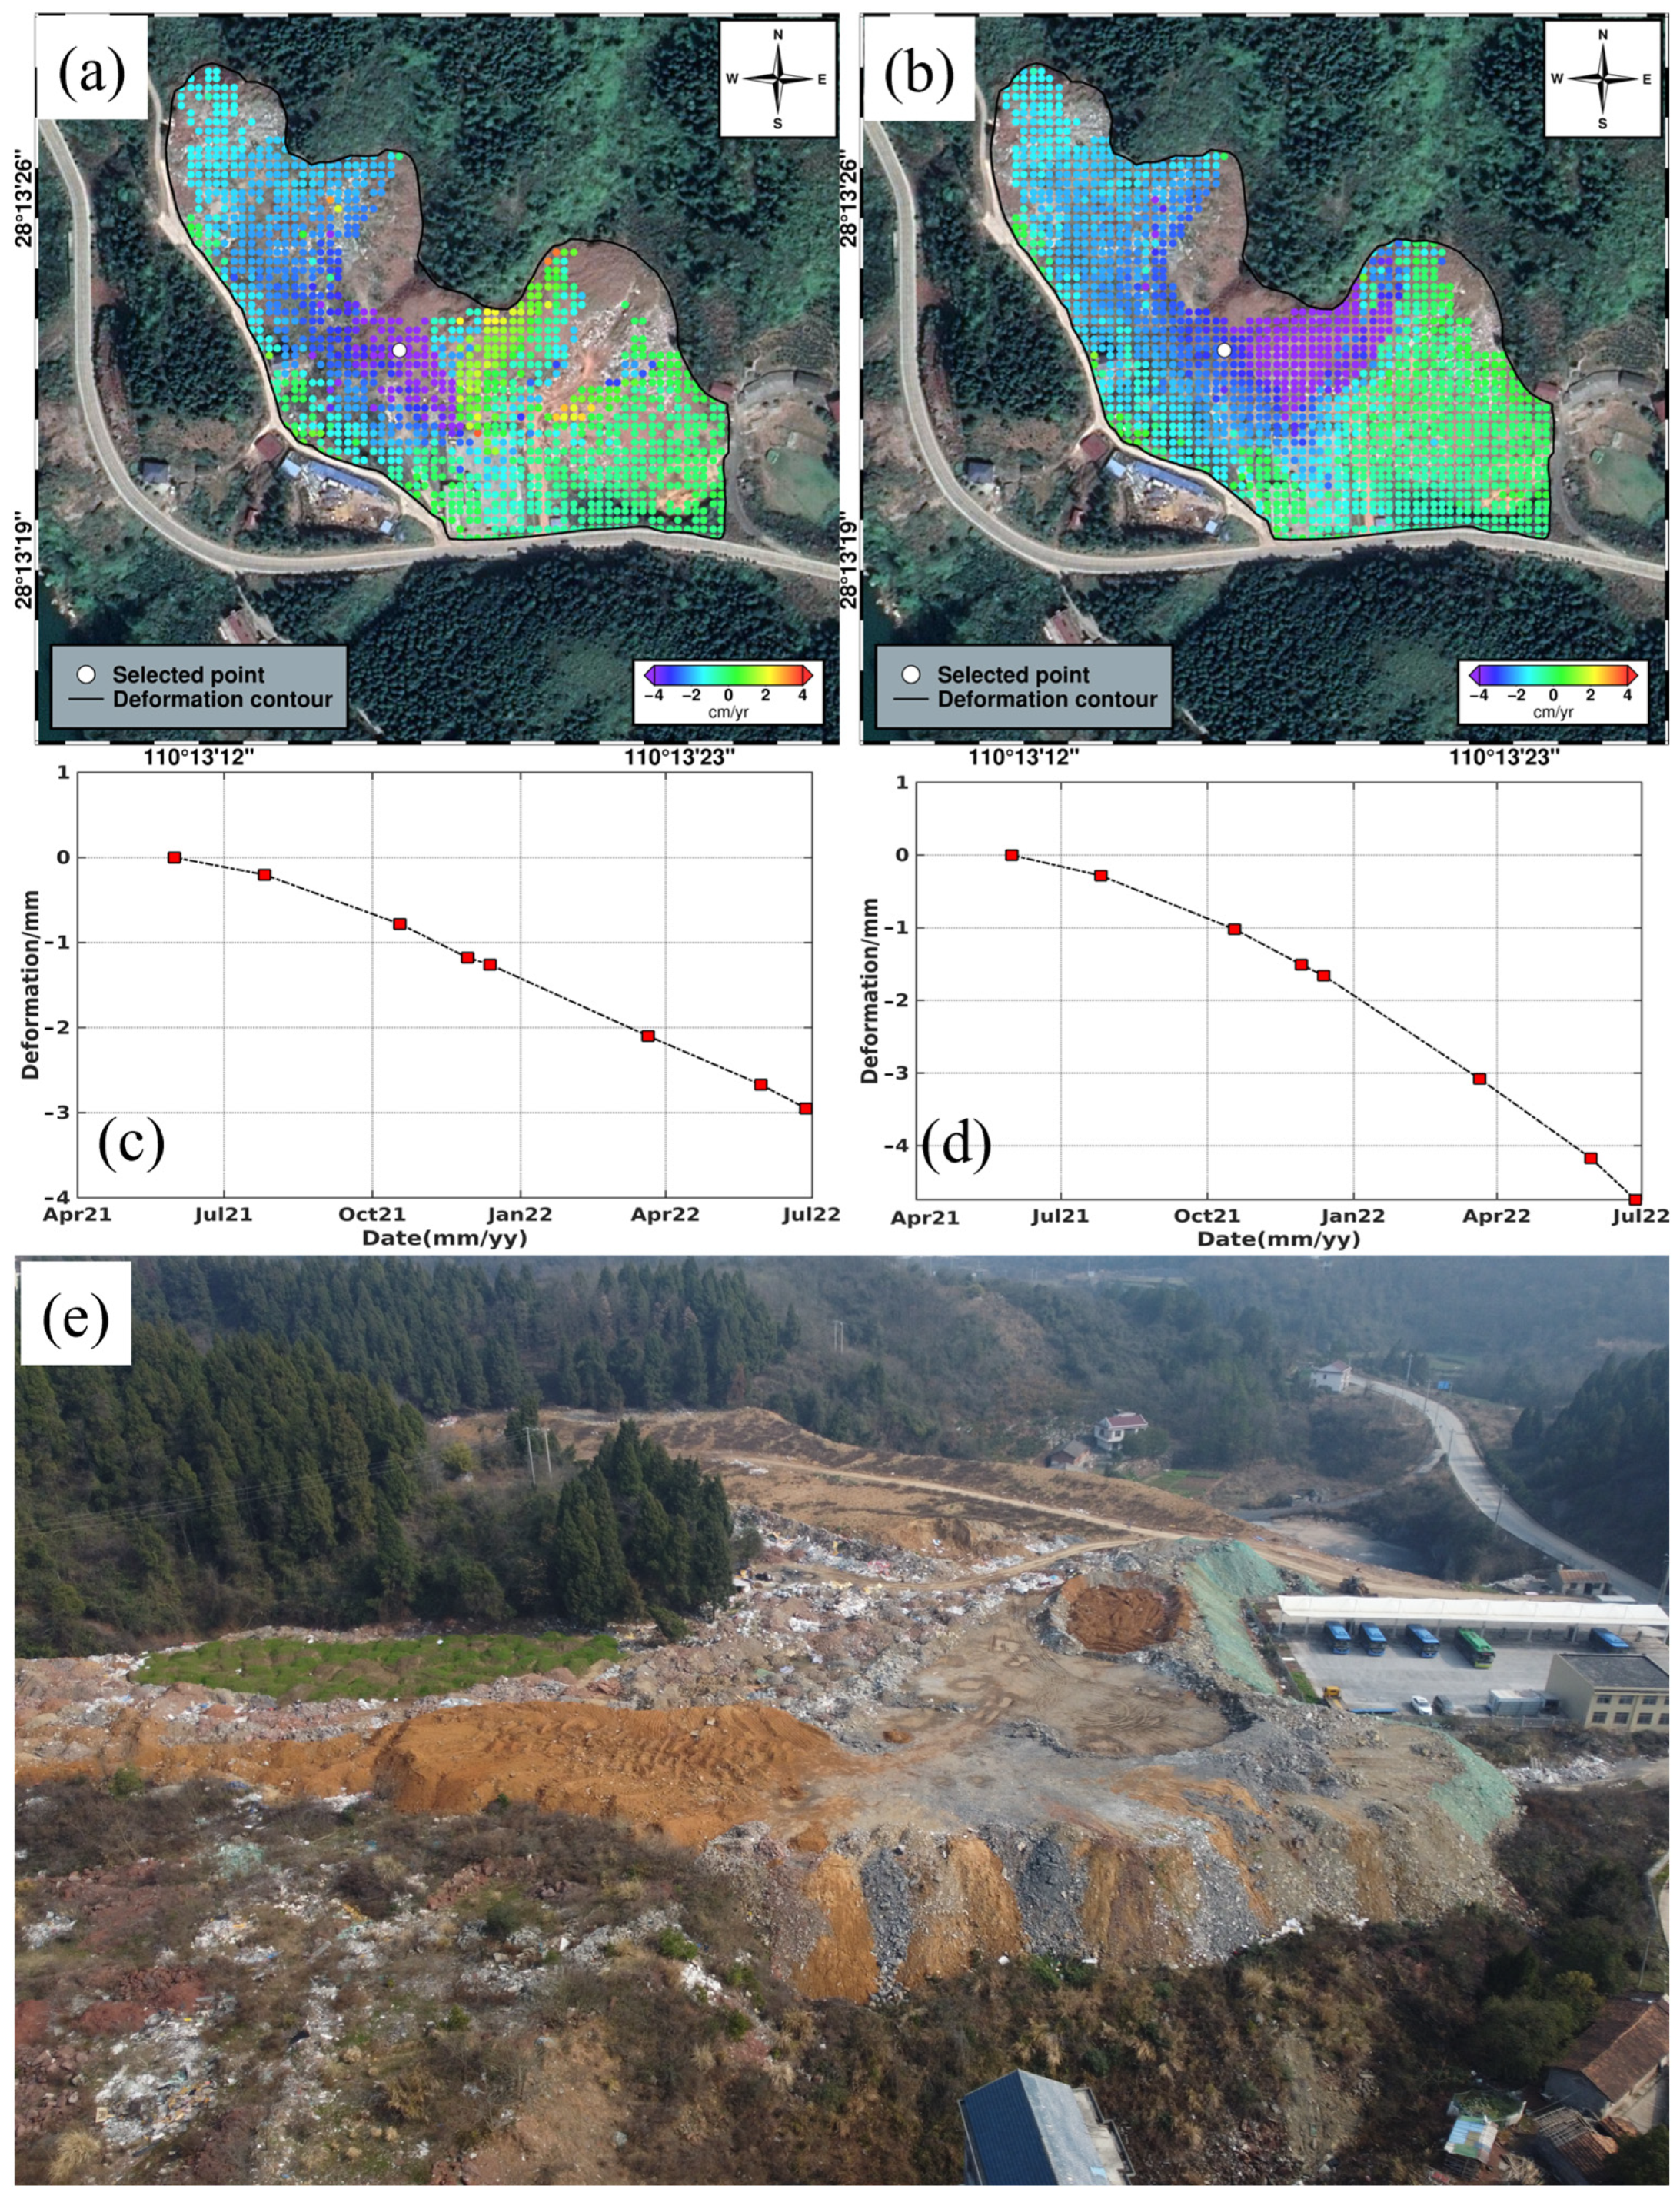
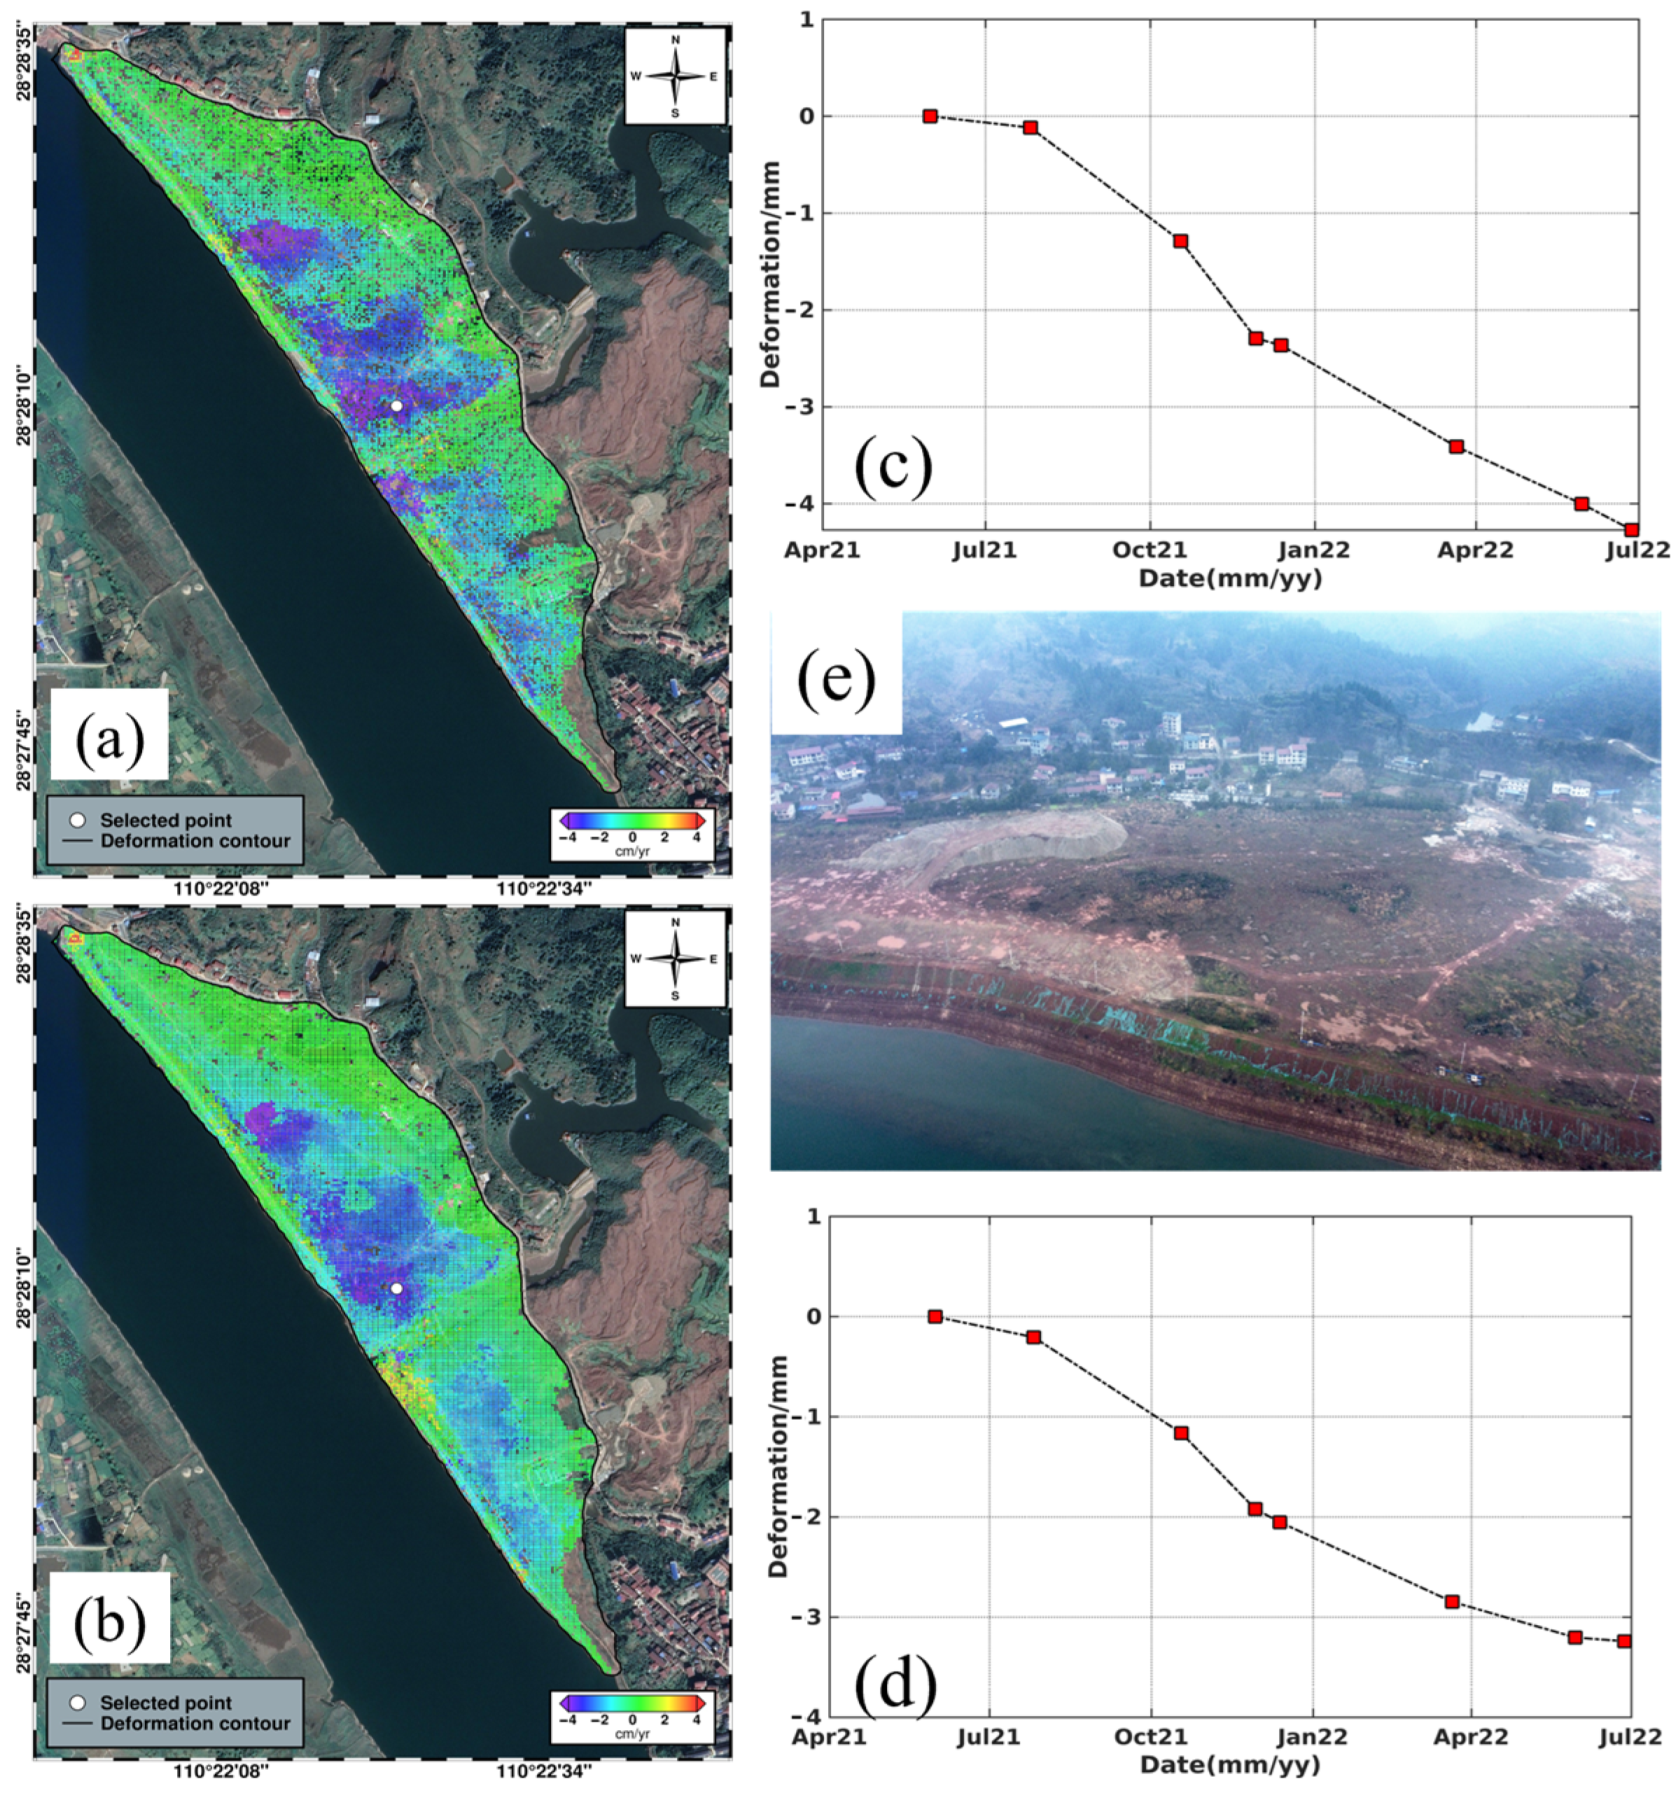
4.2. Time-Series Deformation Analysis of Potential Hazard Sites

To further evaluate the effectiveness of the MT-PolInSAR method, two representative landslide sites (P29 and P30) were selected for a time-series analysis. These sites exhibit clear deformation signals, high-density coherent targets, and typical terrain and vegetation characteristics of the study area. The deformation results are overlaid on high-resolution satellite imagery, while a filed survey photo is provided for validation purposes (Figure 5 and Figure 6). In both regions, the maximum cumulative deformation during the observation period falls between −4 cm and −2 cm. Optical images reveal that the landslide boundaries are clearly visible, slopes appear loose, and localized displacement signs are evident, corroborating the deformation detection results derived from the InSAR analysis.
A comparison between the MT-InSAR and MT-PolInSAR results at site P30 further illustrates the advantages of the proposed method. In the northeastern section of P30, the density of monitoring points in the single-polarization results was significantly lower, with some deformation zones even lacking coverage entirely. In contrast, the MT-PolInSAR method provides a denser and more continuous distribution of monitoring points, resulting in a more comprehensive and accurate depiction of deformation. These findings highlight the significant advantages of MT-PolInSAR in increasing monitoring coverage, minimizing decorrelation effects, and enhancing landslide identification capabilities.
Moreover, deformation patterns in P15 and P16 are primarily associated with ground subsidence or engineering activities, exhibiting higher deformation magnitudes, particularly in construction-intensive areas (Figure 7 and Figure 8). In P15, the MT-InSAR method displays noticeable phase unwrapping errors in certain areas, leading to abrupt variations in the deformation rate. Conversely, the multi-polarization method effectively mitigates these errors, yielding smoother and more reliable results. This suggests that MT-PolInSAR enhances monitoring stability, particularly in complex terrain environments. Similarly, in P16, the multi-polarization method demonstrates more monitoring points and enables a more comprehensive detection of ground deformation caused by construction activities. Field survey imagery confirmed frequent earthwork activities, including excavation, soil accumulation, and road construction, aligning well with the result via InSAR analysis.
A comprehensive evaluation of the results underscores the advantages of the MT-PolInSAR technique, not only in effectively identifying landslide-prone areas but also in monitoring ground deformation resulting from human engineering activities. This makes the technique particularly suitable for landslide hazard detection in densely vegetated and topographically complex regions.

5. Discussion

The experimental results presented above confirm that the proposed MT-PolInSAR method offers clear advantages over single-polarization MT-InSAR in challenging environments characterized by dense vegetation and complex terrain. In this section, we further analyze the benefits and limitations of the method from three key perspectives: interferometric phase quality, monitoring point density, and operational feasibility. Through quantitative comparison and practical considerations, we aim to provide a more comprehensive understanding of the method’s strengths, application scope, and future development potential.

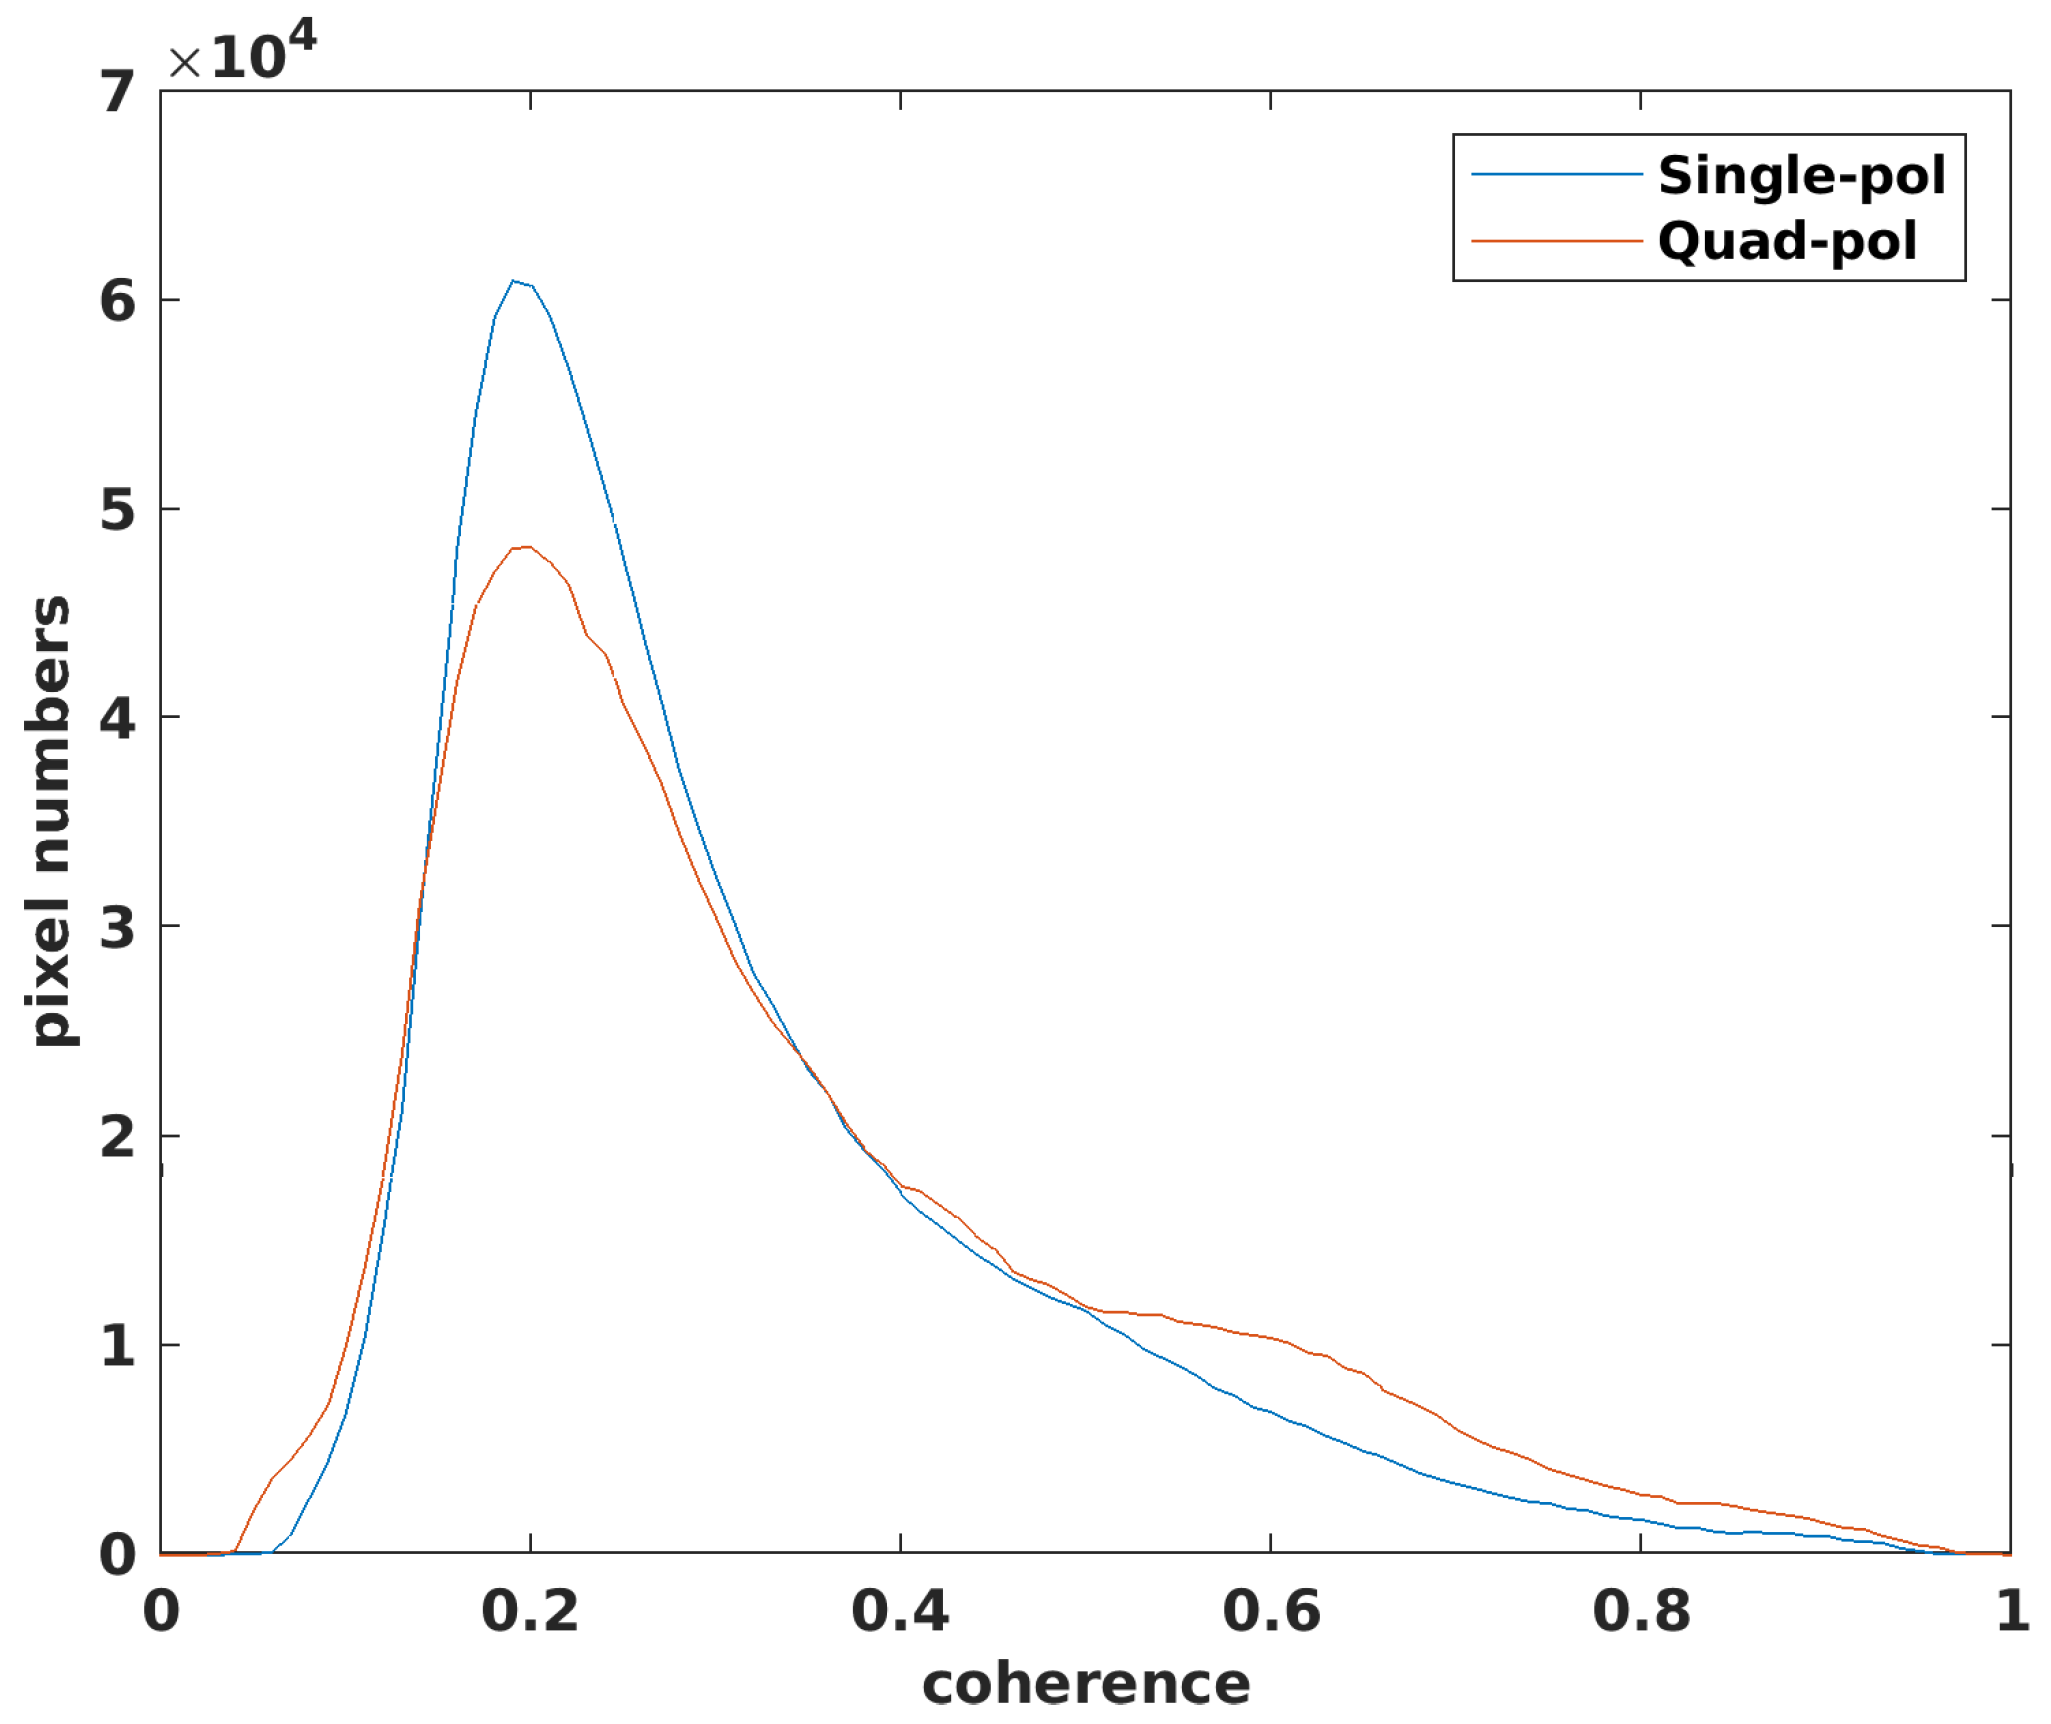
5.1. Interferometric Phase Quality

To evaluate the impact of the MT-PolInSAR method on interferometric phase quality, a representative region of interest (ROI) was selected for analysis (highlighted by the red box in Figure 1). The results, presented in Figure 9, compare the interferometric phases obtained using the single-polarization and multi-polarization methods. In the MT-InSAR approach, severe decorrelation due to vegetation coverage and complex terrain is evident, resulting in significant phase noise in certain regions. Conversely, the MT-PolInSAR method yields an optimized interferometric phase with higher coherence, reduced noise levels, and improved clarity in localized details, demonstrating the benefits of incorporating multi-polarization information.
To quantitatively assess this improvement, the probability distribution of interferometric coherence was computed (Figure 10). The results indicate that, in the single-polarization method, coherence values are predominantly concentrated in the lower range (0.1–0.3), with relatively few high-coherence pixels. This suggests that the single-polarization approach struggles to maintain phase stability in complex areas. In contrast, the MT-PolInSAR method significantly enhances coherence in low-coherence regions, shifting the pixel distribution toward higher coherence values. This improvement highlights the ability of the multi-polarization technique to mitigate decorrelation effects and enhance the reliability of InSAR deformation monitoring. Therefore, in areas with dense vegetation and rugged topography, the MT-PolInSAR approach demonstrates superior performance in terms of interferometric phase quality and monitoring stability.

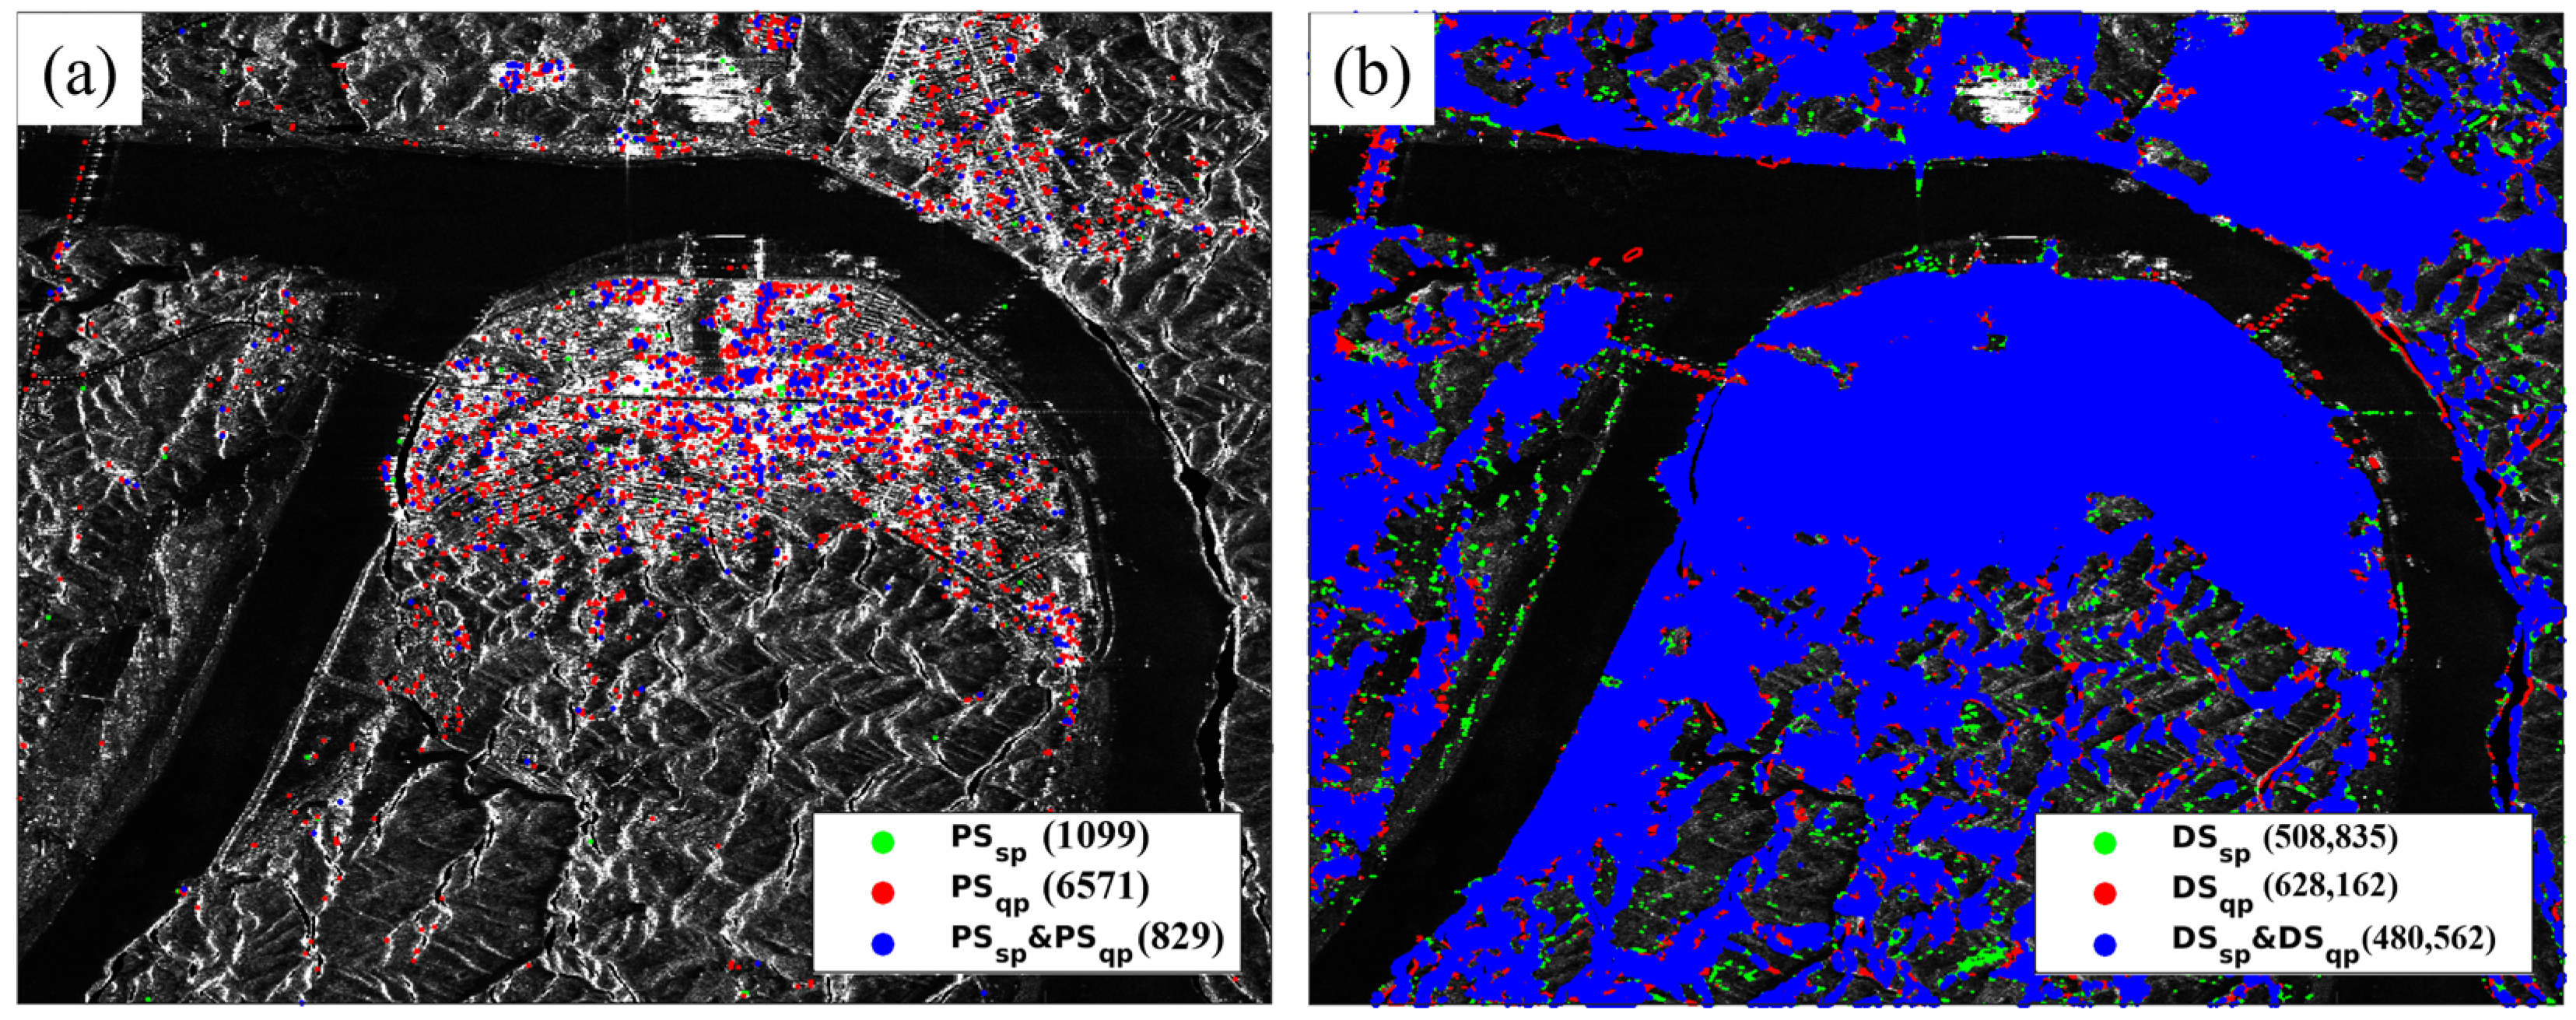
5.2. Density of Monitoring Points

To assess the optimization effects of the MT-PolInSAR method relative to the single-polarization approach, this study conducted a comparative analysis of PS and DS target selection strategies. The spatial distributions of PS and DS points identified by both methods are shown in Figure 11.
For PS target selection, the MT-InSAR method identified only 1099 PS points, whereas the MT-PolInSAR method significantly increased this number to 6571. Additionally, only 829 PS points were commonly detected by both methods, indicating that the multi-polarization approach substantially broadens the selection range of PS targets. The traditional single-polarization ADI method relies solely on single-polarimetric amplitude, whereas the TM method incorporates multi-polarization data. This integration enhances PS point stability and reliability, significantly increasing the number of high-coherence targets and improving deformation monitoring capabilities.
For DS target selection, the results reveal that the MT-InSAR method identified 508,835 DS points, whereas the MT-PolInSAR method significantly increased this number to 628,162, with 480,562 DS points common to both methods. These findings confirm that the multi-polarization approach outperforms the single-polarization method in DS target selection by identifying a greater number of monitoring points, particularly in highly vegetated and decorrelated regions. Consequently, this enhancement improves spatial coverage and surface deformation monitoring accuracy.
Overall, the results highlight the substantial advantages of the MT-PolInSAR method over single-polarization techniques in both PS and DS target selection. By detecting a significantly higher density of monitoring points, the method is particularly well-suited for geologically complex and densely vegetated areas. This capability enables higher monitoring coverage and more comprehensive deformation assessments, making it a valuable tool for landslide hazard detection and monitoring in challenging environments.

5.3. Operational Considerations for Full-Polarization InSAR

While the proposed MT-PolInSAR method significantly improves deformation detection performance, particularly in low-coherence, vegetation-covered regions, it is also important to acknowledge the practical limitations of using fully polarimetric SAR data. Compared to single- or dual-polarization modes, full-polarization acquisitions typically feature a reduced swath width (e.g., from ~70 km to ~30 km) and longer revisit intervals, potentially leading to increased data acquisition costs and reduced temporal resolution in operational applications. In this context, full-polarization InSAR may not be universally necessary across the entire study region. Instead, its use is most justified in areas where traditional single-polarization methods struggle—namely, densely vegetated zones exhibiting low coherence but active slope movements. Identifying and quantifying these high-priority areas could help optimize future monitoring strategies.
Furthermore, it would be valuable to compare the effectiveness of full-polarization monitoring against alternatives such as increasing acquisition frequency using single-polarization modes. However, the relatively small number of available full-polarization SAR acquisitions in this study limits our ability to conduct such a comparative analysis. Future research, with access to more extensive datasets, could systematically evaluate these trade-offs and support the design of cost-effective and targeted InSAR monitoring strategies.

6. Conclusions

This study demonstrates that MT-PolInSAR significantly enhances deformation monitoring in complex terrains by mitigating the limitations of single-polarization InSAR, such as severe decorrelation and low monitoring point density. Experimental validation using ALOS-2 data confirms its capability to detect small-magnitude landslides (−4 to −2 cm/year) with improved coherence and spatial coverage. A total of 32 suspected landslide sites were identified, with field investigations confirming the accuracy of 26 locations, further validating the method’s reliability. By leveraging multi-polarization information, this approach significantly increases the number of PS and DS points, thereby improving deformation detection sensitivity and spatial completeness. While the method is constrained by the long temporal baselines of ALOS-2 (~128 days), future advancements in high-revisit SAR missions (e.g., NISAR) are expected to enhance temporal resolution, further improving monitoring continuity and real-time geohazard assessment.

Author Contributions

Conceptualization, B.L. and Y.C.; methodology, B.L. and Y.C.; validation T.Y. and C.W.; formal analysis, Z.Q. and W.Y.; visualization, Y.T.; writing—original draft preparation, B.L. and Y.C.; writing—review and editing, all authors; supervision, Y.C., and J.H.; funding acquisition, B.L., Y.C. and J.H. All authors have read and agreed to the published version of the manuscript.

Funding

This research was funded by the National Natural Science Foundation of China (42030112), the Hunan Provincial Natural Science Foundation (2024JJ8375 and 2023JJ60562), the Scientific Research Project of the Hunan Institute of Geology (HNGSTP202106), the major scientific and technological projects of the Hunan Geological Institute (HNGSTP202303), the China Scholarship Council (202306370020), and the Innovation Foundation for Postgraduate of Central South University (1053320231689).

Data Availability Statement

The datasets presented in this article are not readily available because the data are part of an ongoing study. Requests to access the datasets should be directed to JAXA (Japan Aerospace Exploration Agency).

Acknowledgments

The multi-polarization ALOS-2/PALSAR-2 datasets were provided by JAXA.

Conflicts of Interest

The authors declare no conflicts of interest.

References

  1. Hu, J.; Li, Z.W.; Sun, Q.; Zhu, J.J.; Ding, X.L. Three-Dimensional Surface Displacements from Insar and GPS Measurements with Variance Component Estimation. IEEE Geosci. Remote Sens. Lett. 2012, 9, 754–758. [Google Scholar] [CrossRef]
  2. Sun, Q.; Zhang, L.; Ding, X.L.; Hu, J.; Li, Z.W.; Zhu, J.J. Slope Deformation Prior to Zhouqu, China Landslide from InSAR Time Series Analysis. Remote Sens. Environ. 2015, 156, 45–57. [Google Scholar] [CrossRef]
  3. Zhao, R.; Li, Z.-W.; Feng, G.-C.; Wang, Q.-J.; Hu, J. Monitoring Surface Deformation over Permafrost with an Improved SBAS-InSAR Algorithm: With Emphasis on Climatic Factors Modeling. Remote Sens. Environ. 2016, 184, 276–287. [Google Scholar] [CrossRef]
  4. Minh, D.H.T.; Hanssen, R.; Rocca, F. Radar Interferometry: 20 Years of Development in Time Series Techniques and Future Perspectives. Remote Sens. 2020, 12, 1364. [Google Scholar] [CrossRef]
  5. Ferretti, A.; Prati, C.; Rocca, F. Nonlinear Subsidence Rate Estimation Using Permanent Scatterers in Differential SAR Interferometry. IEEE Trans. Geosci. Remote Sens. 2000, 38, 2202–2212. [Google Scholar] [CrossRef]
  6. Ferretti, A.; Prati, C.; Rocca, F. Permanent Scatterers in SAR Interferometry. IEEE Trans. Geosci. Remote Sens. 2001, 39, 8–20. [Google Scholar] [CrossRef]
  7. Berardino, P.; Fornaro, G.; Lanari, R.; Sansosti, E. A New Algorithm for Surface Deformation Monitoring Based on Small Baseline Differential SAR Interferograms. IEEE Trans. Geosci. Remote Sens. 2002, 40, 2375–2383. [Google Scholar] [CrossRef]
  8. Ferretti, A.; Fumagalli, A.; Novali, F.; Prati, C.; Rocca, F.; Rucci, A. A New Algorithm for Processing Interferometric Data-Stacks: SqueeSAR. IEEE Trans. Geosci. Remote Sens. 2011, 49, 3460–3470. [Google Scholar] [CrossRef]
  9. Bui, L.K.; Featherstone, W.E.; Filmer, M.S. Disruptive Influences of Residual Noise, Network Configuration and Data Gaps on InSAR-Derived Land Motion Rates Using the SBAS Technique. Remote Sens. Environ. 2020, 247, 111941. [Google Scholar] [CrossRef]
  10. Lee, J.C.; Shirzaei, M. Novel Algorithms for Pair and Pixel Selection and Atmospheric Error Correction in Multitemporal InSAR. Remote Sens. Environ. 2023, 286, 113447. [Google Scholar] [CrossRef]
  11. Danisor, C.; Pauciullo, A.; Reale, D.; Fornaro, G. Detection of Distributed Scatterers in Multitemporal SAR Interferometry: A Comparison between Caesar and Squeesar Detectors. IEEE Trans. Geosci. Remote Sens. 2023, 61, 5220415. [Google Scholar] [CrossRef]
  12. Sowter, A.; Bateson, L.; Strange, P.; Ambrose, K.; Fifiksyafiudin, M. Dinsar Estimation of Land Motion Using Intermittent Coherence with Application to the South Derbyshire and Leicestershire Coalfields. Remote Sens. Lett. 2013, 4, 979–987. [Google Scholar] [CrossRef]
  13. Zhang, B.; Chang, L.; Stein, A. A Model-Backfeed Deformation Estimation Method for Revealing 20-Year Surface Dynamics of the Groningen Gas Field Using Multi-Platform SAR Imagery. Int. J. Appl. Earth Obs. Geoinf. 2022, 111, 102847. [Google Scholar] [CrossRef]
  14. Hu, J.; Ge, Q.; Liu, J.; Yang, W.; Du, Z.; He, L. Constructing Adaptive Deformation Models for Estimating Dem Error in Sbas-Insar Based on Hypothesis Testing. Remote Sens. 2021, 13, 2006. [Google Scholar] [CrossRef]
  15. Liu, Y.; Zhao, C.; Zhang, Q.; Lu, Z.; Zhang, J. A Constrained Small Baseline Subsets (CSBAS) InSAR Technique for Multiple Subsets. Eur. J. Remote Sens. 2020, 53, 14–26. [Google Scholar] [CrossRef]
  16. Zheng, Y.; Zebker, H.; Michaelides, R. A New Decorrelation Phase Covariance Model for Noise Reduction in Unwrapped Interferometric Phase Stacks. IEEE Trans. Geosci. Remote Sens. 2021, 59, 10126–10135. [Google Scholar] [CrossRef]
  17. Fornaro, G.; Verde, S.; Reale, D.; Pauciullo, A. CAESAR: An Approach Based on Covariance Matrix Decomposition to Improve Multibaseline-Multitemporal Interferometric SAR Processing. IEEE Trans. Geosci. Remote Sens. 2015, 53, 2050–2065. [Google Scholar] [CrossRef]
  18. Cao, N.; Lee, H.; Jung, H.C. A Phase-Decomposition-Based PSInSAR Processing Method. IEEE Trans. Geosci. Remote Sens. 2016, 54, 1074–1090. [Google Scholar] [CrossRef]
  19. Samiei-Esfahany, S.; Martins, J.E.; Van Leijen, F.; Hanssen, R.F. Phase Estimation for Distributed Scatterers in InSAR Stacks Using Integer Least Squares Estimation. IEEE Trans. Geosci. Remote Sens. 2016, 54, 5671–5687. [Google Scholar] [CrossRef]
  20. Narayan, A.B.; Tiwari, A.; Dwivedi, R.; Dikshit, O. A Novel Measure for Categorization and Optimal Phase History Retrieval of Distributed Scatterers for InSAR Applications. IEEE Trans. Geosci. Remote Sens. 2018, 56, 5843–5849. [Google Scholar] [CrossRef]
  21. Ansari, H.; De Zan, F.; Bamler, R. Efficient Phase Estimation for Interferogram Stacks. IEEE Trans. Geosci. Remote Sens. 2018, 56, 4109–4125. [Google Scholar] [CrossRef]
  22. Navarro-Sanchez, V.D.; Lopez-Sanchez, J.M.; Vicente-Guijalba, F. A Contribution of Polarimetry to Satellite Differential SAR Interferometry: Increasing the Number of Pixel Candidates. IEEE Geosci. Remote Sens. Lett. 2010, 7, 276–280. [Google Scholar] [CrossRef]
  23. Iglesias, R.; Monells, D.; Lopez-Martinez, C.; Mallorqui, J.J.; Fabregas, X.; Aguasca, A. Polarimetric Optimization of Temporal Sublook Coherence for DInSAR Applications. IEEE Geosci. Remote Sens. Lett. 2015, 12, 87–91. [Google Scholar] [CrossRef]
  24. Sadeghi, Z.; Valadan Zoej, M.J.; Hooper, A.; Lopez-Sanchez, J.M. A New Polarimetric Persistent Scatterer Interferometry Method Using Temporal Coherence Optimization. IEEE Trans. Geosci. Remote Sens. 2018, 56, 6547–6555. [Google Scholar] [CrossRef]
  25. Zhao, F.; Mallorqui, J.J. Coherency Matrix Decomposition-Based Polarimetric Persistent Scatterer Interferometry. IEEE Trans. Geosci. Remote Sens. 2019, 57, 7819–7831. [Google Scholar] [CrossRef]
  26. Zhao, F.; Mallorqui, J.J.; Lopez-Sanchez, J.M. Impact of SAR Image Resolution on Polarimetric Persistent Scatterer Interferometry with Amplitude Dispersion Optimization. IEEE Trans. Geosci. Remote Sens. 2022, 60, 5202810. [Google Scholar] [CrossRef]
  27. Zhang, Z.; Jiang, X.; Wang, M.; Liu, X.; Wang, Q.; Li, R. A Phase-Decomposition-Based Polarimetric Coherence Optimization Method. Int. J. Appl. Earth Obs. Geoinf. 2022, 110, 102771. [Google Scholar] [CrossRef]
  28. Luo, J.; Lopez-Sanchez, J.M.; De Zan, F.; Mallorqui, J.J.; Tomas, R. Assessment of the Contribution of Polarimetric Persistent Scatterer Interferometry on Sentinel-1 Data. IEEE J. Sel. Top. Appl. Earth Obs. Remote Sens. 2022, 15, 7997–8009. [Google Scholar] [CrossRef]
  29. Luo, J.; Lopez-Sanchez, J.M.; De Zan, F. Analysis of the Performance of Polarimetric PSI over Distributed Scatterers with Sentinel-1 Data. Int. J. Appl. Earth Obs. Geoinf. 2023, 125, 103581. [Google Scholar] [CrossRef]
  30. Zhang, L.; Zhao, F.; Wang, Y.; Zhang, Y.; Hu, Z.; Du, S.; Fernández, J. Adaptive polarimetric optimization for ground deformation monitoring using multi-temporal InSAR with dual-polarization sentinel-1. Int. J. Digit. Earth 2025, 18, 2447335. [Google Scholar] [CrossRef]
  31. Shen, P.; Wang, C.; Hu, J. A Polarization Stacking Method for Optimizing Time-Series Interferometric Phases of Distributed Scatterers. Remote Sens. 2022, 14, 4168. [Google Scholar] [CrossRef]
  32. Shen, P.; Wang, C.; Hu, C.; Hu, J.; Fu, H.; Zhu, J. JPPL: A Joint-Polarization Phase Linking Algorithm for Phase Optimization of TSPolInSAR Data. Int. J. Appl. Earth Obs. Geoinf. 2022, 112, 102889. [Google Scholar] [CrossRef]
  33. Jiang, M.; Ding, X.; Hanssen, R.F.; Malhotra, R.; Chang, L. Fast Statistically Homogeneous Pixel Selection for Covariance Matrix Estimation for Multitemporal InSAR. IEEE Trans. Geosci. Remote Sens. 2015, 53, 1213–1224. [Google Scholar] [CrossRef]
  34. Costantini, M. A Novel Phase Unwrapping Method Based on Network Programming. IEEE Trans. Geosci. Remote Sens. 1998, 36, 813–821. [Google Scholar] [CrossRef]
  35. Bekaert, D.P.S.; Hooper, A.; Wright, T.J. A Spatially Variable Power Law Tropospheric Correction Technique for InSAR Data. J. Geophys. Res. Solid Earth 2015, 120, 1345–1356. [Google Scholar] [CrossRef]
  36. Zhang, L.; Ding, X.; Lu, Z.; Jung, H.S.; Hu, J.; Feng, G. A Novel Multitemporal Insar Model for Joint Estimation of Deformation Rates and Orbital Errors. IEEE Trans. Geosci. Remote Sens. 2014, 52, 3529–3540. [Google Scholar] [CrossRef]
  37. Shen, P.; Wang, C.; Lu, L.; Luo, X.; Hu, J.; Fu, H.; Zhu, J. A Novel Polarimetric PSI Method Using Trace Moment-Based Statistical Properties and Total Power Interferogram Construction. IEEE Trans. Geosci. Remote Sens. 2022, 60, 4402815. [Google Scholar] [CrossRef]
  38. Marino, A. Trace Coherence: A New Operator for Polarimetric and Interferometric SAR IMAGES. IEEE Trans. Geosci. Remote Sens. 2017, 55, 2326–2339. [Google Scholar] [CrossRef]
  39. Hanssen, R.F. Radar Interferometry: Data Interpretation and Error Analysis; Springer Science & Business Media: Berlin/Heidelberg, Germany, 2001. [Google Scholar]
  40. Shen, P.; Wang, C.; Hu, J.; Fu, H.; Zhu, J. Interferometric Phase Optimization Based on PolInSAR Total Power Coherency Matrix Construction and Joint Polarization-Space Nonlocal Estimation. IEEE Trans. Geosci. Remote Sens. 2022, 60, 5201014. [Google Scholar] [CrossRef]
  41. Xu, H.; Zeng, G.; Liu, W.; Wang, Y. MLE-MPPL: A Maximum Likelihood Estimator for Multipolarimetric Phase Linking in MTInSAR. IEEE Trans. Geosci. Remote Sens. 2023, 61, 5202913. [Google Scholar] [CrossRef]
  42. Hunan Institute of Geological Disaster Investigation and Monitoring. Detailed Geological Hazard Survey Report of Yuanling County, Hunan Province (1:50,000); Hunan Institute of Geological Disaster Investigation and Monitoring: Changsha, China, 2021. (In Chinese) [Google Scholar]
Figure 1. Study area and ALOS-2 image coverage. The blue dashed box indicates the coverage of ALOS-2 SAR data, and the red dashed box marks the region of interest (ROI) for detailed analysis.
Remotesensing 17 01525 g001
Figure 2. Processing flowchart of the proposed MT-PolInSAR method and the comparative MT-InSAR approach. The top and bottom sections represent identical data preprocessing and deformation estimation. The middle section highlights the differences in PS/DS identification and phase optimization: single polarization on the left, multi-polarization on the right.
Remotesensing 17 01525 g002
Figure 3. Spatiotemporal baseline network for processed ALOS-2 datasets. Blue triangles represent the images and orange lines represent the selected interferograms.
Remotesensing 17 01525 g003
Figure 4. Spatial distribution of deformation rates: (a) MT-InSAR results; (b) MT-PolInSAR results. White circles indicate representative deformation location identified by InSAR (P01–P32).
Remotesensing 17 01525 g004
Figure 5. Deformation results at landslide site P29. (a,b) Deformation rates overlaid on high-resolution satellite imagery for MT-InSAR and MT-PolInSAR results, respectively. The selected point (white dot), landslide boundary (black line), and downslope direction (white arrow) are annotated. (c,d) Time-series deformation curves corresponding to the selected point in (a,b), respectively. (e) Field photograph captured during on-site survey for validation.
Remotesensing 17 01525 g005
Figure 6. Deformation results at landslide site P30. (a,b) Deformation rates overlaid on high-resolution satellite imagery for MT-InSAR and MT-PolInSAR results, respectively. The selected point (white dot), landslide boundary (black line), and downslope direction (white arrow) are annotated. (c,d) Time-series deformation curves corresponding to the selected point in (a,b), respectively. (e) Field photograph captured during on-site survey for validation.
Remotesensing 17 01525 g006
Figure 7. Deformation results at deformation site P15. (a,b) Deformation rates overlaid on high-resolution satellite imagery for MT-InSAR and MT-PolInSAR results, respectively. The selected point (white dot) and deformation boundary (black line) are annotated. (c,d) Time-series deformation curves corresponding to the selected point in (a,b), respectively. (e) Field photograph captured during on-site survey for validation.
Remotesensing 17 01525 g007
Figure 8. Deformation Results at deformation site P16. (a,b) Deformation rates overlaid on high-resolution satellite imagery for MT-InSAR and MT-PolInSAR results, respectively. The selected point (white dot) and deformation boundary (black line) are annotated. (c,d) Time-series deformation curves corresponding to the selected point in (a,b), respectively. (e) Field photograph captured during on-site survey for validation.
Remotesensing 17 01525 g008
Figure 9. Reconstructed interferometric phase after optimization: (a) single-polarization interferometric phase; (b) fully polarimetric interferometric phase. The red circled area in the first sub-image of (a) highlights a region with visible improvement in phase stability in the multi-polarization result.
Remotesensing 17 01525 g009
Figure 10. Histogram of interferometric coherence. The blue and red curves indicate the number of pixels at different coherence levels for the MT-InSAR and MT-PolInSAR methods, respectively.
Remotesensing 17 01525 g010
Figure 11. Spatial distribution of PS and DS points identified by single-polarization and multi-polarization methods. (a) PS targets from single-polarization (green), multi-polarization (red), and their intersection (blue), with numbers in brackets indicating the quantity of points. (b) DS targets from the same categories.
Remotesensing 17 01525 g011
Table 1. Data parameters.
ParameterALOS-2/PALSAR-2
Flight DirectionAscending orbit
Incidence Angle (°)27.8°
Polarization ModeHH
Azimuth Sampling (m)5.3
Range Sampling (m)6.1
Wave (m)0.23
Acquisition Period31 May 2021–27 June 2022
Table 2. InSAR-identified deformation sites and field investigation results.
IDLongitudeLatitudeTypeAccuracyField Verification Findings
P01110°24′34″28°34′44″LandslideCorrectRecorded geological hazard site without visible deformation
P02110°19′52″28°42′37″LandslideCorrectRecorded geological hazard site with visible deformation
P03110°20′55″28°37′34″SubsidenceCorrectErosion-induced deformation
P04110°13′44″28°28′23″LandslideIncorrectNo clear deformation evidence
P05109°55′0″28°34′42″LandslideIncorrectNo clear deformation evidence
P06109°59′26″28°38′25″LandslideIncorrectNo clear deformation evidence
P07110°3′ 53″28°37′ 31″LandslideCorrectRecorded geological hazard site without visible deformation
P08109°57′30″28°37′49″LandslideCorrectNewly identified site with potential instability
P09109°58′7″28°25′46″LandslideCorrectRecorded geological hazard site without visible deformation
P10110°4′57″28°31′22″LandslideCorrectRecorded geological hazard site without visible deformation
P11110°2′57″28°34′57″LandslideIncorrectNo clear deformation evidence
P12110°3′12″28°33′59″LandslideCorrectRecorded geological hazard site with visible deformation
P13110°7′50″28°15′56″LandslideCorrectNewly identified site with potential instability
P14110°10′51″28°10′50″LandslideCorrectNewly identified site with potential instability
P15110°13′14″28°13′25″SubsidenceCorrectSurface deformation linked to waste accumulation
P16110°22′19″28°28′15″SubsidenceCorrectSurface deformation linked to engineering activities (e.g., soil transport)
P17110°24′0″28°26′03″SubsidenceCorrectSurface deformation linked to engineering activities (e.g., soil transport)
P18110°12′ 15″28°16′ 13″LandslideCorrectNewly identified site with potential instability
P19110°1′12″28°33′46″LandslideCorrectRecorded geological hazard site without visible deformation
P20110°8′11″28°33′13″LandslideCorrectRecorded geological hazard site without visible deformation
P21110°4′02″28°9′54″LandslideCorrectNewly identified landslide caused by quarrying activities
P22110°24′19″28°26′37″SubsidenceCorrectSurface deformation linked to local construction activities
P23109°57′07″28°19′51″LandslideCorrectRecorded geological hazard site without visible deformation
P24110°23′49″28°29′35″LandslideCorrectRecorded geological hazard site with visible deformation
P25109°59′17″28°34′57″LandslideIncorrectNo clear deformation evidence
P26109°59′11″28°34′26″LandslideIncorrectNo clear deformation evidence
P27109°57′59″28°38′39″SubsidenceCorrectSurface deformation linked to engineering activities (e.g., soil transport)
P28109°57′59″28°38′24″SubsidenceCorrectSurface deformation linked to engineering activities (e.g., soil transport)
P29109°57′43″28°38′35″LandslideCorrectNewly identified hazard site with visible deformation
P30110°5′01″28°14′24″SubsidenceCorrectSurface deformation linked to agricultural activities
P31110°3′22″28°14′31″LandslideCorrectNewly identified hazard site with visible slope deformation
P32110°3′18″28°13′48″LandslideCorrectNewly identified landslide caused by quarrying activities
Disclaimer/Publisher’s Note: The statements, opinions and data contained in all publications are solely those of the individual author(s) and contributor(s) and not of MDPI and/or the editor(s). MDPI and/or the editor(s) disclaim responsibility for any injury to people or property resulting from any ideas, methods, instructions or products referred to in the content.

