1. Introduction
Seat belt compliance remains a critical public safety concern, with road traffic fatalities continuing to claim thousands of lives annually. In 2022 alone, over 25,000 passenger vehicle occupants died in crashes, nearly half of whom were unrestrained at the time of impact [
1]. The risks are even more pronounced in nighttime crashes, where 57% of fatalities involved individuals not wearing seat belts [
2]. Research consistently demonstrates that seat belt use significantly reduces the risk of fatal injuries [
3,
4] by up to 50% for front seat passengers and 25% for rear seat occupants [
5]. In 2017, an estimated 2549 lives could have been saved had all occupants properly worn seat belts [
1]. Despite their well-documented life-saving potential, seat belt noncompliance persists due to behavioral resistance, enforcement challenges, and limited public awareness [
6].
Current seat belt compliance monitoring relies primarily on manual observational surveys conducted by transportation agencies [
7]. While these surveys provide valuable data, they have inherent limitations. Geographic coverage is restricted, as surveyors typically monitor only one lane and direction per site, which may introduce sampling bias and limit the representativeness of the data. Visibility constraints—such as tinted windows, low lighting, and obstructions—can make it challenging to accurately assess compliance, potentially affecting the reliability of reported rates. Additionally, surveyors may need to reposition themselves along routes or use vantage points like overpasses and exit ramps to improve visibility [
8], which can introduce variability in observation conditions. These limitations highlight the need for more scalable and efficient approaches to seat belt compliance monitoring to ensure reliable and comprehensive data collection.
Beyond observational surveys, various interventions and advancements in vehicle occupant safety technology have aimed to promote seat belt use, including automated warning systems, mass media campaigns, and legislative enforcement [
9,
10]. Automated seat belt reminders, commonly integrated into modern vehicles, encourage compliance through audible or visual alerts. However, these systems serve only as reminders, leaving the decision to comply solely to the driver’s discretion. Furthermore, these systems depend on in-vehicle technology that is often absent in older or less advanced vehicle models, leaving many drivers without access to these safety features. Legislative measures, such as primary seat belt laws in 35 U.S. states [
11] and enforcement initiatives like “Click It or Ticket” [
12] and “Buckle Up America” [
13], run by the NHTSA, also effectively promote seat belt use through extensive advertising and increased enforcement periods.
Despite these measures, wide-spread seat belt compliance remains inconsistent, underscoring the need for innovative solutions to address the gaps in existing strategies. Real-time automated seat belt compliance detection systems offer a promising approach [
14], particularly when integrated with surveillance technologies. Recognizing the importance of such advancements, the U.S. Department of Transportation (U.S. DOT) has emphasized the development of innovative systems through its Small Business Innovation Research (SBIR) program. A recent SBIR solicitation specifically called for the development of devices capable of automatic seat belt use detection, data collection, and driver feedback, highlighting the urgency of advancing research in this area [
15].
The application of computer vision for seat belt detection has gained significant traction in recent years. Early approaches primarily relied on traditional image-processing techniques such as edge detection, salient gradient feature mapping, and color segmentation to identify seat belt presence [
4,
16]. However, these methods were highly sensitive to variations in lighting conditions, vehicle interiors, and camera angles, limiting their practical applicability. More recent advancements have shifted towards deep learning models, particularly convolutional neural networks (CNNs), which offer significantly improved accuracy and robustness [
17]. By extracting hierarchical features from image data, CNN-based models effectively differentiate between buckled and unbuckled seat belts with high precision. For instance, [
18] proposed a real-time, single-stage detection model using YOLOv7 and discussed how it compares conceptually to multi-stage approaches such as those incorporating Region Proposal Networks (RPNs). While these models achieved promising results, they primarily relied on datasets of high-resolution images captured inside vehicles, which differ substantially from the perspectives and image quality of road surveillance systems, posing challenges for real-world deployment. Further advancements have incorporated multi-scale feature extraction techniques combined with deep learning. A study by [
19] extracted features from key regions of interest such as vehicles, windshields, and seat belts to train CNN models for seat belt detection. By incorporating support vector machines (SVMs) to refine detection scores and spatial relationships, the method improved accuracy and robustness on road surveillance images, highlighting its real-world applicability.
Innovative methods have also explored thermal imaging for seat belt detection, with [
20] employing the Fully Connected One Shot (FCOS) network on thermal images captured from 5 to 20 m, demonstrating effectiveness across varying lighting conditions. Additionally, research has integrated seat belt detection into intelligent transportation systems (ITS), proposing IoT-enabled vehicle management systems that combine seat belt monitoring with speed control and alcohol detection for comprehensive road safety solutions [
21].
Building upon these advancements, this study presents an automated seat belt detection system that leverages a YOLO11 neural network and video footage captured by a tethered UAV to identify and quantify seat belt compliance among drivers at stop-controlled intersections. By leveraging aerial surveillance, this approach addresses several key challenges associated with manual surveys and in-vehicle detection methods. The system analyzes recorded UAV footage to detect seat belt use during post-processing, allowing for accurate evaluation under real-world conditions. The primary objectives of this research include the following: (i) developing a robust detection system for monitoring seat belt usage at stop-controlled intersections, (ii) evaluating key factors that impact seat belt detection accuracy, and (iii) demonstrating the scalability and reliability of automated UAV-based seat belt data collection as an alternative to traditional manual surveys. The system’s performance was evaluated through three focused studies designed to reflect common real-world challenges:
Seat Belt–Shirt Color Contrast: Investigated the impact of varying color contrasts on detection accuracy, including challenging cases where seat belt and shirt colors closely matched.
Sunlight Direction: Assessed the model’s robustness under diverse lighting conditions, including glare and shadows, across different times of the day.
Vehicle Type: Examined how differences in vehicle design and interior layouts influenced seat belt visibility and detection accuracy.
To validate real-world applicability, the seat belt detection system was deployed at two stop-controlled intersections in Iowa. Video footage from each site was manually reviewed and compared with the system’s detections. Additionally, performance was benchmarked against OpenAI’s GPT-4V(ision) to evaluate its feasibility for large-scale deployment. As part of this evaluation, a confidence threshold of 0.70 was implemented to conclude seat belt status. Detections below this threshold were categorized as “unknown” and excluded from any compliance analysis, effectively reducing false detections and ensuring reliable results.
This study introduces a reliable and adaptable approach for real-world seat belt compliance monitoring, offering valuable insights for policy and safety initiatives. The remainder of this paper is organized as follows: the Materials and Methods section outlines the experimental setup, data collection process, and model development, the Results section highlights the model’s performance and findings, the Discussion explores practical applications and associated challenges, and the Conclusion summarizes key insights and recommendations for future improvements.
2. Materials and Methods
2.1. Experimental Setup and Data Collection
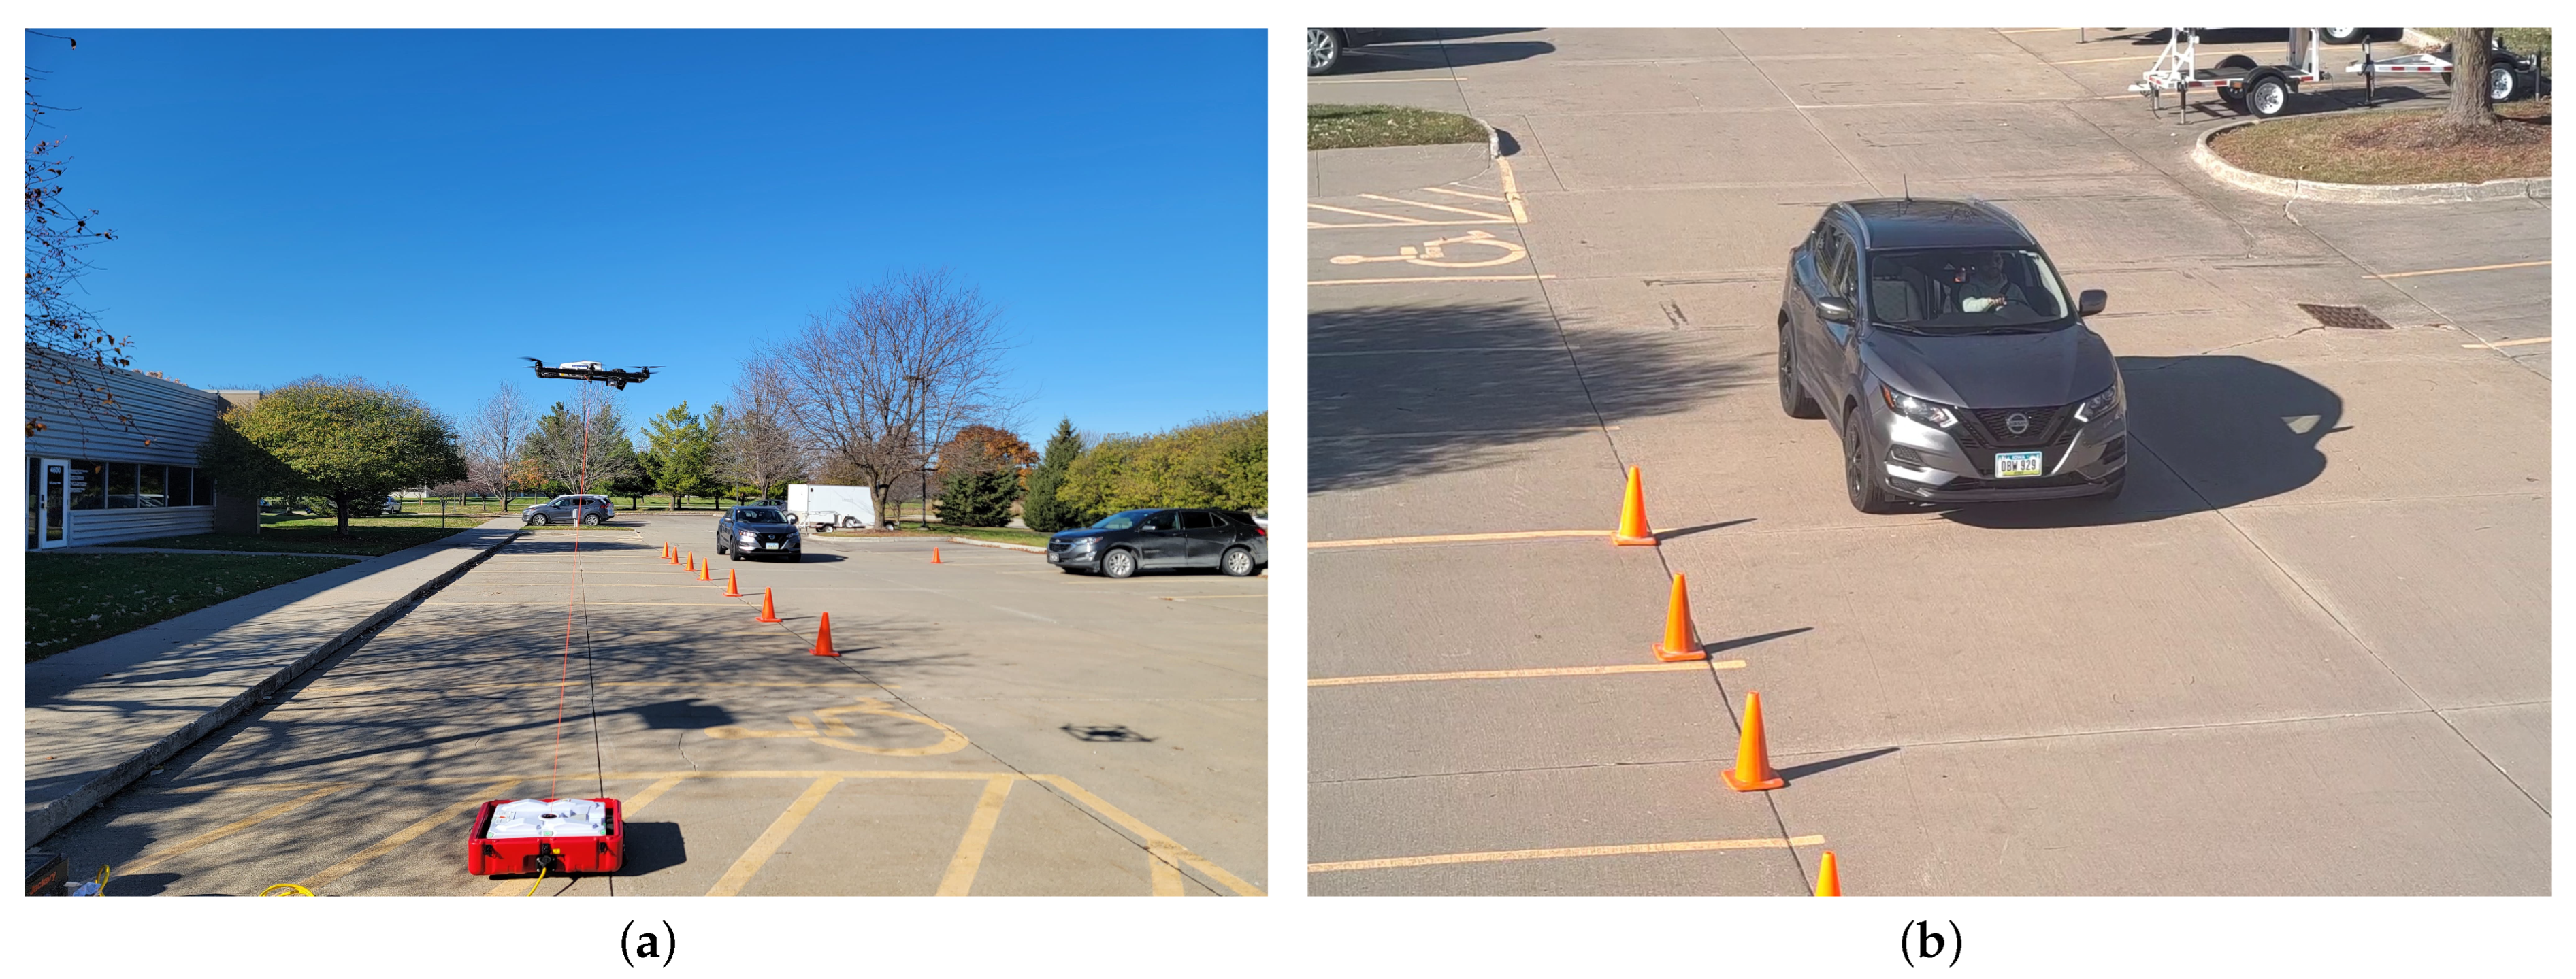
Controlled video data collection was conducted at Iowa State University’s Institute for Transportation (InTrans) parking facility to develop a high-quality dataset for training and evaluating the seat belt detection model. The experimental setup, depicted in
Figure 1, simulated real-world stop-controlled intersection dynamics, where drivers were required to yield at designated points before proceeding.
A tethered UAV was used to capture video footage, positioned overhead and slightly to the left of the lane to achieve a near head-on perspective of approaching vehicles. This strategic placement minimized potential visual obstructions from the vehicle’s A-pillar, which could otherwise obscure the driver’s chest area and hinder seat belt detection. The UAV operated at two altitudes, 15 and 18 feet, to assess the optimal elevation for maximizing seat belt visibility while maintaining high detection accuracy. Additionally, the camera was zoomed in on the windshield, precisely focusing on the driver’s chest area to enhance image clarity and improve seat belt detection reliability.
During operation, the UAV was manually piloted into position and stabilized by the tether system, which allowed for controlled hovering and limited lateral movement based on the tether’s length and tension. Drone mounting, lateral movement, elevation adjustment, camera zoom, and landing were all remotely controlled using a handheld controller. A live video feed displayed on the connected tablet allowed operators to view the UAV’s real-time perspective and make fine adjustments to framing, zoom, and positioning as needed. This ensured that each recording was optimized for visibility and clarity, while maintaining safe, flexible, and stable operation.
Data collection was conducted over a period of two days across multiple sessions during varying daylight conditions, including morning, midday, and late afternoons. To enhance visual diversity, footage was captured from different UAV angles and perspectives, providing varied views of approaching vehicles and driver seating positions. While data were not collected during extreme weather conditions due to equipment and safety constraints, the recordings captured a range of lighting scenarios and weather variability common to daytime driving. The dataset included a diverse mix of vehicle types (e.g., sedans, SUVs, trucks) and driver appearances, supporting broader model generalization.
2.2. Evaluation Studies
To evaluate the robustness of our seat belt detection model in real-world conditions, we designed three experimental studies, each targeting key factors that could impact detection accuracy. For each study, we curated distinct training and testing datasets to ensure a controlled and systematic assessment of the model’s performance. These studies allowed us to pinpoint potential limitations and refine the model to improve its generalizability. The following sections provide a detailed overview of each study.
2.2.1. Seat Belt–Shirt Color Contrast
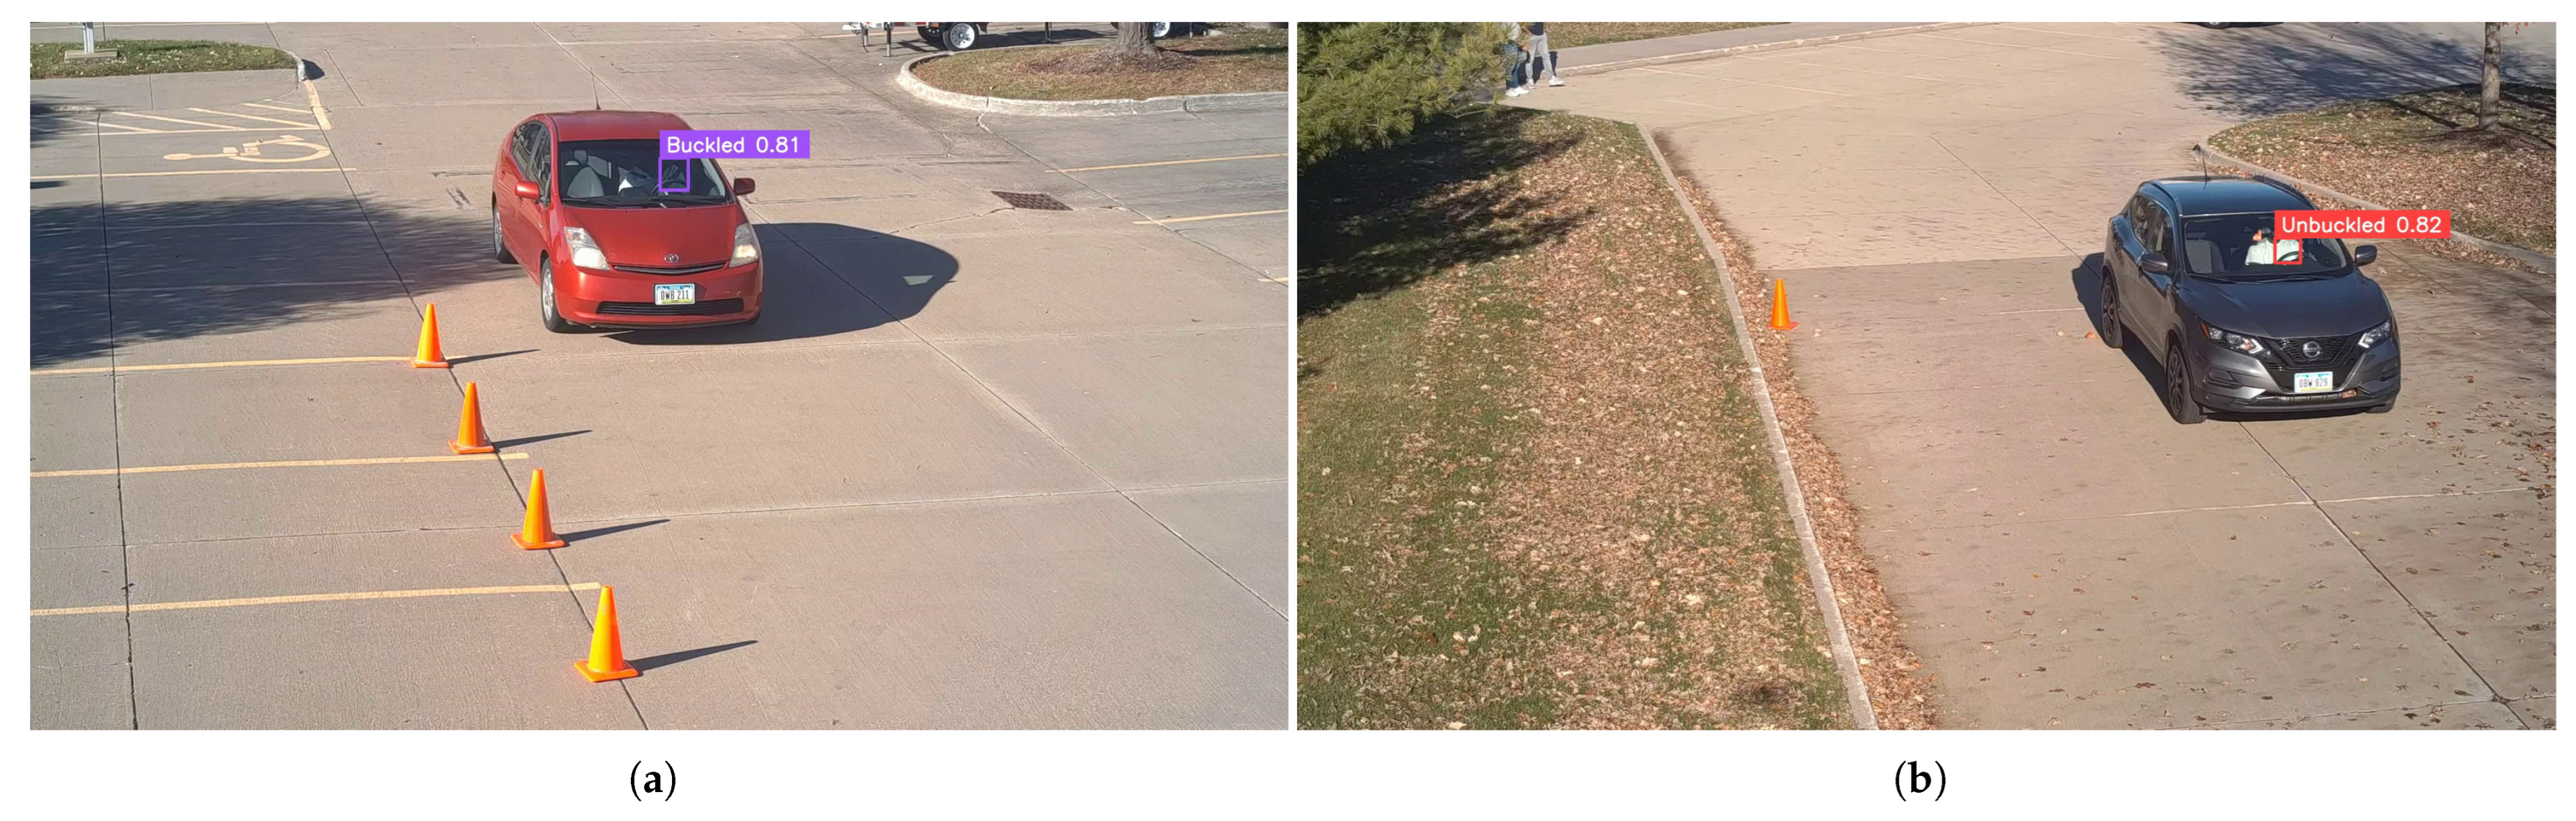
This study examined how seat belt–shirt color contrast affects detection accuracy, especially when the seat belt closely matches the driver’s clothing. Footage was collected of drivers wearing shirts in various colors to ensure contrast variations. The dataset included high-contrast cases (e.g., black seat belt on a white shirt) and low-contrast cases (e.g., gray seat belt on a light-colored shirt) for a thorough performance evaluation.
Beyond assessing detection accuracy across contrast levels, we identified edge cases where the model struggled, such as misinterpreting clothing folds as seat belts or detecting patterned fabrics as seat belt-like features. By analyzing accuracy variations and failure modes, we uncovered the model’s limitations and explored refinements to enhance robustness in diverse real-world conditions.
2.2.2. Sunlight Direction
Lighting variability—particularly direct sunlight, glare, and shadows—poses a significant challenge for seat belt detection. This study examined how sunlight direction affects detection accuracy by capturing footage at different times of the day under varying illumination.
The UAV was positioned in two setups: one facing the sun and another with the sun behind it, allowing us to assess how changing light angles influenced seat belt visibility. The analysis revealed key failure cases, including overexposure washing out seat belt details and shadows creating false seat belt-like features. Based on these findings, we explored targeted improvements, such as exposure-based model adjustments (e.g., normalization and adaptive contrast correction) and data augmentation techniques to enhance detection accuracy under dynamic lighting conditions.
2.2.3. Vehicle Type
Variations in vehicle design—such as windshield height, tint, and interior layout—significantly impact seat belt visibility. Tall, clear windshields provide an unobstructed view, improving detection, while shorter or steeply angled windshields may obscure parts of the seat belt. Tinted windows further complicate detection by reducing contrast and masking seat belt details under certain lighting conditions.
This study assessed model performance across a diverse range of vehicles, including sedans, mini-SUVs, and trucks, to ensure consistent detection accuracy despite design differences. By analyzing detection variations across vehicle types, we identified model limitations and applied adaptive fine-tuning to enhance robustness across different vehicle designs.
2.3. Model Selection
This study utilized YOLO11, one of the latest additions to the You Only Look Once (YOLO) family of object detection models, selected for its superior performance, flexibility, and practical deployment potential [
22]. As a deep learning network designed for real-time object detection, YOLO11 identifies object locations within an image and classifies them using pre-trained weights. By analyzing pixel intensities, the model predicts bounding boxes, class labels, and associated probabilities, providing a comprehensive solution for detection tasks. The integration of advanced components—such as the Cross Stage Partial with Spatial Attention (C2PSA) block and Spatial Pyramid Pooling-Fast (SPPF) block—enhances YOLO11’s ability to focus on critical regions within images while preserving computational efficiency. These features make YOLO11 particularly suitable for complex real-world applications, such as detecting seat belt usage from aerial footage, where both accuracy and inference speed are critical [
23].
The choice of YOLO11 was also guided by its demonstrated balance between detection performance and computational efficiency. As shown in the benchmark comparison from Ultralytics [
24], YOLO11 consistently outperforms earlier YOLO versions in terms of COCO mAP, while maintaining competitive latency across different model sizes. When compared with other state-of-the-art object detectors, YOLO11 ranks among the top-performing models, offering a favorable trade-off between accuracy and speed. This scalability allows for flexible deployment depending on hardware constraints. For example, smaller variants such as YOLO11s and YOLO11m are lightweight and fast, making them well-suited for real-time applications on resource-constrained platforms. In contrast, larger models like YOLO11x provide higher detection accuracy and are more appropriate for offline processing scenarios, such as post-processed seat belt detection.
YOLO11’s architecture is particularly well-suited for seat belt detection in challenging conditions. The C2PSA block enables the effective isolation of critical image regions, improving detection accuracy for objects like seat belts, which can vary significantly in size and orientation. Furthermore, its integration of multi-scale feature extraction via the SPPF block allows the model to adapt to diverse lighting scenarios, such as shadows and direct sunlight, ensuring reliable performance under varying environmental conditions.
A major challenge in seat belt detection is low color contrast between the seat belt and the driver’s clothing or vehicle interior. YOLO11 addresses this through high-resolution feature integration and residual connections, capturing subtle differences in texture and color. Specifically, using a Cross Stage Partial block with 3 convolutions, using a 2 bottleneck layers (C3k2) block, the model captures intricate details efficiently, and distinguishes the seat belt from the surrounding background. This capability becomes crucial in addressing contrast-related challenges, such as when seat belt colors closely match the driver’s shirt or the vehicle’s interior.
For this study, the system was configured with a confidence threshold of 0.70, based on empirical validation to balance precision and recall while minimizing false detections. Detections were categorized into three outcomes: buckled, unbuckled, or unknown. The “unknown” category captured cases where the model’s confidence score fell below the threshold, allowing low-confidence predictions to be excluded from compliance analysis and ensuring uncertain outputs were explicitly accounted for.
2.4. Training YOLO11 for Seat Belt Detection
The YOLO11 architecture was fine-tuned on a composite dataset of 3922 images, comprising UAV-captured footage from our two-day field data collection and external raw images from the Seat Belt Detection dataset on Roboflow Universe [
25]. UAV footage was recorded at 30 frames per second as vehicles approached the intersection, and, together with the external images, provided a diverse and high-resolution source for training and validation. The dataset was split into 80% for training and 20% for validation.
To account for extreme environmental conditions not captured during field data collection—such as nighttime, rain, and degraded image quality—targeted data augmentation techniques were applied during training. These included brightness and contrast adjustments, random cropping, scaling, rotation, perspective transformations, and the addition of noise and blur. These augmentations improved the model’s generalization to diverse and challenging real-world conditions.
Model testing was conducted separately and included two components: (1) overall model testing using general test data to evaluate baseline performance across varied conditions, and (2) study-specific testing using carefully selected frames from the three experimental studies to analyze the model’s performance under targeted scenarios, including seat belt–shirt color contrast, sunlight direction, and vehicle type.
Annotations for all data—including training, validation, and both test sets—were performed using the Computer Vision Annotation Tool (CVAT), with drivers labeled as either “Buckled” or “Unbuckled”. This rigorous annotation process ensured high-quality ground truth labels to support reliable and consistent seat belt detection across diverse scenarios.
The YOLO11 training process optimized hyperparameters and validation strategies to balance performance and efficiency for real-world applications. Training began with an initial learning rate of 0.001667 and gradually decayed using a cosine learning rate scheduler to ensure smooth convergence and minimize loss function oscillations in later stages. A batch size of 16 images was used, leveraging available GPU resources for efficient processing. To stabilize gradient updates, momentum was set to 0.9, and a weight decay factor of 0.0005 was applied to regularize the model and prevent overfitting.
The model was trained for 200 epochs to ensure sufficient dataset exposure for convergence. The AdamW optimizer was chosen for its effectiveness in large-scale deep learning tasks, leveraging momentum and weight decay to improve convergence while reducing overfitting. These carefully designed strategies enhanced detection accuracy and ensured robustness across diverse operational conditions.
2.5. Evaluation Metrics
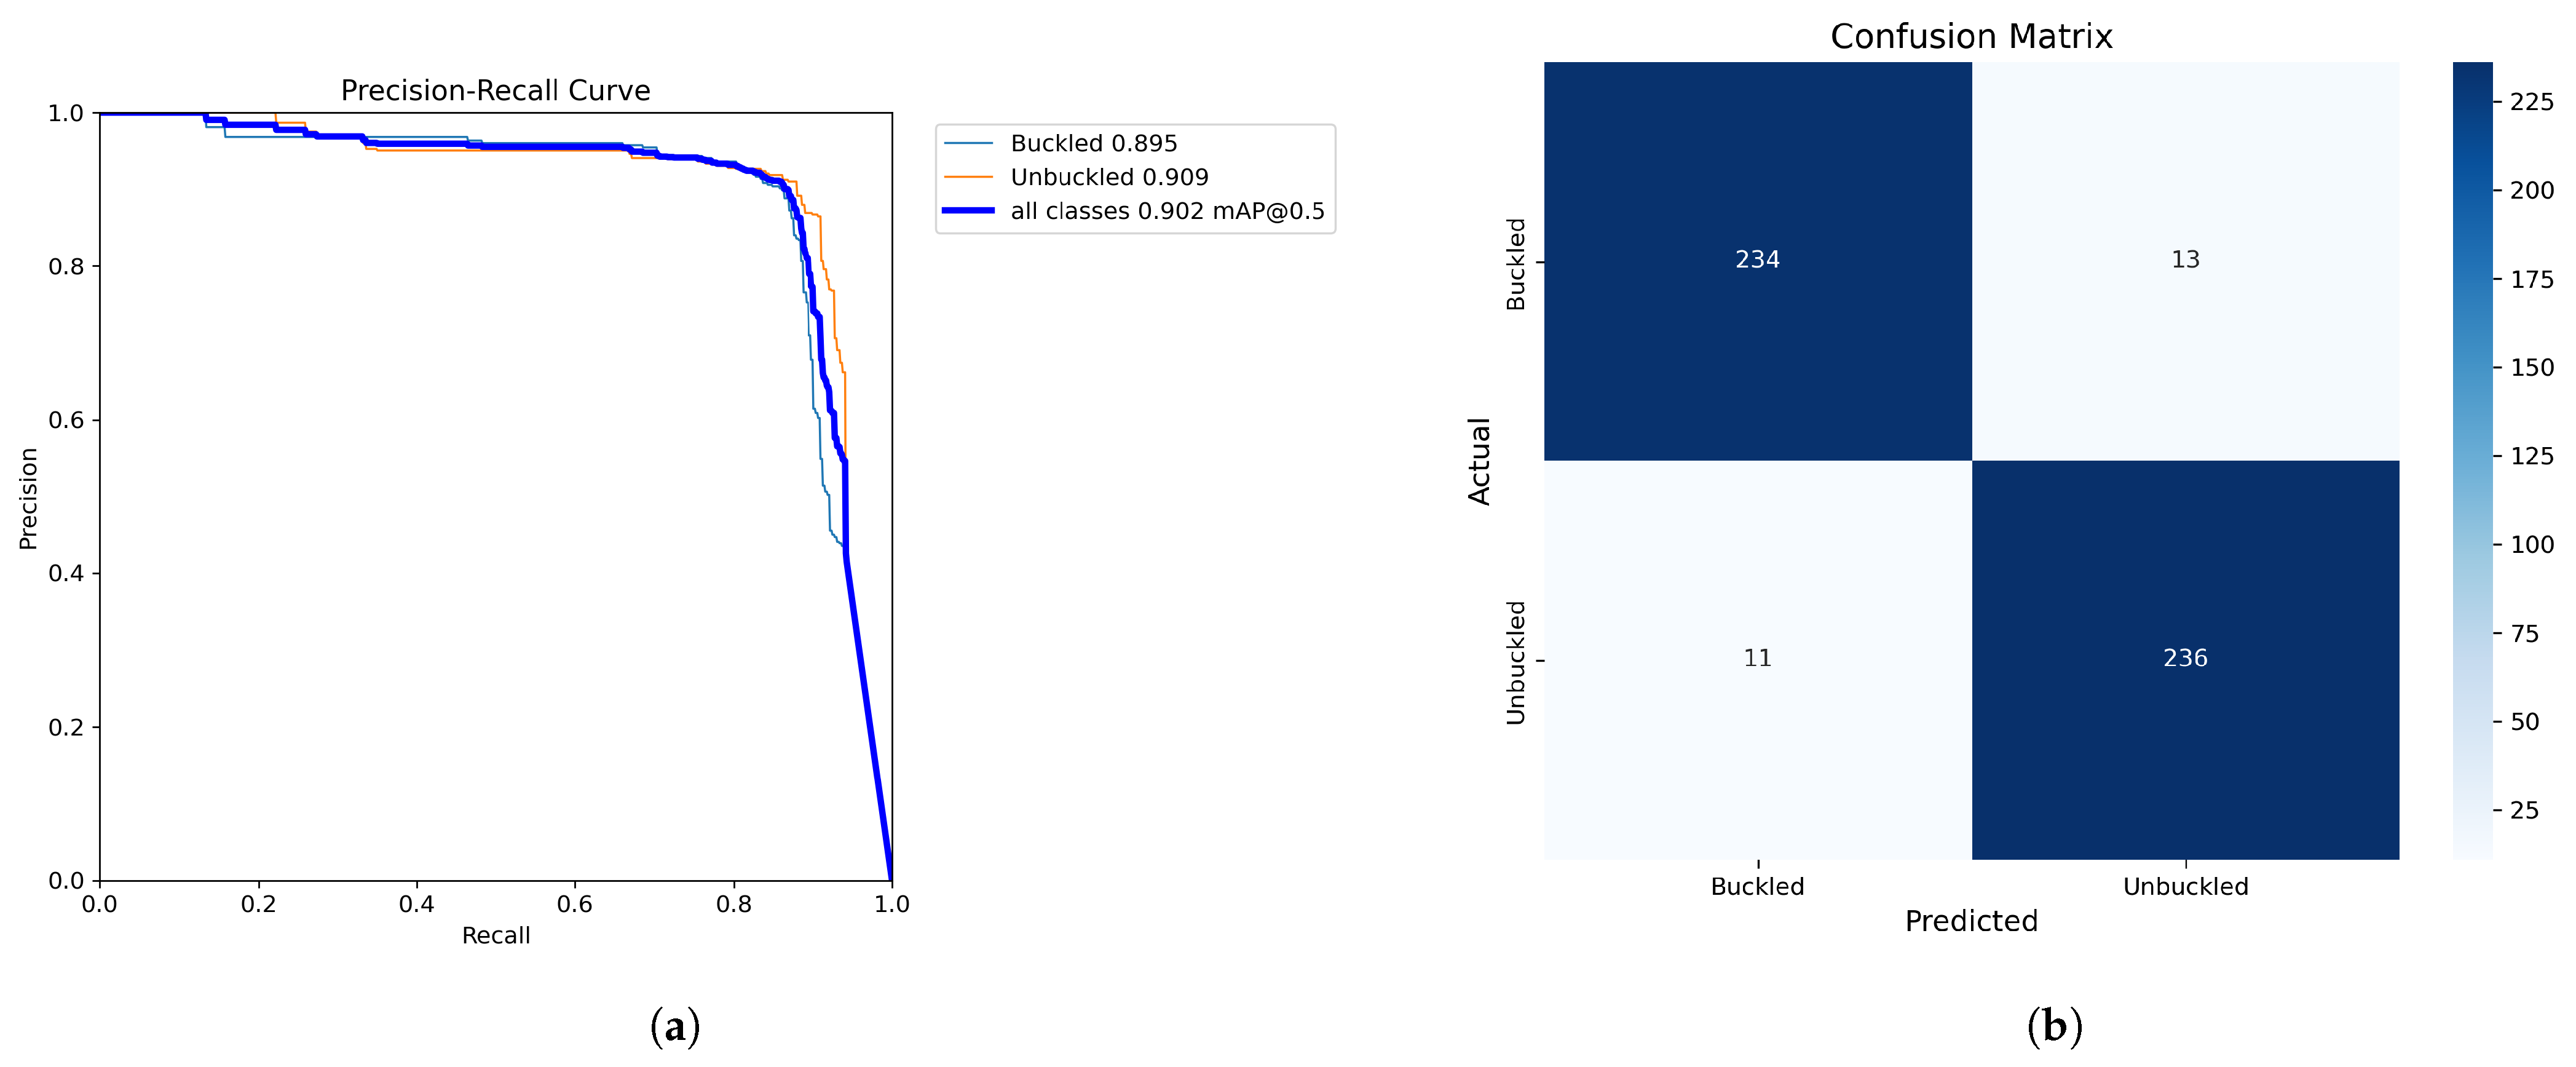
Model performance was assessed based on detection accuracy and computational efficiency to ensure effectiveness and real-world applicability. Detection accuracy was measured using Mean Average Precision (mAP) across IoU thresholds (0.5–0.95) and further evaluated with Precision, Recall, and F1-Score to balance false positives and false negatives. Computational efficiency was analyzed by comparing the model’s detections with OpenAI’s GPT-4V(ision) on the same dataset, assessing resource utilization, cost-effectiveness, and performance consistency to determine feasibility for large-scale deployment.
Precision: reflects the proportion of true positive detections among all predicted positives, computed as follows:
Recall: measures the proportion of true positives among all actual positives and was calculated as follows:
F1-Score: balances Precision and Recall using their harmonic mean, capturing the trade-off between the two metrics:
2.6. Real-World Deployment
The system was deployed at two stop-controlled intersections with distinct geometric and traffic characteristics. The first, a simple single-lane, was located at the intersection between 330th Street and Linn Street (330th–Linn) in Slater, Iowa, while the second, a complex multi-lane intersection with three lanes per approach, was between North Dakota Avenue and Ontario Street (North Dakota–Ontario) in Ames, Iowa.
These sites were selected for their representative traffic patterns and their location along routes historically used for annual manual surveys in Iowa. The goal was to replicate real-world data collection conditions, where surveyors adjust to accessible vantage points along designated routes.
Table 1 lists each site’s name, geographic coordinates (latitude and longitude), and weather conditions during deployment. At both locations, one hour of video footage was recorded to capture a representative sample of traffic patterns and environmental conditions.
Setup at Sites
At the North Dakota–Ontario intersection, researchers replicated setup during the experimental phase by positioning the drone directly overhead at the opposing approach with a slight lateral adjustment (
Figure 1) and zooming in on the target approach. This setup provided a clear view of vehicles as they approached, stopped, and exited the intersection, optimizing detection by enhancing imaging clarity, particularly for slow-moving and stationary vehicles.
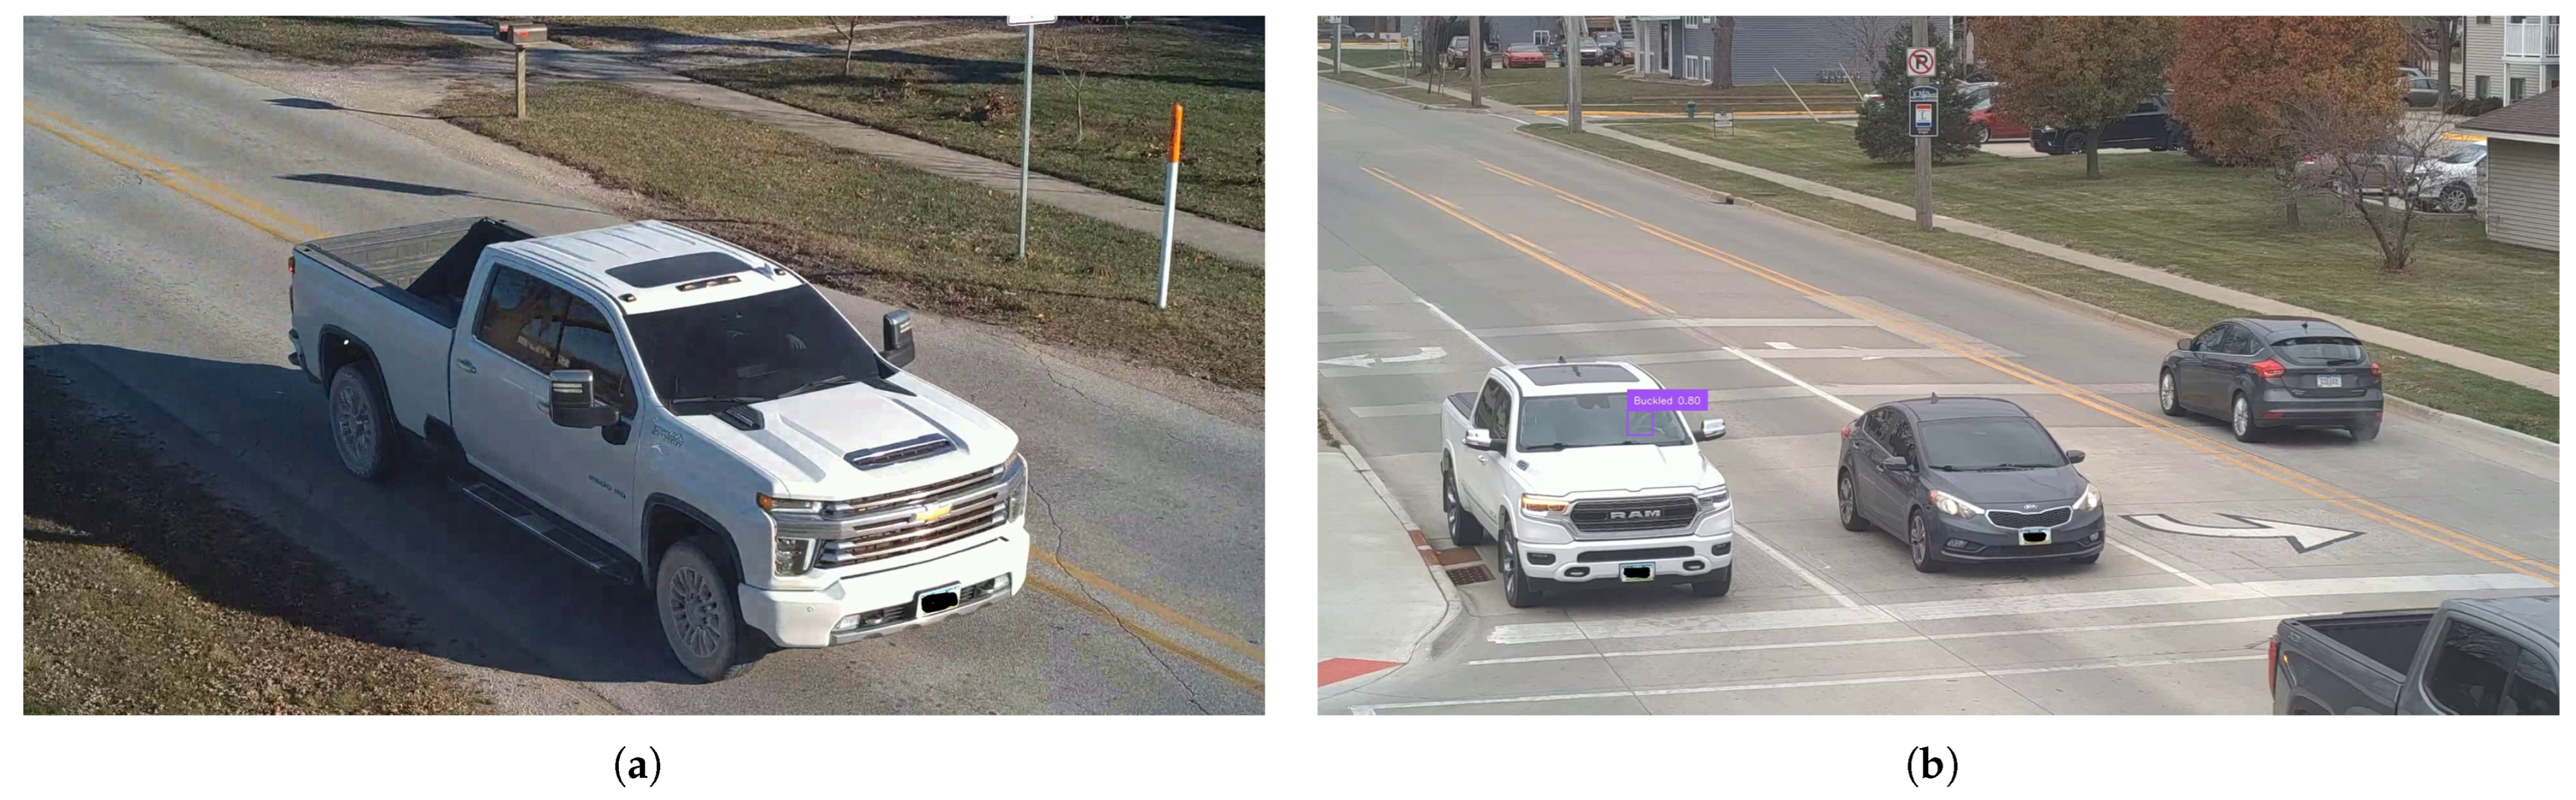
Data collection at 330th–Linn faced challenges in capturing ideal slow–stop–go scenarios. A roadside billboard required positioning the drone farther away to prevent tether interference, limiting footage to instances where drivers began reducing speeds. In some cases, drivers only slowed upon reaching the stop line, further complicating data. While other approaches allowed for broader coverage, the UAV was deliberately positioned with the sun behind it to avoid glare, which the conducted evaluation studies showed significantly reduced detection accuracy. This adjustment optimized imaging conditions but constrained the ability to capture complete driver behavior sequences.
4. Discussion
4.1. UAV Deployment Strategy
This study demonstrates the effectiveness of integrating UAV-captured footage with advanced detection models to automate seat belt compliance monitoring at stop-controlled intersections. Data collection utilized a tethered UAV system. The tether secures the UAV to the base station on the ground and provides power up and data transfer down the UAV. Depending on the power source, the system can operate continuously, be accessed remotely, adjust elevation at any time, and be transported to different locations within minutes, making it adaptable for various field settings. In our implementation, the UAV was powered by a high-capacity, rechargeable battery stationed at the base. This setup supported continuous operation for an average of 5–6 h per session, which was sufficient for each day of experimental trials and real-world deployments. The battery could also be recharged while connected to the UAV, enabling near-continuous monitoring when necessary.
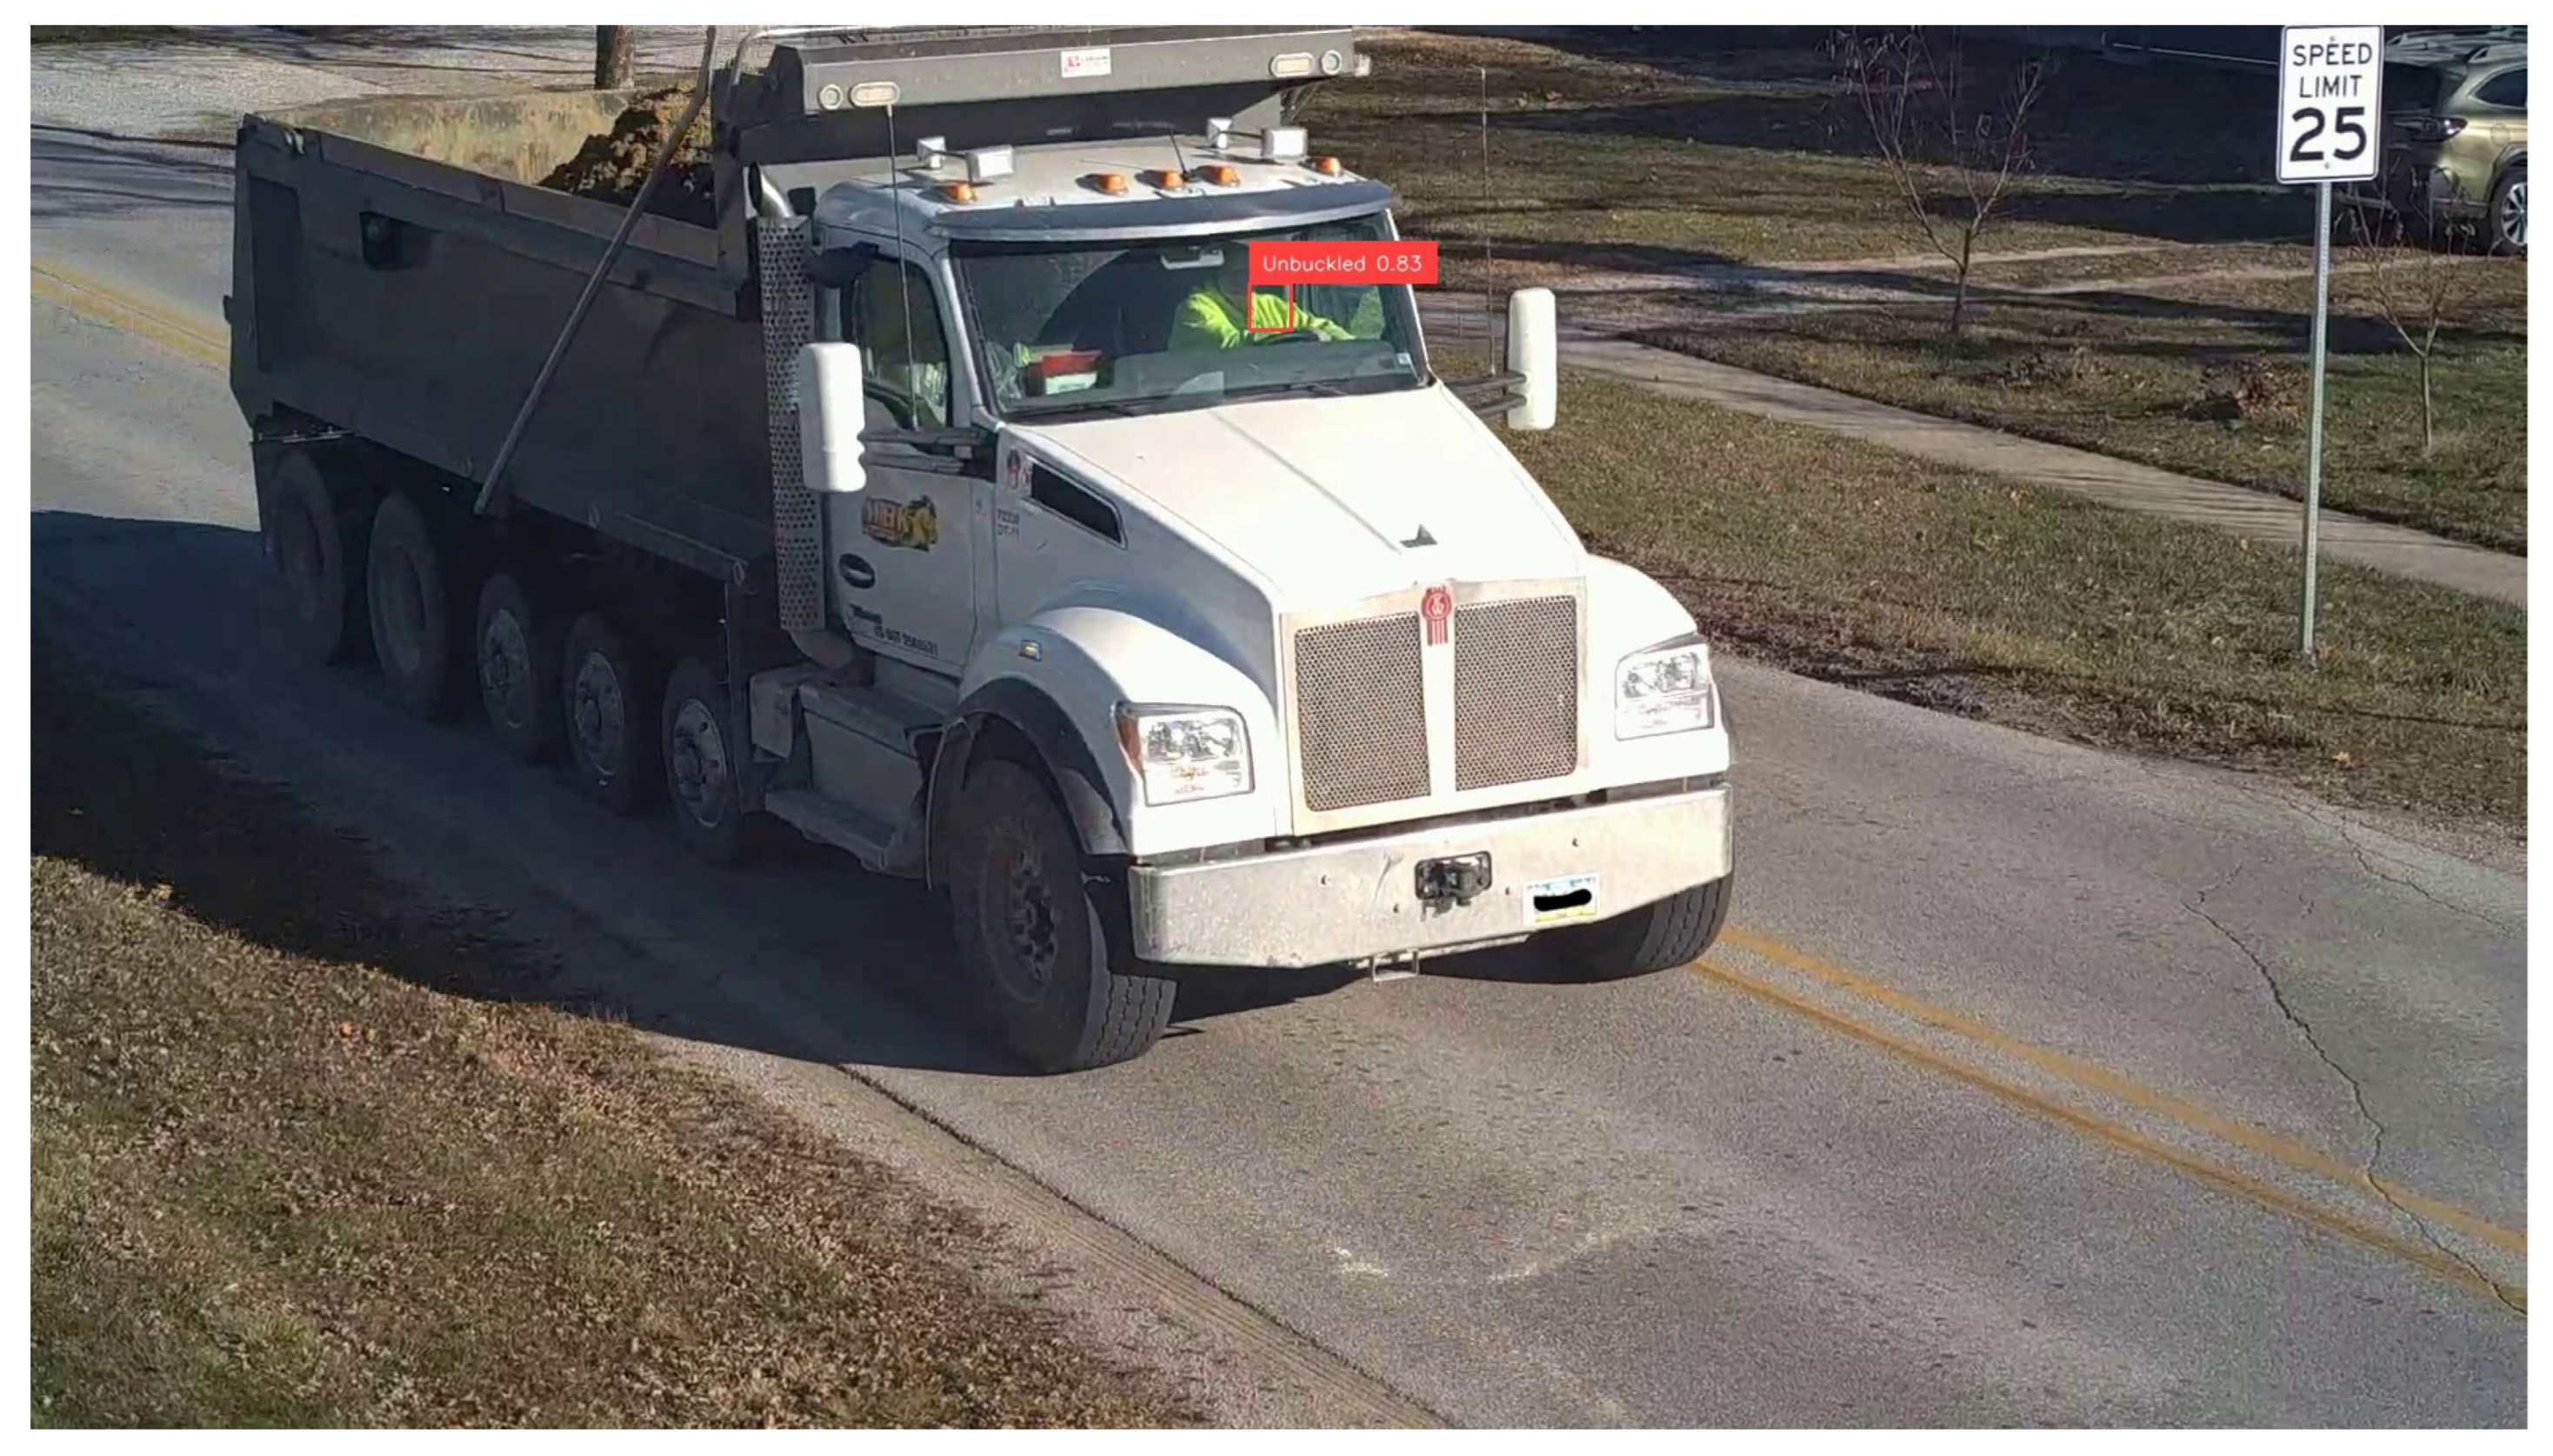
The customized YOLO11 model achieved high detection accuracy across experimental studies, even under challenging scenarios like low seat belt–shirt contrast and tinted windows. A key finding was the impact of direct sunlight, where glare significantly reduced visibility and detection accuracy, emphasizing the importance of strategic UAV positioning. The study identified 18 feet with a 2.3 × camera zoom as the optimal setup for detection accuracy. This configuration ensured clear visibility of drivers during critical moments, as they decelerate while approaching the stop sign, come to a full stop, and begin to accelerate again. These low-speed movements reduced motion blur, allowing the model to reliably detect seat belt status. The zoom level also provided detailed views of the vehicle interior, further enhancing detection performance.
UAV positioning and deployment adaptability are important considerations for real-world implementation. While positioning the UAV with its back to the sun was found to improve visibility and reduce glare, this optimal setup may not always be feasible due to fixed road orientations, nearby obstructions (e.g., buildings, billboards, utility poles), or limited UAV placement zones. As observed at the 330th Street and Linn Street intersection, physical constraints can restrict ideal placement. In such cases, compromises may be necessary, such as scheduling data collection during periods with favorable lighting, prioritizing observation of specific intersection approaches where lighting is more manageable, or adjusting UAV positioning to balance visibility, safety, and sun direction. These factors must be considered during deployment planning to ensure system scalability and reliability across diverse field environments. Future improvements could explore adaptive solutions, such as rotating UAV mounts or polarizing camera filters, to further mitigate glare-related impacts.
In addition to lighting and placement, weather conditions—particularly wind speed—should also be considered during deployment planning. For safety and image stability, data collection should be prioritized on days when wind speeds remain below the recommended 25 mph threshold. Strong winds can cause the tethered line to shift erratically, compromising both UAV stability and flight safety. Ensuring stable flight conditions is critical for capturing clear, consistent footage for accurate seat belt detection.
4.2. Automating Seat Belt Compliance Monitoring–Model vs. Manual Review
The deployment of the seat belt detection model at two stop-controlled intersections, 330th–Linn with a simple one-lane-per-approach setting and North Dakota–Ontario with a complex three-lane-per-approach setting, demonstrated its reliability under real-world monitoring challenges. Manual reviews, simulating traditional methods, were compared against the model’s (automated system) performance.
The comparison criteria for manual reviews were designed to simulate the conditions faced by traditional surveyors who often stand on level ground. However, even these conditions pose significant challenges for accurate observations. Surveyors have been known to stand behind trucks to gain a better view of windshields or observe from overpasses when possible. For example, in a national seat belt compliance report [
8], surveyors explicitly stated the advantages of observing from overpasses: “Whenever possible, observations for high-volume, limited-access roadways were made from an overpass, allowing for easy viewing of seat belt use for both the driver and the passenger.” This comparison highlights that the UAV-based system, which provides a consistent top-down view and enhanced zoom capabilities, replicates and even surpasses the preferred observational settings for manual surveys, offering a fair and practical benchmark.
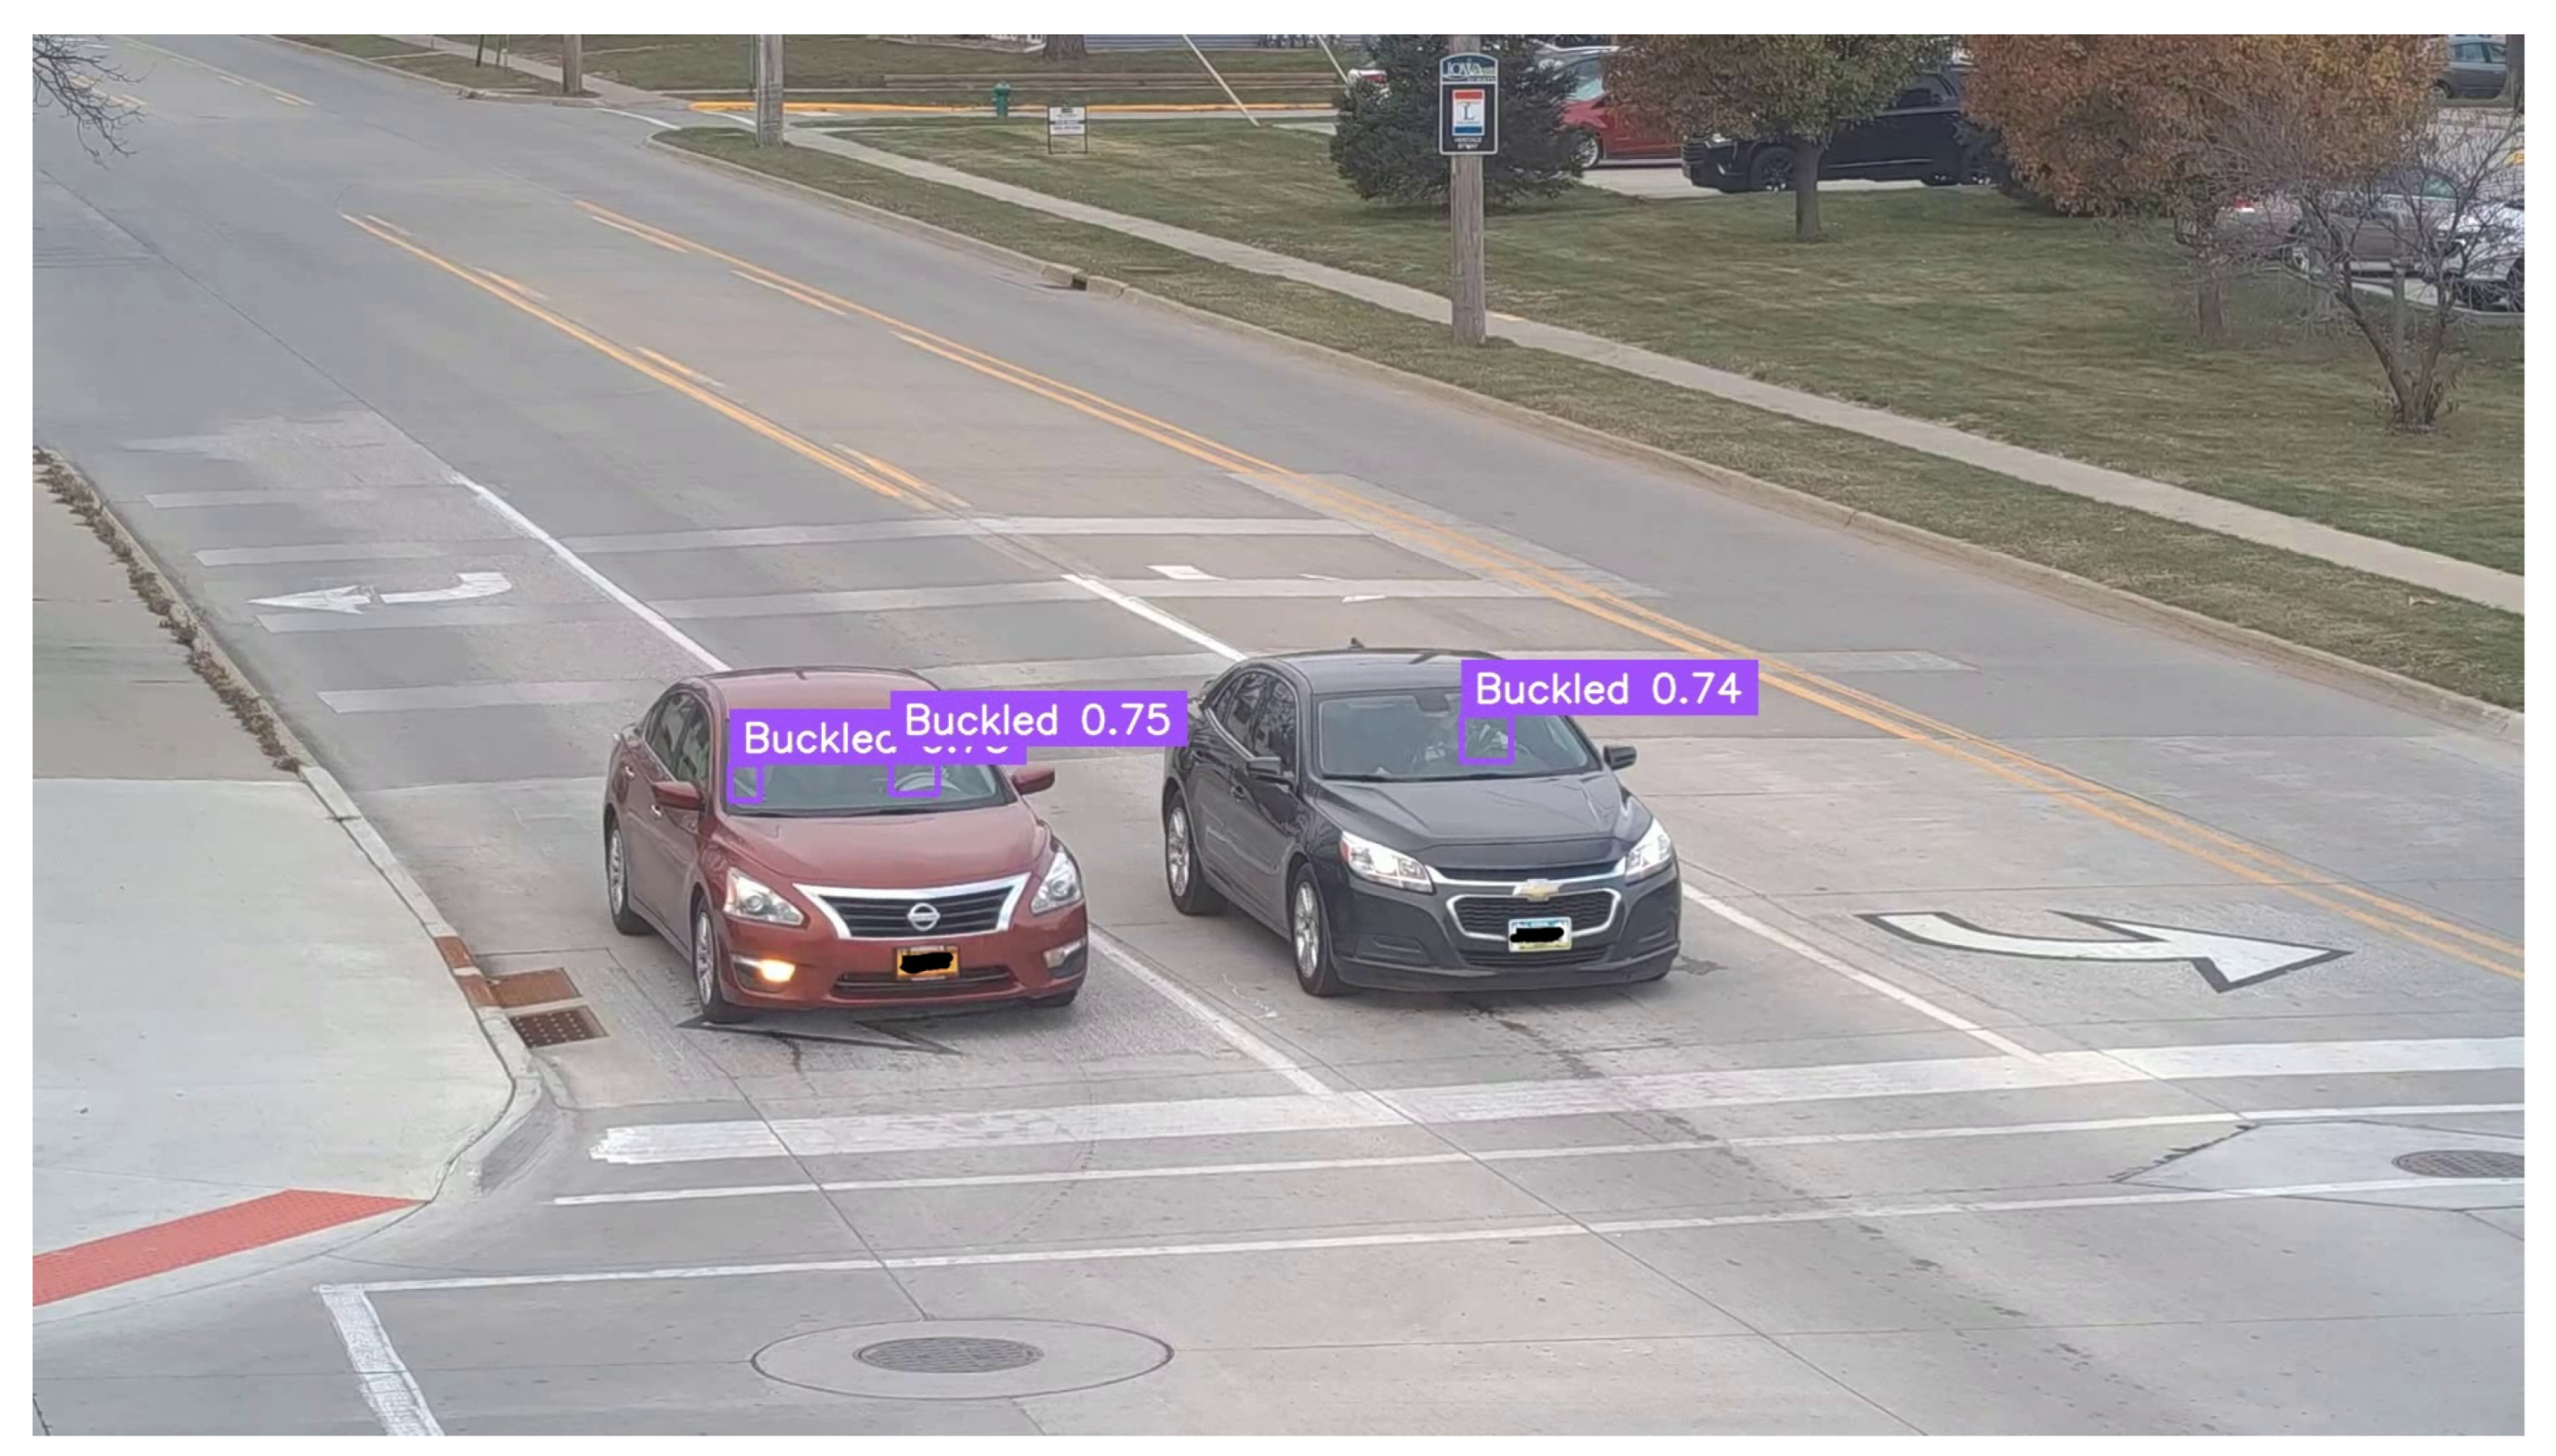
At North Dakota–Ontario, during single-pass observations—reflective of real-world monitoring—reviewers struggled to determine seat belt status reliably. When all lanes were occupied, with some lanes having multiple vehicles lined up moving through the intersection, reviewers found it difficult to keep pace. Conditions such as low color contrast between seat belt and occupant clothing, tinted windshields, fast-moving vehicles, and the cloudiness on-site overwhelmed reviewers, resulting in many missed detections and a very low accuracy of 53.30%. In contrast, the YOLO11 model handled these complexities with ease, detecting seat belt status with an accuracy of 90.66% and no misclassifications, reporting an excellent compliance rate. The model’s ability to simultaneously process multiple lanes and trailing vehicles, unaffected by visibility constraints, showcased its clear advantage over manual methods and reinforced its suitability for real-world seat belt compliance monitoring.
Ideally, the tethered UAV is positioned at a safe distance from utility poles to prevent any potential interference with the tether line during flight. However, at the 330th Street and Linn Street intersection, even a reasonable and typically acceptable distance from nearby utility poles was complicated by the presence of a large billboard adjacent to the roadway. In the event of strong winds, this billboard posed an additional risk of tether entanglement or obstruction. As a result, the UAV’s position had to be adjusted to maintain flight safety and tether clearance. Alternative UAV placements that would have enabled full capture of the stop-and-go cycle would have required the UAV to face direct sunlight. However, the experimental results from this study (
Section 3.3) showed that UAVs facing sunlight experienced glare and shadow interference, which negatively affected detection accuracy. To avoid these issues, we prioritized camera positioning with favorable lighting. This further limited our ability to record the complete stop cycle, restricting footage to vehicles approaching the intersection and beginning to decelerate. In some cases, drivers did not begin slowing down until they reached the stop bar.
Despite these limitations, the model demonstrated strong performance, correctly detecting seat belt usage in 103 out of 114 vehicle pass observations (90.35%), compared to 72.81% achieved through manual video review under the same conditions. It is also worth noting that the posted speed limit at this intersection was 25 mph, which may have contributed to favorable detection outcomes, even when some vehicles did not fully decelerate.
Although the model achieved commendable accuracy, there is room for refinement to further reduce the number of instances classified as “unknown”. The application of a 0.70 confidence threshold significantly enhanced reliability by minimizing false detections, but it also excluded detections with potential for improvement. For example, at North Dakota–Ontario, applying the threshold resulted in zero misclassifications, compared to seven without the threshold, but 11 instances were still categorized as “unknown”. Future iterations of the model should aim to reduce these ambiguous outcomes by improving confidence in challenging conditions, such as low-contrast settings or partially obstructed views. Each instance of detected and classified driver seat belt compliance was meticulously verified, yielding highly satisfactory results.
4.3. Automating Seat Belt Compliance Monitoring–Model vs. LLMs
Despite GPT-4 V(ision)’s ability to detect seat belt usage with slightly higher accuracy, its computational cost and inference time present scalability concerns. Each inference requires token-based API calls, making large-scale deployment costly, whereas our model runs inference at no additional expense, ensuring seamless and cost-effective implementation.
The study also highlights the inherent challenges in seat belt detection. GPT-4V’s justifications point to common sources of uncertainty, such as low image resolution, lighting variations, and seat belt blending with clothing. However, our model was specifically designed to address these limitations through targeted evaluation studies and training on diverse datasets. This structured approach enhances its ability to perform reliably across different conditions, reinforcing its adaptability to real-world scenarios.
By balancing accuracy, efficiency, and scalability, our model provides a practical and deployable solution for automated seat belt compliance monitoring, making it well-suited for large-scale enforcement and traffic safety applications.
Cost Analysis of GPT-4 V(ision) for Seat Belt Detection
The cost of using OpenAI’s GPT-4 V(ision) for seat belt detection is determined by its token-based pricing model, which accounts for both input tokens (image encoding and prompt) and output tokens (AI-generated response). GPT-4 V processes images in 512 × 512-pixel tiles, with a token cost per tile calculated as follows:
where
n represents the number of 512 × 512 tiles required to cover the image. For a 1365 × 768-pixel image,
n is obtained by dividing the width:
rounding up each, and multiplying:
leading to an estimated 1105 input tokens.
Additionally, GPT-4V generates a text-based response (300 output tokens) for seat belt classification, confidence score, and reasoning.
Using OpenAI’s pricing (USD 0.01 per 1000 input tokens, USD 0.03 per 1000 output tokens), the cost breakdown is shown in
Table 11.
4.4. Implications and Future Research Directions
By employing a tethered UAV system and a customized YOLO11 model, this study demonstrates a practical and reliable method for monitoring seat belt use at stop-controlled intersections. Traffic enforcement agencies can adopt this system to enhance compliance monitoring, inform safety policies, and ultimately reduce severe injuries and fatalities.
- 2.
Insights into Factors Affecting Seat Belt Detection
The study provides valuable insights into factors influencing seat belt detection performance, including seat belt–shirt color contrast, sunlight direction, and vehicle type. Understanding these variables is essential for optimizing deployment strategies and ensuring consistent detection accuracy in diverse field conditions.
While this study confirms the feasibility and accuracy of UAV-based automated seat belt compliance detection, several future improvements are worth exploring. The current system relies on manual UAV positioning; however, future deployments may incorporate pre-programmed or semi-autonomous flight control—potentially supported by Simultaneous Localization and Mapping (SLAM) techniques—for enhanced localization, obstacle avoidance, and dynamic repositioning in response to fluctuations in traffic flow or changing approach patterns and geometric constraints. SLAM integration could also facilitate smarter navigation around roadside obstructions and ensure consistent viewpoint framing despite varying infrastructure layouts.
In addition, addressing the challenges posed by direct sunlight remains critical. The strategic placement of the UAV with its back to the sun was shown to minimize glare and shadow interference; however, future systems may benefit from adaptive hardware enhancements such as polarizing camera filters, automatic gimbal adjustments, or exposure correction algorithms to maintain visibility when ideal positioning is not feasible.
Seat belt compliance systems can also evolve beyond detection to support real-time feedback and enforcement. For instance, dynamic message signs could be installed to encourage seat belt use, similar to speed feedback signs. In cases where a driver is detected without a seat belt, an immediate alert could be sent to law enforcement, or repeated violations could be logged to prompt targeted interventions. A regular analysis of these data could also reveal patterns of noncompliance, enabling safety implementations tailored to specific locations or demographic groups. By integrating detection, enforcement, education, and incentives, future systems can promote long-term behavioral change and contribute to broader traffic safety goals.
4.5. Study Limitations
Although data augmentation processes simulated extreme conditions, actual extreme weather conditions and nighttime footage were not tested. These factors could significantly impact detection accuracy. Future studies should include data collection under a broader range of environmental conditions, such as heavy rain, snow, fog, and low-light or nighttime scenarios, to thoroughly evaluate the model’s robustness.
- 2.
Front Seat Passenger Detection
The model performs exceptionally well in detecting drivers but struggles with the consistent detection of front seat passengers in certain scenarios. It performs well when vehicles are directly facing the UAV, but detection accuracy decreases when vehicles are inclined, and the windshield pillar obstructs the view of the front passenger. Addressing this limitation in future iterations could further improve the model’s reliability.
- 3.
Higher-Speed Environments
This study focused on seat belt detection at stop-controlled intersections, where drivers are generally expected to slow down or stop. As such, the model’s performance in higher-speed traffic environments remains untested. Future work should investigate detection accuracy in scenarios where vehicles are moving at higher speeds, such as arterial roads or highways, to assess the model’s applicability in broader traffic contexts.


 ,
, 

