Communication

Impact of the May 2024 Extreme Geomagnetic Storm on the Ionosphere and GNSS Positioning

by
Ekaterina Danilchuk
1,2,
Yury Yasyukevich
1,*,
Artem Vesnin
1,
Aleksandr Klyusilov
1 and
Baocheng Zhang
3
1
Institute of Solar-Terrestrial Physics of Siberian Branch of Russian Academy of Sciences, 664033 Irkutsk, Russia
2
Faculty of Physics, Irkutsk State University, 664003 Irkutsk, Russia
3
State Key Laboratory of Geodesy and Earth’s Dynamics, Innovation Academy for Precision Measurement Science and Technology, Chinese Academy of Sciences, Wuhan 430077, China
*
Author to whom correspondence should be addressed.
Remote Sens. 2025, 17(9), 1492; https://doi.org/10.3390/rs17091492
Submission received: 15 March 2025 / Revised: 16 April 2025 / Accepted: 22 April 2025 / Published: 23 April 2025

Abstract

:
Global navigation satellite systems provide important data sets that can be used to study the influence of various space weather factors. We analyzed the effects of the main phase of the May 2024 extreme geomagnetic storm on the ionosphere and GPS kinematic precise point positioning (PPP). ROTI and global ionospheric maps showed the ionospheric dynamics. The auroral oval expanded up to low latitudes: up to 30°N in the American sector and up to 45°N in the European–Asian sector during the main phase of the geomagnetic storm. The ROTI peaked at 2 TECU/min, which is four times as much against the background. The equatorial anomaly crest intensified considerably (up to 200 TECU) and shifted poleward in the American sector. The counter-propagation finally caused the equatorial anomaly to cross the auroral oval boundary. The ROTI correlated with errors in the kinematic PPP. Positioning errors increased 1.5–5 times at the boundary of the auroral oval. Increased positioning errors propagated according to the shift of the auroral oval boundary. The geomagnetic storm significantly affected the positioning and the ionosphere, threatening various applications based on navigation and communication.

1. Introduction

Geomagnetic storms are a manifestation of the processes of powerful energy release on the Sun. The most powerful geomagnetic storms are associated with coronal mass ejections and occur when the solar wind brings the frozen solar geomagnetic field with a southern z-component [1,2]. During a geomagnetic storm, in addition to the restructuring of the current magnetospheric system, the upper atmosphere heats up and the neutral winds change [3]; the ionospheric electron density changes [1,4]; the auroral oval expands towards the equator [5,6]; ionospheric anomalies originate; and ionospheric multi-scale disturbances of electron variations appear [7], including small-scale irregularities [8]. Besides geophysical effects, geomagnetic storms significantly affect the quality of technical systems [9], including power systems [10], railway systems [11], radio equipment [12], global navigation satellite systems [13,14], and others.
It is also known that the effect of geomagnetic storms on positioning accuracy has an applied aspect. Ionospheric disturbances during geomagnetic storms have a significant impact on standard single-frequency [15] and dual-frequency [16] positioning as well as on precise point positioning [14,17]. Positioning accuracy also depends on the intensity of the geomagnetic storm.
At the same time, extreme geomagnetic storms rarely occur: for example, during solar cycle 23, only 2 storms occurred when the Kp index reached 9. In solar cycle 24, there were no such phenomena. Carrington-class storms do not seem to have occurred in the experimental era. The Québec 1989 extreme geomagnetic storm peaked −565 nT in the Dst index and significantly tested the energy system [18]. Small statistics and significant differences between extreme storms do not allow us to make satisfactory predictions of the effects of such rare but dangerous events. Therefore, each new extreme storm is of great interest.
We analyze the ionospheric response to the main phase of the May 2024 extreme geomagnetic storm using Global Navigation Satellite System (GNSS) data. This paper focuses on the auroral oval boundary and equatorial anomaly crest displacements, as well as the effects of the geomagnetic storms on GPS precise point positioning (PPP).

2. Data and Methodology

Global Navigation Satellite System (GNSS), besides positioning [19], provides information to explore near-Earth space [20]. The technique allows for ionospheric total electron content (TEC) measurements with high temporal (continuous 24-h measurements) and spatial resolution (sufficiently dense network of global and regional receivers).
To study the effects of geomagnetic storms on the ionosphere, the ROTI Index (Rate Of TEC Index) is widely used. ROTI is used to characterize small-scale ionospheric irregularities and/or rapid variations in TEC. ROTI is the root mean square of the TEC rate within a 5 min interval [21]:
R O T I = I t 2 I t 2 ,
where I is the TEC change over time t , which is a temporal resolution of measurements.
Global Ionosphere Maps (GIMs) are used to study the ionospheric response to geomagnetic storms [22,23], ionospheric anomalies [24], and stratospheric warming [25]. In particular, GIMs are used to study ionospheric equatorial anomalies, which are electron concentration maxima located on both sides of the geomagnetic equator. GIMs are currently being developed by several analytical centers that use different approaches to reconstruct vertical TEC and spatial interpolation [26]. At the same time, the accuracy of the different maps is approximately comparable for our study. We used UQRG GIM, which is a rapid product developed by the scientific center of Universitat Politècnica de Catalunya. UQRG maps involve GNSS carrier phase TEC observations for tomographic model and kriging interpolation. UQRG maps have a temporal resolution of 15 minutes and a spatial resolution of 2.5°/5° in latitude/longitude (i.e., from −87.5° to 87.5° in latitude and from 0° to 360° in longitude) [26,27]. Global ionospheric maps in IONEX format [28] are available in the public domain (https://cddis.nasa.gov/archive/gnss/products/ionex/, accessed on 15 March 2025).
To estimate the impact of geomagnetic storms on navigation, we analyzed the changes in GPS kinematic precise point positioning. We used the open-source software GAMP (GNSS Analysis software for multi-constellation and multi-frequency Precise point positioning) [29] to calculate receiver coordinates and evaluate the positioning error. The “forward” PPP solution option was used. Important models and parameters used in the PPP are listed in Table 1. The 23-h medians (one hour was excluded to avoid convergence time effects) of the coordinates were considered as the reference coordinates of the receivers. The total 3D positioning error was calculated as the difference between the median and instantaneous position:
σ = X 2 + Y 2 + Z 2   ,
where X , Y , and Z are deviations of the measured coordinate from the median coordinate in three directions.
The online tool SIMuRG (https://simurg.space/, accessed on 15 March 2025) [30] processes and visualizes GNSS-based ionospheric data. SIMuRG provides ROTI and TEC-based data. The full data set included more than 6000 stations from the International GNSS Receiver Networks [31], the Federal Center for Navigation Data [https://fcnd.ru/, accessed on 15 March 2025], and CORS base station networks [https://eft-cors.ru/, accessed on 15 March 2025]. Figure 1 shows the locations of GNSS receivers.

3. Results

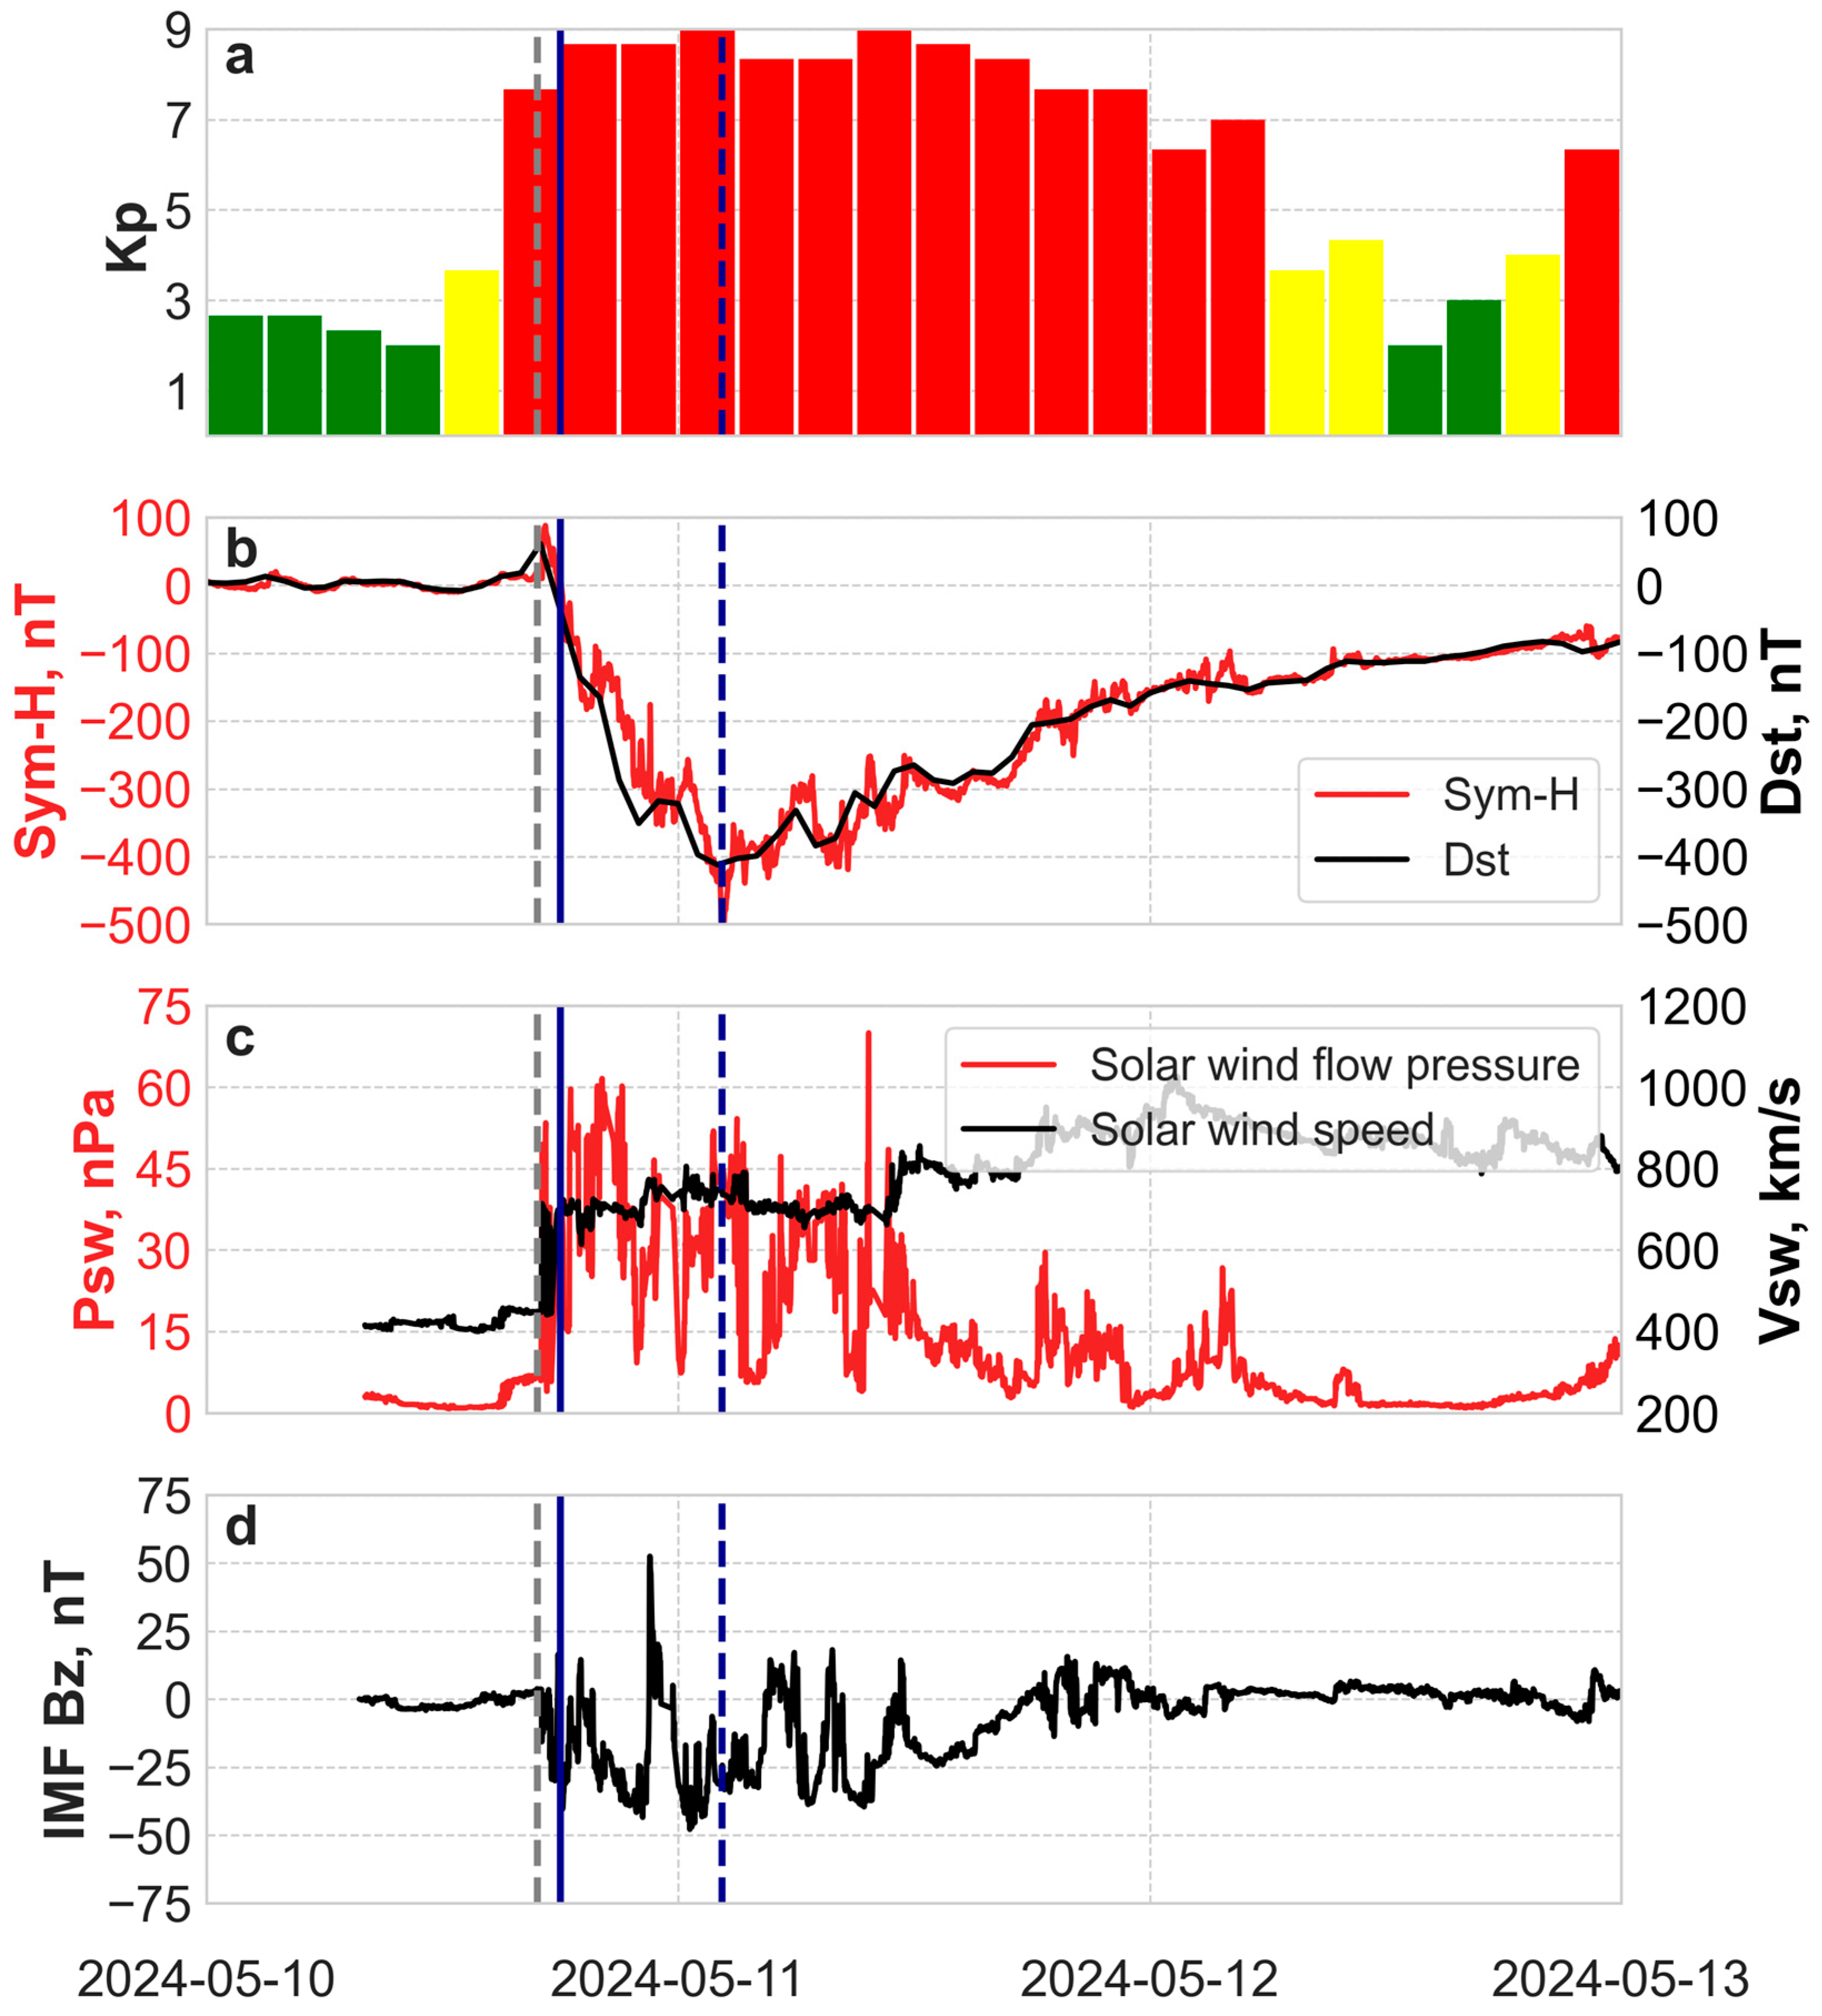
3.1. May 2024 Extreme Geomagnetic Storm

The geomagnetic storm of May 2024 is currently the most powerful geomagnetic storm of solar cycle 25. From 2 to 14 May, the active region of Sun 13664 was observed. On 8–9 May 2024, four X-class solar flares were recorded, causing several coronal mass ejections towards the Earth, which reached the Earth’s magnetosphere at 16:40 UT on 10 May. A sharp increase in the solar wind speed (from 460 to 690 km/s) and a corresponding increase in the dynamic pressure led to the sudden storm commencement (Figure 2).
The initial phase of the geomagnetic storm (shown in Figure 2 between the grey dashed line and the blue line) lasted ~2 hours and was characterized by an increase in the Dst index up to 62 nT at 17:00 UT on 10 May (the maximum value of the SYM-H index is 88 nT at 17:15 UT on 10 May). After 17:15 UT, the SYM-H index started to decrease (Figure 2b). The Dst index reached a minimum of −412 nT at 03:00 UT on 11 May 2024 and the SYM-H −518 nT at 02:14 UT on 11 May 2024. The recovery phase of the geomagnetic storm continued until 19 May (so, some researchers consider the storm as a 10–19 May geomagnetic storm [32]). The Kp index varied between 8333 and 9000 during the main phase and at the beginning of the recovery phase. The maximum value of the Kp index reached 9 during 00-03 UT and 09-12 UT on 11 May (Figure 2a).

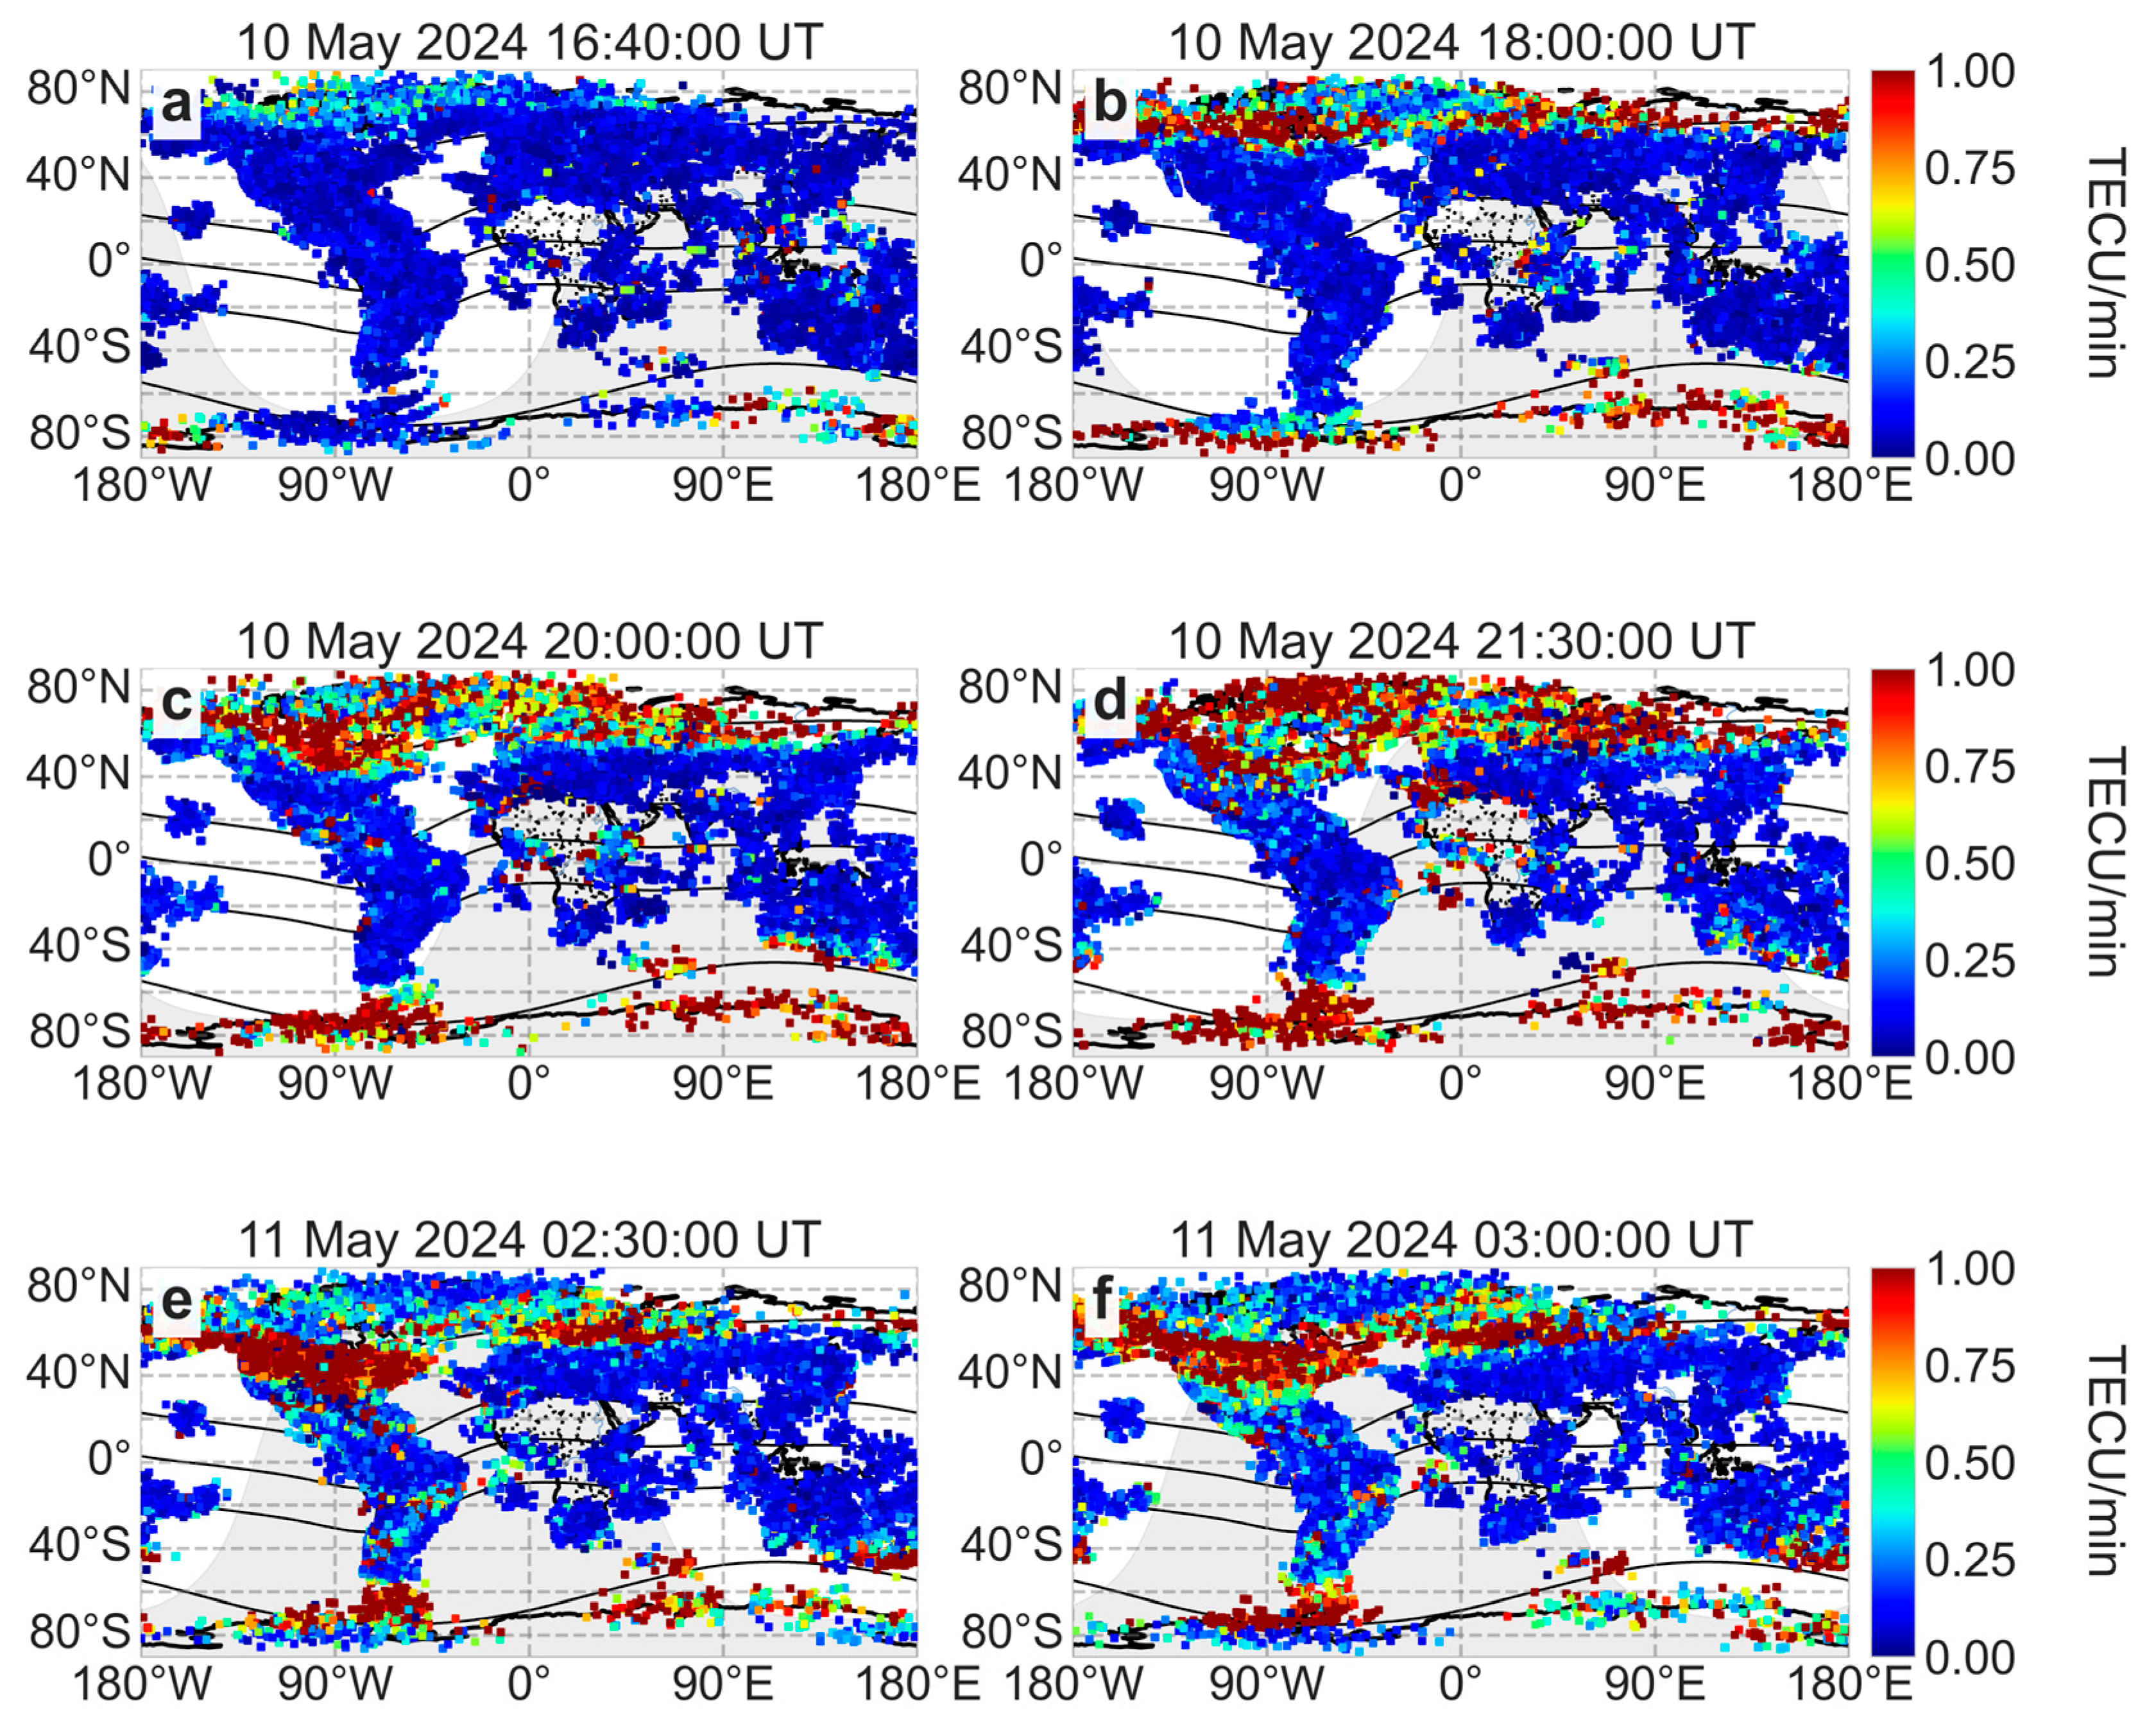
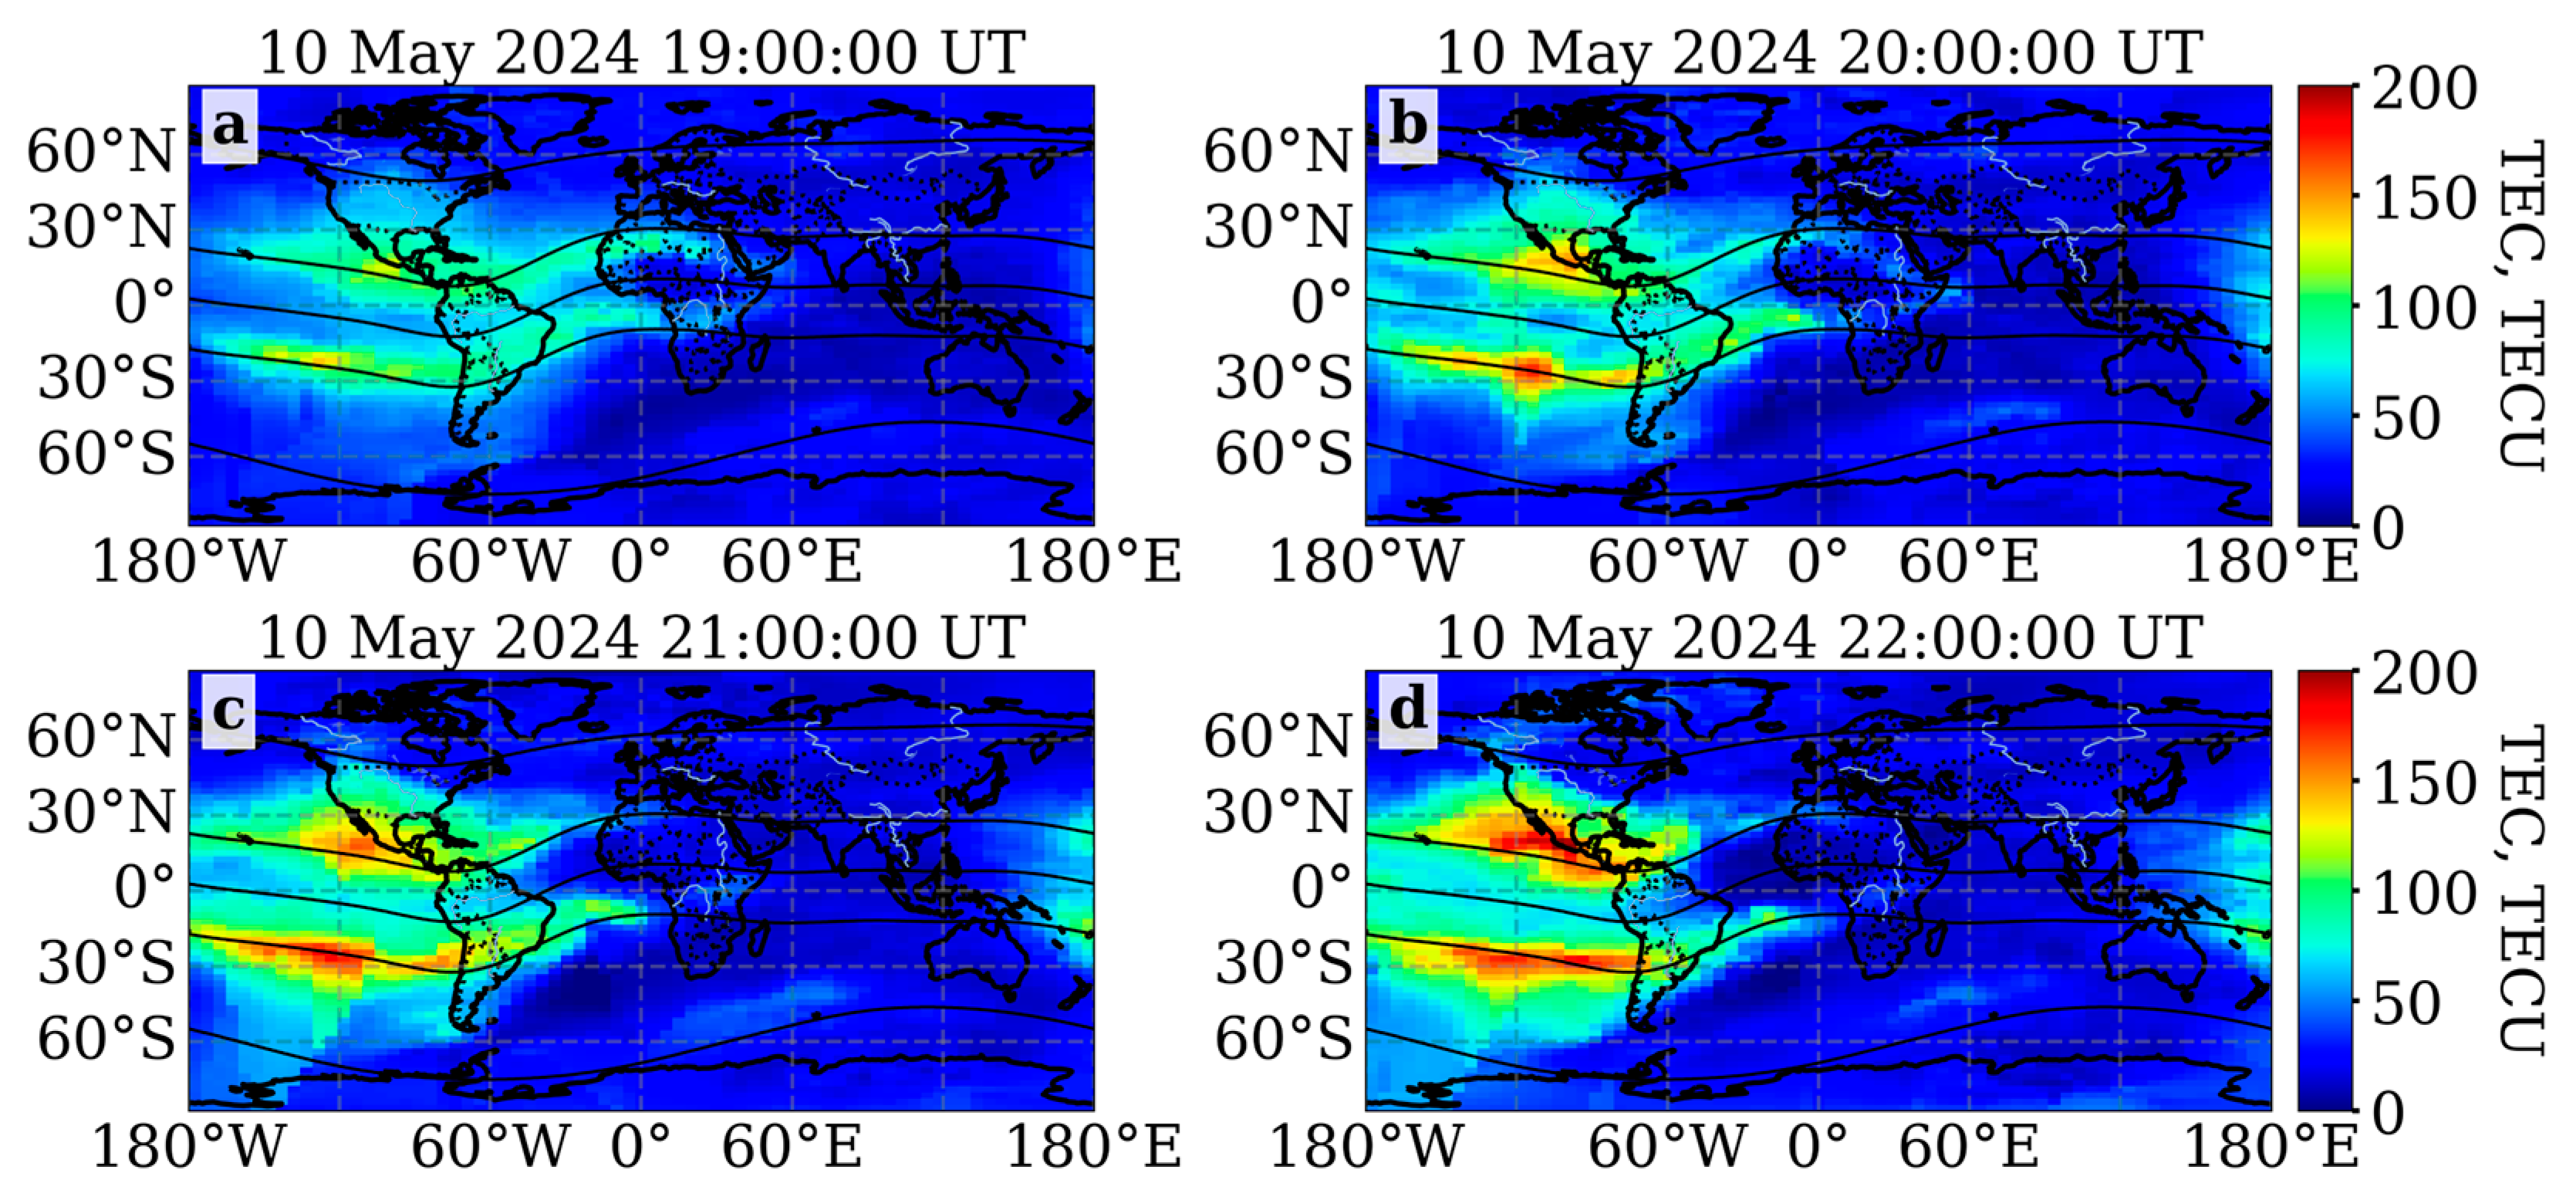
3.2. Ionospheric Disturbances

ROTI characterizes the irregular ionospheric structure during the geomagnetic storm. Figure 3 shows the ROTI dynamics on a global scale during the main phase of the May 2024 extreme geomagnetic storm. The snapshots present the spatial distribution of ROTI at the beginning and during the main phase of the geomagnetic storm. The dots indicate the ionospheric pierce points. The color of the dots reflects the ROTI value.
Since the beginning of the geomagnetic storm at 16:40 UT, the ROTI values increased up to 0.5 TECU/min in the polar regions of both hemispheres. At the same time, the values of the ROTI index do not exceed 0.2 TECU/min at mid- and low latitudes. At the beginning of the main phase of the geomagnetic storm, ROTI increased by more than 0.75 TECU/min at high latitudes. The response to the geomagnetic storm is stronger in the northern hemisphere. During the main phase of the geomagnetic storm, the auroral oval expands up to 30°N and 60°S in the American sector. In contrast, the auroral oval boundary only expands up to 45°N and 40°S in the European–Asian sector (Figure 3b–f). The auroral oval boundary displacement peaked at 02:30 UT on 11 May 2024, when the ROTI values reached 2 TECU/min at 40°N geomagnetic latitude (Figure 3e). During the recovery phase, the ROTI values gradually decreased and the auroral oval boundary was restored to normal conditions.
The equatorial anomaly characterizes the equatorial ionosphere. The equatorial anomaly crest considerably intensified and shifted poleward in the American sector. During the main phase of the geomagnetic storm, the equatorial anomaly extended to about 50°N and 55°S from 21:00 UT until 22:30 UT on 10 May 2024 (Figure 4). During this period, maximum TEC values reached about 175–200 TECU at ~20° geomagnetic latitudes in both hemispheres.
During the main phase of the geomagnetic storm, the auroral oval boundary and the equatorial anomaly crossed at ~21:00 UT on 10 May 2024 (Figure 5, top panel). The maximum intersection of these areas was observed at 21:45 UT on 10 May 2024 (Figure 5, bottom panel). These two areas very rarely overlap (usually mid-latitudes split them), only occurring during extreme geomagnetic storms. In this case, the overlapping effects may distort the signals and lead to poor positioning.

3.3. GPS Positioning During Geomagnetic Storm

We used Equation (2) to calculate the total 3D positioning error in the GPS kinematic PPP mode. Figure 6 shows the global dynamics of positioning errors during the main phase of the May 2024 extreme geomagnetic storm. The snapshots present 3D error dynamics at sudden storm commencement and during the main phase of the geomagnetic storm.
GPS positioning is unaffected at the beginning of the geomagnetic storm at 16:40 UT and during the first 30 minutes of the main phase (Figure 6a,b). During this period, the 3D errors do not exceed 0.2 m. However, some receivers on the west coast of America had positioning errors of more than 0.5 m. After 18:30 UT, the 3D errors sharply increased at high latitudes in the eastern hemisphere. Single 3D errors exceeded 1.5 m. Increased positioning errors propagated to the mid-latitudes up to 30°N (Figure 6d,e), consistent with the shift of the auroral oval boundary (Figure 3). Positioning errors increased 1.5–5 times at the auroral oval boundary. This increase in positioning errors may be due to carrier phase tracking disruption as well as ionospheric disturbances of electron variations, including small-scale irregularities, that occur on the auroral oval during the geomagnetic storm.
In North America, after 21:30 UT on 10 May 2024, the positioning errors sharply increased 2–4 times. First, the increased positioning errors are related to the shift of the auroral oval boundary (Figure 3). Second, the intersection of the auroral oval boundary and the equatorial anomaly could increase 3D positioning errors in this region (Figure 5). At the end of the main phase of the geomagnetic storm, we observe positioning errors of more than 1–1.5 m in North America and errors above the average level at the auroral oval boundary in Europe (Figure 6f).
A similar behavior of the positioning errors is also observed in the southern hemisphere. After 19:00 UT on 10 May 2024, the 3D positioning errors increased 1.5-3 times at the auroral oval boundary. In the southern hemisphere, the positioning errors propagated to the mid-latitudes up to 45°S (Figure 6d,e). In the northern hemisphere, they are smaller. At the end of the main phase of the geomagnetic storm, the positioning errors increased up to 2.5 times at the 20°S geomagnetic latitude and in New Zealand.
Figure 7 shows the 3D positioning error dynamics of some individual GNSS receivers located in the northern hemisphere (TIXG, DAEJ, BOAV, and CAS1). These receivers characterized the positioning error dynamics at high (TIXG), mid- (DAEJ and HLFX), and low (BOAV) latitudes during the main phase of the geomagnetic storm.
At the beginning of the day (about 1–2 h), the large 3D positioning errors were due to the forward-type solution in the GAMP [29]. Before the geomagnetic storm, the average values of the 3D positioning errors did not exceed 0.2 m. In addition, the dynamics of the 3D errors did not show strong changes before the geomagnetic storms.
However, at 18:00 UT on 10 May 2024, the positioning errors sharply increased at high latitudes in both hemispheres (e.g., TIXG receiver in Figure 7). The 3D errors exceeded 1.5 m. Many high-latitude receivers showed this behavior (Figure 6). In addition, the TIXG receiver showed jumpy behavior due to carrier phase tracking disruption. This could be caused by the crucial change in the high-latitude ionosphere during the main phase of the geomagnetic storm, resulting in the loss of phase locks and problems with the ambiguity resolution.
The beginning of the main phase of the geomagnetic storm (from 18:00 UT to 23:00 UT on 10 May 2024) had little effect on the 3D positioning errors at mid- and low latitudes (DAEJ, BOAV, and HLFX receivers in Figure 7). At this time, the positioning errors did not change and remained at the same level (e.g., HLFX receiver in Figure 7), increased by a few centimeters (e.g., DAEJ receiver in Figure 7), or decreased (e.g., BOAV receiver in Figure 7).
Between 20:00 UT and 22:00 UT, the positioning errors started to increase in the DAEJ, BOAV, and HLFX receivers. This can be attributed to the shift of the auroral oval boundary to low latitudes. Furthermore, the increased positioning errors on the HLFX receiver at this time can be attributed to the shift of the auroral oval boundary and the extension of the equatorial anomaly (Figure 5). The increased positioning errors persisted until the end of the day on 10 May 2024.

4. Discussion

Based on the GNSS data, we studied the ionospheric response to the main phase of the May 2024 extreme geomagnetic storm of solar cycle 25. The ROTI variations, the equatorial anomaly, and the 3D positioning errors in the kinematic PPP were considered during the main phase of the geomagnetic storm, which lasted for 9 hours from 18:00 UT on 10 May to 03:00 UT on 11 May 2024 (Figure 2). The full picture of the ionospheric response and the dynamics of the 3D positioning errors during the main phase of the geomagnetic storm can be found in the Supporting Information of this article.
The importance of this study is due to the impact of geomagnetic storms on radio technical systems [9], including GNSS [13,14]. GNSS are not only important for navigation itself: when geomagnetic storms adversely affect the GNSS timing signals, it could influence the electricity distribution networks [33]. Geomagnetic storms influence the ionospheric TEC [34] and can degrade single-frequency navigation. They also cause ionospheric scintillations that affect the GNSS signal tracking and positioning accuracy [35,36]. Some effects could be due to overlapping with solar flares that occurred during the storm period [36,37].
Variations in the structure of the equatorial anomaly are caused by the electrodynamic effects of a prompt penetration electric field and the mechanical effect of the neutral winds [38,39,40]. During the main phase of the geomagnetic storm, we observed an increase in TEC up to 200 TECU in the equatorial anomaly crest (Figure 4). Our results are in agreement with those of other authors [41,42]. Mannucci et al. [41] demonstrated an extreme ionospheric response to storms that occurred on 29–30 October 2003 (Dst = −350 nT, Kp = 9). The TEC values increased up to 175 TECU. Astafyeva et al. [42] studied the ionospheric response to the strongest geomagnetic storm of solar cycle 24 (Dst = −234 nT, Kp = 8-). During the main phase of the 2015 St. Patrick’s Day storm, the TEC values reached 120 TECU at low latitudes.
At the same time, the equatorial anomaly has been observed to shift poleward by 8–15° during geomagnetic storms [41,43,44]. The nighttime ionospheric response to a geomagnetic storm was studied in [45]. During the main phase of the 23–29 September 2020 geomagnetic storm (SYM-H = −60 nT), the equatorial anomaly crests shifted 8–10° poleward. Similar to this work, Oyedokun et al. [46] observed the equatorial anomaly shift poleward in the American sector during the 1 June 2013 geomagnetic storm (SYM-H = −137 nT). We observed the equatorial anomaly crests shift up to 20° poleward in the American sector (Figure 4). Differences in TEC in the equatorial anomaly and the poleward shifts indicate that this geomagnetic storm affected the ionosphere more.
In the equatorial ionosphere after sunset, we also observed the equatorial plasma bubbles [47] moving from East Asia towards Africa. Adabi et al. [48] studied the equatorial plasma bubbles in Southeast/East Asia before and during the main phase of the geomagnetic storm. Global ROTI maps (Figure 3, Supplementary Materials Video S1) and ROTI keograms (Figure 8) could provide a more detailed picture: the equatorial bubbles were more efficiently generated in the South American region. It is likely that this resulted in significant degradation of the ambiguity resolution and navigation precision by the Canadian Spatial Reference System Precise Point Positioning (CSRS-PPP) service [49].The ultra-low frequency waves (Pi3/Pc5) also could influence small-scale ionospheric irregularities and result in GNSS phase scintillations [50]. So, storm-related Pi3/Pc5 waves could be a factor that influences positioning quality and are worth further considering.
Geomagnetic storms affect the position of the auroral oval boundary and the intensity of small-scale irregularities in the oval. This allows us to observe an increase in the ROTI values and a shift of the auroral oval boundary towards the equator during a geomagnetic storm [6]. In the auroral oval, sharp ionospheric density gradients are formed by the deposition of large numbers of energetic particles and the emissions of field-aligned currents from the magnetosphere [51,52].
To study the dynamics of the auroral oval boundary, we used keograms: distributions of time-latitudinal dependence of the averaged ROTI. Figure 8 shows the keogram for the main phase of the May 2024 extreme geomagnetic storm. The latitude bin size is 2.5°, and the time bin size is 5 min. The colors reflect the averaged ROTI values for a given latitude and time.
We observed an increase in ROTI from about 17:00 UT, which corresponds to the initial phase of the geomagnetic storm. In the northern hemisphere, the auroral oval boundary expanded up to 30°N when ROTI reached more than 1.5 TECU/min. In the southern hemisphere, the auroral oval expands up to 45°S during the main phase of the geomagnetic storm. Chernyshov et al. [53] also observed increased ROTI values in the evening hours of 10 May 2024 and a shift of the auroral oval boundary up to 45°N in the subauroral/mid-latitude region of Europe, mainly in the Kaliningrad region.
We compared the main phase of the May 2024 extreme geomagnetic storm with other strong geomagnetic storms of solar activity cycles 23 and 24. One of these occurred on 29–30 October 2003, when the Dst index first dropped to −350 nT and then dropped to −400 nT. Another geomagnetic storm is the most powerful geomagnetic storm of solar activity cycle 24. This geomagnetic storm occurred on 17–18 March 2015, when the Dst index dropped to −233 nT. Figure 9 shows the ROTI keograms for these two geomagnetic storms.
During the 29–30 October 2003 and 17–18 March 2015 geomagnetic storms, the auroral oval boundary expanded up to 50–60°N in the northern hemisphere. However, the maximum ROTI values reached more than 1.5 TECU/min during the 29–30 October 2003 geomagnetic storm and up to 1 TECU/min during the 17–18 March 2015 geomagnetic storm. Thus, the ionospheric response to the main phase of the May 2024 extreme geomagnetic storm was stronger.
Positioning errors increased during geomagnetic storms. Yang et al. [54] observed the rapid degradation of positioning accuracy at high latitudes during the main phase of the storm. We observe the same response to positioning errors in PPP mode: high positioning errors around large values of ROTI and low positioning errors around large values of TEC. At high latitudes, rapid increases in positioning errors are attributed to instantaneous ionospheric responses to geomagnetic storms in auroral regions. Most probably, ionospheric small-scale irregularities start to be generated, resulting in scintillations and adverse effects on GNSS [55]. In contrast, at mid- and low latitudes, positioning accuracy decreases a few hours after the start of the storm. We do not consider details about how the storm influenced the false detection of cycle slips [56], while it is an important mechanism for storm influence on GNSS quality.
It is also known that ionospheric irregularities formed during a geomagnetic storm lead to a decrease in positioning accuracy based on GNSS data [14]. In particular, as a result of such irregularities, 3D positioning errors in the kinematic PPP can increase 1–3 times [17]. During the main phase of the geomagnetic storm, the positioning errors exceeded more than 1.5 m in the high-latitude receivers and increased 1.5–5 times on the auroral oval boundary (Figure 6). At the same time, due to the intensity of the May 2024 geomagnetic storm, increased values of the 3D positioning errors were also observed at the mid-latitudes.
The observed effects agree with those from other research [14,17,57], where the authors studied the 17–18 March 2015 geomagnetic storm. However, the values of their 3D errors were different. In [14], the values of the 3D positioning errors in PPP did not exceed 0.4 m. We found higher error values, more than 1.5 m at high and mid-latitudes. High positioning errors are caused by the intensity of geomagnetic storms. The May 2024 geomagnetic storm was almost 2 times more intense than the storm in [14].
The authors of [58,59] pointed out that the ionospheric index ROTI and GNSS positioning errors are correlated. In fact, the ROTI correlated with positioning errors in the kinematic PPP. The positioning errors increased 1.5–5 times on the auroral oval boundary (Figure 6) when the ROTI values reached 1–2 TECU/min (Figure 3). Increased positioning errors propagated according to the shift of the auroral oval boundary. This correlation is particularly pronounced at the end of the main phase (Figure 3e,f and Figure 6e,f) at latitudes of 45–60°N in the American and 50–60°N in the European sectors.

5. Conclusions

We studied the variation of ROTI, the global ionospheric map UQRG, and the 3D positioning errors in the kinematic PPP during the main phase of the May 2024 extreme geomagnetic storm. This storm was the strongest one after the geomagnetic storm of 20 November 2003. The main conclusions are as follows:
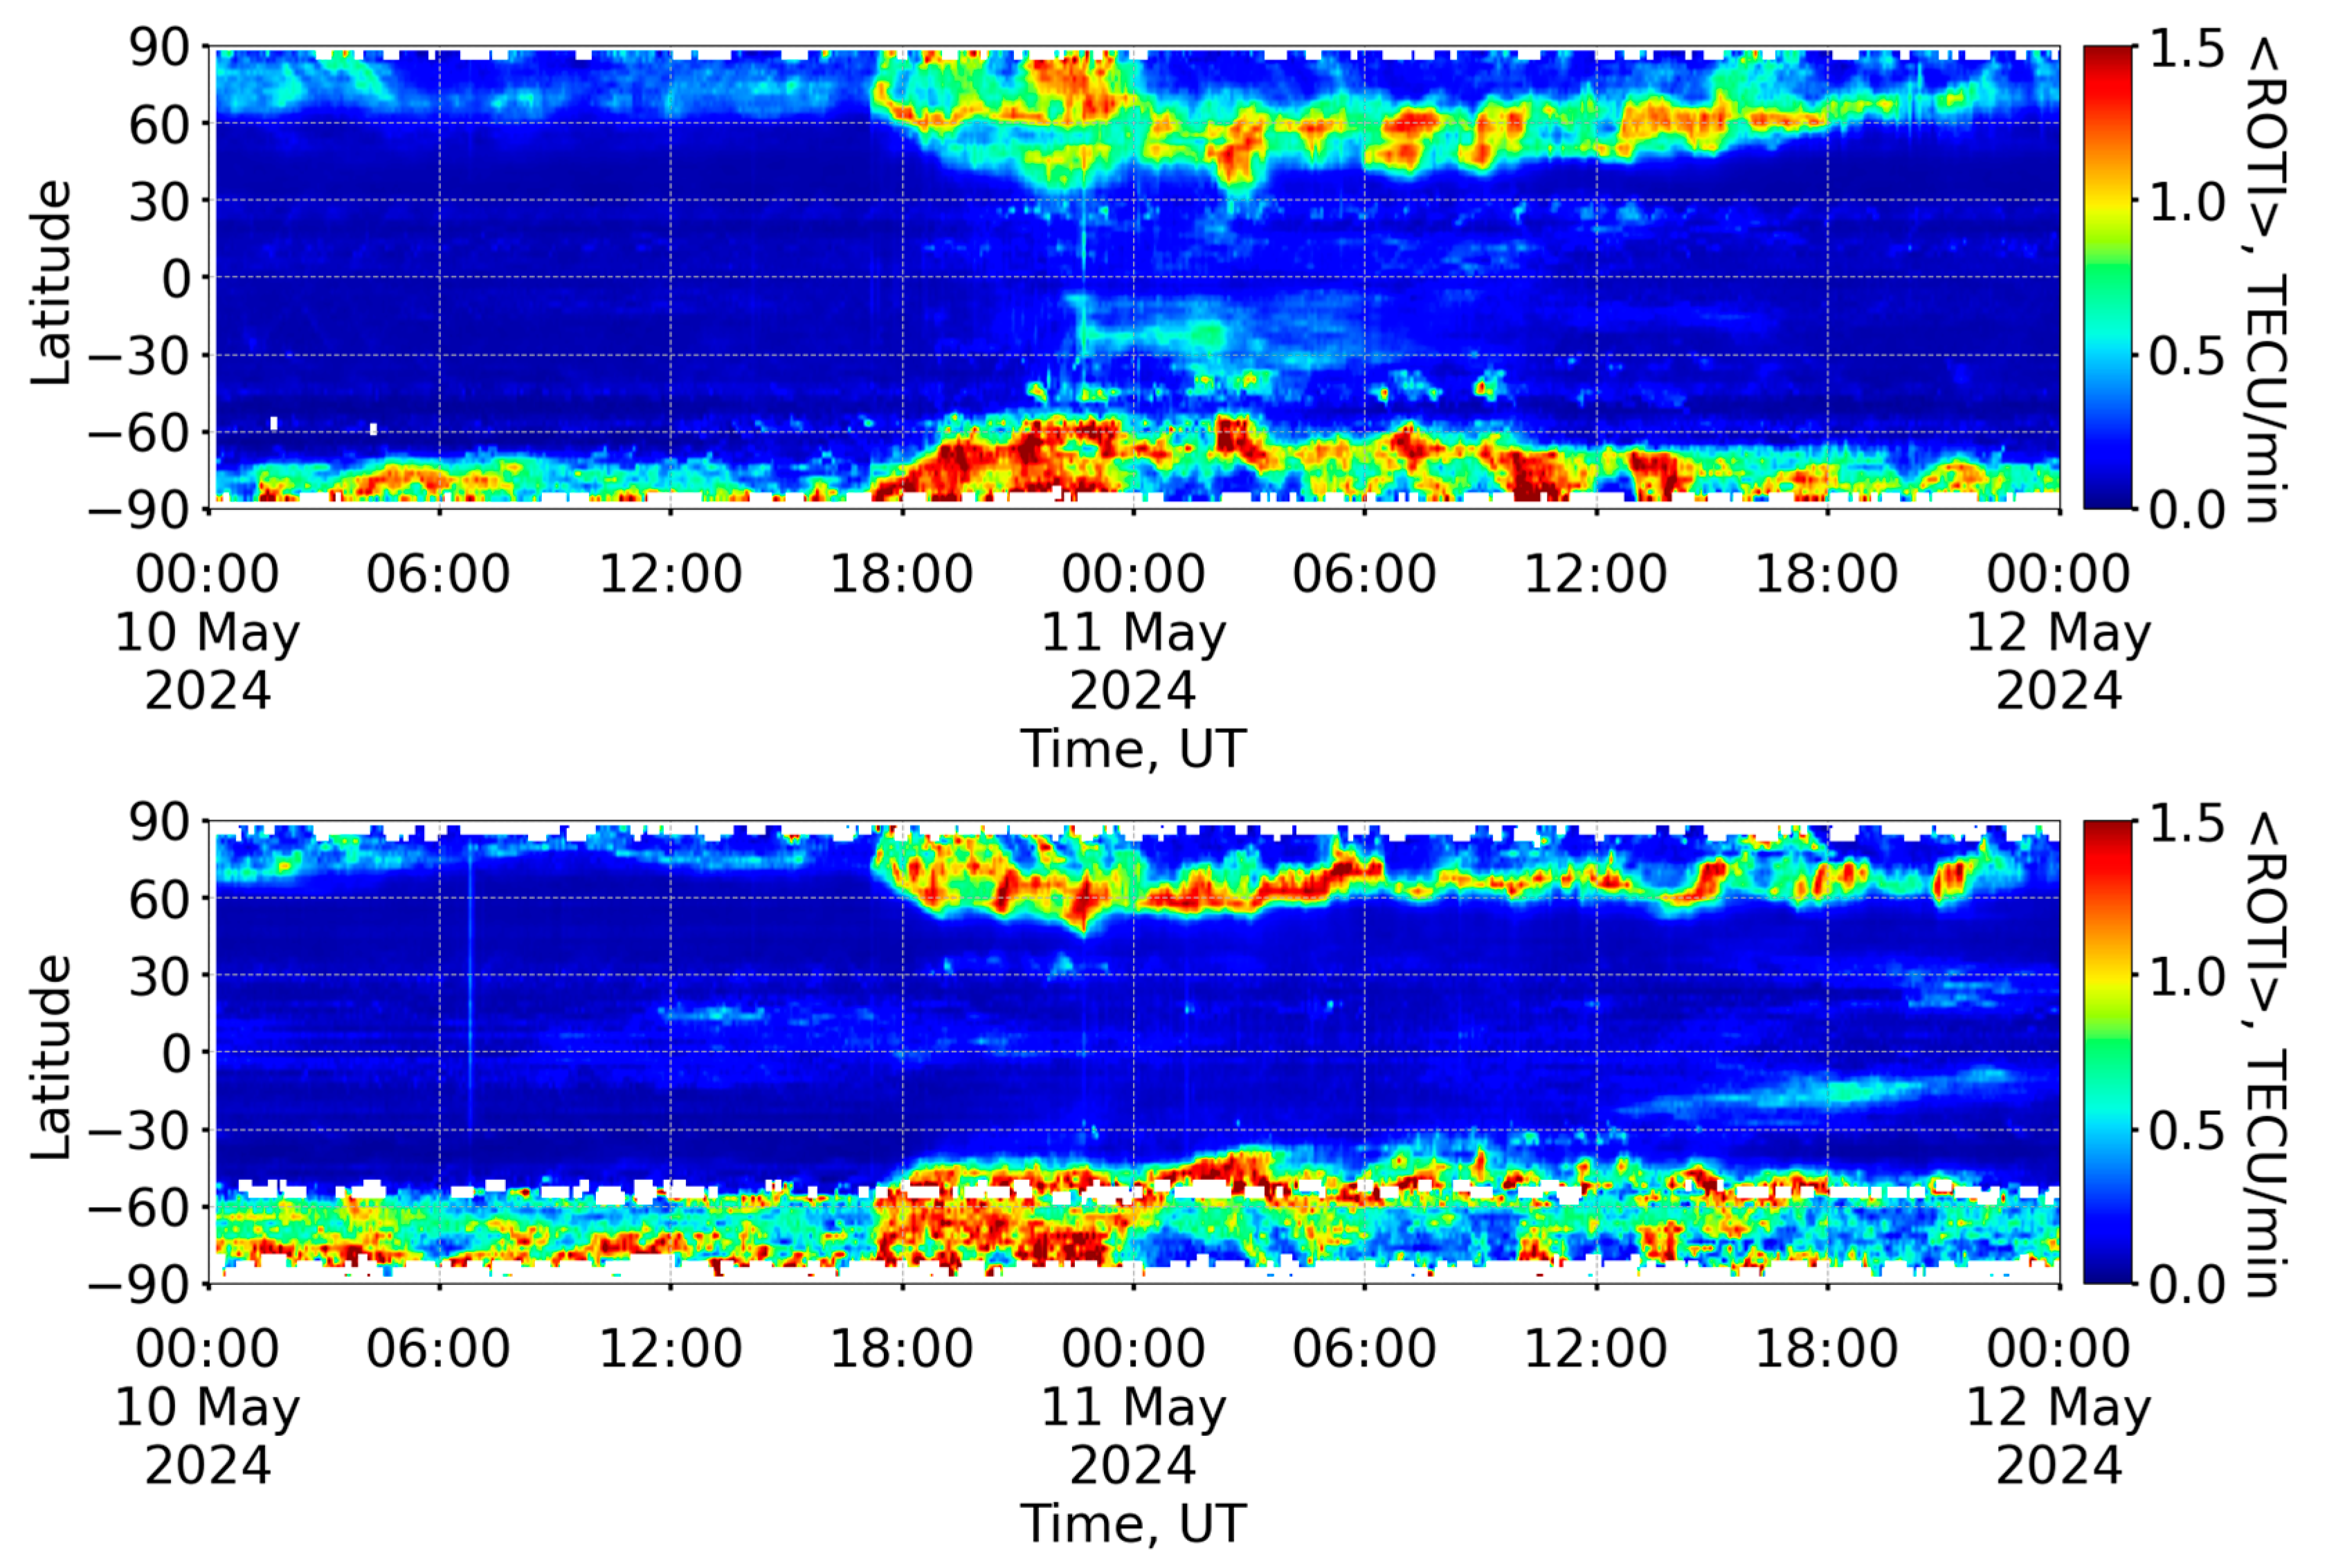
  • The auroral oval expanded up to low latitudes: up to 30°N and 60°S in the American sector and up to 45°N and 40°S in the European–Asian sector during the main phase of the geomagnetic storm. The ROTI peaked at 2 TECU/min, which is four times as much against the background.
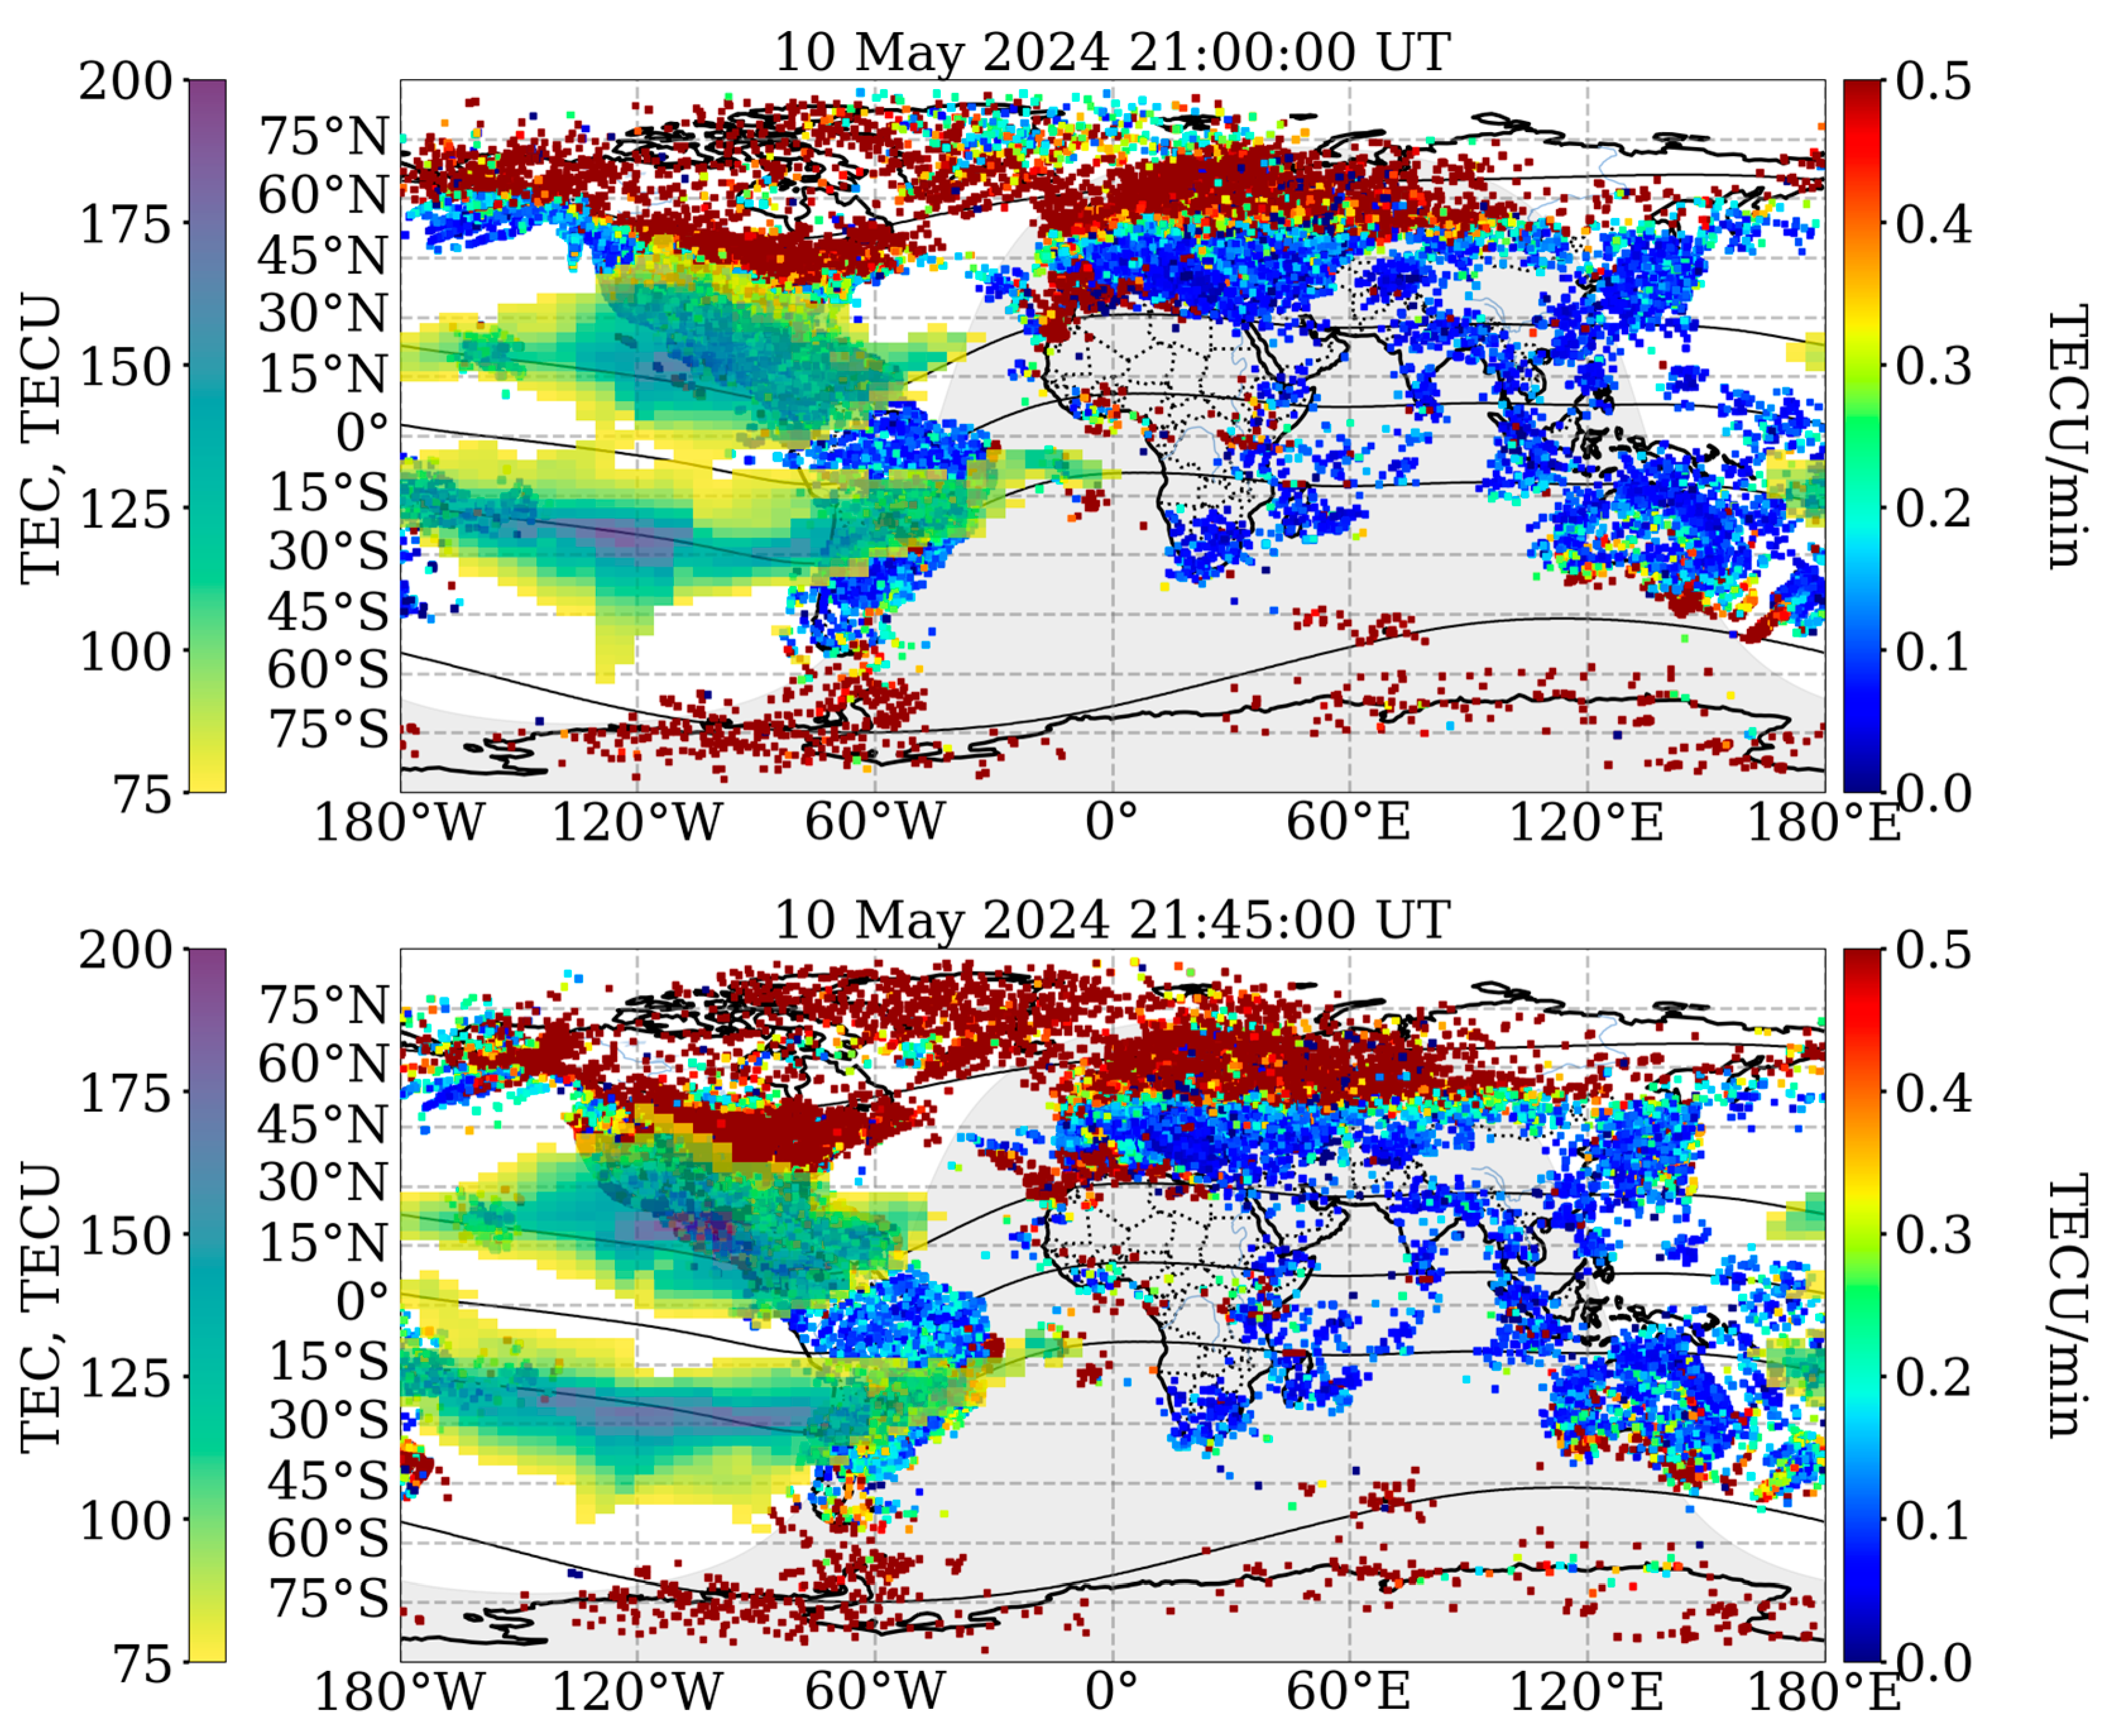
  • The equatorial anomaly crest considerably intensified (up to 200 TECU) and shifted poleward in the American sector during the main phase of the geomagnetic storm. The equatorial anomaly extended to about 50°N and 55°S.
  • The counter-propagation of the auroral oval and the equatorial anomaly finally caused a unique phenomenon—the intersection of the auroral oval boundary and the equatorial anomaly in North America.
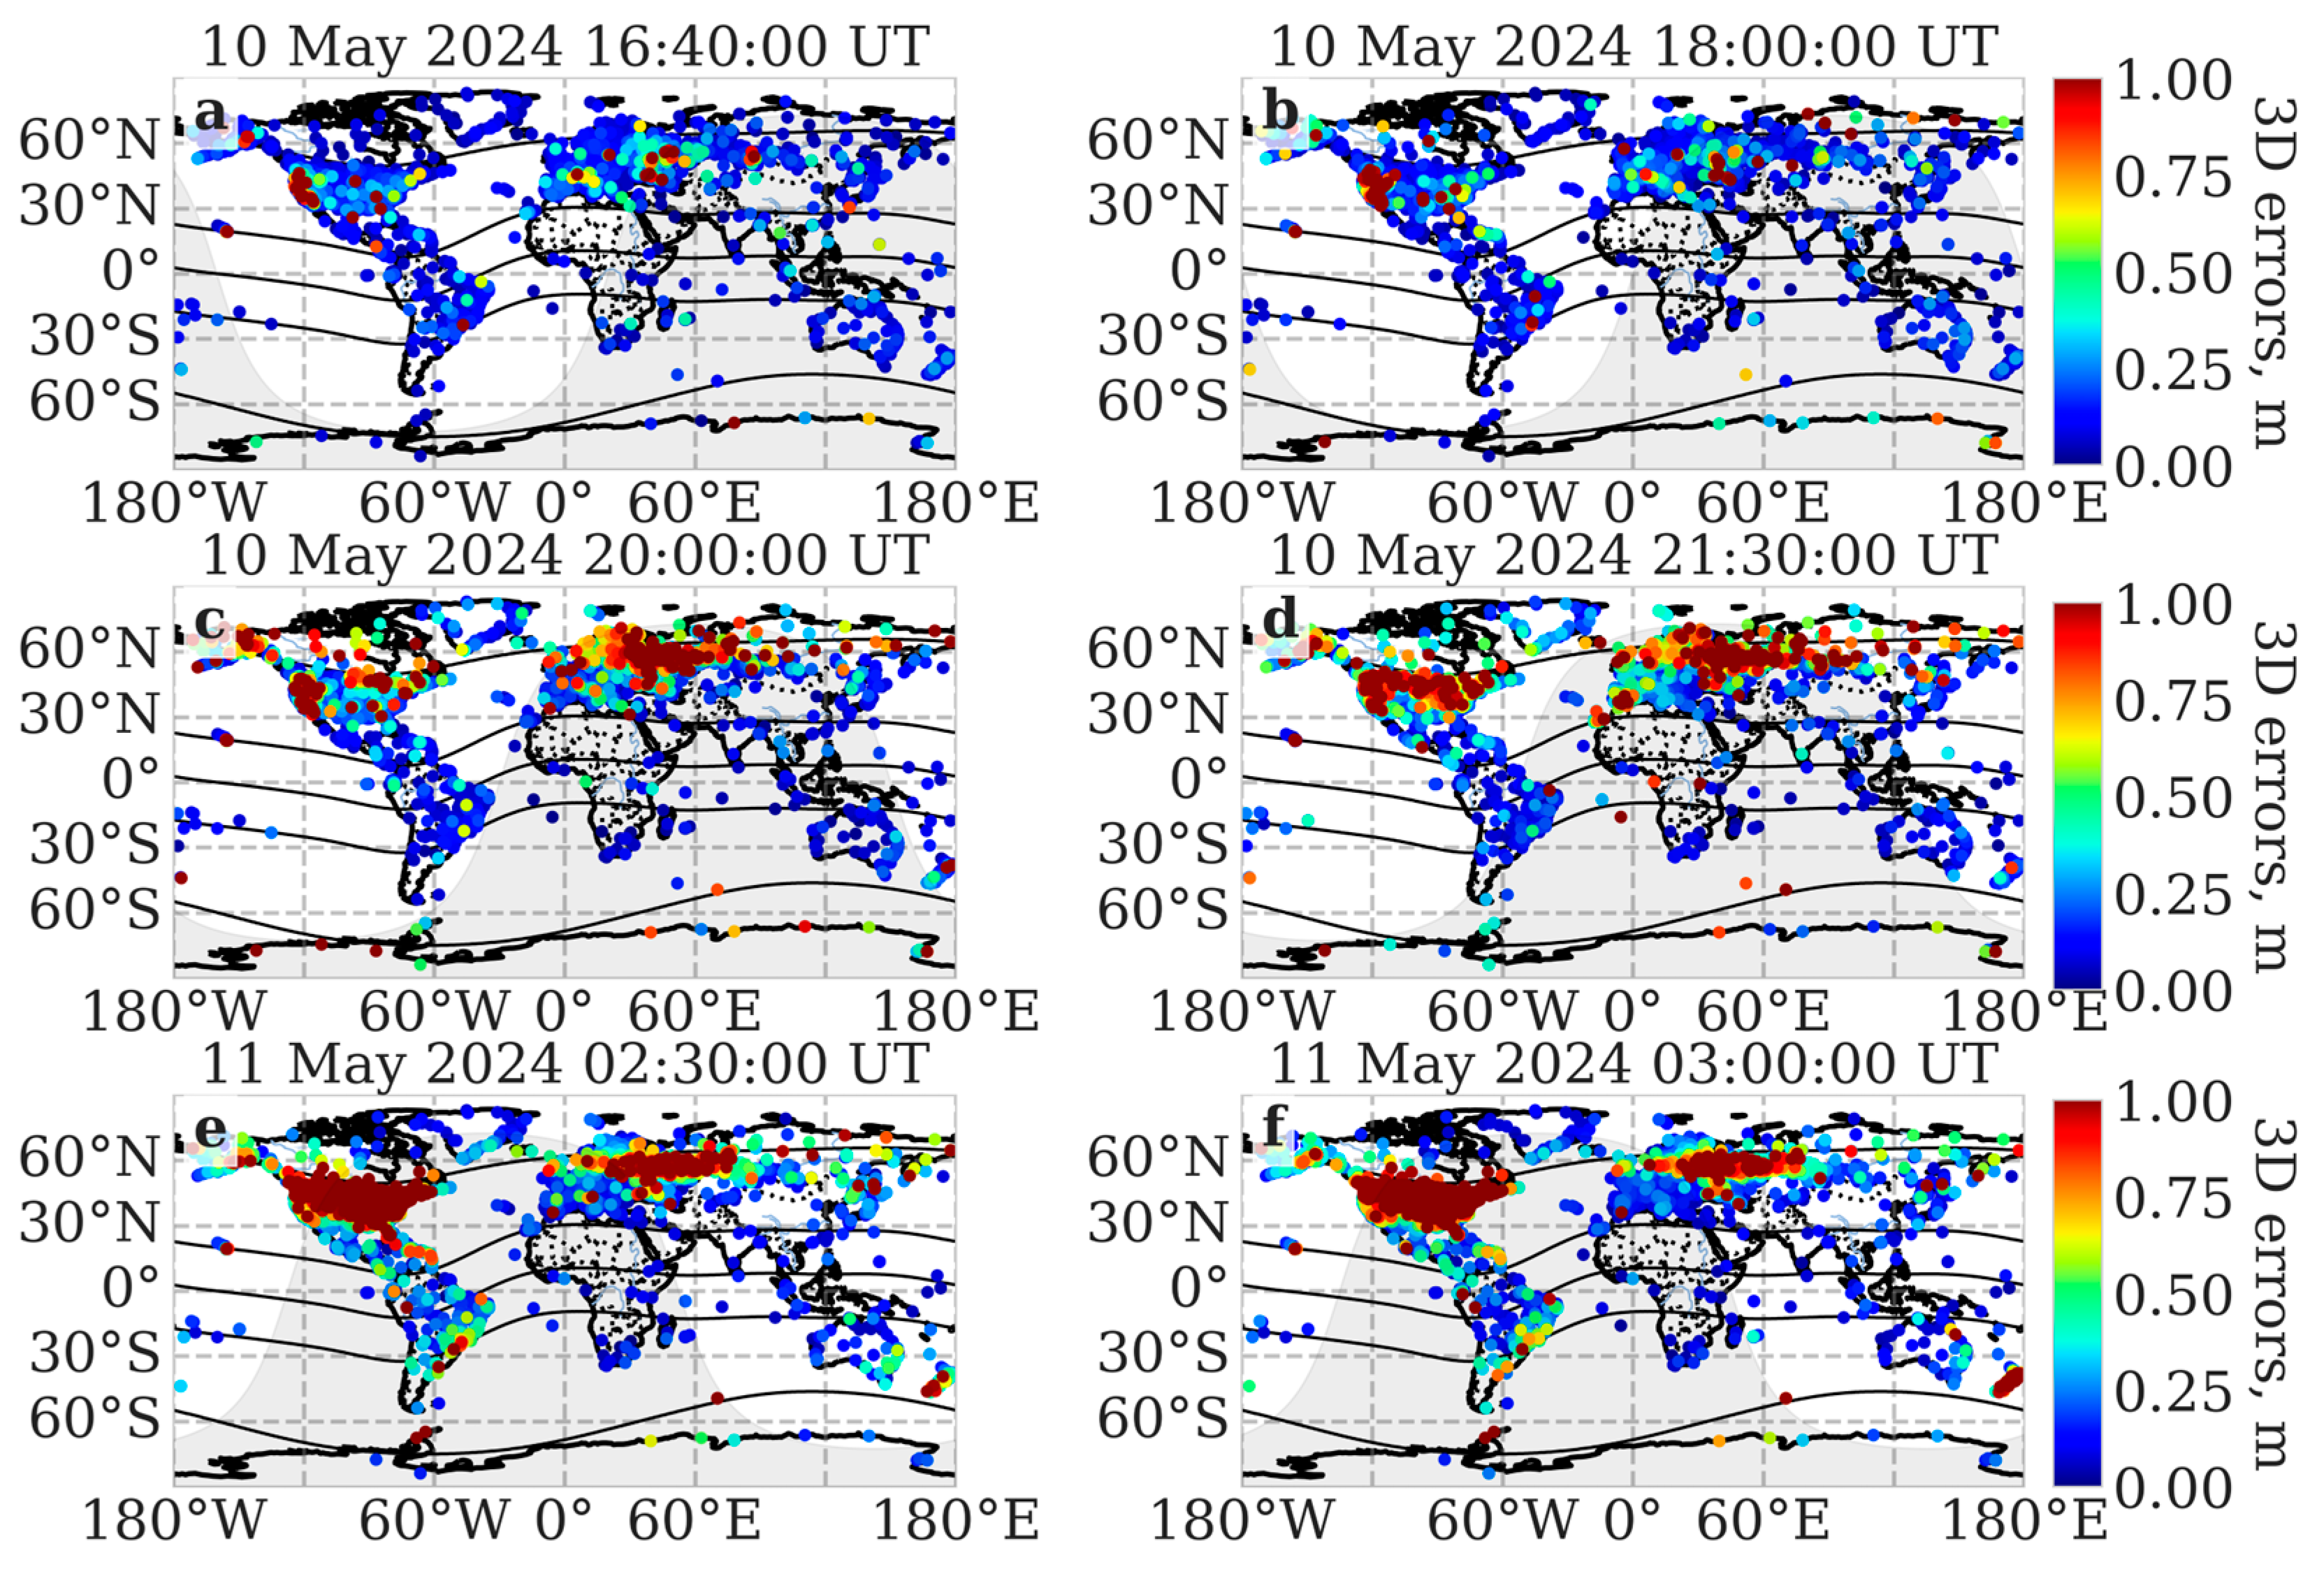
  • The 3D positioning errors increased 1.5–5 times. Increased positioning errors propagated to the mid-latitudes up to 30°N, consistent with the shift of the auroral oval boundary.

Supplementary Materials

The following supporting information can be downloaded at https://www.mdpi.com/article/10.3390/rs17091492/s1, Video S1: Global dynamics for ROTI and GPS PPP errors during the main phase of the May 2024 extreme geomagnetic storm.

Author Contributions

Conceptualization, Y.Y.; methodology, E.D., Y.Y. and A.V.; software, A.V. and E.D.; validation, Y.Y. and B.Z.; formal analysis, Y.Y.; investigation, E.D., Y.Y., A.V., A.K. and B.Z.; resources, A.V.; data curation, A.V. and E.D.; writing—original draft preparation, E.D., Y.Y. and B.Z.; writing—review and editing, E.D. and Y.Y.; visualization, E.D., A.V. and A.K.; supervision, Y.Y.; project administration, Y.Y.; funding acquisition, Y.Y. All authors have read and agreed to the published version of the manuscript.

Funding

This work is financially supported by the Russian Science Foundation (project № 23-17-00157. https://rscf.ru/project/23-17-00157/).

Data Availability Statement

The data presented in this study are openly available in the SIMuRG repository (https://simurg.iszf.irk.ru, accessed on 15 March 2025); the input data in RINEX format are openly available in a number of repositories.

Acknowledgments

For the GNSS data, we acknowledge the International GNSS service, Système d'Observation du Niveau des Eaux Littorales (SONEL), Austrian data center (BEV), Royal Observatory of Belgium, Instituto Brasileiro de Geografia e Estatística, INGV—Rete Integrata Nazionale GPS, The Western Canada Deformation Array (WCDA), Institute of Geodynamics, National Observatory of Athens, Pacific Northwest Geodetic Array (PANGA), REseau NAtional GPS permanent (RENAG), Instituto Tecnológico Agrario de Castilla y León, Scripps Orbit and Permanent Array Center, UCSD, Korea Astronomy and Space Institute, Dutch Permanent GNSS Array (DPGA) the Federal Center for Navigation Data (https://fcnd.ru/, accessed on 15 March 2025), and EFT-CORS (https://eft-cors.ru/, accessed on 15 March 2025). The data were treated by SIMuRG (https://simurg.iszf.irk.ru/, accessed on 15 March 2025).

Conflicts of Interest

The authors declare no conflicts of interest.

References

  1. Danilov, A.; Lastovicka, J. Effects of Geomagnetic Storms on the Ionosphere and Atmosphere. Int. J. Geomagn. Aeron. 2001, 2, 209–224. [Google Scholar]
  2. Yermolaev, Y.I.; Yermolaev, M.Y. Statistic Study on the Geomagnetic Storm Effectiveness of Solar and Interplanetary Events. Adv. Space Res. 2006, 37, 1175–1181. [Google Scholar] [CrossRef]
  3. Fuller-Rowell, T.J.; Codrescu, M.V.; Moffett, R.J.; Quegan, S. Response of the Thermosphere and Ionosphere to Geomagnetic Storms. J. Geophys. Res. 1994, 99, 3893–3914. [Google Scholar] [CrossRef]
  4. Mendillo, M. Storms in the Ionosphere: Patterns and Processes for Total Electron Content. Rev. Geophys. 2006, 44, 2005RG000193. [Google Scholar] [CrossRef]
  5. Yokoyama, N.; Kamide, Y.; Miyaoka, H. The Size of the Auroral Belt during Magnetic Storms. Ann. Geophys. 1998, 16, 566–573. [Google Scholar] [CrossRef]
  6. Edemskiy, I.K.; Yasyukevich, Y.V. Auroral Oval Boundary Dynamics on the Nature of Geomagnetic Storm. Remote Sens. 2022, 14, 5486. [Google Scholar] [CrossRef]
  7. Cander, L.R. Ionospheric Storm Morphology. In Ionospheric Space Weather; Springer Geophysics; Springer International Publishing: Cham, Switzerland, 2019; pp. 95–133. ISBN 978-3-319-99330-0. [Google Scholar]
  8. Yeh, K.C.; Liu, C.-H. Radio Wave Scintillations in the Ionosphere. Proc. IEEE 1982, 70, 324–360. [Google Scholar] [CrossRef]
  9. Pilipenko, V. Space Weather Impact on Ground-Based Technological Systems. Sol.-Terr. Phys. 2021, 7, 68–104. [Google Scholar] [CrossRef]
  10. Béland, J.; Small, K. Space Weather Effects on Power Transmission Systems: The Cases of Hydro-Québec and Transpower New ZealandLtd. In Effects of Space Weather on Technology Infrastructure; Daglis, I.A., Ed.; NATO Science Series II: Mathematics, Physics and Chemistry; Kluwer Academic Publishers: Dordrecht, The Netherlands, 2005; Volume 176, pp. 287–299. ISBN 978-1-4020-2748-2. [Google Scholar]
  11. Thaduri, A.; Galar, D.; Kumar, U. Space Weather Climate Impacts on Railway Infrastructure. Int. J. Syst. Assur. Eng. Manag. 2020, 11, 267–281. [Google Scholar] [CrossRef]
  12. Berngardt, O. Space Weather Impact on Radio Device Operation. Sol.-Terr. Phys. 2017, 3, 37–53. [Google Scholar] [CrossRef]
  13. Demyanov, V.; Yasyukevich, Y.; Sergeeva, M.A.; Vesnin, A. Space Weather Impact on GNSS Performance; Springer International Publishing: Cham, Switzerland, 2022; ISBN 978-3-031-15873-5. [Google Scholar]
  14. Luo, X.; Gu, S.; Lou, Y.; Xiong, C.; Chen, B.; Jin, X. Assessing the Performance of GPS Precise Point Positioning Under Different Geomagnetic Storm Conditions during Solar Cycle 24. Sensors 2018, 18, 1784. [Google Scholar] [CrossRef] [PubMed]
  15. Mošna, Z.; Barta, V.; Berényi, K.A.; Mielich, J.; Verhulst, T.; Kouba, D.; Urbář, J.; Chum, J.; Koucká Knížová, P.; Marew, H.; et al. The March and April 2023 Ionospheric Storms over Europe. Front. Astron. Space Sci. 2024, 11, 1462160. [Google Scholar] [CrossRef]
  16. Zakharenkova, I.; Cherniak, I. Effects of Storm-Induced Equatorial Plasma Bubbles on GPS-Based Kinematic Positioning at Equatorial and Middle Latitudes during the September 7–8, 2017, Geomagnetic Storm. GPS Solut. 2021, 25, 132. [Google Scholar] [CrossRef]
  17. Yang, Z.; Morton, Y.T.J.; Zakharenkova, I.; Cherniak, I.; Song, S.; Li, W. Global View of Ionospheric Disturbance Impacts on Kinematic GPS Positioning Solutions During the 2015 St. Patrick’s Day Storm. JGR Space Phys. 2020, 125, e2019JA027681. [Google Scholar] [CrossRef]
  18. Love, J.J. Extreme-Event Magnetic Storm Probabilities Derived from Rank Statistics of Historical Dst Intensities for Solar Cycles 14–24. Space Weather. 2021, 19, e2020SW002579. [Google Scholar] [CrossRef]
  19. Hofmann-Wellenhof, B.; Lichtenegger, H.; Wasle, E. GNSS—Global Navigation Satellite Systems: GPS, GLONASS, Galileo, and More; Springer: Vienna, Austria; New York, NY, USA, 2008; ISBN 978-3-211-73012-6. [Google Scholar]
  20. Afraimovich, E.L.; Astafyeva, E.I.; Demyanov, V.V.; Edemskiy, I.K.; Gavrilyuk, N.S.; Ishin, A.B.; Kosogorov, E.A.; Leonovich, L.A.; Lesyuta, O.S.; Palamartchouk, K.S.; et al. A Review of GPS/GLONASS Studies of the Ionospheric Response to Natural and Anthropogenic Processes and Phenomena. J. Space Weather Space Clim. 2013, 3, A27. [Google Scholar] [CrossRef]
  21. Pi, X.; Mannucci, A.J.; Lindqwister, U.J.; Ho, C.M. Monitoring of Global Ionospheric Irregularities Using the Worldwide GPS Network. Geophys. Res. Lett. 1997, 24, 2283–2286. [Google Scholar] [CrossRef]
  22. Buonsanto, M.J. Ionospheric Storms—A Review. Space Sci. Rev. 1999, 88, 563–601. [Google Scholar] [CrossRef]
  23. Wang, C.; Rosen, I.G.; Tsurutani, B.T.; Verkhoglyadova, O.P.; Meng, X.; Mannucci, A.J. Statistical Characterization of Ionosphere Anomalies and Their Relationship to Space Weather Events. J. Space Weather Space Clim. 2016, 6, A5. [Google Scholar] [CrossRef]
  24. Yasyukevich, Y.V.; Yasyukevich, A.S.; Ratovsky, K.G.; Klimenko, M.V.; Klimenko, V.V.; Chirik, N.V. Winter Anomaly in Nm F2 and TEC: When and Where It Can Occur. J. Space Weather Space Clim. 2018, 8, A45. [Google Scholar] [CrossRef]
  25. Klimenko, M.V.; Klimenko, V.V.; Bessarab, F.S.; Sukhodolov, T.V.; Vasilev, P.A.; Karpov, I.V.; Korenkov, Y.N.; Zakharenkova, I.E.; Funke, B.; Rozanov, E.V. Identification of the Mechanisms Responsible for Anomalies in the Tropical Lower Thermosphere/Ionosphere Caused by the January 2009 Sudden Stratospheric Warming. J. Space Weather Space Clim. 2019, 9, A39. [Google Scholar] [CrossRef]
  26. Roma-Dollase, D.; Hernández-Pajares, M.; Krankowski, A.; Kotulak, K.; Ghoddousi-Fard, R.; Yuan, Y.; Li, Z.; Zhang, H.; Shi, C.; Wang, C.; et al. Consistency of Seven Different GNSS Global Ionospheric Mapping Techniques during One Solar Cycle. J. Geod. 2018, 92, 691–706. [Google Scholar] [CrossRef]
  27. Liu, Q.; Hernández-Pajares, M.; Lyu, H.; Goss, A. Influence of Temporal Resolution on the Performance of Global Ionospheric Maps. J. Geod. 2021, 95, 34. [Google Scholar] [CrossRef]
  28. Schaer, S.; Gurtner, W.; Feltens, J. IONEX: The Ionosphere Map Exchange Format Version 1. In Proceedings of the IGS AC Workshop, Darmstadt, Germany, 9–11 February 1998; pp. 233–247. Available online: https://files.igs.org/pub/data/format/ionex1.pdf (accessed on 21 April 2025).
  29. Zhou, F.; Dong, D.; Li, W.; Jiang, X.; Wickert, J.; Schuh, H. GAMP: An Open-Source Software of Multi-GNSS Precise Point Positioning Using Undifferenced and Uncombined Observations. GPS Solut. 2018, 22, 33. [Google Scholar] [CrossRef]
  30. Yasyukevich, Y.V.; Kiselev, A.V.; Zhivetiev, I.V.; Edemskiy, I.K.; Syrovatskii, S.V.; Maletckii, B.M.; Vesnin, A.M. SIMuRG: System for Ionosphere Monitoring and Research from GNSS. GPS Solut. 2020, 24, 69. [Google Scholar] [CrossRef]
  31. Dow, J.M.; Neilan, R.E.; Rizos, C. The International GNSS Service in a Changing Landscape of Global Navigation Satellite Systems. J. Geod. 2009, 83, 191–198. [Google Scholar] [CrossRef]
  32. Yasyukevich, Y.V.; Vasiliev, R.V.; Rubtsov, A.V.; Alsatkin, S.S.; Artamonov, M.F.; Beletsky, A.B. Extreme Magnetic Storm of May 10–19, 2024: Coupling Between Neutral and Charged Components of the Upper Atmosphere and the Effect on Radio Systems. Dokl. Earth Sci. 2025, 520, 33. [Google Scholar] [CrossRef]
  33. Etchells, T.; Aplin, K.L.; Berthoud, L.; Kalavana, A.; Larkins, A. Extreme Space Weather Impacts on GNSS Timing Signals for Electricity Grid Management. Space Weather 2024, 22, e2023SW003770. [Google Scholar] [CrossRef]
  34. Jakowski, N.; Schlüter, S.; Sardon, E. Total Electron Content of the Ionosphere during Thegeomagnetic Storm on 10 January 1997. J. Atmos. Sol.-Terr. Phys. 1999, 61, 299–307. [Google Scholar] [CrossRef]
  35. Skone, S.; Knudsen, K.; De Jong, M. Limitations in GPS Receiver Tracking Performance under Ionospheric Scintillation Conditions. Phys. Chem. Earth Part A Solid Earth Geod. 2001, 26, 613–621. [Google Scholar] [CrossRef]
  36. Demyanov, V.; Yasyukevich, Y. Space Weather: Risk Factors for Global Navigation Satellite Systems. Solnechno-Zemn. Fiz. 2021, 7, 30–52. [Google Scholar] [CrossRef]
  37. Maksimov, D.; Kogogin, D.; Nasyrov, I.; Zagretdinov, R. Effects of 7September 5–12, 2017 Solar Flares on Regional Disturbance of Earth’s Ionosphere as Recorded by GNSS Stations Located in the Volga Federal District of the Russian Federation. Sol.-Terr. Phys. 2023, 9, 48–54. [Google Scholar] [CrossRef]
  38. Luan, X. Equatorial Ionization Anomaly Variations During Geomagnetic Storms. In Geophysical Monograph Series; Huang, C., Lu, G., Zhang, Y., Paxton, L.J., Eds.; John Wiley and Sons: Hoboken, NJ, USA, 2021; pp. 301–312. ISBN 978-1-119-50755-0. [Google Scholar]
  39. Cherniak, I.; Zakharenkova, I. Development of the Storm-Induced Ionospheric Irregularities at Equatorial and Middle Latitudes During the 25–26 August 2018 Geomagnetic Storm. Space Weather 2022, 20, e2021SW002891. [Google Scholar] [CrossRef]
  40. Balan, N.; Shiokawa, K.; Otsuka, Y.; Kikuchi, T.; Vijaya Lekshmi, D.; Kawamura, S.; Yamamoto, M.; Bailey, G.J. A Physical Mechanism of Positive Ionospheric Storms at Low Latitudes and Midlatitudes. J. Geophys. Res. 2010, 115, 2009JA014515. [Google Scholar] [CrossRef]
  41. Mannucci, A.J.; Tsurutani, B.T.; Iijima, B.A.; Komjathy, A.; Saito, A.; Gonzalez, W.D.; Guarnieri, F.L.; Kozyra, J.U.; Skoug, R. Dayside Global Ionospheric Response to the Major Interplanetary Events of 29–30 October 2003 “Halloween Storms”. Geophys. Res. Lett. 2005, 32, 2004GL021467. [Google Scholar] [CrossRef]
  42. Astafyeva, E.; Zakharenkova, I.; Förster, M. Ionospheric Response to the 2015 St. Patrick’s Day Storm: A Global Multi-instrumental Overview. JGR Space Phys. 2015, 120, 9023–9037. [Google Scholar] [CrossRef]
  43. Rout, D.; Pandey, K.; Chakrabarty, D.; Sekar, R.; Lu, X. Significant Electric Field Perturbations in Low Latitude Ionosphere Due to the Passage of Two Consecutive ICMEs During 6–8 September 2017. JGR Space Phys. 2019, 124, 9494–9510. [Google Scholar] [CrossRef]
  44. Tsurutani, B.T.; Verkhoglyadova, O.P.; Mannucci, A.J.; Saito, A.; Araki, T.; Yumoto, K.; Tsuda, T.; Abdu, M.A.; Sobral, J.H.A.; Gonzalez, W.D.; et al. Prompt Penetration Electric Fields (PPEFs) and Their Ionospheric Effects during the Great Magnetic Storm of 30–31 October 2003. J. Geophys. Res. 2008, 113, 2007JA012879. [Google Scholar] [CrossRef]
  45. Karan, D.K.; Eastes, R.W.; Daniell, R.E.; Martinis, C.R.; McClintock, W.E. GOLD Mission’s Observation About the Geomagnetic Storm Effects on the Nighttime Equatorial Ionization Anomaly (EIA) and Equatorial Plasma Bubbles (EPB) During a Solar Minimum Equinox. Space Weather 2023, 21, e2022SW003321. [Google Scholar] [CrossRef]
  46. Oyedokun, O.J.; Amaechi, P.O.; Akala, A.O.; Simi, K.G.; Ogwala, A.; Oyeyemi, E.O. Solar and Interplanetary Events That Drove Two CIR-Related Geomagnetic Storms of 1 June 2013 and 7 October 2015, and Their Ionospheric Responses at the American and African Equatorial Ionization Anomaly Regions. Adv. Space Res. 2022, 69, 2168–2181. [Google Scholar] [CrossRef]
  47. Bhattacharyya, A. Equatorial Plasma Bubbles: A Review. Atmosphere 2022, 13, 1637. [Google Scholar] [CrossRef]
  48. Abadi, P.; Muafiry, I.N.; Pratama, T.N.; Putra, A.Y.; Suraina; Pramono, G.H.; Wibowo, S.T.; Chabibi, F.; Ahmad, U.A.; Tresna, W.P.; et al. Leveraging ROTI Map Derived from Indonesian GNSS Receiver Network for Advancing Study of Equatorial Plasma Bubble in Southeast/East Asia. Earth Planet. Phys. 2025, 9, 101–116. [Google Scholar] [CrossRef]
  49. Dal Poz, W.R.; Silva, A.C.; Santos, A.D.P.D.; Medeiros, N.D.G.; Ferreira, Í.O.; Oliveira, J.C.D. Impacts of the Great May 2024 Geomagnetic Storm on Precise Point Positioning. Rev. Bras. Geog. Fis. 2025, 18, 1697–1713. [Google Scholar] [CrossRef]
  50. Belahovskiy, V.; Budnikov, P.; Kalishin, A.; Pilgaev, S.; Roldugin, A. Influence of Geomagnetic Disturbances on Scintillations of GLONASS and GPS Signals as Observed on the Kola Peninsula. Sol.-Terr. Phys. 2023, 9, 54–67. [Google Scholar] [CrossRef]
  51. Cherniak, I.; Zakharenkova, I. Dependence of the High-Latitude Plasma Irregularities on the Auroral Activity Indices: A Case Study of 17 March 2015 Geomagnetic Storm. Earth Planet Space 2015, 67, 151. [Google Scholar] [CrossRef]
  52. Yao, Y.; Liu, L.; Kong, J.; Zhai, C. Analysis of the Global Ionospheric Disturbances of the March 2015 Great Storm. JGR Space Phys. 2016, 121, 12. [Google Scholar] [CrossRef]
  53. Chernyshov, A.A.; Klimenko, M.V.; Nosikov, I.A.; Borchevkina, O.P.; Timchenko, A.V.; Efishov, I.I.; Sinevich, A.A.; Ryakhovsky, I.A.; Yakimova, G.A.; Bessarab, F.S.; et al. Effects in the Upper Atmosphere and Ionosphere in the Subauroral Region during Victory Day 2024 Geomagnetic Storm (10–12 May 2024). Adv. Space Res. 2025, in press. [Google Scholar] [CrossRef]
  54. Yang, Z.; Morton, Y.T.J. Time-Lagged Effects of Ionospheric Response to Severe Geomagnetic Storms on GNSS Kinematic Precise Point Positioning. Space Weather 2024, 22, e2024SW003946. [Google Scholar] [CrossRef]
  55. Marques, H.A.; Marques, H.A.S.; Aquino, M.; Veettil, S.V.; Monico, J.F.G. Accuracy Assessment of Precise Point Positioning with Multi-Constellation GNSS Data under Ionospheric Scintillation Effects. J. Space Weather Space Clim. 2018, 8, A15. [Google Scholar] [CrossRef]
  56. Luo, X.; Du, J.; Lou, Y.; Gu, S.; Yue, X.; Liu, J.; Chen, B. A Method to Mitigate the Effects of Strong Geomagnetic Storm on GNSS Precise Point Positioning. Space Weather 2022, 20, e2021SW002908. [Google Scholar] [CrossRef]
  57. Nie, W.; Rovira-Garcia, A.; Li, M.; Fang, Z.; Wang, Y.; Zheng, D.; Xu, T. The Mechanism for GNSS-Based Kinematic Positioning Degradation at High-Latitudes Under the March 2015 Great Storm. Space Weather 2022, 20, e2022SW003132. [Google Scholar] [CrossRef]
  58. Jacobsen, K.S. The Impact of Different Sampling Rates and Calculation Time Intervals on ROTI Values. J. Space Weather Space Clim. 2014, 4, A33. [Google Scholar] [CrossRef]
  59. Follestad, A.F.; Clausen, L.B.N.; Moen, J.I.; Jacobsen, K.S. Latitudinal, Diurnal, and Seasonal Variations in the Accuracy of an RTK Positioning System and Its Relationship with Ionospheric Irregularities. Space Weather 2021, 19, e2020SW002625. [Google Scholar] [CrossRef]
Figure 1. GNSS receiver location map.
Remotesensing 17 01492 g001
Figure 2. Geomagnetic activity indices and solar wind parameters on 10–12 May 2024: (a) Kp index, (b) Dst (red) and SYM-H (black) indices, (c) solar wind speed (black) and solar wind flow pressure (red), (d) z-component of the interplanetary magnetic field in GSM coordinates. Vertical lines indicate the sudden storm commencement of the geomagnetic storm at 16:40 UT (grey dashed line), the beginning of the main phase at 18:00 UT (blue solid line), and the beginning of the recovery phase at 02:15 UT (blue dashed line).
Remotesensing 17 01492 g002
Figure 3. ROTI map at the beginning of the geomagnetic storm at 16:40 UT on 10 May 2024 (a) and during the main phase of the geomagnetic storm on 10 May 2024 at 18:00 UT (b), 20:00 UT (c), and 21:30 UT (d) and on 11 May 2024 at 02:30 UT (e) and 03:00 UT (f). The black lines indicate the geomagnetic equator and geomagnetic parallels (60°N, 20°N, 20°S, 60°S).
Remotesensing 17 01492 g003
Figure 4. Variation in the equatorial anomaly during the main phase of the geomagnetic storm at 19:00 UT (a), 20:00 UT (b), 21:00 UT (c), and 22:00 UT (d). Maximum extension of the equatorial anomaly boundaries observed between 21:00 UT and 22:30 UT. The black lines indicate the geomagnetic equator and geomagnetic parallels (60°N, 20°N, 20°S, 60°S).
Remotesensing 17 01492 g004
Figure 5. The intersection of the auroral oval boundary and the equatorial anomaly during the main phase of the geomagnetic storm in America. The intersection starts at 21:00 UT on 10 May 2024 (top panel) and lasted for 1.5 hours. The maximum intersection of these areas is observed at 21:45 UT on 10 May 2024 (bottom panel). The black lines indicate the geomagnetic equator and geomagnetic parallels (60°N, 20°N, 20°S, 60°S).
Remotesensing 17 01492 g005
Figure 6. Three-dimensional positioning errors maps. Snapshots are taken for the sudden storm commencement at 16:40 UT on 10 May (a) and during the main phase of the geomagnetic storm at 18:00 UT (b), 20:00 UT (c), and 21:30 UT (d) on 10 May and at 02:30 UT (e) and 03:00 UT (f) on 11 May 2024. The black lines indicate the geomagnetic equator and geomagnetic parallels (60°N, 20°N, 20°S, 60°S).
Remotesensing 17 01492 g006
Figure 7. Three-dimensional positioning error dynamics of receivers TIXG, DAEJ, BOAV, and HLFX. Vertical lines indicate the sudden storm commencement of the geomagnetic storm at 16:40 UT (grey dashed line) and the beginning of the main phase at 18:00 UT (blue solid line).
Remotesensing 17 01492 g007
Figure 8. ROTI keograms in the American sector (top panel) and the Europe–Asia sector (bottom panel) during the main phase of the May 2024 geomagnetic storm.
Remotesensing 17 01492 g008
Figure 9. ROTI keograms during the 29–30 October 2003 (top panel) and 17–18 March 2015 (bottom panel) geomagnetic storms.
Remotesensing 17 01492 g009
Table 1. Parameters and models used for GAMP solution.
ItemStrategies
ObservationDual-frequency GPS observations (RINEX 2.11)
Sampling interval30 s
Positioning processing modeKinematic precise point positioning
Elevation mask angle10°
Precise satellite orbit and clockIGS precise products (sp3 files)
Ionospheric delayDual frequency: ionosphere-free combination mode
Tropospheric delayZenith total delay
Navigation filesBroadcast navigation file
Receiver reference coordinatesIGS daily combined SINEX solution
Satellite antenna phase center correctionGeneral hint for satellite antenna corrections (igs14.atx)
DCBDifferential code biases for satellites and receivers (P1C1, P1P2, P2C2 files)
Ocean tide loading coefficientsocnload.blq
Disclaimer/Publisher’s Note: The statements, opinions and data contained in all publications are solely those of the individual author(s) and contributor(s) and not of MDPI and/or the editor(s). MDPI and/or the editor(s) disclaim responsibility for any injury to people or property resulting from any ideas, methods, instructions or products referred to in the content.

