Article

Spaceborne Lightweight and Compact High-Sensitivity Uncooled Infrared Remote Sensing Camera for Wildfire Detection

by
Fang Ding
1,2,3,
Guoliang Tang
1,2,
Tongxu Zhang
2,3,
Wenli Wu
2,3,
Bangjian Zhao
1,2,
Jingwen Miao
2,3,
Dunping Li
2,3,
Xu Liu
2,3,
Jianyu Wang
1,2,3 and
Chunlai Li
1,2,3,*
1
Shanghai Institute of Technical Physics, Chinese Academy of Sciences, Shanghai 200083, China
2
Hangzhou Institute for Advanced Study, University of Chinese Academy of Sciences, Hangzhou 310024, China
3
University of Chinese Academy of Sciences, Beijing 100049, China
*
Author to whom correspondence should be addressed.
Remote Sens. 2025, 17(8), 1387; https://doi.org/10.3390/rs17081387
Submission received: 21 February 2025 / Revised: 11 April 2025 / Accepted: 11 April 2025 / Published: 14 April 2025
(This article belongs to the Section Engineering Remote Sensing)

Abstract

:
In response to the growing threats posed by frequent wildfires to ecological environments and human safety, this study presents the development of a lightweight, spaceborne, multispectral, uncooled infrared remote sensing camera specifically designed for wildfire monitoring. To address the low wildfire detection sensitivity of VOx uncooled infrared instruments, a multi-point precision temperature control technique and a spatiotemporal stacking method are implemented. Furthermore, a compact design and assembly approach endows the camera with low weight, small size, and low power consumption, making it highly suitable for satellite deployment. The test results demonstrate that the camera weighs less than 1.5 kg, consumes under 1.5 W of power, and achieves a sensitivity below 0.2 K, comparable to current spaceborne cooled infrared remote sensing cameras. The remote sensing camera has successfully detected various wildfires and thermal events. This study provides an innovative instrument for remote sensing wildfire monitoring.

Graphical Abstract

1. Introduction

Currently, wildfires represent a shared challenge for global vegetation ecosystems, human life safety, and social stability. Since the 1980s, influenced by both global climate change and human activities, the frequency and scale of wildfires have increased markedly. Fires not only disrupt vegetation structures but also trigger secondary disasters such as floods, droughts, mudslides, and landslides due to the exposure of land, severely endangering human life and safety. Research indicates that wildfires contribute to over 30% of global greenhouse gas emissions [1,2]. In addition to directly releasing carbon dioxide (CO2), fires emit other greenhouse gases and pollutants, such as methane (CH4) and carbon monoxide (CO), profoundly impacting climate change and the carbon cycle. Furthermore, firefighting efforts demand substantial human, material, and financial resources and may even result in casualties. Therefore, the development of efficient and accurate wildfire detection technology capable of detecting fires in their early stages has become an urgent priority. Infrared detection technology leverages the heat signatures generated by the differences in infrared radiation between a fire and its surroundings to collect information about both. The infrared spectrum can penetrate smoke and partially obscured objects, demonstrating high sensitivity to hot objects, which facilitates the early detection of a wildfire [3]. Various fire monitoring technologies are currently in use, including near-Earth monitoring, aerial surveillance, and satellite monitoring. Traditional methods such as manual patrols, watchtowers, and video surveillance are often constrained by human resources, terrain obstacles, and costs, making large-scale implementation challenging. Aerial monitoring with aircraft and drones can aid in patrolling, but it is limited by flight time [4,5]. In contrast, satellite remote sensing offers significant advantages, including wide coverage, comprehensive information, and the capability for repeated observations. This technology can accurately identify fire points and assess fire damage, especially in remote areas, making it a highly effective tool for the objective monitoring of wildfire disasters.
Infrared remote sensing cameras are an essential component of space-based optical remote sensing, utilizing a thermal infrared (TIR) band to detect the thermal radiation emitted by various targets, such as wildfires. In 1999 and 2002, NASA launched the Terra and Aqua polar-orbiting satellites equipped with a Moderate Resolution Imaging Spectroradiometer (MODIS) sensor [6]. The MODIS has 36 spectral bands, with the TIR bands offering a spatial resolution of 1 km and a noise-equivalent temperature difference (NETD) of 0.25 K at 300 K. The detector employs a dual-sided scanning mirror design, providing a swath width of 2330 km. Subsequently, the NPP satellite carried the Visible Infrared Imaging Radiometer Suite (VIIRS), a next-generation infrared imaging payload developed based on MODIS and the Advanced Very High-Resolution Radiometer (AVHRR), which improved the ground spatial resolution to 375 m [7,8,9,10,11]. The VIIRS has a mid-wave infrared (MWIR) band NETD of 0.302 K at 380 K and a long-wave infrared (LWIR) band NETD of 0.052 K at 300 K. With its massive swath width of 3000 km, the VIIRS can observe most regions of the globe daily and capture multiple images per day, making it one of the primary satellite data sources for global wildfire monitoring. However, its weight reaches 200 kg, and its maximum power consumption is close to 240 W, making it more costly and complex compared to uncooled infrared remote sensing cameras. In 2014, Tetsuya Fukuhara et al. [12] developed a TIR camera based on a commercial uncooled microbolometer array and installed it on a 50 kg-class small satellite dedicated to wildfire detection. The camera has a spatial resolution of 175 m. Although it used an uncooled infrared detector and weighed only 2.5 kg, the lack of a 3–5 μm MWIR band made it difficult to identify high-temperature targets. Sentinel-3B is an Earth observation satellite under the European Space Agency (ESA)’s Copernicus program, launched on 25 April 2018. The satellite was equipped with a series of advanced sensors, including the Sea and Land Surface Temperature Radiometer (SLSTR), which features three TIR bands. The SLSTR used a pulse tube cooler to cool its infrared detectors below 85 K, resulting in a weight exceeding 150 kg and a power consumption of over 150 W. The instrument was primarily designed for wildfire monitoring and measuring sea and land surface temperatures, with a spatial resolution of 1 km [13,14]. In wildfire monitoring, the 1 km spatial resolution may lead to the omission of small fire spots or difficulty in distinguishing adjacent fire sources. China’s Environmental Disaster Monitoring Satellites (HJ-2A/B) were launched in 2020. The infrared cameras on these satellites offer a ground sample distance (GSD) of 48 m and 96 m in the TIR bands, with a swath width of 720 km [15,16]. They were mainly developed for monitoring and predicting environmental disasters and pollution, such as wildfires, droughts, and floods. The sub-100 m resolution provides the potential for early fire detection. However, the MWIR and LWIR bands required cooling systems, resulting in an instrument weight of 142 kg. The high weight and cost made them unsuitable for small-scale, low-cost constellation applications. The Landsat 9 satellite was launched on 27 September 2021. It carried the second-generation Thermal Infrared Sensor 2 (TIRS-2), which used a two-stage mechanical cooler to cool the infrared detector focal plane array (FPA) to 43 K [17]. Due to the cooling system, the instrument weighed 225 kg, with a maximum power consumption of nearly 200 W, inevitably leading to higher costs and complexity. TIRS-2 provides thermal source detection in two spectral bands: 10.6–11.19 μm and 11.5–12.51 μm, with a detection range of 185 km and a maximum GSD of 100 m. The NETD reached 80 mK [18], and its high sensitivity enabled the detection of small-scale or early-stage fires. However, its 16-day ground revisit cycle may be insufficient for monitoring sudden wildfires, and its significant weight limits its response speed, deployment cost, and flexibility. The Fengyun-3G (FY-3G) satellite was successfully launched by the China Meteorological Administration (CMA) on 16 April 2023, as China’s first low-inclination orbit precipitation measurement satellite. Its Medium Resolution Spectral Imager-Rainfall Measurement (MERSI-RM) is a key optical imaging instrument, featuring three TIR channels. These TIR channels used a cooler, with the MWIR band achieving an NETD of 0.25 K at 400 K and the LWIR band achieving an NETD of 0.1 K at 400 K. All channels have a spatial resolution of 500 m and a swath width of approximately 1000 km [19]. Although FY-3G’s MERSI-RM offered high sensitivity and could accurately measure target temperatures over a wide, dynamic range, using cooled detectors required additional power to maintain a low-temperature environment, resulting in higher power consumption and costs. This made it unsuitable for small-scale, low-cost constellation applications, and the 500 m spatial resolution may also lead to the omission of small fire spots.
The infrared remote sensing cameras mentioned above, both domestic and international, primarily utilize cooled infrared focal plane arrays (FPAs). As summarized in Table A1, the requisite additional cooling systems inevitably result in a substantial volume, excessive weight, and elevated power consumption. In contrast, uncooled FPAs eliminate the need for a complex cryogenic cooling infrastructure, offering distinct advantages, including compact architecture, reduced power demands, and enhanced operational reliability [20], making them particularly suitable for wildfire monitoring applications. Nevertheless, uncooled infrared cameras confront the inherent challenges associated with relatively lower detection sensitivity [21], which imposes stringent requirements on target detection and identification capabilities. Consequently, the development of spaceborne high-sensitivity infrared imaging instruments based on uncooled thermal detectors for wildfire monitoring not only carries significant scientific and engineering merit but also represents a formidable technological undertaking.
In this study, we developed a more compact and lightweight spaceborne multispectral uncooled infrared camera for wildfire monitoring. The camera integrates five spectral bands, including visible (VIS) and thermal infrared, featuring a compact design with power consumption below 15 W and a weight under 1.5 kg. These advancements significantly reduce system complexity and cost. Furthermore, we implemented several improvements to enhance the performance of the uncooled infrared camera, achieving sensitivity comparable to cooled infrared cameras for accurate wildfire detection. The camera’s effectiveness was validated through testing on a microsatellite, demonstrating its suitability for wildfire monitoring applications. On 21 May 2024, the camera was successfully launched aboard the commercial satellite ‘Xinghuan’ from the Jiuquan Satellite Launch Center in China [22], entering its designated orbit. The camera has demonstrated accurate fire detection capabilities, showcasing exceptional performance and significant commercial value in wildfire monitoring.

2. Methods

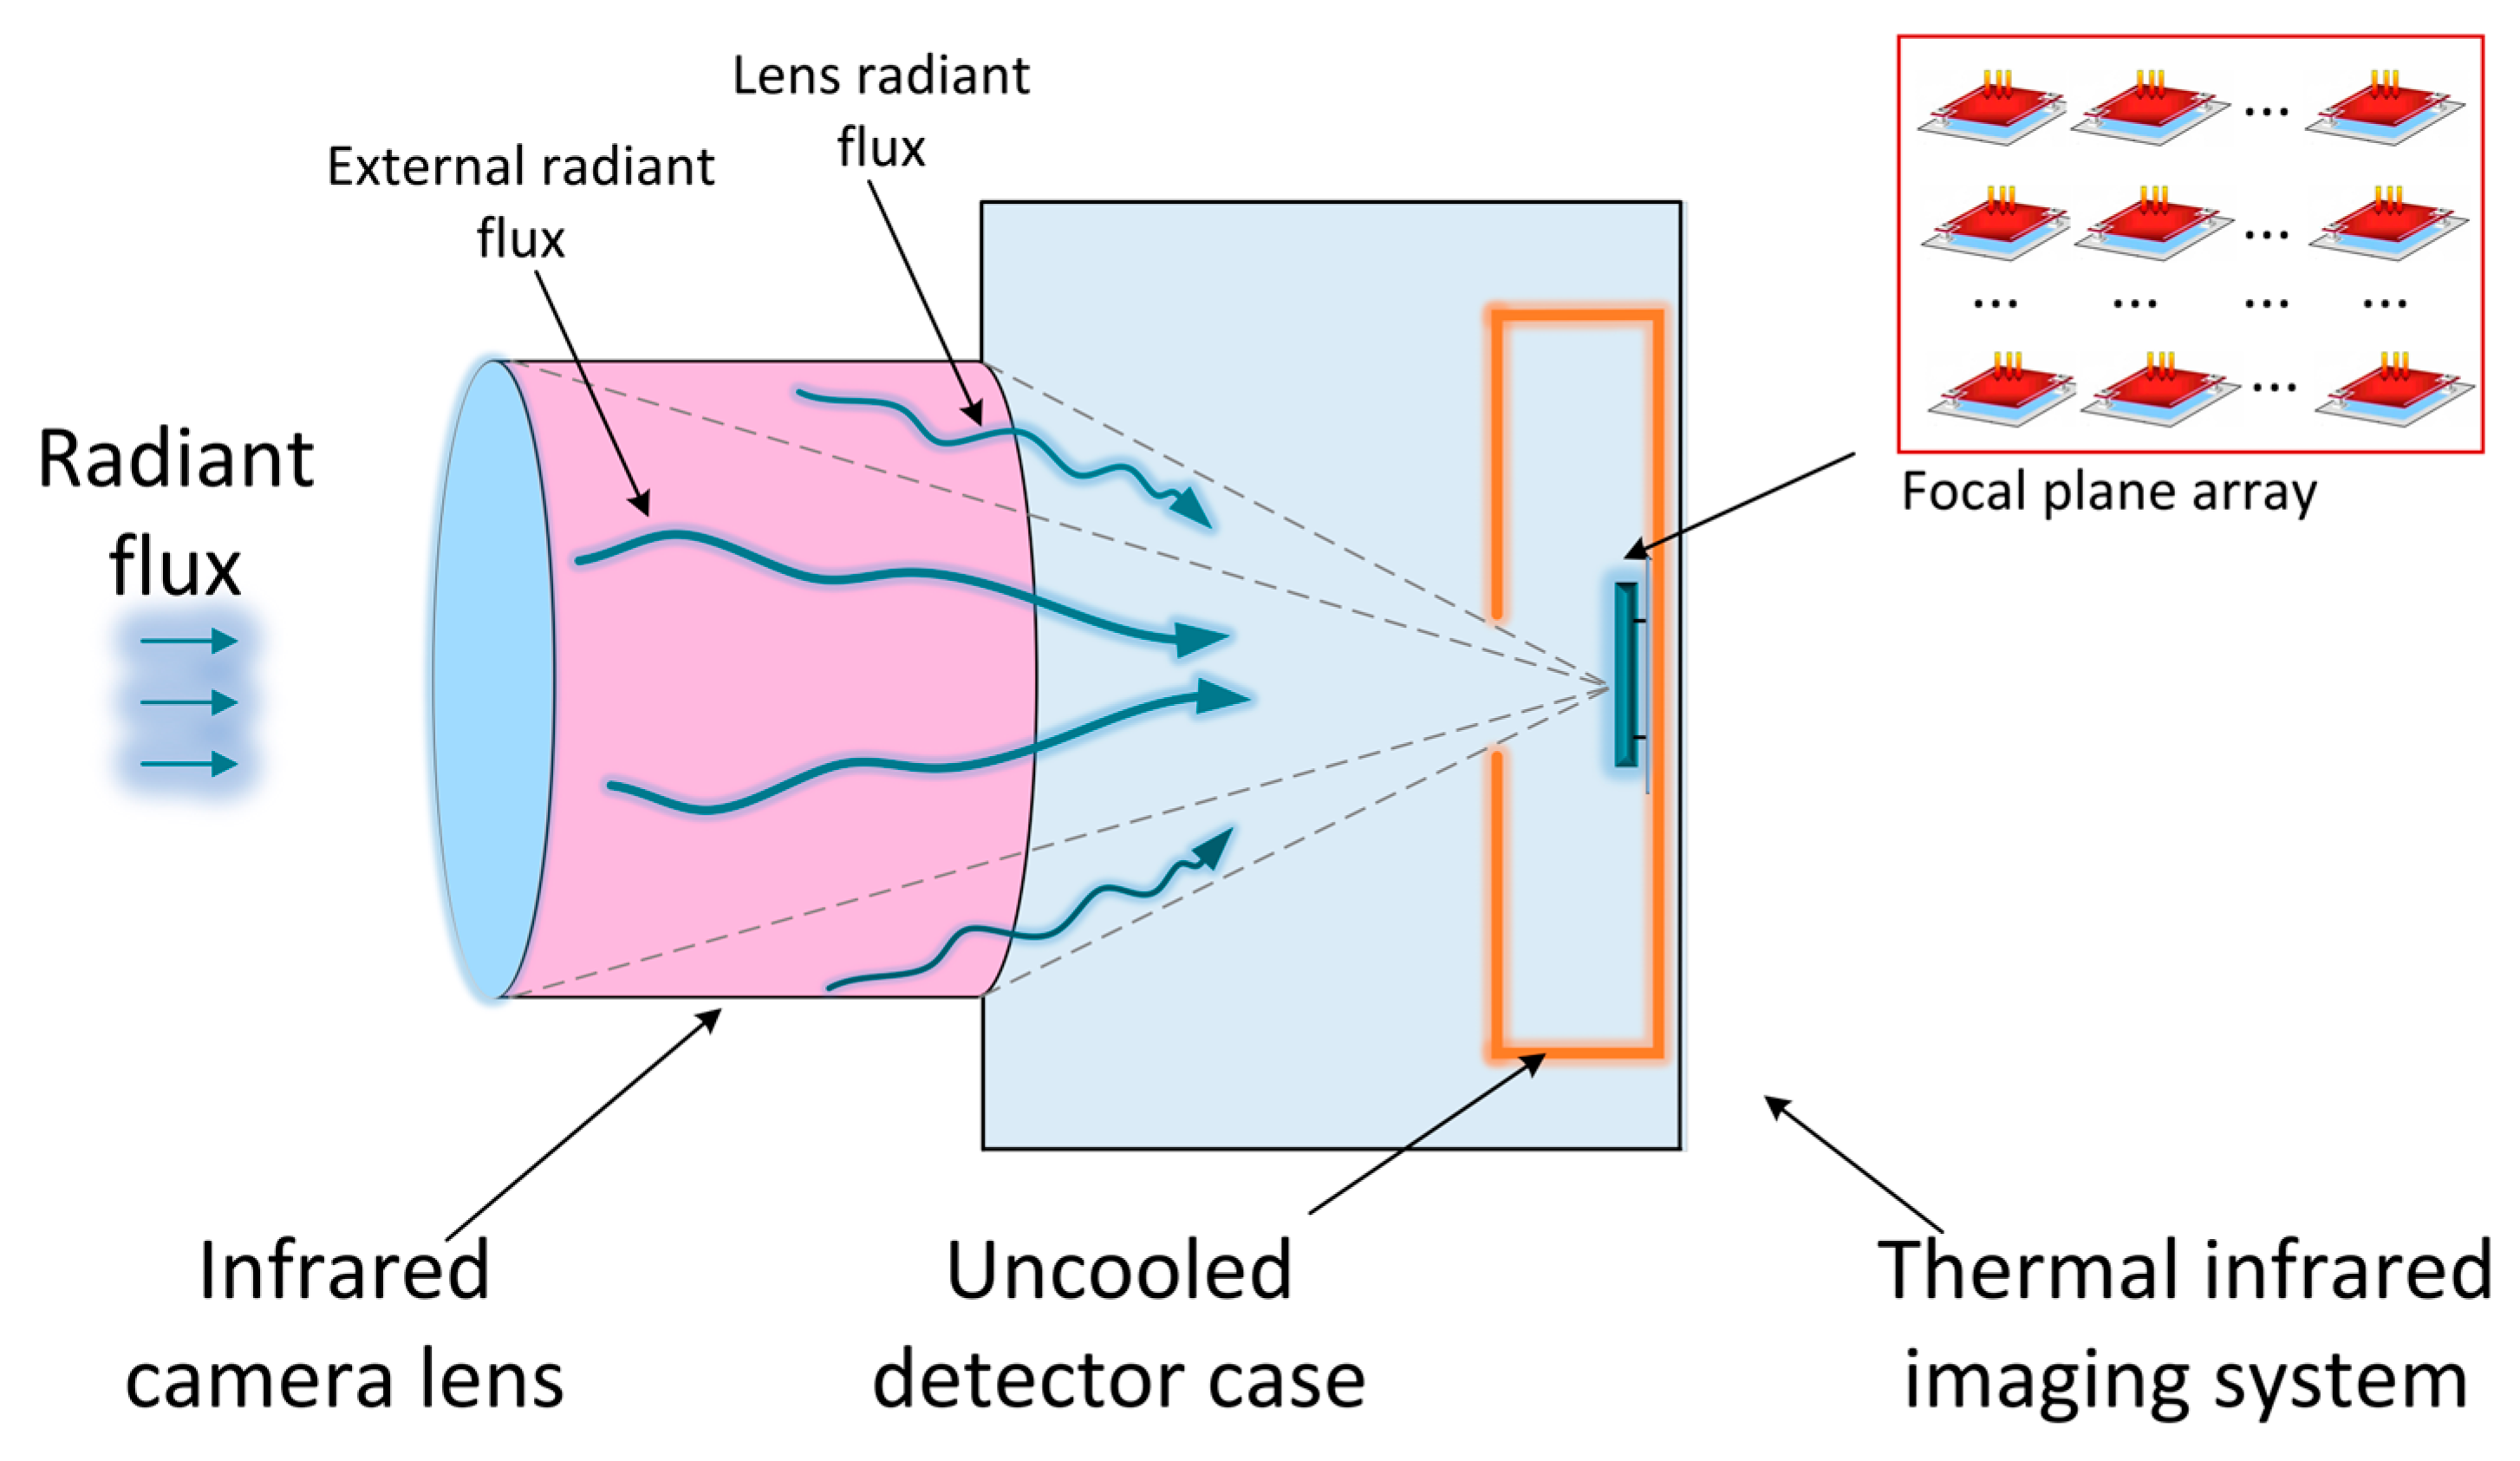
2.1. Thermal Radiation Model

In the theoretical framework of infrared photoelectricity, the spectral radiance of a blackbody is conventionally represented by M λ , T . This quantity is mathematically related to the wavelength λ and the absolute temperature T as follows:
M λ , T = 2 π h c 2 λ 5 1 e c h λ k T 1
where M λ , T represents the spectral radiance of a blackbody with units of W · c m 2 · μ m 1 ; h is Planck’s constant, valued at 6.626196 × 10 34   W · s 2 ; c is the speed of light in a vacuum with a value of 2.997925 × 10 10   c m · s 1 ; and k is the Boltzmann constant, valued at 1.380649 × 10 23   J · K 1 .
Generally, by integrating the spectral radiance of a blackbody over the wavelength range from zero to infinity, we can derive the Stefan–Boltzmann law as follows:
M T = 0 M λ , T d λ = 2 π 5 k 4 15 c 2 h 3 T 4 = σ T 4
where σ represents the Stefan–Boltzmann constant with a value of 5.6697 × 10 12   W c m 2 K 4 , and T represents the absolute temperature of the thermal radiation. The equation demonstrates that the total spectral radiance of an object is directly proportional to the fourth power of its temperature. Consequently, even slight temperature changes can lead to substantial variations in radiative intensity, with the impact being increasingly significant at elevated temperatures.
The uncooled TIR imaging system in our camera was composed of a camera optical lens, a TIR detector, the associated detector electronics, and a mechanical structure house (see Figure 1). External thermal radiation E r enters the camera’s interior through the optical lens and is projected onto the FPA of the TIR detector, while the sources of thermal radiation that can be projected onto the FPA also include the camera optical lens thermal radiation E l , the detector case thermal radiation E d , and the detector itself. The FPA also exists in the external energy radiation E f and indium columns used to support the substrate signal connection of the thermal conductivity E b . The radiation model of the TIR imaging system can be described using the following equation [23]:
E o = E r + E l + E d E f E b
where E o is the radiation energy that the focal surface of the infrared imaging system can finally receive and convert into the output signal. Each thermal radiation source can be represented as an equivalent blackbody radiating energy to the surroundings. The heat conduction process adheres to Fourier’s Law of heat conduction. Within a specific spectral range band, the radiative energy can be described by the following equation:
E r   M r T E l   M l T E d   M d ( T ) E f   M f T E b k A T
where M r T represents external thermal radiation, M l T , M d T , M f T represent the radiative energy emitted by the optical lens, the detector case, and the FPA within the MWIR and LWIR bands, respectively, k is the thermal conductivity of the material with units of W / m · K , A is the cross-sectional area with units of m ² , T is the temperature gradient in K / m , and both k and A are constants.
Based on the above equation, the total radiation energy reaching the uncooled infrared detector FPA is the sum of the contributions from multiple components. Fluctuations in the energy of any single component can result in variations in the output response. To achieve stable measurements of external thermal radiation E r , it is crucial to minimize variations in the thermal radiation emitted by the optical lens E l , the detector case E d , the energy radiated by the FPA to the surroundings E f , and the heat conduction E b .
According to Formulas (2)–(4), assuming that for the same temperature T, the blackbody radiation exitance of a specific band is represented here by λ 1 λ 2 , then, only for the system noise ∆T caused by temperature drift, the fluctuating output radiation energy of the system is as follows:
E M l T λ 1 λ 2 + M d T λ 1 λ 2 + M f T λ 1 λ 2 + C
where C is the thermal conductance at the same temperature T, and in fact, it is not necessarily a constant, since it is not in the category of thermal radiation, so C is the constant instead.
To limit E to a minimum, reduce the λ spectral bandwidth to between λ1 and λ2 or reduce the system temperature drift as noise T , which is the most effective method. However, a bandwidth that is too small decreases the energy input of the imaging system. Therefore, based on this principle, in the design process of uncooled infrared cameras, it is important to consider reducing T .

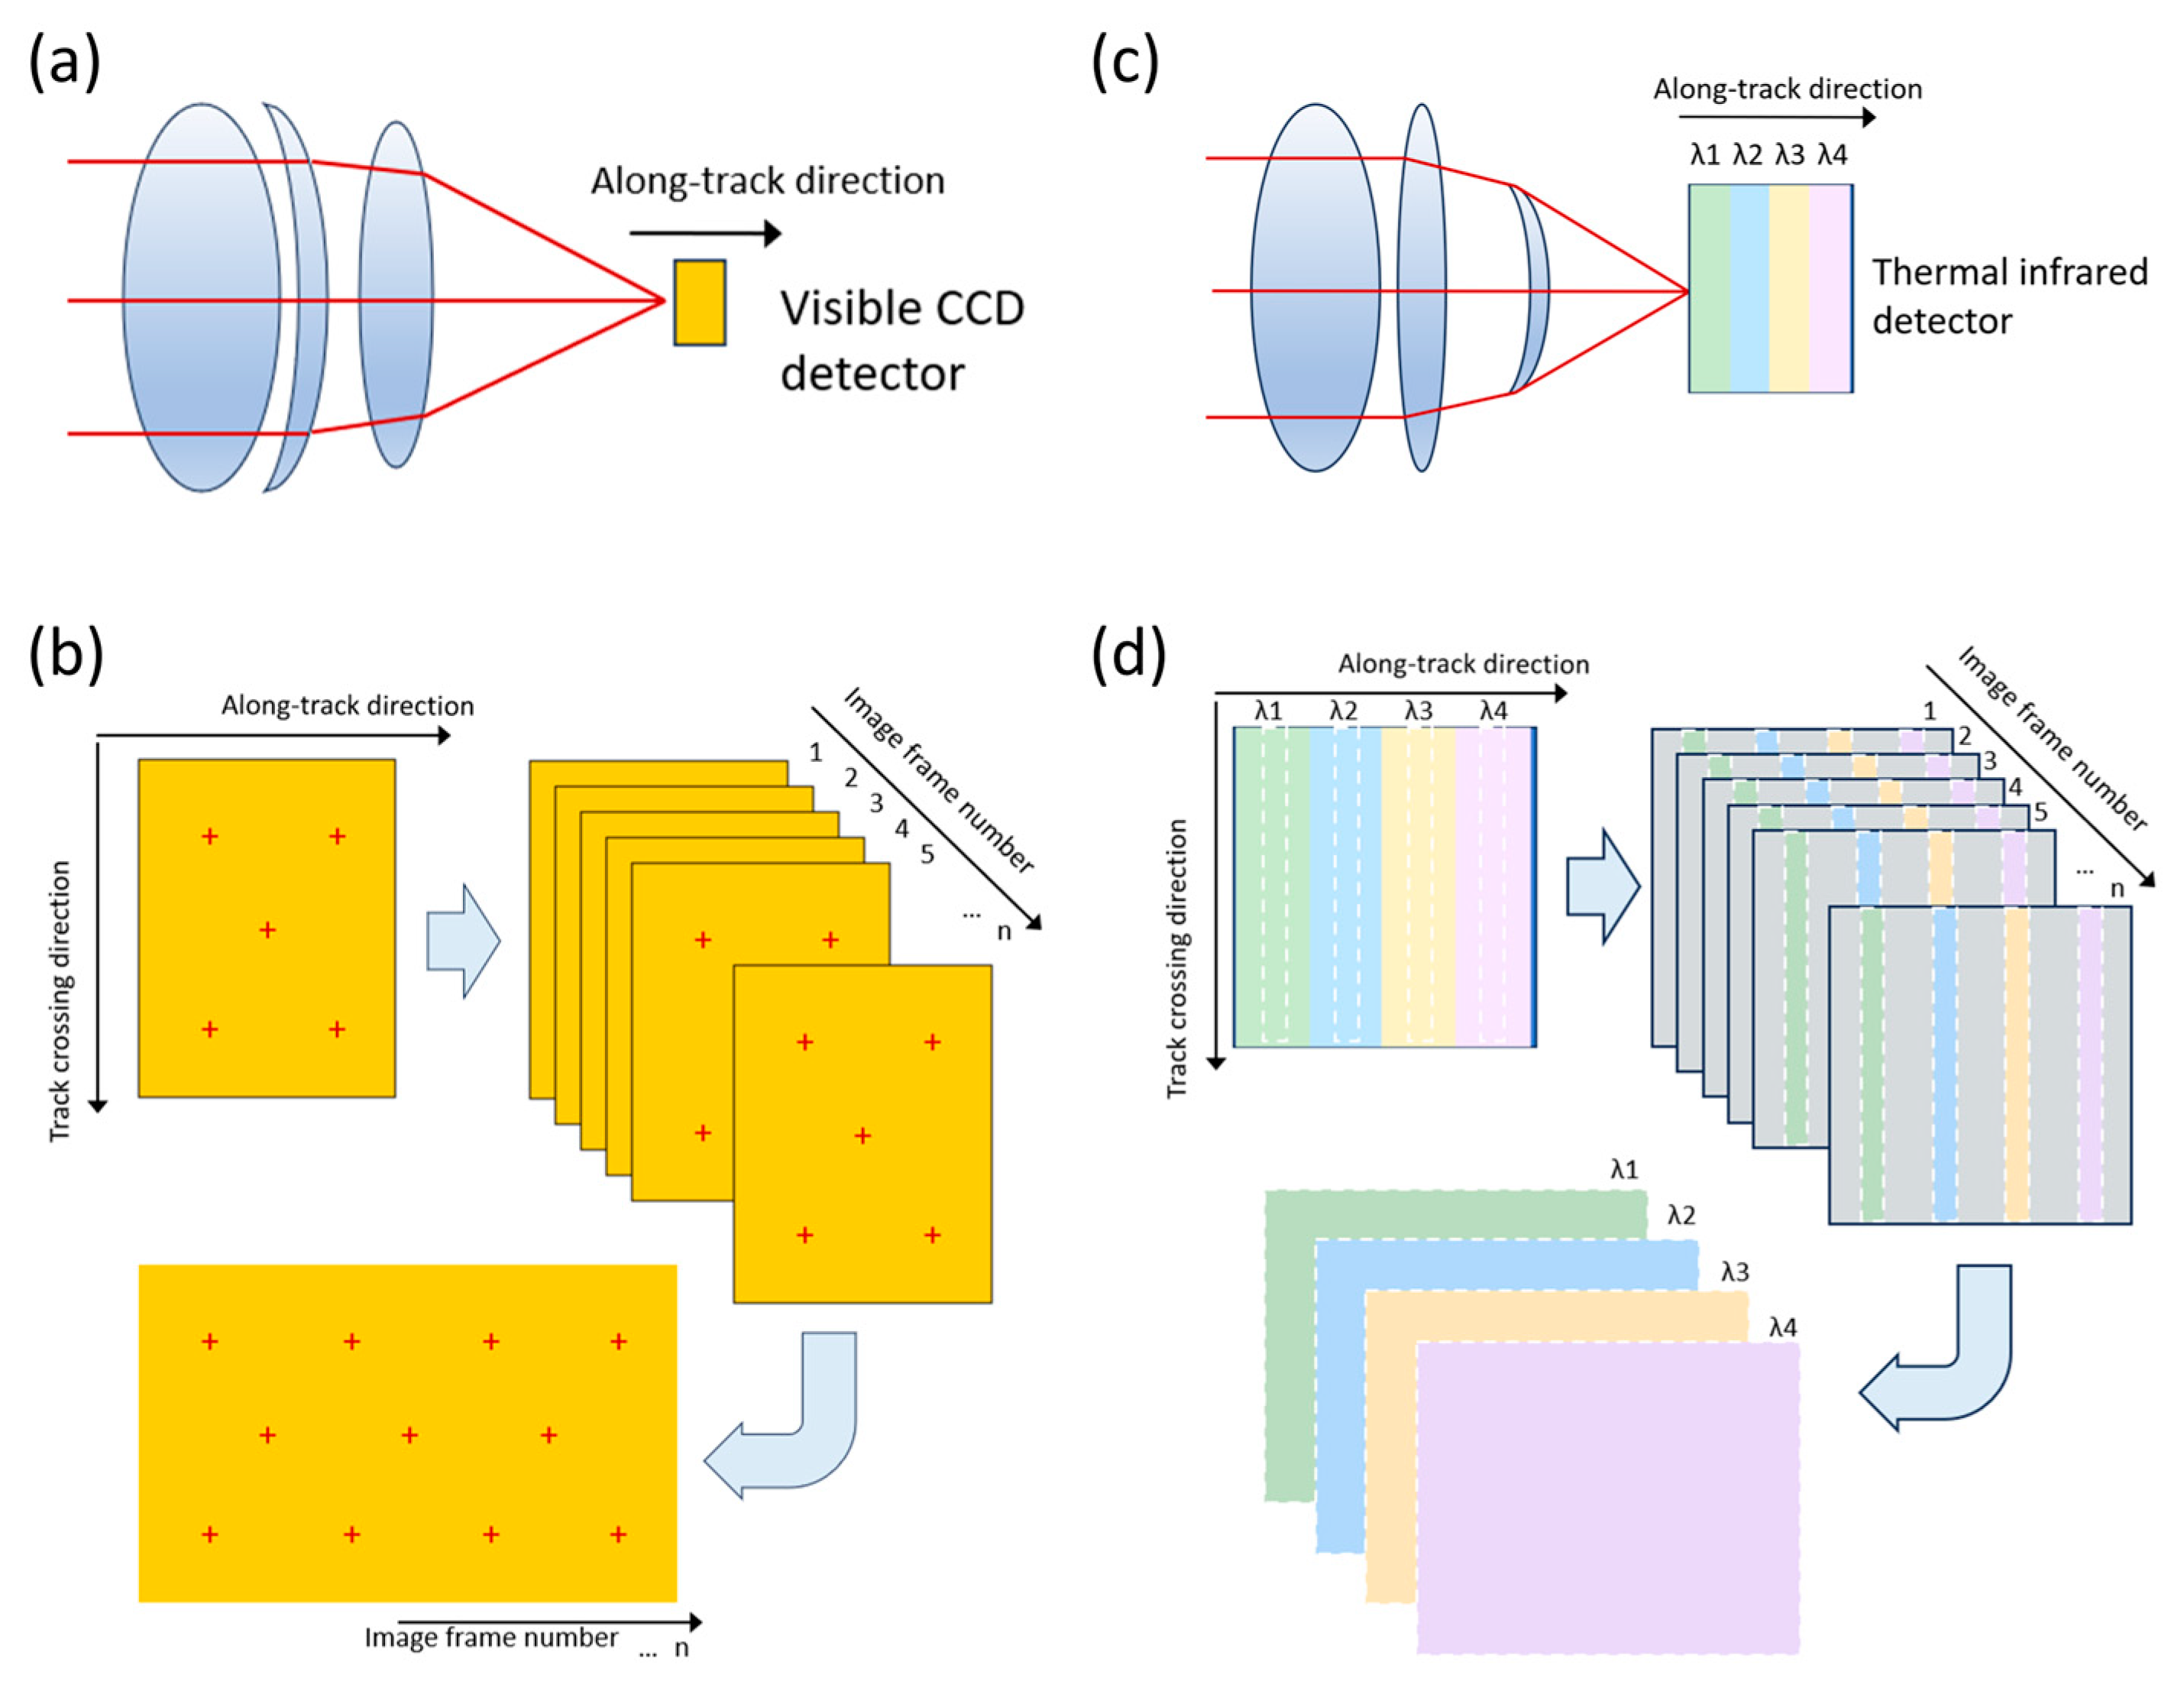
2.2. Camera Imaging Methods

The VIS imaging system utilized continuous push-scan imaging, and the visible full-band image acquired at a lower trigger frequency was used to complete the imaging and then downlink the raw data. Continuous image matching and splicing were carried out during the ground processing phase. The visible imaging schematic is shown in Figure 2a. The field of view of the visible light imaging system is not divided, so the image is a whole picture of the detection array. In the data processing method, only the feature point matching method is used to detect the significant feature points in the image, such as corner points, edges, etc., and the geometric relationship of these feature points is used to achieve image stitching. This method is represented in Figure 2b.
The TIR imaging system incorporated a commercial vanadium oxide (VOx) uncooled infrared detector module, complemented by self-designed infrared lenses and filters, meticulously assembled to form a multispectral infrared imaging system. The VOx uncooled infrared detector was specially customized to respond to the spectral band of 3–14 μm. The optical path of the self-designed TIR imaging system consisted of four split-window filters, which separated the full-band radiative energy signal into four narrow-band infrared energy signals. These signals were then incidents on the detector FPA, forming a four-band spectral image of the ground target (see Figure 2c). The filter was composed of germanium (Ge) glass and was coated with a light transmission enhancement film, ensuring that the transmittance of the corresponding wavelength band exceeded 90%. The TIR imaging system utilized the push-scanning imaging method to scan the ground scene within the field of view area of the flight track, thereby acquiring the image information of the MWIR and LWIR bands. After the completion of the imaging process, the four-channel images were reconstructed with multiple frames, resulting in the acquisition of the complete four spectral ground target images (see Figure 2d).

2.3. Increased Sensitivity

The ability of a TIR imaging system to detect variations in the key quantities of a target radiation source is referred to as sensitivity, which is usually expressed as Noise Equivalent Temperature Differences (NETD). In the case of an uncooled TIR imaging system, it not only captures the target radiation signal but also picks up background radiation noise originating from temperature fluctuations within the instrument. To reduce the effects of temperature drift and improve the sensitivity of the infrared camera, we implemented two strategies: an accurate temperature control technique and a spatiotemporal stacking method.
(a)
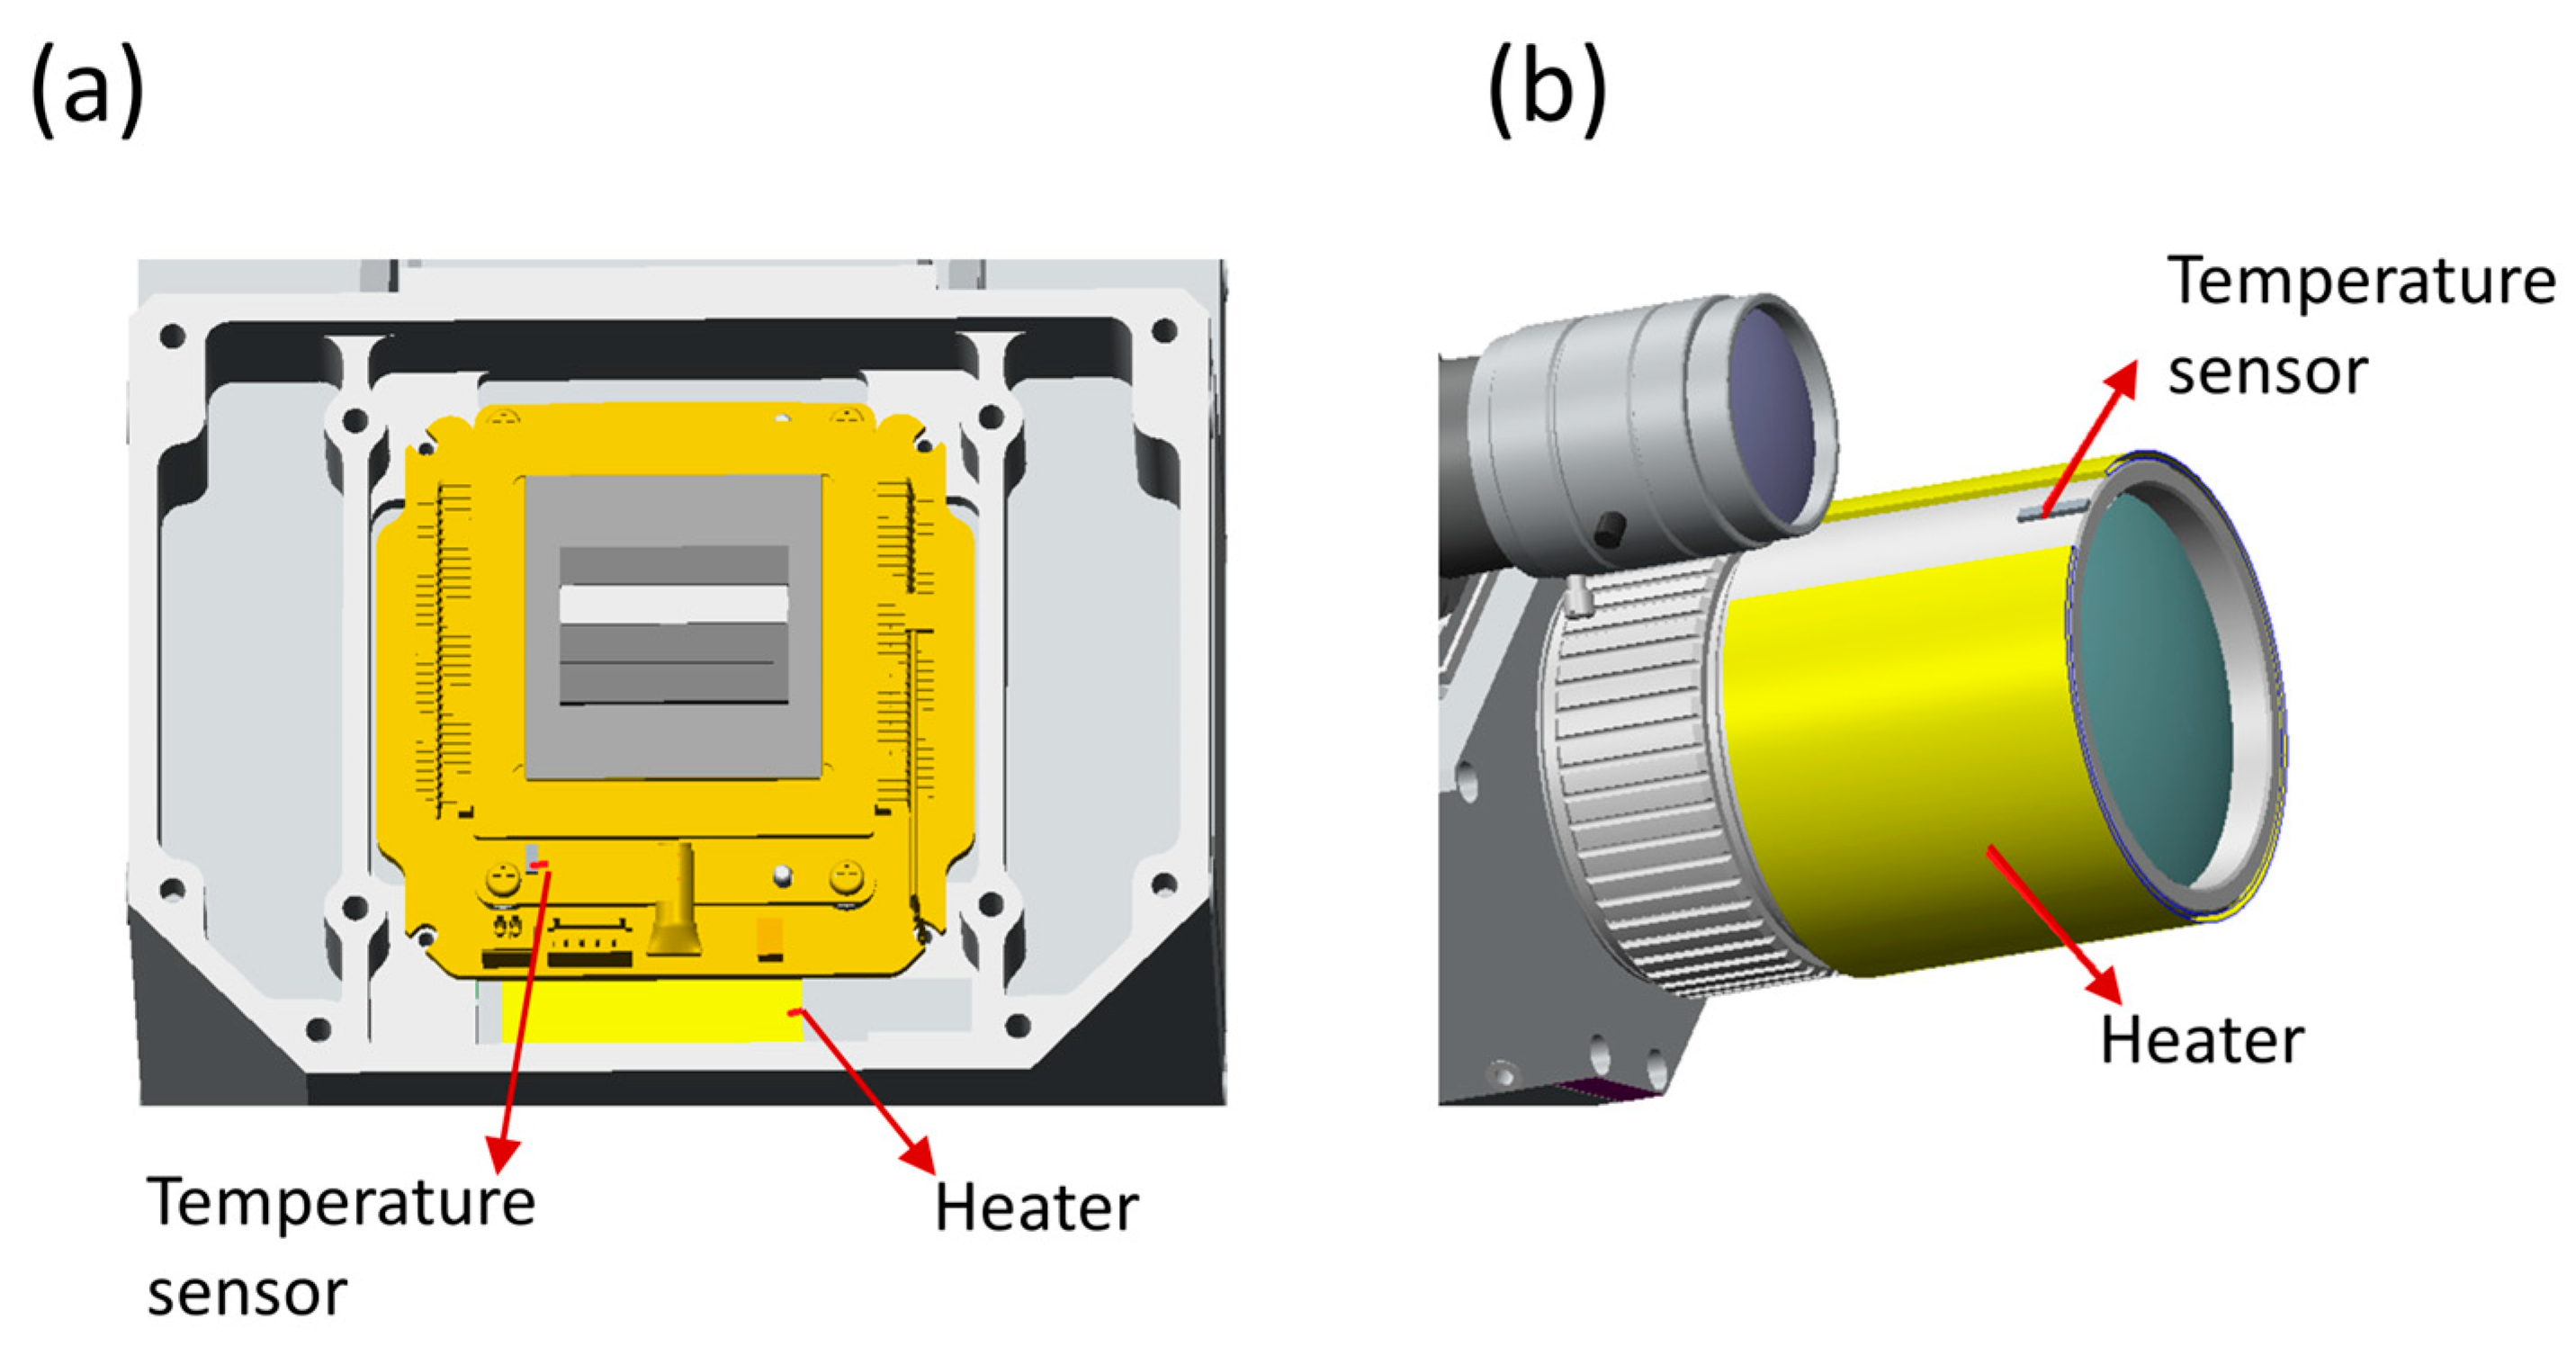
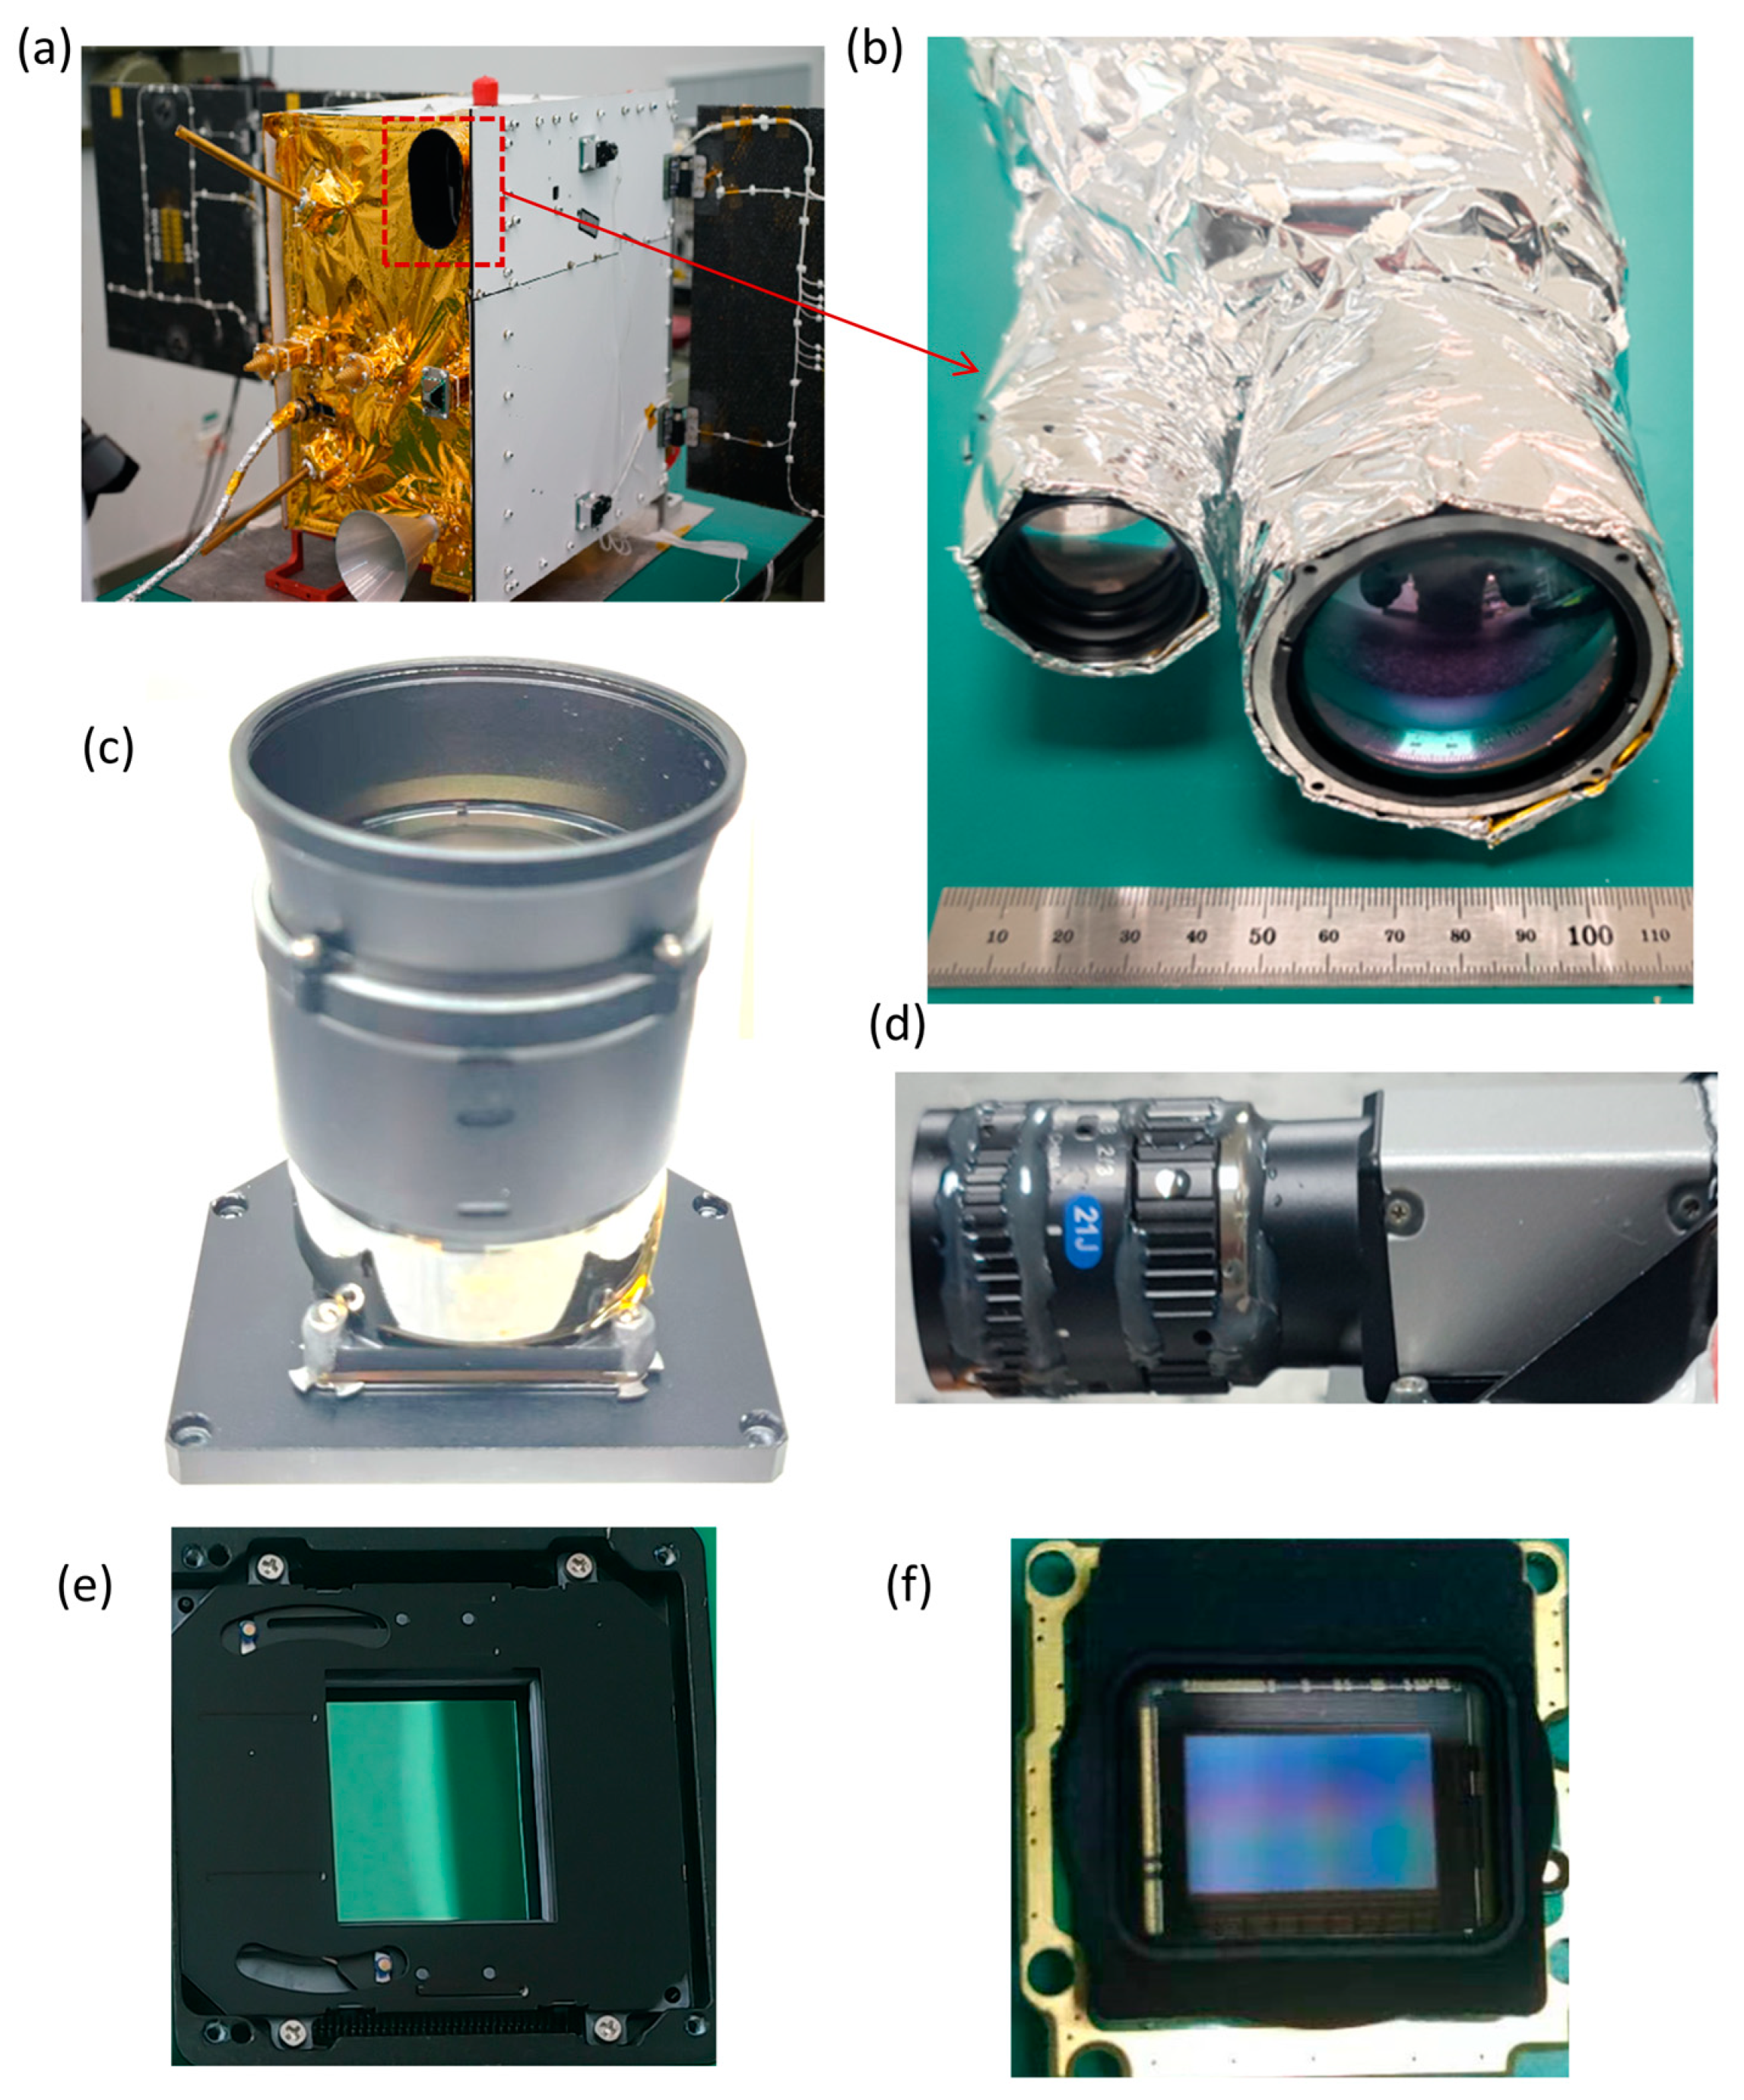
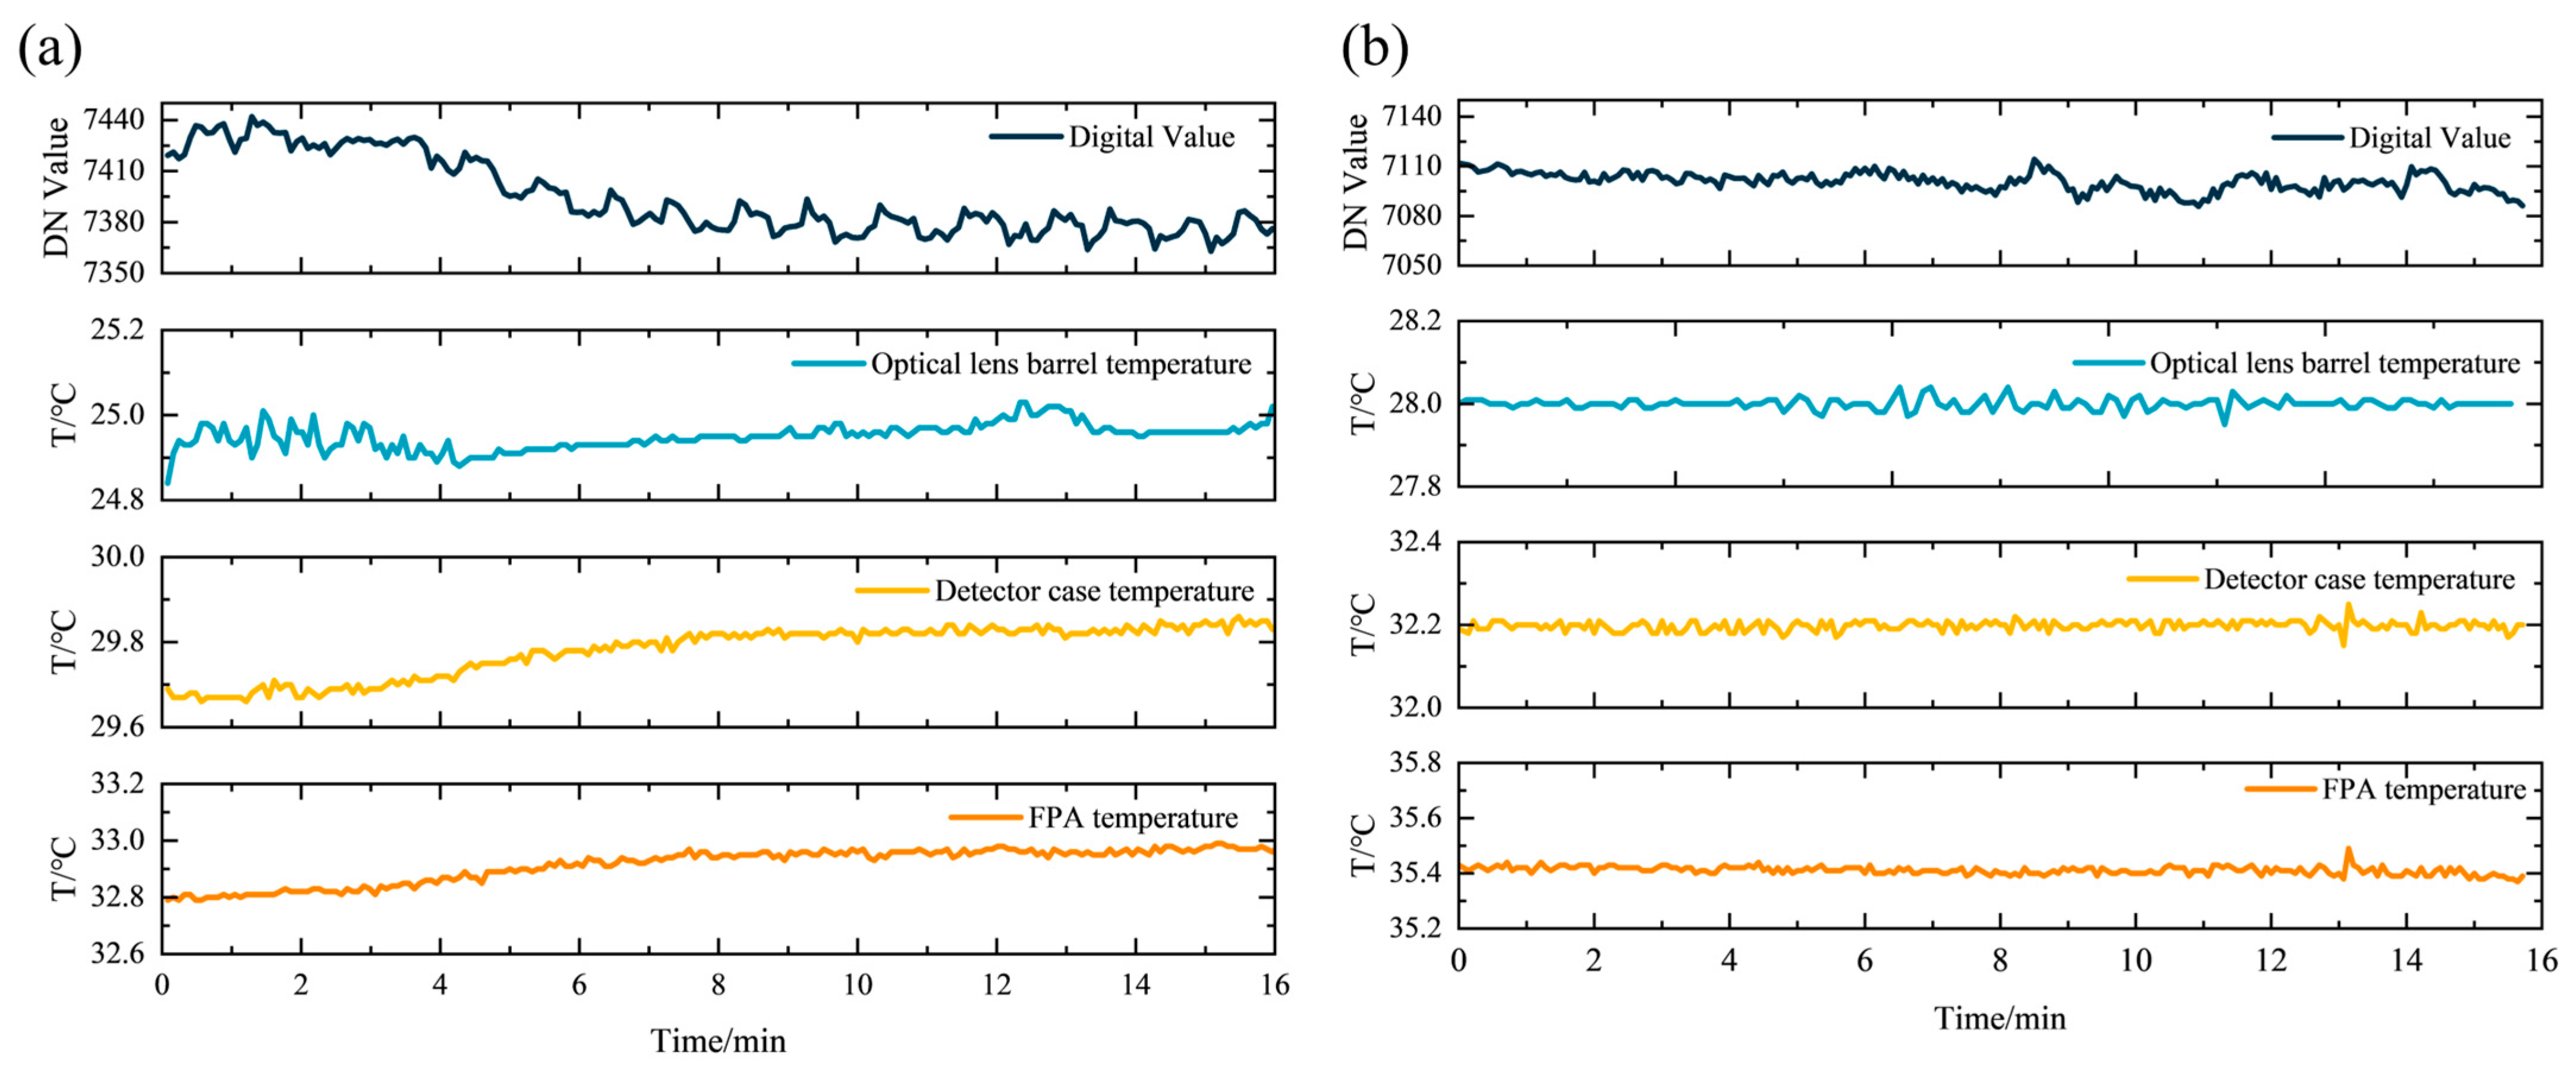
To reduce noise radiation and minimize temperature fluctuations, the inner wall of the mirror tube was treated with a black anodized coating. This treatment helped lower the radiation parameters, thereby decreasing the heat transfer between the mirror tube’s inner wall and its environment. As a result, the amplitude of the temperature fluctuations was significantly reduced, which contributed to the stability of the mirror tube’s temperature control. To maintain stability in the infrared detector throughout its operation, the detector case (as shown in Figure 3a) was designed to have a heating power of 3 W, while the heating power for the camera optical lens was set at 1.5 W (refer to Figure 3b). The implementation of Proportional–Integral–Derivative (PID) thermal control strategies in the optical pathway and the uncooled detector unit was crucial. These measures stabilized the temperatures of the optical lens and the detector shell structure during the detection and imaging processes. By reducing the impacts of temperature fluctuations and mitigating noise, these strategies enhanced the signal-to-noise ratio (SNR). Overall, incorporating PID thermal control within the optical pathway and the uncooled detector unit ensured that the optical lens and the detector unit maintained stable temperatures, further improving performance during imaging.
(b)
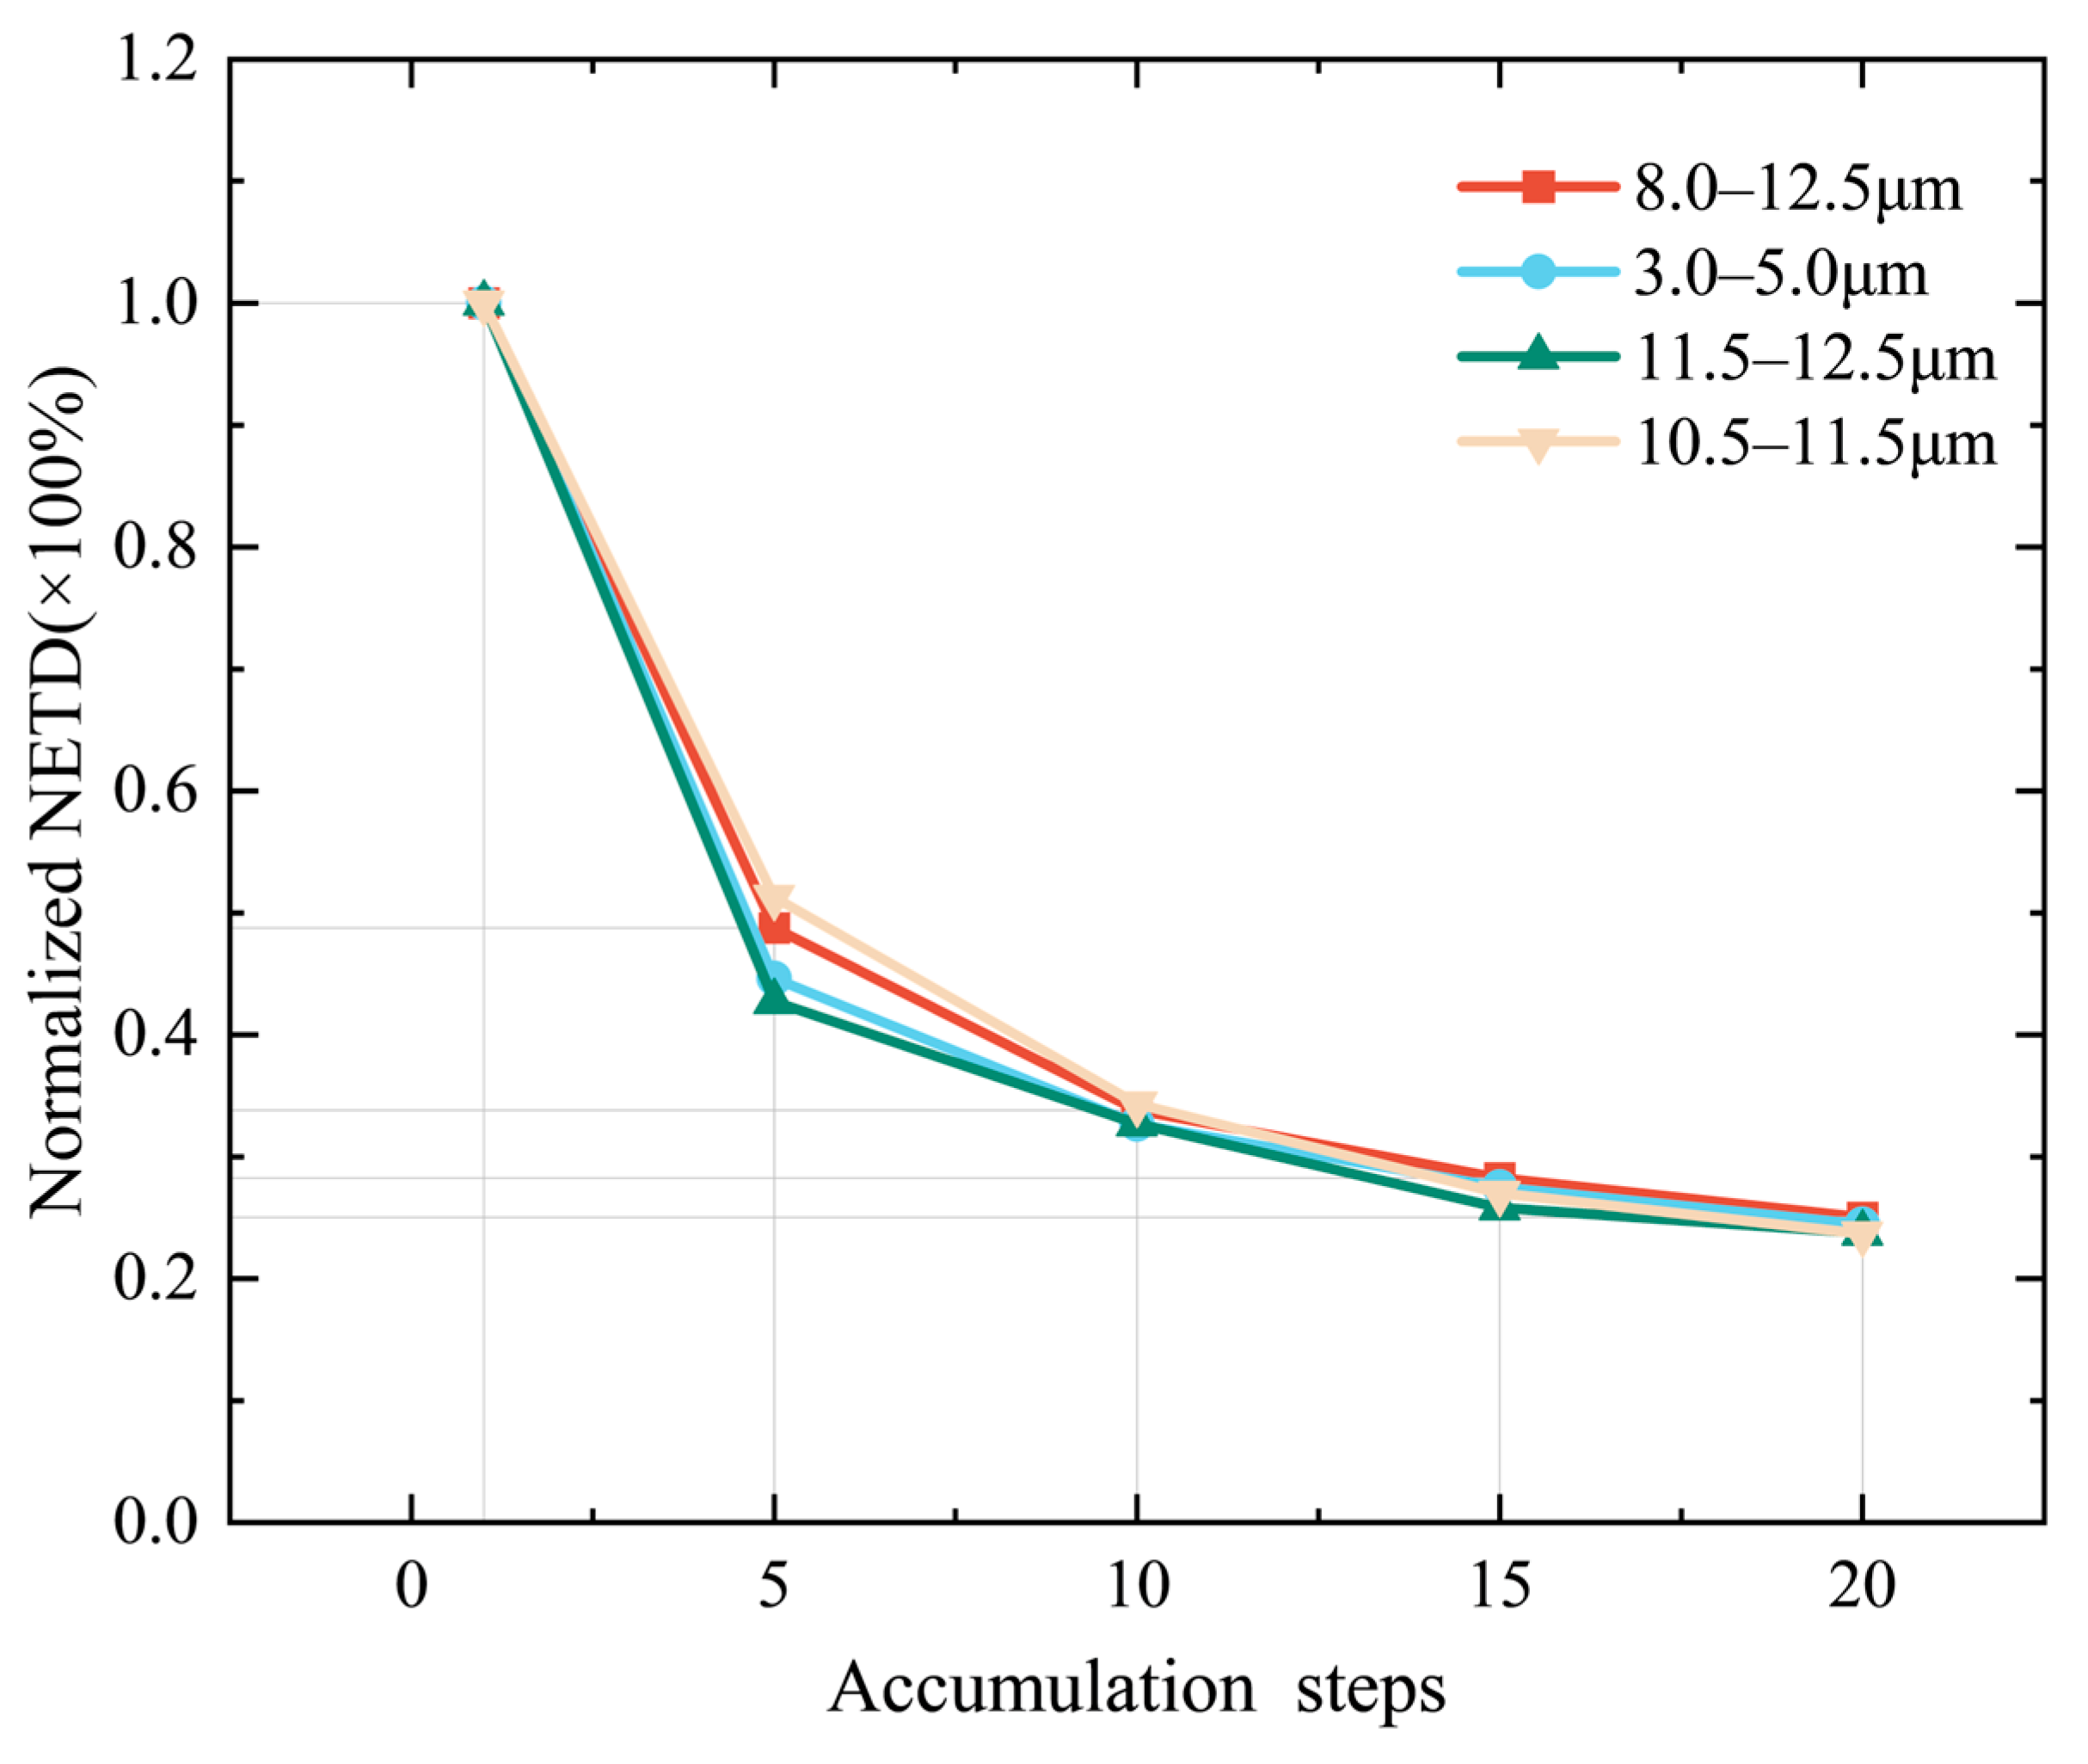
In the processing of imaging, a spatiotemporal interleaved redundant information multiplexing method was proposed. The method was founded on modern information theory, which posited that the accumulation of optical signals from the same target region could enhance weak signals and mitigate the impact of noise on image quality. Specifically, when the infrared outer array detector advanced the scanning, under the condition of speed–height ratio matching, the images of two adjacent frames were staggered by an integer number of pixels in the direction of advancing the scanning. By utilizing the detector’s different pixels to integrate the imaging of the same scene in a very short period, the pixels corresponding to the same space in the images from different times were accumulated to calculate the mean value. This process reduced the white noise in the detection process by matching the accumulation of information between images from different frames and enhancing the sensitivity of uncooled thermal infrared cameras.
This method can be delineated as the following process, assuming that the SNR for a single sample is
S N R s i n g l e = S i g n a l ( r m s ) N o i s e ( r m s )
whereas the sensitivity of an infrared imaging system is measured as follows:
N E T D s i n g l e = T S N R s i n g l e = T D N σ
where T denotes the temperature difference between different target radiation sources; σ denotes the root mean square difference of the data collected closer to the typical temperature value, where 300 K is taken for LWIR and 400 K for MWIR; and   D N denotes the difference between the digital value of the different target radiation sources after they have been imaged and outputted through the infrared imaging system. The SNR of the averaged output after N accumulations is
S N R m u l t i p l e = N · S N R s i n g l e
The minimum detectable signal of the averaged output after N times of accumulation becomes 1 N of that before accumulation, while the sampling value of the same temperature difference remains unchanged after the signal is averaged cumulatively, and the sensitivity is improved to N of that of the original.
N E T D m u l t i p l e = N E T D s i n g l e × 1 N

3. Camera Design

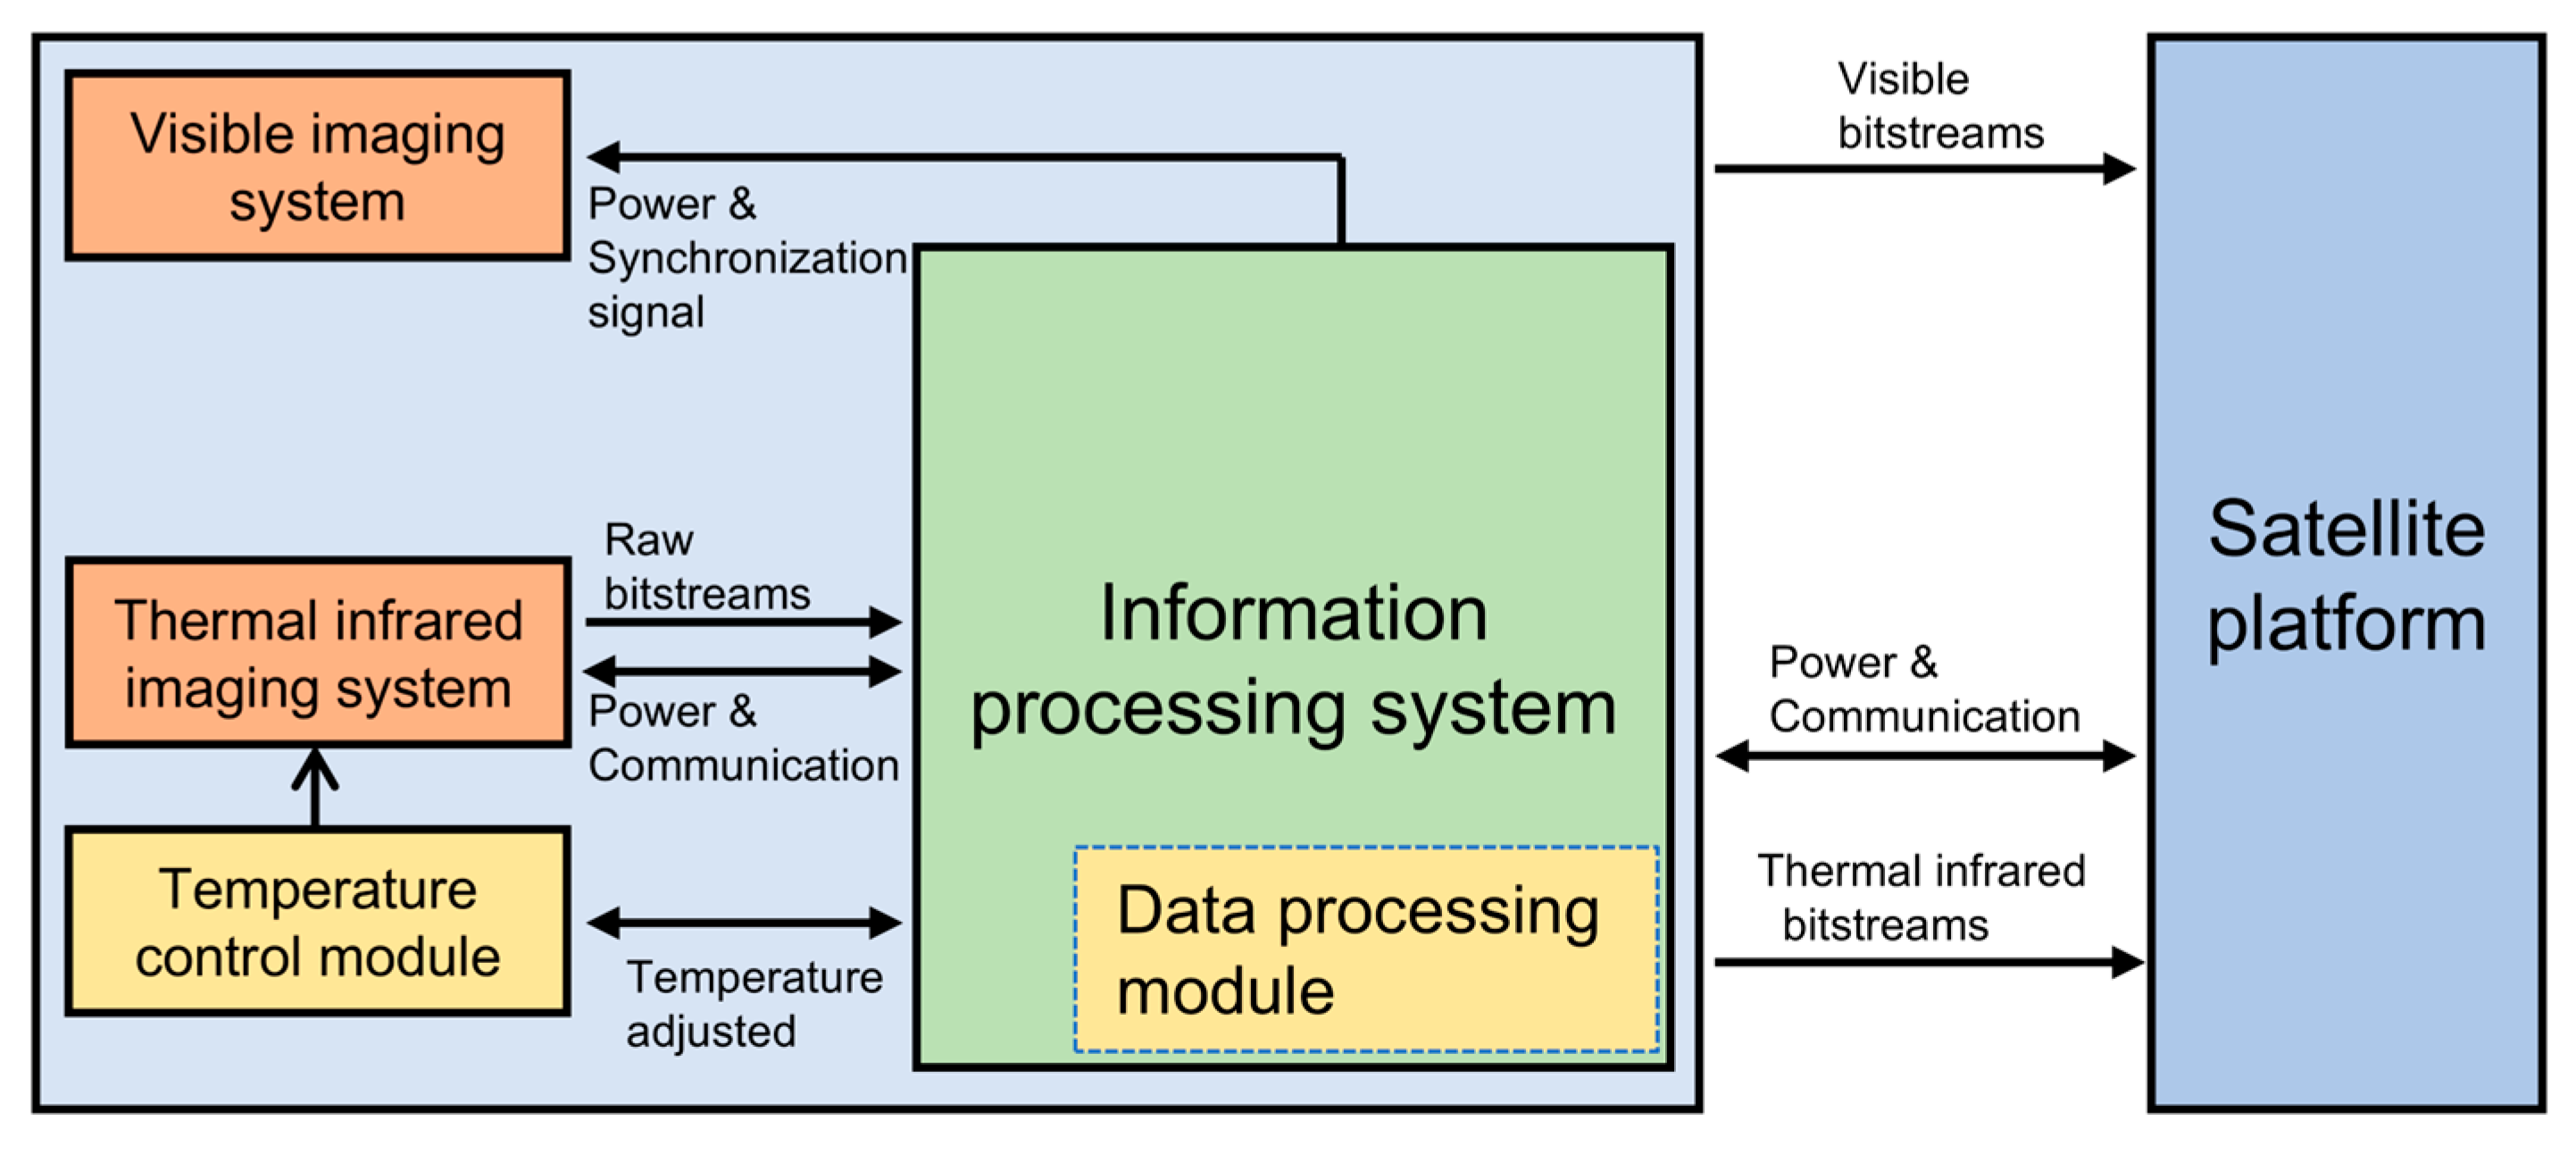
3.1. Camera Architecture

The camera consisted of a VIS imaging system, a TIR imaging system, and an information processing system (see Figure 4).
The VIS imaging system employed mature commercial lens modules to obtain the 400–700 nm band features of the landscape. It was designed with a spatial resolution of 60 m, enhancing the accuracy of geographic information positioning. On the other hand, the TIR imaging system was employed to acquire images in the MWIR and LWIR bands. It was primarily designed for wildfire detection applications on the Earth’s surface. The TIR imaging system could function independently of light conditions, maintaining operational competence during both diurnal and nocturnal periods. The information processing system included two components: a data processing component and a temperature control component. These modules facilitated the camera’s stable acquisition of remote sensing images and external measurement and control communications. The camera is capable of realizing 24 h of uninterrupted remote sensing observation, which improves the efficiency and time resolution of remote sensing data acquisition and ensures continuous and effective monitoring of the target area.
Figure 5a shows the pre-launch state of the lightweight, compact multispectral camera, which has been mounted on a 50 kg class microsatellite. Figure 5b displays the pre-launch camera, which has a width of 10 cm. After undergoing more than two months of testing, it would be officially launched into space. The detailed specifications of the camera can be found in Table 1.

3.2. TIR Imaging System

The TIR imaging system consisted of a commercially available VOx uncooled infrared detector, adapter support, and an optical lens assembly. The closed space created by the lens and barrel of the optical lens assembly featured small vent holes on the sides to accommodate the vacuum conditions of space. Additionally, the barrel was fitted with mounting lugs at the front, which connected to the main frame (as shown in Figure 5c). The infrared telescope was designed with an aperture of 50 mm and a focal length of 50 mm, utilizing a transmissive optical system made from Ge as the optical material. Its housing was designed to withstand the vibrations experienced during launch, with a seamless and monocoque structure that provided enough stiffness to support the weight of the Ge lens, which was 397 g. The uncooled infrared detector FPA was housed in an anodized enclosure that was sealed to effectively dissipate heat. To minimize the impact of water vapor and diffusion gases on the detector, the interior of the enclosure was filled with nitrogen. The specifications of the TIR detector are summarized in Table 2.
According to the thermal radiation model Formula (5), we have analyzed the influence of correlation variables on the output response of the TIR imaging system. The standard deviation T   is the most commonly used indicator to evaluate the fluctuation of temperature data because it is intuitive and easy to interpret. Before the development of the camera, we calculated the effect of the model on the blackbody response in the band of 3–14 μm.
Figure 6 shows the response curve of the thermal infrared imaging system to the 35 °C blackbody with and without using the accurate temperature control technique, respectively. The time period is about 15 min. We calculated the standard deviations of the related temperature variables in the figure with and without temperature control measures, expressed by ∆T. The noise of the system output digital value is represented by σ . The results are shown in Table 3.
Table 3 shows the influence of temperature control measures on the key factors of the TIR imaging system. The fluctuation range of the optical lens barrel temperature is reduced by about 2.85 times, the detector case temperature is reduced by about 5.05 times, and the FPA temperature is reduced by about 4.15 times. Overall, the total noise of the system is reduced by 3.92 times.
Therefore, heaters were installed on the uncooled detector structure and optical lens barrel, which reduced the impact, reduced the signal drift, and proved to be effective in improving the signal quality. Before each imaging session, the shutter module positioned in front of the detector array was typically calibrated once. The uncooled infrared detector is shown in Figure 5e. This calibration further diminished the effects of temperature drift on the imaging quality of the system. The optical lens and the detector were analyzed to ensure their suitability for use in a vacuum environment, and both were found to meet the requirements. Subsequent ground-based vacuum tests assessed the optical lens and the detector, confirming that they were capable of functioning appropriately in vacuum conditions. To meet space utilization requirements, further operations were necessary. Such operations included mechanical reinforcement and calibration.

3.3. VIS Imaging System

A commercial visible light detector was utilized in the construction of the VIS imaging system. To ensure its adaptability to the harsh space environment, we implemented modification measures for the lens of the VIS imaging system to enhance the reliability of the commercial camera in space. These modification measures included the use of a space adhesive, heat-conducting gaskets, and the addition of small air vents (see Figure 5d).
The VIS imaging system was equipped with an A7200MG30 CMOS detector (see Figure 5f) provided by iRAY Technology Co., Ltd. (Yantai, China). The array size of the visible camera is 1920 × 1200, and the detector pixel size is 5.86 μm × 5.86 μm, covering wavelengths of 400–700 nm. The VIS imaging system was designed with a higher spatial resolution of 60 m@500 km. At a distance of 500 km, the enhanced spatial resolution could enhance the absolute accuracy of positioning. Before the vacuum test, the commercial lens underwent modifications, all lubricants were eliminated, and the focus was adjusted to infinity with a collimator in the laboratory. The primary specifications of the visible light detector are detailed in Table 2.

3.4. Information Processing System

The information processing system contained two modules: a data processing module and a temperature control module. The data processing module was used for data preprocessing of the infrared imaging results, including non-uniformity correction, radiation correction, image enhancement, and telemetry remote control communication with the satellite platform. The XC7K325T-2FFG900I civilian chip of the XILINX Company (San Jose, CA, USA) was used in the data processing module, and it was a low-cost chip. The interface for communication with the platform employed the widely utilized Controller Area Network (CAN) bus interface and Gigabit Ethernet interface, facilitating the transmission of commands from the platform to the camera and the reception and transmission of image data to the satellite platform. The utilization of standard network interfaces contributed to space and development time savings, thereby reducing the overall cost of the camera. The temperature control module played a pivotal role in stabilizing the temperature of the camera’s critical components. It employed a PID temperature control algorithm to ensure a precise regulation of the temperatures of the uncooled detector unit and the optical unit.

4. Results

4.1. Camera Sensitivity

We conducted a NETD test on the four TIR spectral bands of the multispectral uncooled infrared camera. The procedure involved placing two standard blackbody sources (Model: Medium- and High-Temperature Blackbody from Optoelectronics Technology Co., Ltd., Jiyuan, Hangzhou, China) at different temperatures in front of the TIR imaging system (see Figure 7a). For the LWIR spectral bands, blackbody 1 was set to 50 °C, while blackbody 2 was set to 27 °C. In contrast, for the MWIR spectral band, blackbody 1 was configured to 97 °C, and blackbody 2 was set to 127 °C. After powering on the camera, we used the precision temperature control system to adjust the temperature of the infrared optical lens barrel and the housing connected to the uncooled detector to approximately 1.5 °C above room temperature. Following a stabilization period of about 20 min, during which time the temperature gradually stabilized, we captured images of the two blackbody sources by the camera, and we selected the image area corresponding to the maximum response for each spectral band from the data acquired by the TIR imaging system of the camera, as illustrated in Figure 7b. The average curve of the response values from the two blackbody sources, acquired simultaneously along the traversing rail for the four bands, is shown in Figure 7c.
We utilized the image data from 100 frames to calculate the average value of the two blackbody signals and the standard deviation and respectively tested the NETD of each infrared band with the accumulation steps of 1, 5, 10, 15, and 20. The results are presented in Table 4.
We drew the data in the above table into a graph, as shown in Figure 8 below. Compared with the accumulation series of 1, the NETD value of the accumulation series of 10 was about 30%, which was in line with the analysis of the enhancement capability of the Formula (9). Therefore, the system selected 10 times of accumulation when considering the operation resources comprehensively.
Generally, wildfires can be divided into three stages: the initial stage, the spreading stage, and the extinguishing stage. In the early stage of a fire, the ignition point is small, the temperature is low, and the radiation signal is weak. The camera needs to have high sensitivity to detect the weak infrared radiation signals. During the fire spreading stage, the fire rapidly expands, the temperature rises, and the radiation signal significantly intensifies. In the extinguishing stage, the fire weakens, but residual embers or hotspots may still exist. The camera needs to have high sensitivity and the ability to detect low-intensity residual thermal radiation. Typically, the initial and extinguishing stages of a fire are low-intensity fires with a temperature range of approximately 200–400 °C. The spreading stage is divided into moderate-intensity and high-intensity fires. Moderate-intensity fires have a temperature range of 400–600 °C, while high-intensity fires exceed 800 °C.
According to Planck’s law, NETD is inversely proportional to the rate of change of the spectral emissivity of blackbody radiation d M d T , so the NETD in different stages of wildfire development can be converted using the following formula:
N E T D ( T 2 ) = N E T D ( T 1 ) · d M d T | T = T 1 d M d T | T = T 2
We have measured the NETD of four thermal infrared bands of the camera in the laboratory and calculated the NETD of each band of the TIR imaging system at the following temperatures: 200 °C, 400 °C, 600 °C, 800 °C, and 1000 °C, according to different temperature distributions during different fire periods. The results are shown in Table 5.
Table 5 demonstrates that as temperature increases, the NETD values of the camera’s four TIR bands decrease, indicating an enhanced differential temperature detection capability with stronger infrared radiation at higher temperatures. However, at elevated temperatures, the peak wavelength of blackbody radiation shifts toward shorter wavelengths. Consequently, medium- and high-temperature wildfires are more suitably detected using MWIR bands, while LWIR bands exhibit superior detection performance for low-temperature fires during their initial stages.

4.2. Wildfire Detection

On 8 June 2024, at approximately 9:25 a.m. CST, the multispectral uncooled infrared camera detected an early-stage forest fire near the mouth of Leman Bay on the Roper River in the Northern Territory of Australia. Both the panchromatic VIS and TIR imaging systems had successfully captured the scene of the wildfire. The visible light image (as shown in Figure 9a) provided clear surface information about the area, indicating that the forest fire was in its early stages, accompanied by visible smoke and signs of fire. Figure 9b–e shows the grayscale data images of the four bands from the TIR imaging system, enabling a precise identification of the wildfire’s location. When combined with the known spatial resolution information, geographic information may be matched to locate the specific location of the wildfire, with geographic coordinates of (135.34°E, 14.77°S), more accurately.
MODIS and VIIRS remote sensing images were selected for comparison. The image time of the MODIS data was 05:45 UTC on 8 June 2024, and the remote sensing image of the thermal infrared band band20 (3.66–3.84 μm) channel was selected (as shown in Figure 10a). The imaging time of the VIIRS data was 05:24 UTC on 8 June 2024, and the remote sensing image of the thermal infrared band I04 (3.55–3.93 μm) channel was selected (as shown in Figure 10b).
These two images of forest fires near the mouth of Lyman Bay in Australia are in the MWIR range and are very sensitive to the high-temperature radiation of fire hotspots, which can effectively detect forest fires, grassland fires, and so on. Compared with the remote sensing image of our camera, the shooting time here was about 4 h later, and the wildfire was theoretically larger, the infrared radiation was stronger, and the fire characteristics were more obvious. However, the MODIS spatial resolution was only 1000 m, the VIIRS spatial resolution was 375 m, the description of the fire outline was not clear, and the surface scenery features around the wildfire, such as rivers, were not obvious. In contrast, the remote sensing images obtained by our camera in the early stage were clearer, more accurate in positioning, and more conducive to an assessment and judgment of the fire.
When determining the geographic coordinates of the fire point, calculating the error range is an important step in evaluating the accuracy and reliability of remote sensing data. The error range is usually determined by the following factors: spatial resolution (GSD), geographic registration accuracy, fire detection algorithm, satellite attitude, and orbit parameters. The overall error range can be estimated by the following formula:
e r r c a m e r a = e r r G S D 2 + e r r r e g i s t r a t i o n 2 + e r r a l g o r i t h m 2 + e r r o r b i t 2
The spatial resolution of the camera was 120 m, and the GSD error was assumed to be the half pixel resolution of ±60 m, the geographic registration error was measured to be ±60 m during design, the algorithm error was assumed to be ±60 m, and the satellite attitude error was assumed to be ±120 m. The comprehensive error range was ±158.75 m, according to the above formula. The geographical coordinates of the wildfire were (135.34°E, 14.77°S), and the comprehensive error range was ±158.75 m; therefore, it could be expressed as (135.34°E, 14.77°S) ±158.75 m. The imaging positioning errors of the camera under different GSD conditions are shown in Table 6, assuming that the spatial resolution was improved; e r r G S D ,   e r r r e c t i f i c a t i o n ,   e r r a l g o r i t h m ,   e r r o r b i t were also assumed values.
To further assess the detection capacity of the uncooled infrared camera at the miniature fire point, a combustion detection experiment was conducted on the night of 18 October 2024, in the barren terrain of Acheng District, Harbin City, Heilongjiang Province, China. The test status is presented in Table 7. The test team reclaimed one sample plot, laid 190 kg of straw, and used flat ground ignition to simulate a real wildfire. They also took safety measures, cleaned up flammable materials around the ignition area, dug fire isolation ditches, and checked the effectiveness of fire-fighting devices, such as water pump pressure, transportation pipelines, and emergency communication devices.
In the thermal map of this fire point burning monitoring, there are several “hotspots” in the long wave image, including the fire point area (see Figure 11a). However, utilizing LWIR data alone is insufficient for the comprehensive identification and filtration of all types of anomalous hotspot information. By combining it with the MWIR data, it is possible to accurately identify the fire point at the 10 × 10 m level, which occupies only one pixel in the MWIR image (as shown in Figure 11b). This allows for the accurate detection of the fire point on small scales.
Based on this fire point experiment, the radiation energy received by the camera can be evaluated. Generally, the total Fire Radiative Power (FRP) is commonly utilized as a metric to assess the scale of wildfires [24]. The thermal emission from wildfires is predominantly localized within the flame zone [25]. The flame zone radiating outward from the ignition point typically displays a crown-like distribution across the entire wildfire area. The fire intensity within the flame zone is defined as follows:
F i = I r × D
where I r is the rate of heat release per unit area of the flame zone in k W / m 2 , and D is the horizontal depth of the crown fire with units of m .
During the specialized fire combustion test, a Fluke Ti450 infrared thermometer (Model: Fluke Ti450 from Fluke Test Instruments Co., Ltd., Shanghai, China) was utilized. This thermometer has a dynamic temperature range of −20 °C to 1200 °C. The measurement results revealed that the ignition temperature of the fire ranged between 700 °C and 800 °C. By applying the Stefan–Boltzmann law in terms of emissivity, we calculated the value of I r to be 23.2 k W / m ² . During the test, the fire area measuring 10 m × 10 m was accurately identified. Based on the size of the combustion area, the FRP was estimated to be approximately 2.32 MW.
At the same time, it can be observed that, compared to Figure 9a and Figure 9b–e, the visible light imaging system operated at shorter wavelengths and could provide high-resolution images during the day or under sufficient lighting conditions. The details are clear, resembling what the human eye sees, and the images are intuitive, making them easy to identify and analyze. This system is suitable for applications such as land cover identification, vegetation monitoring, and urban planning. However, the visible light imaging system heavily relies on sunlight. At night or under insufficient lighting conditions, the system cannot receive reflected visible light, leading to a significant decline in performance and difficulty in obtaining effective images. In the nighttime fire point combustion experiment shown in Figure 11, only the thermal infrared imaging system successfully captured ground information. Even with an increased exposure time, the visible light imaging system could not compensate for the severe decline in SNR. The multispectral infrared imaging system includes 3–5 μm (MWIR) and 8–12.5 μm (LWIR) bands. These bands are used to detect thermal radiation and reflection from different objects. When the light is sufficient during the day or at night, the infrared imaging system can work normally and can detect the thermal radiation information of the target, which is suitable for all-weather monitoring and the identification of targets with obvious temperature differences, such as fires and industrial heat sources. Infrared imaging systems are particularly suitable for night monitoring. However, due to the long wavelength, it usually cannot provide the same spatial resolution as the visible imaging system. In smoke, haze, or high-humidity environments, smoke scatters visible light, blocking the propagation of light, and resulting in blurred images, reduced contrast, and difficulty in distinguishing ground objects. The TIR band (especially 8–12.5 μm) has a strong ability to penetrate smoke and can obtain clearer images in environments with higher smoke concentrations (see Figure 9b). Sensitive to temperature differences, it can detect small temperature differences on the ground, especially in terms of heat-source detection, and can provide valuable information.
At 15:41 on 25 June 2024, the camera successfully detected multiple high-temperature heat sources in the oil fields of Basra Province, Iraq. By combining mid-wave infrared data, these heat sources were accurately identified (see Figure 12a). The heat sources were located at a flare stack in the Malha DS8 oil field. The precise identification of these high-temperature points demonstrated the camera’s capability for high-precision industrial heat source monitoring. Figure 12b shows the eruption of Mount Etna on the island of Sicily, Italy. Before the volcanic eruption, the camera had already detected a large area of abnormal hotspots in the region. The “hotspots” were clearly visible in the image data, indicating the camera’s exceptional ability to detect anomalous heat sources with high precision. Mount Etna is one of the most active volcanoes in Europe, and the detection of this eruption proved that the infrared camera can also play a significant role in disaster monitoring and early warning systems. Figure 12c displays the latest satellite remote sensing images of a wildfire that occurred on 11 January 2025, in California, USA. The wildfire burned near Eaton Canyon, east of Los Angeles, covering approximately 1266 pixels in the mid-wave infrared image, equivalent to an area of about 19 km2. This brush fire had been ongoing for nearly five days, and publicly reported estimates indicated that the burned area was at least 57 km2 [26], making it the largest fire captured by the camera to date.
The above wildfire cases occurred in regions with different geographical locations, timeframes, and climatic conditions, and the types of abnormal hotspots also varied in scale. These cases included the dry and hot areas of the Middle East, river valleys near estuaries, high-latitude wastelands at night, and mid-to-low-latitude mountain fires, covering diverse geographical environments and climatic conditions. These observations fully validated the camera’s detection capabilities under various complex conditions. The detected hotspot events are summarized in Table 8.
The uncooled camera has successfully detected the aforementioned hotspot cases. However, for smaller fire points or low-intensity fires such as embers, their thermal radiation signals are weaker. For instance, the temperature of these fire points is relatively low, typically below 300 °C, and may approach or fall below the camera’s NETD threshold, leading to detection difficulties and resulting in missed or false alarms. For smaller fires, such as those with an area of less than 10 m2, the camera’s spatial resolution may be insufficient to accurately identify them. Additionally, the weak thermal radiation signals from small-scale fires can easily be masked by the surrounding background noise. Low spatial resolution may also lead to inaccurate fire point localization. In areas with high smoke coverage, the transmittance of smoke in the MWIR (3–5 μm) and LWIR (8–12.5 μm) bands is low. Smoke absorbs and scatters infrared radiation, causing the fire signal to weaken and significantly reducing the camera’s detection range and performance. Therefore, appropriately improving the camera’s spatial resolution to enhance its ability to detect small-scale fires, optimizing the camera’s NETD performance to improve its capability to detect low-temperature targets, and developing smoke-resistant algorithms through the fusion of spectral data from different bands are highly significant measures.

5. Discussion

5.1. Camera Performance

This study highlights the challenges in developing a lightweight, compact, and high-performance spaceborne multispectral infrared remote sensing camera based on uncooled infrared devices for wildfire monitoring. Uncooled infrared detectors exhibit relatively low thermal responsiveness and elevated noise levels, which collectively diminish the system’s wildfire detection sensitivity. These limitations directly impair the camera’s capability to identify wildfire targets.
To address these challenges, we proposed a precision temperature control technology specifically designed for uncooled TIR imaging systems. This technology maintains the uncooled infrared detector’s operational temperature, structural configuration, and optical path within strictly defined parameters. Our results demonstrated that this approach effectively mitigated the temperature fluctuations caused by material properties, device noise, and signal drift (as shown in Figure 6), thereby reducing system noise (refer to Table 3) and ensuring data acquisition accuracy and reliability. In practical applications, we implemented an accurate temperature control strategy based on equilibrium temperature points during orbital imaging operations. Furthermore, the existing research has established that Time-Delay Integration (TDI) technology can enhance system sensitivity [27]. By employing a spatiotemporal stacking image processing method derived from this technology (see Figure 2d), we significantly improved the TIR imaging system’s sensitivity, representing a major technological advancement in lightweight, multispectral, uncooled infrared cameras for space applications.
Table A1 summarizes the performance specifications of primary satellite-based infrared instruments, both domestic and international, which utilize photon-cooled infrared systems for wildfire monitoring. The comparative analysis reveals fundamental performance metrics, including power consumption, weight, swath width, spatial resolution, and sensitivity. Our study has achieved progress in uncooled infrared instrumentation, attaining sensitivity levels below 0.2 K in both LWIR and MWIR bands (refer to Table 4), surpassing the TIR instrument sensitivity of HJ-2A/B and FY3-G systems. Regarding weight and power consumption, our camera demonstrates superior performance compared to advanced instruments, including HJ-2A/B, Landsat 9, and FY3-G. While a higher spatial resolution has been demonstrated to enhance the detection of small-scale fire spots [28], our TIR imaging system’s 120 m GSD remains inferior to HJ-2A/B satellite infrared instruments. Improving spatial resolution would additionally reduce fire spot localization errors. According to Table 6, a high spatial resolution, such as 15 m, has a significant advantage in the designation of fire location and scope for fire monitoring and emergency response and provides a reliable spatial reference. However, increasing spatial resolution typically compromises swath width and global coverage capability [29], necessitating future design optimizations to balance spatial resolution with temporal resolution in remote sensing imaging systems.

5.2. Some Issues for Wildfire Detection

In this study, we used the camera to detect smaller-scale fire hotspots (as demonstrated in Figure 11). By comparison, the minimum FRP detected by MODIS during wildfires was approximately 20 MW [30]. The wildfire FRP identified in our mission was only about one-ninth of the minimum value recorded by MODIS, indicating the camera’s superior capability in detecting weak and small targets.
However, the lack of quantitative detection capabilities for heat sources in a vacuum environment is a limitation of this camera. Current spaceborne cooled infrared cameras are primarily categorized as quantitative instruments. Quantitative remote sensing missions require rigorous radiometric calibration to ensure that the sensor’s output signals can be accurately converted into physical quantities, such as temperature or radiative intensity. These instruments were specifically designed to provide high-quality and precise remote sensing data, such as surface temperature, radiation, and climate change monitoring. To achieve this goal, cameras must be equipped with high-quality detectors and cooling systems to stabilize their thermal response and ensure measurement accuracy, especially considering the long-term stability required in the space environment.
As qualitative detection instruments, uncooled infrared cameras are typically employed to capture infrared images and rely on the contrast of infrared images and relative temperature differences between regions for the real-time monitoring of targets. Cooled infrared cameras are usually equipped with more sophisticated radiometric calibration systems to provide accurate temperature inversion data. In contrast, our uncooled infrared camera lacks such a high-precision calibration system and does not possess high-accuracy radiometric quantification capabilities, making it unsuitable for precise quantitative remote sensing missions. Previous studies have explored the long-term calibration of uncooled infrared instruments under terrestrial conditions [31,32]. However, accuracy was difficult to ensure due to the severe temperature drift characteristic of uncooled infrared devices. Our test results (as presented in Table 3) have demonstrated that an effective temperature control method can ensure the stability of the uncooled TIR system’s response, enhancing the quantitative temperature detection capability of TIR imaging systems. This study provides a novel solution for advancing effective quantitative remote sensing applications, which will be a key focus area of our future research.

5.3. The Long-Term Challenge for This Camera

In the space environment, typical factors affecting uncooled infrared detectors include radiation effects, significant temperature variations, and long-term signal drift. In this study, an uncooled infrared camera was installed inside a satellite cabin (as shown in Figure 5a). While the external satellite temperature may fluctuate between 100 °C and +100 °C or become even higher due to the day–night cycle, the internal cabin temperature remains relatively stable, ranging from +10 °C to +15 °C with slow variations. This stability prevents thermal fatigue effects on the uncooled infrared detector. Furthermore, the infrared detector within the camera was equipped with precise thermal control measures, effectively mitigating signal drift and maintaining a stable response. Regarding radiation effects, the space environment is filled with high-energy particle radiation, including energetic protons, electrons, and heavy ions from solar wind, Earth’s radiation belts, and cosmic rays [33]. Such radiation may lead to detector material degradation, increased dark current and noise, and pixel damage, which manifests in remote sensing images as discontinuous defective pixels. However, since the camera is primarily designed for qualitative wildfire detection, only a subset of detector pixels needs to respond to the presence of wildfires. Therefore, the impact of radiation-induced damage remains manageable. Additionally, appropriate image processing algorithms can be applied in postprocessing to correct and restore remote-sensing images.

6. Conclusions

In this study, a lightweight, compact, and high-sensitivity multispectral infrared camera for wildfire monitoring was successfully developed using a VOx uncooled infrared detector. The camera operates without requiring cooling equipment, significantly reducing both energy consumption and system complexity. Consequently, it achieves lower overall costs, simplified operations, and meets the requirements for miniaturization and portability. Through precision temperature control and spatiotemporal accumulation methods, the camera achieved sensitivities below 0.2 K in both mid-wave and long-wave infrared bands, reaching performance levels comparable to the existing cooled infrared cameras and overcoming the challenge of low sensitivity. The TIR band provides a resolution of 120 m, enhancing fire detection accuracy. This capability is particularly well-suited to meet the practical requirements of wildfire monitoring in remote sensing applications.
In the future, the synergistic optimization of spatial resolution and swath width will be a key focus of research. By advancing optical system design, efforts will be made to enhance GSD to 60 m or better while maintaining the advantages of the existing swath widths. This advancement will significantly improve the early detection of small-scale fire points and enhance fire localization accuracy, thereby providing more precise support for high-resolution disaster assessments and emergency responses. Furthermore, future research should prioritize the transition from qualitative to quantitative detection capabilities, enabling the camera to support quantitative remote sensing applications. This includes tasks such as weather forecasting, land surface temperature inversion, and sea surface temperature monitoring. Such advancements will provide more accurate data for climate monitoring and environmental management, further driving innovation and practical applications in remote sensing technology.

Author Contributions

Conceptualization, F.D. and G.T.; methodology, F.D.; software, G.T., T.Z. and W.W.; validation, F.D. and J.M.; formal analysis, C.L.; resources, T.Z., D.L. and B.Z.; data curation, F.D. and X.L.; writing—original draft preparation, F.D. and B.Z.; visualization, F.D. and W.W.; supervision, F.D.; project administration, C.L. and J.W.; funding acquisition, C.L. All authors have read and agreed to the published version of the manuscript.

Funding

This study was funded by 1. The Basic Research Program of Zhejiang Provincial Department of Science and Technology (Grant No. 2023C03012). 2. The Spearhead Research Program of Zhejiang Provincial Department of Science and Technology (Grant No. 2024C03032).

Data Availability Statement

The data that support the findings of this study are available from the corresponding author.

Conflicts of Interest

The authors declare no conflicts of interest.

Appendix A

Table A1. Typical infrared observation instruments on major Earth-observing satellites.
SatellitesTerraAquaNPPSentinel-3BHJ-2A/BLandsat 9FY3-G
InstrumentMODISMODISVIIRSSLSTRTIRSTIRS-2MERSI-RM
Launch year1999.122002.052011.102018.042020.092021.092023.04
Wavelength
(μm)
3.6–4.0
8.4–14.3
3.6–4.0
8.4–14.3
3.66–3.84
3.973–4.128
8.4–8.7
10.263–11.263
11.538–12.488
3.55–3.93
10.4–11.3
11.5–12.5
3.5–3.9
10.5–11.5
11.5–12.5
10.6–11.19
11.5–12.51
3.71–3.89
10.3–11.3
11.5–12.5
NETD0.25 K@300 K0.25 K@300 K0.302 K@380 K (MWIR)
0.052 K@300 K (LWIR)
0.1 K@300 K0.5 K@400 K (MWIR) 0.42 K@300 K (LWIR)0.08 K@300 K0.25 K@400 K (MWIR)
0.1 K@300 K (LWIR)
Swath
(km)
23302330300014007201851000
Spatial resolution
(m)
10001000375/750100048/96100500
Max weight
(kg)
>200>200200>150142225100
Max power
(W)
>150>150240>15050200100
Detector typeCooledCooledCooledCooledCooledCooledCooled

References

  1. Andreae, M.O. Emission of Trace Gases and Aerosols from Biomass Burning—An Updated Assessment. Atmos. Chem. Phys. 2019, 19, 8523–8546. [Google Scholar] [CrossRef]
  2. van der Werf, G.R.; Randerson, J.T.; Giglio, L.; van Leeuwen, T.T.; Chen, Y.; Rogers, B.M.; Mu, M.; van Marle, M.J.E.; Morton, D.C.; Collatz, G.J.; et al. Global Fire Emissions Estimates during 1997–2016. Earth Syst. Sci. Data 2017, 9, 697–720. [Google Scholar] [CrossRef]
  3. Zhou, S. Advanced Infrared Photoelectric Engineering: An Introduction, 1st ed.; Science Press: Beijing, China, 2014; pp. 71–90. [Google Scholar]
  4. Allison, R.S.; Johnston, J.M.; Craig, G.; Jennings, S. Airborne Optical and Thermal Remote Sensing for Wildfire Detection and Monitoring. Sensors 2016, 16, 1310. [Google Scholar] [CrossRef]
  5. Thornberry, T.D.; Gao, R.-S.; Ciciora, S.J.; Watts, L.A.; McLaughlin, R.J.; Leonardi, A.; Rosenlof, K.H.; Argrow, B.M.; Elston, J.S.; Stachura, M.; et al. A Lightweight Remote Sensing Payload for Wildfire Detection and Fire Radiative Power Measurements. Sensors 2023, 23, 3514. [Google Scholar] [CrossRef] [PubMed]
  6. Visible Infrared Imaging Radiometer Suite (VIIRS)—LAADS DAAC. Available online: https://ladsweb.modaps.eosdis.nasa.gov/missions-and-measurements/viirs/ (accessed on 15 February 2025).
  7. Barnes, W.; Xiong, X.; Salomonson, V. Status of Terra MODIS and Aqua MODIS. In Proceedings of the IGARSS 2002: IEEE International Geoscience and Remote Sensing Symposium and 24th Canadian Symposium on Remote Sensing, Vols I-VI, Proceedings: Remote Sensing: Integrating Our View of the Planet, Toronto, ON, Canada, 24–28 June 2002; pp. 970–972. [Google Scholar]
  8. Oliva, P.; Schroeder, W. Assessment of VIIRS 375 m Active Fire Detection Product for Direct Burned Area Mapping. Remote Sens. Environ. 2015, 160, 144–155. [Google Scholar] [CrossRef]
  9. Schueler, C.; Clement, J.; Miller, S.; Kealy, P.; Ardanuy, P.; Cota, S.; DeLuccia, F.; Haas, J.; Mango, S.; Speidel, C.; et al. NPOESS VIIRS: Next Generation Polar-Orbiting Atmospheric Imager. Opt. Remote Sens. Atmos. Clouds III 2003, 4891, 50–64. [Google Scholar]
  10. Lee, T.; Miller, S.; Schueler, C.; Hawkins, J.; Turk, F.; Richardson, K.; Kent, J. NPOESS VIIRS: Dramatically Improved Operational Capability. Appl. Weather. Satell. II 2005, 5658, 1–10. [Google Scholar]
  11. Csiszar, I.; Schroeder, W.; Giglio, L.; Ellicott, E.; Vadrevu, K.P.; Justice, C.O.; Wind, B. Active Fires from the Suomi NPP Visible Infrared Imaging Radiometer Suite: Product Status and First Evaluation Results. J. Geophys. Res.-Atmos. 2014, 119, 803–816. [Google Scholar] [CrossRef]
  12. Fukuhara, T.; Kouyama, T.; Kato, S.; Nakamura, R.; Takahashi, Y.; Akiyama, H. Detection of Small Wildfire by Thermal Infrared Camera With the Uncooled Microbolometer Array for 50-Kg Class Satellite. IEEE Trans. Geosci. Remote Sens. 2017, 55, 4314–4324. [Google Scholar] [CrossRef]
  13. Coppo, P.; Mastrandrea, C.; Stagi, M.; Calamai, L.; Nieke, J. Sea and Land Surface Temperature Radiometer Detection Assembly Design and Performance. J. Appl. Remote Sens. 2014, 8, 084979. [Google Scholar] [CrossRef]
  14. Ramaseri Chandra, S.N.; Christopherson, J.B.; Casey, K.A.; Lawson, J.; Sampath, A. 2022 Joint Agency Commercial Imagery Evaluation—Remote Sensing Satellite Compendium; Circular: Reston, VA, USA, 2022; p. 298. [Google Scholar]
  15. HJ-2A/B Successfully Acquires First Batch of Images: Two Payloads from Shanghai Institute of Technical Physics Make New Contributions to China’s Environmental and Disaster Monitoring—Shanghai Institute of Technical Physics, Chinese Academy of Sciences. Available online: http://www.sitp.cas.cn/xwzx/kydt/202011/t20201110_5742938.html (accessed on 10 February 2025).
  16. Details for Instrument IRMSS-2 (HJ). Available online: https://space.oscar.wmo.int/instruments/view/irmss_2_hj (accessed on 10 February 2025).
  17. Masek, J.G.; Wulder, M.A.; Markham, B.; McCorkel, J.; Crawford, C.J.; Storey, J.; Jenstrom, D.T. Landsat 9: Empowering Open Science and Applications through Continuity. Remote Sens. Environ. 2020, 248, 111968. [Google Scholar] [CrossRef]
  18. Montanaro, M.; McCorkel, J.; Tveekrem, J.; Stauder, J.; Mentzell, E.; Lunsford, A.; Hair, J.; Reuter, D. Landsat 9 Thermal Infrared Sensor 2 (TIRS-2) Stray Light Mitigation and Assessment. IEEE Trans. Geosci. Remote Sens. 2022, 60, 5002408. [Google Scholar] [CrossRef]
  19. Introduction to MERSI-RM Instrument. Available online: https://www.nsmc.org.cn/nsmc/cn/instrument/MERSI-RM.html (accessed on 8 February 2025).
  20. Kimata, M. Uncooled Infrared Focal Plane Arrays. IEEJ Trans. Electr. Electron. Eng. 2018, 13, 4–12. [Google Scholar] [CrossRef]
  21. Xie, X.L.; Zhu, X.X.; Zhu, J.C.; Shen, W.M. Analysis and Suppression of Stray Radiation in Uncooled Thermal Infrared Imaging Spectrometer. ACTA Opt. Sin. 2022, 42, 104–110. [Google Scholar]
  22. On-Orbit Verification Successful! A Non-Cooled Infrared Imaging System Co-Developed by Hangzhou Institute for Advanced Study Demonstrates World-Leading Comprehensive Performance. Available online: https://mp.weixin.qq.com/s/_ASP6bQUrQ15QnHGMiL-hQ?from=singlemessage&scene=1&subscene=10000&clicktime=1719279106&enterid=1719279106&sessionid=0&ascene=1&fasttmpl_type=0&fasttmpl_fullversion=7261029-zh_CN-zip&fasttmpl_flag=0&realreporttime=1719279106041 (accessed on 22 June 2024).
  23. Wang, J.; Wang, Y.; Li, C. Noise model of hyperspectral imaging system and influence on radiation sensitivity. J. Remote Sens. 2010, 14, 607–620. [Google Scholar]
  24. Roberts, G.; Wooster, M.; Perry, G.; Drake, N.; Rebelo, L.; Dipotso, F. Retrieval of Biomass Combustion Rates and Totals from Fire Radiative Power Observations: Application to Southern Africa Using Geostationary SEVIRI Imagery. J. Geophys. Res.-Atmos. 2005, 110. [Google Scholar] [CrossRef]
  25. Maffei, C.; Menenti, M. Predicting Forest Fires Burned Area and Rate of Spread from Pre-Fire Multispectral Satellite Measurements. ISPRS J. Photogramm. Remote Sens. 2019, 158, 263–278. [Google Scholar] [CrossRef]
  26. Title Death Toll of Los Angeles Wildfires Rises to 16, California Deploys More Resources for Rescue_News Channel_CCTV.com. Available online: https://news.cctv.com/2025/01/12/ARTIHYubv4eV1pw6BMaxEZiK250112.shtml (accessed on 12 January 2025).
  27. Oloomi, H.M.; Alam, M.S.; Rana, M.M. Noise Performance Evaluation of Uncooled Infrared Detectors (June 2009). IEEE Sens. J. 2011, 11, 971–987. [Google Scholar] [CrossRef]
  28. Zheng, W.; Chen, J.; Liu, C.; Shan, T.; Yan, H. Study of the Application of FY-3D/MERSI-II Far-Infrared Data in Wildfire Monitoring. Remote Sens. 2023, 15, 4228. [Google Scholar] [CrossRef]
  29. Chen, X.; Liu, L.; Li, J.; Ou, W.; Zhang, Y. Applications and Research Progress in Satellite Remote Sensing for Fire Detection. Remote Sens. 2020, 24, 531–542. [Google Scholar]
  30. Peterson, D.; Wang, J.; Ichoku, C.; Hyer, E.; Ambrosia, V. A Sub-Pixel-Based Calculation of Fire Radiative Power from MODIS Observations: 1 Algorithm Development and Initial Assessment. Remote Sens. Environ. 2013, 129, 262–279. [Google Scholar] [CrossRef]
  31. Wang, Z.; Zhou, J.; Ma, J.; Wang, Y.; Liu, S.; Ding, L.; Tang, W.; Pakezhamu, N.; Meng, L. Removing Temperature Drift and Temporal Variation in Thermal Infrared Images of a UAV Uncooled Thermal Infrared Imager. ISPRS J. Photogramm. Remote Sens. 2023, 203, 392–411. [Google Scholar] [CrossRef]
  32. Aragon, B.; Johansen, K.; Parkes, S.; Malbeteau, Y.; Al-Mashharawi, S.; Al-Amoudi, T.; Andrade, C.F.; Turner, D.; Lucieer, A.; McCabe, M.F. A Calibration Procedure for Field and UAV-Based Uncooled Thermal Infrared Instruments. Sensors 2020, 20, 3316. [Google Scholar] [CrossRef]
  33. Vampola, A. The Hazardous Space Particle Environment. IEEE Trans. Plasma Sci. 2000, 28, 1831–1839. [Google Scholar] [CrossRef]
Figure 1. Radiometric model of the TIR imaging system.
Remotesensing 17 01387 g001
Figure 2. Schematic diagram of multispectral infrared camera imaging modes. (a) VIS imaging system, (b) Mosaic of VIS images, (c) TIR imaging system, and (d) Mosaic of TIR images from four spectral bands.
Remotesensing 17 01387 g002
Figure 3. Temperature control methods for TIR imaging system. (a) Schematic diagram of active heaters and temperature measurement point for uncooled infrared detector case. (b) Schematic diagram of active heaters and temperature measurement point for the infrared optical lens barrel.
Remotesensing 17 01387 g003
Figure 4. Block diagram of the multispectral uncooled infrared camera and connection with the satellite platform.
Remotesensing 17 01387 g004
Figure 5. Camera appearance and components: (a) camera mounted on a 50 kg-class small satellite, (b) camera exterior with a thermal insulation layer on the outer envelope, (c) TIR optical system, (d) VIS optical system, (e) uncooled infrared detector, and (f) VIS detector.
Remotesensing 17 01387 g005
Figure 6. The radiation response–temperature change graph when using the accurate temperature control technique for the TIR imaging system. (a) Non-temperature controlled, and (b) temperature controlled.
Remotesensing 17 01387 g006
Figure 7. NETD testing for four TIR bands. (a) Two blackbodies and the camera. (b) Thermal response heatmaps for four infrared bands with the accumulation steps of 10. (c) Blackbody response curves for four infrared bands with the accumulation steps of 10.
Remotesensing 17 01387 g007
Figure 8. Normalized NETD trends for different accumulation steps.
Remotesensing 17 01387 g008
Figure 9. Wildfire remote sensing images captured by the camera. (a) Wildfire remote sensing image in the visible light band. (b) Wildfire remote sensing image in the 8.0–12.5 μm band. (c) Wildfire remote sensing image in the 3.0–5.0 μm band. (d) Wildfire remote sensing image in the 11.5–12.5 μm band. (e) Wildfire remote sensing image in the 10.5–11.5 μm band.
Remotesensing 17 01387 g009
Figure 10. Wildfire remote sensing images captured by another camera. (a) MODIS remote sensing image of the wildfire, and (b) VIIRS remote sensing image of the wildfire.
Remotesensing 17 01387 g010
Figure 11. The heatmaps of fire spot remote sensing images from two TIR bands of the camera. (a) The heatmap for fire spot detection in the 8.0–12.5 μm band. (b) The heatmap for fire spot detection in the 3.0–5.0 μm band.
Remotesensing 17 01387 g011
Figure 12. Different detection cases of a thermal infrared imaging system: (a) oil well flare stack, (b) volcano, and (c) wildfire.
Remotesensing 17 01387 g012
Table 1. Specification of the multispectral uncooled infrared camera.
ParameterValue
Imaging modePush-broom Imaging
WavelengthVisible band: 400–700 nm
Band 1: 8.0–12.5 μm
Band 2: 3.0–5.0 μm
Band 3: 11.5–12.5 μm
Band 4: 10.5–11.5 μm
F-numberVIS imaging system: 2.5
TIR imaging system: 1.0
NETDBand 1: 0.02 K@300 K
Band 2: 0.12 K@400 K
Band 3: 0.15 K@300 K
Band 4: 0.18 K@300 K
Modulation Transfer Function≥0.15
Spatial resolutionVIS band: 60 m@500 km
TIR bands: 120 m@500 km
Swath150 km@500 km
Field of View (FOV)VIS imaging system: 12.68° × 8.0°
TIR imaging system: 17.1° × 13.8°
Operational temperature range5–25 °C
Imaging frame rateVIS band: 10 Hz
TIR bands: 21.11 Hz
Approximate power consumptionStandby Mode: 3.5 W
Preparation Mode: 14 W
Imaging Mode: 10 W
Instrument weight1.33 kg
Dimension85 mm × 100 mm × 171 mm
Table 2. Specification of the TIR detector and VIS detector.
ParameterTIR DetectorVIS Detector
SensorVOx uncooled microbolometer1/1.2″CMOS
Wavelength3–14 μm400–700 nm
Pixel size12 μm5.86 μm
Active pixels1280 × 10241920 × 1200
NETD or SNR<50 mK@300 K>38 dB
Thermal time constant<10 ms/
Frame rate30 Hz30 Hz
Quantization14 bits8/10/12 bits
Dimension41 mm × 31.5 mm × 8.31 mm29 mm × 29 mm × 42 mm
Weight≤50 g88 g
Table 3. Noise with temperature control measures and without temperature control measures.
ConditionOptical Lens Barrel TemperatureDetector Case TemperatureFPA TemperatureSystem
Noise
T /K σ
No precision temperature control0.030.060.0622.07
Precision temperature control0.010.010.015.62
Lifting ratio2.855.054.153.92
Table 4. Effect of spatiotemporal stacking method on NETD.
Accumulation Steps15101520
NETD (mK)
Band1 8.0–12.5 μm
@300 K
62 30 21 18 16
Band2 3.0–5.0 μm
@400 K
371 165 121 102 91
Band3 11.5–12.5 μm
@300 K
462 197 151 119 110
Band4 10.5–11.5 μm
@300 K
533 273 183 144 126
Table 5. NETD evaluation results of uncooled TIR imaging system under different fire intensities.
Wildfire
Temperature (°C)
NETD (mK)
8–12.5 μm3–5 μm11.5–12.5 μm10.5–11.5 μm
2005.372.538.146.2
4001.825.113.216.0
6000.811.66.17.4
8000.46.23.34.0
10000.23.72.02.4
Table 6. Error estimation of fire point position at different GSD.
G S D
(m)
e r r G S D
(m)
e r r r e c t i f i c a t i o n
(m)
e r r a l g o r i t h m
(m)
e r r o r b i t
(m)
e r r c a m e r a
(m)
120±60±60±60±120±158.75
60±30±30±30±60±79.37
30±15±15±15±30±39.69
15±7.5±7.5±7.5±15±19.84
Table 7. Fire point combustion test status.
ParameterCondition
TimeSatellite pass: 21:38:04–21:38:22
Burning area10 m × 10 m
Effective area100 m2
Location127.21°E, 45.61°N
Elevation250.43 m
CombustiblesCorn straw
Table 8. Location of hotspots acquired in our camera observation.
Radiation SourceName of SitesLocation
WildfireLeman Bay, Australia135.34°E, 14.77°S
Oil well flare stackBasra Province, Iraq47.56°E, 30.23°N
VolcanoMount Etna, Italy15.00°E, 37.75°N
Fire pointHarbin City, China127.21°E, 45.61°N
WildfireEaton Canyon, USA118.13°W, 34.17°N
Disclaimer/Publisher’s Note: The statements, opinions and data contained in all publications are solely those of the individual author(s) and contributor(s) and not of MDPI and/or the editor(s). MDPI and/or the editor(s) disclaim responsibility for any injury to people or property resulting from any ideas, methods, instructions or products referred to in the content.

