
Satellite-Observed Arid Vegetation Greening and Terrestrial Water Storage Decline in the Hexi Corridor, Northwest China


Abstract
1. Introduction
2. Data
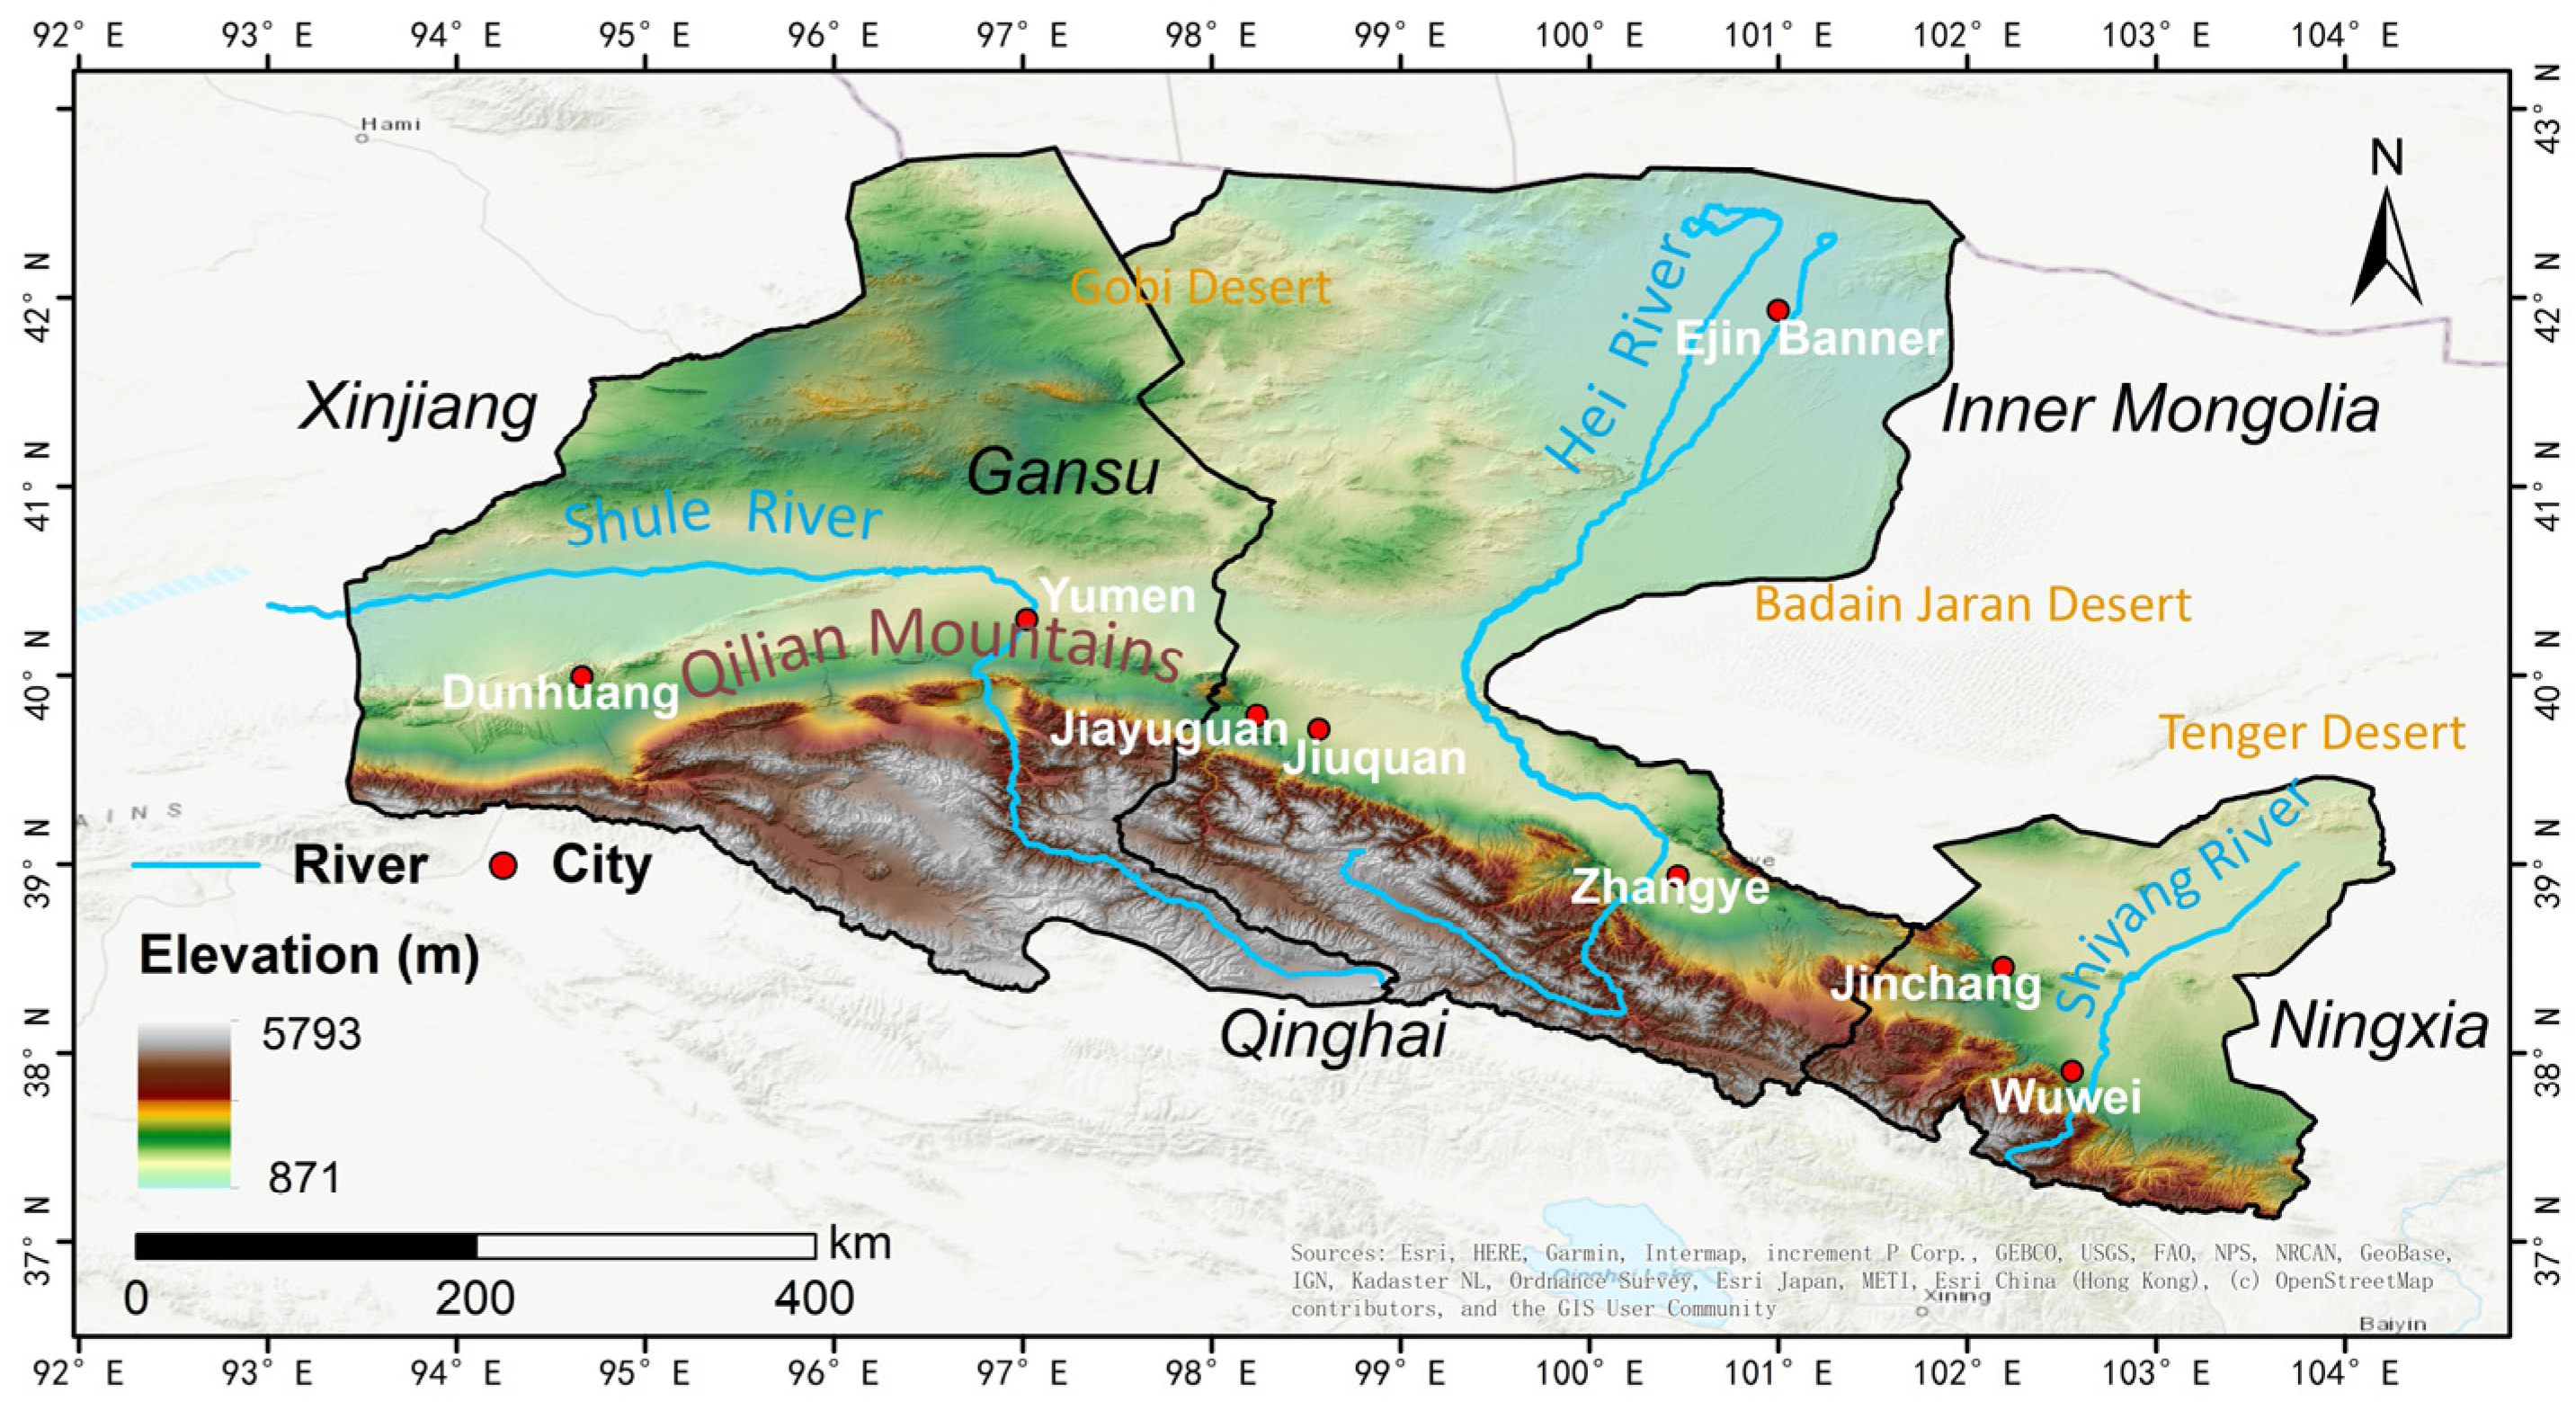
2.1. Study Area
2.2. GRACE/GRACE-FO TWSA Data
2.3. MODIS EVI Data
2.4. Land Cover Data
2.5. GPM Precipitation Data
2.6. Air Temperature Data
3. Methodology
3.1. Spatiotemporal Trends of TWSAs and Environmental Variables
3.2. Attribution Analysis of TWSA Changes
4. Results
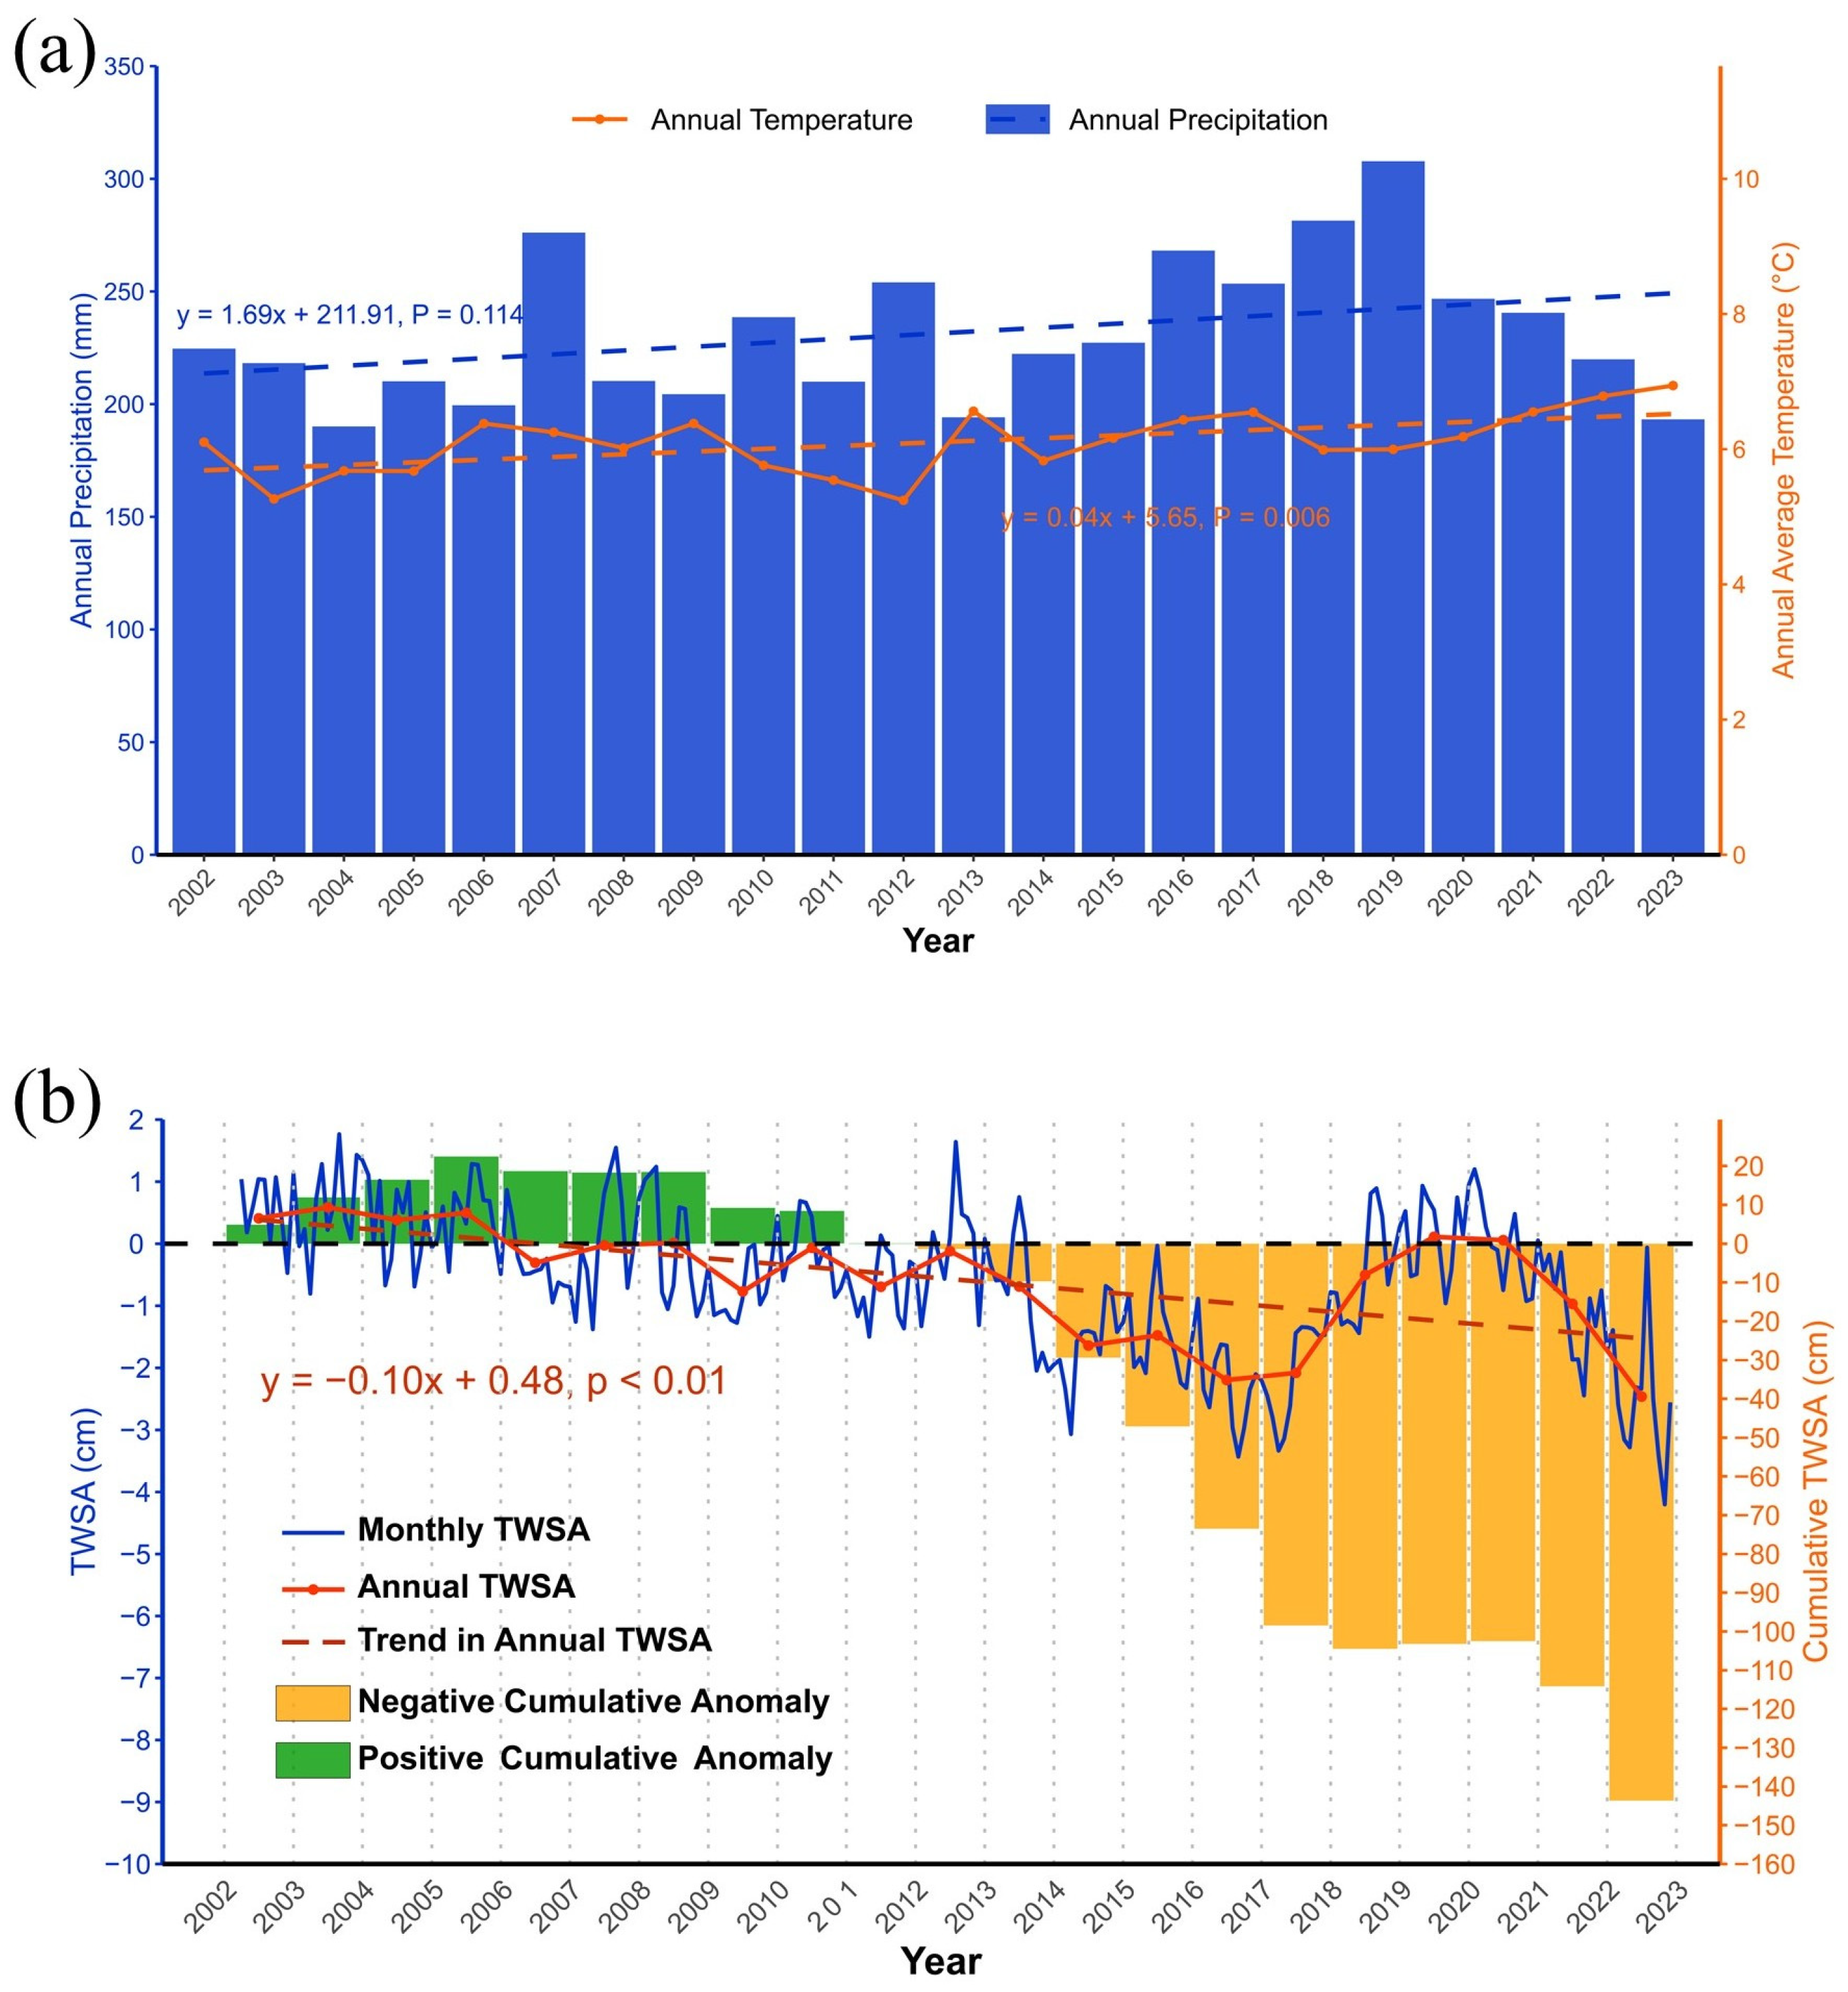
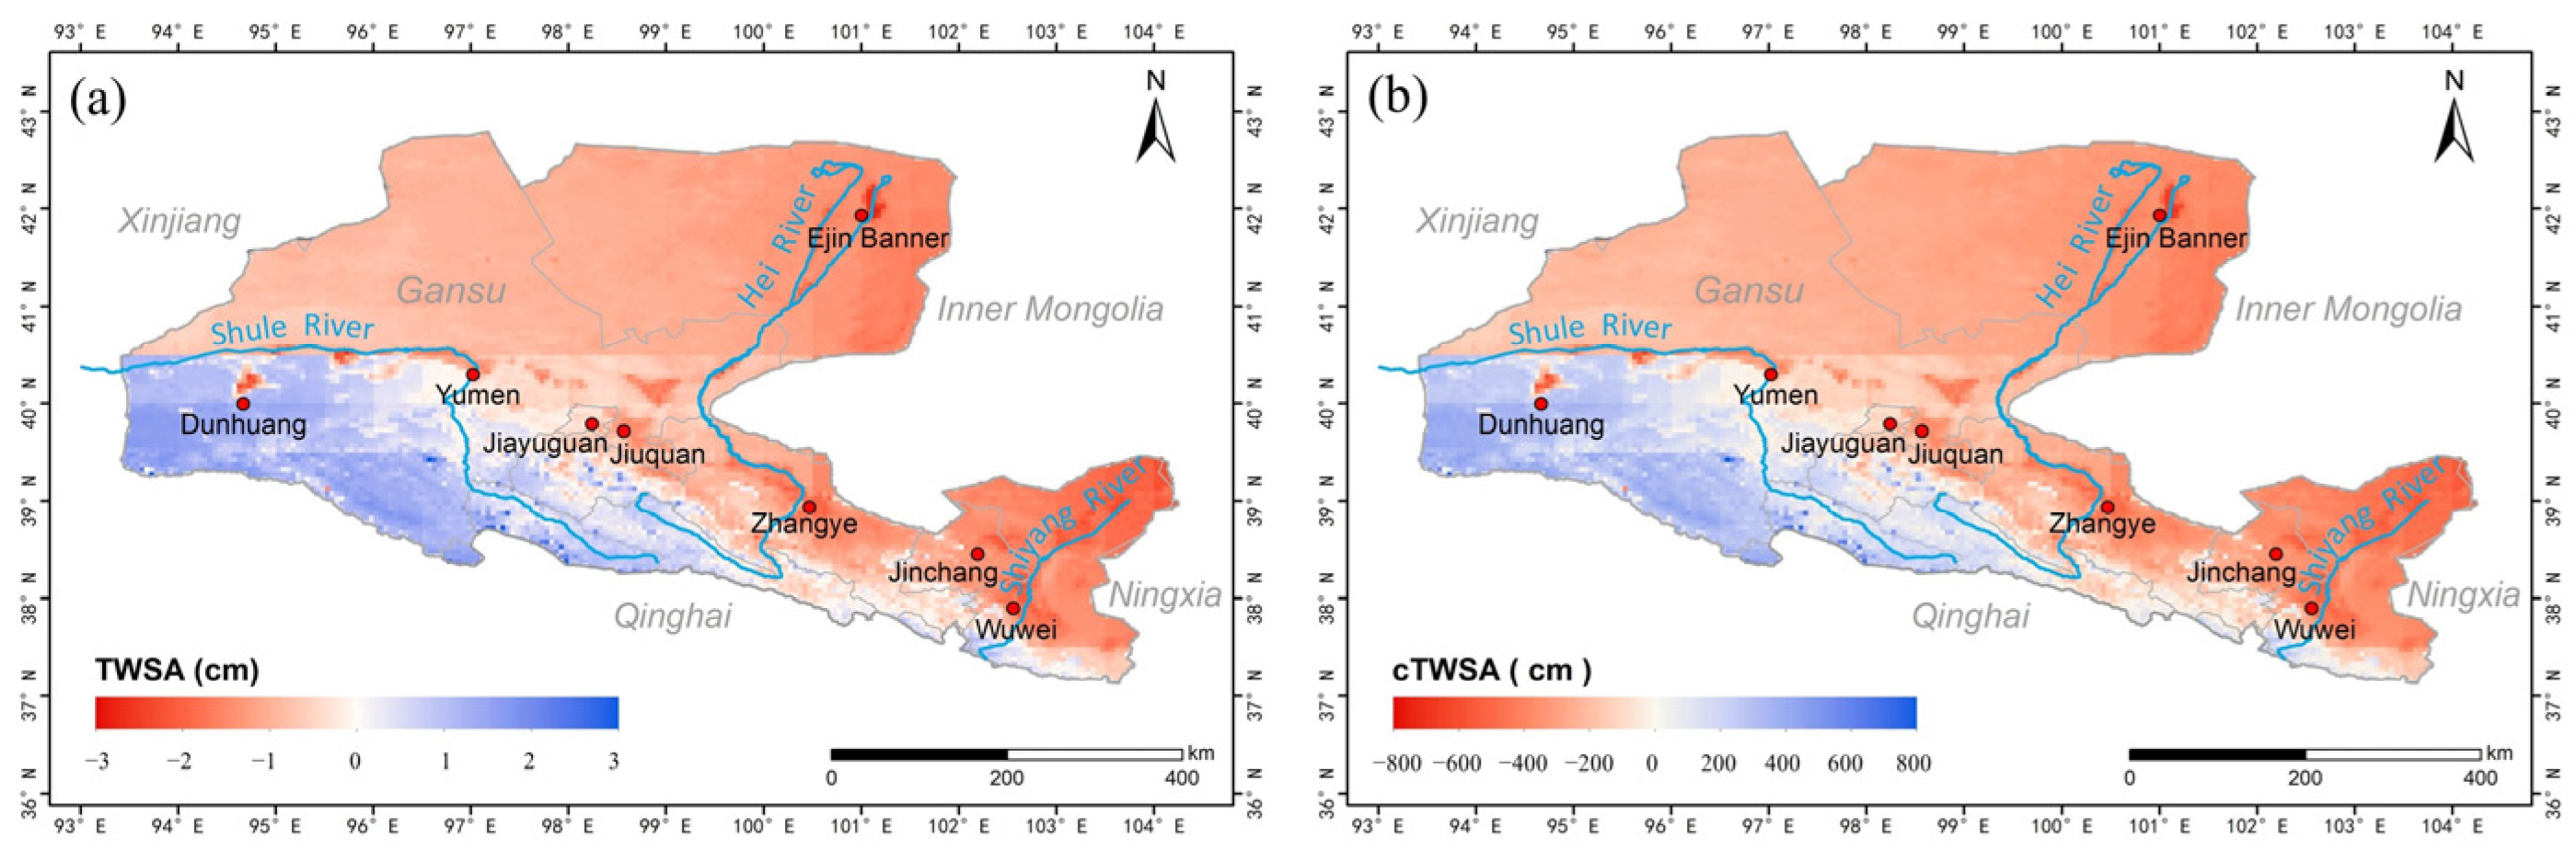
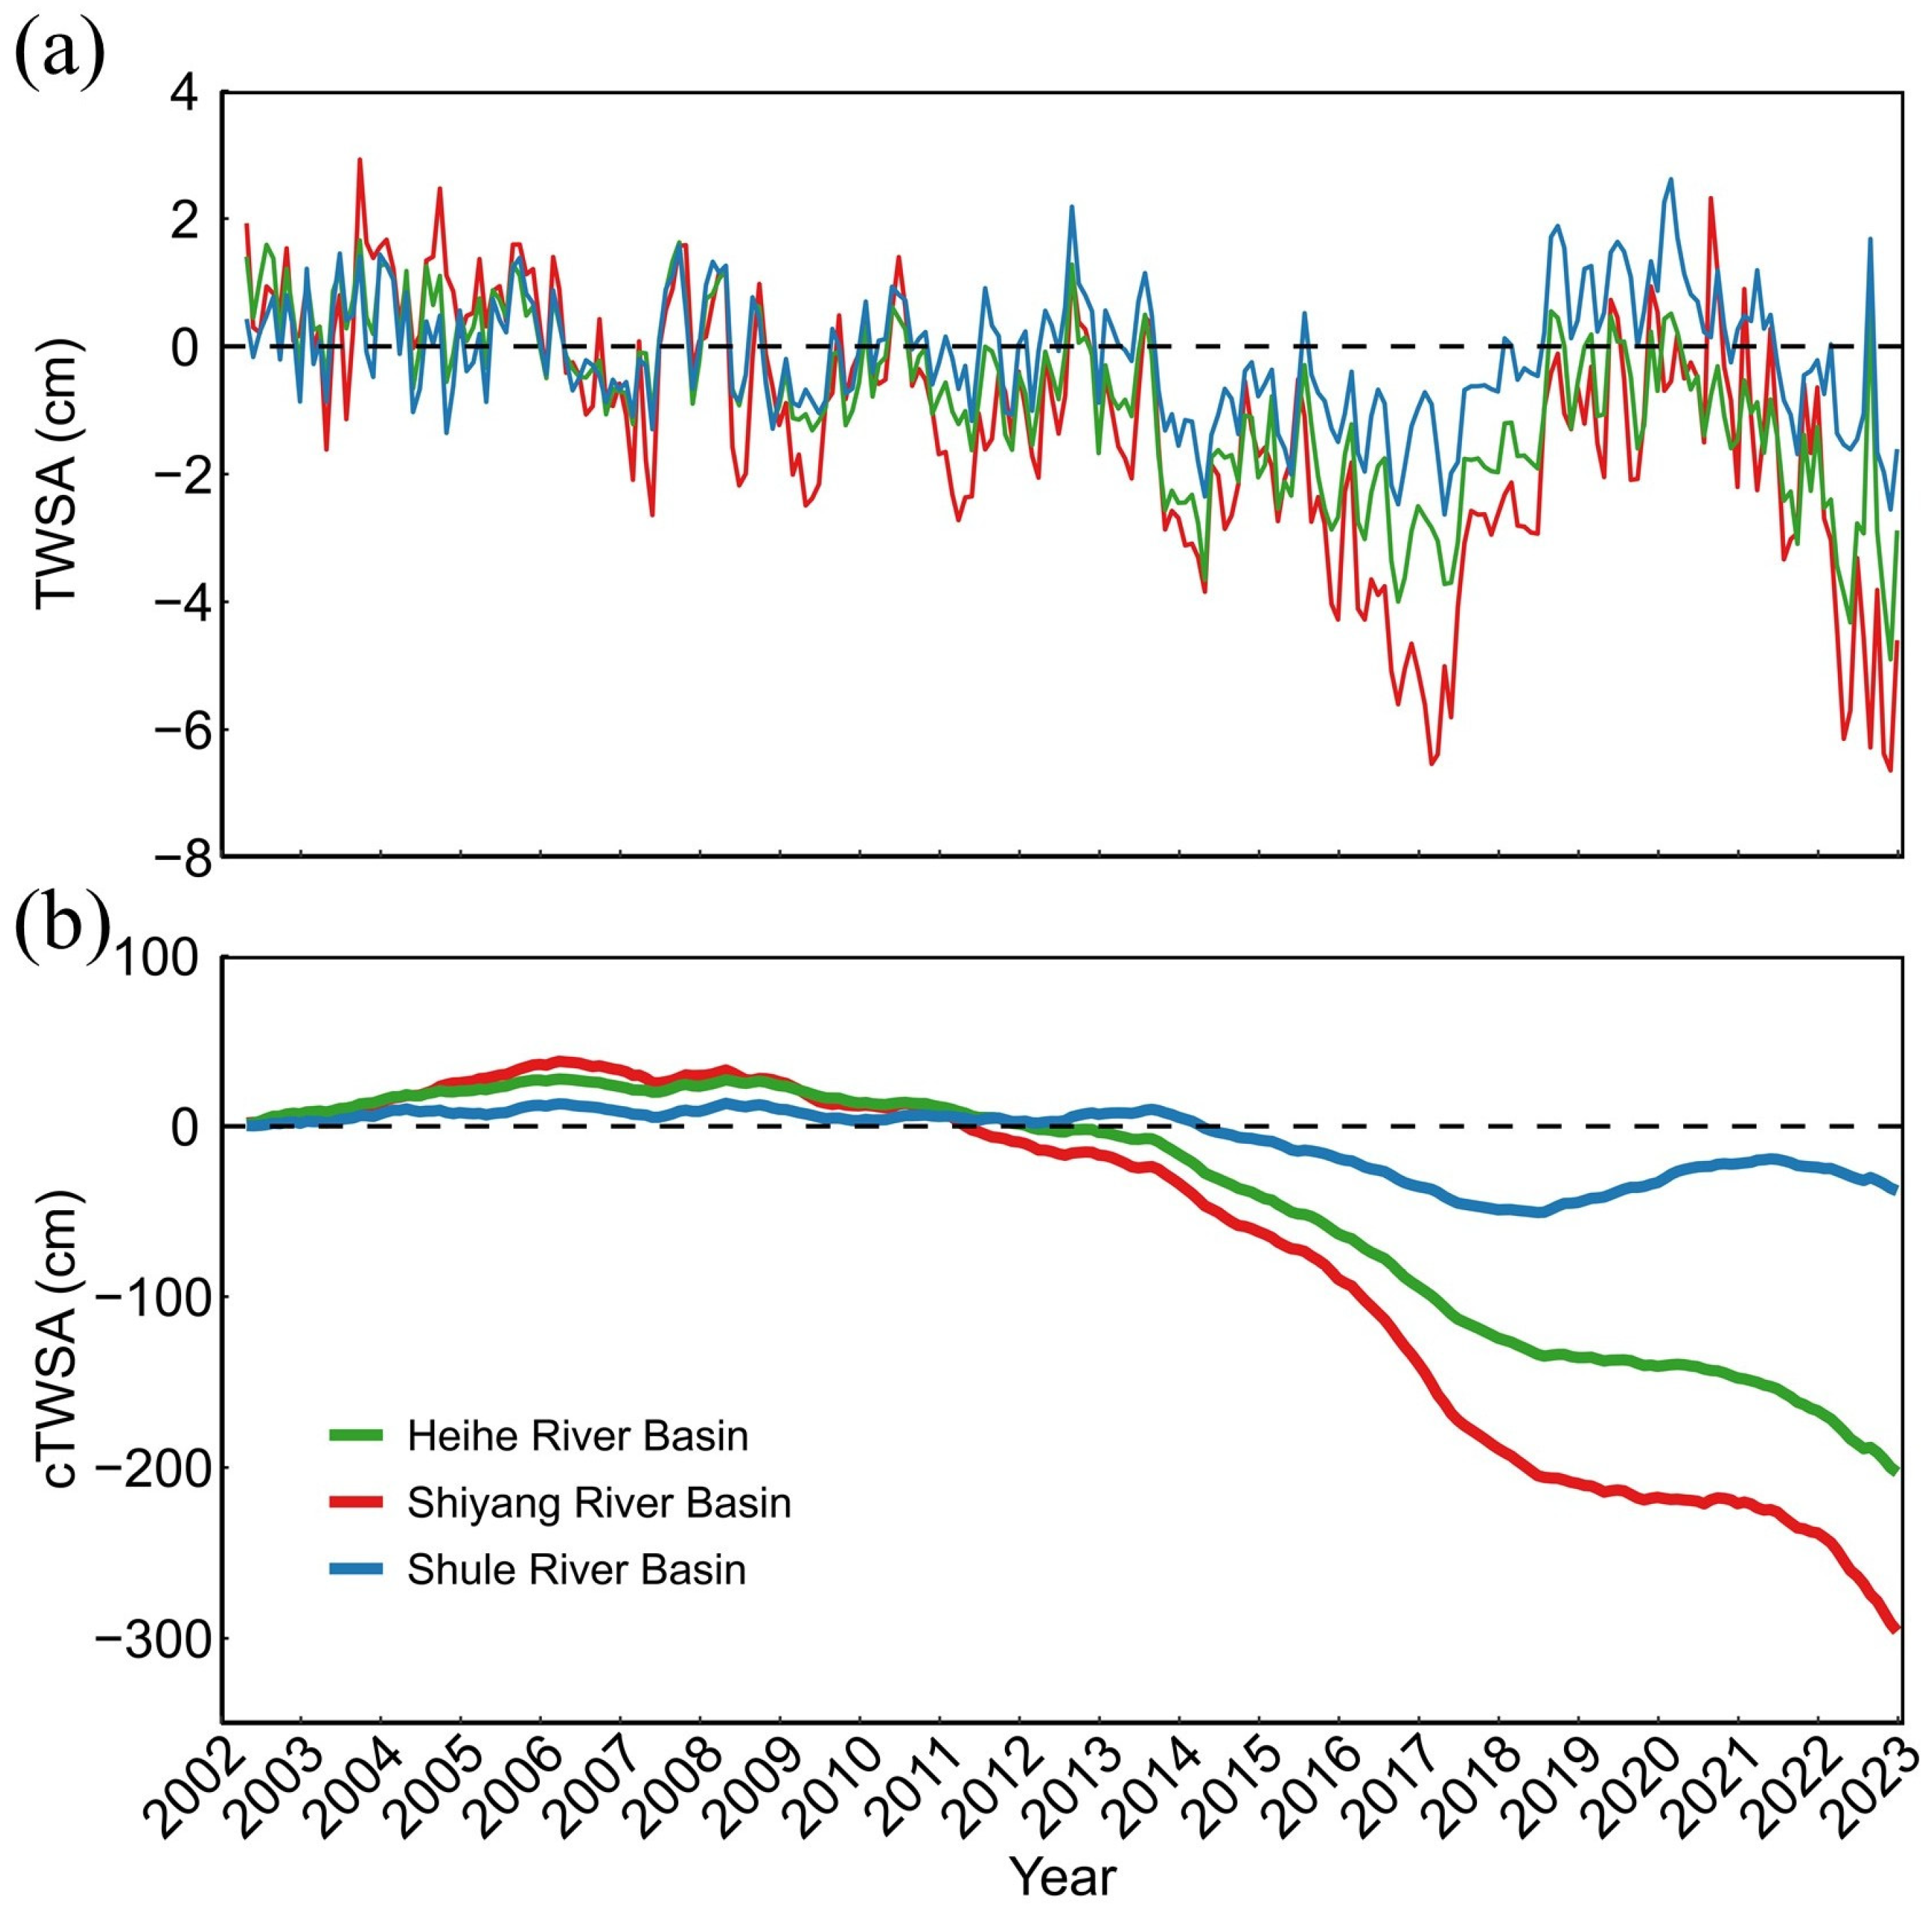
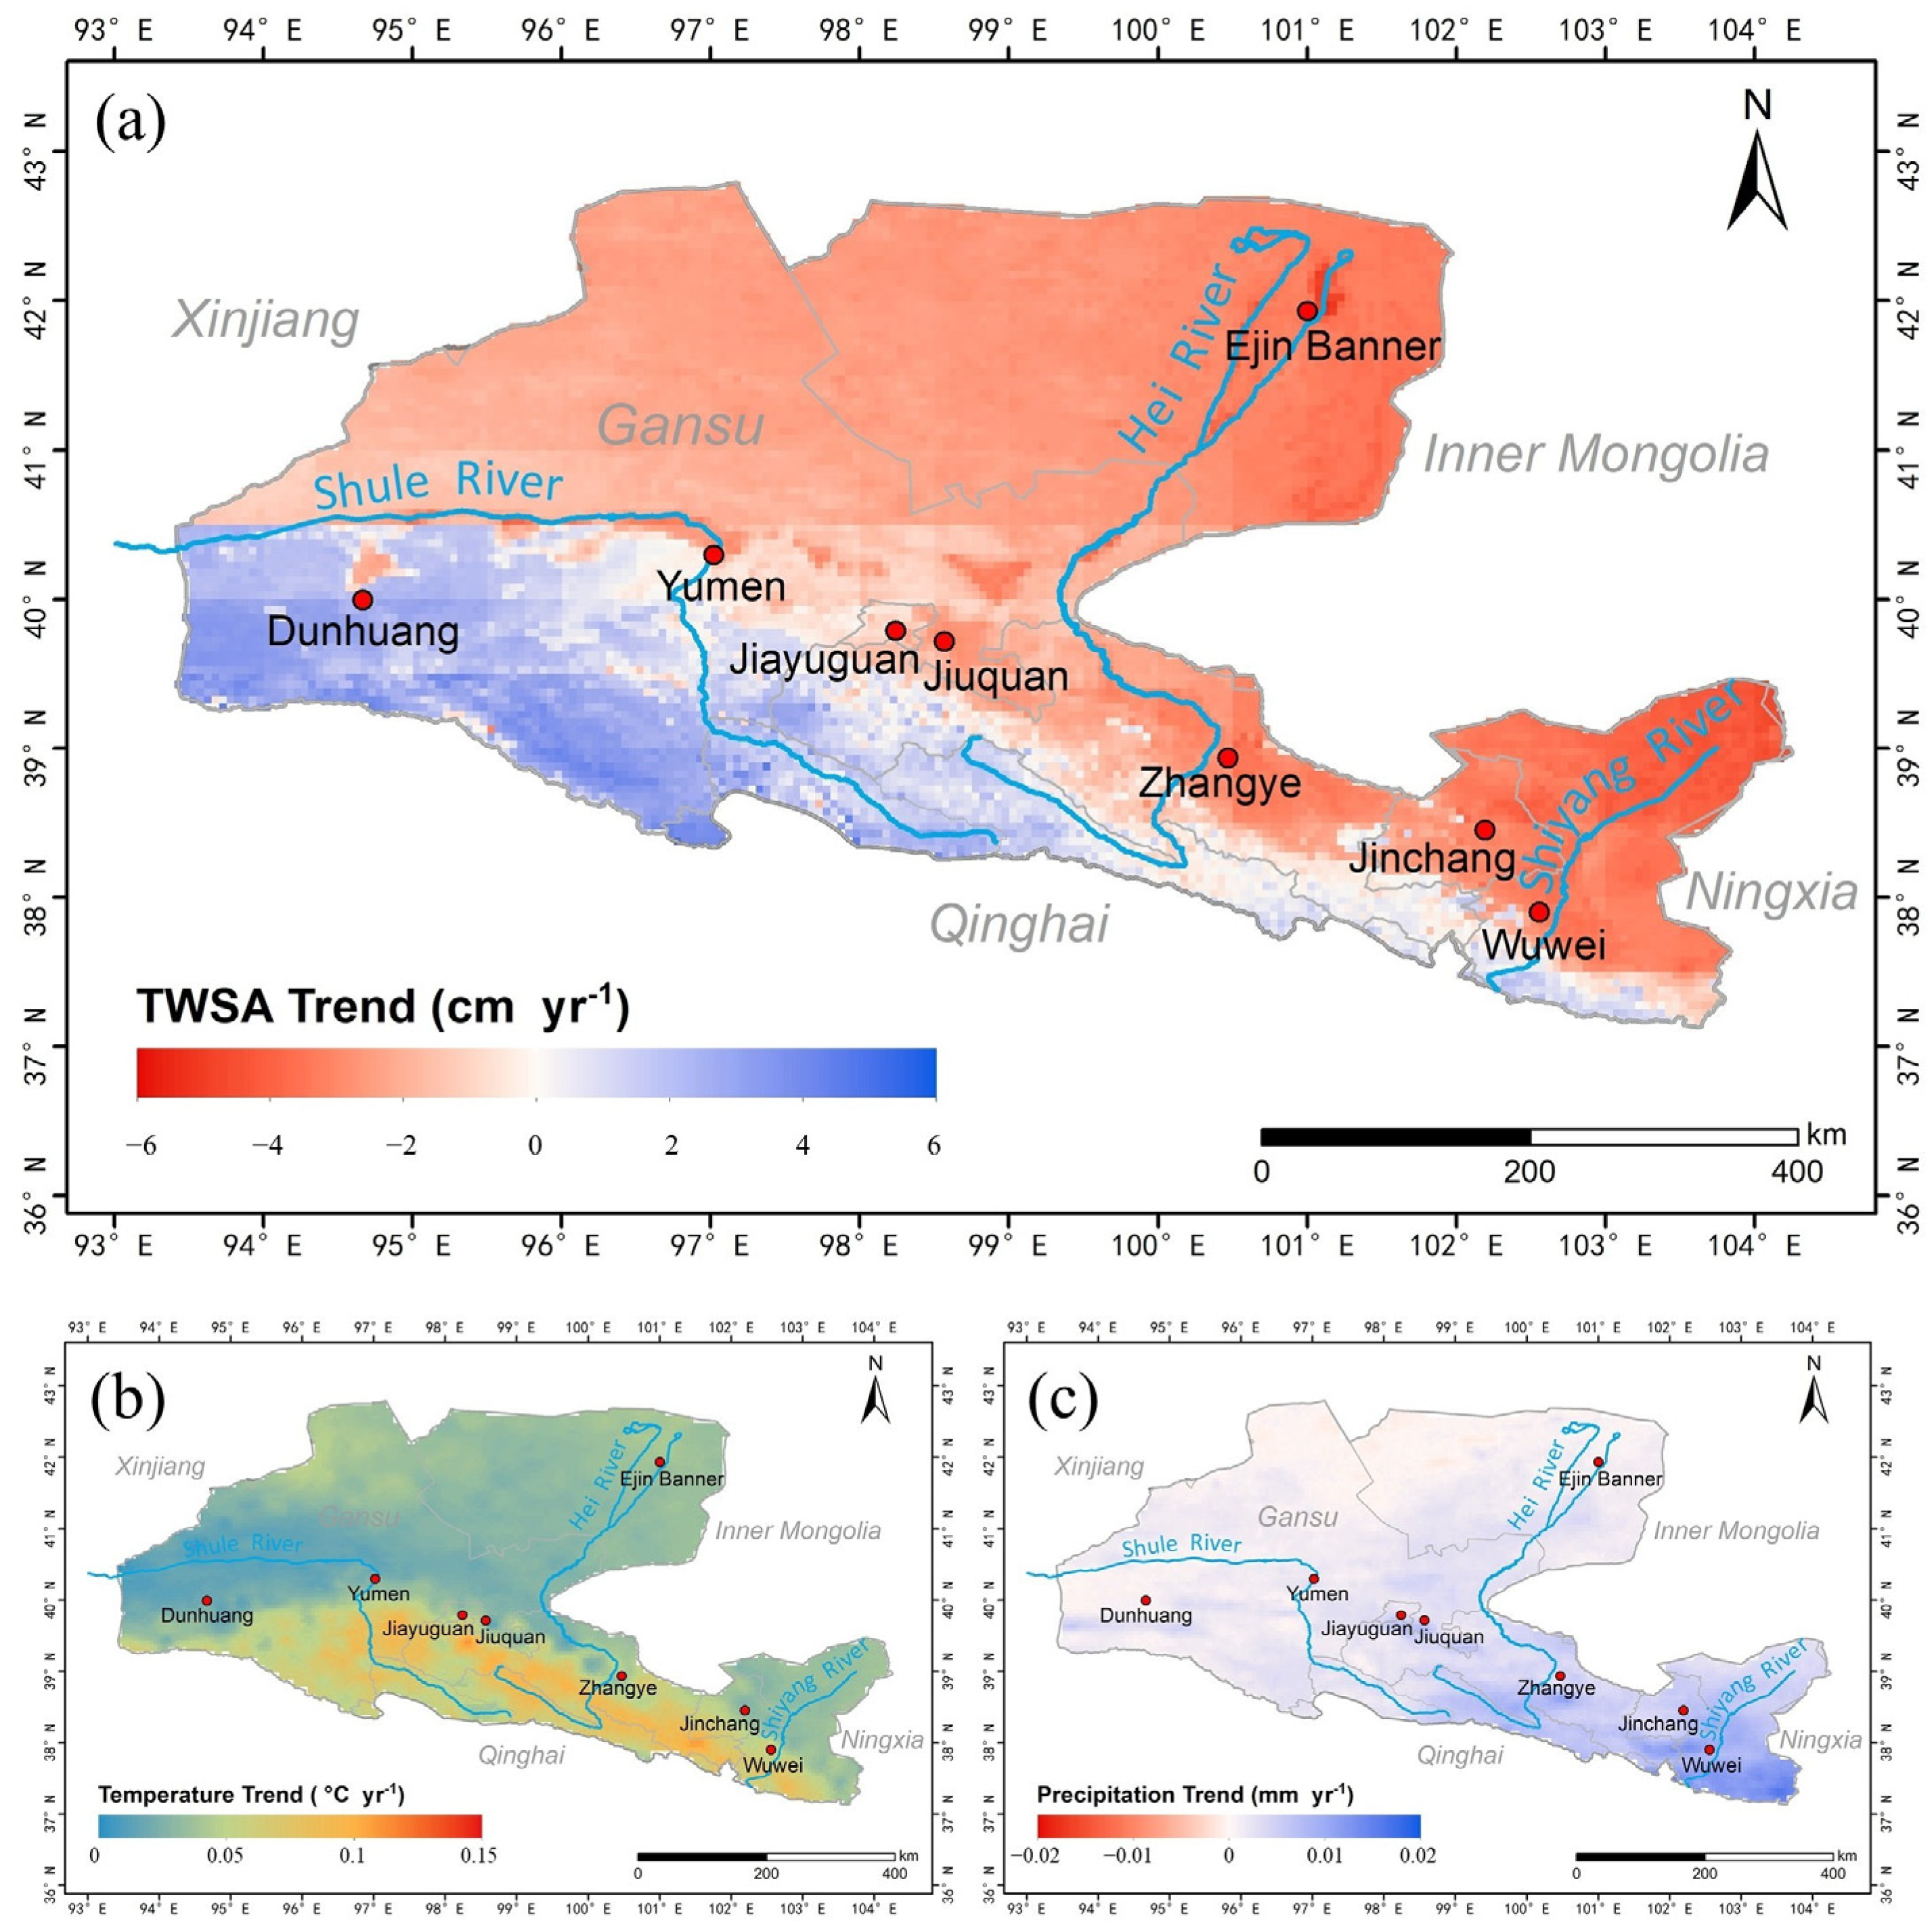
4.1. Spatial and Temporal Variations in TWSAs in the Inland River Basin of the Hexi Corridor
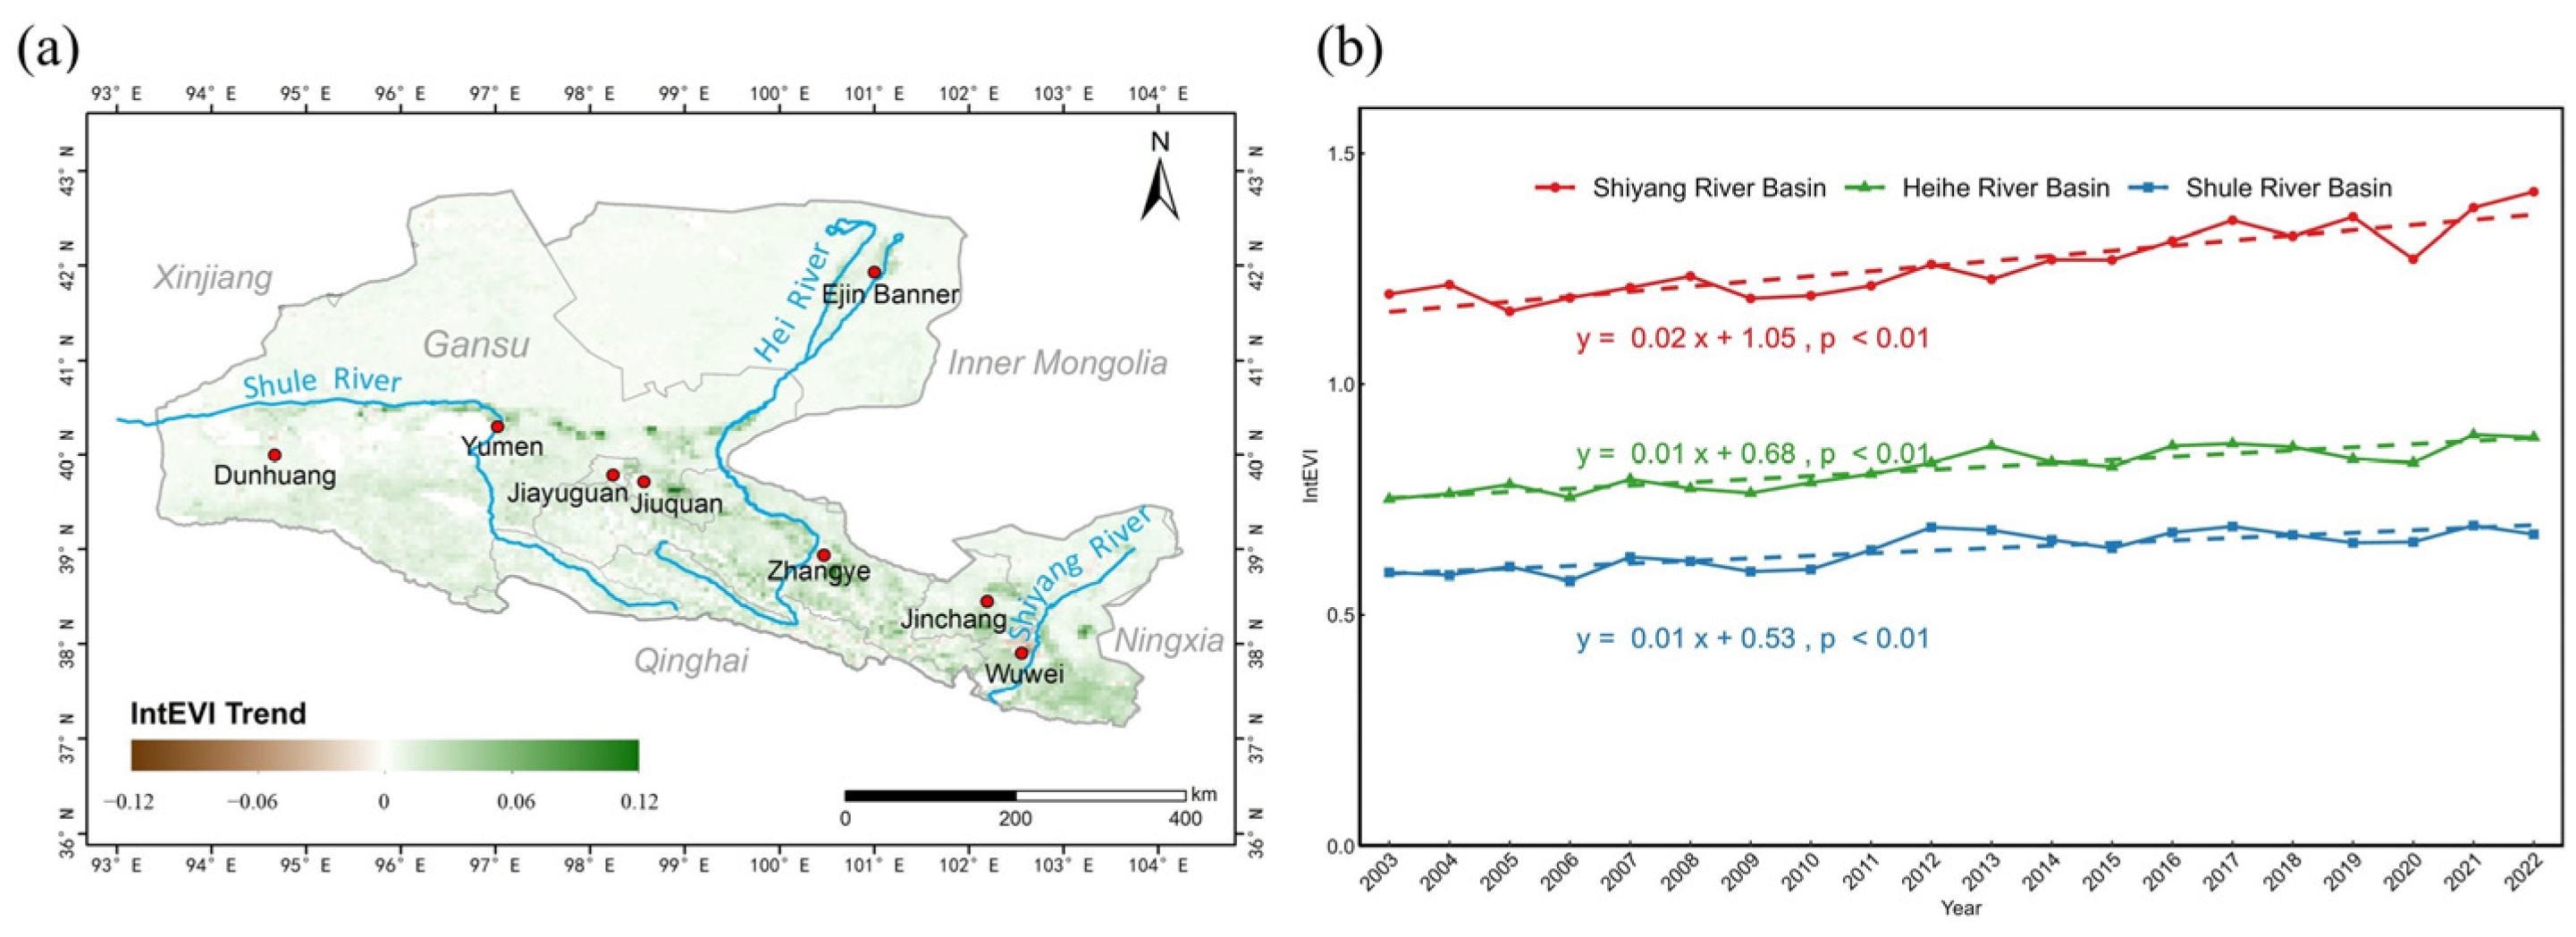
4.2. Spatial and Temporal Trends of EVI in the Inland River Basins of the Hexi Corridor
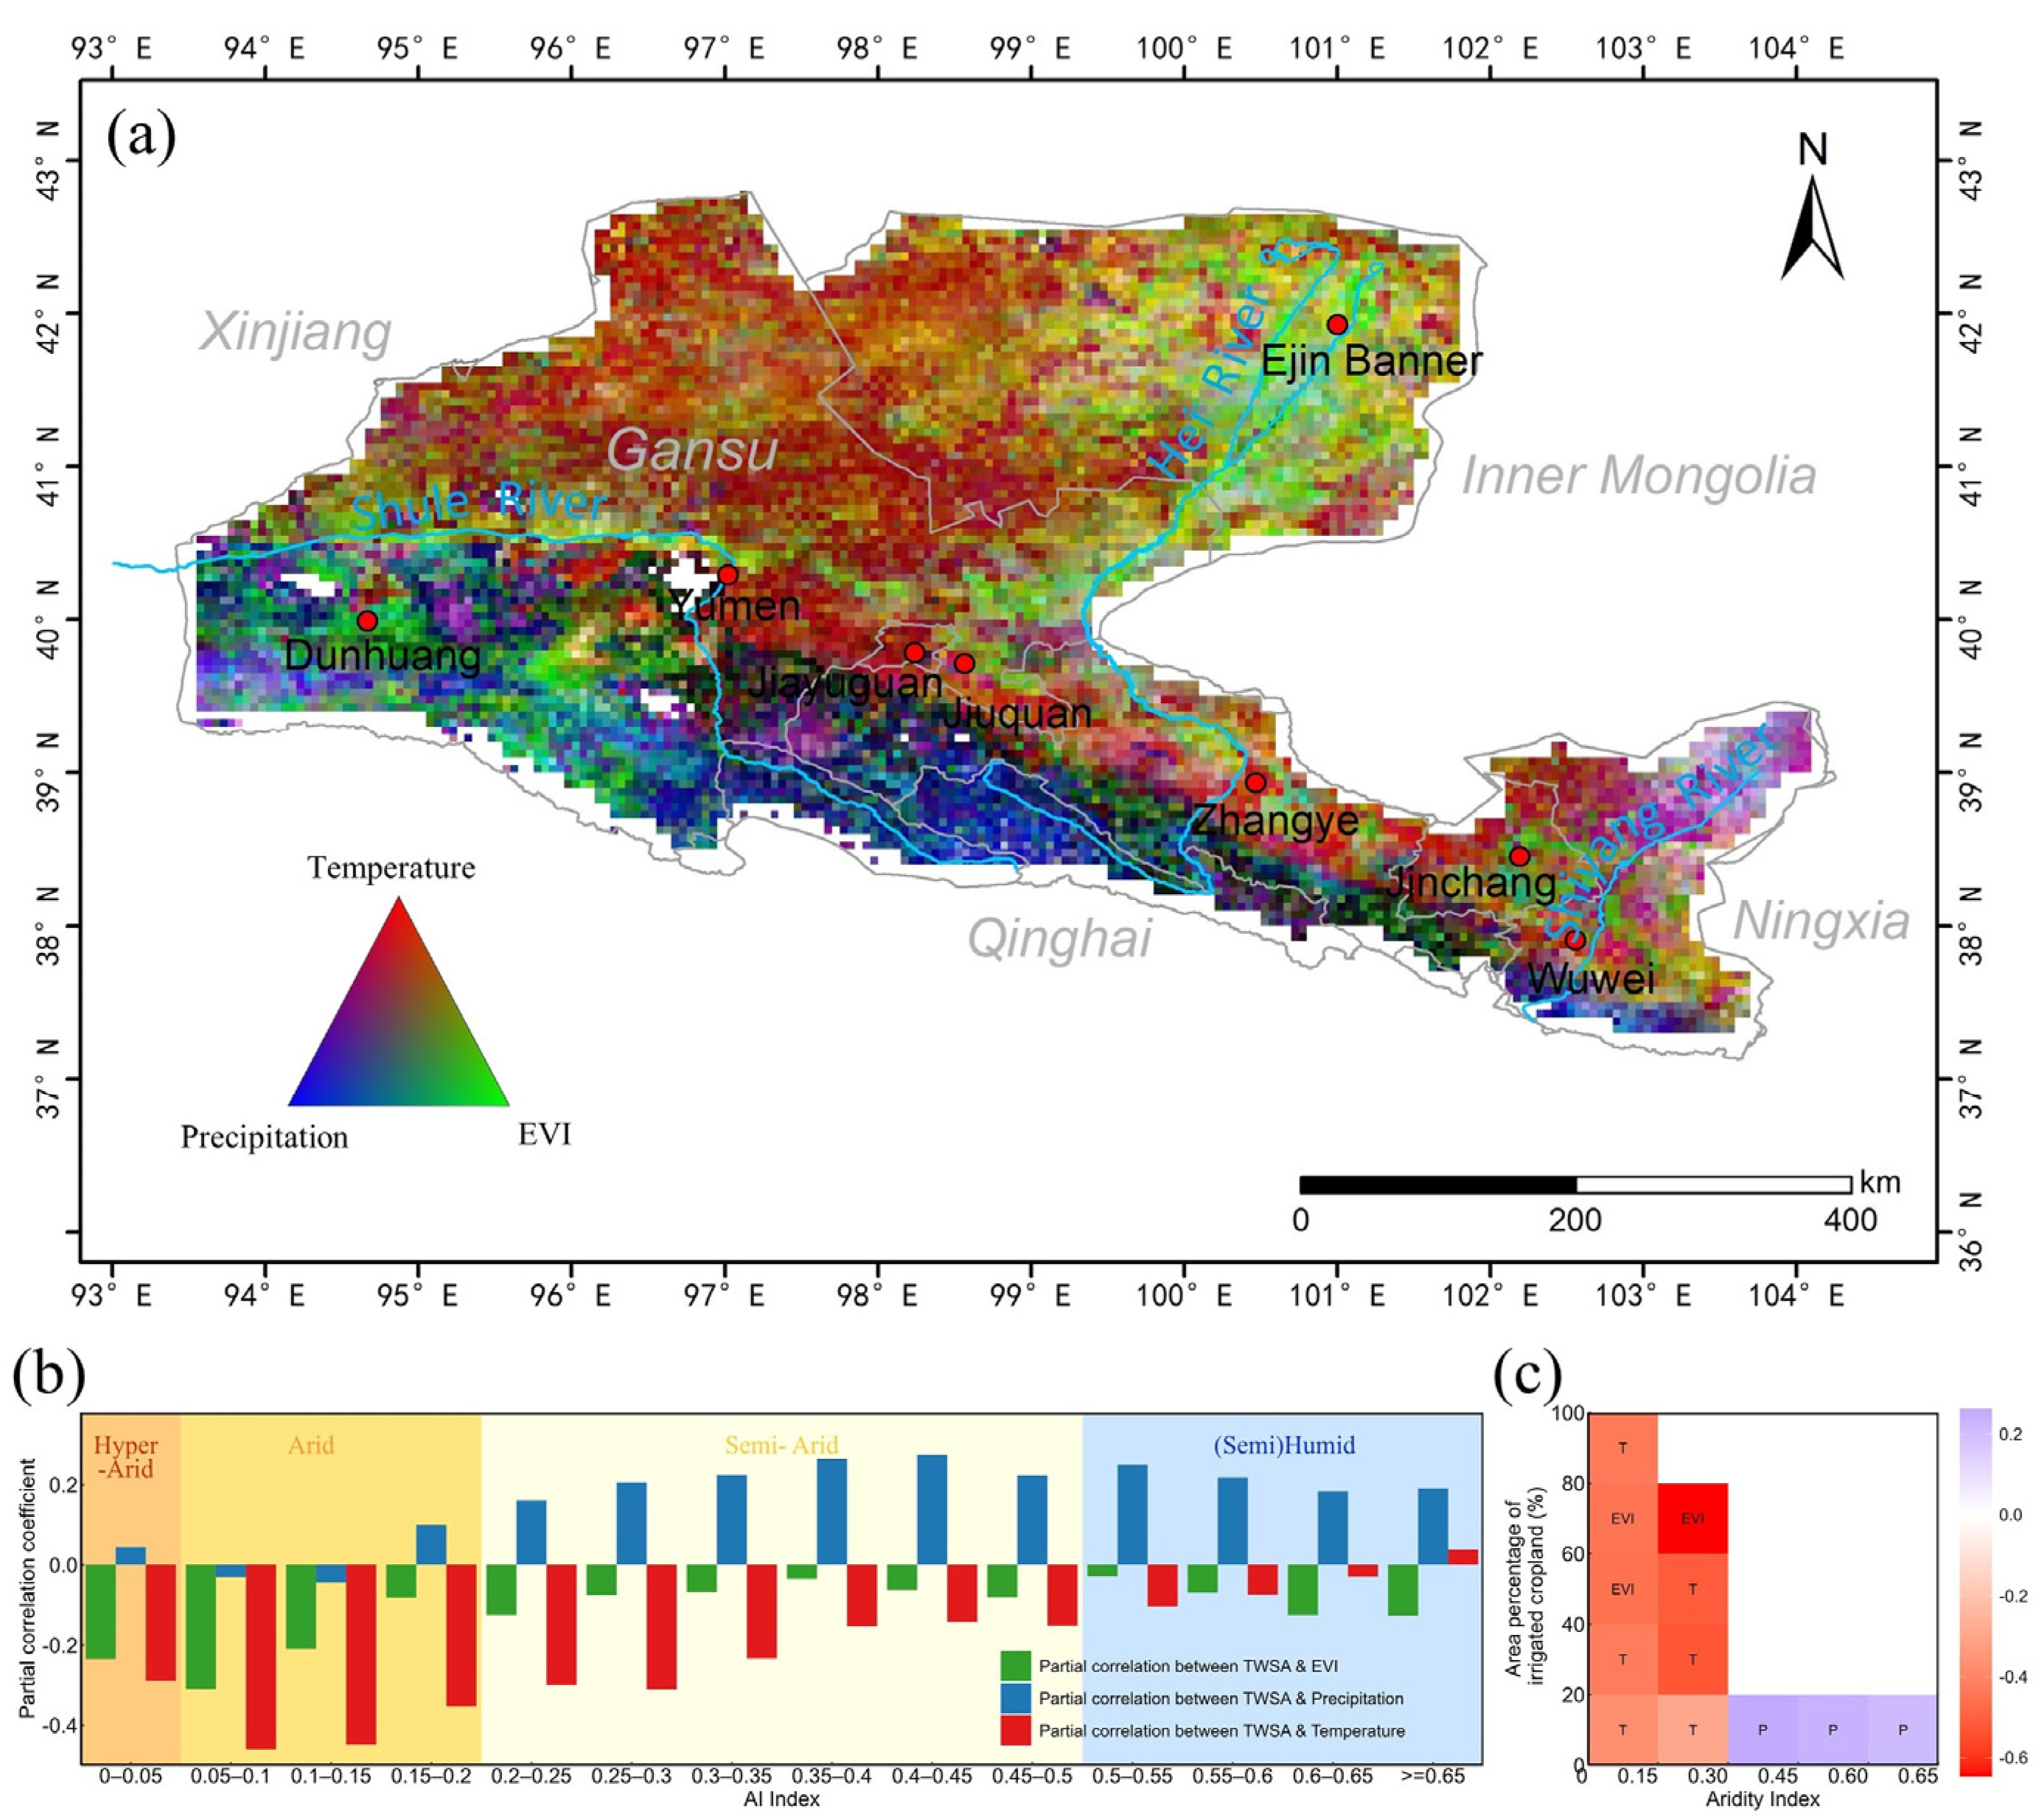
4.3. Partial Correlation Analysis Between TWSAs and Multiple Driving Factors
5. Discussion
6. Conclusions
Author Contributions
Funding
Data Availability Statement
Conflicts of Interest
References
- Prăvălie, R. Drylands extent and environmental issues. A global approach. Earth-Sci. Rev. 2016, 161, 259–278. [Google Scholar] [CrossRef]
- Jian, D.; Niu, G.-Y.; Ma, Z.; Liu, H.; Guan, D.; Zhou, X.; Zhou, J. Limited driving of elevated CO2 on vegetation greening over global drylands. Environ. Res. Lett. 2023, 18, 104024. [Google Scholar] [CrossRef]
- Ahlström, A.; Raupach, M.R.; Schurgers, G.; Smith, B.; Arneth, A.; Jung, M.; Reichstein, M.; Canadell, J.G.; Friedlingstein, P.; Jain, A.K. The dominant role of semi-arid ecosystems in the trend and variability of the land CO2 sink. Science 2015, 348, 895–899. [Google Scholar] [CrossRef] [PubMed]
- Poulter, B.; Frank, D.; Ciais, P.; Myneni, R.B.; Andela, N.; Bi, J.; Broquet, G.; Canadell, J.G.; Chevallier, F.; Liu, Y.Y. Contribution of semi-arid ecosystems to interannual variability of the global carbon cycle. Nature 2014, 509, 600–603. [Google Scholar] [CrossRef] [PubMed]
- D’Odorico, P.; Bhattachan, A.; Davis, K.F.; Ravi, S.; Runyan, C.W. Global desertification: Drivers and feedbacks. Adv. Water Resour. 2013, 51, 326–344. [Google Scholar] [CrossRef]
- Perpinyà-Vallès, M.; Machefer, M.; Ameztegui, A.; Escorihuela, M.J.; Brandt, M.; Romero, L. Quantification of Carbon Stocks at the Individual Tree Level in Semiarid Regions in Africa. J. Remote Sens. 2024, 4, 0359. [Google Scholar] [CrossRef]
- Zhang, Z.; Ma, X.; Maeda, E.E.; Lu, L.; Wang, Y.; Xie, Z.; Li, X.; Pan, Y.; Huang, L.; Zhao, Y. Satellite observed dryland greening in Asian endorheic basins: Drivers and implications to sustainable development. Sci. Total Environ. 2024, 922, 171216. [Google Scholar] [CrossRef]
- Lian, X.; Piao, S.; Chen, A.; Huntingford, C.; Fu, B.; Li, L.Z.; Huang, J.; Sheffield, J.; Berg, A.M.; Keenan, T.F. Multifaceted characteristics of dryland aridity changes in a warming world. Nat. Rev. Earth Environ. 2021, 2, 232–250. [Google Scholar] [CrossRef]
- Zhang, Y.; Gentine, P.; Luo, X.; Lian, X.; Liu, Y.; Zhou, S.; Michalak, A.M.; Sun, W.; Fisher, J.B.; Piao, S. Increasing sensitivity of dryland vegetation greenness to precipitation due to rising atmospheric CO2. Nat. Commun. 2022, 13, 4875. [Google Scholar] [CrossRef]
- Cao, L.; Liu, X.; Zhu, P.; Wang, L. The distribution and evolution of groundwater level depths and groundwater sustainability in the hexi corridor over the last five years. Sustainability 2024, 16, 2527. [Google Scholar] [CrossRef]
- Li, Y.; Liu, W.; Feng, Q.; Zhu, M.; Yang, L.; Zhang, J.; Yin, X. The role of land use change in affecting ecosystem services and the ecological security pattern of the Hexi Regions, Northwest China. Sci. Total Environ. 2023, 855, 158940. [Google Scholar] [CrossRef] [PubMed]
- Chen, B.; Li, Z.; Song, C.; Yu, C.; Zhu, W.; Liu, Z.; Han, B.; Du, J.; Zhang, C.; Xu, F. Automatic detection of active geohazards with millimeter-to-meter-scale deformation and quantitative analysis of factors influencing spatial distribution: A case study in the Hexi corridor, China. Int. J. Appl. Earth Obs. Geoinf. 2024, 131, 103995. [Google Scholar] [CrossRef]
- Wang, S.; Liu, H.; Yu, Y.; Zhao, W.; Yang, Q.; Liu, J. Evaluation of groundwater sustainability in the arid Hexi Corridor of Northwestern China, using GRACE, GLDAS and measured groundwater data products. Sci. Total Environ. 2020, 705, 135829. [Google Scholar] [CrossRef]
- Rodell, M.; Reager, J.T. Water cycle science enabled by the GRACE and GRACE-FO satellite missions. Nat. Water 2023, 1, 47–59. [Google Scholar] [CrossRef]
- Zektser, I.S.; Everett, L.G. Groundwater Resources of the World and Their Use; United Nations Educational, Scientific and Cultural Organization: Paris, France, 2004. [Google Scholar]
- Rodell, M.; Famiglietti, J.S.; Wiese, D.N.; Reager, J.; Beaudoing, H.K.; Landerer, F.W.; Lo, M.-H. Emerging trends in global freshwater availability. Nature 2018, 557, 651–659. [Google Scholar] [CrossRef] [PubMed]
- Ramillien, G.; Famiglietti, J.S.; Wahr, J. Detection of continental hydrology and glaciology signals from GRACE: A review. Surv. Geophys. 2008, 29, 361–374. [Google Scholar] [CrossRef]
- Chang, L.L.; Yuan, R.; Gupta, H.V.; Winter, C.L.; Niu, G.Y. Why is the terrestrial water storage in dryland regions declining? A perspective based on gravity recovery and climate experiment satellite observations and Noah land surface model with multiparameterization schemes model simulations. Water Resour. Res. 2020, 56, e2020WR027102. [Google Scholar] [CrossRef]
- Wang, J.; Song, C.; Reager, J.T.; Yao, F.; Famiglietti, J.S.; Sheng, Y.; MacDonald, G.M.; Brun, F.; Schmied, H.M.; Marston, R.A. Recent global decline in endorheic basin water storages. Nat. Geosci. 2018, 11, 926–932. [Google Scholar] [CrossRef]
- Feng, X.; Fu, B.; Piao, S.; Wang, S.; Ciais, P.; Zeng, Z.; Lü, Y.; Zeng, Y.; Li, Y.; Jiang, X. Revegetation in China’s Loess Plateau is approaching sustainable water resource limits. Nat. Clim. Change 2016, 6, 1019–1022. [Google Scholar] [CrossRef]
- McVicar, T.R.; Li, L.; Van Niel, T.G.; Zhang, L.; Li, R.; Yang, Q.; Zhang, X.; Mu, X.; Wen, Z.; Liu, W. Developing a decision support tool for China’s re-vegetation program: Simulating regional impacts of afforestation on average annual streamflow in the Loess Plateau. For. Ecol. Manag. 2007, 251, 65–81. [Google Scholar] [CrossRef]
- Zhang, S.; Yang, Y.; McVicar, T.R.; Yang, D. An analytical solution for the impact of vegetation changes on hydrological partitioning within the Budyko framework. Water Resour. Res. 2018, 54, 519–537. [Google Scholar] [CrossRef]
- Jia, X.; Zhu, Y.; Luo, Y. Soil moisture decline due to afforestation across the Loess Plateau, China. J. Hydrol. 2017, 546, 113–122. [Google Scholar] [CrossRef]
- Yang, L.; Wei, W.; Chen, L.; Chen, W.; Wang, J. Response of temporal variation of soil moisture to vegetation restoration in semi-arid Loess Plateau, China. Catena 2014, 115, 123–133. [Google Scholar] [CrossRef]
- Lian, J.; Chen, H.; Wang, F.; Nie, Y.; Wang, K. Separating the relative contributions of climate change and ecological restoration to runoff change in a mesoscale karst basin. Catena 2020, 194, 104705. [Google Scholar] [CrossRef]
- An, L.; Wang, J.; Huang, J.; Pokhrel, Y.; Hugonnet, R.; Wada, Y.; Cáceres, D.; Müller Schmied, H.; Song, C.; Berthier, E. Divergent causes of terrestrial water storage decline between drylands and humid regions globally. Geophys. Res. Lett 2021, 48, e2021GL095035. [Google Scholar] [CrossRef]
- Zhao, M.; Zhang, J.; Velicogna, I.; Liang, C.; Li, Z. Ecological restoration impact on total terrestrial water storage. Nat. Sustain. 2021, 4, 56–62. [Google Scholar] [CrossRef]
- Kang, E.; Lu, L.; Xu, Z. Vegetation and carbon sequestration and their relation to water resources in an inland river basin of Northwest China. J. Environ. Manag. 2007, 85, 702–710. [Google Scholar] [CrossRef]
- Wu, H.; Bai, J.; Li, J.; Liu, R.; Zhao, J.; Ma, X. The Relationships Between Vegetation Changes and Groundwater Table Depths for Woody Plants in the Sangong River Basin, Northwest China. Remote Sens. 2025, 17, 937. [Google Scholar] [CrossRef]
- Long, T.; Wagner, M.; Demske, D.; Leipe, C.; Tarasov, P.E. Cannabis in Eurasia: Origin of human use and Bronze Age trans-continental connections. Veg. Hist. Archaeobotany 2017, 26, 245–258. [Google Scholar] [CrossRef]
- Yang, Y.; Ren, L.; Dong, G.; Cui, Y.; Liu, R.; Chen, G.; Wang, H.; Wilkin, S.; Chen, F.-l. Economic change in the prehistoric Hexi corridor (4800–2200 bp), north-west China. Archaeometry 2019, 61, 957–976. [Google Scholar] [CrossRef]
- Cao, Y.; Xie, Z.; Woodgate, W.; Ma, X.; Cleverly, J.; Pang, Y.; Qin, F.; Huete, A. Ecohydrological decoupling of water storage and vegetation attributed to China’s large-scale ecological restoration programs. J. Hydrol. 2022, 615, 128651. [Google Scholar] [CrossRef]
- Liu, M.; Nie, Z.-L.; Cao, L.; Wang, L.-F.; Lu, H.-X.; Wang, Z.; Zhu, P.-C. Comprehensive evaluation on the ecological function of groundwater in the Shiyang river watershed. J. Groundw. Sci. Eng. 2021, 9, 326–340. [Google Scholar]
- Wang, B.; Wang, X.; Song, L.; Huang, Y.; Sun, L.; Han, L. Shiyang river basin water resources to climate changing respond and to the ecological environmental impact. In Proceedings of the Remote Sensing and Modeling of Ecosystems for Sustainability IV, San Diego, CA, USA, 22 October 2007; SPIE: Bellingham, WA, USA, 2007; pp. 456–465. [Google Scholar]
- Zeng, J.; Li, K.; Wang, X.; Chai, M.; Wang, K.; Zhao, Q.; Lin, P.; Zhao, X. The application of reweighted Markov chains in water-sediment prediction in inland river basins—A case study of the Shiyang River Basin. Sustain. Cities Soc. 2021, 73, 103061. [Google Scholar] [CrossRef]
- Li, X.; Cheng, G.; Ge, Y.; Li, H.; Han, F.; Hu, X.; Tian, W.; Tian, Y.; Pan, X.; Nian, Y. Hydrological cycle in the Heihe River Basin and its implication for water resource management in endorheic basins. J. Geophys. Res. Atmos. 2018, 123, 890–914. [Google Scholar] [CrossRef]
- Chen, Y.; Zhang, D.; Sun, Y.; Liu, X.; Wang, N.; Savenije, H.H. Water demand management: A case study of the Heihe River Basin in China. Phys. Chem. Earth Parts A/B/C 2005, 30, 408–419. [Google Scholar] [CrossRef]
- Ma, J.; Wang, X.; Edmunds, W. The characteristics of ground-water resources and their changes under the impacts of human activity in the arid Northwest China—A case study of the Shiyang River Basin. J. Arid Environ. 2005, 61, 277–295. [Google Scholar] [CrossRef]
- Xie, C.; Zhao, L.; Eastoe, C.J.; Wang, N.; Dong, X. An isotope study of the Shule River Basin, Northwest China: Sources and groundwater residence time, sulfate sources and climate change. J. Hydrol. 2022, 612, 128043. [Google Scholar] [CrossRef]
- Zhou, M.; Sun, D.; Wang, X.; Ma, Y.; Cui, Y.; Wu, L. Multi-objective optimal allocation of water resources in Shule River Basin of Northwest China based on climate change scenarios. Agric. Water Manag. 2024, 302, 109015. [Google Scholar] [CrossRef]
- Landerer, F.W.; Flechtner, F.M.; Save, H.; Webb, F.H.; Bandikova, T.; Bertiger, W.I.; Bettadpur, S.V.; Byun, S.H.; Dahle, C.; Dobslaw, H. Extending the global mass change data record: GRACE Follow-On instrument and science data performance. Geophys. Res. Lett. 2020, 47, e2020GL088306. [Google Scholar] [CrossRef]
- Zhang, G.; Xu, T.; Yin, W.; Bateni, S.M.; Jun, C.; Kim, D.; Liu, S.; Xu, Z.; Ming, W.; Wang, J. A machine learning downscaling framework based on a physically constrained sliding window technique for improving resolution of global water storage anomaly. Remote Sens. Environ. 2024, 313, 114359. [Google Scholar] [CrossRef]
- Huete, A.; Didan, K.; Miura, T.; Rodriguez, E.P.; Gao, X.; Ferreira, L.G. Overview of the radiometric and biophysical performance of the MODIS vegetation indices. Remote Sens. Environ. 2002, 83, 195–213. [Google Scholar] [CrossRef]
- Liu, L.; Zhang, X.; Gao, Y.; Chen, X.; Shuai, X.; Mi, J. Finer-resolution mapping of global land cover: Recent developments, consistency analysis, and prospects. J. Remote Sens. 2021, 2021, 5289697. [Google Scholar] [CrossRef]
- Liu, J.; Ren, Y.; Chen, X. Regional Accuracy Assessment of 30-Meter GLC_FCS30, GlobeLand30, and CLCD Products: A Case Study in Xinjiang Area. Remote Sens. 2023, 16, 82. [Google Scholar] [CrossRef]
- Zhao, T.; Zhang, X.; Gao, Y.; Mi, J.; Liu, W.; Wang, J.; Jiang, M.; Liu, L. Assessing the accuracy and consistency of six fine-resolution global land cover products using a novel stratified random sampling validation dataset. Remote Sens. 2023, 15, 2285. [Google Scholar] [CrossRef]
- Huffman, G.J.; Bolvin, D.T.; Braithwaite, D.; Hsu, K.; Joyce, R.; Xie, P.; Yoo, S.H. NASA Global Precipitation Measurement (GPM) Integrated Multi-Satellite Retrievals for GPM (IMERG); Algorithm Theoretical Basis Document (ATBD) Version; National Aeronautics and Space Administration (NASA): Washington, DC, USA, 2015; Volume 4, p. 30. [Google Scholar]
- Hersbach, H.; Bell, B.; Berrisford, P.; Hirahara, S.; Horányi, A.; Muñoz-Sabater, J.; Nicolas, J.; Peubey, C.; Radu, R.; Schepers, D. The ERA5 global reanalysis. Q. J. R. Meteorol. Soc. 2020, 146, 1999–2049. [Google Scholar] [CrossRef]
- Hirsch, R.M.; Slack, J.R.; Smith, R.A. Techniques of trend analysis for monthly water quality data. Water Resour. Res. 1982, 18, 107–121. [Google Scholar] [CrossRef]
- Xie, Z.; Huete, A.; Cleverly, J.; Phinn, S.; McDonald-Madden, E.; Cao, Y.; Qin, F. Multi-climate mode interactions drive hydrological and vegetation responses to hydroclimatic extremes in Australia. Remote Sens. Environ. 2019, 231, 111270. [Google Scholar] [CrossRef]
- Bai, J.; Shi, H.; Yu, Q.; Xie, Z.; Li, L.; Luo, G.; Jin, N.; Li, J. Satellite-observed vegetation stability in response to changes in climate and total water storage in Central Asia. Sci. Total Environ. 2019, 659, 862–871. [Google Scholar] [CrossRef]
- Zhao, R.; Liu, X.; Dong, J.; Zhao, G.; Manevski, K.; Andersen, M.N.; Tang, Q. Human activities modulate greening patterns: A case study for southern Xinjiang in China based on long time series analysis. Environ. Res. Lett. 2022, 17, 044012. [Google Scholar] [CrossRef]
- Rohde, M.M.; Albano, C.M.; Huggins, X.; Klausmeyer, K.R.; Morton, C.; Sharman, A.; Zaveri, E.; Saito, L.; Freed, Z.; Howard, J.K. Groundwater-dependent ecosystem map exposes global dryland protection needs. Nature 2024, 632, 101–107. [Google Scholar] [CrossRef]
- Xin, Z.; Xu, J.; Zheng, W. Spatiotemporal variations of vegetation cover on the Chinese Loess Plateau (1981–2006): Impacts of climate changes and human activities. Sci. China Ser. D Earth Sci. 2008, 51, 67–78. [Google Scholar] [CrossRef]
- Zeng, Y.; Hao, D.; Huete, A.; Dechant, B.; Berry, J.; Chen, J.M.; Joiner, J.; Frankenberg, C.; Bond-Lamberty, B.; Ryu, Y. Optical vegetation indices for monitoring terrestrial ecosystems globally. Nat. Rev. Earth Environ. 2022, 3, 477–493. [Google Scholar] [CrossRef]
- Berry, J. 3.10 solar induced chlorophyll fluorescence: Origins, relation to photosynthesis and retrieval. Compr. Remote Sens. 2018, 3, 143–162. [Google Scholar]
- Zhang, Y.; Guanter, L.; Berry, J.A.; Joiner, J.; van der Tol, C.; Huete, A.; Gitelson, A.; Voigt, M.; Köhler, P. Estimation of vegetation photosynthetic capacity from space-based measurements of chlorophyll fluorescence for terrestrial biosphere models. Glob. Change Biol. 2014, 20, 3727–3742. [Google Scholar] [CrossRef]
- Zhang, Y.; Peñuelas, J. Combining solar-induced chlorophyll fluorescence and optical vegetation indices to better understand plant phenological responses to global change. J. Remote Sens. 2023, 3, 0085. [Google Scholar] [CrossRef]
- Du, S.; Liu, X.; Chen, J.; Liu, L. Prospects for solar-induced chlorophyll fluorescence remote sensing from the SIFIS payload onboard the TECIS-1 satellite. J. Remote Sens. 2022, 2022, 9845432. [Google Scholar] [CrossRef]
- Zhang, P.; Gu, S.; Chen, L.; Shang, J.; Lin, M.; Zhu, A.; Yin, H.; Wu, Q.; Shou, Y.; Sun, F. FY-3G satellite instruments and precipitation products: First report of China’s Fengyun rainfall mission in-orbit. J. Remote Sens. 2023, 3, 0097. [Google Scholar] [CrossRef]
- Gonsamo, A.; Ciais, P.; Miralles, D.G.; Sitch, S.; Dorigo, W.; Lombardozzi, D.; Friedlingstein, P.; Nabel, J.E.; Goll, D.S.; O’Sullivan, M. Greening drylands despite warming consistent with carbon dioxide fertilization effect. Glob. Change Biol. 2021, 27, 3336–3349. [Google Scholar] [CrossRef]
- Müller Schmied, H.; Cáceres, D.; Eisner, S.; Flörke, M.; Herbert, C.; Niemann, C.; Peiris, T.A.; Popat, E.; Portmann, F.T.; Reinecke, R. The global water resources and use model WaterGAP v2. 2d: Model description and evaluation. Geosci. Model Dev. 2021, 14, 1037–1079. [Google Scholar] [CrossRef]


Disclaimer/Publisher’s Note: The statements, opinions and data contained in all publications are solely those of the individual author(s) and contributor(s) and not of MDPI and/or the editor(s). MDPI and/or the editor(s) disclaim responsibility for any injury to people or property resulting from any ideas, methods, instructions or products referred to in the content. |
© 2025 by the authors. Licensee MDPI, Basel, Switzerland. This article is an open access article distributed under the terms and conditions of the Creative Commons Attribution (CC BY) license (https://creativecommons.org/licenses/by/4.0/).
Share and Cite
Cao, C.; Zhu, X.; Liu, K.; Liang, Y.; Ma, X. Satellite-Observed Arid Vegetation Greening and Terrestrial Water Storage Decline in the Hexi Corridor, Northwest China. Remote Sens. 2025, 17, 1361. https://doi.org/10.3390/rs17081361
Cao C, Zhu X, Liu K, Liang Y, Ma X. Satellite-Observed Arid Vegetation Greening and Terrestrial Water Storage Decline in the Hexi Corridor, Northwest China. Remote Sensing. 2025; 17(8):1361. https://doi.org/10.3390/rs17081361
Chicago/Turabian StyleCao, Chunyan, Xiaoyu Zhu, Kedi Liu, Yu Liang, and Xuanlong Ma. 2025. "Satellite-Observed Arid Vegetation Greening and Terrestrial Water Storage Decline in the Hexi Corridor, Northwest China" Remote Sensing 17, no. 8: 1361. https://doi.org/10.3390/rs17081361
APA StyleCao, C., Zhu, X., Liu, K., Liang, Y., & Ma, X. (2025). Satellite-Observed Arid Vegetation Greening and Terrestrial Water Storage Decline in the Hexi Corridor, Northwest China. Remote Sensing, 17(8), 1361. https://doi.org/10.3390/rs17081361