Article

Landscape Analysis and Assessment of Ecosystem Stability Based on Land Use and Multitemporal Remote Sensing: A Case Study of the Zhungeer Open-Pit Coal Mining Area

1
State Key Laboratory for Fine Exploration and Intelligent Development of Coal Resources, China University of Mining and Technology (Beijing), Beijing 100083, China
2
Institute of Ecological Environmental Restoration in Mine Areas of West China, Xi’an University of Science and Technology, Xi’an 710054, China
*
Author to whom correspondence should be addressed.
Remote Sens. 2025, 17(7), 1162; https://doi.org/10.3390/rs17071162
Submission received: 8 February 2025 / Revised: 19 March 2025 / Accepted: 19 March 2025 / Published: 25 March 2025

Abstract

:
Intensive mining activities in the Zhungeer open-pit coal mining area of China have resulted in drastic changes to land use and landscape patterns, severely affecting the ecological quality and stability of the region. This study integrates 36 years (1985–2020) of Landsat multiband remote sensing imagery with 30 m resolution CLCD land cover data, establishing a “Sky–Earth–Space” integrated monitoring system. This system allows for the calculation of ecological indices and the creation of land use transition matrices for internal and external regions of the mining area, ultimately completing an assessment of the ecological stability of the Zhungeer open-pit coal mining region. By overcoming the limitations posed by a singular data source, it facilitates a dynamic analysis of the interrelationships among mining activities, vegetation responses, and engineering remediation efforts. The findings reveal a significant transformation among various land types within the mining area, with both the area of mining pits and the area rehabilitated through artificial restoration undergoing rapid increases. By 2020, the area of the mining pits had reached 2630.98 hectares, while the area designated for rehabilitation had expanded to 2204.87 hectares. Prior to 2000, bare land and impermeable surfaces dominated the internal area of the mine; however, post-2000, the Normalized Difference Built-up Index (NDBI) value continuously decreased to −0.0685, indicative of an ecological transition where vegetation became predominant. The beneficial impacts of rehabilitation efforts have effectively mitigated the adverse environmental consequences of open-pit coal mining. Since 2000, the mean Normalized Difference Vegetation Index (NDVI) within the mining area has shown a consistent increase, recovering to 0.2246, signifying a restoration of the internal ecological environment. Moreover, this area exerts a notable radiative influence on the vegetation conditions outside the mining zone, with a contribution value of 1.016. Following rehabilitation efforts, the landscape patch density, landscape separation, and landscape fragmentation in the Zhungeer open-pit coal mining area exhibited a declining trend, leading to a more uniform distribution of landscape patches and improved structural balance. By 2020, the adaptability index had risen to 0.35836, achieving 93.69% of the restoration level observed prior to mining operations in 1985, thus indicating an improvement in ecosystem stability and the restoration of ecological functions, although rehabilitation efforts display a temporal lag of 10 to 15 years. The adverse impacts of open-pit coal mining on the regional ecological environment are, in fact, predominantly short-term. However, human intervention has the potential to reshape the ecology of the mining area, enhance the quality of the ecological environment, and foster the sustained development of regional ecological health.

Graphical Abstract

1. Introduction

As the world’s largest producer and consumer of coal, China places significant reliance on open-pit coal mining for its energy supply [1]. This intense anthropogenic activity inflicts direct damage upon the surface, resulting in soil erosion and the loss of biodiversity, thereby disrupting original land use patterns and the initial ecosystems [2,3]. Particularly in the arid and semi-arid regions of Northwest China, fragile ecosystems become increasingly sensitive to external disturbances following the impacts of open-pit mining activities [4,5]. Consequently, ecological restoration in mining areas has become critically urgent, promoting the development of green mining practices to mitigate the negative effects of open-pit coal mining on the ecological environment. Open-pit coal mining has precipitated a series of environmental issues, such as vegetation degradation [6], soil erosion [7], and heavy metal contamination [8], all of which constitute significant threats to biodiversity, alter landscape patterns, and disrupt ecological functions, ultimately compromising the stability of the ecosystem in mining areas [9]. Therefore, it is vital to clarify the impacts of open-pit mining activities on land use changes and the ecological environment in the affected regions, as well as to analyze the cumulative effects of ecological engineering both within the mining areas and beyond. The rapid and comprehensive advancement of 3S technology has provided remote sensing with a unique advantage in the dynamic monitoring of ecological conditions in mining areas, offering a practical solution for detecting ecological disturbances in coal mining regions [10]. Xu et al. [11] utilized multitemporal Landsat remote sensing imagery in conjunction with a random forest model to classify land use/land cover (LULC) in open-pit mining areas and their surroundings, exploring the evolution of landscape patterns related to these mining activities.
Some researchers have quantitatively assessed the impact of mining activities on ecological environments through indicators such as vegetation cover [12], remote sensing ecological indices [13], and landscape ecological health indices [14]. However, these metrics merely reflect the ecological characteristics of the region at specific times and do not account for the reciprocal positive and negative effects between ecological engineering and open-pit mining activities. Recent studies have indicated that land use transition matrices [15], which can represent phased changes within coal mining areas, may serve as quantifiable indicators of the impact of mining activities on the regional ecological environment. It is noteworthy that mining activities not only cause direct damage to the surfaces within the mining boundaries but also lead to ecological degradation beyond the mine, thereby affecting the overall ecological quality of the region [16].
Currently, many experts and scholars have proposed using the theories of landscape ecology to provide decision-making support for comprehensive risk prevention in coal mining areas, which can effectively guide the optimization and management of landscape patterns in these regions. Zhang et al. [17] used the transfer matrix and landscape pattern indices based on the GEE platform to analyze the spatiotemporal evolution trends of land use and landscape patterns over 20 years in 13 typical open-pit coal mines in Inner Mongolia and assessed the impact of ecological restoration projects on land use structure and landscape patterns. Chen et al. [18] focused on the Shengli Open-Pit Mine in Xilin Gol, China, revealing the spatiotemporal impacts of large-scale open-pit coal mines on the landscape ecological health of semi-arid grasslands, and established a research system of landscape indices–pattern–evolution–driving forces–spatial statistics. Additionally, some scholars, in their research on the regional ecological impacts of mining activities, have considered indicators such as ecological integrity and biodiversity to accurately locate key landscape areas and establish key protection zones in coal mining areas. Wang et al. [19] developed a model for identifying key landscape areas based on Landsat TM/OLI data and identified very important patches, important patches, and common patches around open-pit coal mines in the semi-arid grasslands of the Yimin open-pit mining area in China, enriching the foundation for ecological mapping and the construction of ecological security patterns. Research on the landscape structure, landscape stability, and landscape processes in coal mining areas has also gradually increased in recent years. Soumen et al. [20] used satellite remote sensing data to study the land use changes and landscape fragmentation caused by open-pit mining activities in the Barabini C.D. block of West Bengal, India, and found that the changes in landscape structure caused significant spatial loss, directly leading to a decrease in regional sustainability. Feng et al. [21] constructed three indices—NDVI central tendency, heterogeneity, and relative variability—based on normalized vegetation index (NDVI) time-series data grids, completing the identification of landscape dynamic processes and stability in semi-arid grassland coal mining areas in China. Furthermore, some studies have conducted buffer zone analyses outside the mining areas to clarify the ecological impact effects of mining activities on external regions. Wu et al. [22] analyzed the theoretical reference range of the impacts of the Shengli Open-Pit Mine through buffer zone analysis, landscape ecological function contribution rates, and the modified landscape disturbance index, concluding that the grassland landscape around the mining area is primarily affected lightly. However, there is limited research that analyzes the land use type changes and landscape pattern evolution of open-pit mining areas from multiple perspectives in ecological environmental studies.
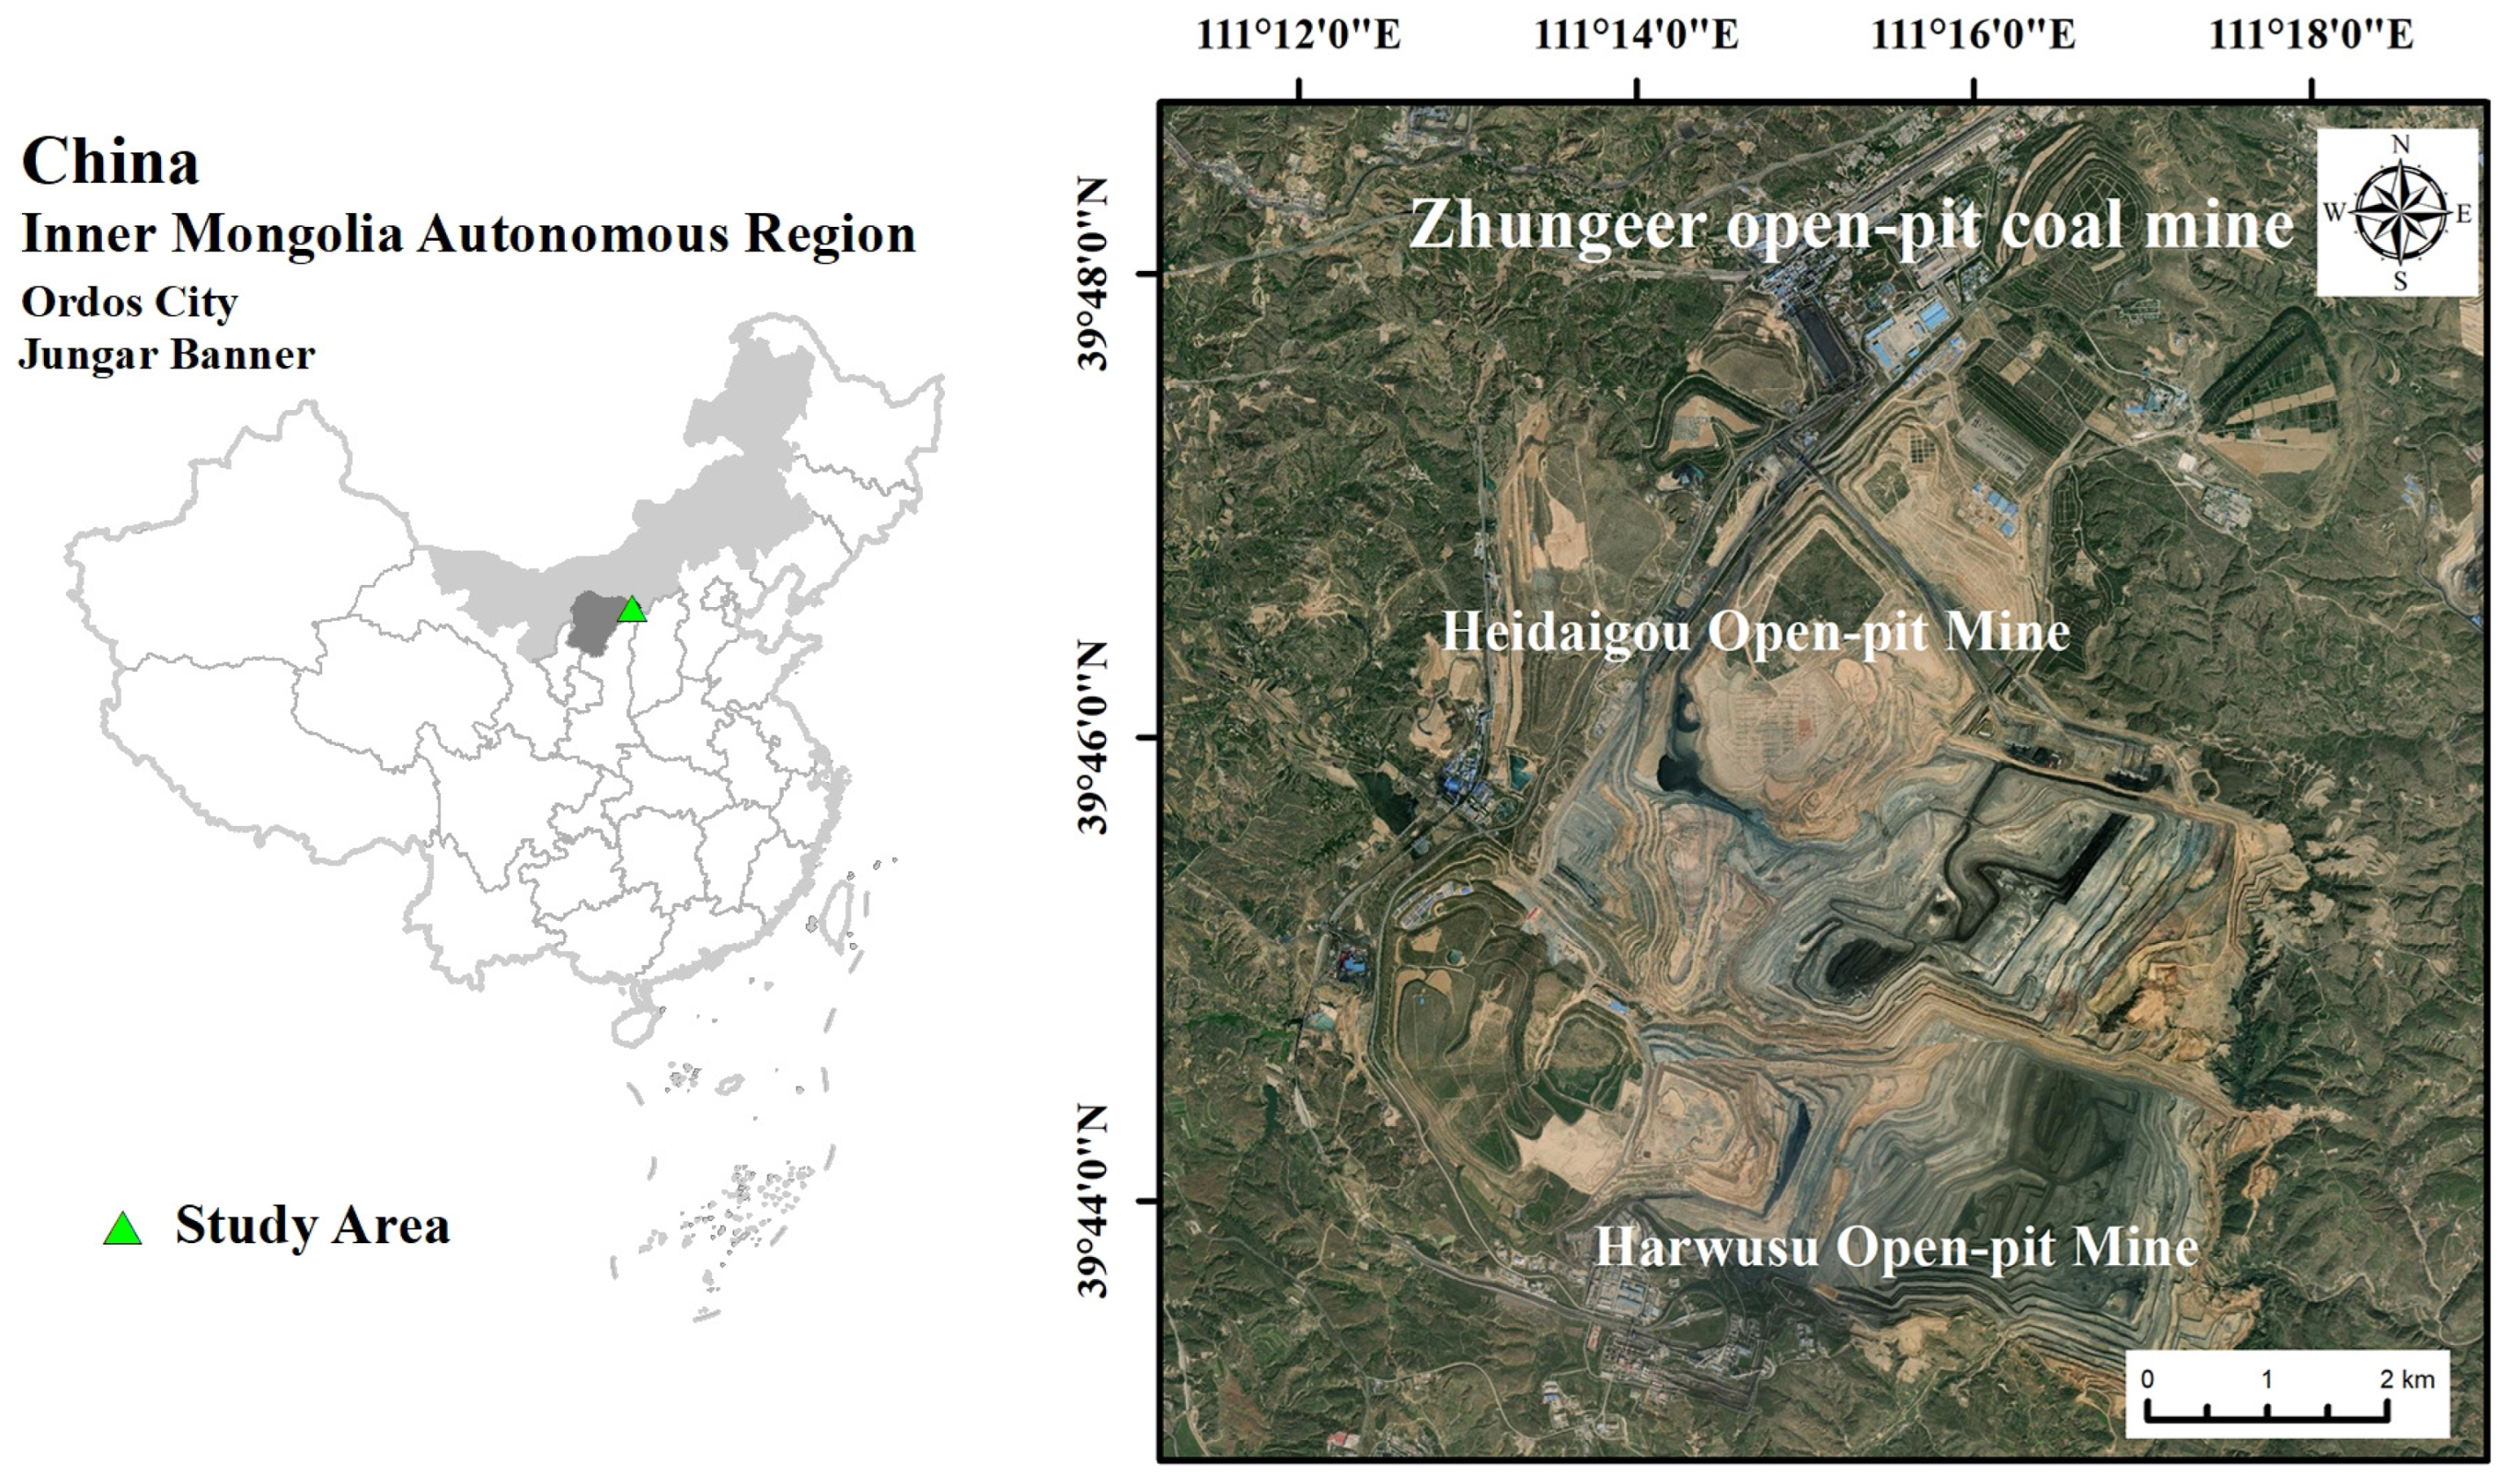
The Heidaigou and Harwusu open-pit mines, located in the southeastern part of Ordos City, Inner Mongolia, China, represent the largest open-pit coal mining area in Asia and lie within a typical arid and semi-arid region of China [23]. Over the past 30 years, mining activities have resulted in severe soil erosion and vegetation degradation, impairing the ecological functions of the landscape and increasing ecosystem stability. Furthermore, due to the mine’s special geographical position within the upper and middle reaches of the Yellow River basin, situated just 4.3 km from the river’s main flow, changes in landscape patterns and ecosystem stability directly affect the high-quality ecological development of the Yellow River basin and the environmental quality of nearby towns [24]. However, current research on the ecological environment of this area primarily focuses on geological disasters [25], vegetation and soil effects [26], and geological environmental monitoring [23], with limited attention to changes in landscape patterns. The expansion of pits and the restoration of vegetation in the Zhungeer open-pit coal mining area will alter the land types and landscape patterns within the mining area. Given the sensitivity of the research area, changes in land use and landscape patterns will significantly impact the ecological quality of the upper and middle reaches of the Yellow River basin. Hence, examining the land use, landscape pattern evolution, and ecosystem stability changes in the Zhungeer open-pit coal mining area is of critical scientific importance.
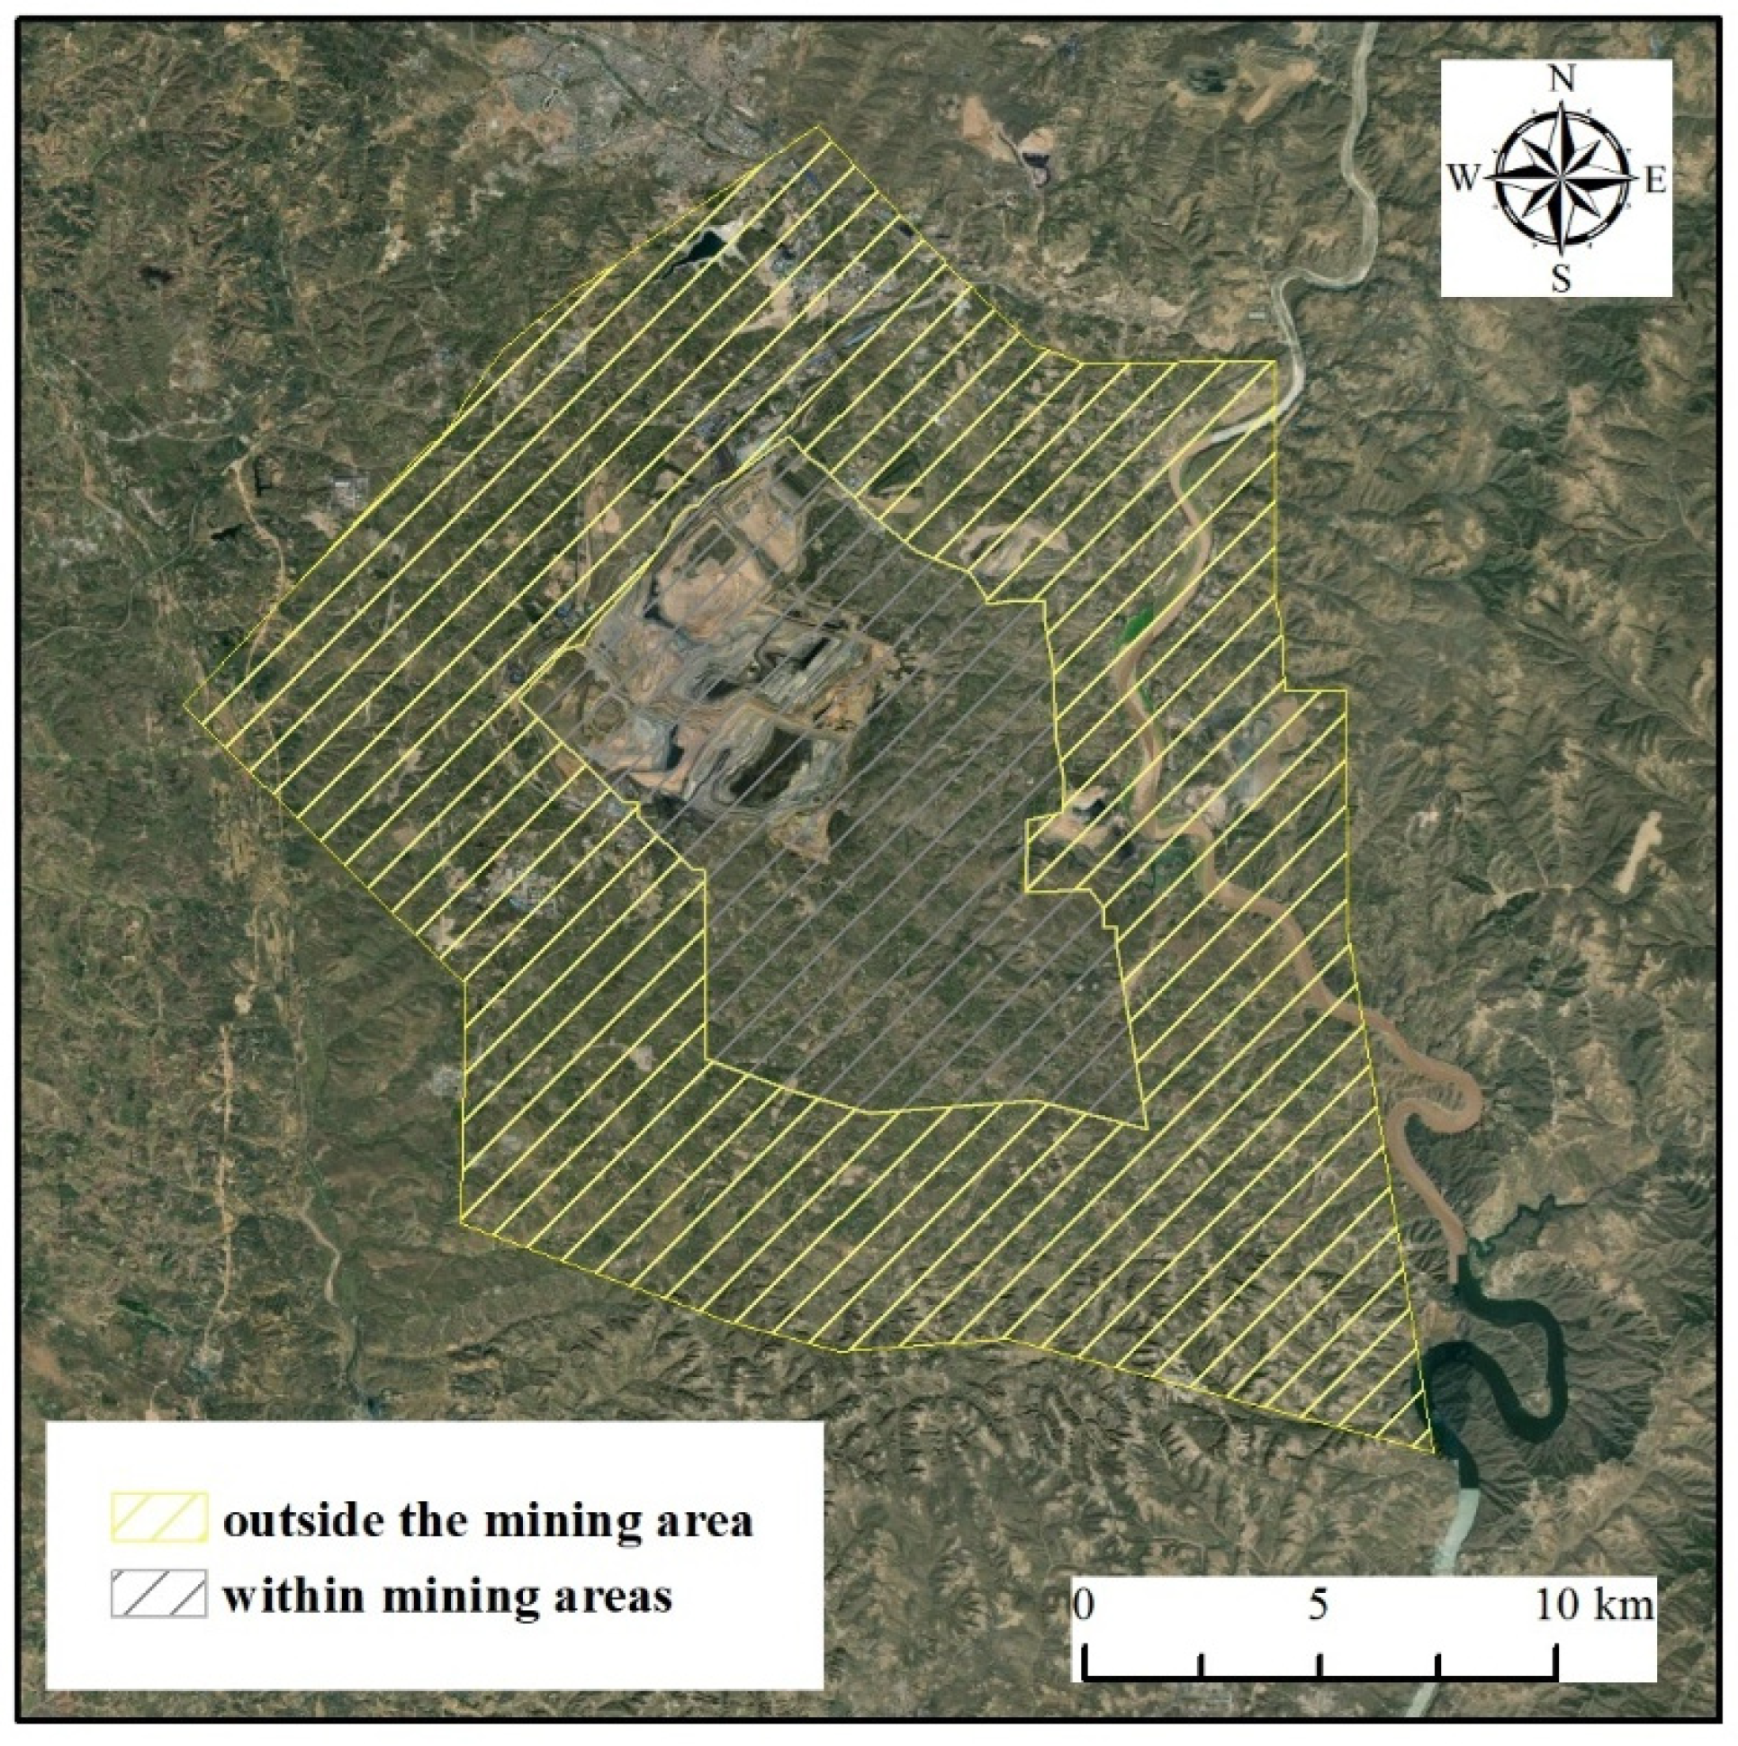
This research focuses on the zhungeer open-pit coal mining area in China and, for the first time, proposes the “Collaborative Ecological Risk Assessment Model for Internal and External Dimensions of Open-Pit Coal Mining Areas”. This model breaks through the limitations of traditional studies that have solely concentrated on the ecological effects within the mining site. Integrating landscape pattern indices with ecological vulnerability assessment models facilitates the quantitative classification of the impacts of mining activities on both the internal and external ecological environments. The objectives of the study are as follows: (1) to construct a land use transition matrix encompassing the entire cycle from preconstruction of the mining area to its official production transfer and the balance between mining activities and ecological restoration, using the China Land Cover Dataset (CLCD) from 1985 to 2020; (2) to establish a multitemporal ecological index and landscape pattern index using Landsat TM/OLI remote sensing images from eight time points between 1985 and 2020, thereby facilitating an analysis of the dominant interrelations between vegetation and mining (bare land) within the mining area; and (3) to provide a quantitative basis for future vegetation restoration and ecological rehabilitation strategies in the Zhungeer open-pit coal mining area and other open-pit coal mining regions across the country based on evaluations and analyses of landscape pattern evolution. The research outcomes aim to provide scientific support for ecosystem stability prevention and sustainable development in the region encompassing the Zhungeer open-pit coal mining area.

2. Materials and Methods

2.1. Overview of the Study Area and Mining Situation

The study area is located within the jurisdiction of the Zhungeer Energy Group’s Heidaigou Open-Pit Coal Mine and the Harwusu Open-Pit Coal Mine in the Zhungeer Banner, Inner Mongolia (110°49′10″E to 111°25′55″E, 39°25′7″N to 40°2′21″N), as illustrated in Figure 1. This region lies between the hilly gully area of the Loess Plateau and the eastern edge of the Kubuqi Desert, belonging to the midstream basin of the Yellow River. The area suffers from significant land desertification and exhibits a fragile ecological environment, which has been exacerbated by continuous capacity expansion that has also led to ecological degradation. The eastern boundary of the mining area is located a mere 4.3 km from the mainstream of the Yellow River. It experiences a typical temperate continental climate with distinct seasons; the average annual temperature for the entire banner ranges from 6.2 °C to 8.7 °C. The annual average precipitation in Zhungeer Banner is approximately 400 mm, predominantly concentrated from July to September, while the annual sunshine hours total around 3000 [23]. The predominant soil type is cinnamon soil, placing the region within a typical transitional zone between grassland and desert steppe, as well as being a representative area of the agricultural-pastoral interspersed zone in northern China. The principal species in the grassland vegetation community include Stipa capillata (bensho grass), Stipa grandis (Kazakhe grass), Lespedeza daurica (Daurian lespedeza), and Thymus mongolicus (Mongolian thyme) [27].
The Heidaigou Open-Pit Coal Mine, located on the northern side of the study area, is a large-scale open-pit coal mine designed and constructed independently by China. Construction began in 1990, trial production commenced in 1998, and full-scale production officially began in 1999. As of 2023, after undergoing multiple expansions and capacity upgrades, the annual raw coal production capacity has reached 34 million tons. The Harwusu Open-Pit Coal Mine to the south began construction in 2006 and was completed and put into operation in 2008, with a designed service life of 79 years and an annual raw coal production capacity of 35 million tons. Throughout the advancement of mining operations in both the northern and southern open-pit mines, the boundaries of the mining area have gradually merged as the positions of the pits have shifted, thus making this region a focal point for ecological research within the mining sector.

2.2. Sources of Data

2.2.1. Boundary Data of the Coal Mining Area

The boundary data of two open-pit coal mines encompassed by the research area were obtained from the official National Mining Rights Investigation and Extraction Information Disclosure System of the Ministry of Natural Resources of China [28]. Initially, this study extracted the coordinates of the key points defining the mining area from the system. Subsequently, these coordinates were converted into a spatial data structure in accordance with their sequential arrangement, thereby precisely delineating the geographical boundaries of the research area. This transformation process not only assures the accuracy of the research area but also provides essential data support for subsequent Geographic Information System (GIS) analyses and remote sensing data processing.

2.2.2. Remote Sensing Digital Imagery

In this study, we processed remote sensing images using ENVI 5.6 software and conducted land use change analysis and ecological index statistics using ArcGIS 10.8 [29]. This primarily involved utilizing the Landsat data series, including Landsat 5 and Landsat 8. The Landsat datasets were downloaded from the United States Geological Survey (USGS) [30]. The initial time frame was set to 1985, with an interval of five years, encompassing a total of eight years to acquire all remote sensing digital imagery of the research area up to the present (given that data from 1985 were unavailable, imagery from 1986 was selected as a substitute). Subsequently, we conducted further analyses on the Landsat data, calculating surface temperature and vegetation indices through band computations. Detailed information about the datasets employed is presented in Table 1.

2.2.3. Land Use Data

We utilized the Chinese 30 m Land Cover Data Set (CLCD) from 1985 to 2022, with the initial year set to 1985 and the dataset now updated to 2022. These data are based on the Google Earth Engine platform and employ Landsat series satellite imagery, utilizing methodologies such as random forests, spatiotemporal filtering, and logical post-processing. The overall classification accuracy reached 79.31%, and it demonstrated a satisfactory consistency with other thematic products in terms of changes in forest vegetation, water bodies, and impervious surfaces over time. In alignment with the timeline of mining activities, we selected datasets coinciding with the timestamps of the remote sensing digital imagery for our analysis. The processing steps included extraction of masks, reprojection, and background value setting, which facilitated subsequent calculations of the spatiotemporal distribution of land use [31].

2.2.4. Excavation Pits and Vegetation Restoration Areas

Leveraging historical remote sensing imagery data and employing multitemporal analysis, we can extract the spatial distribution and dynamic changes in excavation pits over the years, while simultaneously monitoring the extent of vegetation restoration and its evolutionary trends. In conjunction with time series analysis, we can delineate the processes of expansion or contraction of the excavation pits. Furthermore, we assess the extent and degree of vegetation recovery surrounding these pits, quantifying the spatiotemporal variations between the pits and the restored vegetation. This approach provides a scientific basis for evaluating the effectiveness of ecological restoration in mining areas and for future planning.

2.3. Image Processing and Classification

2.3.1. Remote Sensing Image Processing

After downloading the Landsat 5 and Landsat 8 data from the United States Geological Survey (USGS) website, a series of preprocessing steps were carried out using ENVI 5.6 software, including radiometric calibration [32], atmospheric correction [32], geometric precision correction [33], and mask clipping [34]. The Radiometric Calibration function was selected, with the Calibration Type set to Radiance, Output Interleave set to BIL, Output Data Type set to Float, and the Scale Factor set to 0.10. The Apply FLAASH Settings option was then selected.
After completing the radiometric calibration, the generated file was used for FLAASH Atmospheric Correction. In the Radiance Scale Factors interface, the option “use single scale factor for all bands” was selected. Furthermore, the image center coordinates (latitude and longitude) and imaging time were automatically read. Based on the study area’s location and the time of acquisition, the Atmospheric Model was set to Mid-Latitude Summer, and the Aerosol Model was set to Rural, while the remaining settings were kept at their default values.

2.3.2. Vector Extraction of Excavation Pits and Vegetation Restoration

In this study, we utilized the eCognition Developer v9.0.2 platform to perform vectorization on historical remote sensing images following mask extraction, thereby ensuring the accurate delineation of excavation pits and vegetation restoration areas [35]. The specific operational steps are as follows:
First, within the eCognition software v9.0.2, we employed the Multiresolution Segmentation tool to conduct multiscale segmentation on multiple remote sensing images. This method integrates spectral information, shape characteristics, and compactness parameters to categorize the images into objects with similar attributes. To guarantee the precision of the segmentation results meets the requirements for extracting excavation pits and vegetation restoration areas, we set the Scale Parameter to 10, enabling an effective representation of detail features while preventing both over-segmentation and under-segmentation.
Subsequently, after completing the segmentation, we exported the results as vector data and performed further processing within the ArcGIS 10.8 platform. In ArcGIS 10.8, we utilized the attribute filling function to assign corresponding classification attributes (excavation pits and vegetation restoration areas) to the segmented vector objects, and we conducted merging operations on similar patches to create cohesive units for subsequent analysis. The merged vector data provides a clearer depiction of the spatial distribution characteristics of the excavation pits and vegetation restoration areas.
Finally, employing the spatial analysis tools in ArcGIS 10.8, we calculated the areas of the excavation pits and vegetation restoration zones, which furnishes quantitative foundations for subsequent monitoring of dynamic changes and evaluations of ecological restoration effectiveness.

2.3.3. Calculation of NDVI

The Normalized Difference Vegetation Index (NDVI) is a crucial metric in the field of remote sensing, utilized to assess the extent of vegetation cover in a specific area. Its calculation is founded on the reflectance values of the red and near-infrared wavelengths [33,34]. NDVI can be computed using the ratio of the reflectance values from the infrared band to that of the near-infrared band in remote sensing digital images, as expressed in the following formula:
N D V I = N I R R e d N I R + R e d
In the aforementioned formula, NIR and Red denote the near-infrared band and the red band within the image, respectively. To investigate the relationship between NDVI and land surface temperature, this study computed NDVI values. The findings reveal that NDVI values fluctuate within a range of −1.0 to 1.0; higher values signify a stronger level of vegetation cover in the area, correlating with improved vegetative health. This phenomenon arises from the high reflectance of green vegetation in the near-infrared band combined with lower reflectance in the visible light band. Conversely, the reflectance of rocky surfaces and bare soil is relatively low, resulting in NDVI values typically falling between +0.8 and +0.65. Elevated NDVI values suggest greater canopy density and greenness, while the NDVI values for exposed soils and rocks approach zero. In contrast, the NDVI values for aquatic regions yield negative results. However, NDVI is highly sensitive to soil moisture and plant water content, meaning that temperature and precipitation can cause fluctuations in NDVI values. Additionally, in regions where the spectral reflectance of soil and vegetation overlap, this index may not effectively distinguish between different types of land cover.

2.3.4. Calculation of NDBI

The application of the Normalized Difference Built-up Index (NDBI) in ecological research within mining areas primarily focuses on several key aspects: monitoring land cover changes in mining regions, assessing environmental impacts of mining activities, and analyzing the effectiveness of ecological restoration efforts [15,36]. During the process of mine development, large-scale land excavation, ecological degradation, and rapid changes in land use pose significant challenges, with green spaces and natural areas increasingly replaced by built environments and industrial land. Therefore, NDBI can be employed to evaluate the ecological environment of mining sites. The NDBI is calculated using the reflectance values from the shortwave infrared (SWIR) and near-infrared (NIR) bands in remote sensing imagery, and the formula is as follows:
N D B I = S W I R N I R S W I R + N I R
In the aforementioned formula, the shortwave infrared (SWIR) band and the near-infrared (NIR) band correspond to band 5 and band 4 of the Landsat TM sensor, as well as band 6 and band 5 of the Landsat OLI sensor, respectively.
The NDBI values typically range from [−1, 1]; when NDBI > 0, the surface is predominantly comprised of built environments; when NDBI < 0, the surface is primarily characterized by vegetation, bare land, or water bodies; and when NDBI ≈ 0, it may indicate a mixed surface. NDBI can be integrated with land surface temperature (LST) data to explore the relationship between urban development, mining activities, and regional ecological environments. Coal mining areas generally exhibit elevated temperatures, thereby facilitating the analysis of ecological evolution and expansion within the region. However, in urban areas with complex terrain or multilayered buildings, the reflectance of NDBI may be influenced by the mixed pixel effect. At the same time, NDBI can also be affected by shadows, water bodies, or other features, leading to inaccurate results.

2.4. Calculation of Landscape Patterns

Utilizing the mining area boundaries obtained in Section 2.2.1, the CLCD data delineate the boundaries of the mining area, with the internal regions of the mining boundaries defined as the mining scale. Taking into account the distance from the study area to towns, a 5 km outward buffer is established as the regional scale, simultaneously serving as a non-mining area for subsequent analyses [6] (Figure 2).
Based on the aforementioned distinction between mining and non-mining areas, image data are cropped using various vector extents. Furthermore, due to the consistency requirements of the Fragstats 4.2 software, all data projections are redefined to a uniform standard of WGS 1984 UTM Zone 48N [11]. The land cover data attributes are linked by setting the ID and type fields in the attribute table, while a background value of −9999 is established to prevent the occurrence of anomaly values and associated errors during calculations [37].

2.4.1. Patch Density

Patch density (PD) is a significant metric for assessing the degree of landscape fragmentation [38]. It reflects the quantity of a specific type of patch within a unit area, calculated as the number of patches divided by the total area of the landscape (measured in hectares). It is computed using the following formula:
P D = N A
In the formula, N represents the total number of patches within the landscape (which may refer to the number of patches of a specific land use type or the overall number of patches within the entire landscape), while A denotes the total area of the landscape (commonly derived from pixel area in remote sensing imagery). This indicator aids in evaluating the heterogeneity and fragmentation of the landscape. A higher PD value indicates greater landscape heterogeneity and fragmentation, suggesting closer distances between patches, which may restrict ecological functions; conversely, a lower patch density implies greater connectivity or overall integrity of the landscape [18,39].

2.4.2. SPLIT

Landscape fragmentation (SPLIT) is a commonly used metric for assessing the degree of landscape fragmentation, particularly in evaluating the uniformity of landscape patch distribution and the extent of spatial isolation [18,40]. The SPLIT index measures fragmentation by taking into account the number, size, shape, and relative distribution of landscape patches. The calculation formula is as follows:
S P L I T = i = 1 N ( P i / A ) N
In the formula, Pi represents the perimeter of the i-th patch; A denotes the total area of the landscape; and N indicates the number of patches within the landscape. Generally, the SPLIT index ranges from 0 to infinity, with higher SPLIT values typically signifying fragmentation of ecological habitats within the landscape, hindering interconnection among biological populations and disrupting species migration, thereby resulting in lower biodiversity. Conversely, lower SPLIT values usually suggest a more continuous habitat in the landscape, facilitating species migration and gene flow, and thereby enhancing biodiversity [9,41].

2.4.3. Shannon’s Diversity Index

Shannon’s Diversity Index (SHDI) is a measure employed to assess the diversity of geographical landscapes [10,42]. This index is grounded in the concept of information entropy and is utilized to describe the distribution and quantity of different types of patches within the landscape, thereby facilitating the evaluation of ecosystem health and biodiversity. The calculation formula is as follows:
S H D I = i = 1 m p i ln p i
In the expression, m denotes the number of patch types within the landscape (i.e., the number of species), while pi represents the proportion of the i-th patch type, calculated according to the following formula:
p i = A i A t o t a l
In the formula, Ai signifies the total area of the i-th patch type, while Atotal represents the total area of the landscape. A higher Shannon’s Diversity Index indicates a greater presence of biodiversity and ecosystem health within the landscape. If the landscape comprises numerous patch types that are evenly distributed, this reflects a high level of diversity, potentially indicating greater ecological stability and a rich variety of habitat types. Conversely, if the landscape features few patch types, or if a particular type predominates, this suggests low diversity, implying that the ecosystem may be homogenized or significantly disturbed [43].

2.4.4. Shannon’s Evenness Index

The Shannon’s Evenness Index (SHEI) is a metric developed based on the Shannon’s Diversity Index (SHDI) to assess the degree of uniform distribution of patch types within a landscape [43]. The calculation formula is as follows:
S H E I = S H D I ln ( m )
The calculation method for the Shannon’s Diversity Index (SHDI) has been previously described. In this formula, m represents the number of patch types present in the landscape. When the proportions of each patch type are perfectly equal, the SHDI reaches its maximum value, which is given by ln(m). The values of the Shannon’s Evenness Index (SHEI) range from 0 to 1. A SHEI value approaching 0 indicates that certain patch types dominate the landscape, suggesting disturbances within the ecosystem or a homogenization of landscape functions. In contrast, a SHEI value nearing 1 signifies a more uniform distribution of various patch types, reflecting a well-balanced landscape structure and greater ecosystem stability [41].

2.4.5. Patch Richness Density

Patch Richness Density (PRD) is an indicator that measures the diversity of patch types within a landscape, reflecting the number of patch types per unit area [38,39]. Unlike Patch Richness (PR), which quantifies the total number of patch types without considering area, PRD emphasizes the influence of landscape area on richness, making it more suitable for comparative analysis across landscapes of varying scales. The calculation formula is as follows:
P R D = P R A t o t a l
In the formula, PRD represents the total number of patch types within the landscape, while Atotal denotes the total area of the landscape, with the unit typically expressed as the number of patch types per unit area. A higher PRD value indicates a greater number of patch types per unit area, suggesting a higher level of landscape diversity and reflecting a rich array of ecological functions and habitat types. Conversely, a lower PRD value signifies fewer patch types per unit area, which may indicate a more homogenized landscape or one that has been significantly impacted by human disturbances [39].
The Fitness Index (FI) serves as a metric for assessing the resilience of an ecosystem by integrating the diversity, structural complexity, and evenness of the ecological system. The formula is as follows:
F I = W 1 S H D I + W 2 P R D + W 3 S H E I
In this formula, W1, W2, and W3 represent the weights assigned to the Shannon Diversity Index, the Patch Richness Density Index, and the Shannon Evenness Index, respectively, with the total weight summing to 1. The terms SHDI, PRD, and SHEI denote the standardized corresponding indicator values. A higher FI value signifies a region’s ecosystem characterized by greater diversity, a more uniform distribution, and greater structural complexity, indicating a robust resilience and stability of the system. Conversely, a lower FI value indicates impairment in the functions of the regional ecosystem and a diminished capacity for recovery.

3. Results

3.1. Spatiotemporal Analysis of Land Use Change

3.1.1. Spatiotemporal Changes in Land Use and Transition Matrix in the Study Area

The primary land use types in the study area include shrubland, farmland, grassland, bare land, and built-up areas. Mining activities have exerted a significant influence on land use patterns, with mining pits and related land parcels categorized as bare land due to the ongoing extraction processes. Facilities such as factories and industrial squares within the mining area are classified as impervious surfaces (as illustrated in Figure 3). The alterations in these land use types reflect the disruption of natural ecosystems caused by mining development and its spatiotemporal expansion characteristics.
Throughout the 35-year study period, the area of farmland has exhibited a persistent decline, a trend likely associated with the expansion of mining operations, land occupation, and the conversion of agricultural land to other types of use. Concurrently, the areas of grassland, bare land, and impervious surfaces have been continuously increasing, particularly the rise in bare land, which directly signifies the impact of mining activities on surface vegetation degradation. The expansion of impervious surfaces indicates a gradual increase in the scale of infrastructure development within the mining area. These changes not only reveal the profound impact of mining development on land use patterns but also provide essential grounds for further assessing the trends in ecological changes and the restoration potential of the mining environment.
Through a spatial statistical analysis of land use types in the study area over a 35-year period, coupled with a comparative examination of historical remote sensing imagery (as shown in Table 2 and Figure 4), it is observed that the total area of the study region measures 12,736.98 hectares, during which notable changes in land use patterns have occurred. The area of farmland has consistently diminished, plummeting from 3356.55 hectares in 1985 to 1036.31 hectares in 2020, with the primary transition being towards grassland. The area of grassland exhibited a trend of initial expansion followed by a decline, increasing from 291.33 hectares in 1985 to 665.97 hectares in 2020, and peaking around 2015 at 1435.33 hectares.
The open-pit mining activities have led to the stripping of surface soils, resulting in a significant increase in bare land, which escalated from 122.85 hectares prior to mining construction in 1985 to 1100.72 hectares in 2020, a substantial portion of which has transitioned from grassland. Furthermore, with the development of the coal mining area, the area of impervious surfaces (such as mining structures) has expanded annually, rising from 48.33 hectares in 1985 to 646.21 hectares in 2020; this increase is also primarily attributed to the conversion of grassland. These transformations reflect the profound impact of mining development on regional land use patterns.
Thus, it can be inferred that prior to 1985, the land use types in the study area were predominantly characterized by farmland. With the emergence of open-pit coal mining, a significant portion of the farmland was abandoned and subsequently converted to grassland. As the mining pits expanded, many grasslands transitioned to bare land and impervious surfaces. Notably, around 2010, a new land use type—forest—began to emerge within the study area, with its area gradually increasing. Since the Zhungeer Open-Pit Coal Mine began production in 1999, we define the period before 1990 as the premining stage and the period after 1990 as the post-mining stage. Independent samples t-tests were conducted on land use areas for the two stages. As shown in Table 2, except for the grassland category, the areas of other land use types showed significant differences before and after mining activities.

3.1.2. Temporal and Spatial Changes in the Area of Mining Pits and Vegetation Restoration

Through an analysis of the mining pit areas and vegetation restoration zones extracted via eCognition software, it is observed that the Kuangger Open-Pit Coal Mine area has exhibited a trend of southward expansion in mining pits over the 35-year study period, increasing from 405.14 hectares in 1990, the year of its establishment, to 2630.98 hectares by 2020, with continued growth anticipated. Conversely, the areas designated for vegetation restoration have demonstrated a notable expansion trend, exhibiting distinctive textures and patch shapes in remote sensing imagery, and appearing bright red in false-color composite images. Initially recorded at 7.11 hectares in 1995, the area of vegetation restoration has progressively increased, reaching 2204.87 hectares by 2020.
A synchronized comparison of Figure 5 and Figure 6 reveals that the Zhungeer mining area underwent extensive vegetation restoration around 2005, particularly in the northeastern section of the study area, where two substantial spoil sites began to take shape. The false-color imagery indicates that the vegetation in this region is thriving, characterized by a high canopy cover. Subsequently, between 2010 and 2020, two additional large vegetation restoration areas gradually emerged in the southwestern part of the study area, with these zones continuing to expand, highlighting the significant success of the restoration efforts.

3.2. Changes in Ecological Indices and Landscape Indices

3.2.1. Changes in NDVI

Using the Zonal Tool within the ArcGIS 10.8 platform to analyze the NDVI values of both the internal and external areas of the mining district, it was discovered that the mean NDVI value within the mining area before 1985 was approximately 0.04. Over the subsequent 35-year research period, this value exhibited fluctuations. Notably, the maximum NDVI value occurred in 1990, reaching 0.62, while the minimum value remained relatively stable. This stability is primarily attributed to the bare land created by the stripping of surface soil during coal extraction, as well as the strong spectral absorption of light by the black surfaces within the mining pits (Table 3). However, the NDVI mean value change curve indicates that despite the fluctuations, the overall NDVI values exhibited a gradual upward trend throughout the research period. This trend suggests that, under the influence of ecological restoration measures, the condition of vegetation has steadily improved.
In regard to the NDVI values outside the mining area, the mean NDVI consistently remained higher than that of the internal mining area at all time points, with similar patterns of change. This indicates that the vegetative condition in the external region is also gradually enhancing (Table 4). We may preliminarily conclude that the ecological initiatives implemented within the mining area have had a positive impact on the external environment. To further analyze the contribution of the internal mining area to the ecological quality of the external environment, we employed regression analysis to establish a relational model between the changes in mean NDVI within the mining area and those in the external region. A linear regression approach was utilized:
Δ N D V I A = N D V I A , l a t e r N D V I A , e a r l y
Δ N D V I B = N D V I B , l a t e r N D V I B , e a r l y
Δ N D V I B = α + β Δ N D V I A + ε
In this model, α represents the intercept, β signifies the contribution coefficient of Region A to Region B, and ɛ denotes the error term. The β value derived from the regression analysis serves to indicate the extent to which changes in the NDVI of Region A influence the NDVI of Region B. Specifically, a positive β suggests that an increase in the NDVI of Region A corresponds to an elevation in the NDVI of Region B.
Analysis of Figure 6 and Figure 7 reveals that the development of mining pits in the study area has progressed from north to south. Prior to the construction and development of the mining area, the overall vegetation conditions in the study area were poor. It was not until around 2000 that significant changes in the Normalized Difference Vegetation Index (NDVI) were observed, depicting a spatial distribution characterized by lower values in the north and higher values in the south—a trend that persisted until approximately 2015. By 2020, as the area of the mining pits continued to expand, the NDVI values within the pit areas remained low, while surrounding regions generally exhibited higher NDVI values, indicating a marked improvement in vegetation conditions across the study area. A further examination of the NDVI maps from 2000 to 2020 alongside the mean NDVI data (NDVImean) in Table 3 reveals a consistent improving trend in vegetation conditions over the past two decades, with a steady increase in NDVI values (Figure 8).
Utilizing the aforementioned method, the results displayed in Table 5 reveal a linear regression model described by the equation y = 1.016x + 0.0049. In this model, the β value is 1.016, indicating that for every unit increase in the NDVI value within the mining area, the mean NDVI of the external area increases by 1.016 units (Figure 9). This finding underscores a remarkably strong positive influence of changes occurring within the mining area on those in the external region, further demonstrating that the ecological initiatives implemented internally have significantly facilitated ecological restoration in the external environment.

3.2.2. Changes in NDBI

Similar to the fluctuations observed in NDVI distribution, the Normalized Difference Built-up Index (NDBI) within the mining area exhibited a relatively high value distribution during the early stages of mining development (1990), primarily attributable to the poor condition of vegetation at that time. Regions where NDBI > 0 were widely dispersed throughout the study area, indicating that built-up land predominated. However, around 1995, the area with NDBI < 0 gradually increased, reflecting an improvement trend in vegetation coverage. From 2000 to 2020, pixels with NDBI > 0 were predominantly concentrated within the mining pits, while the majority of the study area featured NDBI values below 0. This trend was particularly evident in several large-scale and high-intensity vegetative restoration sites, where the NDBI values were significantly low (see Table 6). Similarly, the NDBI values outside the mining area exhibited a consistently declining trend, demonstrating that the ecological initiatives implemented internally were influencing the external region, resulting in a predominance of vegetation-dominated pixel distributions(see Table 7).
Given that the NDBI value ranges from [−1, 1], with NDBI > 0 indicating built-up land and NDBI < 0 primarily representing vegetation and water bodies, the absence of significant ponded water surfaces within the study area allows us to interpret the pixels with NDBI < 0 essentially as indicators of vegetation coverage. Prior to the commencement of mining activities (before 1985), the mean NDBI value for the study area was 0.25 (see Table 4), suggesting that built-up land occupied a relatively large proportion.
Yet, as mining development progressed from 1990 to 1995, the NDBI values continued to rise, reflecting the ongoing expansion of built-up land. With the onset of mining production and the implementation of ecological restoration efforts, the NDBI values began to gradually decline. By 2020, the mean NDBI for the study area had dropped to −0.068, indicating that vegetation coverage has emerged as the dominant characteristic of the region(Figure 10). This change vividly illustrates the effectiveness of ecological restoration measures and their substantial contribution to the improvement of the mining area’s ecological environment.

3.2.3. Changes in Landscape Patterns

The PD value first decreases and then rises, particularly evident within the mining area. Prior to construction, the yellow earth gully patches exhibited a high density due to the influence of topography; however, during the extensive process of open-pit coal mining, interconnected bare land patches emerged, resulting in a decline in the PD value (Table 8).
Following the implementation of ecological restoration, a significant portion of the bare land was transformed into vegetation. However, the inability to connect these vegetative patches due to the presence of roads and other types of intervening patches resulted in an increase in the PD value once again (DIVISION, SPLIT) (Table 9).
In the early stages of construction, the SHDI within the mining area experienced a decline, indicating a reduction in biodiversity and a weakening of ecosystem health. However, following 2015, it began to rise, surpassing preconstruction levels. This suggests that coal mining activities have contributed to the restoration of the ecological conditions in the region, enhancing both biodiversity and the overall health of the ecosystem (Table 10, Figure 11).
In the initial stages of construction, the SHEI within the mining area decreased, indicating that the human activity of coal mining has led to an uneven distribution of landscape patches, disrupting the balance of the landscape structure and diminishing ecosystem stability. Similarly to the SHDI, the SHEI began to rise after 2015, signifying a restoration of uniformity in the distribution of landscape patches in the region, a gradual rebalancing of the landscape structure, and an enhancement of ecosystem stability.
The comprehensive calculation of the aforementioned indicators yielded a Fitness Index (FI), as illustrated in Table 11 and Figure 12, with weights assigned as follows: W1 = 0.2, W2 = 0.4, and W3 = 0.4. It was observed that the FI of the Zhungeer Open-pit Coal Mine was 0.3825 prior to its construction. As the coal mining activities progressed, the FI gradually declined, reaching a nadir of 0.31532 in 2015, after which it began to exhibit an upward trend. By 2020, the FI had rebounded to 0.35836. Generally, an FI greater than 0.7 indicates high adaptability, an FI between 0.4 and 0.7 signifies moderate adaptability, and an FI below 0.4 reflects low adaptability. This indicates that over the 35-year study period, the adaptability index of the Zhungeer Open-pit Coal Mine consistently remained below 0.4, categorizing the region as having a low base level of adaptability; however, since 2015, it has gradually approached a state of moderate adaptability.

4. Discussion

4.1. The Impact of Mining Activities on Regional Land Use

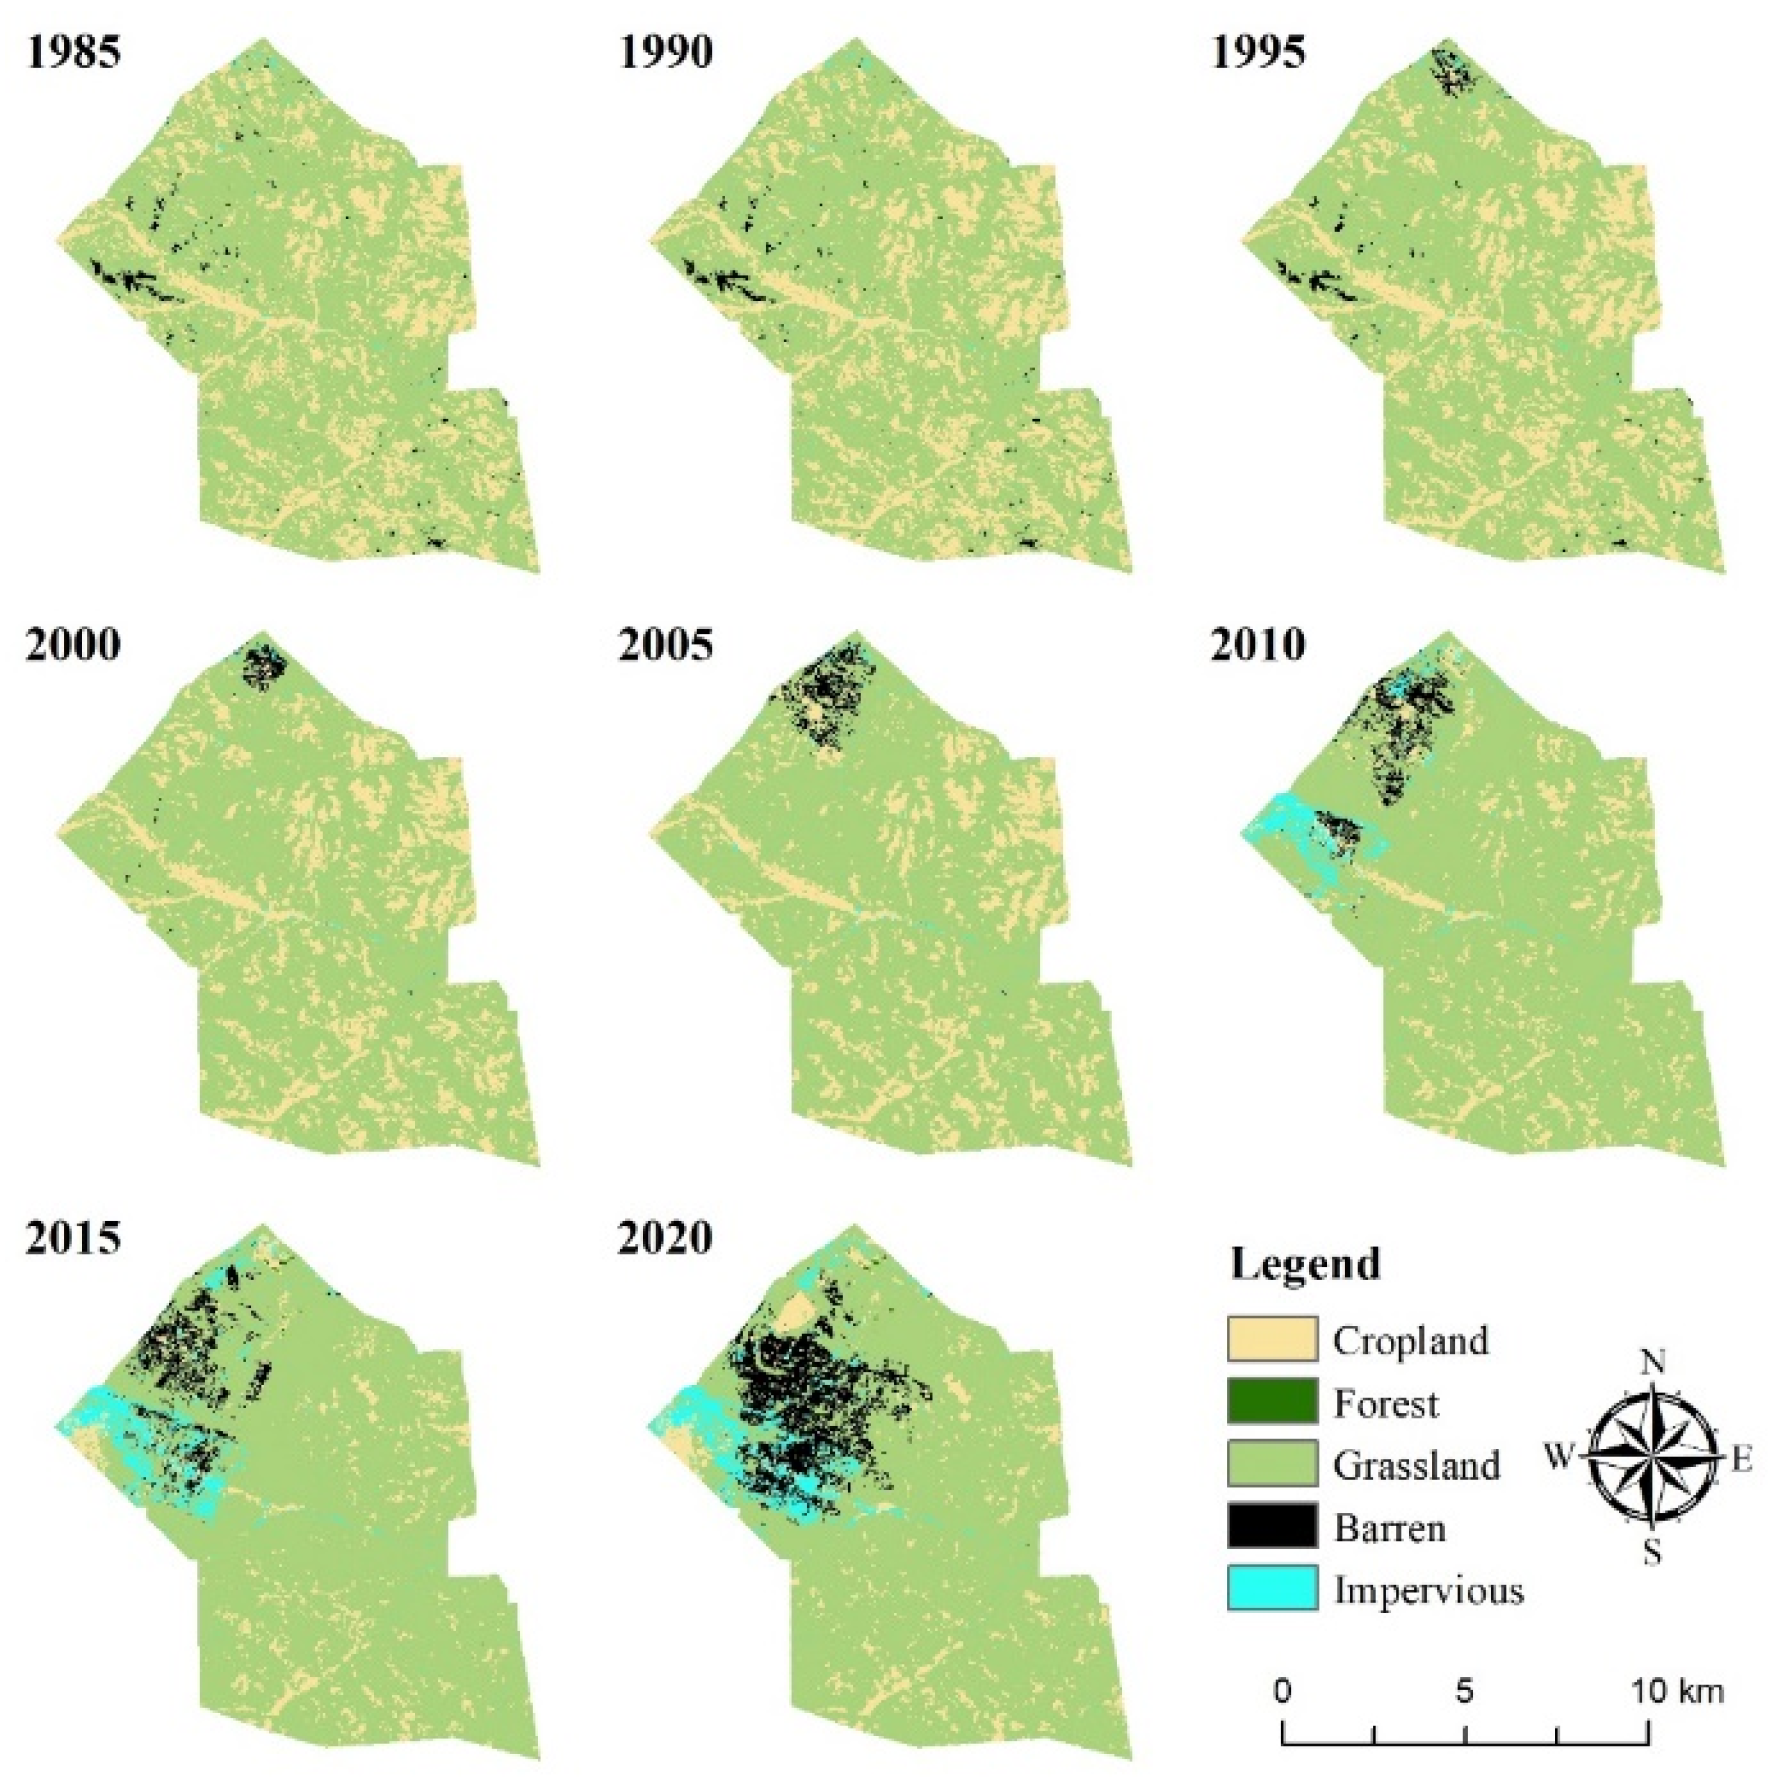
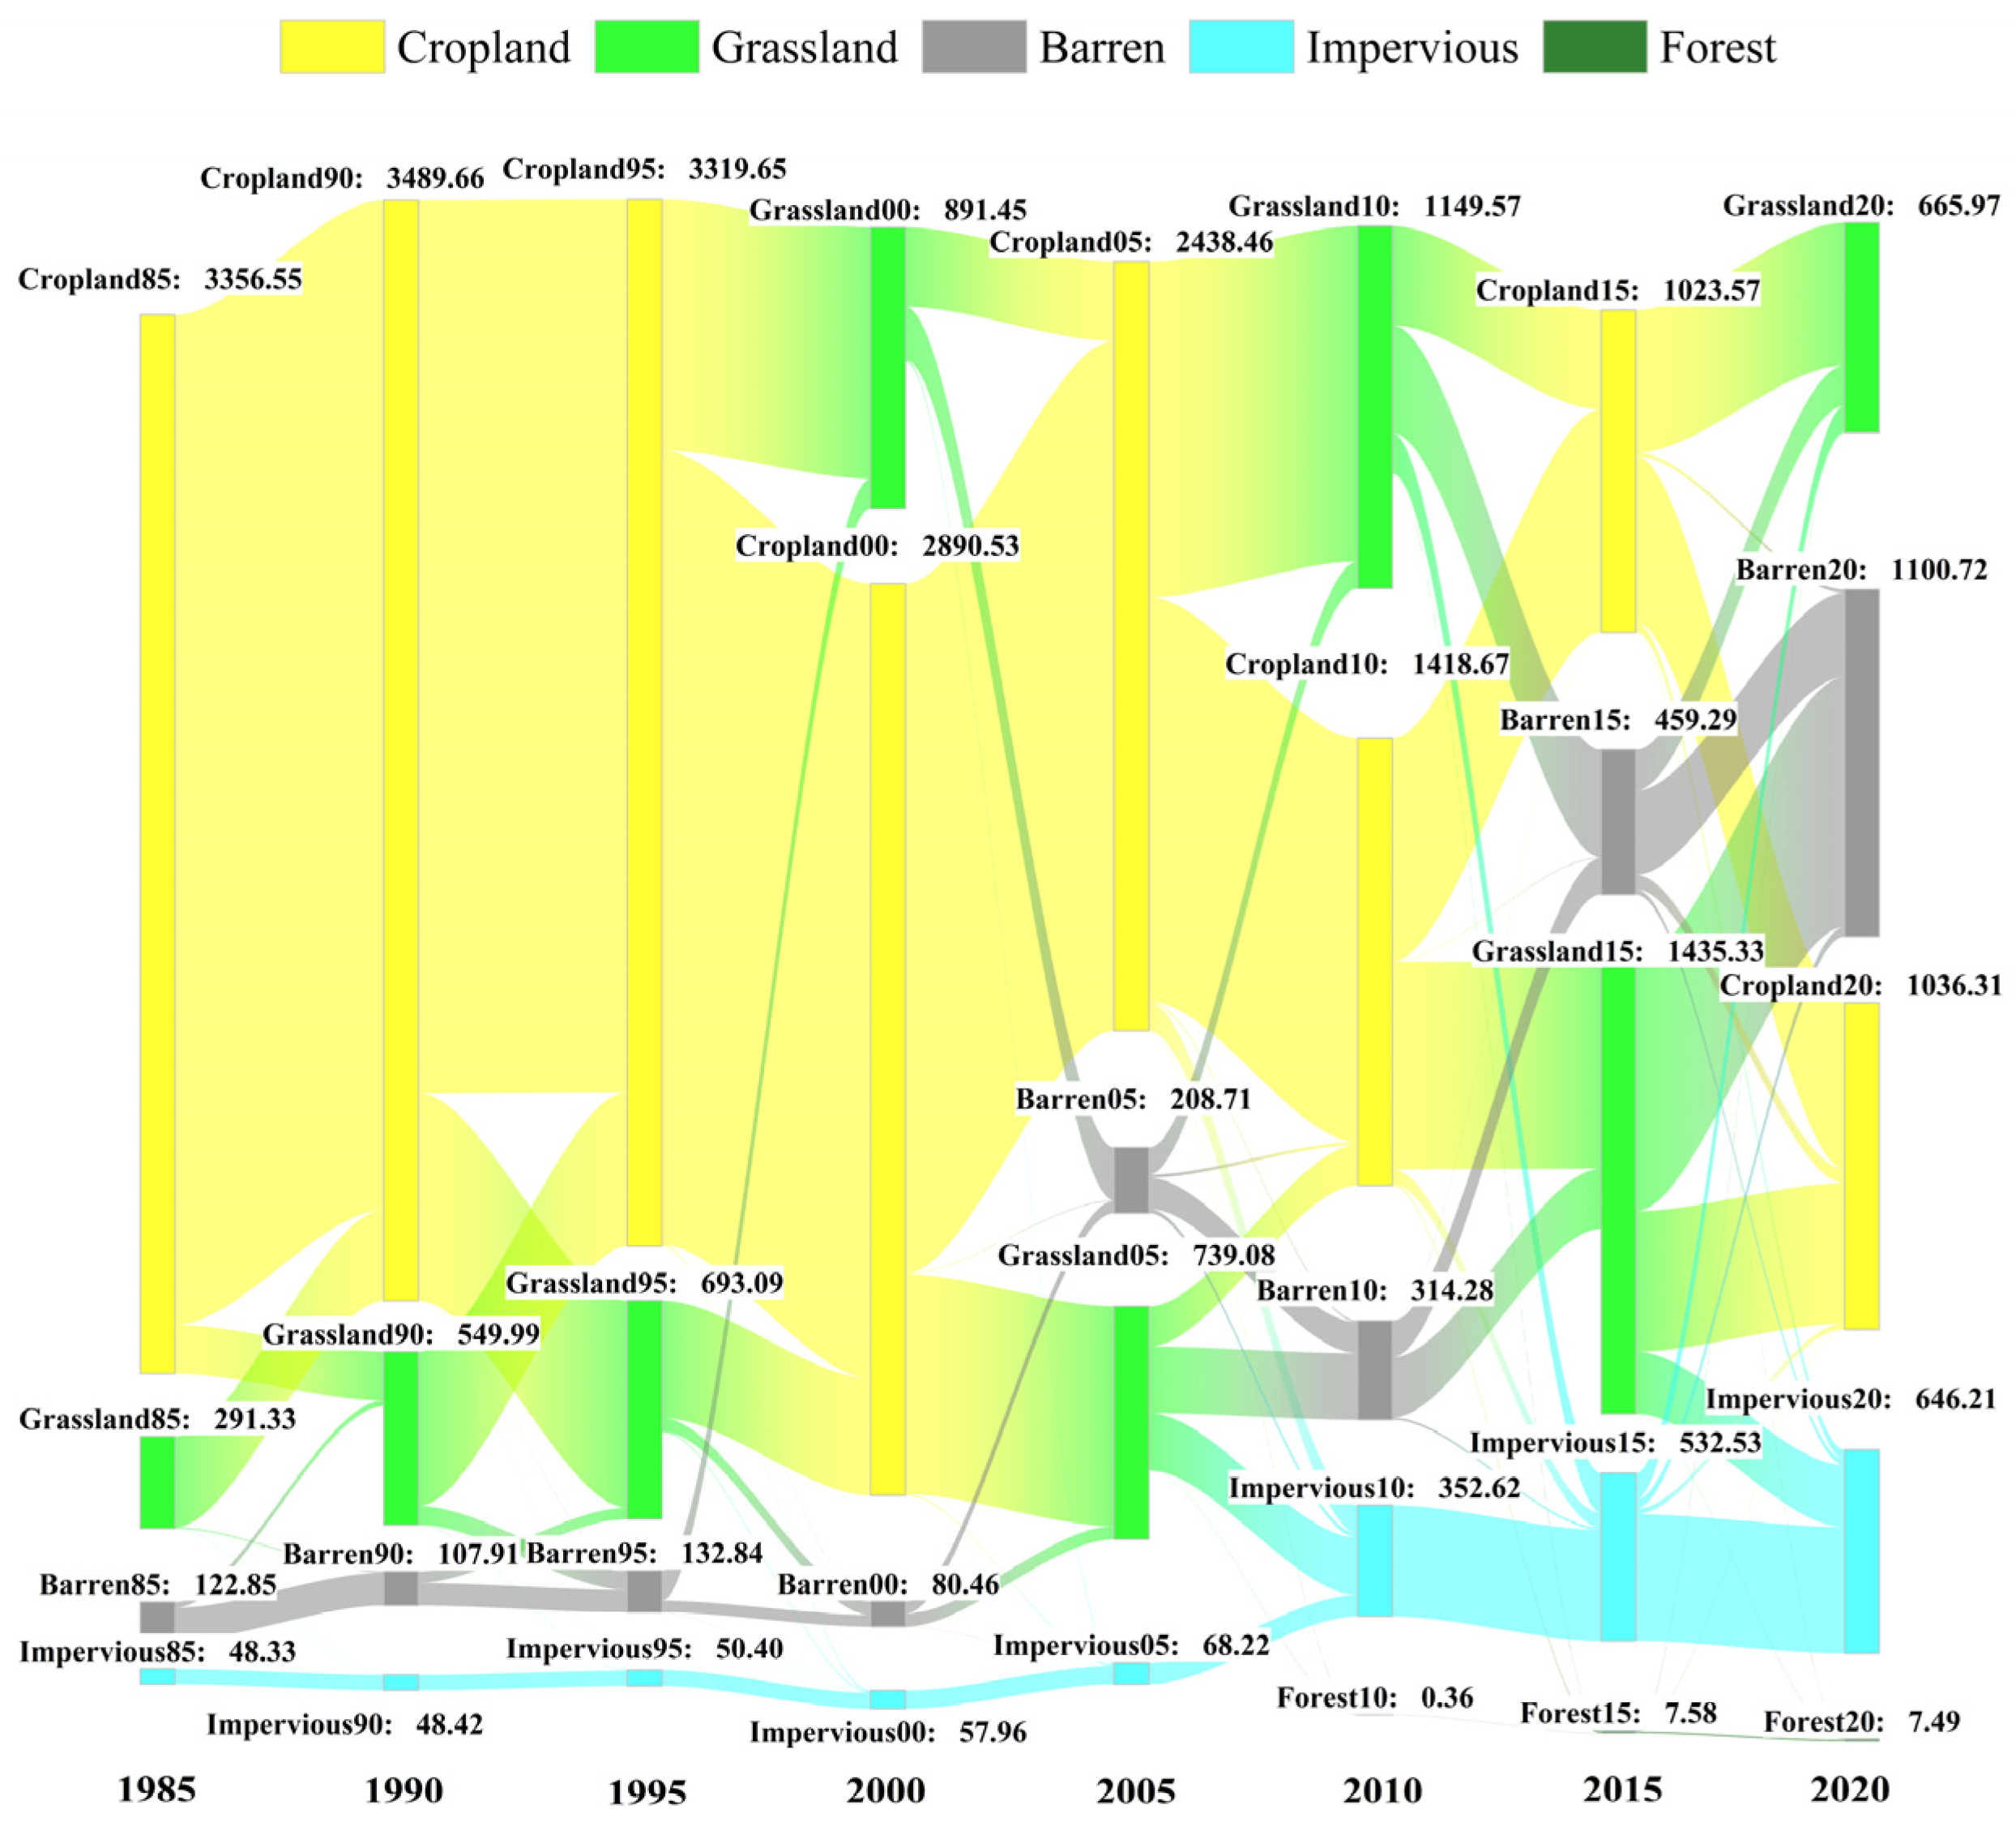
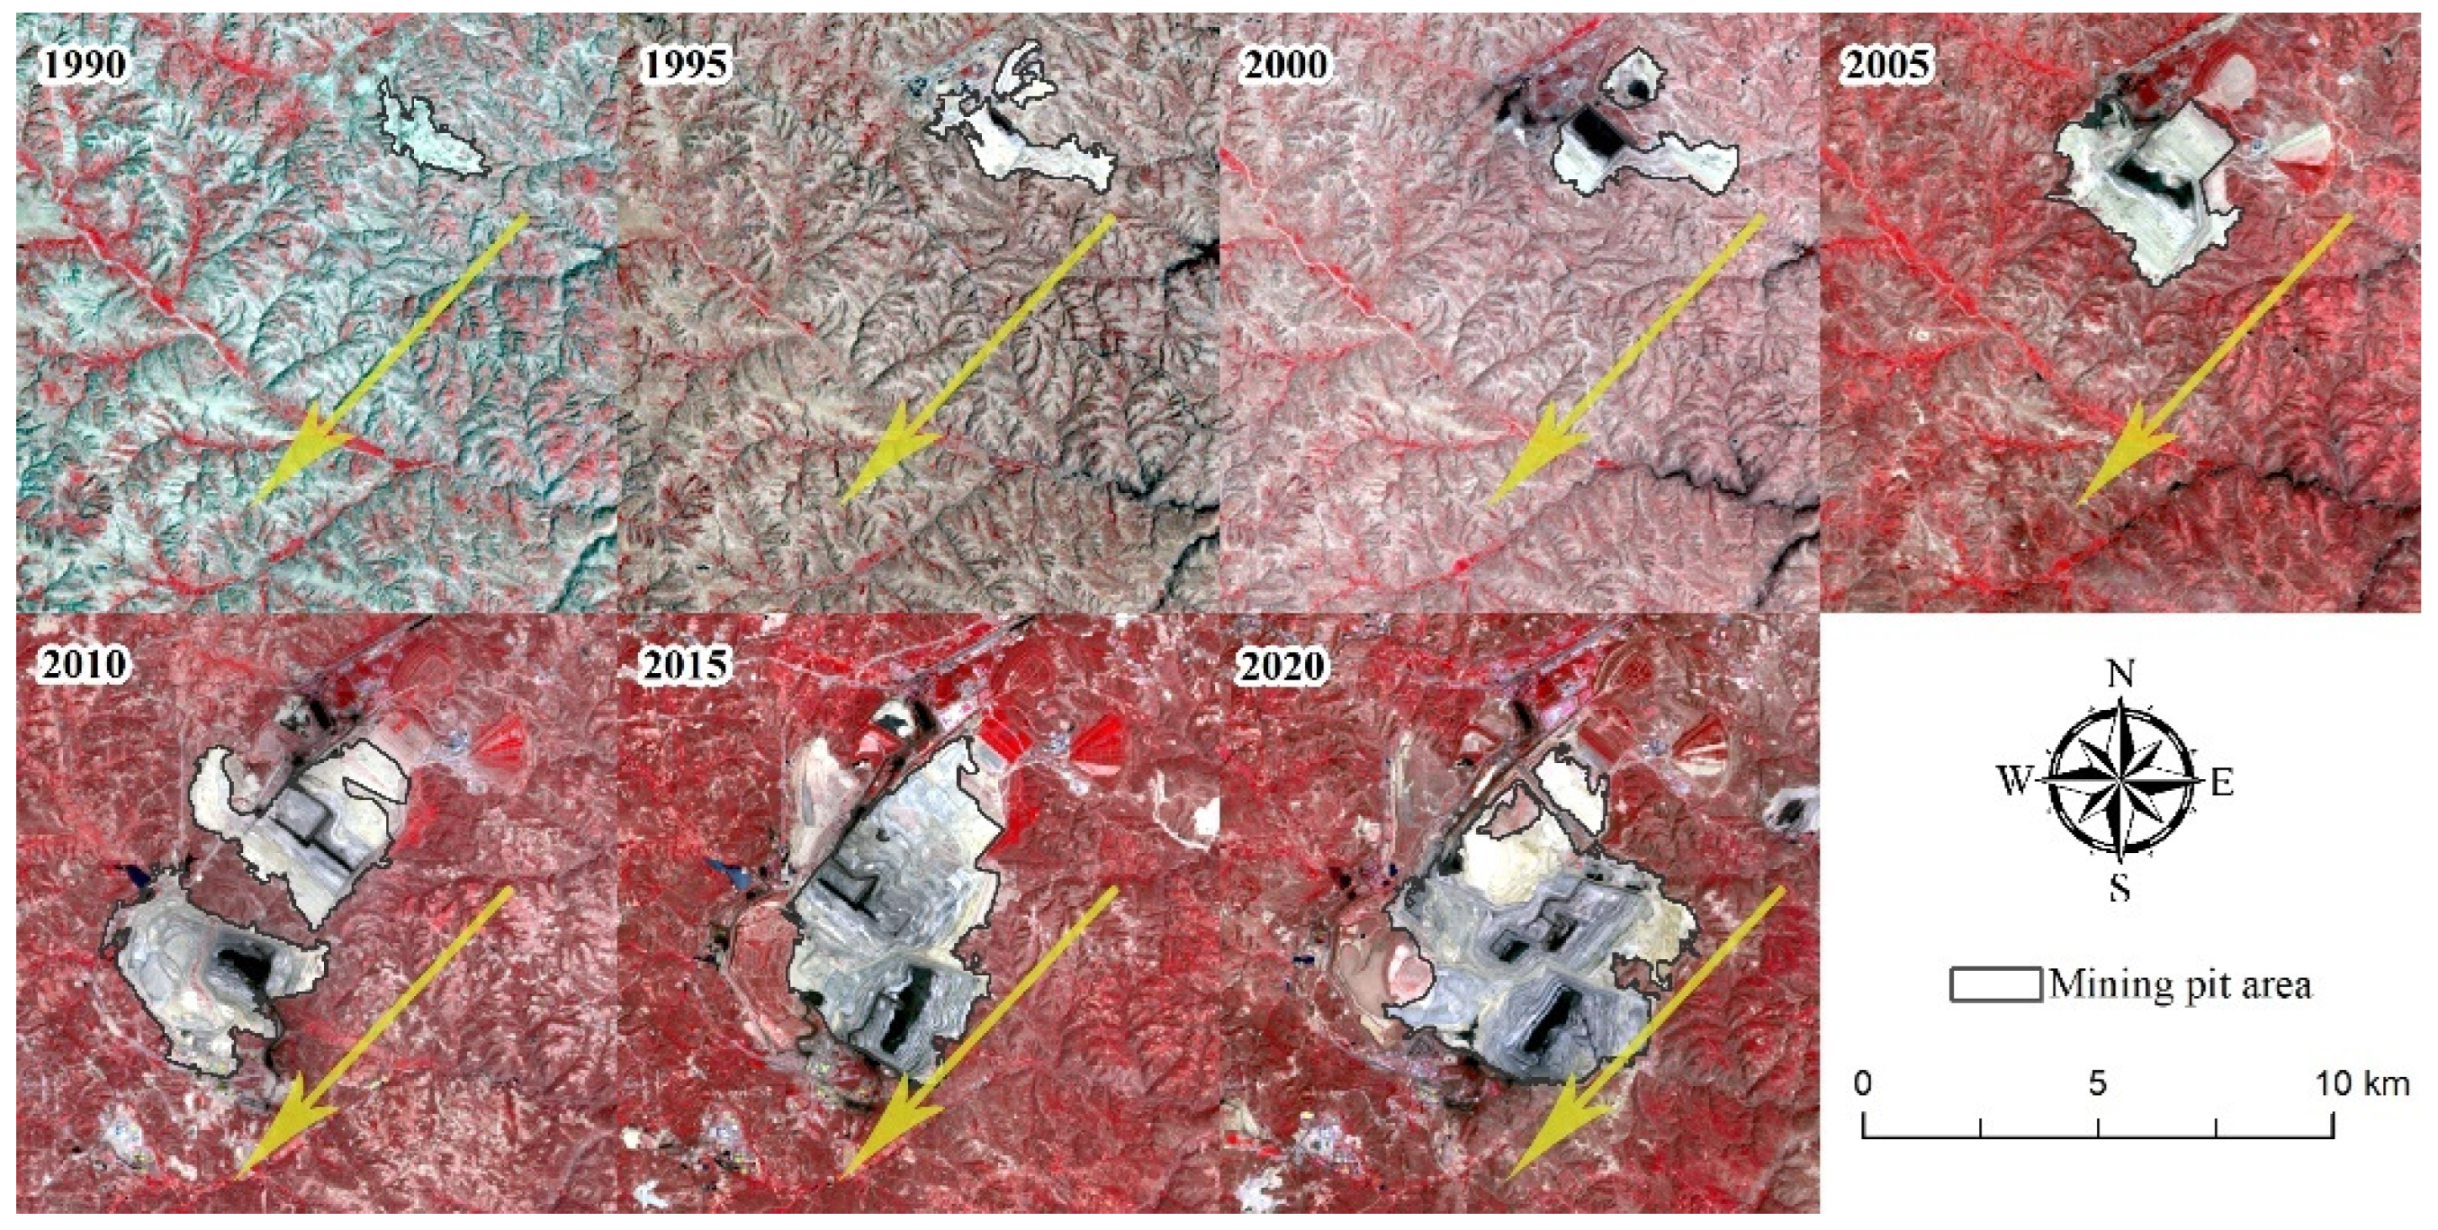
The analysis of the land use transfer matrix within the mining area reveals that prior to the infrastructure development in 1985, the Zhungeer open-pit mining area was predominantly dominated by cultivated land, alongside grassland, bare land, and scattered impervious surfaces. Through multitemporal remote sensing image interpretation and spatial overlay analysis, it was observed that during the construction phase from 1990 to 1999, the area of bare land maintained a dynamic equilibrium. Following the implementation of the Ha’erwusu open-pit coal mining project in 2006, the rate of bare land expansion escalated significantly, largely resulting from the conversion of grassland coverage. The bare land within the study area primarily emerged from grassland transformed under mining impacts; after the cessation of mining activities, efforts to restore vegetation have reverted this bare land back to grassland types. Simultaneously, as mining pits have progressed and new spoil heaps have been established, areas once characterized by grassland have reverted to bare land. Additionally, the reclamation efforts in the region have facilitated the transition from bare land to lower-lying areas, restoring them to higher-value cultivated land, thereby achieving the ultimate goal of land reclamation within the mining area and enhancing land use efficiency [3,15].
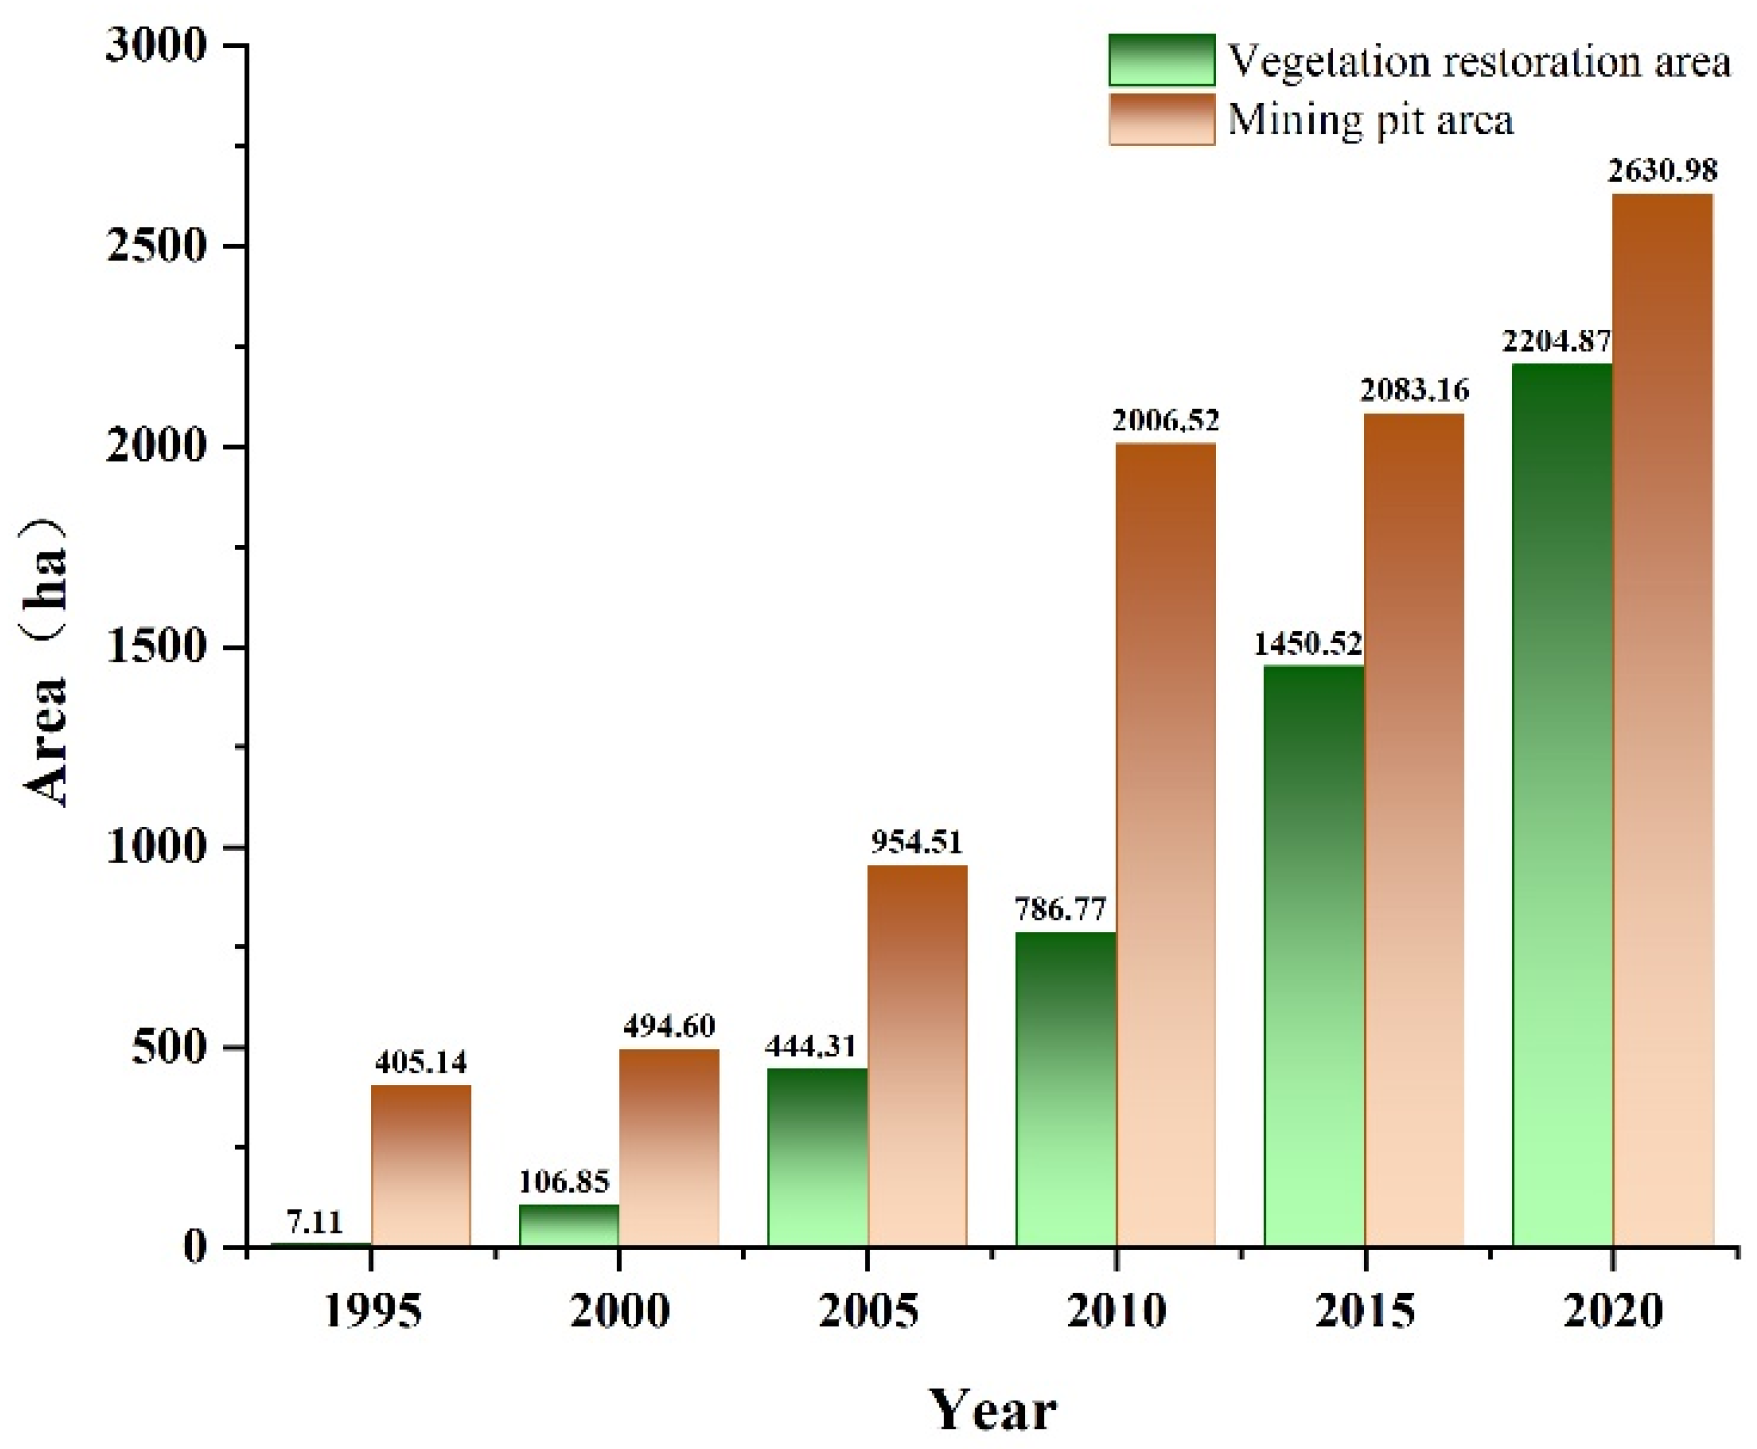
We further analyzed the spatial distribution of pit vectors obtained through multiscale segmentation in conjunction with ecological restoration areas. We found that the mining pits have shifted from being predominantly in the northeast direction to the southwest in recent years, with rapid increases in area. Concurrently, the number and scale of spoil tips have also risen swiftly. Following the formal transfer of production at the northern Heidaigou Open-Pit Mine in 1999, a green area of 106.35 hectares emerged. Subsequently, the area of spoil tips in the north gradually increased, exhibiting diverse plantings of trees, shrubs, herbaceous plants, and agricultural land, as indicated by high-resolution historical imagery of the region. As depicted in Figure 6, the area of vegetation restoration has continued to expand in tandem with the enlargement of mining pits, with both areas nearly equaling by 2020. This synchronous growth trend of “mining intensity and restoration efforts” characterizes the collaborative development pathway between resource extraction and ecological management, providing a quantifiable empirical case for ecological restoration in arid region mining areas [33,44].

4.2. The Impact of Mining Activities on Regional Ecological Indices and Landscape Patterns

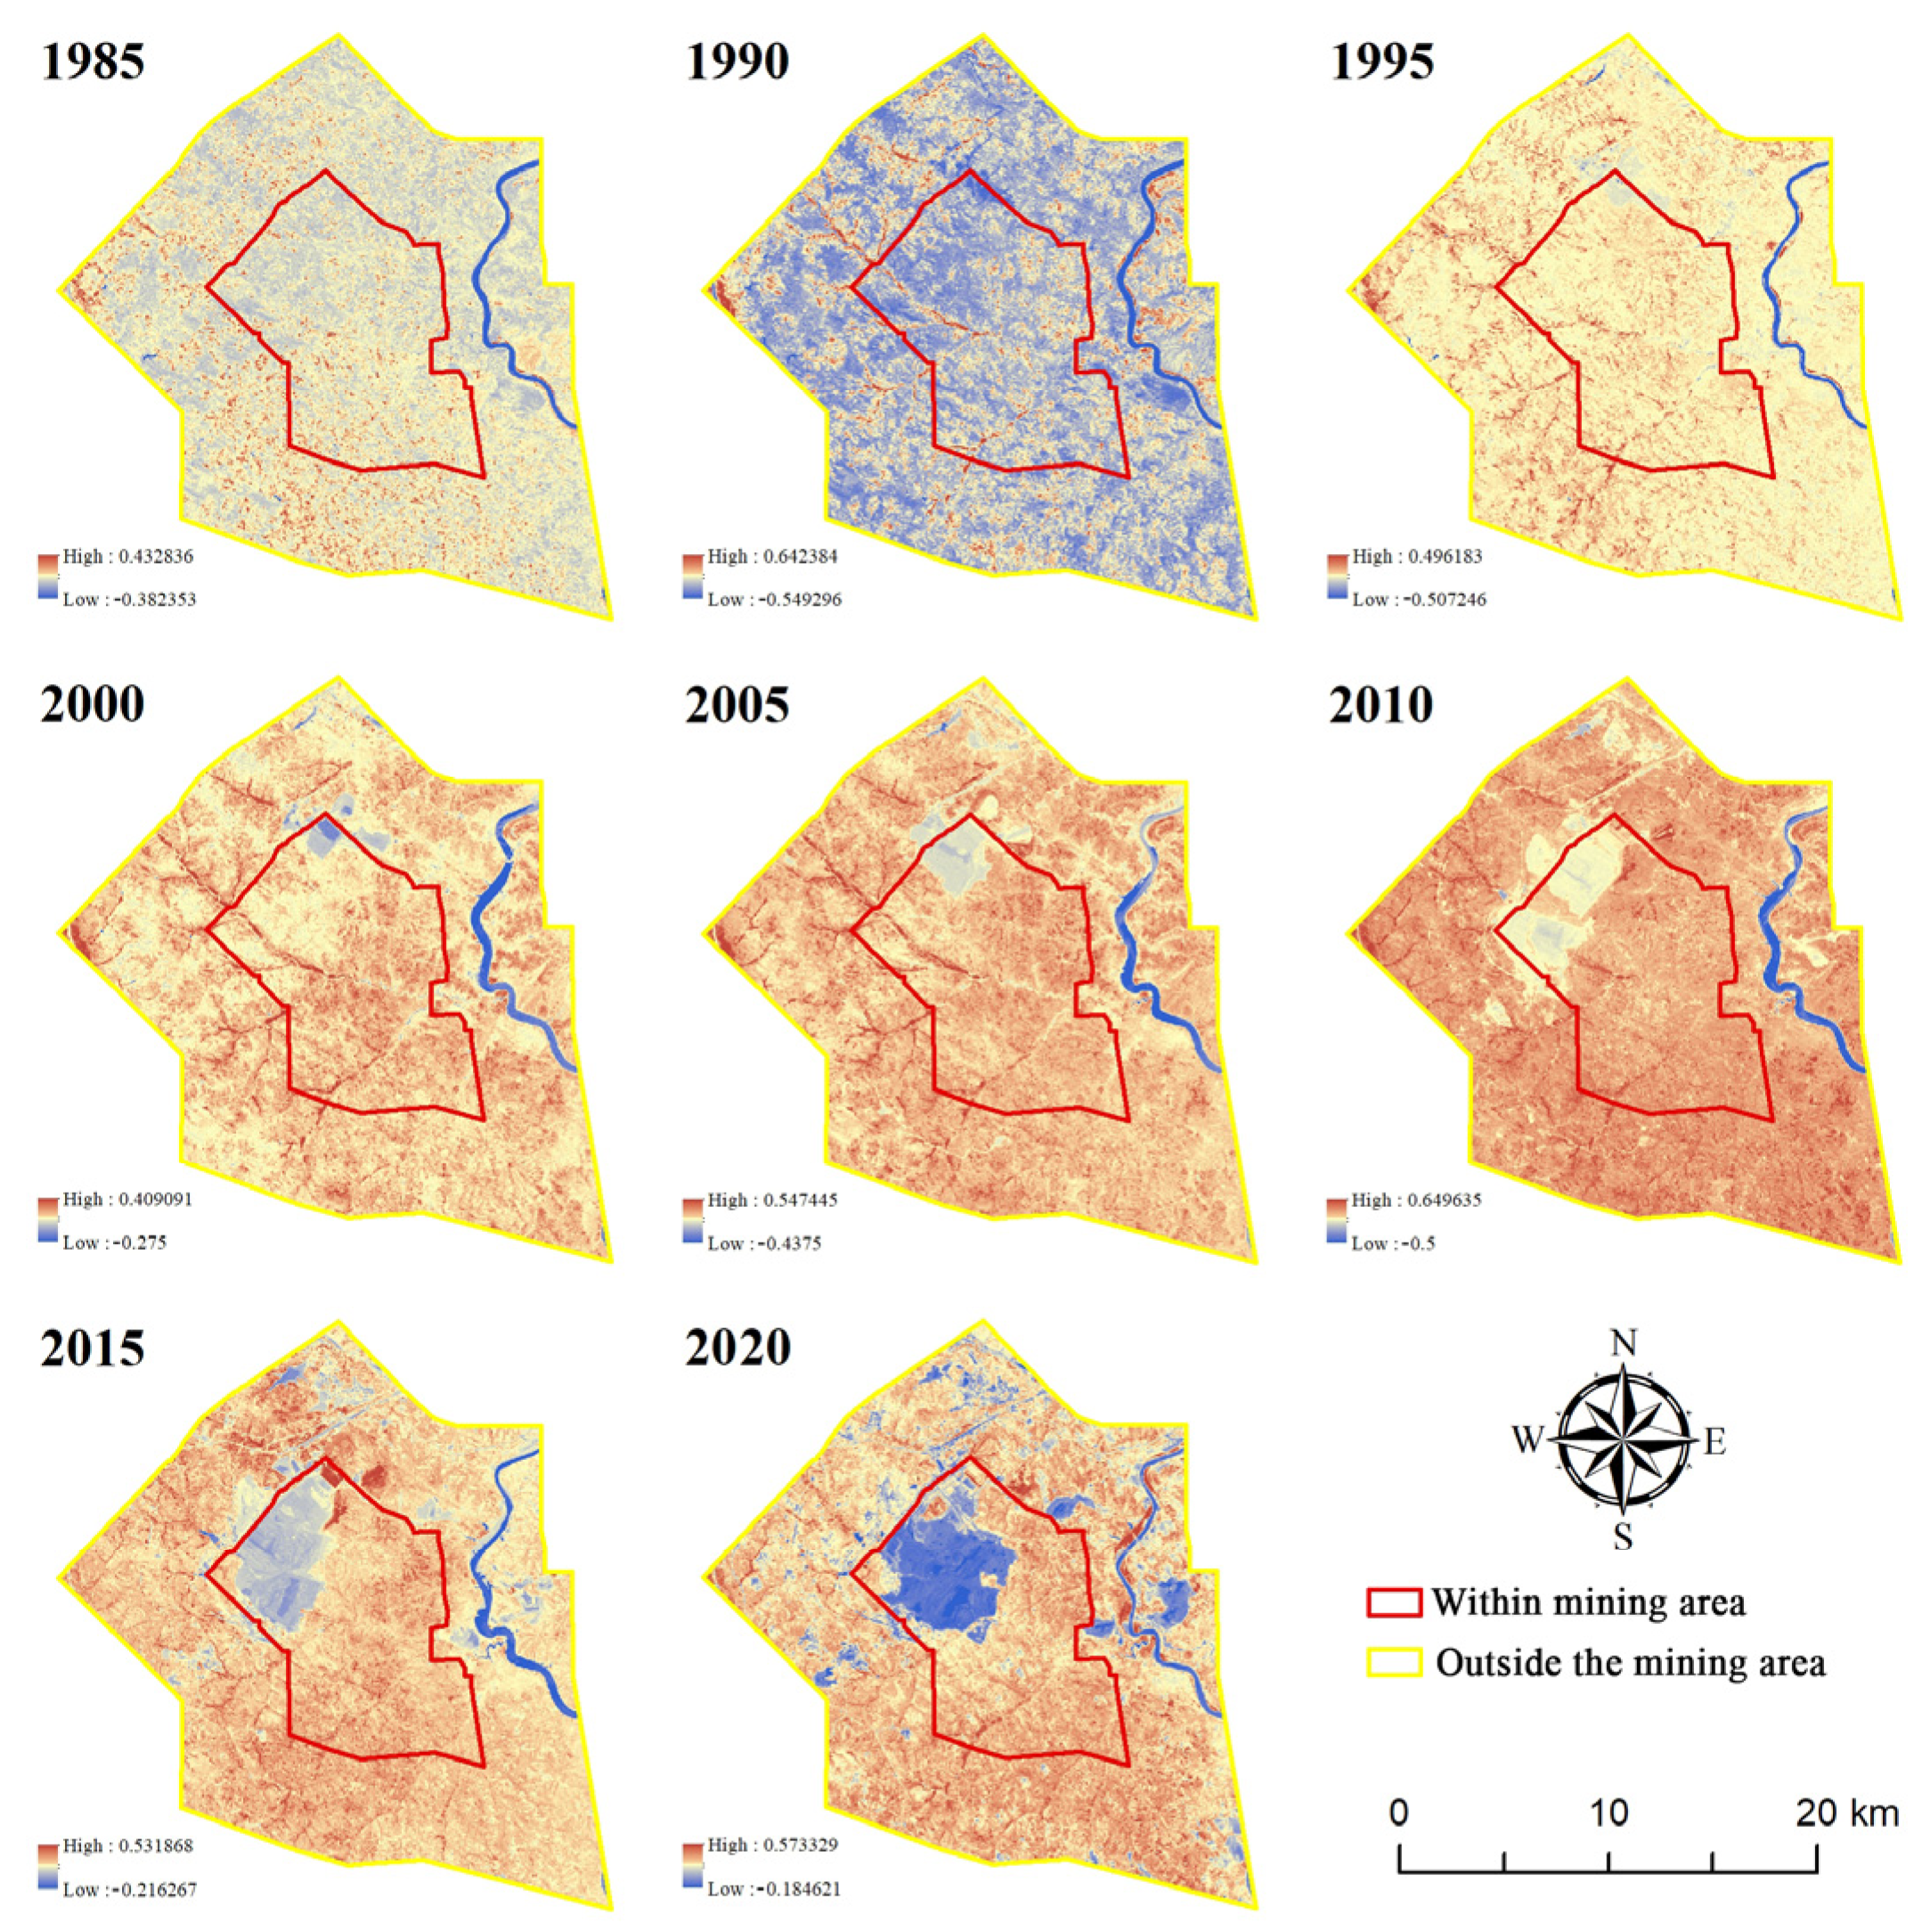
Following the analysis of NDVI and NDBI, we discovered that prior to the development of the mining area, the mean NDVI approached zero, indicating a relatively low level of NDVI throughout the entire study area. Over the 35-year research period, although the mining pits exert an unequivocal depressing influence on the NDVI of the study region, geographic statistical analysis revealed that the overall NDVI has reached a considerably elevated level. This phenomenon of reverse ecological growth corroborates the substantial compensatory mechanism of high-intensity restoration efforts against the adverse effects of mining. Similarly, the NDBImean, which indicates better vegetation cover at lower values, exhibited an increase only in the 1990s and around 2010. We attribute this phenomenon primarily to the significant events surrounding the construction of the northern Heidaigou and southern Harwusu open-pit mines. During this period, the rapid expansion of mining pit areas directly contributed to the increase in NDBI values. However, as the enterprise intensified its ecological governance efforts, green vegetation increasingly dominated the study area, ultimately reducing the mean NDBI to negative values. The rise in NDVI and the decline in NDBI are consistent with the results obtained from the land use transition matrix [5,26,33].
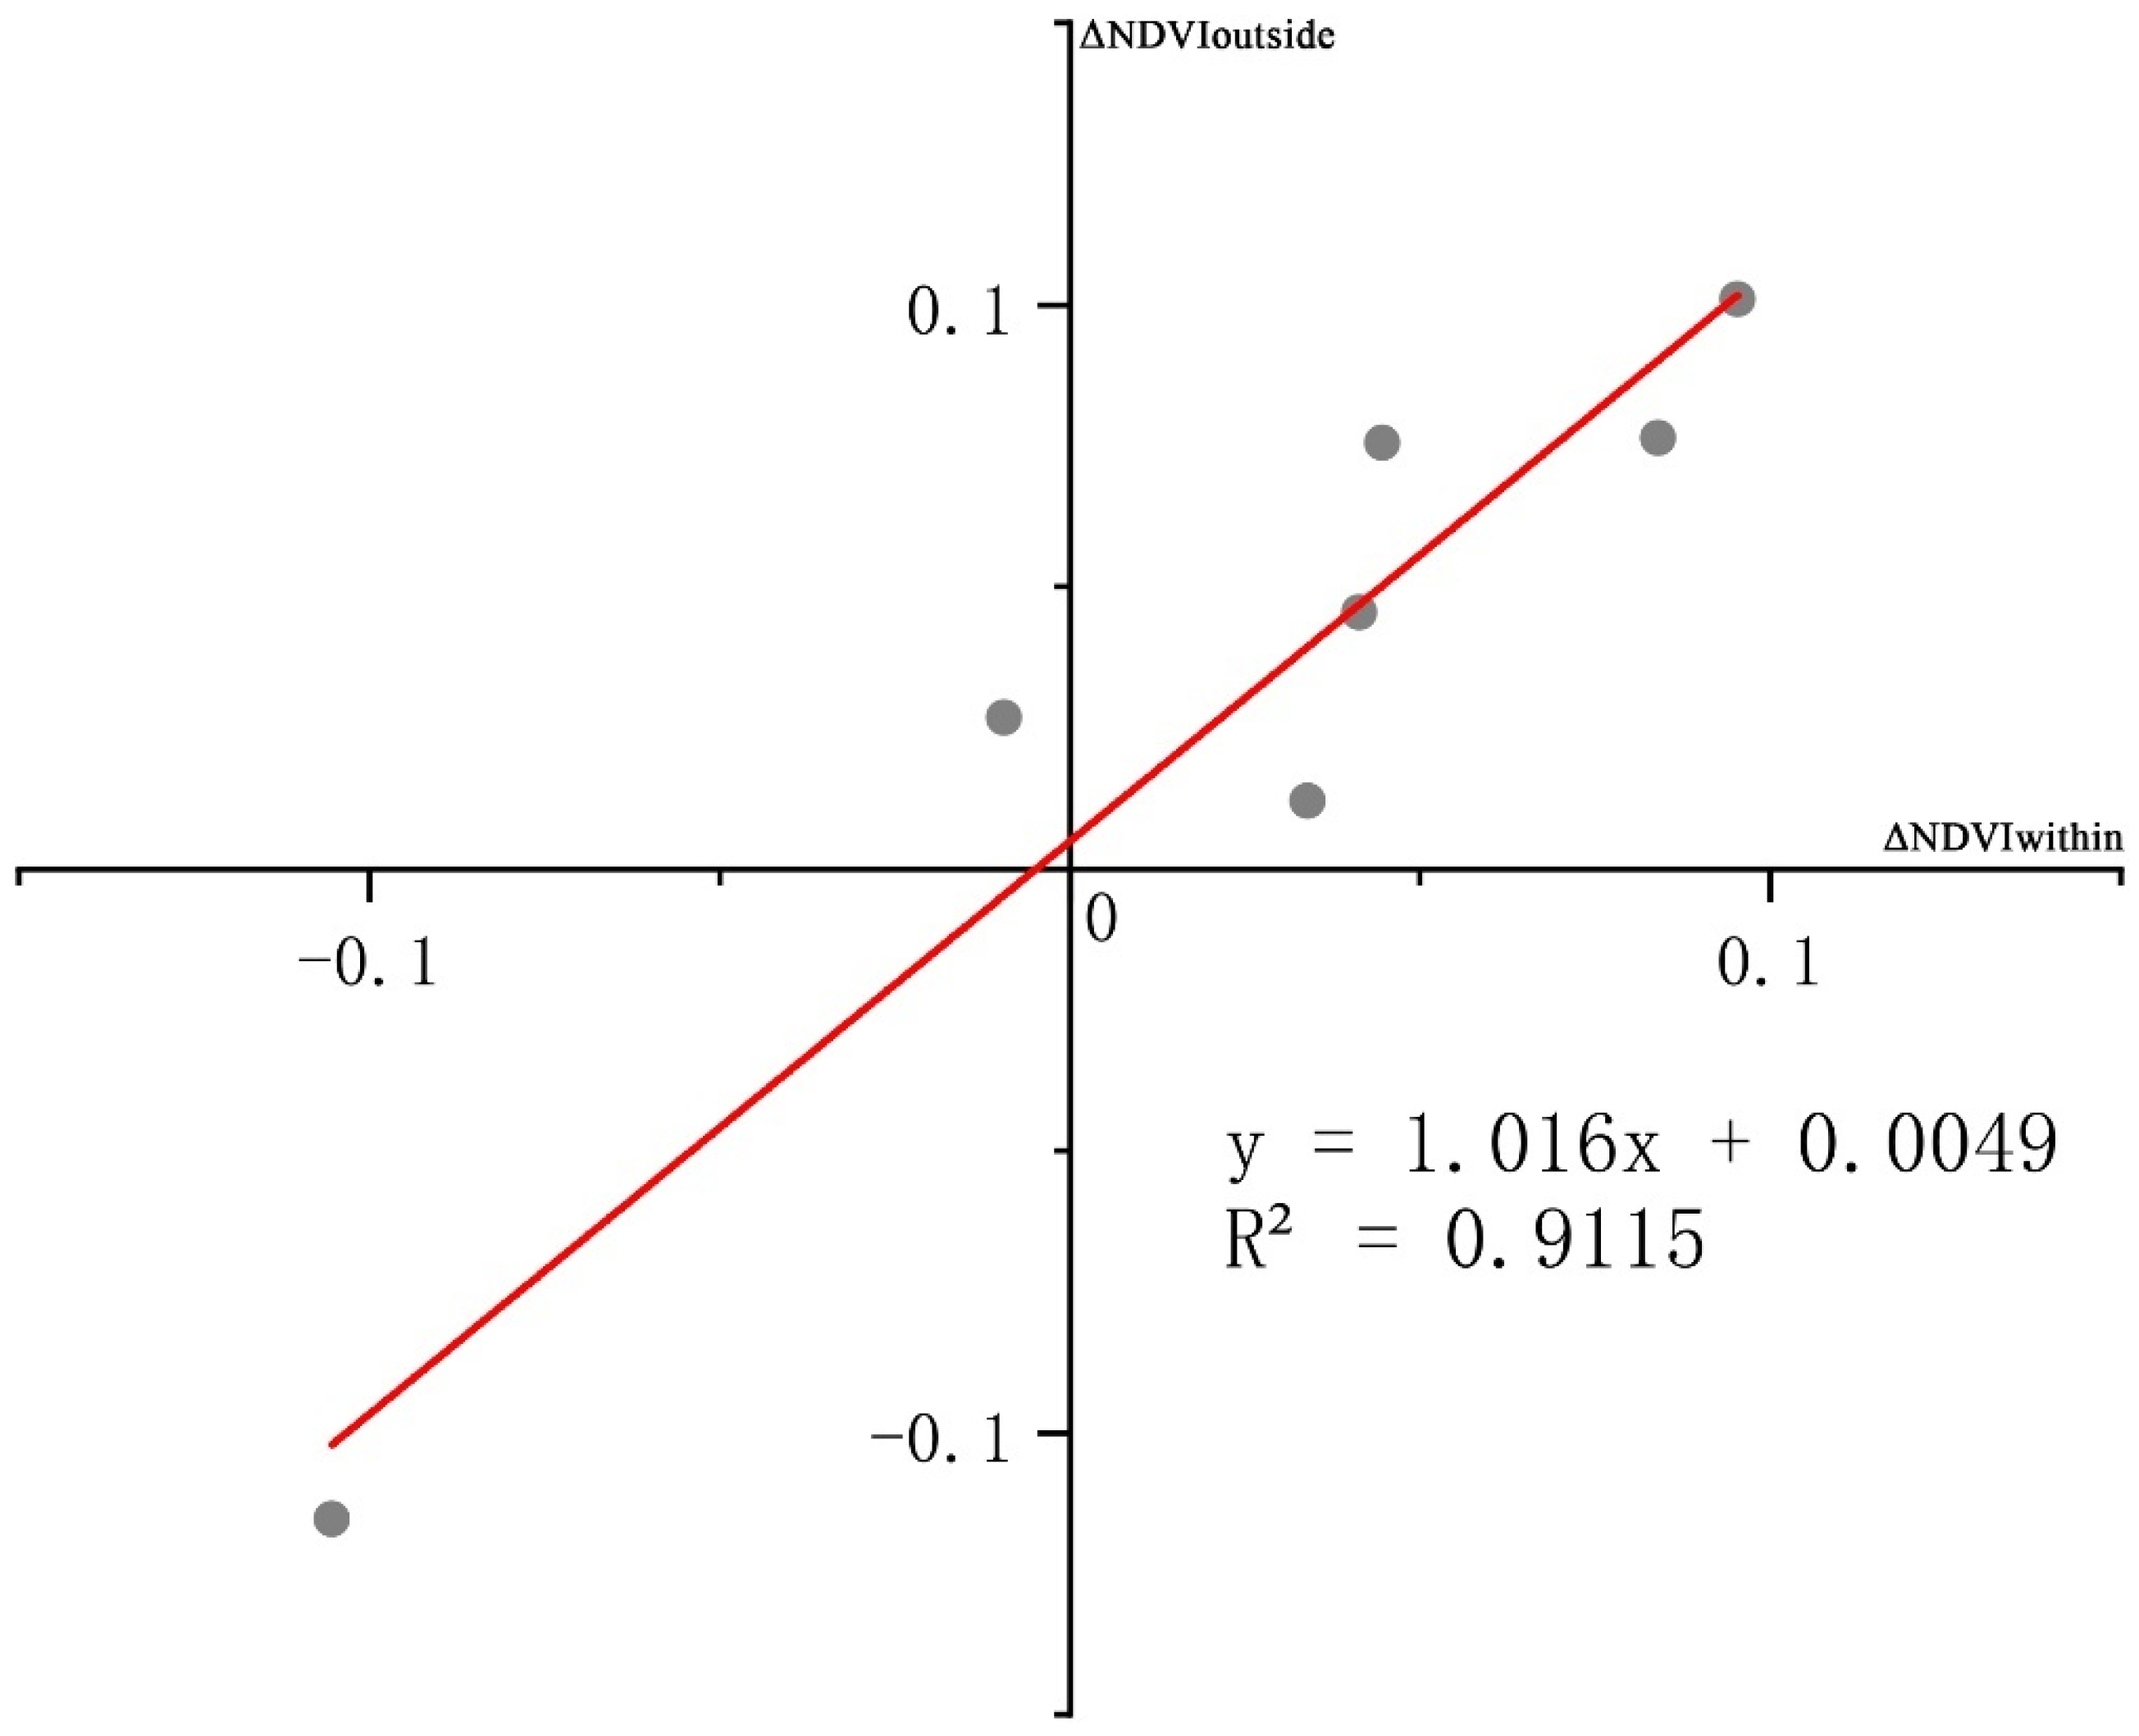
At the same time, the contribution of changes in the internal NDVI of the mining area to the external NDVI was analyzed. Over the span of 35 years of study, model fitting revealed that the internal NDVI growth contributed 1.016 to the external NDVI growth. This finding indicates a remarkably strong positive effect of the internal changes on the external environment, further demonstrating that the ecological projects implemented within the coal mine have played a significant role in promoting ecological restoration beyond its boundaries. Over the course of 35 years, the enterprise has invested a total of 2.881 billion yuan in land reclamation and greening efforts, rehabilitating 94,000 acres of land and achieving a reclamation rate of 100% in the mining area. The area of artificially restored vegetation within the study region has transitioned from nonexistent to substantial growth, with various ecological indicators now exceeding levels observed prior to coal mining. This also underscores, from another perspective, the positive impact of the evolutionary pattern of “mining disturbance—artificial restoration—system reconstruction” in ecologically fragile areas [3,32,45].
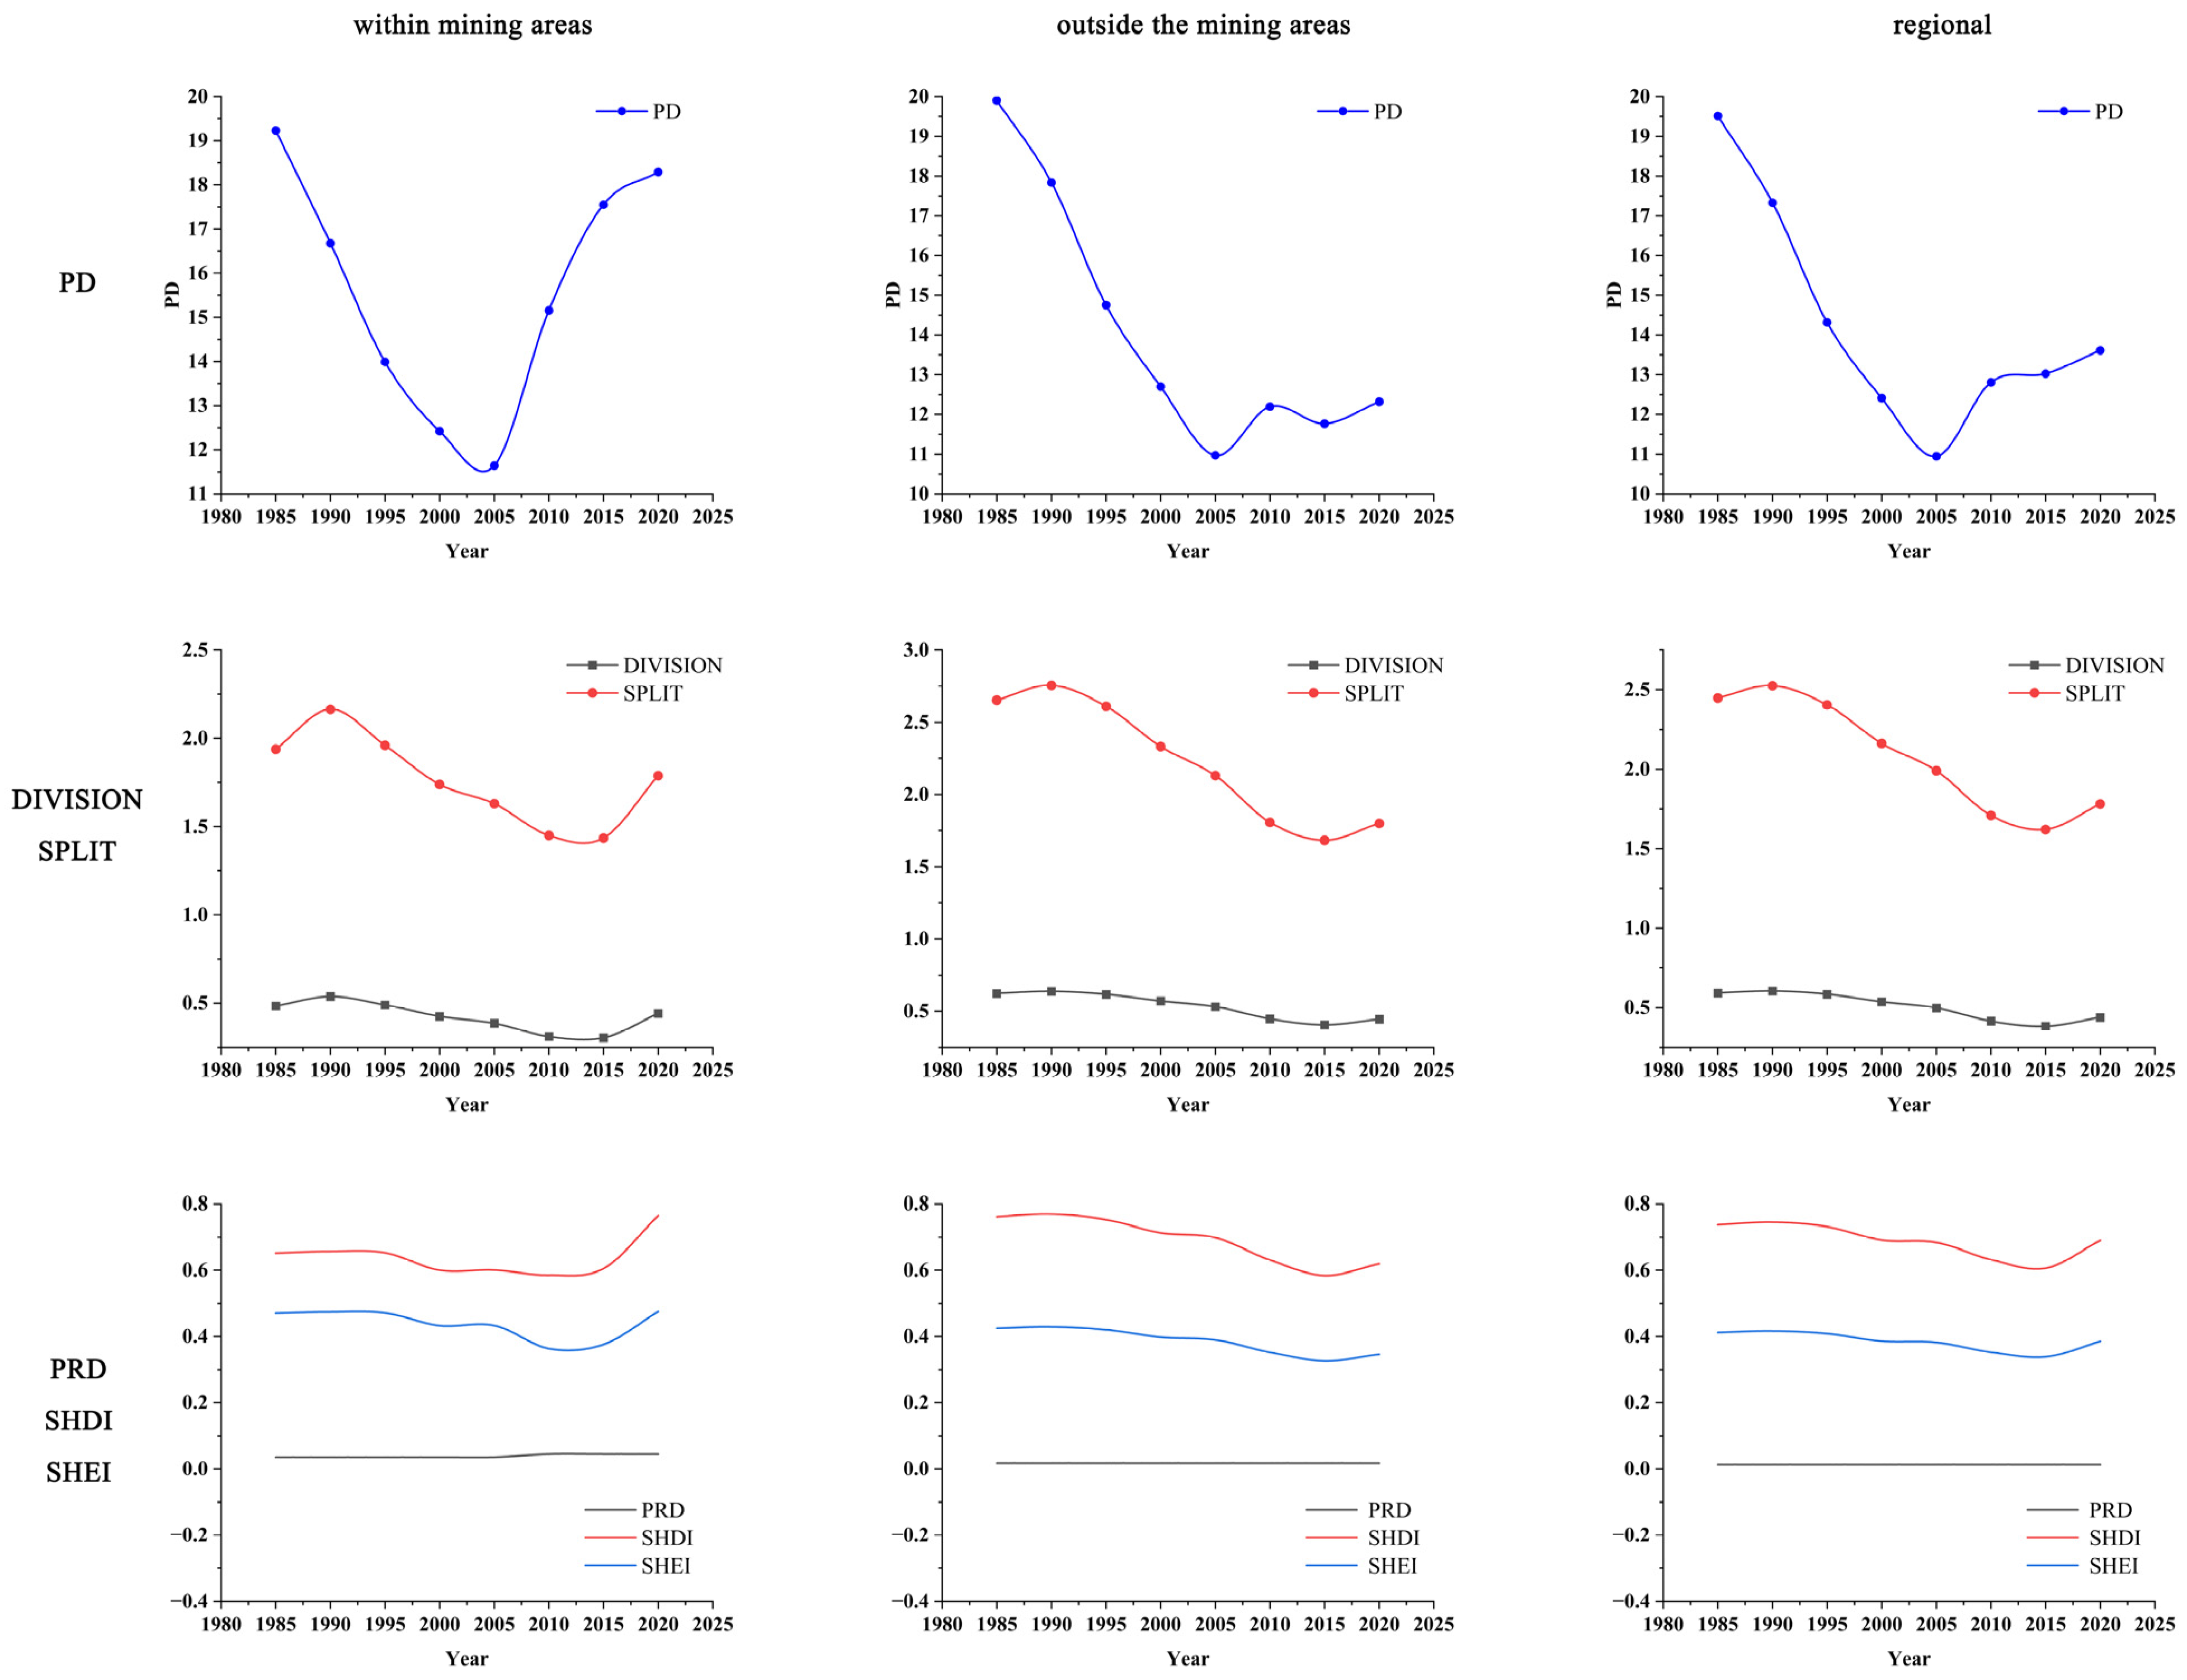
The research on the evolution of ecological space in mining areas based on landscape pattern indices indicates that before coal extraction, the internal landscape of the mining area exhibited a high degree of fragmentation due to geomorphological constraints, with a relatively high PD value, thereby limiting ecological functionality. As mining activities progressed, the synergistic effects of mining disturbances and restoration efforts led to a significant decrease in the PD value, resulting in numerous small landscape patches being interconnected through vegetation planting. The connectivity among these patches was enhanced, while the area of bare land (mining pits) within the mining zone continuously expanded, forming larger patches. The reduction in PD value signifies a decrease in landscape heterogeneity and fragmentation within the mining area, reflecting an improvement in ecological functionality. Entering the 21st century, the area of bare land continued to grow, the number of spoil heaps increased, and the types of ecological restoration diversified. The number of vegetation patches within the mining area rose, becoming more dispersed. Additionally, the construction and operation of the Halousu Open-Pit Mine in the southern part of the study area resulted in fragmentation and disorder among landscape patches, leading to a continuous rise in the PD value. Although the PD value maintained an upward trend after 2015, the rate of increase slowed, indicating that landscape restructuring had entered a dynamic equilibrium phase. This phenomenon suggests that both mining activities and artificial restoration within the mining area have reached a state of stability. The northern restoration area of the Zhungeer Open-Pit Mine exhibits a more organized patch structure, whereas the development of the Halousu Open-Pit mine in the south has caused the patches of mining pits and unreclaimed spoil heaps to gradually merge in the north and south, yet still maintain a transitional fragmented pattern. Consequently, this has resulted in a trend of slow PD value increase, promoting connectivity among patches, which directly reflects an increase in landscape heterogeneity and fragmentation within the mining area, thus imposing limitations on ecological functionality, albeit with some alleviation in recent years [35,46].
The cross-scale analysis of landscape pattern evolution indicates that, between 1985 and 2000, the PD value outside the mining area significantly decreased, exhibiting a notable spatial synergy with the internal conditions of the mining area. This comprehensive landscape integration can be primarily attributed to national ecological initiatives. The slogan “enclosing mountains for forest cultivation and using forests to sustain livestock” was proposed by China’s forestry sector in 1978, sparking extensive discussion and attention as a pivotal measure in ecological construction. Notably, in Zhungeer Banner, the region began its afforestation efforts as early as 1965, which contributed to a continuous decline in PD value during the period from 1985 to 2005. The external landscape patches primarily comprised mountainous shrubs, and the implementation of forestry policies led to improvements in vegetative conditions, resulting in the merger and connectivity of landscape patches.
Following 2005, analyses of remote sensing imagery from the external mining area revealed an increase in industrial sites surrounding the coal industry, leading to the degradation of original vegetative patches due to industrial development. High-resolution imagery interpretation indicated that industrial land patches displayed characteristics of “small scale and high dispersion”, thereby constraining the overall increase in the PD value and resulting in only a modest rise. This “local fragmentation—overall stability” pattern substantiates the landscape resilience threshold theory. Furthermore, the stability of the PD value around 2020 suggests that the landscape heterogeneity and fragmentation levels in the external mining area have remained relatively high, with a restoration of connectivity between patches and a stabilization of ecological functionality. In examining the combined region of the mining area and its surroundings, we also found that the overall PD value exhibited a trend of first decreasing then increasing, suggesting that mining activities in the Zhungeer coalfield have led to reduced landscape heterogeneity and fragmentation, enhancing ecological functionality. However, in recent years, a slow degradation has emerged, albeit at a minimal level.
As for the DIVISION and SPLIT landscape indices, both in the internal, external, and overall regional perspectives, there was a trend of first increasing, then decreasing, and then increasing again. Both indices increased during the early stages of mining area construction, indicating the appearance of scattered landscape patches that disrupted the integrity and connectivity of regional patches. As the mining area matured and ecological environmental investment increased, both DIVISION and SPLIT indices decreased, indicating a restoration of landscape connectivity and improvement in the continuity of ecological habitats, leading to enhanced biodiversity. This pattern is consistent with the response of PD changes. After 2015, the DIVISION and SPLIT indices began to rise again. Our analysis of historical remote sensing images revealed that the construction within the mining area and the increasing number of industrial sites outside the mining area led to the creation of more roads, cutting patches and causing spatial isolation, which led to a reduction in landscape connectivity.

4.3. The Impact of Mining Activities on Regional Ecosystem Stability

After analyzing the results of SHDI, SHEI, and PRD, we found that PRD remained at a low level in all areas, indicating that the study area had a relatively simple patch structure and low landscape richness. In terms of SHDI, the internal SHDI of the mining area experienced a decline from 1985 to 2010, followed by an increase post-2010. This denotes that the construction and mining activities associated with the open-pit coal mine initially reduced landscape diversity, with some original landscape types being supplanted by the emergence of mining pits. A similar downward trend was observed in SHEI during this timeframe, indicating that the predominance of bare land patches resulting from mining expansion has led to persistent disruption of the ecosystem and a decline in stability. However, post-2010, both SHDI and SHEI indicators have progressively recovered, with PRD also experiencing modest improvement, surpassing levels recorded before the onset of mining in 1985. This suggests a restoration of landscape diversity within the mining area. Through analysis of the company’s ecological restoration measures and methods, it was found that during vegetation reconstruction, tree forests, shrub forests, farmland, and grasslands were established, resulting in new landscape types within the mining area. This result also suggests that the landscape patches in the mining area became more uniform. Although the expansion of mining pits continued to dominate with bare land, the type changes in other patches and their connectivity have reduced the dominance of bare land [10,40,41]. Comprehensive analysis of these three indices reveals that the landscape structure within the mining area became imbalanced following mining activities, yet with the implementation of ecological restoration projects, the landscape structure has gradually regained balance, resulting in progressive improvements in the ecosystem and heightened stability, along with an increasing richness of habitat types.
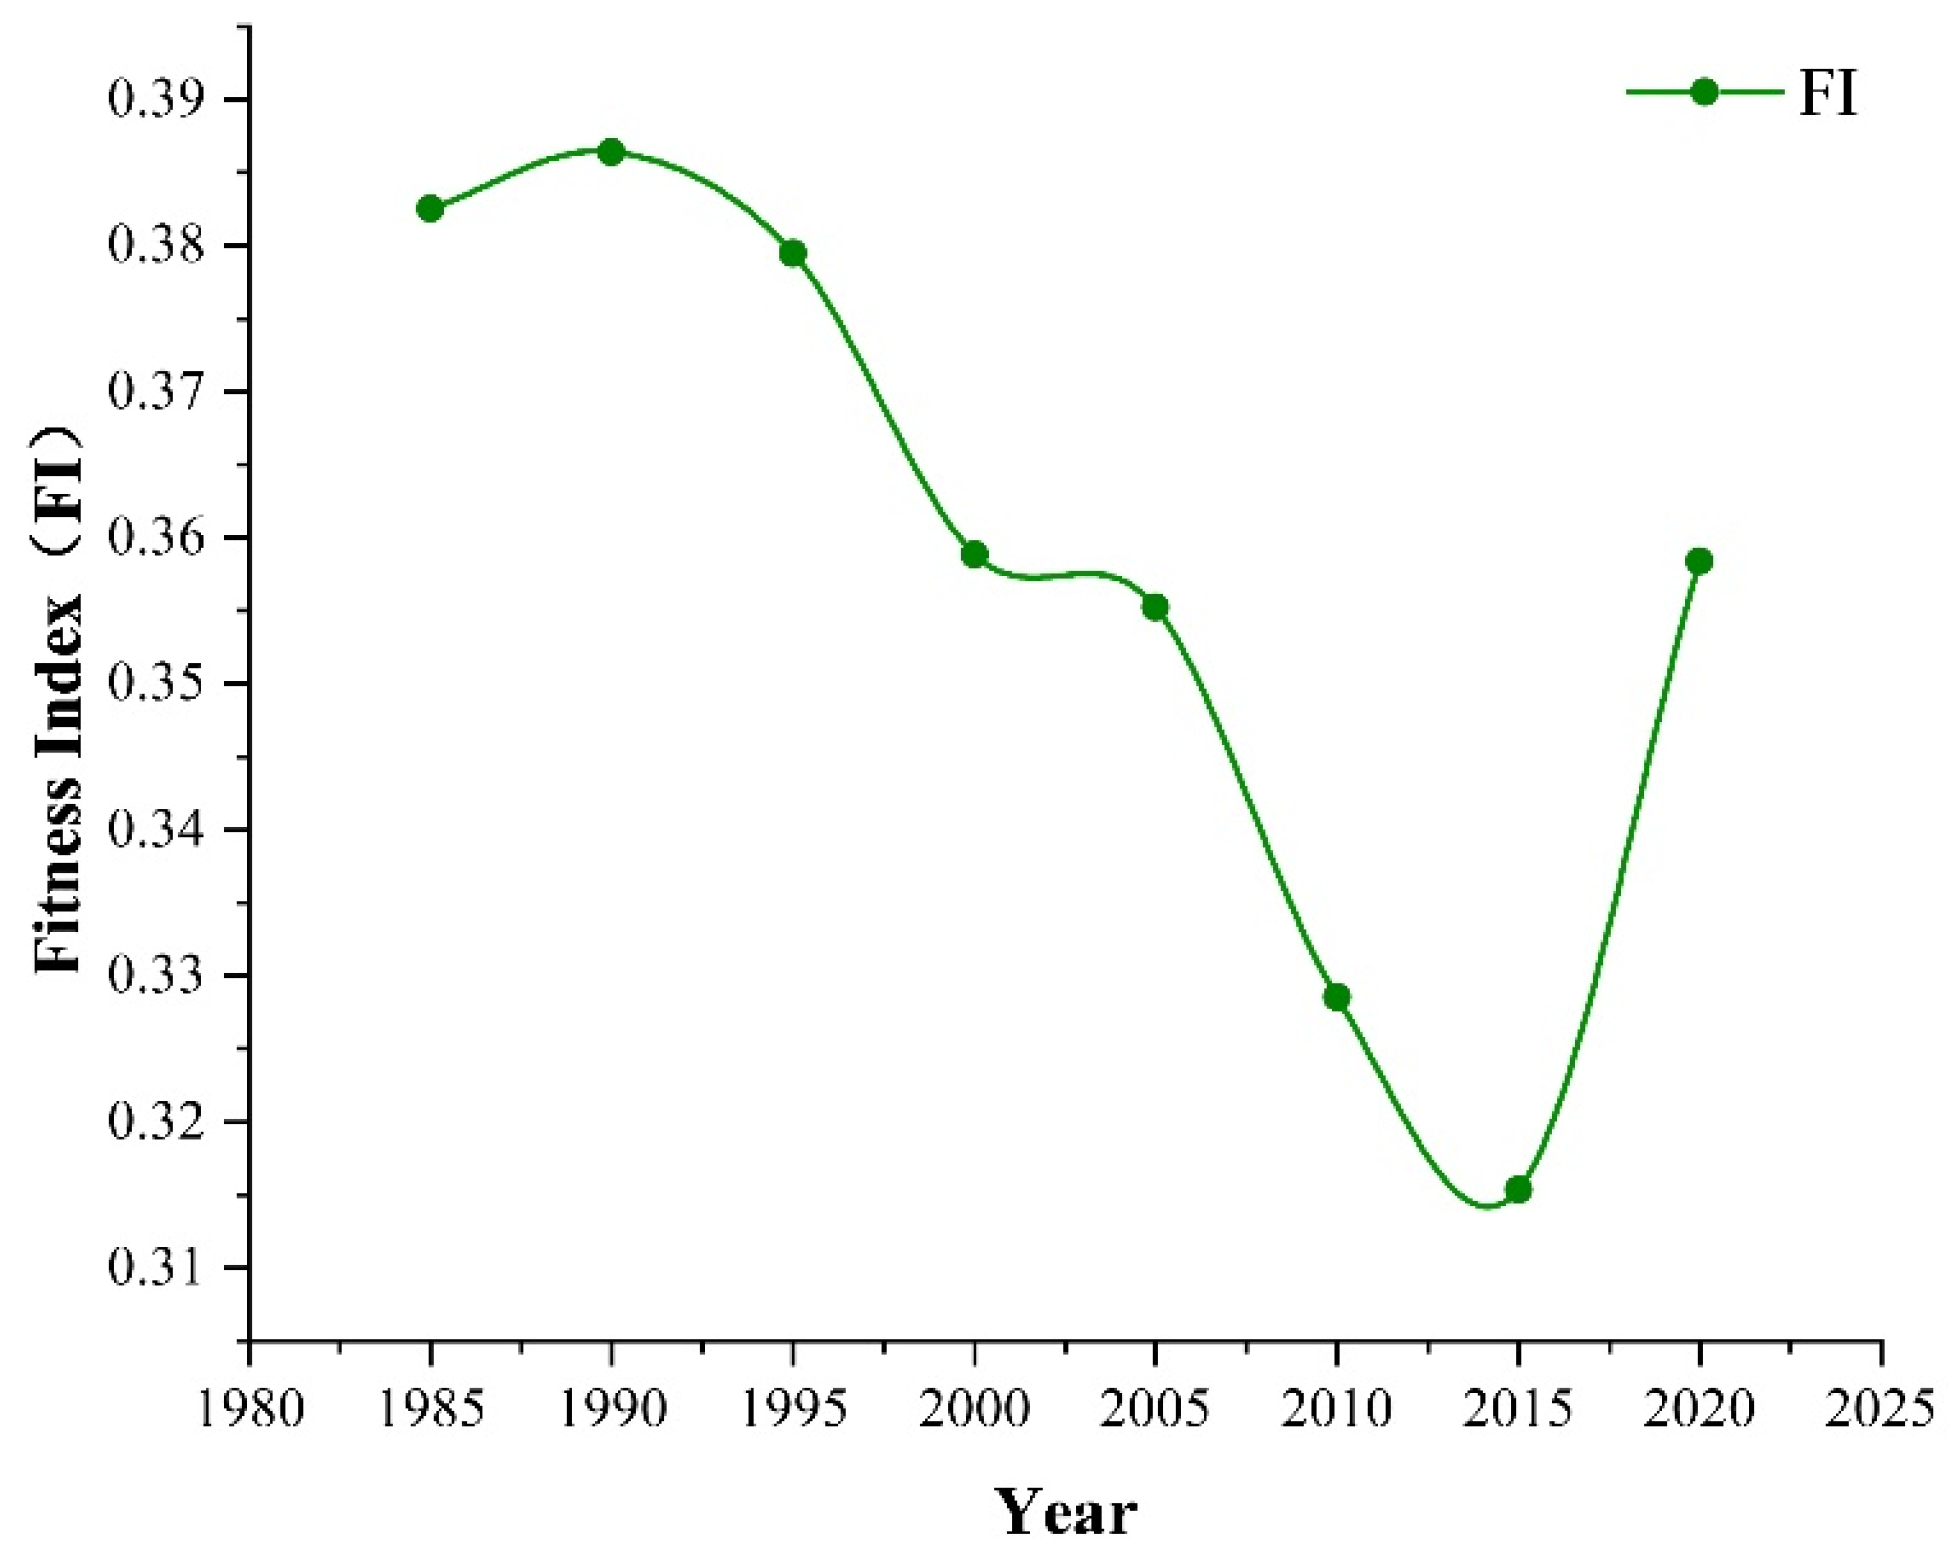
However, from the external perspective of the mining area, we found that while SHDI and SHEI in the external area followed a similar trend of first decreasing and then increasing, the increase was much slower. Observing the entire region’s three indices, it becomes evident that the recovery of landscape quality in the overall area, influenced by the internal SHDI and SHEI metrics, surpasses that observed externally. This indicates that the ecological state of the entire region is predominantly shaped by the conditions within the mining area. Although mining pit expansion in the mining area impacts the entire region, the positive effects of ecological restoration have already offset the negative impacts of mining activities. Moreover, the greening of spoil grounds and land reclamation in the mining area have had a positive effect on the ecological quality and ecosystem stability of the external area and the entire region, it shows that the ecological restoration of the mining area has a significant spatial spillover effect. After comprehensive analysis of PRD, SHDI, and SHEI, the FI index shows that the ecosystem stability of the Zhungeer open-pit mining area continued to decrease over the 35-year study period. However, a significant rebound in this index occurred after 2015, which we believe is due to the delayed effects of ecological engineering. Although immediate restoration measures were taken, the process of ecosystem recovery is gradual, and it takes several years after the implementation of ecological engineering to reach the desired level of ecological function and biodiversity [40,42]. The comprehensive analysis of the PRD, SHDI, and SHEI resulted in a Fitness Index (FI) indicating that the ecosystem stability of the Zhungeer Open-pit Coal Mine experienced a continuous decline over the 35-year study period. Notably, after 2015, there was a significant improvement in ecosystem stability, with a marked rebound in this indicator occurring only thereafter. We attribute this phenomenon to the lagging effects of ecological engineering; despite the implementation of restoration measures in the short term, the recovery of an ecosystem is often a gradual process, requiring several years post-implementation before achieving the desired ecological functions and levels of biodiversity [12,47].
Building upon the aforementioned analyses of changes in land use, ecological indicators, and landscape metrics, we deduce that between 1985 and 2020, the activities associated with open-pit coal mining inflicted detrimental effects on the regional landscape patterns and ecological quality. However, entering the 21st century, the promulgation of national and local ecological policies, coupled with the implementation of ecological projects within the mining area, has gradually mitigated the negative impacts of mining activities, with the positive effects of ecological restoration increasingly counteracting these adverse influences. Furthermore, these beneficial impacts have begun to radiate into the larger surrounding areas of the coal mine [43]. Through our research, it is also evident that ecological restoration within the mining area can drive improvements in the ecological quality of surrounding areas. Therefore, in future ecological engineering projects, priority can be given to intensive restoration along the mining area’s boundaries, while implementing dust control measures within the mining area to prevent land exposure.

4.4. Significance and Limitations of This Study

The significance of this study is two-fold, encompassing both theoretical and practical dimensions. On one hand, in the development of the general ecological theory framework, our research integrates landscape ecology with general ecology. Utilizing indicators such as PD, DIVISION, and SPLIT, we conducted a multifaceted analysis of changes in landscape patterns to assess the heterogeneity, fragmentation, and connectivity of the region following open-pit coal mining activities. These metrics are representative and effectively reflect the destruction wrought by intense human activities on landscape patterns, while also demonstrating the restoration of these patterns during ecological recovery and reconstruction processes. This methodology serves as a paradigm for subsequent research, substantiating the feasibility of studying ecological functions within mining areas at the landscape level. On the other hand, within the ecosystems of mining areas in arid and semi-arid regions, our specific findings reveal that shifts in land use types alter the regional environment through transformations in landscape patterns. This inspires further contemplation among researchers in mining ecology on how to reshape the ecological quality of regional environments by modifying local landscape fragmentation and connectivity, thereby fostering more rational and sustainable development of open-pit coal mining in arid and semi-arid zones.
However, this study does have certain limitations. As previously noted, the causal relationship between ecosystem changes and regional vegetation–climate factors remains unclear. Our research only highlights the preliminary relationships among land use, vegetation, and landscape patterns, without considering the impact of climate change on the overall ecological environment of the region [43,48]. Establishing causal inferences necessitates longer-term observational data to validate these relationships and the application of advanced manifold reconstruction methods in coupled dynamical systems. For future research, we aim to employ remote sensing inversion calculations of climatic factors observed on the ground, based on the landscape ecological indicators proposed in this study. We hope to collect and use more data consistent with local ground-truth meteorological and vegetation parameters. This will be combined with long-sequence datasets and spatiotemporal causal relationship recognition models based on cloud computing platforms such as Google Earth Engine to reveal the underlying mechanisms more deeply [23].

5. Conclusions

This study constructs a multidisciplinary spatiotemporal big data fusion analysis framework to systematically evaluate the ecological effects in the Zhungeer mining area from 1985 to 2020. By innovatively applying remote sensing image interpretation in conjunction with ecological process coupling models, it focuses on revealing the dynamic interactive mechanisms between mining activities and ecological restoration projects, leading to the following conclusions:
(1) Over the 35-year research period, various land types within the Zhungeer open-pit coal mining area have undergone mutual transformations. Directly driven by open-pit mining, the internal bare land has expanded significantly, presenting marked spatiotemporal differentiation—continuous exposed zones have formed at a rate of 30.07 ha/a in the mining pit area, while the ecological restoration project implementation zone has achieved a reverse growth of 62.79 ha/a through a “human management–vegetation reconstruction” collaborative model.
(2) Since the establishment of the mining area, bare land and impervious surfaces dominated the internal landscape by 1995, with an NDBI value reaching 0.2730. However, after 2000, the NDBI value has continuously declined to −0.0685, indicating that vegetation has begun to dominate the landscape, and the cumulative effects of ecological restoration projects can surpass the negative impacts of mining activities.
(3) From 1985 to 1995, due to the influence of mining development, the mean NDVI within the mining area decreased from 0.04 to 0.0301, indicating a deterioration of vegetative conditions in the study area. However, after 2000, the mean NDVI progressively increased, restoring to 0.2246, which signifies recovery of the internal ecological environment. Additionally, there is a notable radiative effect of the mining area on the external vegetation conditions, achieving a contribution value of 1.016.
(4) In the Zhungeer open-pit coal mining area, landscape patch density, landscape separation, and landscape fragmentation all exhibited a declining trend following human management efforts, resulting in increased landscape heterogeneity and fragmentation. The landscape’s aromatic diversity index and aromatic evenness index also showed an upward trend post-intervention, with a more uniform distribution of landscape patches contributing to enhanced structural balance. Notably, it was discovered that ecological regulation exhibits a lag effect of 10 to 15 years—while the ecosystem adaptability index in 2020 (0.35836) declined by 6.31% compared with 1985, its recovery trajectory demonstrates a fitting degree of 93.69% with the original ecosystem, reflecting the phased characteristics of ecological recovery in mining-affected areas. Based on the variations in land use and ecological indices presented in this study, theoretical foundations and practical paradigms for ecological governance in similar mining regions are provided.

Author Contributions

T.L. and Y.B. planned and designed the research; T.L. and Y.P. performed experiments and analyzed data; Y.B., T.L., Y.P., X.W. and X.D. wrote the manuscript. All authors have read and agreed to the published version of the manuscript.

Funding

This study was funded by the National Natural Science Foundation of China (52394194; 52394195), the National Key Research and Development Program of China (2022YFF1303303; 2022YFF1303304), and the Joint Research Program for ecological conservation and high-quality development of the Yellow River Basin (2022-YRUC-01-0304).

Data Availability Statement

Data will be made available on request.

Conflicts of Interest

The authors declare that they have no known competing financial interests or personal relationships that could have appeared to influence the work reported in this paper.

References

  1. Liu, X.; Zhou, W.; Bai, Z. Vegetation coverage change and stability in large open-pit coal mine dumps in China during 1990–2015. Ecol. Eng. 2016, 95, 447–451. [Google Scholar] [CrossRef]
  2. Guo, J.; Li, Q.; Xie, H.; Xie, H.; Li, J.; Qiao, L.; Zhang, C.; Yang, G.; Wang, F. Monitoring of Vegetation Disturbance and Restoration at the Dumping Sites of the Baorixile Open-Pit Mine Based on the LandTrendr Algorithm. Int. J. Environ. Res. Public Health 2022, 19, 9066. [Google Scholar] [CrossRef] [PubMed]
  3. Liu, Y.; Liu, Y.; Yue, H.; Bi, Y.; Peng, S.; Jia, Y. Remote Sensing Inversion of Soil Carbon Emissions in Desertification Mining Areas. Spectrosc. Spectr. Anal. 2024, 44, 2840–2849. [Google Scholar]
  4. Hu, J.; Ye, B.; Bai, Z.; Feng, Y. Remote Sensing Monitoring of Vegetation Reclamation in the Antaibao Open-Pit Mine. Remote Sens. 2022, 14, 5634. [Google Scholar] [CrossRef]
  5. Hu, J.; Ye, B.; Bai, Z.; Hui, J. Comparison of the Vegetation Index of Reclamation Mining Areas Calculated by Multi-Source Remote Sensing Data. Land 2022, 11, 325. [Google Scholar] [CrossRef]
  6. Feng, H.; Zhou, J.; Zhou, A.; Su, D.; Han, X.; Xiong, R. Co-evolution mechanism of grassland degradation and its belowground habitat under the influence of coal mining activities. Catena 2024, 241, 107997. [Google Scholar]
  7. Shi, W.; Wang, J.; Li, X.; Xu, Q.; Jiang, X. Multi-fractal characteristics of reconstructed landform and its relationship with soil erosion at a large opencast coal-mine in the loess area of China. Geomorphology 2021, 390, 107859. [Google Scholar]
  8. Liu, X.; Bai, Z.; Shi, H.; Zhou, W.; Liu, X. Heavy metal pollution of soils from coal mines in China. Nat. Hazards 2019, 99, 1163–1177. [Google Scholar]
  9. Ou, B.; Abulizi, A.; Zayiti, A.; Jiang, J.; Akbar, A.; Yu, T. Ecological Risk Zoning Control in Zhundong Economic Development Zone Based on Landscape Pattern Changes. Sustainability 2023, 15, 15972. [Google Scholar] [CrossRef]
  10. Zhang, Y.; Qu, J.; Liu, D.; Yang, J.; Li, D. Study on Forest Landscape Scale Effect Based on ArcGIS and GS. In Proceedings of the 9th International Symposium on Multispectral Image Processing and Pattern Recognition (MIPPR)—Remote Sensing Image Processing, Geographic Information Systems, and Other Applications, Enshi, China, 31 October–1 November 2015. [Google Scholar]
  11. Xu, H.; Cheng, W. Landscape Analysis and Ecological Risk Assessment during 1995-2020 Based on Land Utilization/Land Coverage (LULC) and Random Forest: A Case Study of the Fushun Open-Pit Coal Area in Liaoning, China. Sustainability 2024, 16, 2442. [Google Scholar] [CrossRef]
  12. Hong, F.Z.; He, G.J.; Wang, G.Z.; Zhang, Z.; Peng, Y. Monitoring of Land Cover and Vegetation Changes in Juhugeng Coal Mining Area Based on Multi-Source Remote Sensing Data. Remote Sens. 2023, 15, 3439. [Google Scholar] [CrossRef]
  13. Xiao, W.; Guo, J.W.; He, T.T.; Lei, K.G.; Deng, X.Y. Assessing the ecological impacts of opencast coal mining in Qinghai-Tibet Plateau-a case study in Muli coal field, China. Ecol. Indic. 2023, 153, 110454. [Google Scholar] [CrossRef]
  14. Wu, Z.H.; Lei, S.G.; Lu, Q.Q.; Bian, Z.F. Impacts of Large-Scale Open-Pit Coal Base on the Landscape Ecological Health of Semi-Arid Grasslands. Remote Sens. 2019, 11, 1820. [Google Scholar] [CrossRef]
  15. Das, N.; Mondal, P.; Sutradhar, S.; Ghosh, R. Assessment of variation of land use/land cover and its impact on land surface temperature of Asansol subdivision. Egypt. J. Remote Sens. Space Sci. 2021, 24, 131–149. [Google Scholar] [CrossRef]
  16. Hou, H.; Ding, Z.; Zhang, S.; Guo, S.C.; Yang, Y.J.; Chen, Z.X.; Mi, J.X.; Wang, X. Spatial estimate of ecological and environmental damage in an underground coal mining area on the Loess Plateau: Implications for planning restoration interventions. J. Clean. Prod. 2021, 287, 125061. [Google Scholar] [CrossRef]
  17. Zhang, L.; Zhai, Z.; Zhou, Y.; Liu, S.H.; Wang, L.W. The Landscape Pattern Evolution of Typical Open-Pit Coal Mines Based on Land Use in Inner Mongolia of China during 20 Years. Sustainability 2022, 14, 9590. [Google Scholar] [CrossRef]
  18. Chen, Y.X.; Yu, X.Y.; Xu, D.M.; Peng, J. A spatial machine learning approach to exploring the impacts of coal mining and ecological restoration on regional ecosystem health. Environ. Res. 2025, 264, 120379. [Google Scholar] [CrossRef]
  19. Wang, S.; Huang, J.; Yu, H.; Ji, C.N. Recognition of Landscape Key Areas in a Coal Mine Area of a Semi-Arid Steppe in China: A case Study of Yimin Open-Pit Coal Mine. Sustainability 2020, 12, 2239. [Google Scholar] [CrossRef]
  20. Soumen, C. Impact of open pit coal mining on the forest landscape ecology using spatial metrics: A study of Barabani C.D. block, West Bengal. Spat. Inf. Res. 2021, 29, 645–659. [Google Scholar]
  21. Feng, H.; Zhou, J.; Zhou, A.; Xu, H.L.; Su, D.H.; Han, X. Spatiotemporal variation indicators for vegetation landscape stability and processes monitoring of semiarid grassland coal mine areas. Land Degrad. Dev. 2022, 33, 3–17. [Google Scholar] [CrossRef]
  22. Wu, Z.; Lei, S.; Lu, Q.; Bian, Z.F.; Ge, S.J. Spatial distribution of the impact of surface mining on the landscape ecological health of semi-arid grasslands. Ecol. Indic. 2020, 111, 105996. [Google Scholar]
  23. Li, P.X.; Wang, B.; Chen, P.; Zhang, Y.L.; Zhao, S.H. Vulnerability assessment of the eco-geo-environment of mining cities in arid and semi-arid areas: A case study from Zhungeer, China. Ecol. Indic. 2023, 152, 110364. [Google Scholar]
  24. Li, T.T.; Zhang, Q.; Wang, G.; Singh, V.; Zhao, J.Q.; Sun, S.; Wang, D.Z.; Liu, T.X.; Duan, L.M. Ecological degradation in the Inner Mongolia reach of the Yellow River Basin, China: Spatiotemporal patterns and driving factors. Ecol. Indic. 2023, 154, 110498. [Google Scholar] [CrossRef]
  25. Yang, T.; Zhang, Q.; Wan, X.; Li, X.P.; Wang, Y.Y.; Wang, W. Comprehensive ecological risk assessment for semi-arid basin based on conceptual model of risk response and improved TOPSIS model-a case study of Wei River Basin, China. Sci. Total Environ. 2020, 719, 137502. [Google Scholar]
  26. Ma, B.; Yang, X.; Yu, Y.; Shu, Y.; Che, D.F. Investigation of Vegetation Changes in Different Mining Areas in Liaoning Province, China, Using Multisource Remote Sensing Data. Remote Sens. 2021, 13, 5168. [Google Scholar] [CrossRef]
  27. Xu, D.Y.; You, X.G.; Xia, C.L. Assessing the spatial-temporal pattern and evolution of areas sensitive to land desertification in North China. Ecol. Indic. 2019, 97, 150–158. [Google Scholar]
  28. Wang, B.; Li, P.X.; Zhu, X.Y. Quantification of Vegetation Phenological Disturbance Characteristics in Open-Pit Coal Mines of Arid and Semi-Arid Regions Using Harmonized Landsat 8 and Sentinel-2. Remote Sens. 2023, 15, 5257. [Google Scholar] [CrossRef]
  29. Qiu, Y.S.; Gao, J.; Zhan, Q.L. Forest vegetation spatial and temporal pattern analysis based on NDVI in Jiuzhaigou. In Proceedings of the 2nd International Conference on Renewable Energy and Environmental Technology (REET), Dalian, China, 19–20 August 2014. [Google Scholar]
  30. Li, X.H.; Lei, S.G.; Liu, Y.; Chen, H.; Zhao, Y.B.; Gong, C.A.; Bian, Z.F.; Lu, X.G. Evaluation of Ecological Stability in Semi-Arid Open-Pit Coal Mining Area Based on Structure and Function Coupling during 2002–2017. Remote Sens. 2021, 13, 5040. [Google Scholar] [CrossRef]
  31. Xiao, W.; Deng, X.; He, T.; Chen, W.Q. Mapping Annual Land Disturbance and Reclamation in a Surface Coal Mining Region Using Google Earth Engine and the LandTrendr Algorithm: A Case Study of the Shengli Coalfield in Inner Mongolia, China. Remote Sens. 2020, 12, 1612. [Google Scholar] [CrossRef]
  32. Liu, C.; Zhang, F.; Jim, C.-Y.; Oke, S.A.; Adam, E. Evaluation of atmospheric correction algorithms for salt lake water assessment: Accuracy, 926 band-specific effects, and sensor consistency. PLoS ONE 2024, 19, e0315837. [Google Scholar]
  33. Chen, J.; Hou, D.; He, C.; Liu, Y.T.; Guo, Y.; Yang, B. Change Detection With Cross-Domain Remote Sensing Images: A Systematic Review. IEEE J. Sel. Top. Appl. Earth Obs. Remote Sens. 2024, 17, 11563–11582. [Google Scholar] [CrossRef]
  34. Sun, A.; He, S.; Gu, Y.; Li, P.L.; Liu, C.; Ye, G.Q.; Zhou, F. Performance Assessment of Landsat-9 Atmospheric Correction Methods in Global Aquatic Systems 930. Remote Sens. 2024, 16, 4517. [Google Scholar]
  35. Jaeger, J.A.G. Landscape division, splitting index, and effective mesh size: New measures of landscape fragmentation. Landsc. Ecol. 2000, 15, 115–130. [Google Scholar]
  36. Zhang, X.L.; Li, Z.; Li, D.; He, Y.K. Marine Environment Distinctions and Change Law Based on eCongnition Remote Sensing Technology. J. Coast. Res. 2019, 94, 107–111. [Google Scholar]
  37. Jia, D.; Wang, C.J.; Mu, S.G.; Zhao, H. Vegetation spatial and temporal dynamic characteristics based on NDVI time series trajectories in grassland opencast coal mining. Ying Yong Sheng Tai Xue Bao = J. Appl. Ecol. 2017, 28, 1808–1816. [Google Scholar]
  38. Lei, S.; Ren, L.; Bian, Z. Time-space characterization of vegetation in a semiarid mining area using empirical orthogonal function decomposition of MODIS NDVI time series. Environ. Earth Sci. 2016, 75, 516. [Google Scholar]
  39. Choudhury, D.; Das, K.; Das, A. Assessment of land use land cover changes and its impact on variations of land surface temperature in Asansol-Durgapur Development Region. Egypt. J. Remote Sens. Space Sci. 2019, 22, 203–218. [Google Scholar]
  40. Zhao, W.K.; Li, P.L.; Yang, B. New insight into the spatiotemporal distribution and ecological risk assessment of endocrine-disrupting chemicals in the Minjiang and Tuojiang rivers: Perspective of watershed landscape patterns. Environ. Sci. Process. Impacts 2024, 26, 1360–1372. [Google Scholar]
  41. Liu, C.F.; Li, J.Z.; Li, X.M.; He, X.Y.; Chen, W. Selection of landscape metrics for urban forest based on simulated landscapes. Ying Yong Sheng Tai Xue Bao = J. Appl. Ecol. 2009, 20, 1125–1131. [Google Scholar]
  42. Zhou, S.; Chang, J.; Hu, T.; Luo, P.J.; Zhou, H.X. Spatiotemporal Variations of Land Use and Landscape Ecological Risk in a Resource-Based City, from Rapid Development to Recession. Pol. J. Environ. Stud. 2020, 29, 475–490. [Google Scholar]
  43. Rao, J.; Ouyang, X.; Pan, P.; Huang, C.; Li, J.F.; Ye, Q.L. Ecological Risk Assessment of Forest Landscapes in Lushan National Nature Reserve in Jiangxi Province, China. Forests 2024, 15, 484. [Google Scholar] [CrossRef]
  44. Dai, X.; Huang, L.; Dai, Y. The Analysis of the Difference of Land-use Landscape Patterns between the Jinsha River Dry-hot Valley and the Redbed of Middle Yunnan Province-Based on the Typical Basins of the Redbed of Middle Yunan Province. In Proceedings of the 6th International Conference on Mechatronics, Computer and Education Informationization (MCEI), Shenyang, China, 11–13 November 2016. [Google Scholar]
  45. Liu, S.; Liu, Y.; Wang, A.; Luo, Y.F.; Li, W.G.; Zhang, W.H.; Mao, D.Q.; Wang, S.L.; Mukherjee, I.; Wang, J. Machine learning-based prediction of landscape pattern variations: A case study in the Yushenfu mining area, northern Shaanxi, China. Environ. Earth Sci. 2024, 83, 201. [Google Scholar] [CrossRef]
  46. Liu, Y.; Xu, J.; Yuan, Z.; Sha, Z.G. Analysis of the influence of the water balance process on the change of landscape patterns in the upper reaches of the Yangtze River. Water Policy 2022, 24, 261–281. [Google Scholar] [CrossRef]
  47. Jin, T.T.; Zhang, Y.X.; Zhu, Y.H.; Guo, J. Spatiotemporal variations of ecosystem service values and landscape ecological risk and their correlation in forest area of Loess Plateau, China: A case study of Ziwuling region. Ying Yong Sheng Tai Xue Bao = J. Appl. Ecol. 2021, 32, 1623–1632. [Google Scholar]
  48. Zhang, M.; Wang, J.; Zhou, R. Sustainable effect of coal mining on hydrological drought risk: A case study on Kuye river basin, China. Nat. Hazards 2020, 103, 2929–2943. [Google Scholar] [CrossRef]
Figure 1. Remote sensing imagery of the study area.
Remotesensing 17 01162 g001
Figure 2. Schematic diagram of internal and external division of mining area.
Remotesensing 17 01162 g002
Figure 3. Spatial and temporal distribution of land use types in the Zhungeer mining area from 1985 to 2020.
Remotesensing 17 01162 g003
Figure 4. Sankey map of land use changes in Zhungeer mining area from 1985 to 2020 (ha).
Remotesensing 17 01162 g004
Figure 5. Temporal and spatial variation map of mining pit scope in Zhungeer mining area (The direction of the yellow arrow in the picture is the advancing direction of the Zhungeer open-pit coal mine).
Remotesensing 17 01162 g005
Figure 6. Temporal and spatial variation map of vegetation restoration area in Zhungeer mining area.
Remotesensing 17 01162 g006
Figure 7. Statistical chart of mining pit and vegetation restoration area in Zhungeer mining area.
Remotesensing 17 01162 g007
Figure 8. Time series variation diagram of NDVI spatial distribution in the research area.
Remotesensing 17 01162 g008
Figure 9. Contribution value model of NDVI change inside the mining area to the outside of the mining area.
Remotesensing 17 01162 g009
Figure 10. Time series variation diagram of NDBI spatial distribution in the research area.
Remotesensing 17 01162 g010
Figure 11. Landscape index change curve of internal, external, and whole area in Zhungeer mining area.
Remotesensing 17 01162 g011
Figure 12. Interannual variation in Fitness Index in the study area.
Remotesensing 17 01162 g012
Table 1. Details of data used.
No.TimeData UsedSpatial ResolutionPath and RowData Description
11986Landsat 5 (TM)Other bands 30 m
Band-6 120 m
126 and 32LT05_L1TP_126032_19860624_20200918_02_T1
21990126 and 32LT05_L1TP_126032_19900822_20200916_02_T1
31995126 and 32LT05_L1TP_126032_19950703_20170107_01_T1
42000127 and 32LT05_L1TP_127032_20000723_20200906_02_T1
52005126 and 32LT05_L1TP_126032_20050730_20161125_01_T1
62010126 and 32LT05_L1TP_126032_20100712_20200823_02_T1
72015Landsat 8 (OLI)Panchromatic 15 m Operational Land Imager 30 m
Thermal Infrared Sensor 100 m
127 and 32LC08_L1TP_127032_20150701_20200909_02_T1
82020126 and 32LC08_L1TP_126032_20200824_20200905_02_T1
Table 2. Statistics of Land Use Types and Areas from 1985 to 2020 (ha).
YearCroplandGrasslandBarrenImperviousForest
19853356.55 291.33 122.85 48.33 0.00
19903489.66 549.99 107.91 48.42 0.00
19953319.65 693.09 132.84 50.40 0.00
20002890.53 891.45 80.46 57.96 0.00
20052438.46 739.08 208.71 68.22 0.00
20101418.67 1149.57 314.28 352.62 0.36
20151023.57 1435.33 459.29 532.53 7.58
20201036.31 665.97 1100.72 646.21 7.49
p-value0.00040.07820.03270.000340.0258
Table 3. Statistics of NDVI value within the mining area.
YearNDVIminNDVImaxNDVImeanStd.
1985−0.23710.40940.04010.0347
1990−0.08770.62320.13540.0872
1995−0.15790.49620.03010.0334
2000−0.13430.39530.11410.0529
2005−0.13560.53020.15550.0795
2010−0.18520.50790.14610.0897
2015−0.02050.47080.18000.0730
2020−0.18460.51020.22460.1107
Table 4. Statistics of NDVI value outside the mining area.
YearNDVIminNDVImaxNDVImeanStd.
1985−0.38240.43280.04100.0417
1990−0.54930.64240.14190.0980
1995−0.50720.46670.02650.0460
2000−0.27500.40910.10290.0614
2005−0.43750.54740.14820.0957
2010−0.50000.64960.17490.1121
2015−0.21630.53190.18700.0666
2020−0.14300.57330.26240.0764
Table 5. NDVI change difference statistics.
YearΔNDVI
WithinOutside
1985–19900.09530.1009
1990–1995−0.1053−0.1154
1995–20000.0840.0764
2000–20050.04140.0453
2005–2010−0.00940.0267
2010–20150.03390.0121
2015–20200.04460.0754
Table 6. Statistics of NDBI value within the mining area.
YearNDBIminNDBImaxNDBImeanStd.
1985−0.17070.37570.25460.0281
1990−0.24020.41820.20120.0643
1995−0.08890.51480.27300.0273
2000−0.22000.51920.24240.0420
2005−0.16330.44830.17670.0577
2010−0.13080.44120.22660.0430
2015−0.24210.37340.01620.0436
2020−0.33470.1610−0.06850.0560
Table 7. Statistics of NDBI value outside the mining area.
YearNDBIminNDBImaxNDBImeanStd.
1985−0.6267 0.3858 0.2414 0.0866
1990−0.8387 0.5038 0.1797 0.1205
1995−0.7200 0.4672 0.2621 0.0813
2000−0.7273 1.0000 0.2305 0.0764
2005−0.6393 0.5016 0.1626 0.0877
2010−0.6812 0.5728 0.2034 0.0752
2015−0.3167 0.5848 0.0113 0.0446
2020−0.4110 0.4097 −0.0907 0.0581
Table 8. Annual statistical table of regional scale landscape index in Zhungeer region.
YearPDDIVISIONSPLITPRDSHDISHEI
198519.50960.59142.44760.01320.73730.4115
199017.33010.60392.52480.01320.74490.4158
199514.31540.58422.4050.01320.73140.4082
200012.41140.53752.16230.01320.69110.3857
200510.94590.49751.99020.01320.6840.3817
201012.81030.41511.70960.01320.63180.3526
201513.02620.38291.62050.01320.6060.3382
202013.61040.43851.78090.01320.69010.3852
Table 9. Annual statistical table of landscape index within mining areas in Zhungeer area.
YearPDDIVISIONSPLITPRDSHDISHEI
198519.23340.48411.93840.03560.65180.4702
199016.67790.53792.1640.03560.6570.4739
199513.98870.48981.95980.03560.65310.4711
200012.42160.42491.73870.03560.60010.4329
200511.6380.38631.62950.03560.60050.4332
201015.15520.31051.45040.04450.5850.3635
201517.55050.30341.43550.04450.60490.3758
202018.29010.44081.78820.04450.76440.4749
Table 10. Annual statistical table of external landscape index of mining areas in Zhungeer area.
YearPDDIVISIONSPLITPRDSHDISHEI
198519.90250.62312.65310.01760.7610.4247
199917.83490.6372.75450.01760.76930.4293
199514.75110.61692.61050.01760.75240.4199
200012.69820.5712.33120.01760.7130.3979
200510.97040.53062.13050.01760.6980.3896
201012.19450.44671.80730.01760.63080.3521
201511.76690.40611.68370.01760.58420.326
202012.31960.44421.79910.01760.61950.3457
Table 11. Fitness Index statistics at the regional scale of the study area.
Year19851990199520002005201020152020
FI0.38250.38640.379480.358860.355220.328520.315320.35836
Disclaimer/Publisher’s Note: The statements, opinions and data contained in all publications are solely those of the individual author(s) and contributor(s) and not of MDPI and/or the editor(s). MDPI and/or the editor(s) disclaim responsibility for any injury to people or property resulting from any ideas, methods, instructions or products referred to in the content.

