Article

A Simple Scenario for Explaining Asymmetric Deformation Across the Altyn Tagh Fault in the Northern Tibetan Plateau: Contributions from Multiple Faults

1
National Institute of Natural Hazards, Ministry of Emergency Management of China, Beijing 100085, China
2
Guangdong Provincial Key Laboratory of Geodynamics and Geological Hazards, School of Earth Science and Engineering, Sun Yat-Sen University, Zhuhai 519080, China
3
Southern Marine Science and Engineering Guangdong Provincial Laboratory (Zhuhai), Zhuhai 519080, China
*
Author to whom correspondence should be addressed.
Remote Sens. 2025, 17(7), 1277; https://doi.org/10.3390/rs17071277
Submission received: 11 February 2025 / Revised: 20 March 2025 / Accepted: 29 March 2025 / Published: 3 April 2025

Abstract

:
Asymmetric deformation has been observed along the Altyn Tagh Fault (ATF), the northern boundary of the Tibetan Plateau. Several mechanisms have been proposed to explain this asymmetry, including contrasts in crustal strength, lower crust/upper mantle rheology, deep fault dislocation shifts, and dipping fault geometry; however, the real scenario remains debated. This study utilizes a time series Interferometric Synthetic Aperture Radar (InSAR) technique to investigate spatially variable asymmetries across the western section of the ATF (83–89°E). We generated a high-resolution three-dimensional (3D) crustal velocity field from Sentinel-1 data for the northwestern Tibetan Plateau (~82–92°E; 33–40°N). Our results confirm that pronounced greater deformations within the Tibetan Plateau occur only along the westernmost section of the ATF (83–85.5°E). We propose this asymmetry is primarily driven by a splay fault system within a transition zone, bounded by the ATF in the north and the Margai Caka Fault (MCF)–Kunlun Fault (KLF) in the south, which accommodates an east–west extension in the central Tibetan Plateau while transferring sinistral shear to the KLF. The concentrated strain observed along the ATF and MCF–KLF lends more support to a block-style eastward extrusion model, rather than a continuously deforming model, for Tibetan crustal kinematics.

1. Introduction

Deformation across strike-slip faults is theoretically expected to be symmetric, as described by the elastic screw dislocation model [1], which has been widely applied to invert slip rates of strike-slip faults using geodetic observations. However, asymmetric interseismic deformation has been observed along several major strike-slip faults, including the North Anatolian Fault [2], the Sumatra Fault [3], the San Andreas Fault [4,5], the Xianshuihe Fault [6], and the Altyn Tagh Fault (ATF) [7,8,9,10,11,12,13,14,15]. Asymmetry is also often evident in coseismic displacements, as exemplified by the 1906 San Francisco earthquake [16], the 1997 MW 7.6 Manyi (Tibet) earthquake [17], the 2001 MW 7.8 Kokoxili (Tibet) earthquake [18], and the 2013 MW 7.7 Balochistan earthquake [19,20], and within fault damage zones [21]. The degree of asymmetry can vary significantly among faults, with a ratio of deformation magnitude across the fault ranging from 1.2 to 30 [2]. This phenomenon provides valuable insights into key parameters, such as fault geometry at depth, the layered structure of the lithosphere, and the rheological properties of the crust. Understanding the underlying physical mechanisms is crucial for assessing earthquake potential and developing geodynamic models of crustal movement.
Since the collision of the Indian and Eurasian plates ~50 Ma ago, the Tibetan Plateau has undergone a process from uplift to thinning [22,23]. The ATF plays a significant role in the tectonic evolution of the Plateau [22,24]. It runs a length of ~1200 km in the direction of ~N70°E and may have been displaced left-laterally by 350–470 km [25,26]. Its slip rate derived in early studies, constrained by the data and technical methods available at that time, suggested it was as high as >20 mm/yr [27,28]. With the following detailed fieldwork and improvement of geodetic observation, a consensus has gradually been reached among geological, paleoseismological, and geodetic studies supporting a left-slip rate of 8–12 mm/yr [9,12,25,29,30,31,32,33,34,35,36,37,38,39] (Figure 1).
Some studies have noted interseismic deformation asymmetry across the ATF, although comprehensive investigations are lacking. Existing work often focuses on localized segments or the near-field, failing to capture the full asymmetric morphology and complicating the analysis of physical origins. Jolivet et al. [10], using descending ERS and ENVISAT Synthetic Aperture Radar (SAR) data, first observed the asymmetric interseismic deformation near ~94°E, with a wider deformation zone on the Qaidam Basin side; they proposed that the asymmetry resulted from a southward fault offset by 5–7 km at depth (close to the southern branch of the ATF) together with a rigidity contrast of 0.85 between the Tarim Basin and the Tibetan Plateau crust. Elliott et al. also observed asymmetric interseismic deformation near 85°E using descending ERS-1/2 data [7], but with a pattern opposite to that in the east, i.e., a large deformation gradient into the Tarim Basin, which is inconsistent with the higher crustal rigidity of the Tarim Basin. With GPS observation, He et al. [9] proposed a southward fault offset of 13 km at depth near ~86.2°E. Zhu et al. also observed asymmetry with ENVISAT data near 85°E but did not provide details [15]. Using Sentinel-1 data, Liu et al. [12] identified asymmetric deformation near 83.5°E and 85°E but also did not characterize details, proposing a contribution from a contrast in elastic layer thickness and shear modulus beside the fault. Ge et al. [8], supplementing the existing GNSS network with seven new continuous GNSS stations near ~90°E, found twice the shear in the south between 86°E and 90°E and proposed a significantly smaller effective elastic thickness on the south side as the cause. Luo et al. identified significant asymmetric deformation with Sentinel-1 data near 85°E [13], attributing it to the combined contribution of several adjacent, sub-parallel active faults, but did not quantify the effect. Shen et al. demonstrated that strain localization is variable [14], with strain concentrated at the fault in some sections and distributed across a broad area in others, implying a significant role for sub-parallel faults in shaping the overall deformation field. Liu et al. found asymmetric interseismic strain in the velocity profile across the ATF and proposed that this asymmetry results from the combined effects of decreasing rigidity from the Tarim Basin to the Tibetan Plateau and a southward offset of fault location [11].
Conversely, other studies have not observed asymmetric deformation [40,41,42]. For example, Li et al. [40], combining GNSS and ENVISAT data, found no evidence of asymmetry near ~86°E. At ~94°E, where southward asymmetry was observed [10], Wang et al. also did not detect a significant asymmetric pattern across the ATF using Sentinel-1 data [41], attributing the asymmetry in interseismic deformation across the wide zone (from Tarim Basin to Qaidam Basin) to secondary faults. Using ENVISAT data (2003–2010) near ~85°E, Zhang et al. found that strain was not concentrated along only the ATF but also four other subsidiary faults to the south [42].
The northwestern Tibetan Plateau, characterized by a high altitude, cold climate, and sparse population, presents significant challenges for GNSS observations. The existing GNSS network lacks sufficient spatial resolution to capture subtle variations in deformation gradients, both perpendicular and parallel to the fault [43,44,45,46,47]. Previous studies largely focused on the ATF itself, utilizing data within a narrow zone (<200 km) surrounding the fault [11,14,41]. However, accurate characterization of large-scale crustal motion is usually essential for inverting the fault slip rate. To address the limitation, we employed Sentinel-1 SAR data to produce a large-scale deformation field encompassing the northwestern Tibetan Plateau, which enables an accurate depiction of the asymmetric characteristics in the vast region. We tested interpreting the asymmetry using a simplified model, the cumulative contribution of multiple parallel faults, and obtained good results.
Figure 1. Map of the ATF. The shaded background is the topography. White areas are lakes. Black lines are mapped active faults [48]. Dotted lines are suture zones. JSS: Jinsha Suture; AKMS: Anymaqen–Kunlun–Muztagh Suture. Beach balls are GCMT mechanisms for M ≥ 6 earthquakes (https://www.globalcmt.org/, accessed on 18 March 2025). Green arrows are GNSS horizontal velocity vectors [45], relative to the rigid Tarim Basin. Black solid symbols are geological fault slip rates, with circles for Cowgill et al. [29], squares for Cowgill et al. [30], diamonds for Gold et al. [31], triangles for Liu et al. [35], stars for Zhang et al. [38], and hexagons for Xu et al. [37], respectively. Blue hollow symbols are geodetic slip rates, with circles for Liu et al. [34], squares for Liu et al. [12], diamonds for Zhao et al. [39], triangles for Li et al. [32], stars for Zhu et al. [15], and hexagons for He et al. [9], respectively. The blue dashed polygons represent the coverage of geodetic data used in Elliott et al. [7], Ge et al. [8], and Jolivet et al. [10]. The blue dashed line shows the profile location of Jolivet et al. [10].
Remotesensing 17 01277 g001

2. Materials and Methods

2.1. Sentinel-1 SAR Data

The European Space Agency (ESA)’s Sentinel-1 C-band SAR data were used to derive the crustal deformation. The footprint of one standard Sentinel-1 Interferometric Wide Swath (IW) image covers a geographical area of ~250 km × 180 km over the Tibetan Plateau. To fully cover the study area, we used data from 5 ascending tracks and 5 descending tracks, mosaicking 5–6 frames along each track (Table 1).

2.2. Time Series InSAR Processing

The open-source software GMTSAR version 5.5.0 [49] was used to perform the InSAR analysis. The processing was automated using iGPS software (https://github.com/igps-ftk/iGPS, accessed on 1 October 2024) [13,50]. Conventional processing steps were followed as detailed in Luo et al. [13], with detailed information found in Text S1 in the Supplementary Materials. For each track, interferograms were initially generated by subswath (iw1/iw2/iw3) without unwrapping. To minimize discontinuities across frame boundaries, data acquired on the same date were first mosaicked by subswath. All images were geometrically aligned to a reference one, with burst discontinuities further reduced using the Enhanced Spectral Diversity (ESD) [51] method. Hundreds of interferograms were created per track, with 30% of them having temporal baselines exceeding one year, enabling the detection of weak tectonic signals. A multilook factor of 32:8 was applied, resulting in a pixel size of ~200 m in the derived deformation field. Topographic phase was removed using the 90 m Shuttle Radar Topography Mission (SRTM) Digital Elevation Model [52]. Speckle noise was suppressed by applying the Goldstein filter [53]. Interferograms from all three subswaths were merged, and phase unwrapping was performed using Snaphu version 2.0.4 [54] in continuous deformation mode with Minimum Cost Function (MCF) initialization. A planar trend was removed from the unwrapped phase to mitigate long-wavelength noise. Atmospheric delays were not explicitly corrected using models like GACOS [55] due to their limited impact in this study area, as determined by preliminary analysis. Mean line-of-sight (LOS) velocity fields were derived using coherence-based SBAS time series analysis [56]. Pixels with coherence values below 0.05 were masked out to remove decorrelated areas.
The derived rate maps are shown in Figure 2. A key feature in the rate maps is the contrasting sense of motion along two major fault zones (Figure 2), the ATF, marking the northern edge of the Tibetan Plateau, and the Jinsha Suture (JSS)–Margai Chaka Fault (MCF)–Kunlun Fault (KLF) zone, separating the northern Tibetan Plateau (the Songpan-Ganzi Terrane) and central Tibetan Plateau (the Qiangtang Terrane). This is consistent with the known patterns of Tibetan crustal movement.

2.3. Three-Dimensional (3D) Deformation Field Reconstruction

InSAR only measures deformation in the LOS direction of the SAR sensor. It is preferable to analyze fault movement based on a 3D deformation field, since a single-view LOS deformation field may not reflect the real spatial morphology of surface deformation, as exemplified by the remarkable difference in coseismic displacements obtained from ascending and descending views in terms of spatial coverage, slip direction, and magnitude.
The relationship between the 3D crustal displacements and their LOS projection is [57]
i = sin ( θ ) n sin ( φ ) e cos ( φ ) + u cos ( θ ) ,
where i is the InSAR LOS displacement; n, e, and u are the north–south, east–west, and vertical displacements, respectively; φ is the orbital direction; and θ is the local incidence angle.
We first transformed the InSAR LOS velocities into the GNSS frame. The GNSS horizontal velocities [45] were first transformed into the frame of the Tarim Basin in order to remove the trend in velocity profile constructed later. The GNSS horizontal velocities were projected onto the LOS direction by accounting for the varying SAR imaging geometry. Then, the differences between the projected GNSS velocities and the InSAR velocities were calculated and used to fit a planar trend surface that was lastly subtracted from the InSAR rate map. The resulting rate maps from adjacent tracks showed good agreement within overlapping areas (Figure 2).
With Equation (1), the 3D velocity field was derived at pixels where at least one ascending and one descending LOS velocities (1A + 1D) exists. We downsampled the ground resolution from ~200 m to ~2 km in the 3D deformation field to reduce the computation burden but keep the spatial details of the asymmetric deformation, which we focused on in this work. In Equation (1), there are three unknowns to be solved, i.e., the crustal movement in three directions (e—east–west; n—north–south; u—vertical), with the satellite orbit direction φ and the incident angle θ being known quantities, and i being the observed quantity (InSAR LOS deformation). In most areas, Sentinel-1 can only provide two-view observations, i.e., 1A + 1D, leaving the linear equations underdetermined. Considering that InSAR is insensitive to north–south fault movement and that the faults we are studying are primarily in strike of nearly the east–west direction, if we use GNSS north–south velocities, interpolated from the discrete GNSS results, as the measurement of n in Equation (1), we can directly solve for the remaining two unknowns (e and u). In overlapping areas of adjacent tracks, there may be more views (e.g., 1A + 2D, 2A + 1D, or 2A + 2D). In such cases, the least squares method is used to solve for the unknowns, still with the GNSS north–south velocity as the constraint of n in Equation (1).

3. Results

3.1. Overall Pattern of Deformation Field in the Northwestern Tibetan Plateau

The most prominent signal in our InSAR-derived 3D crustal deformation field is the left-slip of the ATF (Figure 3a), consistent with its rapid slip rate of 8–12 mm/yr [36]. The deformation of the 2020 MW 6.4 Nima normal earthquake [58] in Central Tibet is also apparent. However, it is primarily in the vertical direction, and the seismogenic fault, the Yibu Chaka Fault, lies approximately 200 km south of the Kunlun Fault; thus, it does not affect our analysis of fault motion of the ATF. Furthermore, clear velocity contrast across the surface rupture of the 1997 MW 7.6 Manyi earthquake is also evident, indicating postseismic deformation persists even two decades after the event [59,60].
To characterize regional strain patterns, we constructed fault-parallel velocity profiles along the JSS–MCF–KLF zone, another prominent left-slip boundary south of the ATF. This zone is affected by recent large earthquakes: the 1997 MW 7.6 Manyi earthquake on the MCF [17] and the 2001 MW 7.8 Kokoxili earthquake on the Kunlun Fault [61]. While some researchers attribute both events to the Kunlun Fault, the MCF belongs to the distinct tectonic setting of the central Tibetan Plateau’s V-shaped conjugate strike-slip fault system. Furthermore, the Kunlun Fault forms the northern boundary of the Songpan-Ganzi Terrane, while the MCF lies near the southern margin of this terrane [62], suggesting they are likely distinct geological structures. Nevertheless, we consider the MCF–KLF zone as the southern boundary based upon the closeness of the observed concentrated deformation on them. The westward extent of left-lateral slip on the MCF is unclear. ENVISAT SAR data revealed a 4–8 mm/yr left-lateral slip rate along the JSS near 84–85°E [63]. Therefore, we extended the southern edge westward along the JSS. Fault-parallel velocity profiles perpendicular to the JSS–MCF–KLF zone’s overall trend (Figure 4) were then constructed at a spacing of 10 km.
These profiles confirm that the ATF and the JSS–MCF–KLF are the most prominent fault zones accommodating sinistral shear within the northwestern Tibetan Plateau (Figure 4). No visible shear exists to the north of the ATF, and only a modest portion (~5 mm/yr out of 23 mm/yr) of eastwards extrusion exists south of the JSS–MCF–KLF zone. The velocity profiles suggest the presence of an additional structure in-between, e.g., near the Anymaqen–Kunlun–Muztagh Suture (AKMS) at 87°E (Figure S2 in the Supplementary Materials). The third fault is required to accommodate the remaining shear strain in the northwestern Tibetan Plateau. This led us to incorporate the Heishibeihu Fault (HF)–AKMS into the splay fault model. Consequently, our fault model incorporates three structures that accommodate the left-lateral shear within the region: (1) the JSS–MCF–KLF, (2) the HF–AKMS, and (3) the ATF.
The profiles show significant asymmetry across the ATF in the west (<85°E), e.g., at profile AA’–CC’ in Figure 4, with larger deformation on the southern side (the Tibetan Plateau), which is consistent with a more rigid Tarim Basin. However, the velocity gradient is smooth from north to south; the strain concentration on an individual fault is not clearly distinguishable. In the east, velocity profiles clearly show that strain accumulation primarily occurs along the ATF and the JSS–MCF–KLF, e.g., profile GG’ in Figure 4.

3.2. Inversion of Fault Slip Rate

The slip rates and locking depths were estimated using the screw dislocation model [1]:
v = S 1 π arctan ( x 1 γ 1 D 1 ) + S 2 π arctan ( x 2 γ 2 D 2 ) + S 3 π arctan ( x 3 γ 3 D 3 ) + μ ,
where x is the distance to the fault trace (in km); v is the observed fault-parallel velocity (in mm/yr) at location x; D is the locking depth of the fault plane (in km); S is the slip rate (in mm/yr) between the freely creeping sides beneath the locked upper layer; γ is the shift to compensate for mapped fault trace uncertainty; μ is the velocity shift; the subscripts 1–3 represent the JSS–MCF–KLF, the HF–AKMS, and the ATF, respectively. Because the ATF, HF–AKMS, and JSS–MCF–KLF zones are roughly parallel in strike, we ignored the strike difference among them.
The unknown parameters (S, D, γ, and μ) were estimated with the Delayed-Rejection Adaptive Metropolis (DRAM) version of the Markov Chain Monte Carlo (MCMC) method [64]. The a priori values and ranges for parameters were specified as shown in Table 2.
Figure 5 presents the optimized estimates of fault position shifts, slip rates, and locking depths for all profiles. The three-fault model effectively accounts for the first-order asymmetry in the interseismic deformation, although minor residual asymmetry remains locally. East of 86°E, shear strain is predominantly accommodated by the ATF and the KLF; west of 86°E, however, the intermediate fault (the HF–AKMS) is required to explain the asymmetric deformation. And by incorporating the HF–AKMS into the model, slip rate estimates for the ATF between 83 and 85°E are lower than the commonly accepted slip rate of ~10 mm/yr [36]; the large uncertainty in estimate indicates that the model cannot well resolve the individual contribution from the ATF and the HF–AKMS. The ATF and HF may merge into one at depth along this section. The slip rate of the JSS–MCF–KLF increases gradually from west to east, consistent with the east–west extension in the central Tibetan Plateau. Along the MCF, geological offset and dating once yielded an average left-slip rate of 10 ± 2.2 mm/a [65], which is consistent with a slip rate of 10.2 ± 0.4 mm/yr derived using ERS2 data spanning 1.63 years [66] but much larger than the rate of 3 ± 2 mm/yr obtained by Bell et al. [67]. Our InSAR-derived deformation field reveals a sinistral slip rate of ~6 mm/yr along the MCF two decades after the 1997 MW 7.6 Manyi earthquake (Figure 4 and Figure 5b), lying in the middle of previous estimates.
The estimated shallow locking depths (Figure 5c) align well with the locations of strong earthquakes that occurred in the last three decades, e.g., at the MCF for the 1997 MW 7.6 Manyi earthquake [17], confirming the presence of postseismic deformation [59,60,68]. Notably, there are two segments on the ATF with relatively shallow locking depths, i.e., near 83.5°E and 84.8°E, potentially indicating postseismic deformation due to the 1924 double M > 7 earthquakes. Fieldwork has suggested that these two events rupture a total length of ~160 km between 83.6°E and 85.2°E [69]; however, the larger locking depths in the middle suggest that the middle part was not ruptured.

3.3. Residual Asymmetric Deformation

The three-fault model suggests that the asymmetric deformation across the ATF is primarily accommodated by the HF–AKMS and the JSS–MCF–KLF structures. However, is some degree of residual asymmetry still present? During the MCMC simulation, we permitted all faults to have a maximum trace offset of 30 km (Table 2). Consequently, the estimated offset of the ATF (Figure 5a) can serve as a metric to assess whether a significant residual asymmetry persists, which shows that the remaining asymmetric deformation along the ATF is spatially variable.
(1)
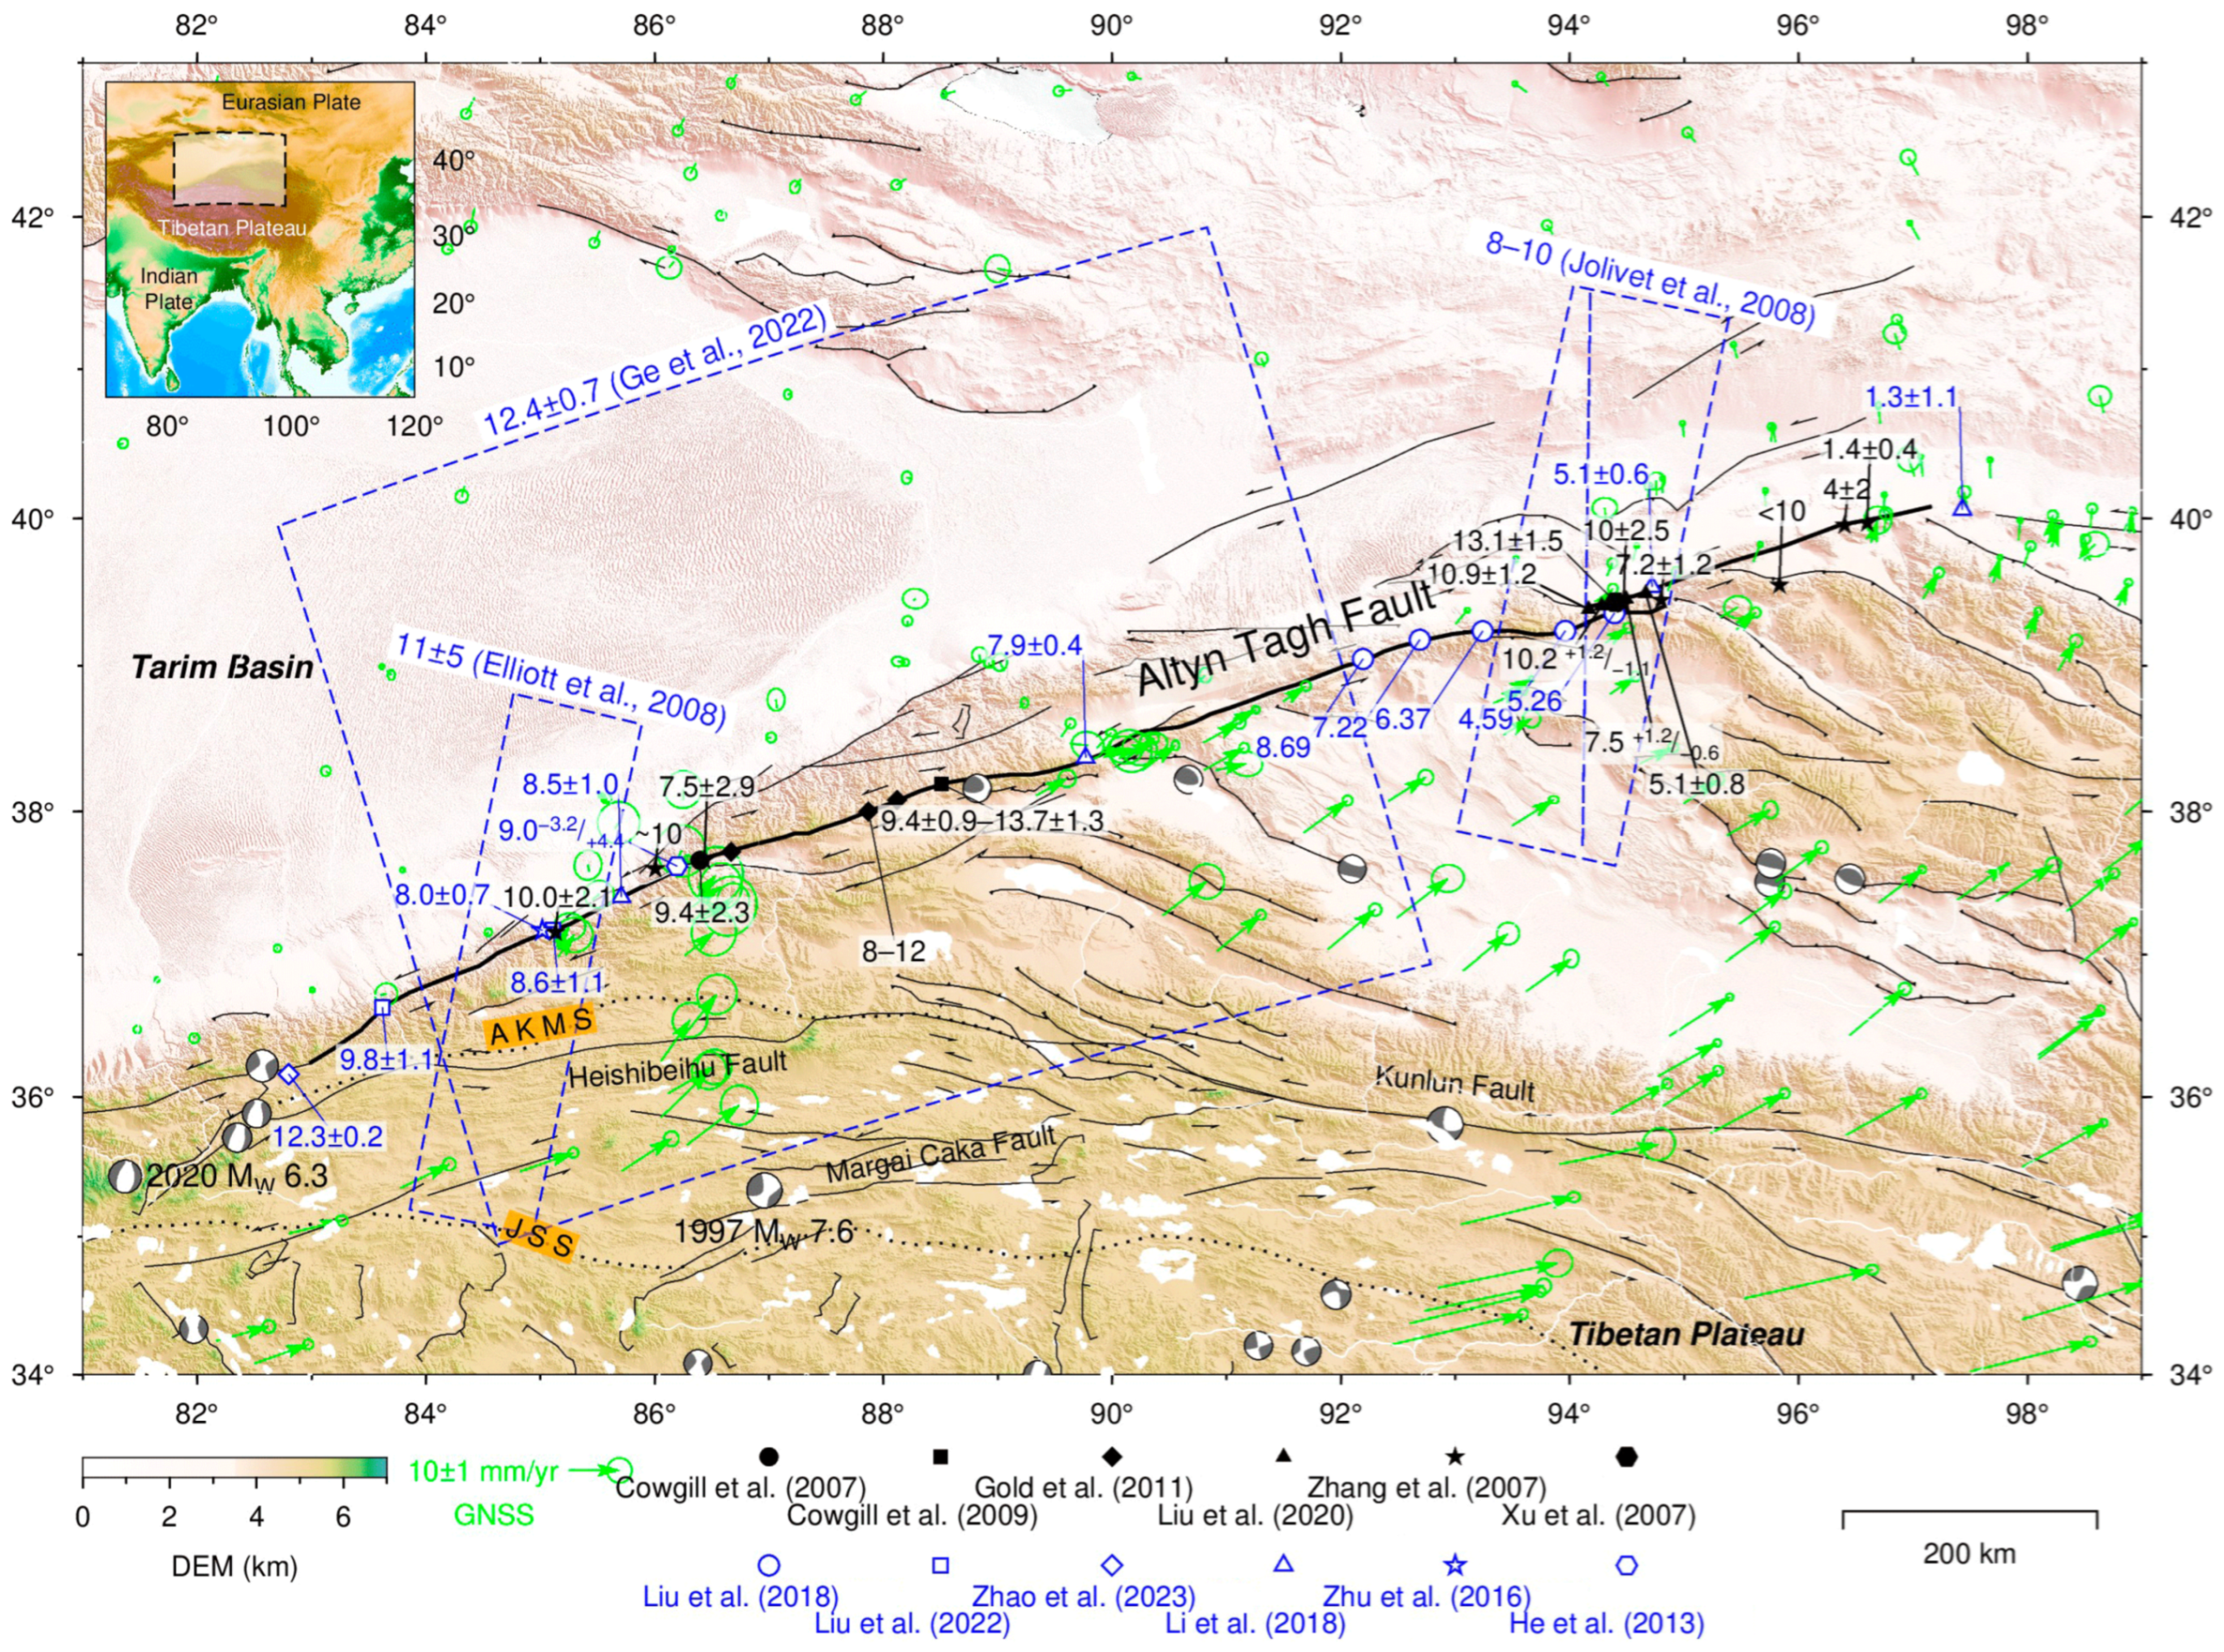
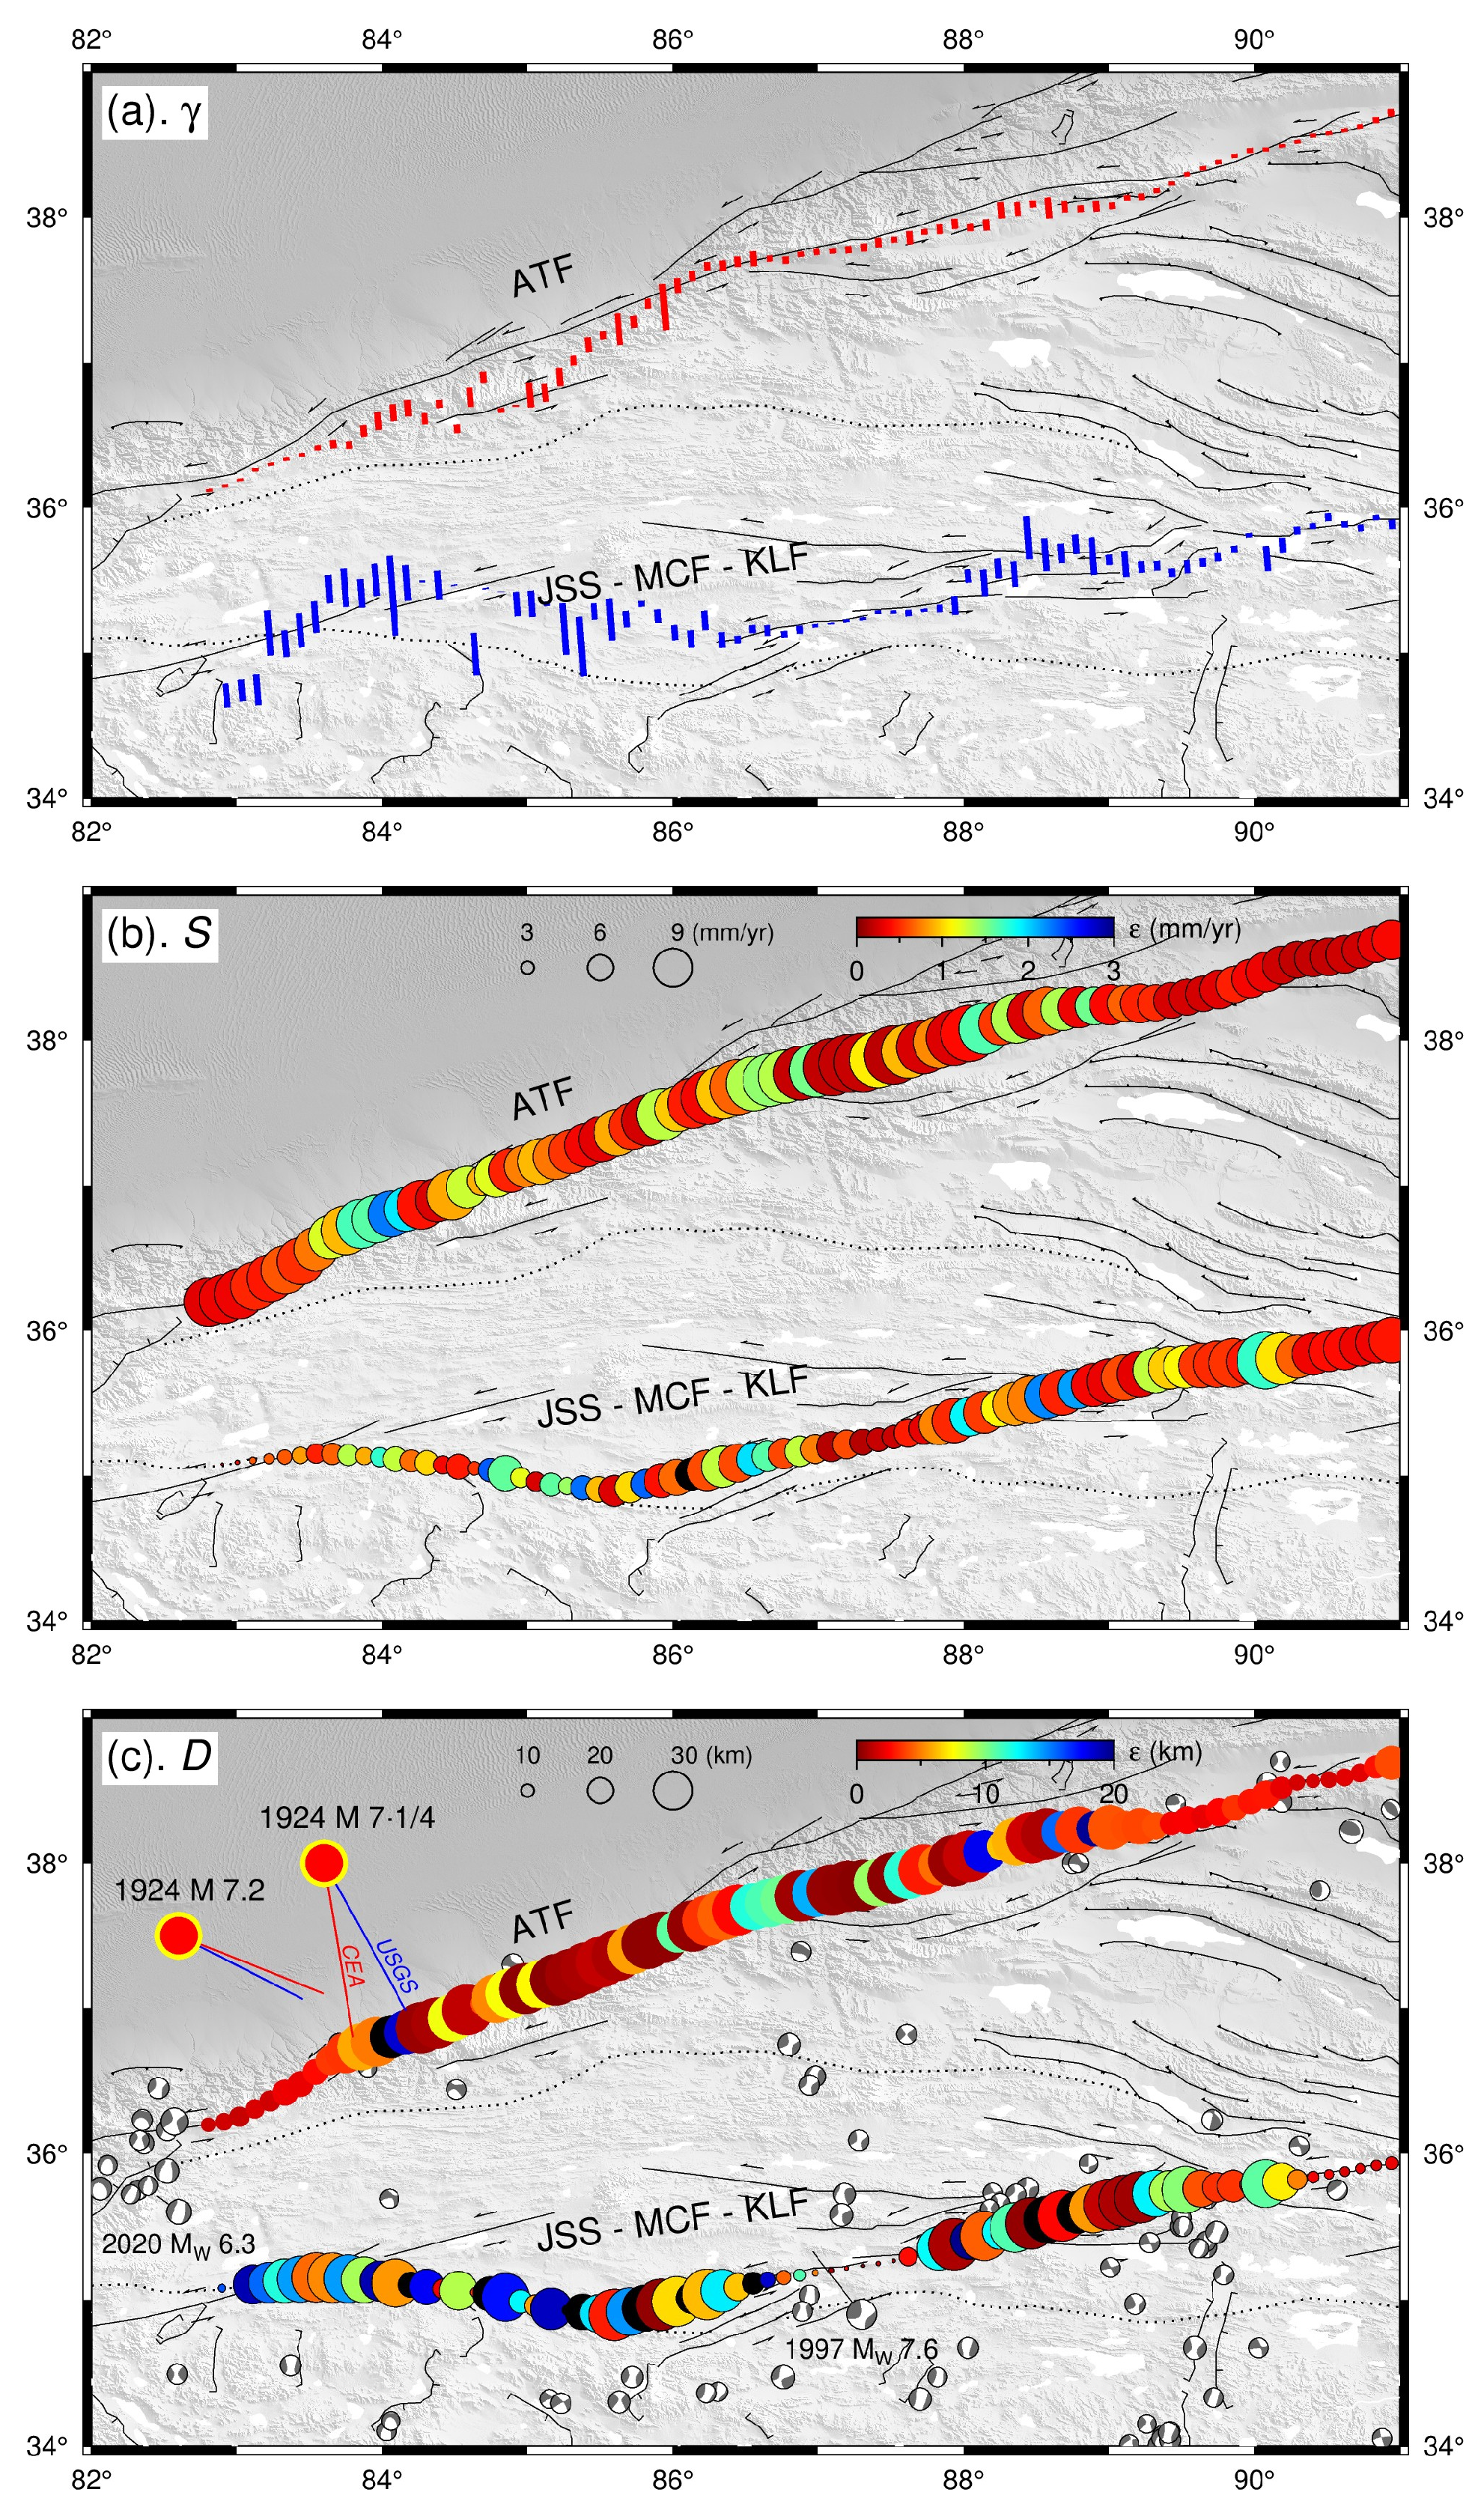
At approximately >88°E along the ATF, a southwards fault offset of around 10 km is commonly observed, as depicted in Figure S3 in the Supplementary Materials. This aligns with observations in the eastern section utilizing InSAR [10] and employing GNSS [8]. Geological investigations indicate that around ~89°E, the ATF bifurcates into two branches. According to the fault offset estimates in this study, contemporary deformation primarily occurs on the south branch, which is consistent with the findings at ~94°E using ENVISAT data [10].
(2)
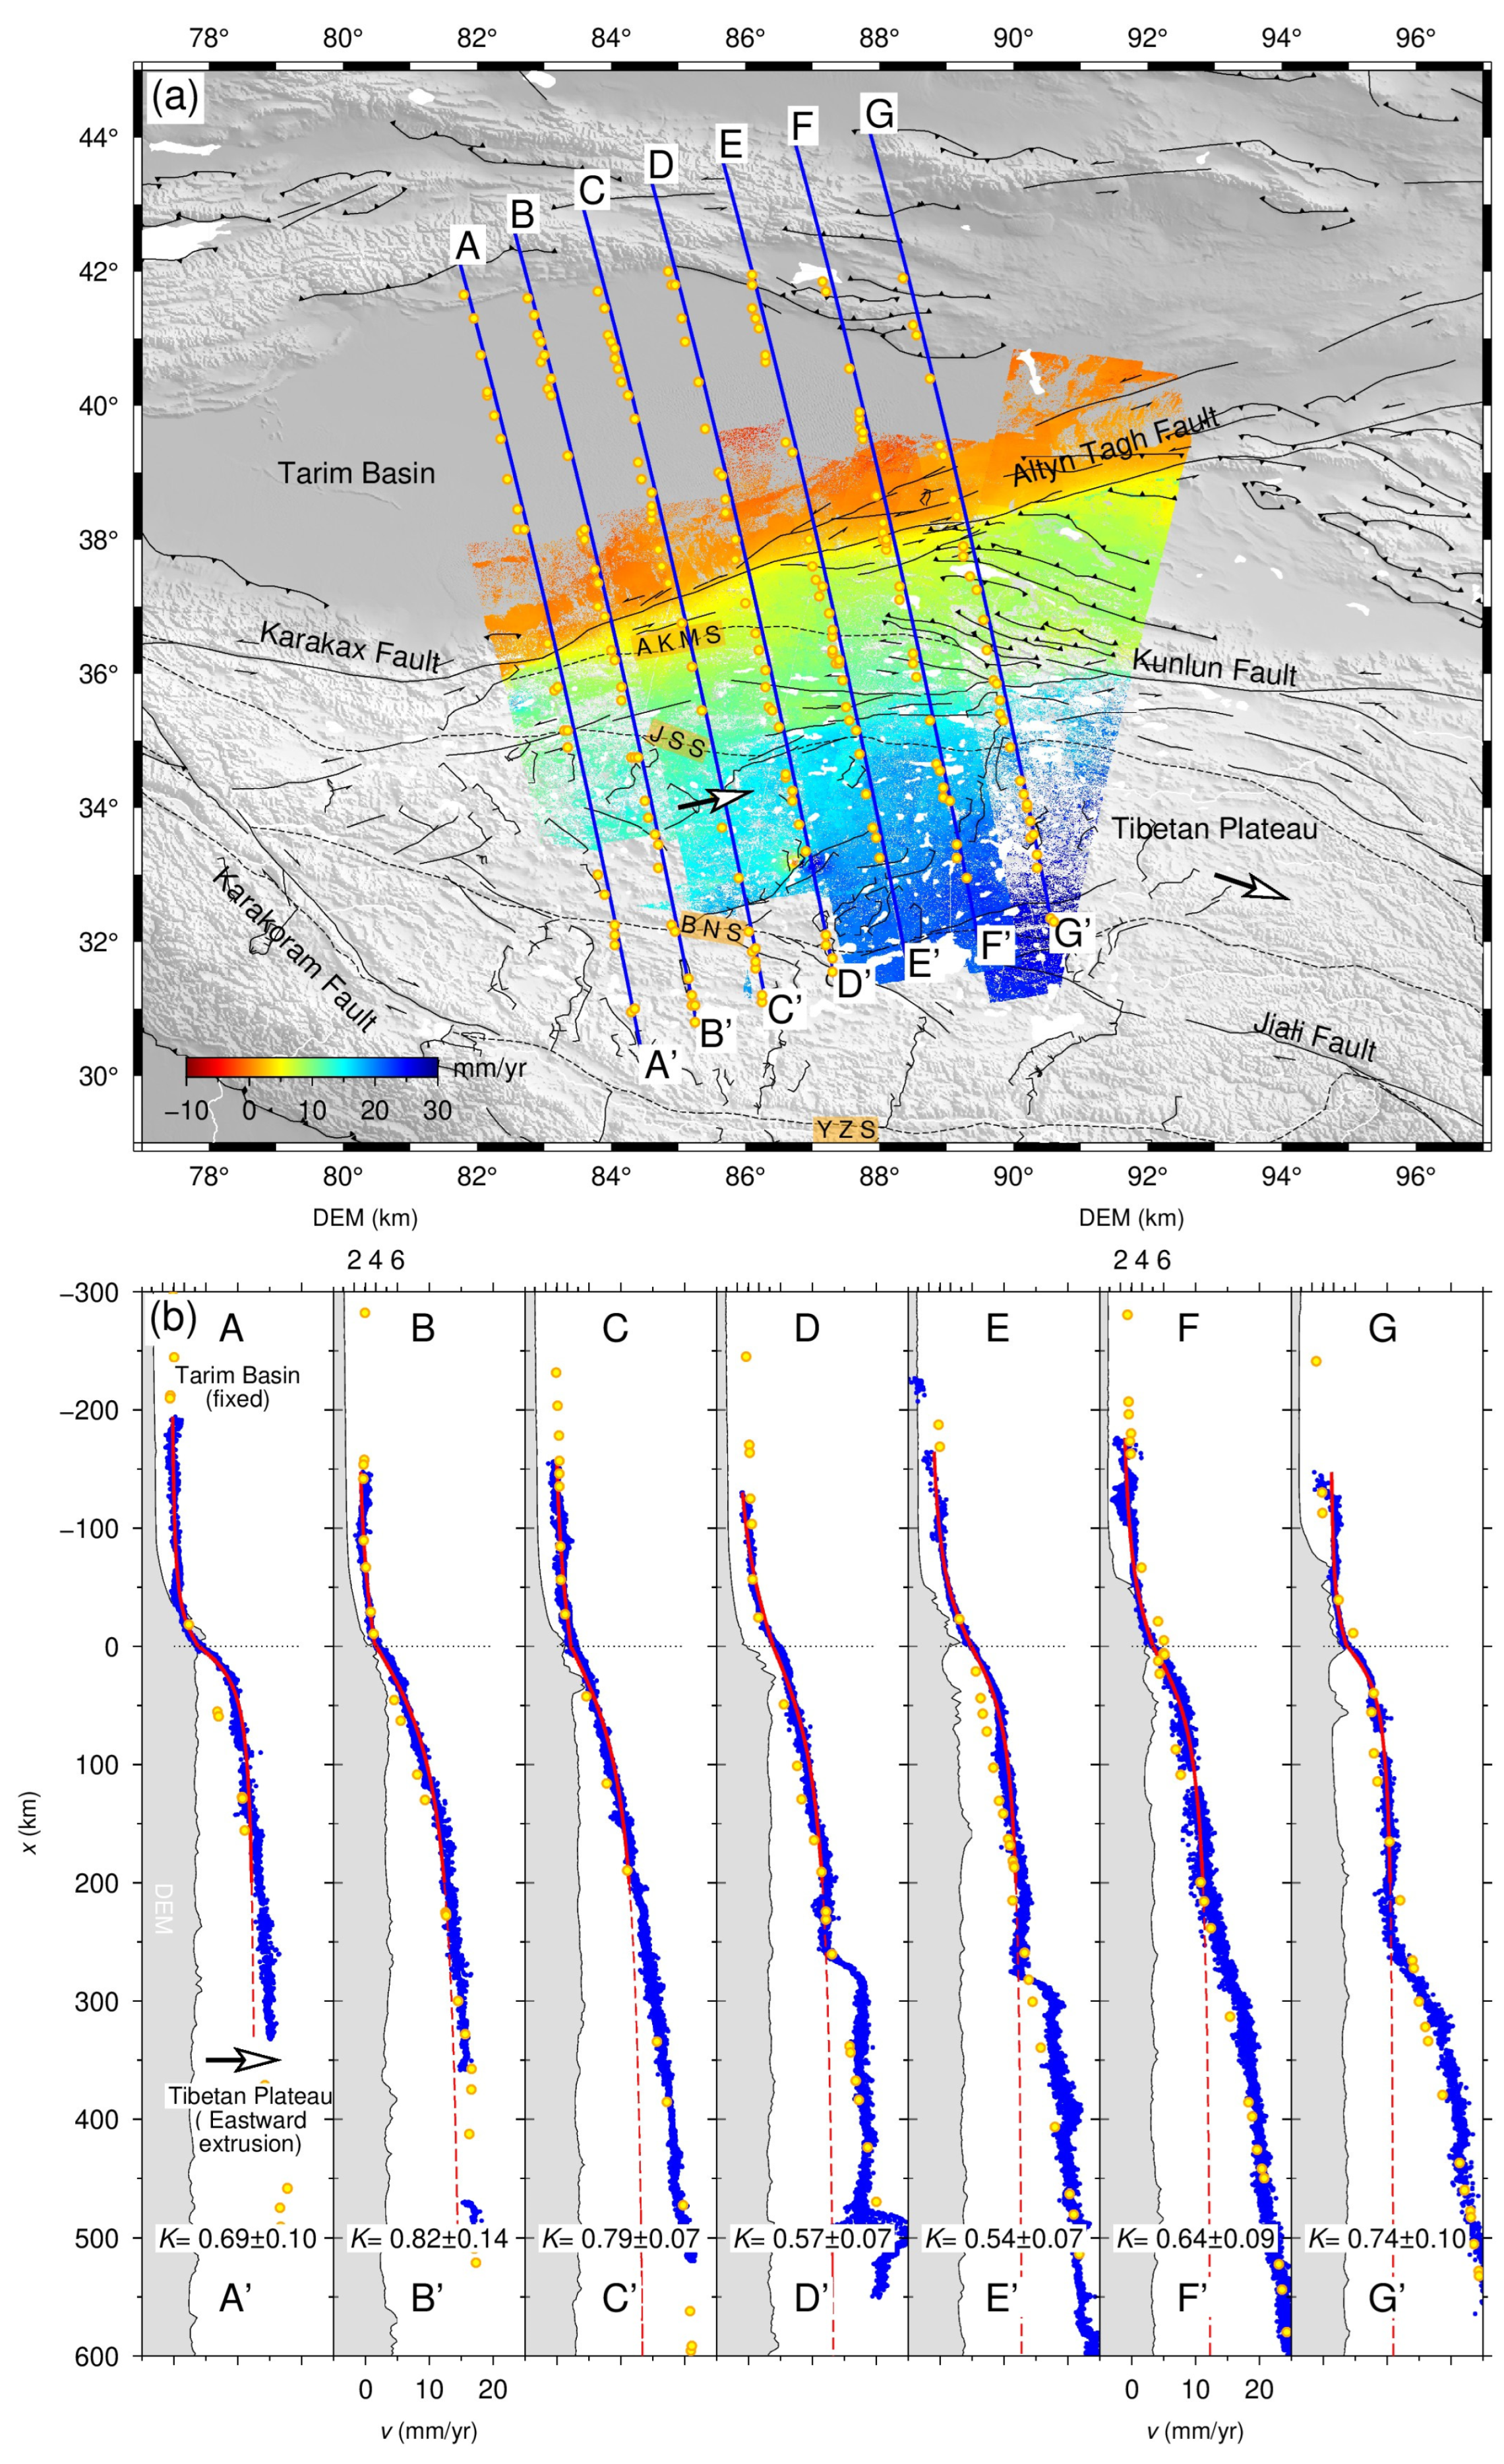
In the central section near 85.5–86.5°E, there is a northward asymmetry with larger deformation towards the Tarim Basin side. This pattern is illustrated by a specific example near 86.4°E across the ATF, as shown in Figure S4 in the Supplementary Materials. This gradient pattern aligns with the InSAR observation around ~85°E [7], where the maximum deformation gradient was observed about 10 km into the Tarim Basin side. However, it contradicts the GNSS results at ~86°E, which suggest a southward offset of ~13 km at depth into the Tibetan Plateau [9].
(3)
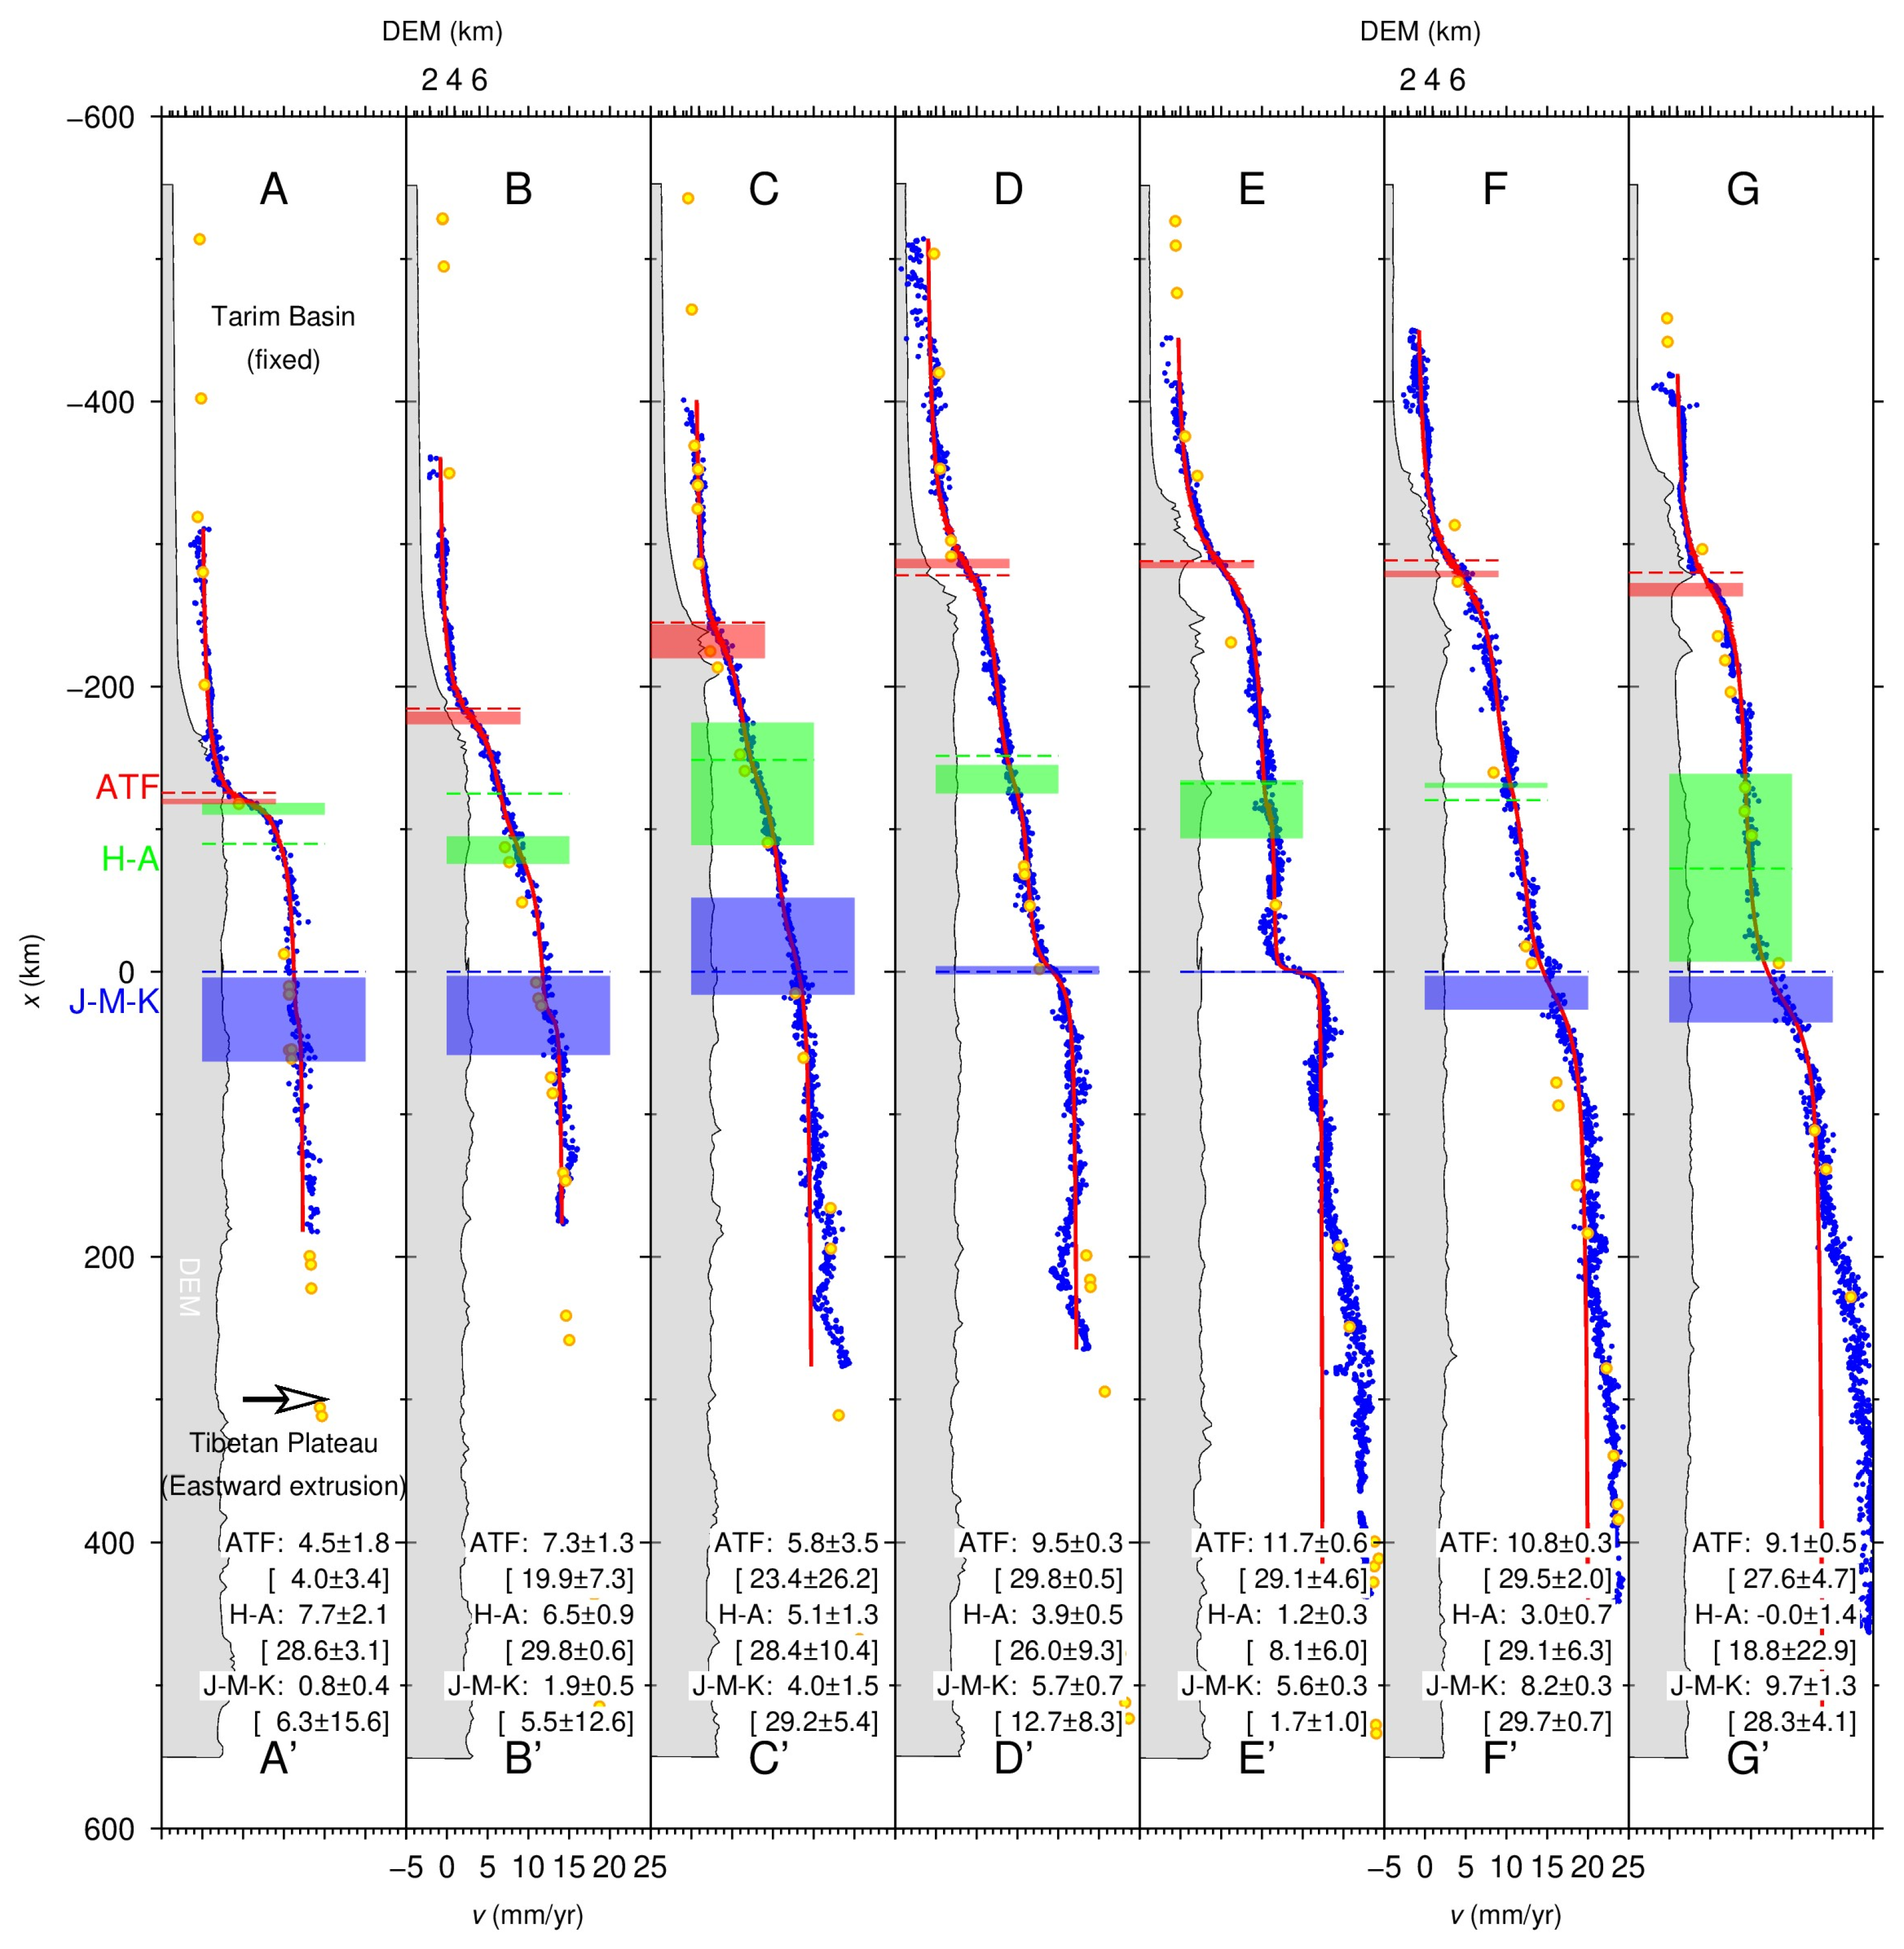
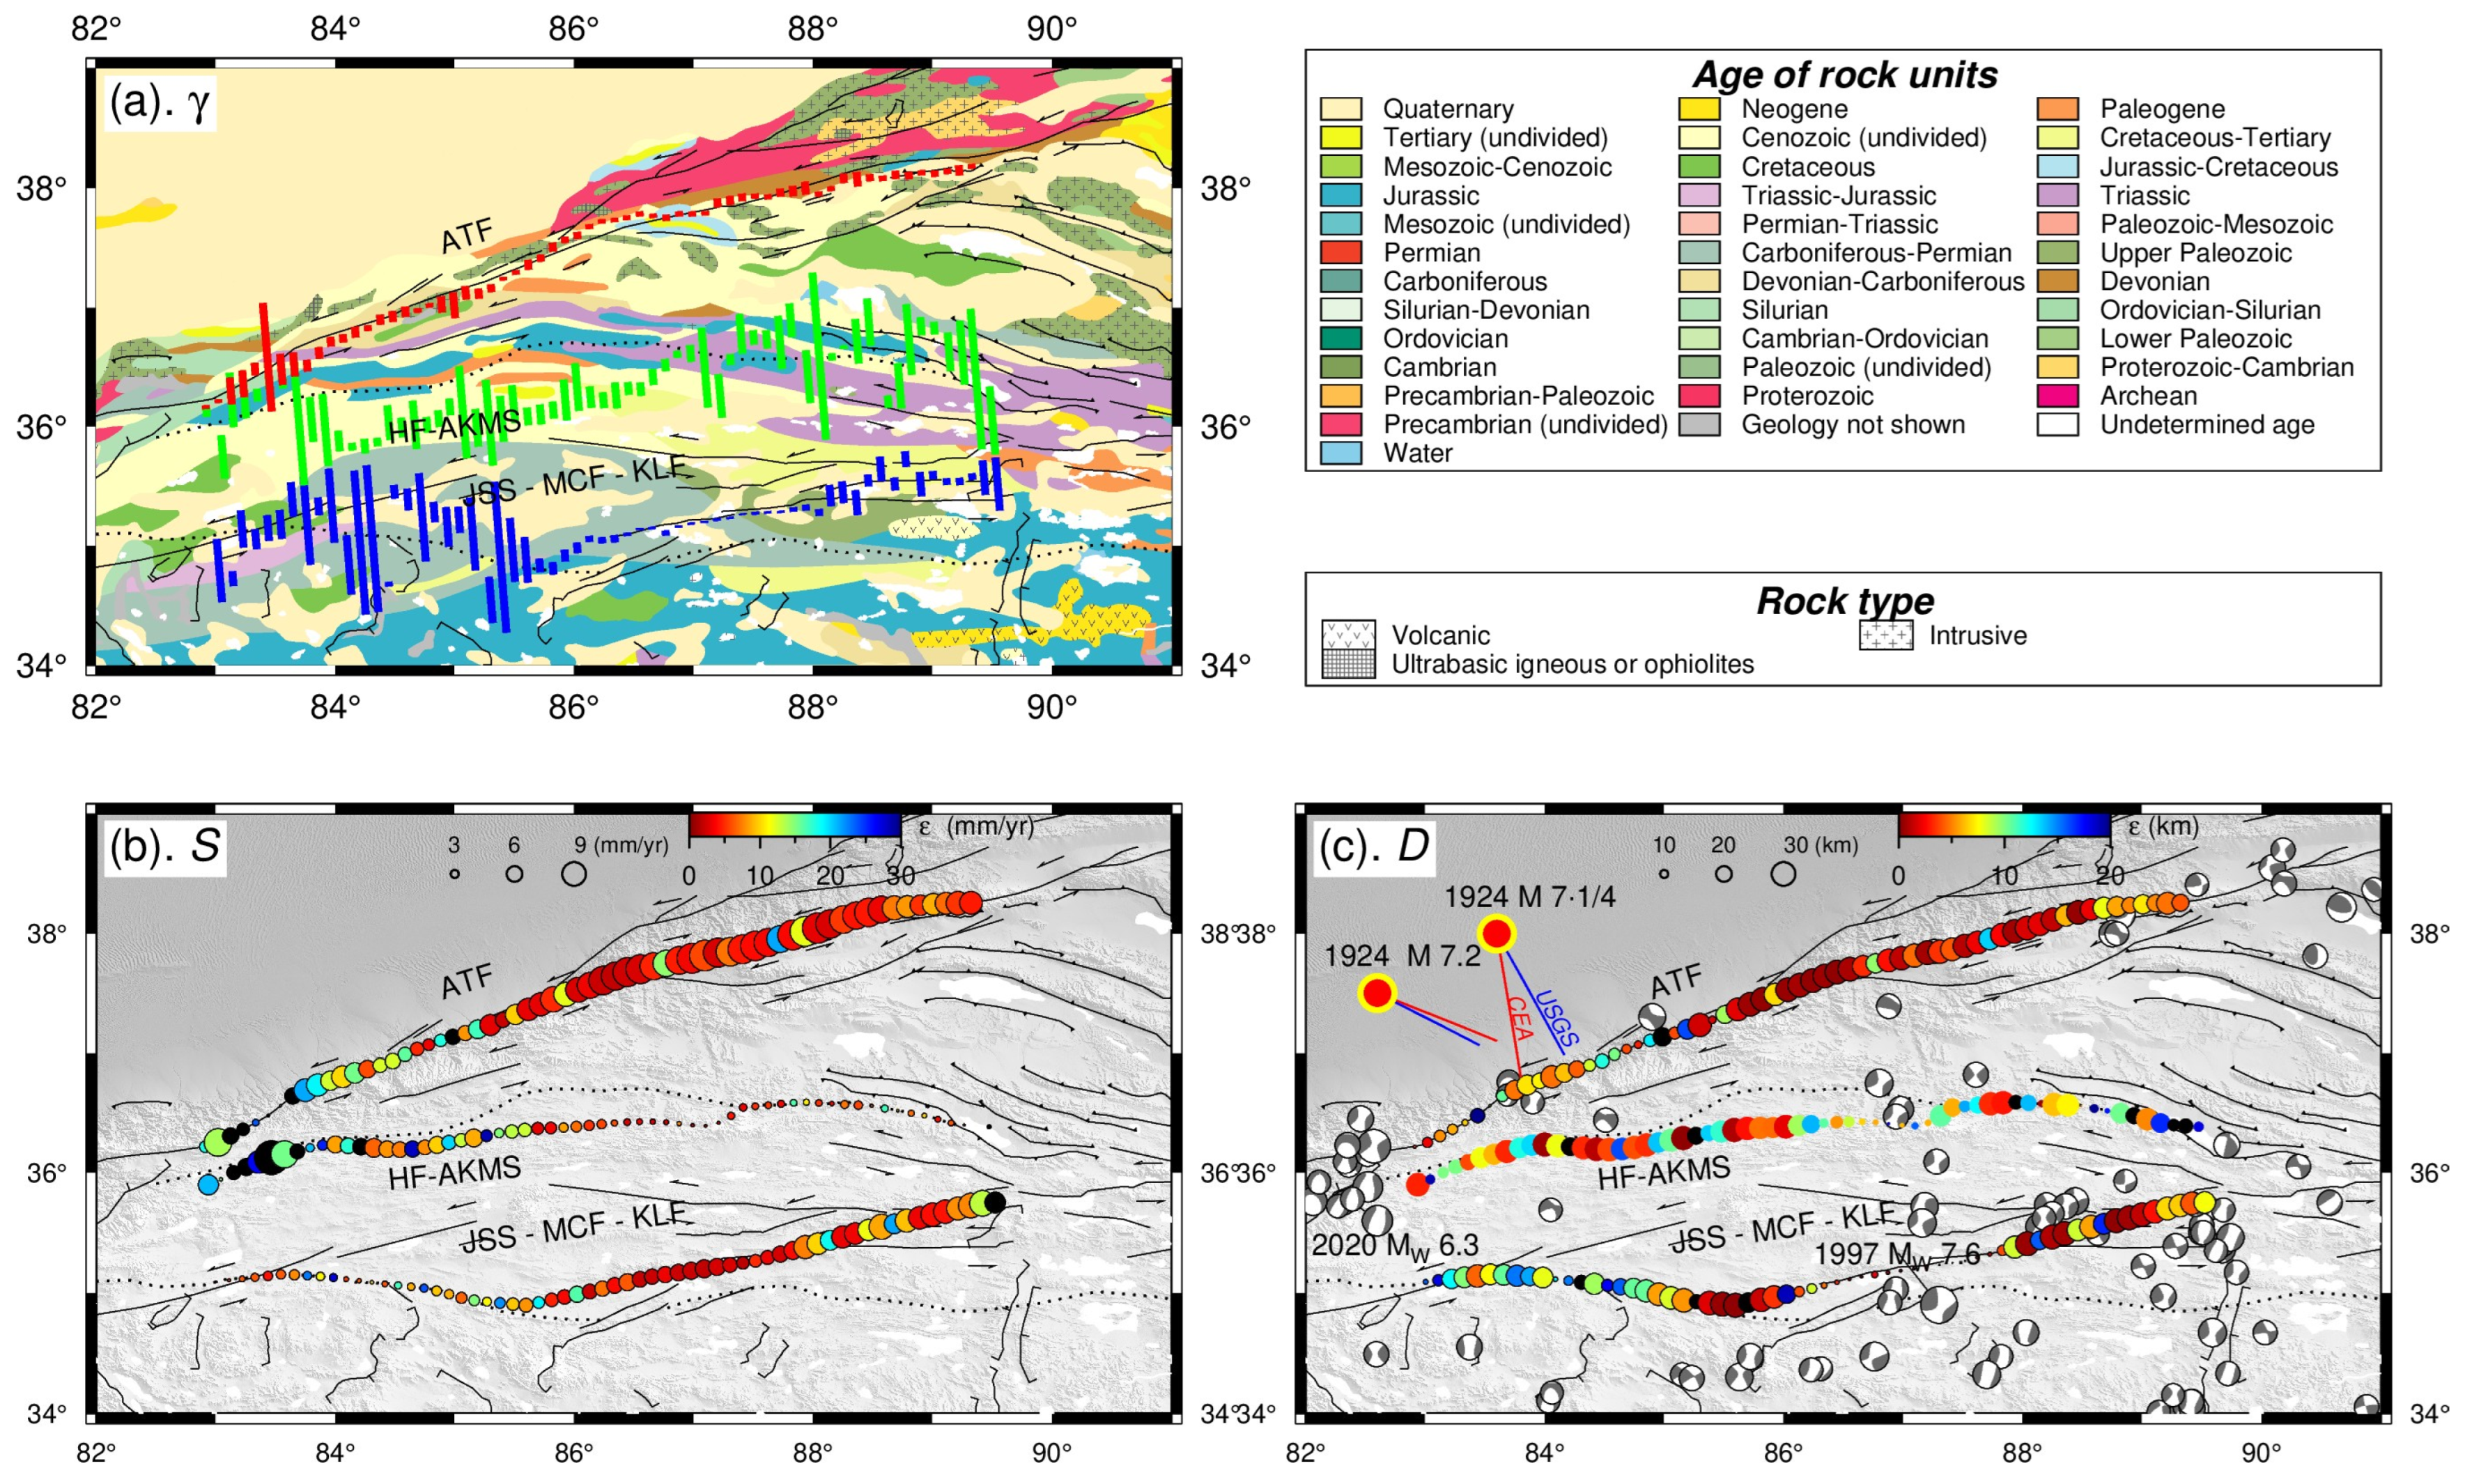
In the westmost section of <85°E, the fault offset estimates are overall consistent with the mapped ATF location, falling within the model error limits, despite persistent residual asymmetry towards the plateau. The prominent asymmetry has been largely accounted for by considering additional contributions from the HF–AKMS fault, e.g., near 84.5°E, as depicted in Figure S5 in the Supplementary Materials.
(4)
In other areas, e.g., between 85–85.5°E and 87–88°E along the central ATF, the remaining asymmetric feature is not pronounced, as shown in Figure S6 in the Supplementary Materials.

4. Discussions

4.1. Can Crust Rigidity Contrast Solely Explain the Asymmetry?

We test whether the rigidity contrast between the Tibetan Plateau and Tarim Basin can fully explain the observed asymmetry in the interseismic deformation across the ATF. The modified half-space elastic dislocation model [10] is employed to calculate and analyze the asymmetric deformation across the fault.
v = 2 ( 1 K ) S π arctan ( x γ D ) + v 0 if   x < γ 2 K S π arctan ( x γ D ) + v 0 if   x > γ ,
where K represents the asymmetry coefficient ranging from 0 to 1, indicating the extent of rigidity contrast between both sides of the fault. A value of K = 0.5 signifies no asymmetry in the interseismic deformation field across the fault, as per Equation (2).
In this inversion, we have made the assumption that the mapped trace of the ATF is accurate, based on its significant geomorphic expression. Consequently, we permitted it to only vary within a narrow range of [−3 km, 3 km] to accommodate minor inaccuracies in fault trace mapping without compromising our asymmetry analysis. The results reveal that a rigidity coefficient of approximately ~0.7 is required to comprehensively account for the asymmetry within a 200 km distance of the ATF (profile AA’ in Figure 6). Notably, even with an extreme rigidity contrast further eastward, it remains insufficient to adequately explain the full asymmetry across the whole region. East of 85°E, most derived rigidity coefficients fall within the range of [0.4, 0.6], signifying a relatively modest presence of asymmetry (profiles DD’–FF’ in Figure 6).
Our findings do not support previously proposed primary mechanisms attributing the asymmetric interseismic deformation across the ATF to rheological contrasts, varying crustal thickness [8], deep fault dislocation [9], or combinations thereof [10]. If rheological contrasts were the primary driver, a consistent deformation pattern would be expected along the entire ATF, contrary to our observations and previous findings along several segments [14,41,42]. Even in the westernmost ATF, where asymmetry is most pronounced, the combined influence of multiple faults adequately explains the large-scale interseismic deformation. Consequently, we propose that the observed asymmetry is predominantly a result of multiple nearby faults, with other potential factors playing a subordinate role.

4.2. Can a Two-Fault Model Explain the Asymmetric Deformation?

We explore whether the deformation field in the northwestern Tibetan Plateau can be adequately represented by a dislocation model incorporating only two faults, i.e., the ATF and the JSS–MCF–KLF. Results (Figure 7) show good agreement between the two- and three-fault models east of 86°E; however, significant discrepancies exist in the western section (83–86°E). Achieving a satisfactory fit to the asymmetric interseismic loading rate in this area necessitates two key criteria: (1) a deeper locking depth (~40 km) and (2) a substantial fault offset of the ATF towards the Tibetan Plateau, reaching a maximum of >30 km and varying along the strike (Figure 7a). It seems that this variation cannot be fully explained by a shallow–deep offset, a south dipping fault geometry, or a single crustal rigidity contrast across the ATF. Therefore, we think that the two-fault model cannot adequately fit the asymmetric interseismic deformation across the ATF.

5. Conclusions

Using ~9 years of Sentinel-1 data, we derived a 3D crustal deformation field for the northwestern Tibetan Plateau. Our analysis revealed the following findings.
Interseismic deformation across the ATF displays pronounced spatial variability in asymmetry. The western section (~83–85°E) is characterized by the most significant asymmetry, with predominant elastic deformation occurring within the Tibetan Plateau. In contrast, asymmetry is less apparent along the central section of the ATF. The transition zone between these segments exhibits marked lateral variations in the spatial extent and gradient of asymmetric deformation. Notably, larger deformation is not consistently observed on the Tibetan Plateau side.
The observed asymmetry in deformation cannot be attributed solely to a consistent rigidity contrast between the Tarim Basin and the Tibetan Plateau. Instead, the combined influence of the ATF, Jinsha Suture–Margai Caka Fault–Kunlun Fault, and secondary faults fully explains the deformation pattern. Consequently, the asymmetric deformation in the northwestern Tibetan Plateau region is primarily a manifestation of these fault interactions rather than crustal property variations, viscoelastic effects, or other factors.
Rapid strain accumulation within the Tibetan Plateau is concentrated along major fault zones rather than being uniformly distributed, supporting the eastward extrusion model of block-style tectonic movement.

Supplementary Materials

The following supporting information can be downloaded at https://www.mdpi.com/article/10.3390/rs17071277/s1: Text S1: Processing steps of time series InSAR analysis; Figure S1: Temporal and spatial baseline of interferograms; Figure S2: Fault-parallel velocity profile near 87°E across the ATF; Figure S3: Fault-parallel velocity profile near 89°E across the ATF; Figure S4: Fault-parallel velocity profile near 86.4°E across the ATF; Figure S5: Fault-parallel velocity profile near 84.5°E across the ATF; Figure S6: Fault-parallel velocity profile near 87.75°E across the ATF.

Author Contributions

Conceptualization, Y.T.; methodology, Y.L.; software, Y.T. and Y.L.; validation, W.J., Y.T., and W.F.; formal analysis, Y.L.; investigation, Y.L. and H.J.; resources, Y.T. and W.J.; data curation, Y.L.; writing—original draft preparation, Y.L. and H.J.; writing—review and editing, Y.T. and W.F.; visualization, Y.L.; supervision, Y.T. and H.J.; project administration, Y.T. and W.J.; funding acquisition, Y.T. and W.J. All authors have read and agreed to the published version of the manuscript.

Funding

This research was funded by the National Natural Science Foundation of China, grant numbers 42271015 and 41972230, and the Basic Research Special Fund of the National Institute of Natural Hazards, Ministry of Emergency Management of China, grant number ZDJ2018-13.

Data Availability Statement

The Sentinel-1 data used in this study are publicly available from the European Space Agency (ESA) through the Copernicus Open Access Hub service (https://browser.dataspace.copernicus.eu/, accessed on 1 May 2024). Interferometric processing and time series analysis were performed using open-source GMTSAR software (https://topex.ucsd.edu/gmtsar/, accessed on 9 September 2022). The 3D deformation fields generated in this work are deposited at Zenodo (https://doi.org/10.5281/zenodo.14991722) [70]. The iGPS software used to facilitate the InSAR processing and results analysis is available from https://github.com/igps-ftk/iGPS (accessed on 1 October 2024).

Acknowledgments

We are grateful to three anonymous reviewers for their comments and suggestions that helped improve the manuscript substantially. The plots were generated using the GMT software package version 6.4.0 (https://www.generic-mapping-tools.org/, accessed on 9 September 2022).

Conflicts of Interest

The authors declare no conflicts of interest. The funders had no role in the design of the study; in the collection, analyses, or interpretation of data; in the writing of the manuscript; or in the decision to publish the results.

Abbreviations

The following abbreviations are used in this manuscript:
ATFAltyn Tagh Fault
GNSSGlobal Navigation Satellite System
InSARInterferometric Synthetic Aperture Radar
JSSJinsha Suture
KLFKunlun Fault
LOSline-of-sight
MCFMargai Caka Fault

References

  1. Savage, J.C.; Burford, R.O. Geodetic Determination of Relative Plate Motion in Central California. J. Geophys. Res. 1973, 78, 832–845. [Google Scholar] [CrossRef]
  2. Le Pichon, X.; Kreemer, C.; Chamot-Rooke, N. Asymmetry in Elastic Properties and the Evolution of Large Continental Strike-slip Faults. J. Geophys. Res. Solid Earth 2005, 110, 2004JB003343. [Google Scholar] [CrossRef]
  3. Genrich, J.F.; Bock, Y.; McCaffrey, R.; Prawirodirdjo, L.; Stevens, C.W.; Puntodewo, S.S.O.; Subarya, C.; Wdowinski, S. Distribution of Slip at the Northern Sumatran Fault System. J. Geophys. Res. Solid Earth 2000, 105, 28327–28341. [Google Scholar] [CrossRef]
  4. Freymueller, J.T.; Murray, M.H.; Segall, P.; Castillo, D. Kinematics of the Pacific-North America Plate Boundary Zone, Northern California. J. Geophys. Res. Solid Earth 1999, 104, 7419–7441. [Google Scholar] [CrossRef]
  5. Prescott, W.H.; Yu, S. Geodetic Measurement of Horizontal Deformation in the Northern San Francisco Bay Region, California. J. Geophys. Res. Solid Earth 1986, 91, 7475–7484. [Google Scholar] [CrossRef]
  6. Ji, L.; Zhang, W.; Liu, C.; Zhu, L.; Xu, J.; Xu, X. Characterizing Interseismic Deformation of the Xianshuihe Fault, Eastern Tibetan Plateau, Using Sentinel-1 SAR Images. Adv. Space Res. 2020, 66, 378–394. [Google Scholar] [CrossRef]
  7. Elliott, J.R.; Biggs, J.; Parsons, B.; Wright, T.J. InSAR Slip Rate Determination on the Altyn Tagh Fault, Northern Tibet, in the Presence of Topographically Correlated Atmospheric Delays. Geophys. Res. Lett. 2008, 35, 2008GL033659. [Google Scholar] [CrossRef]
  8. Ge, W.; Shen, Z.; Molnar, P.; Wang, M.; Zhang, P.; Yuan, D. GPS Determined Asymmetric Deformation Across Central Altyn Tagh Fault Reveals Rheological Structure of Northern Tibet. J. Geophys. Res. Solid Earth 2022, 127, e2022JB024216. [Google Scholar] [CrossRef]
  9. He, J.; Vernant, P.; Chéry, J.; Wang, W.; Lu, S.; Ku, W.; Xia, W.; Bilham, R. Nailing down the Slip Rate of the Altyn Tagh Fault. Geophys. Res. Lett. 2013, 40, 5382–5386. [Google Scholar] [CrossRef]
  10. Jolivet, R.; Cattin, R.; Chamot-Rooke, N.; Lasserre, C.; Peltzer, G. Thin-plate Modeling of Interseismic Deformation and Asymmetry across the Altyn Tagh Fault Zone. Geophys. Res. Lett. 2008, 35, 2007GL031511. [Google Scholar] [CrossRef]
  11. Liu, C.; Ji, L.; Zhu, L.; Xu, C.; Qiu, J. Interseismic Strain Rate Distribution Model of the Altyn Tagh Fault Constrained by InSAR and GPS. Earth Planet. Sci. Lett. 2024, 642, 118884. [Google Scholar] [CrossRef]
  12. Liu, Y.; Zhao, D.; Shan, X. Asymmetric Interseismic Strain across the Western Altyn Tagh Fault from InSAR. Remote Sens. 2022, 14, 2112. [Google Scholar] [CrossRef]
  13. Luo, Y.; Tian, Y.; Feng, W.; Hu, Y. Development and application of automated processing tool for time series deformation analysis using open-source GMTSAR and iGPS software. Rev. Geophys. Planet. Phys. 2023, 54, 653–666. [Google Scholar] [CrossRef]
  14. Shen, L.; Hooper, A.; Elliott, J.R.; Wright, T.J. Variability in Interseismic Strain Accumulation Rate and Style along the Altyn Tagh Fault. Nat. Commun. 2024, 15, 6876. [Google Scholar] [CrossRef]
  15. Zhu, S.; Xu, C.; Wen, Y.; Liu, Y. Interseismic Deformation of the Altyn Tagh Fault Determined by Interferometric Synthetic Aperture Radar (InSAR) Measurements. Remote Sens. 2016, 8, 233. [Google Scholar] [CrossRef]
  16. Thatcher, W.; Marshall, G.; Lisowski, M. Resolution of Fault Slip along the 470-km-long Rupture of the Great 1906 San Francisco Earthquake and Its Implications. J. Geophys. Res. Solid Earth 1997, 102, 5353–5367. [Google Scholar] [CrossRef]
  17. Peltzer, G.; Crampé, F.; King, G. Evidence of Nonlinear Elasticity of the Crust from the Mw7.6 Manyi (Tibet) Earthquake. Science 1999, 286, 272–276. [Google Scholar] [CrossRef]
  18. Wan, Y.; Shen, Z.; Wang, M.; Zhang, Z.-S.; Gan, W.; Wang, Q.-L.; Sheng, S.-Z. Coseismic Slip Distribution of the 2001 Kunlun Mountain Pass West Earthquake Constrained by GPS and Insar Data. Chin. J. Geophys. 2008, 51, 753–764. [Google Scholar] [CrossRef]
  19. Avouac, J.-P.; Ayoub, F.; Wei, S.; Ampuero, J.-P.; Meng, L.; Leprince, S.; Jolivet, R.; Duputel, Z.; Helmberger, D. The 2013, Mw 7.7 Balochistan Earthquake, Energetic Strike-Slip Reactivation of a Thrust Fault. Earth Planet. Sci. Lett. 2014, 391, 128–134. [Google Scholar] [CrossRef]
  20. Lauer, B.; Grandin, R.; Klinger, Y. Fault Geometry and Slip Distribution of the 2013 Mw 7.7 Balochistan Earthquake From Inversions of SAR and Optical Data. J. Geophys. Res. Solid Earth 2020, 125, e2019JB018380. [Google Scholar] [CrossRef]
  21. Savage, H.M.; Shreedharan, S.; Fagereng, Å.; Morgan, J.K.; Meneghini, F.; Wang, M.; McNamara, D.D.; Wallace, L.M.; Saffer, D.M.; Barnes, P.M.; et al. Asymmetric Brittle Deformation at the Pāpaku Fault, Hikurangi Subduction Margin, NZ, IODP Expedition 375. Geochem. Geophys. Geosyst. 2021, 22, e2021GC009662. [Google Scholar] [CrossRef]
  22. Molnar, P.; Tapponnier, P. Cenozoic Tectonics of Asia: Effects of a Continental Collision: Features of Recent Continental Tectonics in Asia Can Be Interpreted as Results of the India-Eurasia Collision. Science 1975, 189, 419–426. [Google Scholar] [CrossRef]
  23. Molnar, P.; England, P.; Martinod, J. Mantle Dynamics, Uplift of the Tibetan Plateau, and the Indian Monsoon. Rev. Geophys. 1993, 31, 357–396. [Google Scholar] [CrossRef]
  24. Avouac, J.; Tapponnier, P. Kinematic Model of Active Deformation in Central Asia. Geophys. Res. Lett. 1993, 20, 895–898. [Google Scholar] [CrossRef]
  25. Cowgill, E.; Yin, A.; Harrison, T.M.; Xiao-Feng, W. Reconstruction of the Altyn Tagh Fault Based on U-Pb Geochronology: Role of Back Thrusts, Mantle Sutures, and Heterogeneous Crustal Strength in Forming the Tibetan Plateau. J. Geophys. Res. Solid Earth 2003, 108, 2002JB002080. [Google Scholar] [CrossRef]
  26. Yin, A.; Rumelhart, P.E.; Butler, R.; Cowgill, E.; Harrison, T.M.; Foster, D.A.; Ingersoll, R.V.; Qing, Z.; Xian-Qiang, Z.; Xiao-Feng, W.; et al. Tectonic History of the Altyn Tagh Fault System in Northern Tibet Inferred from Cenozoic Sedimentation. Geol. Soc. Am. Bull. 2002, 114, 1257–1295. [Google Scholar] [CrossRef]
  27. Mériaux, A.-S.; Ryerson, F.J.; Tapponnier, P.; Van Der Woerd, J.; Finkel, R.C.; Xu, X.; Xu, Z.; Caffee, M.W. Rapid Slip along the Central Altyn Tagh Fault: Morphochronologic Evidence from Cherchen He and Sulamu Tagh. J. Geophys. Res. Solid Earth 2004, 109, 2003JB002558. [Google Scholar] [CrossRef]
  28. Peltzer, G.; Socquet, A.; Lasserre, C.; Meriaux, A.; Tapponnier, P.; Ryerson, R. InSAR Observations of Interseimsic Strain along the Central Altyn Tagh Fault Consistent with Holocene Slip-Rate. AGU Fall Meet. Abstr. 2006, T21E-02. [Google Scholar]
  29. Cowgill, E. Impact of Riser Reconstructions on Estimation of Secular Variation in Rates of Strike–Slip Faulting: Revisiting the Cherchen River Site along the Altyn Tagh Fault, NW China. Earth Planet. Sci. Lett. 2007, 254, 239–255. [Google Scholar] [CrossRef]
  30. Cowgill, E.; Gold, R.D.; Xuanhua, C.; Xiao-Feng, W.; Arrowsmith, J.R.; Southon, J. Low Quaternary Slip Rate Reconciles Geodetic and Geologic Rates along the Altyn Tagh Fault, Northwestern Tibet. Geology 2009, 37, 647–650. [Google Scholar] [CrossRef]
  31. Gold, R.D.; Cowgill, E.; Arrowsmith, J.R.; Chen, X.; Sharp, W.D.; Cooper, K.M.; Wang, X.-F. Faulted Terrace Risers Place New Constraints on the Late Quaternary Slip Rate for the Central Altyn Tagh Fault, Northwest Tibet. Geol. Soc. Am. Bull. 2011, 123, 958–978. [Google Scholar] [CrossRef]
  32. Li, Y.; Shan, X.; Qu, C.; Liu, Y.; Han, N. Crustal Deformation of the Altyn Tagh Fault Based on GPS. J. Geophys. Res. Solid Earth 2018, 123, 10309–10322. [Google Scholar] [CrossRef]
  33. Liu, C.; Ji, L.; Zhu, L.; Zhao, C. InSAR-Constrained Interseismic Deformation and Potential Seismogenic Asperities on the Altyn Tagh Fault at 91.5–95°E, Northern Tibetan Plateau. Remote Sens. 2018, 10, 943. [Google Scholar] [CrossRef]
  34. Liu, C.J.; Zhao, C.Y.; Ji, L.Y.; Zhang, Z.R.; Sun, H. Interseismic Deformation Across The Eastern Altyn Tagh Fault from InSAR Measurements. Int. Arch. Photogramm. Remote Sens. Spat. Inf. Sci. 2018, XLII–3, 1029–1033. [Google Scholar] [CrossRef]
  35. Liu, J.; Ren, Z.; Zheng, W.; Min, W.; Li, Z.; Zheng, G. Late Quaternary Slip Rate of the Aksay Segment and Its Rapidly Decreasing Gradient along the Altyn Tagh Fault. Geosphere 2020, 16, 1538–1557. [Google Scholar] [CrossRef]
  36. Wang, Y.; Wang, M. A Review of Slip Rates Along the Altyn Tagh Fault and Its Implications. Earthq. Res. China 2020, 36, 817–826. [Google Scholar]
  37. Xu, X.; Wang, F.; Zheng, R.; Chen, W.; Ma, W.; Yu, G.; Chen, G.; Tapponnier, P.; Van Der Woerd, J.; Meriaux, A.S.; et al. Late Quaternary Sinistral Slip Rate along the Altyn Tagh Fault and Its Structural Transformation Model. Sci. China Ser. Earth Sci. 2005, 48, 384. [Google Scholar] [CrossRef]
  38. Zhang, P.; Molnar, P.; Xu, X. Late Quaternary and Present-day Rates of Slip along the Altyn Tagh Fault, Northern Margin of the Tibetan Plateau. Tectonics 2007, 26, 2006TC002014. [Google Scholar] [CrossRef]
  39. Zhao, X.; Wang, C.; He, J.; Liang, L.; Tang, Y.; Zhang, H. Recent Tectonic Movement in the Western Tibetan Plateau Revealed by InSAR Measurements. IEEE J. Sel. Top. Appl. Earth Obs. Remote Sens. 2023, 16, 9336–9349. [Google Scholar] [CrossRef]
  40. Li, Y.; Nocquet, J.-M.; Shan, X. Crustal Deformation across the Western Altyn Tagh Fault (86° E) from GPS and InSAR. Geophys. J. Int. 2021, 228, 1361–1372. [Google Scholar] [CrossRef]
  41. Wang, D.; Elliott, J.R.; Zheng, G.; Wright, T.J.; Watson, A.R.; McGrath, J.D. Deciphering Interseismic Strain Accumulation and Its Termination on the Central-Eastern Altyn Tagh Fault from High-Resolution Velocity Fields. Earth Planet. Sci. Lett. 2024, 644, 118919. [Google Scholar] [CrossRef]
  42. Zhang, G.; Qu, C.; Shan, X.; Song, X.; Zhang, Y.; Li, Y. Present-Day Crustal Deformation of the Northwestern Tibetan Plateau Based on InSAR Measurements. Remote Sens. 2023, 15, 5195. [Google Scholar] [CrossRef]
  43. Gan, W.; Zhang, P.; Shen, Z.; Niu, Z.; Wang, M.; Wan, Y.; Zhou, D.; Cheng, J. Present-day Crustal Motion within the Tibetan Plateau Inferred from GPS Measurements. J. Geophys. Res. Solid Earth 2007, 112, 2005JB004120. [Google Scholar] [CrossRef]
  44. Shen, Z.; Wang, M.; Li, Y.; Jackson, D.D.; Yin, A.; Dong, D.; Fang, P. Crustal Deformation along the Altyn Tagh Fault System, Western China, from GPS. J. Geophys. Res. Solid Earth 2001, 106, 30607–30621. [Google Scholar] [CrossRef]
  45. Wang, M.; Shen, Z. Present-Day Crustal Deformation of Continental China Derived From GPS and Its Tectonic Implications. J. Geophys. Res. Solid Earth 2020, 125, e2019JB018774. [Google Scholar] [CrossRef]
  46. Wang, Q.; Zhang, P.-Z.; Freymueller, J.T.; Bilham, R.; Larson, K.M.; Lai, X.; You, X.; Niu, Z.; Wu, J.; Li, Y.; et al. Present-Day Crustal Deformation in China Constrained by Global Positioning System Measurements. Science 2001, 294, 574–577. [Google Scholar] [CrossRef]
  47. Zhang, P.-Z.; Shen, Z.; Wang, M.; Gan, W.; Bürgmann, R.; Molnar, P.; Wang, Q.; Niu, Z.; Sun, J.; Wu, J.; et al. Continuous Deformation of the Tibetan Plateau from Global Positioning System Data. Geology 2004, 32, 809. [Google Scholar] [CrossRef]
  48. Taylor, M.; Yin, A. Active Structures of the Himalayan-Tibetan Orogen and Their Relationships to Earthquake Distribution, Contemporary Strain Field, and Cenozoic Volcanism. Geosphere 2009, 5, 199–214. [Google Scholar] [CrossRef]
  49. Sandwell, D.; Mellors, R.; Tong, X.; Wei, M.; Wessel, P. Open Radar Interferometry Software for Mapping Surface Deformation. Eos Trans. Am. Geophys. Union 2011, 92, 234. [Google Scholar] [CrossRef]
  50. Tian, Y. iGPS: IDL Tool Package for GPS Position Time Series Analysis. GPS Solut. 2011, 15, 299–303. [Google Scholar] [CrossRef]
  51. Fattahi, H.; Agram, P.; Simons, M. A Network-Based Enhanced Spectral Diversity Approach for TOPS Time-Series Analysis. IEEE Trans. Geosci. Remote Sens. 2017, 55, 777–786. [Google Scholar] [CrossRef]
  52. Farr, T.G.; Kobrick, M. Shuttle Radar Topography Mission Produces a Wealth of Data. Eos Trans. Am. Geophys. Union 2000, 81, 583–585. [Google Scholar] [CrossRef]
  53. Goldstein, R.M.; Werner, C.L. Radar Interferogram Filtering for Geophysical Applications. Geophys. Res. Lett. 1998, 25, 4035–4038. [Google Scholar] [CrossRef]
  54. Chen, C.W.; Zebker, H.A. Network Approaches to Two-Dimensional Phase Unwrapping: Intractability and Two New Algorithms. J. Opt. Soc. Am. A 2000, 17, 401. [Google Scholar] [CrossRef] [PubMed]
  55. Yu, C.; Li, Z.; Penna, N.T.; Crippa, P. Generic Atmospheric Correction Model for Interferometric Synthetic Aperture Radar Observations. J. Geophys. Res. Solid Earth 2018, 123, 9202–9222. [Google Scholar] [CrossRef]
  56. Tong, X.; Schmidt, D. Active Movement of the Cascade Landslide Complex in Washington from a Coherence-Based InSAR Time Series Method. Remote Sens. Environ. 2016, 186, 405–415. [Google Scholar] [CrossRef]
  57. Fialko, Y.; Simons, M.; Agnew, D. The Complete (3-D) Surface Displacement Field in the Epicentral Area of the 1999 MW 7.1 Hector Mine Earthquake, California, from Space Geodetic Observations. Geophys. Res. Lett. 2001, 28, 3063–3066. [Google Scholar] [CrossRef]
  58. Li, K.; Li, Y.; Tapponnier, P.; Xu, X.; Li, D.; He, Z. Joint InSAR and Field Constraints on Faulting During the Mw 6.4, July 23, 2020, Nima/Rongma Earthquake in Central Tibet. J. Geophys. Res. Solid Earth 2021, 126, e2021JB022212. [Google Scholar] [CrossRef]
  59. Ryder, I.; Parsons, B.; Wright, T.J.; Funning, G.J. Post-Seismic Motion Following the 1997 Manyi (Tibet) Earthquake: InSAR Observations and Modelling. Geophys. J. Int. 2007, 169, 1009–1027. [Google Scholar] [CrossRef]
  60. Ryder, I.; Wang, H.; Bie, L.; Rietbrock, A. Geodetic Imaging of Late Postseismic Lower Crustal Flow in Tibet. Earth Planet. Sci. Lett. 2014, 404, 136–143. [Google Scholar] [CrossRef]
  61. Xu, X.; Yu, G.; Klinger, Y.; Tapponnier, P.; Van Der Woerd, J. Reevaluation of Surface Rupture Parameters and Faulting Segmentation of the 2001 Kunlunshan Earthquake (Mw 7.8), Northern Tibetan Plateau, China. J. Geophys. Res. Solid Earth 2006, 111, 2004JB003488. [Google Scholar] [CrossRef]
  62. Burchfiel, B.C.; Chen, Z. Tectonics of the Southeastern Tibetan Plateau and Its Adjacent Foreland; Geological Society of America: Boulder, CO, USA, 2013; ISBN 978-0-8137-1210-9. [Google Scholar]
  63. Daout, S.; Doin, M.; Peltzer, G.; Lasserre, C.; Socquet, A.; Volat, M.; Sudhaus, H. Strain Partitioning and Present-Day Fault Kinematics in NW Tibet From Envisat SAR Interferometry. J. Geophys. Res. Solid Earth 2018, 123, 2462–2483. [Google Scholar] [CrossRef]
  64. Haario, H.; Laine, M.; Mira, A.; Saksman, E. DRAM: Efficient Adaptive MCMC. Stat. Comput. 2006, 16, 339–354. [Google Scholar] [CrossRef]
  65. Xu, X.; Chen, W.; Ma, W.; Yu, G.; Chen, G. Surface Rupture of the Kunlunshan Earthquake (Ms 8.1), Northern Tibetan Plateau, China. Seismol. Res. Lett. 2002, 73, 884–892. [Google Scholar] [CrossRef]
  66. Sun, J.; Xu, X.; Shi, Y.; Liang, F. InSAR-Derived Interseismic Deformation and Preliminary Slip Rate Estimation of the Mani Segment of the East Kunlun Fault. Prog. Nat. Sci. 2007, 17, 1361–1370. [Google Scholar]
  67. Bell, M.A.; Elliott, J.R.; Parsons, B.E. Interseismic Strain Accumulation across the Manyi Fault (Tibet) Prior to the 1997 Mw 7.6 Earthquake:Manyi Fault Strain Accumulation. Geophys. Res. Lett. 2011, 38, L24302. [Google Scholar] [CrossRef]
  68. Luo, Y.; Hu, Y.; Tian, Y.; Zhang, J. Seismogenic fault and aftershock characteristics for the 2014 MS7.3 Yutian earthquake, Xinjiang. Acta Seismol. Sin. 2021, 43, 48–56. [Google Scholar] [CrossRef]
  69. Lin, J. The Surface Rupture Zone of 1924 Ms7 1⁄4 Double Earthquakes in the Western Segment of Altyn Tagh Fault; Institute of Earthquake Forecasting, China Earthquake Administration: Beijing, China, 2024. [Google Scholar]
  70. Luo, Y.; Jiang, H.; Feng, W.; Tian, Y.; Jiang, W. Supporting Dataset for Study on “A Simple Scenario for Explaining Asymmetric Deformation Across the Altyn Tagh Fault in Northern Tibetan Plateau: Contributions from Multiple Faults”. 2025. Available online: https://zenodo.org/records/14991722 (accessed on 8 March 2025).
Figure 2. InSAR LOS rate maps of the northwestern Tibetan Plateau. (a) Ascending tracks. (b) Descending tracks. Blue dashed lines indicate locations of velocity profiles AA’–GG’ in Figure 4. Positive velocity represents uplift (moving toward satellite). The numbers are processed Sentinel-1 tracks in this work (Table 1). The other plot specifications are the same as those in Figure 1. BNS: Bangong-Nujiang Suture; YZS: Yarlung-Zangbo Suture.
Remotesensing 17 01277 g002
Figure 3. InSAR-derived 3D crustal velocity fields of the northwestern Tibetan Plateau. (a) East–west; (b) North–south; (c) Uplift. Purple arrows are GNSS horizontal velocity vectors [45] relative to the Tarim Basin. The other plot specifications are the same as those in Figure 2.
Remotesensing 17 01277 g003
Figure 4. Fault-parallel (strike-slip) velocity profiles (AA’–GG’) along the JSS-MCF-KLF across the northwestern Tibetan Plateau. Profile locations are shown in Figure 2b. Positive velocities indicate moving eastward. Blue and yellow dots are InSAR-derived and interpolated GNSS velocities, respectively. Red lines are best-fit models. The numbers are optimal estimates of strike-slip rates and locking depths (in square brackets). The dashed lines indicate mapped fault traces; and the shaded rectangle shows best-fit estimates of fault traces. Red: the ATF; green: the HF-AKMS (H-A); blue: the JSS–MCF–KLF (J-M-K).
Remotesensing 17 01277 g004
Figure 5. Inversion results for the model with three active faults in the northwestern Tibetan Plateau. (a) Fault trace shift (γ) estimates. The geological map is from https://docs.gmt-china.org/6.1/dataset-CN/, accessed on 18 March 2025. Blue, green, and red vertical bars indicate range of fault trace shift estimates for the JSS-MCF-KLF, HF-AKMS, and ATF, respectively. (b) Slip rates (S) estimates and uncertainties (ε). The size and color of the circle represent slip rate and uncertainty, respectively. (c) Locking depth (D) estimates and uncertainties. The size and color of the circle represent locking depth and uncertainty, respectively. Black lines are mapped active faults and dotted lines are suture zones [48]. Beach balls are earthquake mechanisms from GCMT (https://www.globalcmt.org/, accessed on 18 March 2025). Red shaded circles are 1924 M > 7 earthquakes, with blue and red lines pointing to the hypocenters reported by the USGS (https://earthquake.usgs.gov/, accessed on 8 October 2023) and CEA (https://data.earthquake.cn/, accessed on 16 October 2024), respectively.
Remotesensing 17 01277 g005
Figure 6. Asymmetry analysis using the modified half-space elastic dislocation model considering only rigidity contrast. (a) Fault-parallel velocity map and centerline locations of profiles AA’–GG’. The other plot specifications are the same as those in Figure 1. (b) Crustal rigidity (K) estimates. The other plot specifications are the same as those in Figure 4.
Remotesensing 17 01277 g006
Figure 7. Inversion results for the model with two active faults in the northwestern Tibetan Plateau. (a) Fault trace shift (γ) estimates. Blue and red vertical bars indicate range of fault trace shift estimates for the JSS-MCF-KLF and ATF, respectively. (b) Slip rate (S) estimates. The size and color of the circle represent slip rate and uncertainty, respectively. (c) Locking depth (D) estimates. The size and color of the circle represent locking depth estimate and uncertainty, respectively. The other plot specifications are the same as those in Figure 5.
Remotesensing 17 01277 g007
Table 1. Sentinel-1 data used in this work.
TrackTrack DirectionASF FramesStarting TimeEnding TimeNumber of AcquisitionsNumber of Interferograms
85Ascending0088–011916 November 20143 March 2022164–182557–1300
12Ascending0104–012929 December 201410 April 202357557
114Ascending0100–01256 November 20147 November 2023120546
41Ascending0099–012420 October 201423 February 202360101
143Ascending0105–013015 October 201417 April 2021154739–1300
165Descending0467–049229 October 20148 February 202363258
92Descending0460–048012 October 201430 October 202254800
19Descending0461–048131 October 201429 February 202457–155238–323
121Descending0462–048726 October 201425 March 202348459
48Descending0457–04871 November 20141 April 202354–160103–1300
Table 2. Parameters used in MCMC analysis.
SymbolParameter DescriptionInitial ValueSampling Ranges
SSlip rate (mm/yr)10[−20, 20]
DLocking depth (km)10[0, 50]
γFault trace shift (km)0[−30, 30]
μVelocity offset (mm/yr)Mean of dataRange of data
Disclaimer/Publisher’s Note: The statements, opinions and data contained in all publications are solely those of the individual author(s) and contributor(s) and not of MDPI and/or the editor(s). MDPI and/or the editor(s) disclaim responsibility for any injury to people or property resulting from any ideas, methods, instructions or products referred to in the content.

