Article

Multi-Instrument Analysis of Ionospheric Equatorial Plasma Bubbles over the Indian and Southeast Asian Longitudes During the 19–20 April 2024 Geomagnetic Storm

by
Sampad Kumar Panda
1,*,
Siva Sai Kumar Rajana
1,2,
Chiranjeevi G. Vivek
2,
Jyothi Ravi Kiran Kumar Dabbakuti
3,
Wangshimenla Jamir
4 and
Punyawi Jamjareegulgarn
5
1
Department of Electronics and Communication Engineering, Koneru Lakshmaiah Education Foundation, Green Fields, Vaddeswaram 522302, India
2
CSIR-Fourth Paradigm Institute (CSIR-4PI), Bangalore 560037, India
3
Department of Internet of Things, Koneru Lakshmaiah Education Foundation, Green Fields, Vaddeswaram 522302, India
4
Department of Geography, Nagaland University, Lumami 798627, India
5
King Mongkut’s Institute of Technology Ladkrabang, Prince of Chumphon Campus, Chumphon 86160, Thailand
*
Author to whom correspondence should be addressed.
Remote Sens. 2025, 17(6), 1100; https://doi.org/10.3390/rs17061100
Submission received: 4 February 2025 / Revised: 18 March 2025 / Accepted: 19 March 2025 / Published: 20 March 2025
(This article belongs to the Special Issue Advances in GNSS Remote Sensing for Ionosphere Observation)

Abstract

:
In this study, we explored the occurrence of near-sunrise equatorial plasma bubbles (EPBs) and inhibition of dusk-time EPBs during the geomagnetic storm (SYM-Hmin= −139 nT) of 19–20 April 2024 using multi-instrument observations over the Indian and Southeast Asian longitude sectors. The initial phase of this storm commenced around 0530 UT on 19 April 2024 and did not manifest any visible alterations in the ionospheric electric fields during the main phase of the storm, which corresponded to a period between post-sunset to midnight over the study region. However, during the recovery phase of the storm, the IMF Bz suddenly flipped northward and was associated with an overshielding of the penetrating electric fields, which triggered the formation of near-sunrise EPBs. Interestingly, the persistence of EPBs was also noticed for more than three hours after the sunrise terminator. Initially, sunrise EPBs were developed in the Southeast Asian region and later drifted toward the Indian longitude region, along with the sunrise terminator. Moreover, this study suggested that the occurrence of EPBs was suppressed due to the altered storm time electric fields at the dip equatorial region across the 70–90°E longitude sector in the recovery period. This study highlighted that even moderate geomagnetic storms can generate near-sunrise EPBs in a broader longitude sector due to penetrating electric fields in overshielding conditions, which can significantly affect trans-ionospheric signals.

1. Introduction

The formation of equatorial plasma bubbles (EPBs) is a significant ionospheric phenomenon, primarily observed in the F layer of the ionosphere after sunset. These EPBs, associated with the depletion of plasma density, can affect communication, navigation, and satellite-based technologies. During quiet ionospheric conditions, EPBs are typically formed through Rayleigh–Taylor (R-T) instability. This instability arises when the denser plasma layer in the equatorial ionosphere is situated above the less dense plasma layer. The primary driver of this instability is the vertical plasma drift, which is generally influenced by the pre-reversal enhancement (PRE) of the zonal electric field. The PRE occurs near sunset, before the electric field in the ionosphere changes direction, leading to the stronger upward plasma drifts. This upward plasma drift increases in strength during the evening transition, lifting the plasma to higher altitudes, where it becomes unstable and forms EPBs [1,2,3]. EPBs are most commonly observed near the magnetic equator but can extend beyond equatorial ionization anomaly (EIA) regions in both hemispheres through magnetic field lines based on the strength of the vertical plasma drift. EPBs associated with plasma irregularities are also referred to as equatorial spread-F (ESF) structures. These are typically observed in the ionosonde-derived ionogram traces due to the scattering of radio waves over the broad range of frequencies in the ionosphere [4]. EPBs can also be referred to as plasma depletions observed through in situ satellite measurements. Additionally, other forms of EPBs are plumes, which are observed using ground-based radars [5,6]. The formation of EPBs is strongly influenced by the progression of the solar cycle. When solar activity is high, increased ionization in the F-region leads to larger plasma density gradients, creating more favorable conditions for the development of EPBs and associated ionospheric irregularities [7,8,9,10].
Additionally, geomagnetic storms are often associated with penetrating electric fields (PPEFs) and disturbances in neutral winds (DDEFs), which may cause modified ionospheric irregularities, either enhancing or suppressing the EPB formation depending on the prevailing conditions [11,12]. PPEFs originating from the magnetosphere can penetrate to equatorial latitudes, which enhances the vertical plasma drifts. These enhanced drifts lift the plasma to altitudes where R-T instability becomes more pronounced, leading to the formation of plasma bubbles that extend toward higher latitudes [13,14]. PPEFs are particularly strong during the main phase of geomagnetic storms, increasing the altitude of the plasma layers and promoting the growth of R-T instability. Conversely, storm-induced westward penetration electric fields can suppress the evening PRE in vertical drift, which is crucial for EPBs’ formation [15]. This suppression is due to the overshielding processes that lead to a reduction in the growth rate of R-T instability, thereby inhibiting EPBs’ development. Additionally, enhancement of morning EPBs can occur due to the reversal of electric field polarity from westward to eastward during geomagnetic storms. This reversal leads to an increase in the F-layer peak height and density, facilitating EPBs’ formation [16]. Moreover, storm-generated neutral winds and DDEFs further influence ionospheric conditions, which can trigger the formation of EPBs during the sunrise period of the recovery phase of geomagnetic storms [17]. They are also capable of suppressing the regular occurrence of post-sunset EPBs during the storm recovery phase [18,19].
Several researchers have investigated the characteristics of EPBs’ occurrence under different solar and geomagnetic conditions [20,21,22,23,24,25]. Carter et al. [22] studied the global occurrence of EPBs during the St. Patrick’s Day geomagnetic storm in 2015 using GPS, VHF, and ionosonde observations. They revealed the inhibition of EPBs in several longitude sectors, while an enhancement of post-midnight EPBs was observed due to the presence of DDEFs. Similarly, Dugassa et al. [26] investigated the occurrence of EPBs over the Indian, African, and American longitudinal sectors during the geomagnetic storms that occurred in the years 2012 and 2013 using GNSS-ROTI. They observed the occurrence of irregularities in most longitudes from post-sunset to pre-midnight, which were more intense in the American longitude sector. On a regional scale, Tulasi Ram et al. [23] observed the enhancement of dusk-time EPBs in the Indian longitude sector due to the presence of strong PPEFs during the 2015 St. Patrick’s Day geomagnetic storm. Additionally, Venkatesh et al. [24] reported similar patterns in dusk-time EPBs over the Brazilian region.
Most of the studies focus on the formation of dusk-time EPBs during geomagnetic storms. However, the occurrence of pre-sunrise EPBs is less explored, and only a few studies investigated the characteristics of pre-sunrise EPBs during moderate and intense geomagnetic storms [27,28,29,30,31]. Zakharenkova et al. [28] noticed the enhanced plasma drifts in the vertical direction, accompanied by the existence of EPBs in the dawn-side sector over the Pacific region using satellite and TIE-GCM observations during the geomagnetic storm of 18–19 February 2014. They concluded that these EPBs originated due to the DDEFs in the local dawn period during the storm recovery phase. Similar observations of the generation of near-sunrise EPBs due to DDEFs were also reported by Luo et al. [30] using the multi-instrument observations for the 17–20 August 2003 severe geomagnetic storm (Dst < −140 nT) in both hemispheres, specifically in the 140°–160°E longitude sector. Carmo et al. [32] also observed the pre- and post-sunrise EPBs over the Brazilian region during the recovery phase of the 18 February 2015 moderate geomagnetic storm due to storm-time wind that caused DDEFs near the dawn sector. In a different study, Tulasi Ram et al. [27] noticed the EPBs close to sunrise during the moderate geomagnetic storm over the Indonesian region. They highlighted that a sudden northward shift in the IMF Bz and associated overshielding PPEFs led to elevated plasma levels and the subsequent formation of EPBs. In the Southeast Asian region, Huang et al. [33] investigated the occurrence of EPBs during the severe geomagnetic storm in October 2016, and they reported the unique sunrise EPBs triggered in the storm’s main phase on 14 October 2016, attributed to the electric field changes during the storm period. Recently, Sun et al. [31] also studied the formation of EPBs during the near-sunrise and sunset periods during the geomagnetic storm period of 26–28 February 2023 over the East/Southeast Asian region. They highlighted that the electric fields generated by the storm were responsible for the formation of EPBs during the near-sunrise period.
To the best of our knowledge, the longitudinal characteristics of near-sunrise EPBs during the geomagnetic storms across the Indian and Southeast Asian longitude sectors have not been previously reported in the literature, making this study novel. This study investigates the anomalous generation of near-sunrise EPBs observed during the moderate to severe geomagnetic storm that occurred during 19–20 April 2024 across Indian and Southeast Asian regions. Multiple-instrument observations of GISTM-derived S4, GPS-derived ROTI, Digisonde observations of foF2 and h’F, and Swarm satellite-derived electron density profiles are used for the analysis. In Section 2, we provide a general overview of the data and methodology used. The findings from the observations are presented in Section 3. Section 4 discusses the results, followed by Section 5, which presents a summary of the results in this paper.

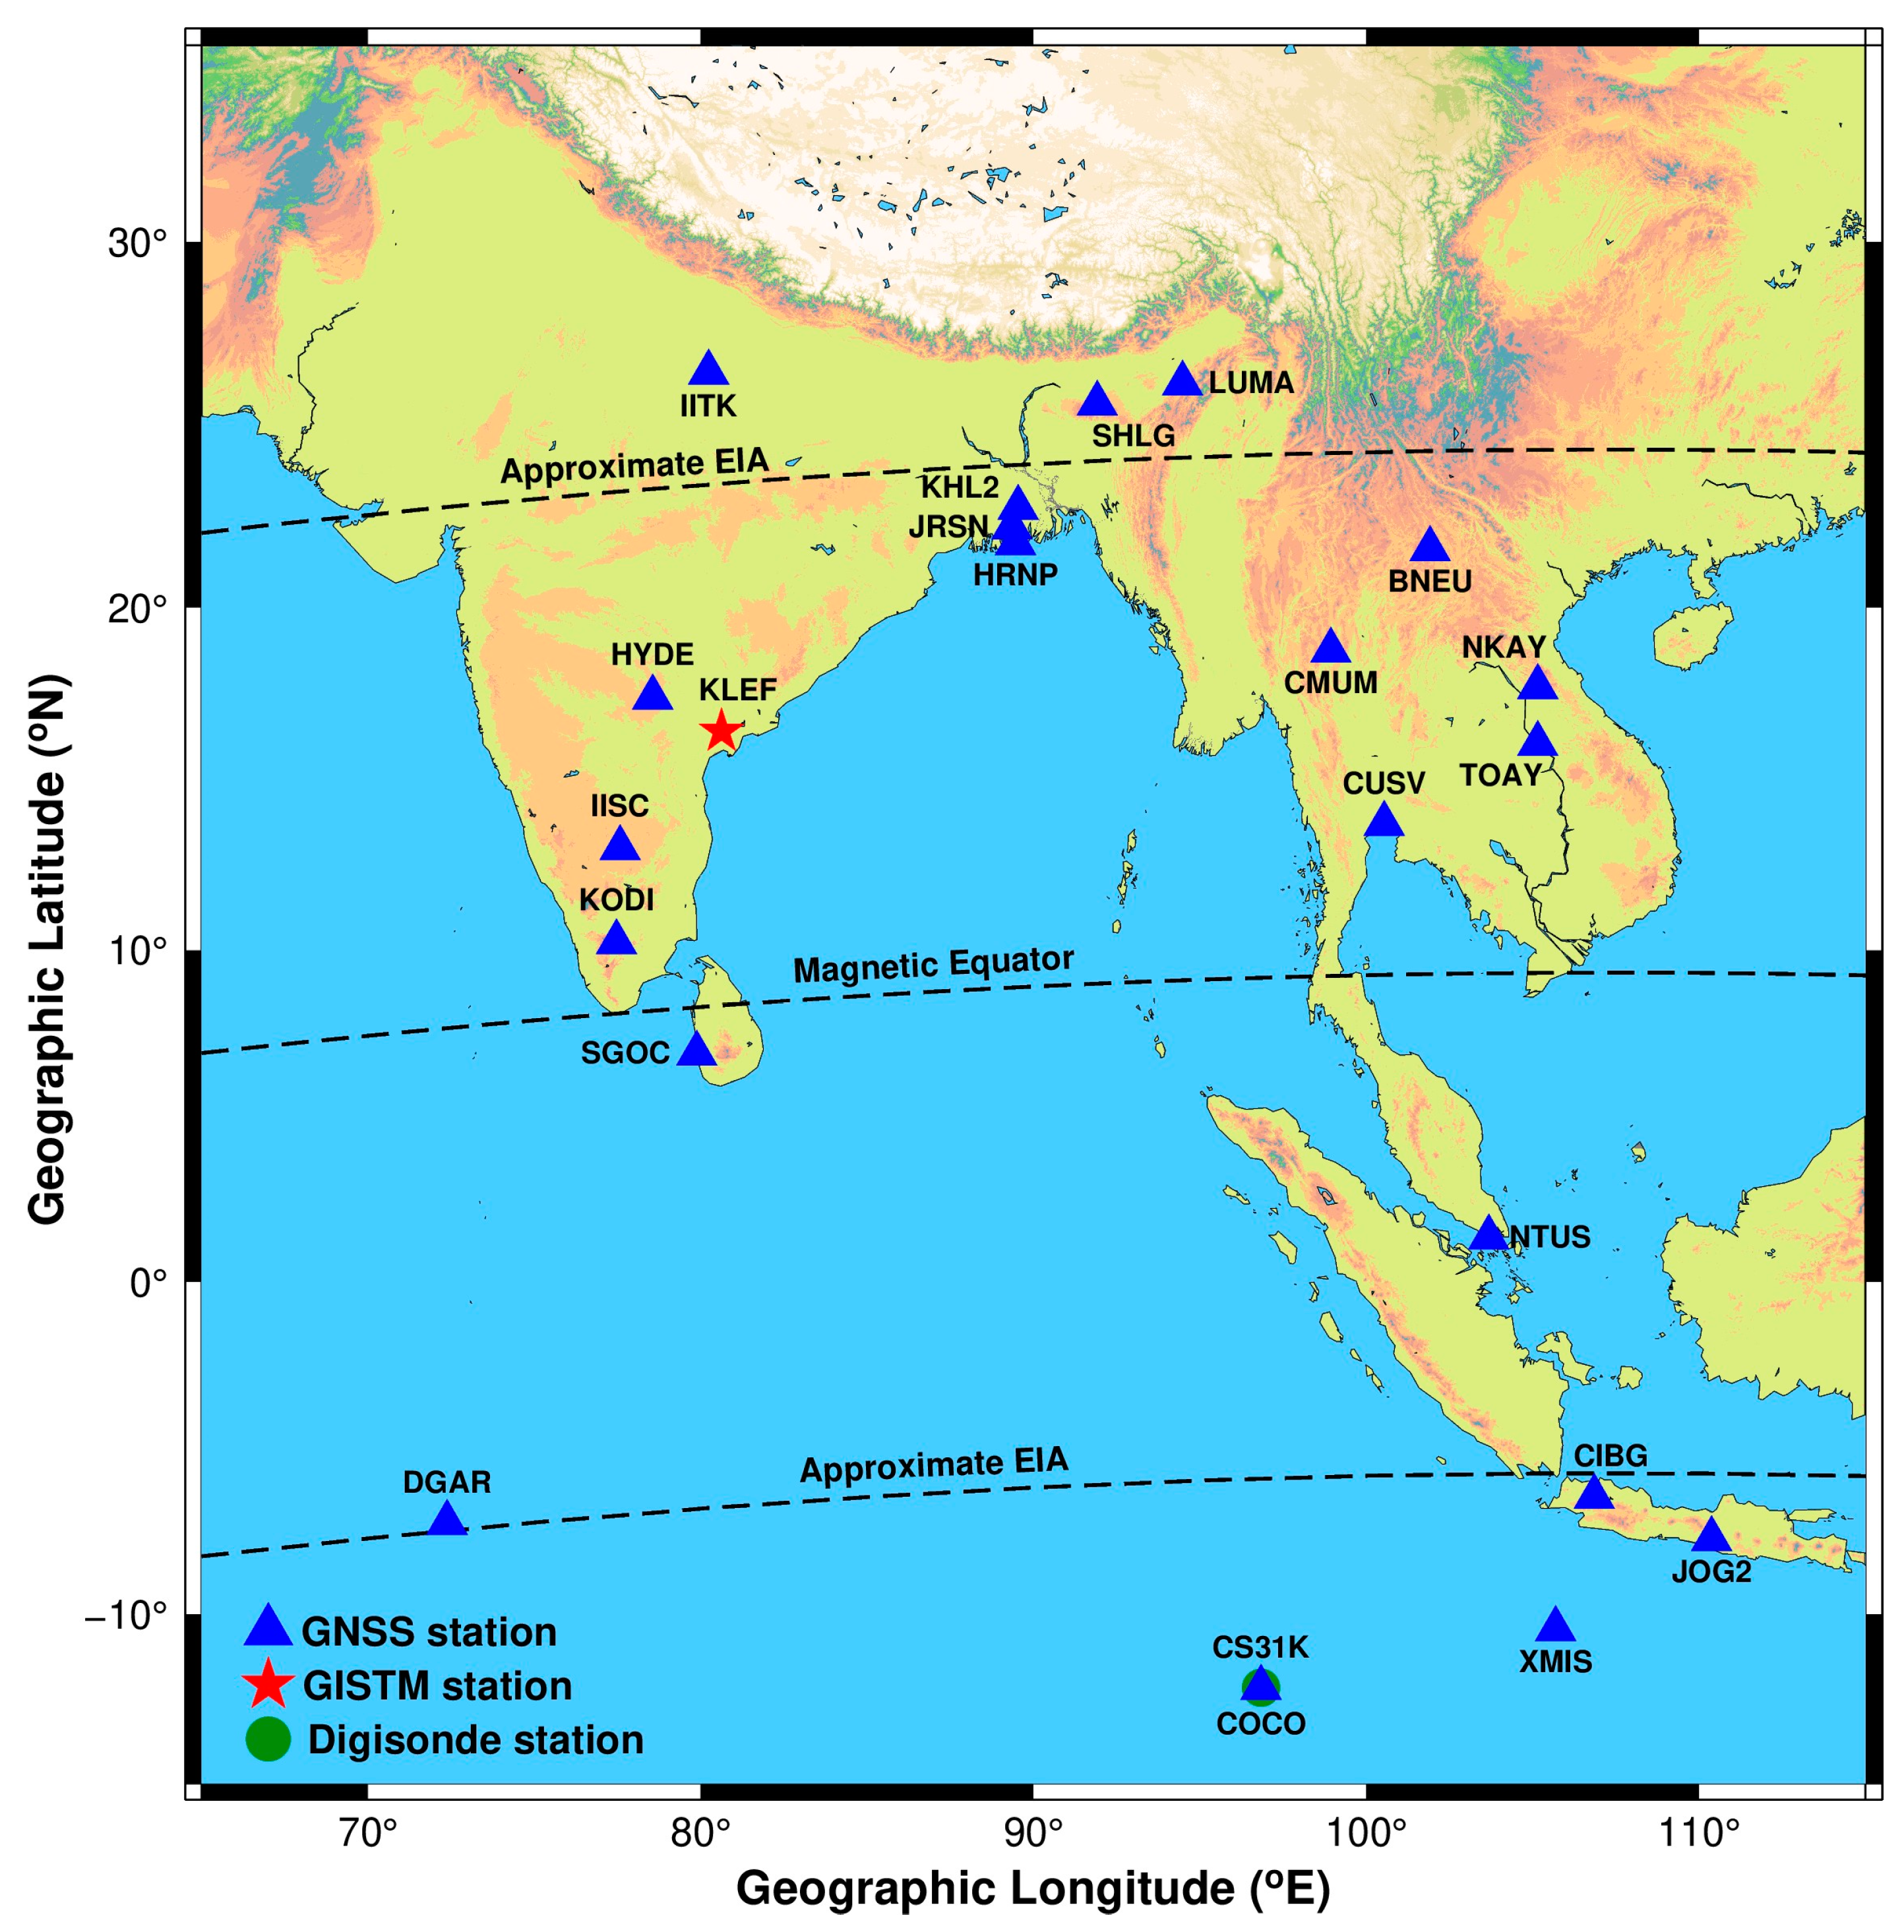
2. Materials and Methods

To characterize the variability of EPBs, we used the scintillation index (S4) recorded by a specialized GISTM receiver (Septentrio make PolaRx5S Receiver with VeraChoke choke ring antenna, Belgium) established at a low-latitude location, Vijayawada (geographic coordinates: 16.4°N, 80.6°E), along with the ROTI derived from GPS observations [34,35] collected by GNSS receivers (Make: Septentrio, Belgium; Trimble, USA; Leica, Switzerland) from Indian and Southeast Asian longitude regions (Table 1 and Figure 1). The GISTM receiver provided the S4 index by calculating the normalized variance of the signal intensity. The magnetic equator and the approximate EIA lines were obtained from the International Geomagnetic Reference Field (IGRF) model provided by the World Data Center for Geomagnetism (WDC), Kyoto (https://wdc.kugi.kyoto-u.ac.jp/, accessed on 6 January 2025). The approximate EIA was located at 15°N magnetic latitude, which was based on standard ionospheric models where the location of the peak electron density was present. The GISTM receiver provided the S4 index by calculating the normalized variance of the signal intensity (Equation (1)).
S 4 = S I 2 S I 2 S I 2
Here, 〈SI〉 is the 1 min average signal intensity.
The procedure provided by Nguyen Thanh et al. [36] was used to calculate the ROTI from GPS observations:
R O T I = R O T 2 R O T 2
Here, 〈 〉 determines the average over every nonoverlapping 5 min interval. The ROT could be obtained from the STEC measurements, as follows:
R O T = S T E C Φ n i S T E C Φ n 1 i t n t n 1
where i and n indicate the satellite PRN number and time of epoch, respectively. The denominator t n t n 1 corresponds to the time difference between the successive epochs.
Digisonde-derived foF2 and h’F measurements from the Cocos Island location, along with the Swarm-A and Swarm-C satellite-derived electron density profiles at the 85°E and 110°E longitudes, were also used in this analysis. Additionally, we used the PPEEFM-derived eastward electric fields to support the findings. The model utilized DSCOVR satellite-provided solar wind variables and a climatological model for quiet-day electric field fluctuations. If the DSCOVR data were unavailable, the model used the NASA/ACE spacecraft data. GMT version 6.0.0 was used to generate all the figures used in this study [37].

3. Results

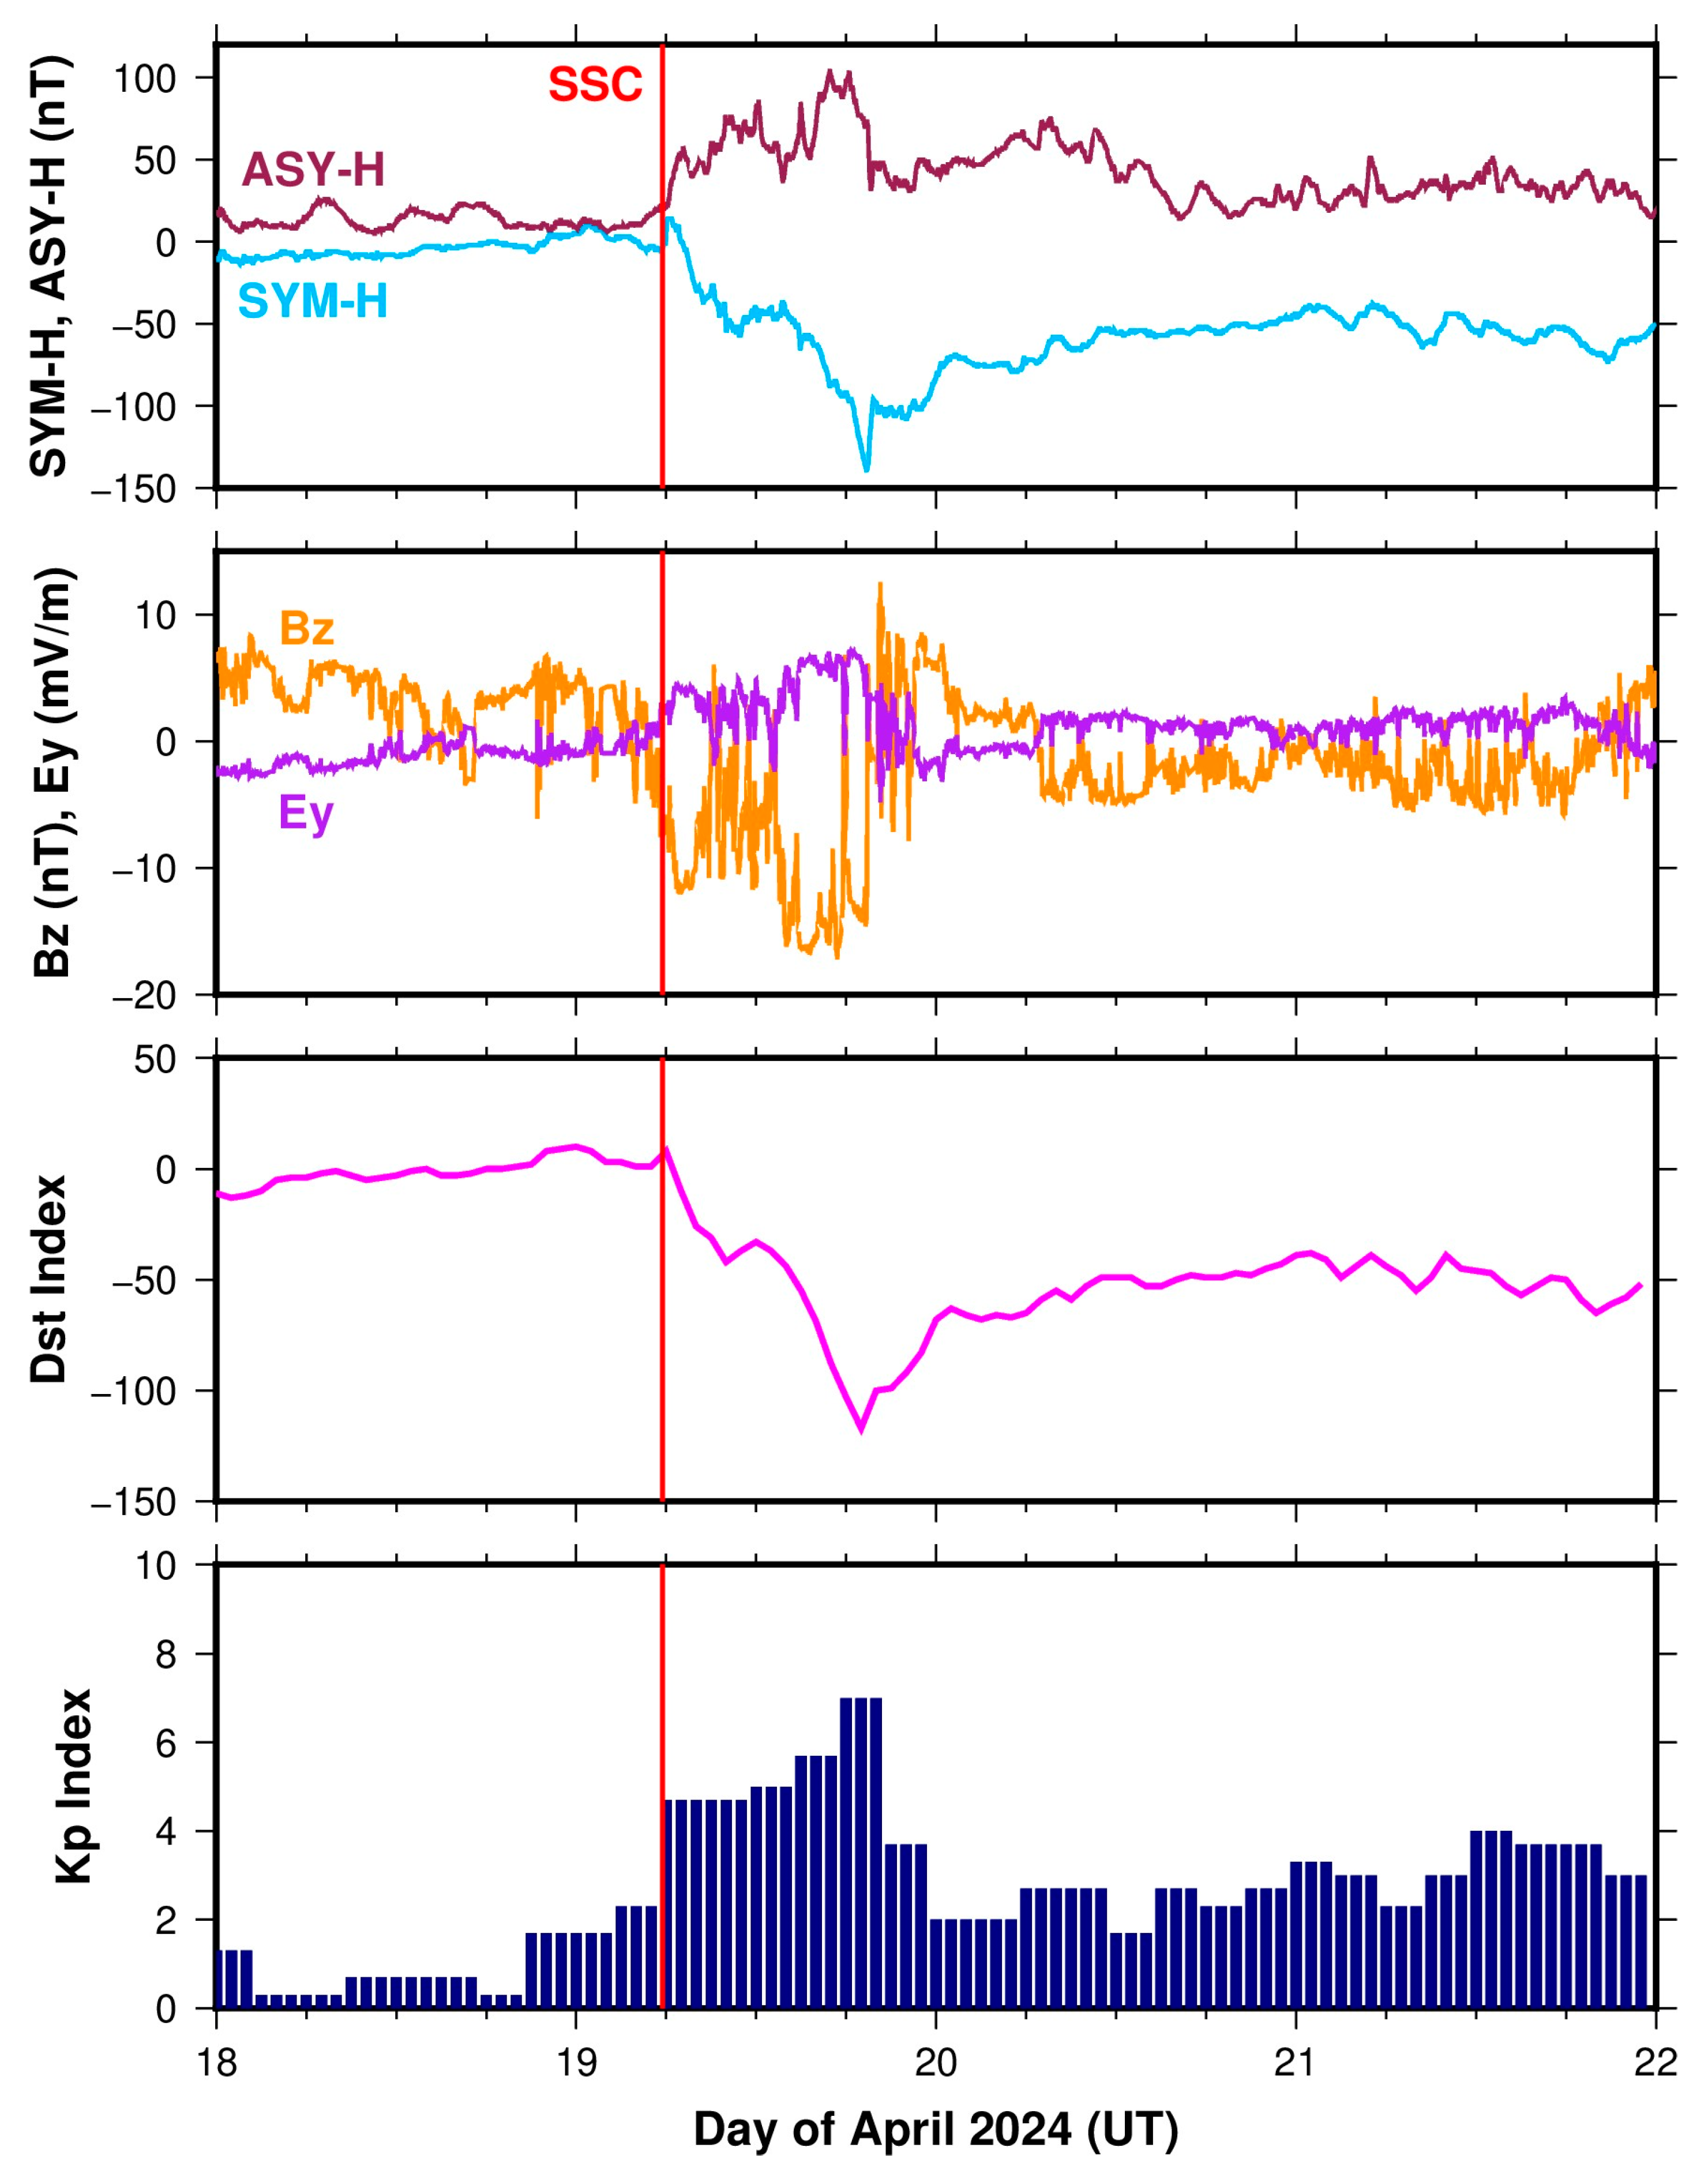
3.1. Geophysical Conditions During the Geomagnetic Storm of 19–20 April 2024

Geomagnetic and interplanetary parameters from 18 to 21 April 2024 are depicted in Figure 2. The initial phase of the storm started around 0530 UT on 19 April, marked by the IMF Bz component turning southward, and it reached its first minima (−12 nT) at 0649 UT. The IMF Bz continued fluctuating thereafter but mostly remained directed southward, touching the lowest minima (−17.22 nT) at 1724 UT on April 19. The episode was succeeded by the storm recovery phase around 1920 UT on April 19 with a sudden shift of the IMF Bz into the northward direction, reaching its peak value of 12.56 nT at 2017 UT. After this, it mostly persisted in the northward orientation throughout the recovery phase. Additionally, the SYM-H index dropped down to reach a minimum value of −139 nT during the main phase, after which it began to recover toward normal levels in the subsequent phase. The hourly Kp index reached 7, and the hourly minimum Dst index dropped to −117 nT during the storm.

3.2. Occurrence Characteristics of EPBs During 18–21 April 2024

3.2.1. S4 Index from 80°E Longitude Sector During 18–21 April 2024

The S4 index measurements obtained from the low-latitude GISTM receiver at Vijayawada (KLEF) from 18 to 21 April 2024 are presented in Figure 3. During the study period, S4 values consistently exceeded 0.6 during the post-sunset period on all days except for 20 April, indicating significant scintillation activity during these hours. This suggested the presence of enhanced ionospheric irregularities after sunset, which were also observed in the storm’s main phase on 19 April. This indicates that the storm did not cause any significant electric field changes in the ionosphere during dusk time. In contrast, no noticeable increase in the S4 index was observed during the sunrise period on any of these days. However, a marked increase in scintillation activity was observed during the recovery phase of the storm, which began around 1920 UT on the second day. Specifically, around the local sunrise period from 2200 UT on April 19 to 0400 UT on April 20, the S4 values increased from quiet-time levels to 0.4 (between the black dotted line in Figure 3), confirming moderate scintillation activity.

3.2.2. ROTI from 70–80°E Longitude Sector During 18–21 April 2024

To support the occurrence of near-sunrise EPBs over the region, GPS-derived ROTI values from southern EIA region latitudes to the northern pole-ward EIA latitudes in the 70–80°E longitude region are presented in Figure 4. Similar to the S4 data, the ROTI values (>1 TECU/min) from all processed stations indicated the presence of EPBs and scintillation activity around the sunrise period. An increase in ROTI values was first observed at the 77°E and 80°E longitude stations SGOC, HYDE, and IISC (~2200 UT), followed by KODI and IITK (~0000 UT on 20 April). The increase was observed later at the 72°E longitude station in the Southern Hemisphere, DGAR (~0300 UT on 20 April). The ROTI values from stations located within the EIA and pole-ward EIA regions (HYDE and IITK) exhibited higher magnitudes compared to the dip-equatorial station SGOC. This suggested that ionospheric irregularities and associated EPBs were more prominent at higher latitudes within the EIA. Moreover, the S4 and ROTI values jointly confirmed the presence of near-sunrise EPBs, with significant scintillation activity lasting up to three hours after the sunrise terminator.

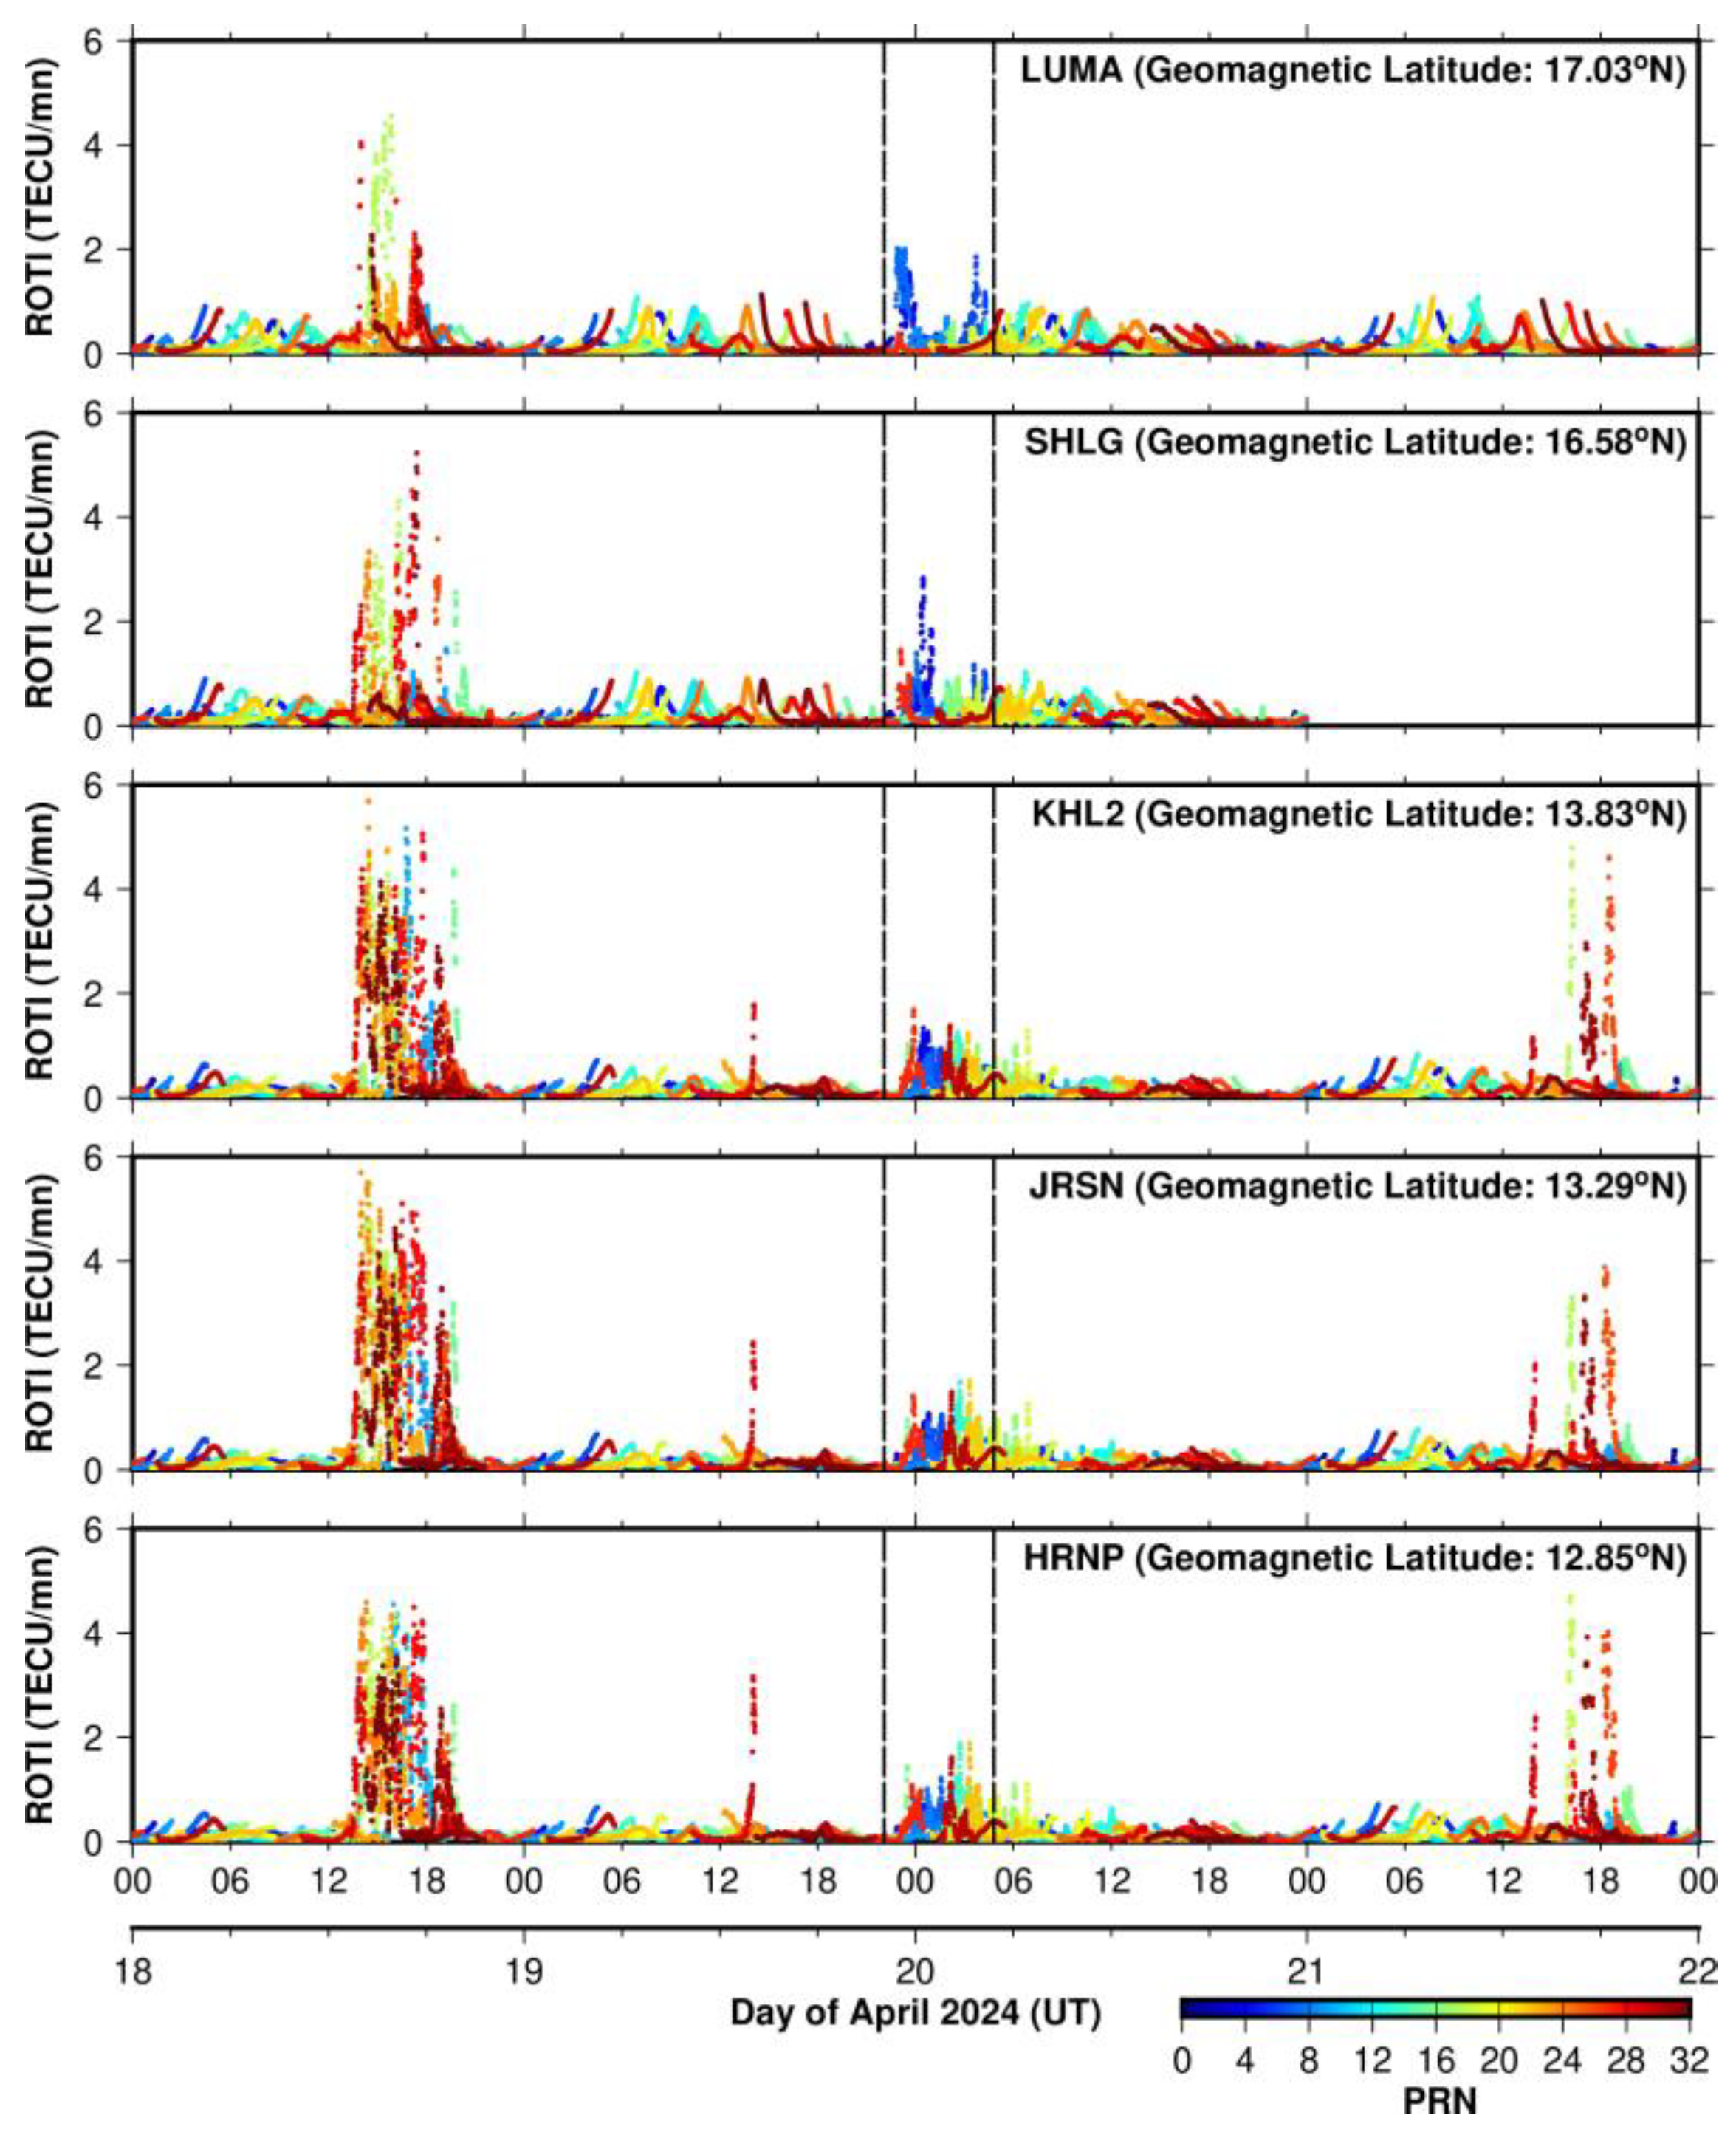
3.2.3. ROTI from 90°E Longitude Sector During 18–21 April 2024

GPS-derived ROTI values over EIA and beyond EIA region stations from the 90°E longitude sector are plotted in Figure 5. The results indicated clear patterns of plasma irregularities during the sunrise period (ROTI > 1 TECU/min), with distinct variations in the ROTI values observed across different stations. At EIA stations (HRNP, JRSN, and KHL2), a marked increase in ROTI values was seen from all the available PRNs, suggesting the presence of enhanced ionospheric irregularities. In contrast, in stations located beyond the EIA region (SHLG and LUMA), only a few PRNs experienced the scintillation activity, with an increase in ROTI values around 2200 UT to 0400 UT the next day, indicating a weaker presence of EPBs.

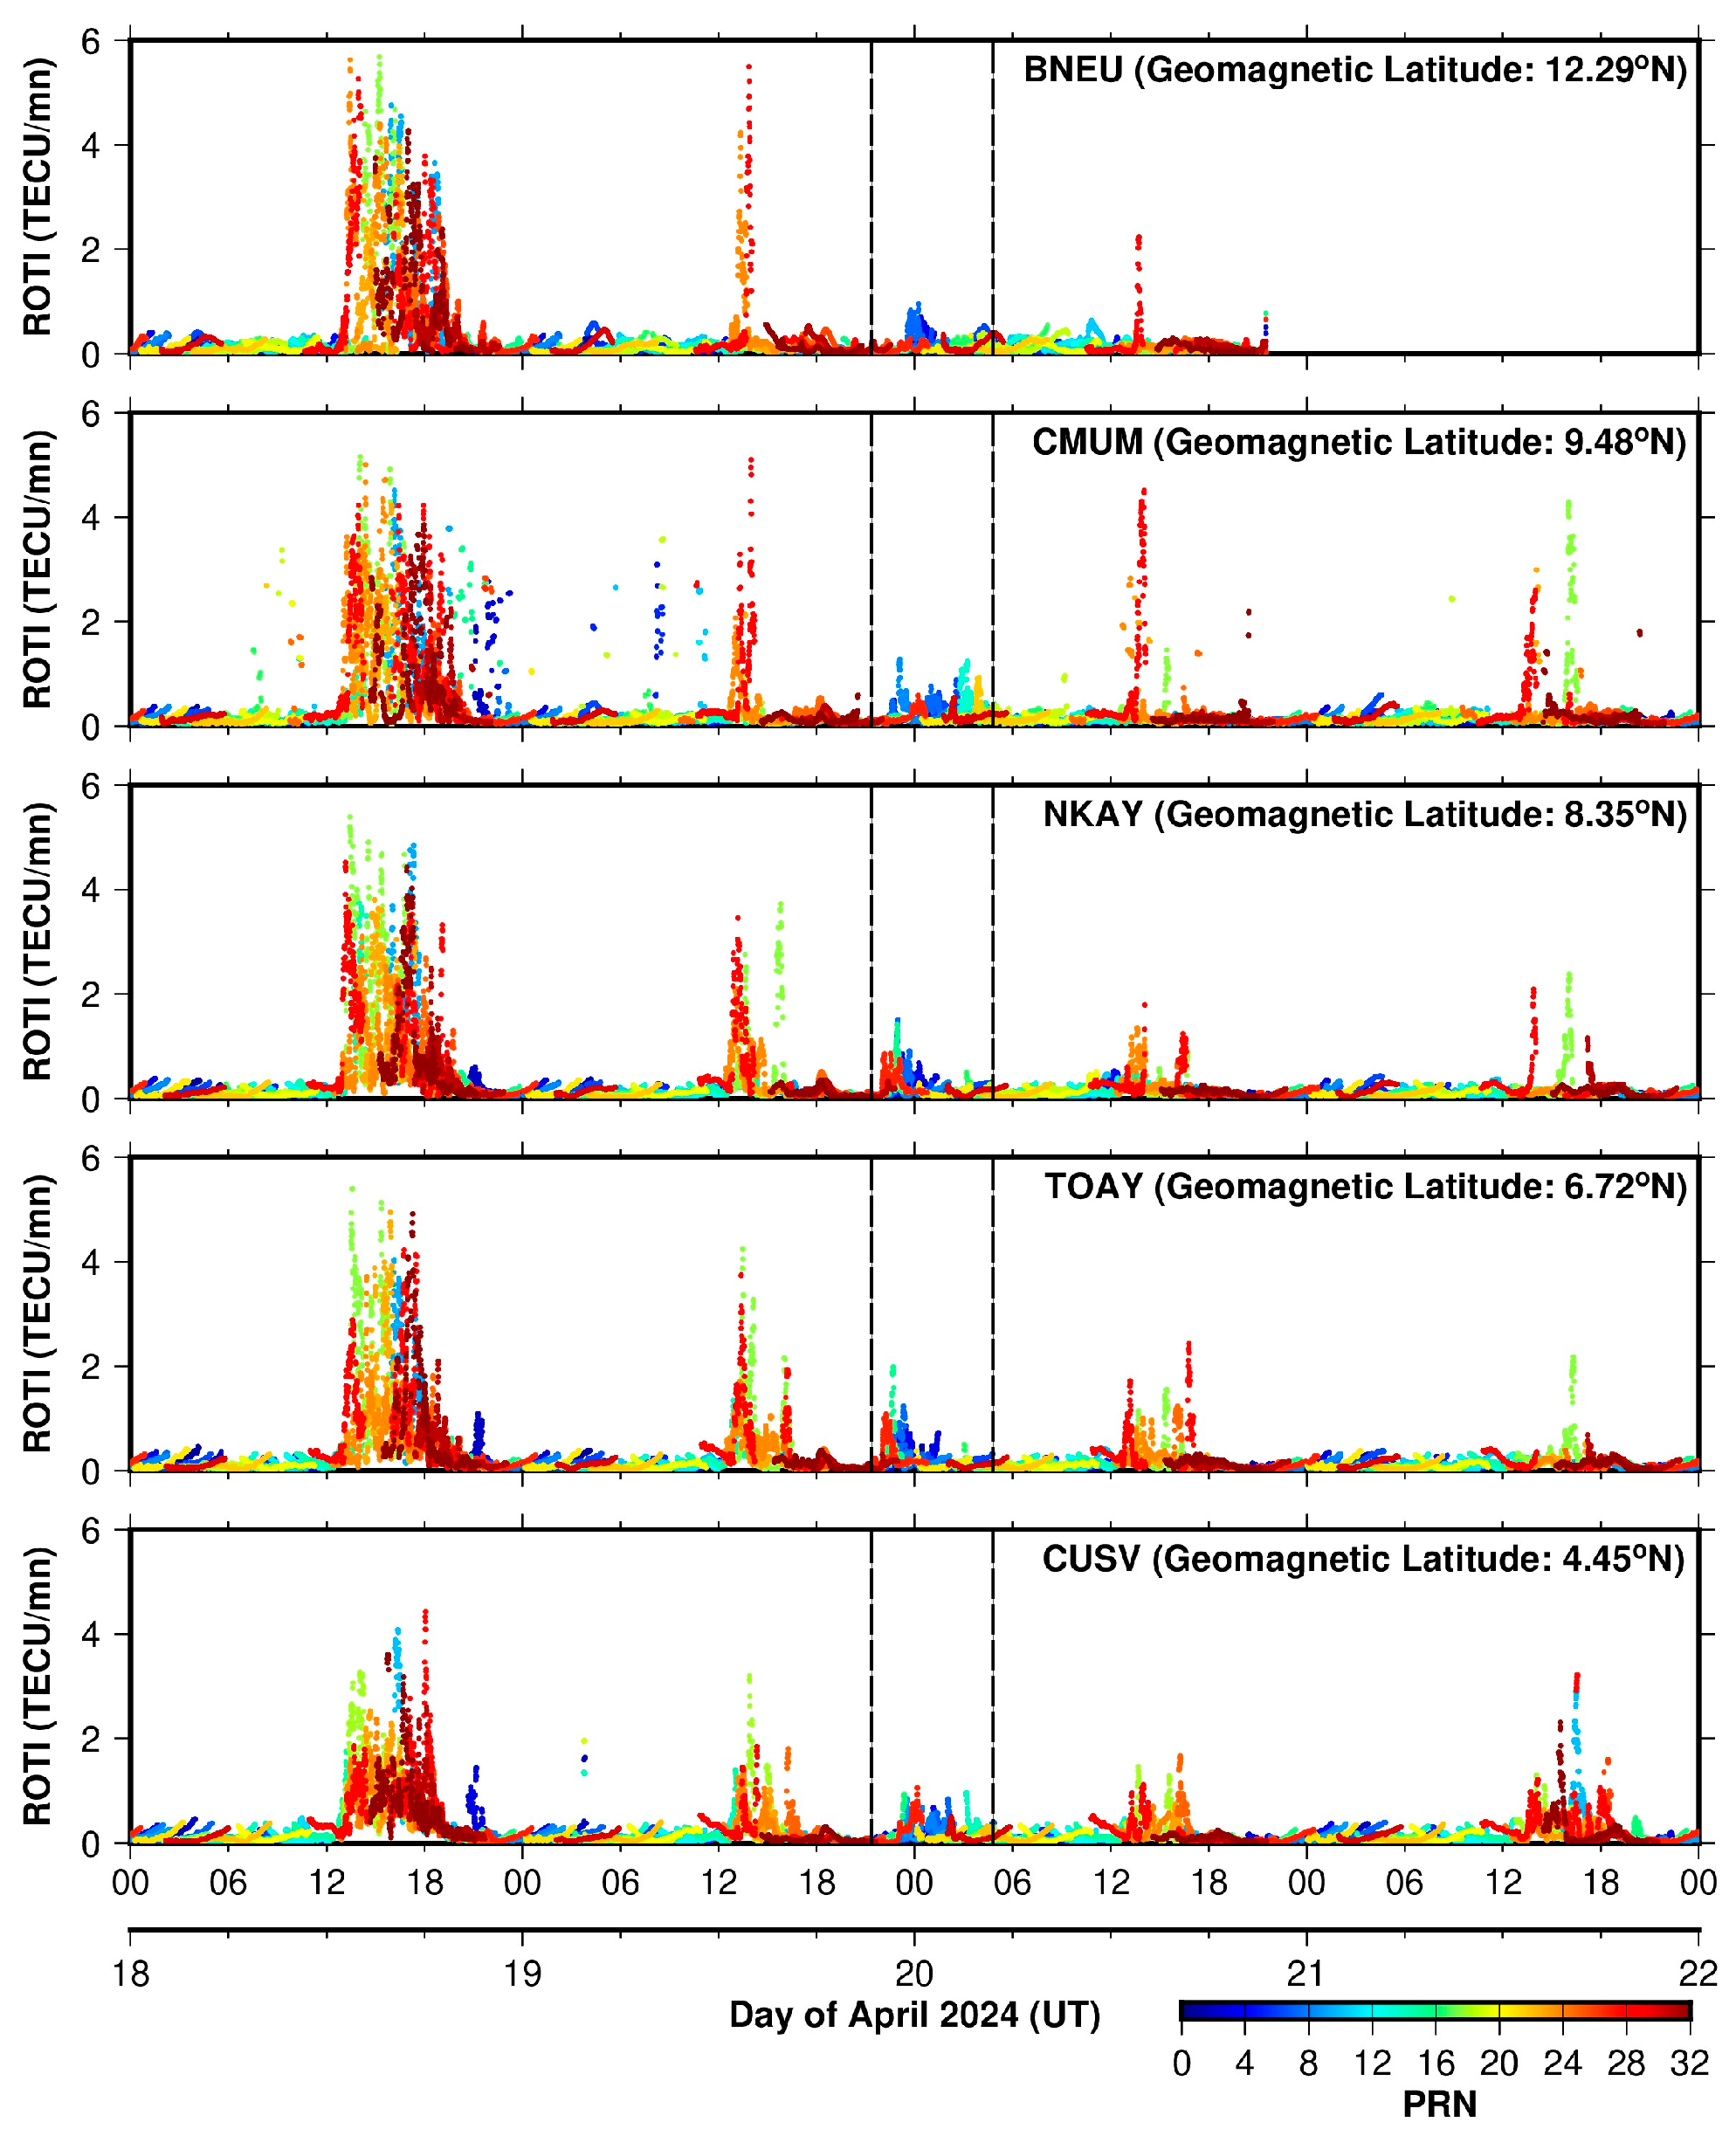
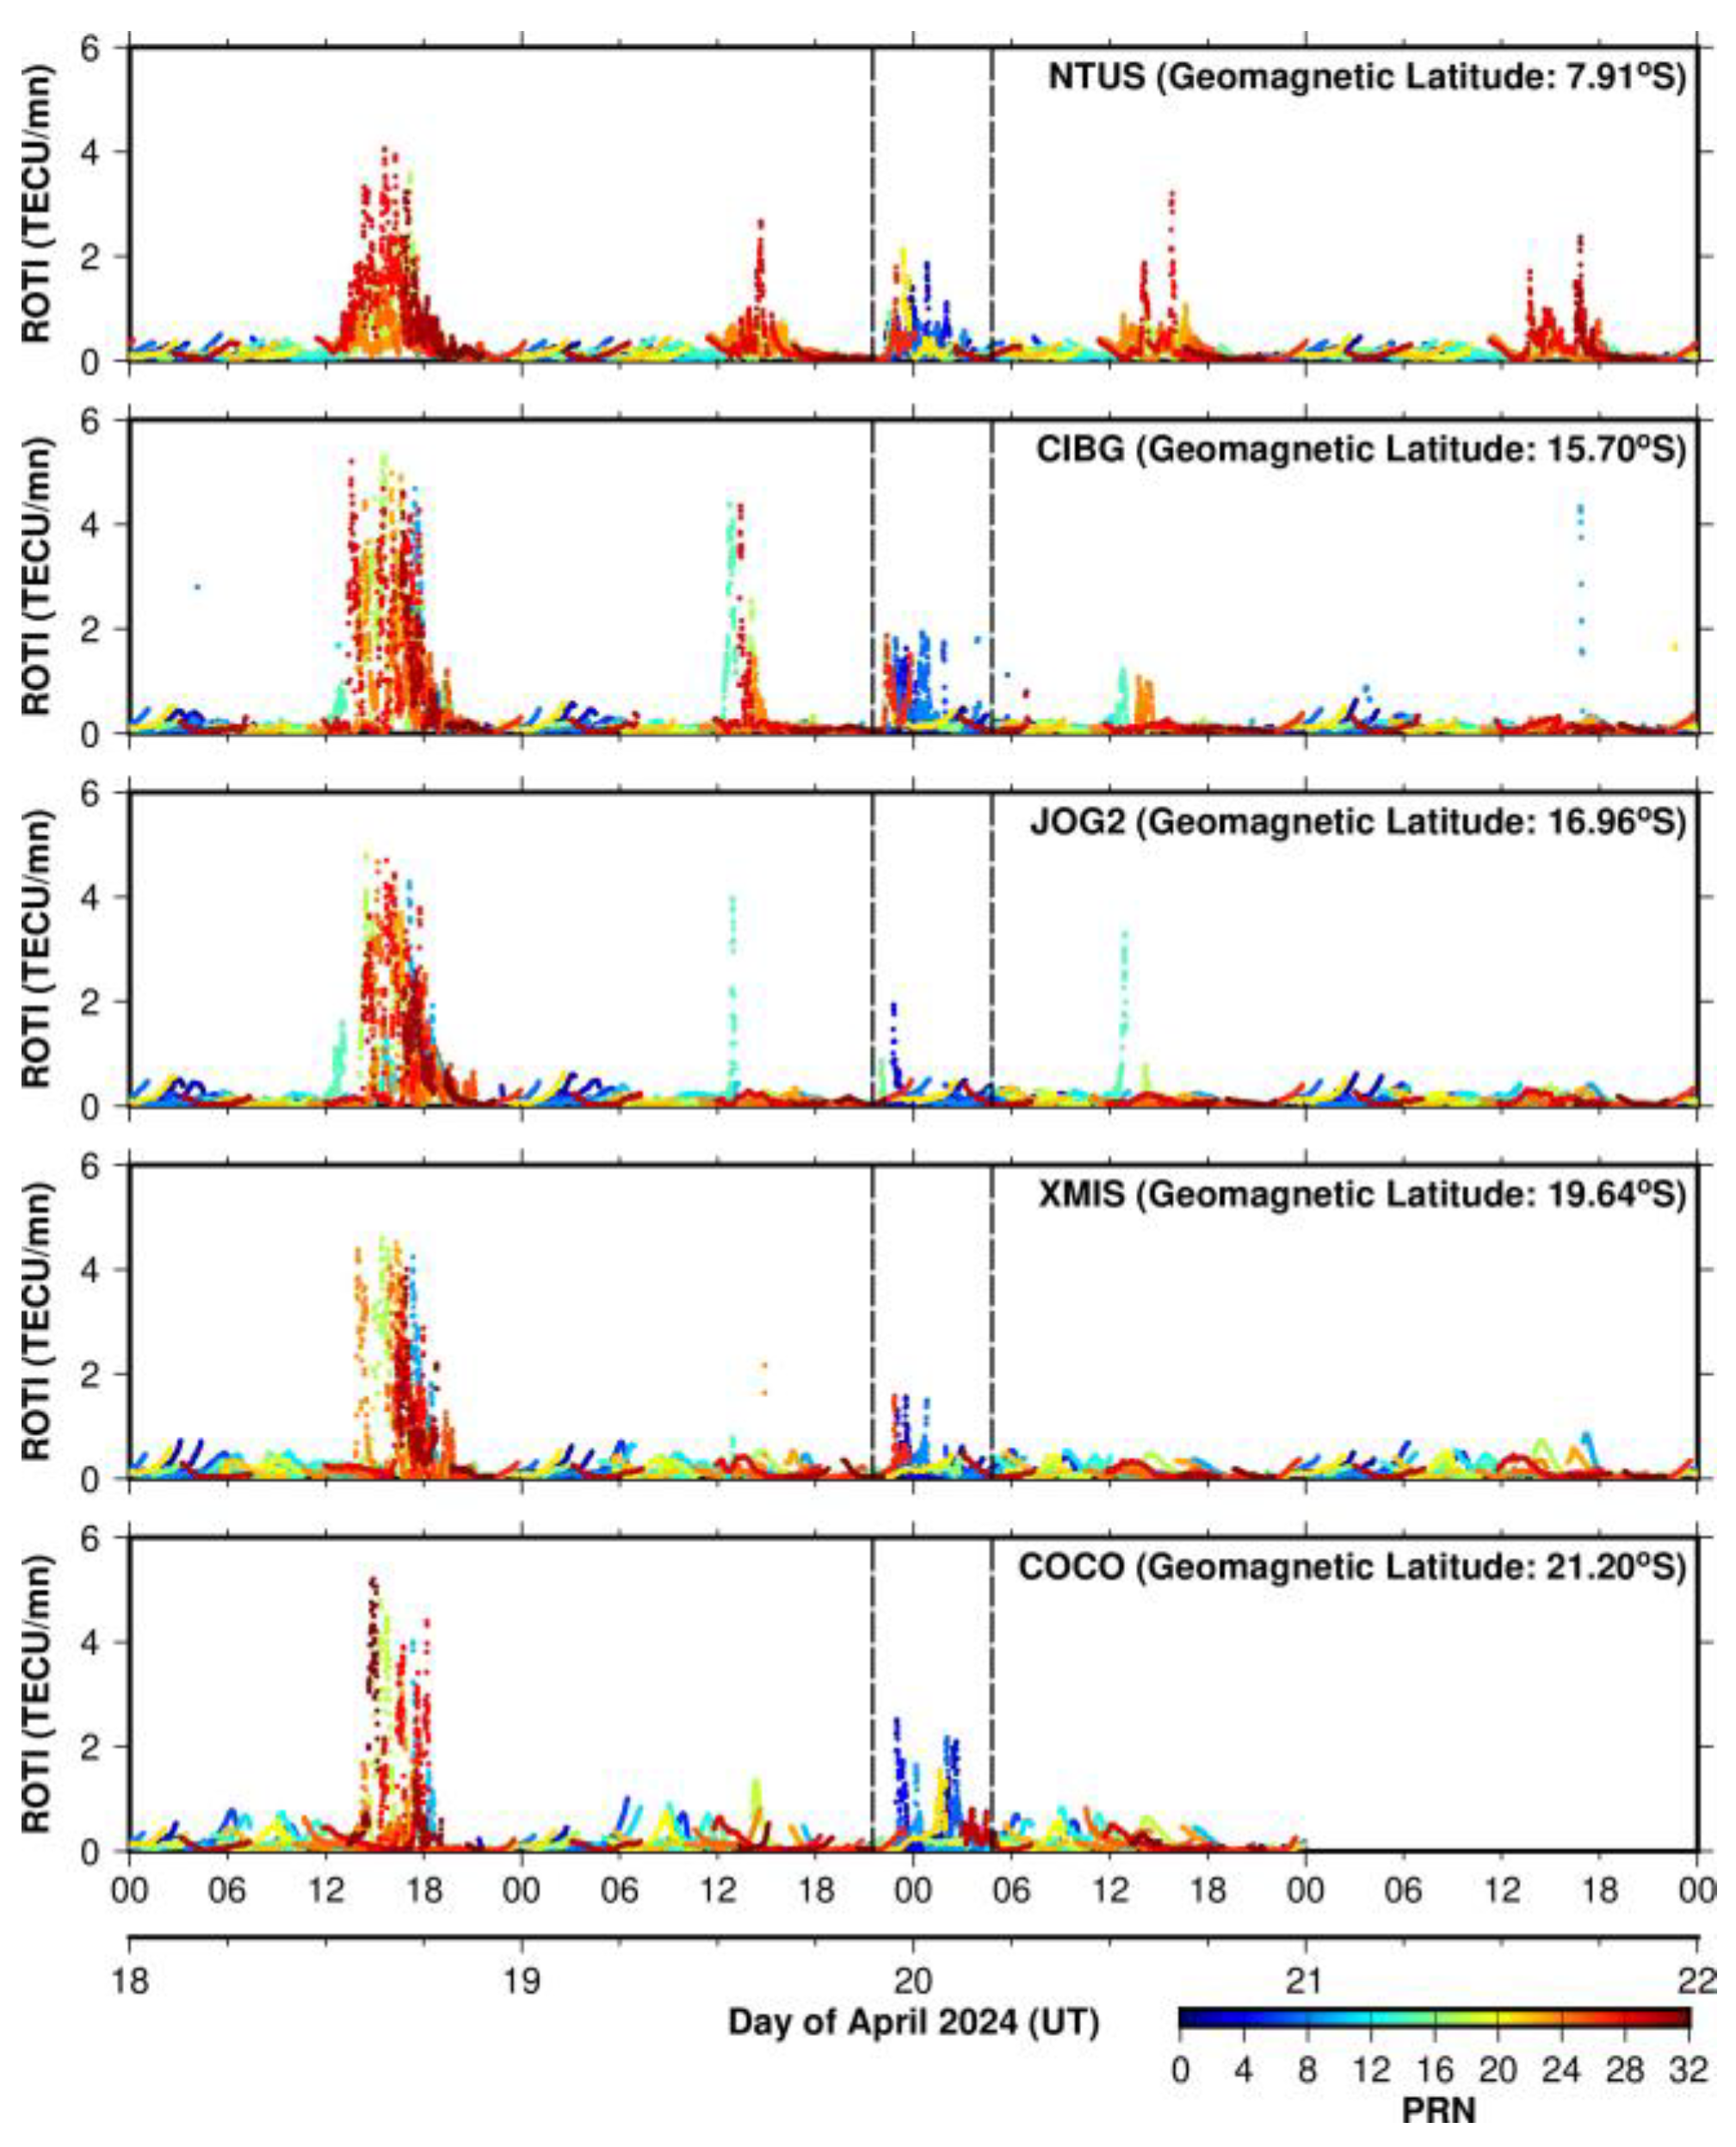
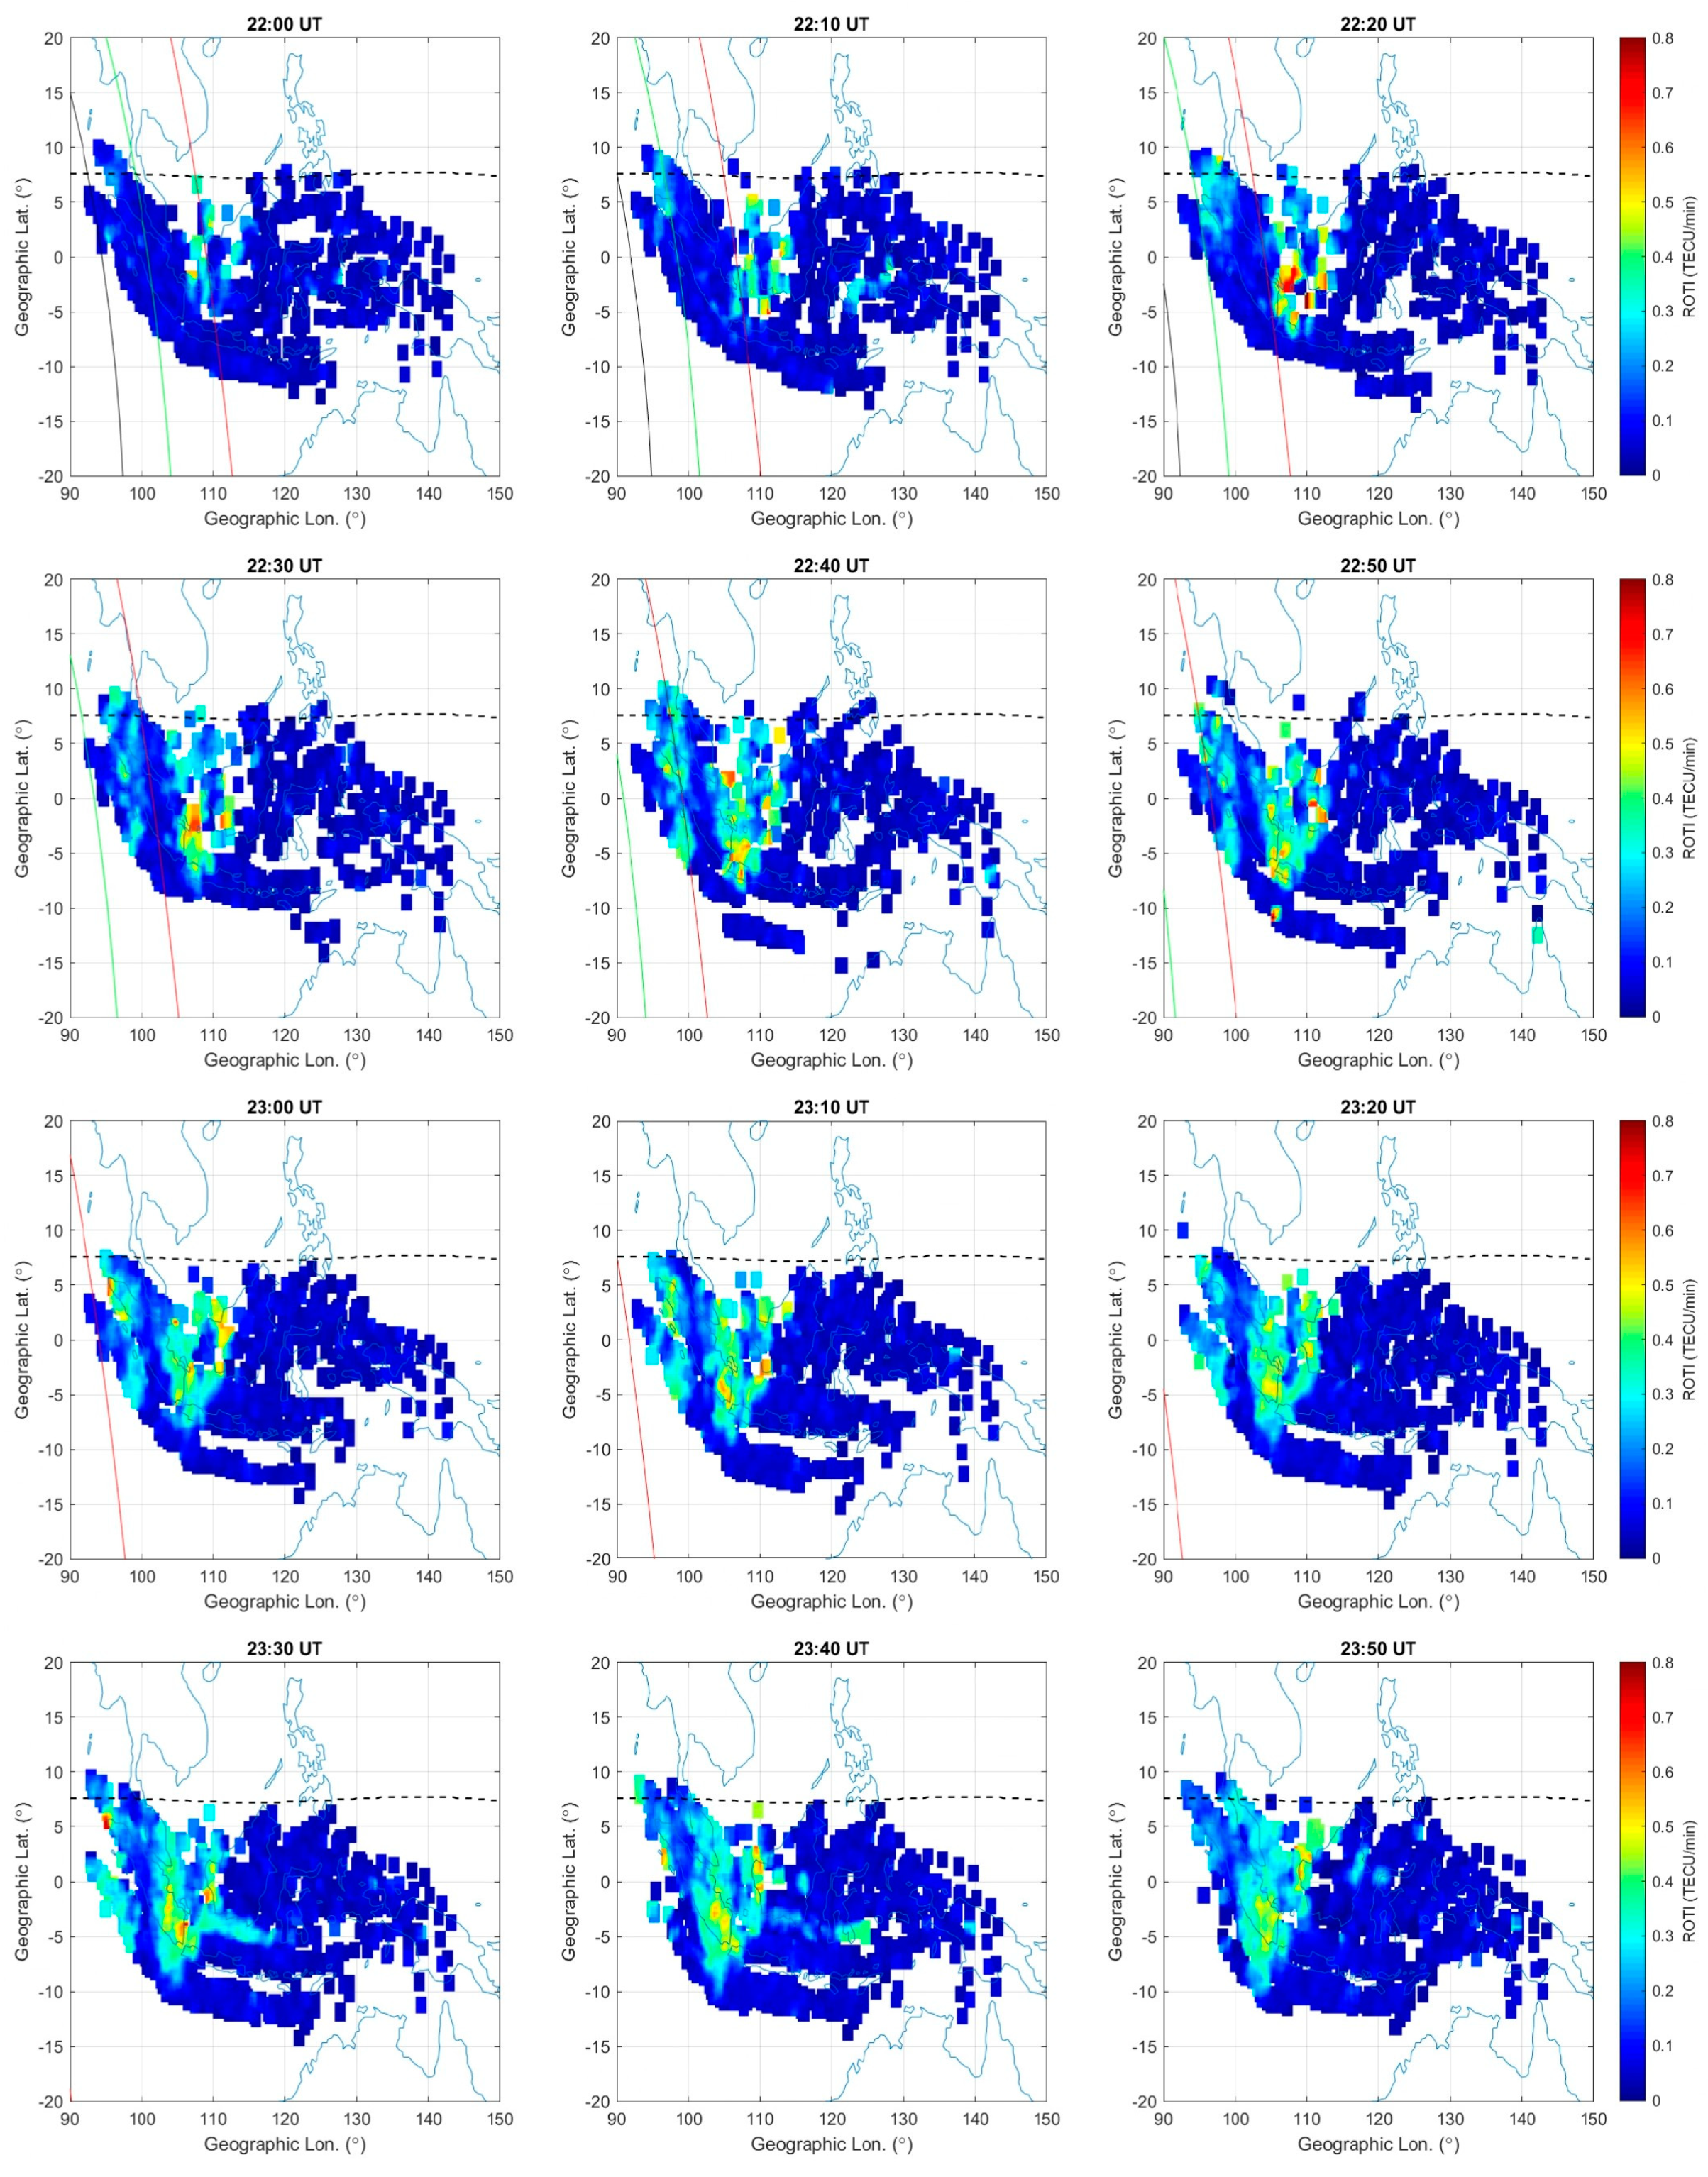
3.2.4. ROTI from the 100 to 110°E Longitude Sector During 18–21 April 2024

The GPS-ROTI spanning from the southern EIA region to the northern EIA region across the 100–110°E longitude sector is illustrated in Figure 6 and Figure 7. This region also showed the occurrence of near-sunrise EPBs during the geomagnetic storm recovery phase, from 2200 UT on 19 April to 0300 UT on 20 April. The intensity of EPBs was significantly higher (ROTI > 2 TECU/min) at stations located in the latitudes of the geomagnetic south, compared to those in the northern latitudes. Moreover, EPBs at northern EIA region stations were short-lived and persisted for only one to two hours. Also, the EPBs disappeared even earlier at stations situated at longitudes greater than 105°E (such as NKAY, TOAY, XMIS, and JOG2). Interestingly, the station COCO, located beyond the southern EIA crest region, also exhibited high magnitude in ROTI values, exceeding 2 TECU /min, indicating intense EPBs.
The ROTI maps from the Indonesian GNSS network are also plotted in Figure 8 to understand the EPB variations around the geomagnetic equator in the Southeast Asian longitude region [38]. These ROTI maps were generated from 2200 UT to 2350 UT on 19 April, with an interval of 10 min. The EPBs began to form in the region around 2200 UT on 19 April, near the geomagnetic equator during the local sunrise period. Subsequently, these EPBs were formed in other longitude regions, specifically those below 110°E longitude. Notably, no EPB formation was observed in longitudes greater than 110°E.

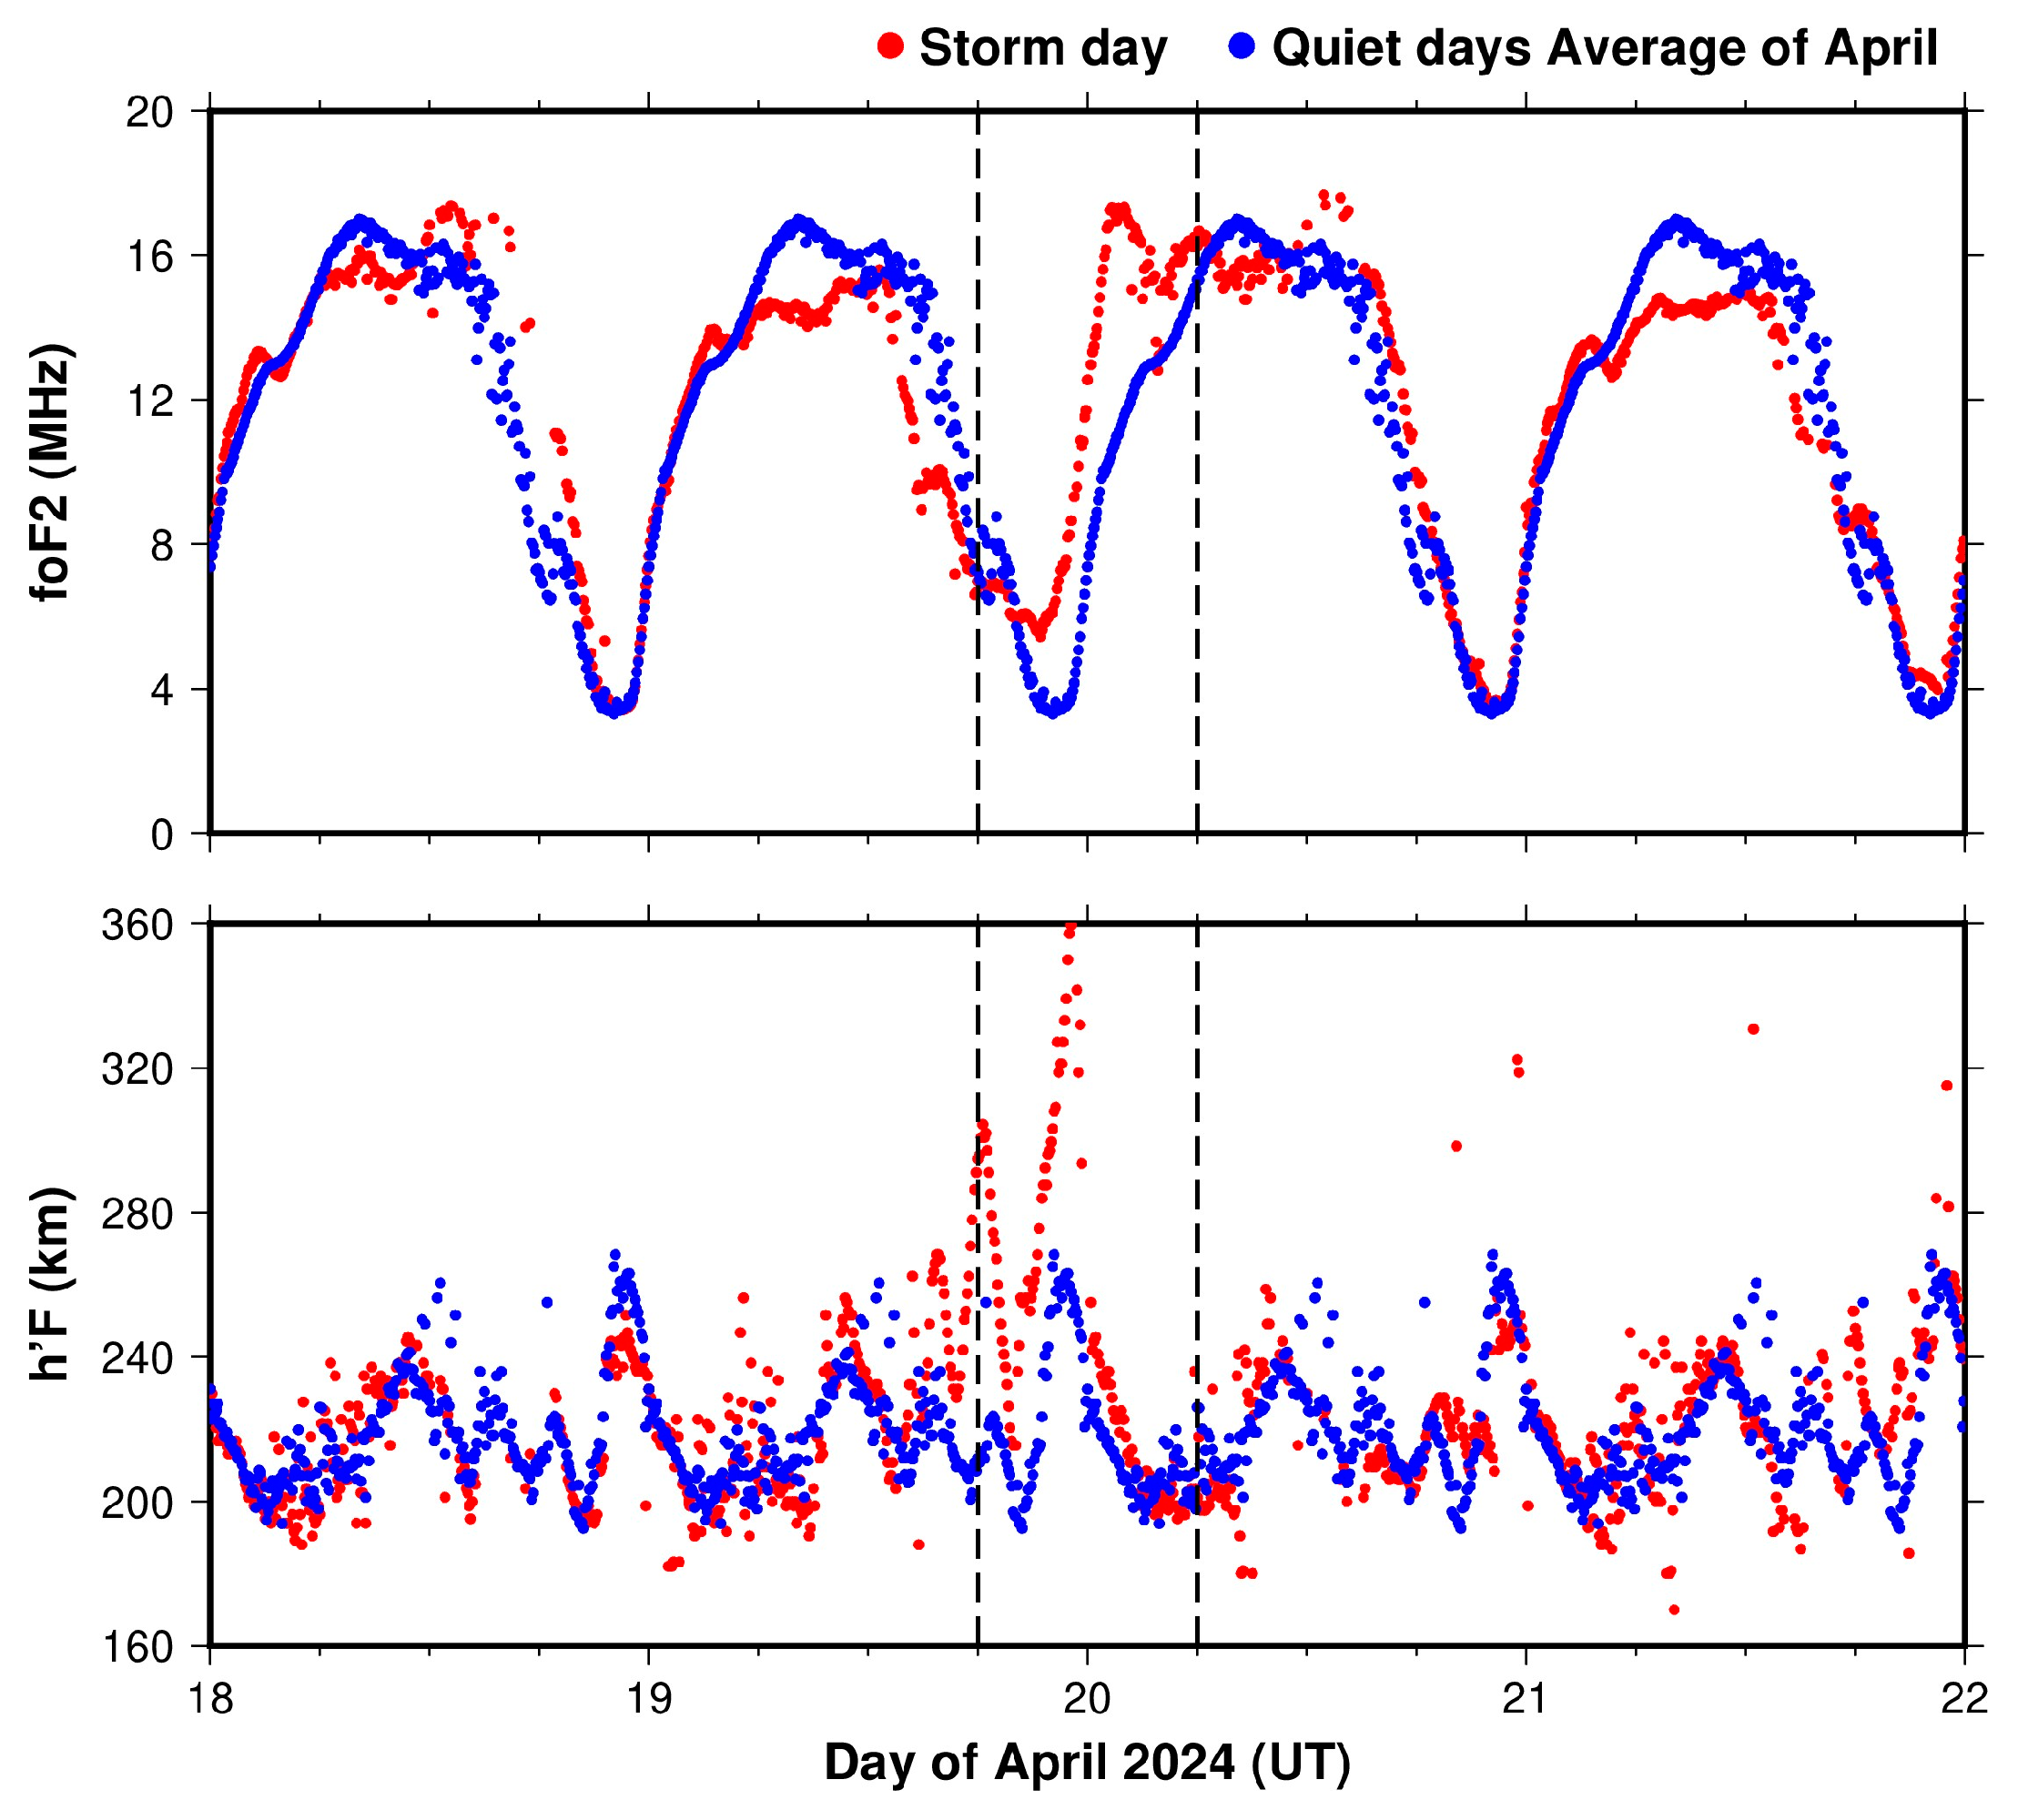
3.2.5. foF2 and h’F Variations at Cocos Island from 18 to 21 April 2024

Digisonde-derived foF2 and h’F at Cocos Island (geographic coordinates: 12.19°S, 96.83°E) located beyond the southern EIA region are plotted in Figure 9. The average of quiet days was calculated from five international quiet days in April 2024. During the storm period, the h’F increased to more than 350 km around sunrise, which is significantly higher than the quiet-time levels (maximum was ~280 km). The critical frequency of the F2 layer also increased from quiet-time levels from 2200 UT on 19 April to 03 UT on 20 April. The rise in F-layer height and foF2 values indicated an elevated F layer near the sunrise period during the storm recovery phase at Cocos Island. This supported the occurrence of EPBs, which is also observed in the increase of ROTI in Figure 7.

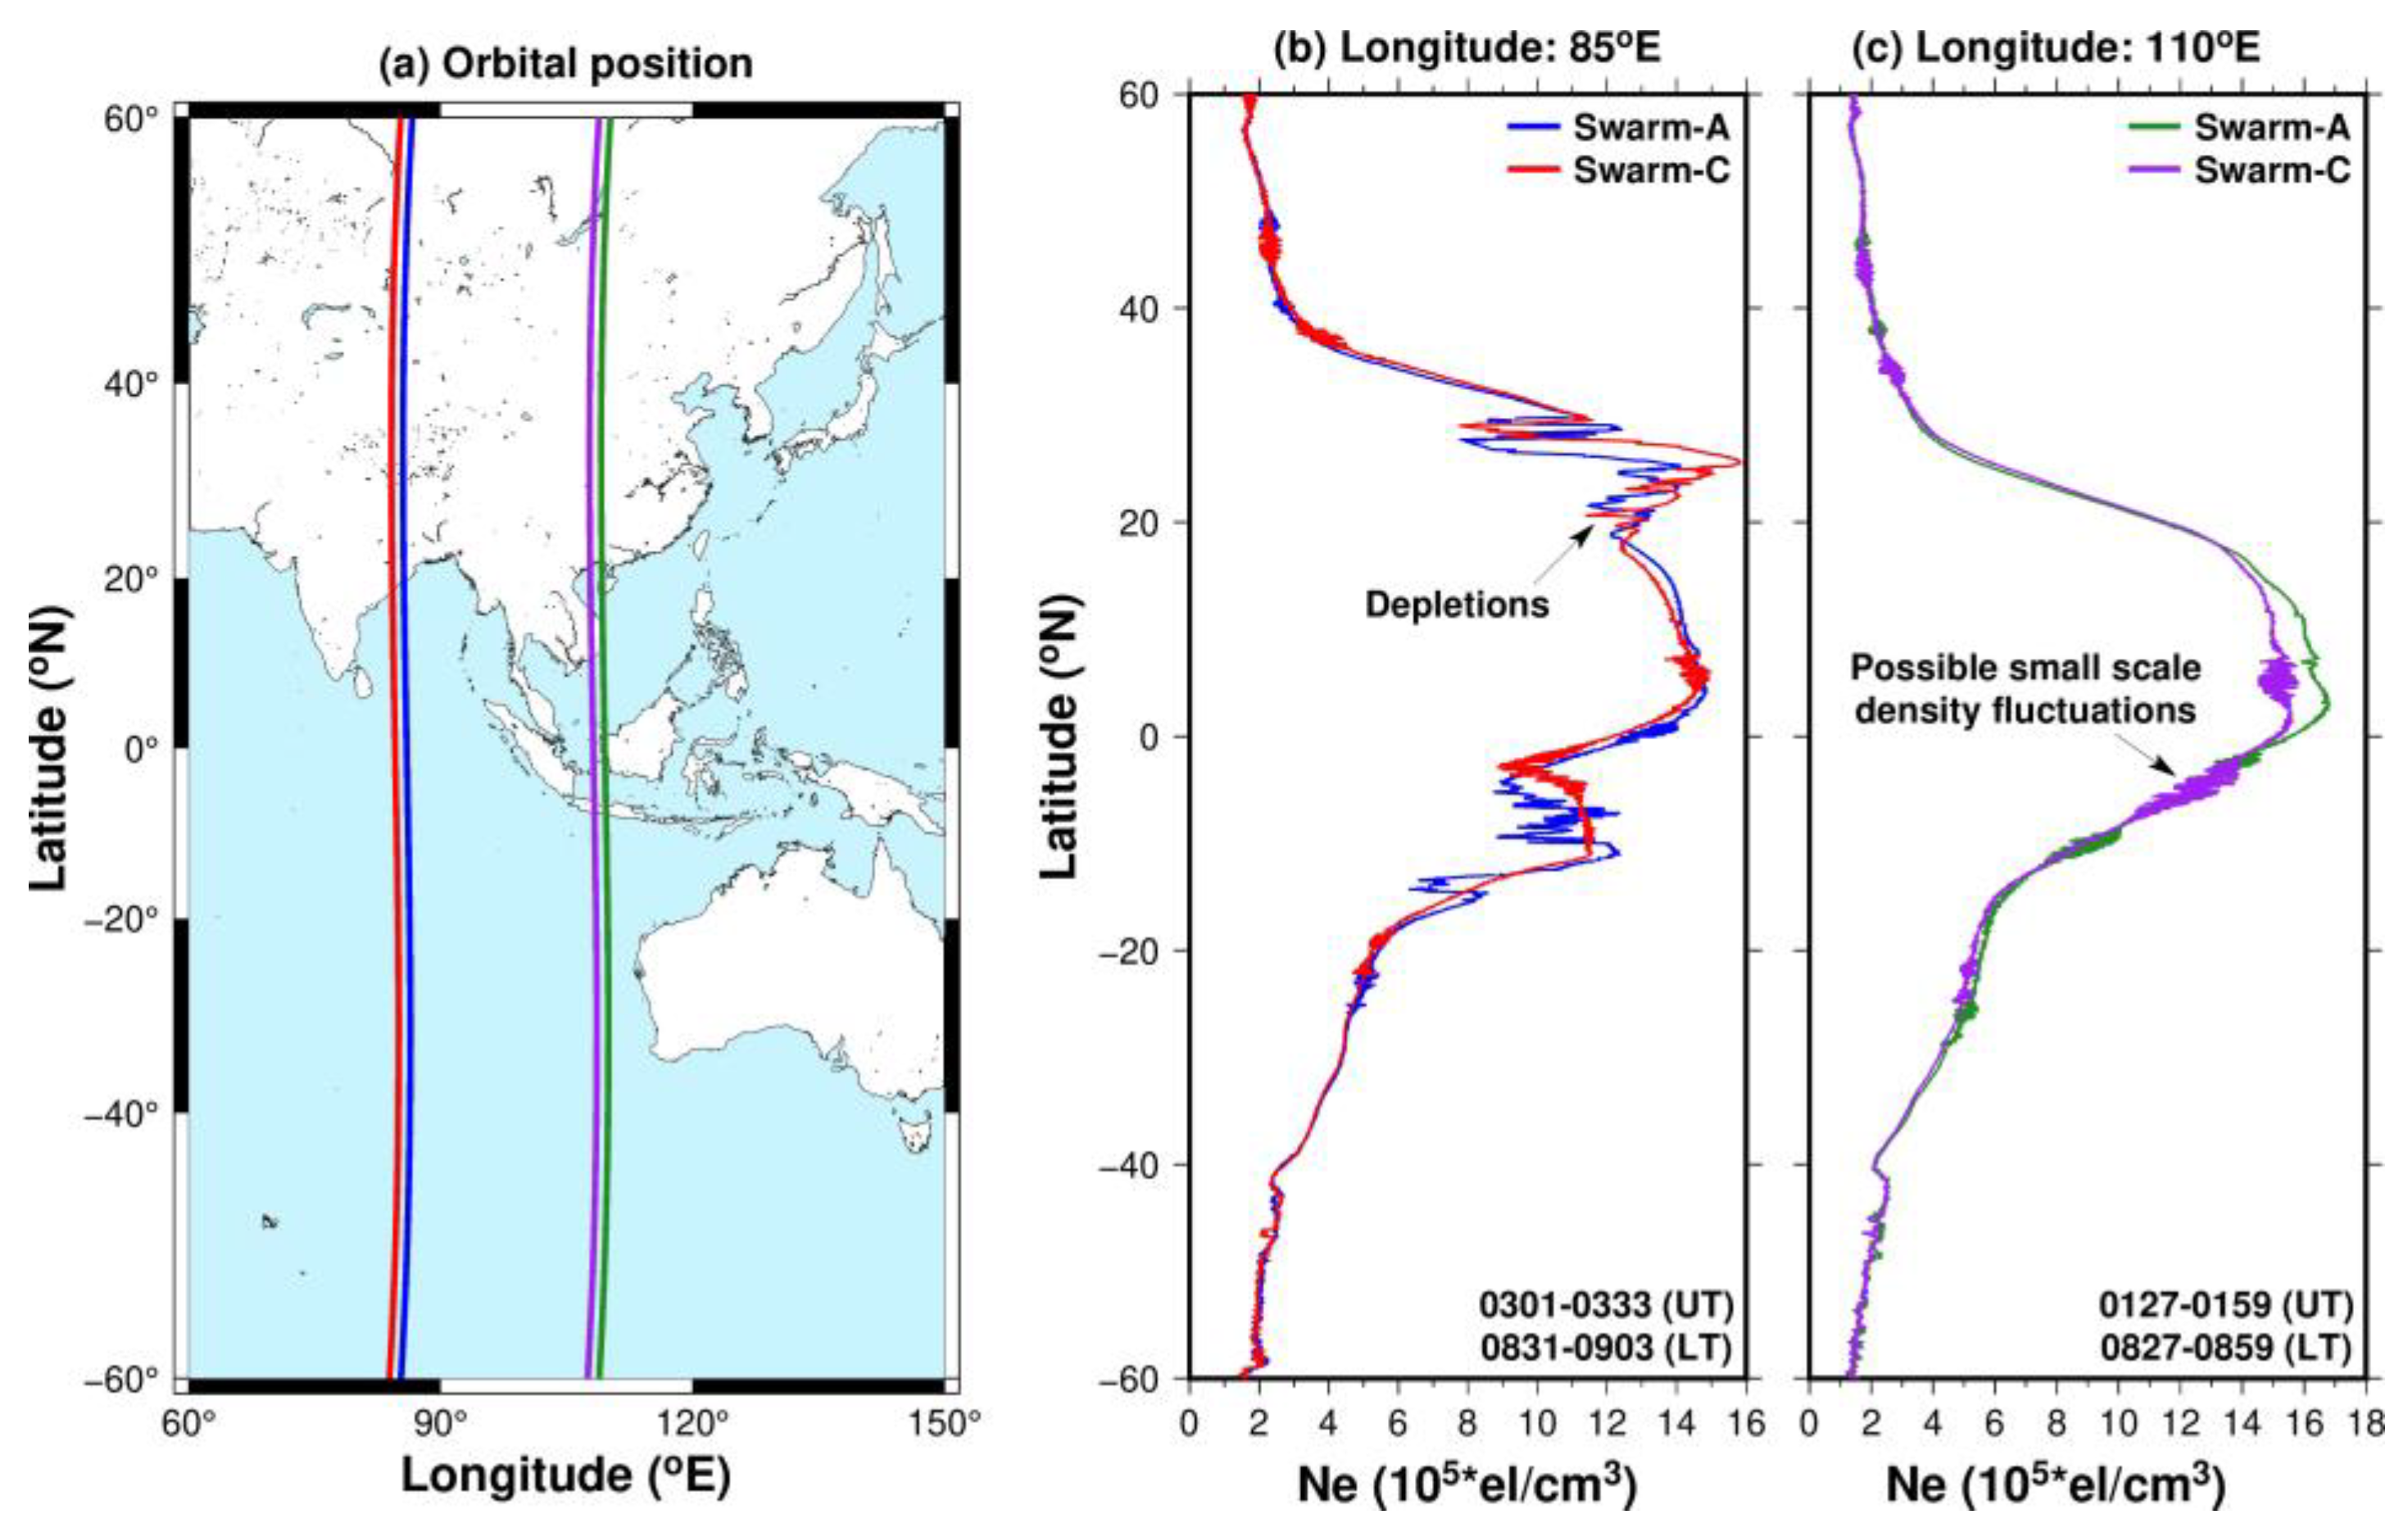
3.2.6. Swarm Satellite-Derived Electron Density Variations at 85°E and 85°E Longitudes on 20 April

Electron density variations from Swarm-A and Swarm-C, along with orbital positions from 0301 UT to 0333 UT on 20 April at 85°E longitude, are depicted in Figure 10a,b. Severe electron density fluctuations were observed over the conjugate locations in the EIA region of both hemispheres, indicating plasma depletions. Interestingly, these density fluctuations were more prominent in the Southern Hemisphere compared to the Northern Hemisphere. These variations further confirmed the formation of EPBs around the sunrise period, and their persistence was observed even three hours after sunrise.
Additionally, the electron density variations derived from Swarm-A and Swarm-C at 110°E longitude from 0127 UT to 0159 UT on April 20 are shown in Figure 10c. In this longitude region, the electron density fluctuations were minimal in the Southern Hemisphere, and no noticeable fluctuations were observed in the Northern Hemisphere. These minimal fluctuations corroborated with the low ROTI values recorded at the JOG2 station, located in the 110°E longitude region. The electron density profiles also supported the findings of no EPB occurrence in the regions beyond 110°E longitude, as indicated by the ROTI maps in Figure 8.

4. Discussion

Geomagnetic storms, triggered by intense solar wind–magnetosphere interactions lead to large-scale ionospheric disturbances, particularly in the equatorial and low-latitude regions. During the main phase of geomagnetic storms, eastward penetrating electric fields in under-shielding conditions lead to the occurrence of EPBs in the post-sunset period [39,40,41]. However, in this study, the main phase of the geomagnetic storm, which coincided with the local dusk time on 19 April, did not show any significant plasma enhancement across the entire study region of India and Southeast Asia. This indicated that the conventional electric fields did not affect the dip equatorial and low-latitude ionosphere during the main phase of the storm under southward-oriented IMF Bz. During the recovery phase of the storm, which started around 1920 UT on 19 April, the formation of near-sunrise EPBs and associated plasma fluctuations was noticed in the GISTM receiver-derived S4 index, GPS-derived ROTI, Digisonde observations of foF2 and h’F, and Swarm-A and Swarm-C electron density profiles over the Indian and Southeast Asian longitudinal regions.
ROTI values calculated from the GPS observations in various longitude regions provided valuable insights into the temporal and spatial behavior of plasma structures and the occurrence of EPBs during the sunrise hours. ROTI values showed that EPBs predominantly occurred in the near-sunrise to post-sunrise period from 2200 UT to 0400 UT in the 70–90°E longitude region, and from 2200 UT to 0300 UT in the 100–110°E longitude region. Beyond the 110°E longitude region, plasma fluctuations were not observed. The EPBs were formed initially in the 100–110°E longitude region and drifted toward the Indian longitude region, along with the sunrise terminator. Also, the intensity of EPBs was maximum at southern latitudes compared to northern latitudes. These results were further confirmed by the additional data from Swarm satellite-derived electric fields and Digisonde observations of foF2 and h′F. The h′F at Cocos Island increased abruptly to more than 350 km, which is high compared to that from the quiet time level with a maximum of ~280 km (Figure 9).
In previous studies, Zakharenkova et al. [28] noted the existence of EPBs in the dawn period due to enhanced vertical plasma drift during the 18–19 February 2014 geomagnetic storm due to the DDEFs over the Pacific region. Similarly, Luo et al. [30] observed that DDEFs generated near-sunrise EPBs during the recovery phase of the intense geomagnetic storm of 17–20 August 2003 across the 140°–160°E longitude region based on multi-instrument observations. Carmo et al. [32] also reported similar observations of pre- and post-sunrise EPBs over the Brazilian region, caused by storm-time winds and DDEFs during the recovery phase of the 18 February 2015 moderate geomagnetic storm. The above studies highlight the occurrence of near-sunrise EPBs during the storm recovery phase due to the presence of DDEFs. However, a few studies have also reported the occurrence of near-sunrise EPBs during storms’ main phase. Huang et al. [33] studied the unique sunrise EPBs triggered during the main phase of the storm due to electric field changes during the severe geomagnetic storm in October 2016 over the Southeast Asian region. A similar study by Sripathi et al. [42] reported the existence of EPBs in the dawn sector during the 4–5 February 2011 geomagnetic storm’s main phase, due to the PPEFs over the Indian longitude sector.
To explore the potential mechanisms driving the occurrence of near-sunrise EPBs during the 19–20 April 2024 geomagnetic storm, PPEEFM model-derived electric fields at 80°E and 100°E longitudes were used in the analysis (Figure 11). These results showed that electric fields penetrated the equatorial region following the storm recovery phase (highlighted by the magenta circle in Figure 11), which coincided with the local midnight to pre-sunrise period. These electric fields significantly modified the local ionospheric conditions in the equatorial region, raising the F layer to higher altitudes compared to the quiet periods, which was also observed in the h’F of Figure 9. This elevated F layer initiated the onset of R-T instability, thereby creating favorable conditions for the formation of EPBs around the dawn sector. These observations supported the role of overshielding electric fields, which were linked to the abrupt northward shifts in the IMF Bz during the recovery phase, as shown in Figure 2, and were responsible for the occurrence of near-sunrise EPBs. These results are consistent with previous reports by Tulasi Ram et al. [27], where they observed EPBs close to sunrise during the moderate geomagnetic storm, caused by a sudden northward shift in the IMF Bz and associated overshielding PPEFs over the Indonesian region. In other studies, Fejer et al. [43] and Rastogi and Patel [44] also reported overshielding PPEFs generating near-sunrise EPBs. The occurrence of near-sunrise EPBs associated with overshielding PPEFs during the recovery phase of the moderate geomagnetic storm is a unique feature, and only few studies have reported this earlier, which highlights the importance of this research. Also, these EPBs persisted for more than three hours from the sunrise terminator in all the longitude regions. Moreover, storm-time electric fields in the dip equatorial region suppressed the formation of dusk-time EPBs during the recovery period of the storm on 20 April in the 70–90°E longitude region, as observed in Figure 4 and Figure 5. Previous studies by Abdu [45], Nayak et al. [18], and Rajana et al. [19] also reported the suppression of post-sunset EPBs during the geomagnetic storm recovery phase due to the presence of DDEFs.

5. Conclusions

The formation of EPBs during the moderate geomagnetic storm that occurred during 19–20 April 2024 in the Indian and Southeast Asian regions was studied using multi-instrument observations. The key findings were as follows:
i.
Despite the significant southward turning of IMF Bz (Dst minimum: −117 nT) during the main phase of the above-mentioned storm event, there were hardly any significant disturbances in the electric fields observed during the local post-sunset to midnight sector over the whole 70–110°E longitude region.
ii.
The formation of EPBs during the near-sunrise period was mainly linked to the northward shift in IMF Bz associated with the rapid penetration of overshielding electric fields during the storm recovery phase.
iii.
EPBs were more intense at the geomagnetic southern latitudes compared to the northern latitudes in the 90–110°E longitude region. Additionally, the EPBs that initially developed in the Southeast Asian region drifted toward the Indian longitude region, along with the sunrise terminator.
iv.
Further, these near-sunrise EPBs persisted for more than three hours after the sunrise terminator.
v.
Additionally, altering electric fields in the dip equatorial region suppressed the formation of dusk-time EPBs during the storm recovery period across the 70–90°E longitude region.
Moreover, this study explored the potential development of near-sunrise EPBs and their connection to ionospheric dynamics during moderate geomagnetic storms and their effects on radio wave propagation.

Author Contributions

Conceptualization, S.K.P. and S.S.K.R.; methodology, S.K.P.; software, S.K.P., J.R.K.K.D. and S.S.K.R.; validation, S.K.P., J.R.K.K.D., P.J. and S.S.K.R.; formal analysis, S.K.P., S.S.K.R., C.G.V., J.R.K.K.D. and W.J.; investigation, S.K.P., S.S.K.R., C.G.V., J.R.K.K.D., P.J. and W.J.; data curation, S.K.P., S.S.K.R., C.G.V. and W.J.; writing—original draft preparation, S.K.P. and S.S.K.R.; writing—review and editing, S.K.P., S.S.K.R., C.G.V., J.R.K.K.D., P.J. and W.J.; visualization, S.K.P., J.R.K.K.D., P.J. and S.S.K.R.; supervision, S.K.P.; project administration, S.K.P.; funding acquisition, S.K.P., C.G.V. and P.J. All authors have read and agreed to the published version of the manuscript.

Funding

Chiranjeevi G Vivek acknowledges the support provided from the CSIR-4PI Project (Grant Number: OLP-0005). Sampad Kumar Panda acknowledges the Science and Engineering Research Board (SERB) for the financial support under the Core Research Grant scheme (Grant Number: CRG/2019/003394). Punyawi Jamjareegulgarn acknowledges the financial support for this research from the Fundamental Fund (FF68) of the Thailand Science Research and Innovation Fund (Grant Number: RE-KRIS/FF68/84).

Data Availability Statement

The IGS GNSS and UNAVCO GNSS data used in this study were downloaded from the Crustal Dynamics Data Information System (CDDIS) archive (https://cddis.nasa.gov/archive/gnss/, accessed on 6 January 2025) and the GAGE archive (https://www.unavco.org/data/gps-gnss/gps-gnss.html, accessed on 6 January 2025). Yuma almanac data used for extracting TEC were downloaded from the United States Coast Guard Navigation Center website (https://www.navcen.uscg.gov/, accessed on 6 January 2025). Interplanetary and geomagnetic parameters were downloaded from the NASA-OMNI website (https://omniweb.gsfc.nasa.gov/, accessed on 6 January 2025). Swarm electron density data were obtained from the European Space Agency (ESA) VIRES web platform (https://vires.services/, accessed on 23 January 2025). The GNSS data from Kodaikanal, Lumami, were provided by the CSIR-Fourth Paradigm Institute (CSIR-4PI), Nagaland University respectively. GISTM data from Vaddeswaram, Guntur, were provided by the Koneru Lakshmaiah Education Foundation (KLEF). ROTI maps from the Indonesian region were downloaded from the Gatotkaca website (https://gatotkaca.brin.go.id/petaionosfer/, accessed on 23 January 2025). Digisonde data from Cocos Island were obtained from the GIRO website (https://giro.uml.edu/, accessed on 23 January 2025). The real-time eastward equatorial electric field data were obtained from the prompt penetration equatorial electric field model (PPEFM; https://geomag.colorado.edu/online-calculators/real-time-model-ionospheric-electric-fields, accessed on 23 January 2025).

Acknowledgments

The authors thank the Director of CSIR-4PI for supporting the GNSS program. The authors also appreciate Nagaland University for maintaining the Lumami GNSS station.

Conflicts of Interest

The authors declare no conflicts of interest.

References

  1. Woodman, R.F.; La Hoz, C. Radar observations of F region equatorial irregularities. J. Geophys. Res. 1976, 81, 5447–5466. [Google Scholar] [CrossRef]
  2. Kelley, M.C. The Earth’s Ionosphere: Plasma Physics and Electrodynamics; Academic Press: Cambridge, UK, 2009. [Google Scholar]
  3. Abdu, M.A. Outstanding problems in the equatorial ionosphere–thermosphere electrodynamics relevant to spread F. J. Atmos. Sol. Terr. Phys. 2012, 63, 869–884. [Google Scholar] [CrossRef]
  4. Bhattacharyya, A. Equatorial Plasma Bubbles: A Review. Atmosphere 2022, 13, 1637. [Google Scholar] [CrossRef]
  5. Patil, A.S.; Nade, D.P.; Taori, A.; Pawar, R.P.; Pawar, S.M.; Nikte, S.S.; Pawar, S.D. A Brief Review of Equatorial Plasma Bubbles. Space Sci. Rev. 2023, 219, 16. [Google Scholar] [CrossRef]
  6. Kil, H. The Morphology of Equatorial Plasma Bubbles—A Review. J. Astron. Space Sci. 2015, 32, 13–19. [Google Scholar] [CrossRef]
  7. Huang, C.Y.; Burke, W.J.; Machuzak, J.S.; Gentile, L.C.; Sultan, P.J. Equatorial Plasma Bubbles Observed by DMSP Satellites during a Full Solar Cycle: Toward a Global Climatology. J. Geophys. Res. Space Phys. 2002, 107, SIA 7-1–SIA 7-10. [Google Scholar] [CrossRef]
  8. Kotulak, K.; Zakharenkova, I.; Krankowski, A.; Cherniak, I.; Wang, N.; Fron, A. Climatology Characteristics of Ionospheric Irregularities Described with GNSS ROTI. Remote Sens. 2020, 12, 2634. [Google Scholar] [CrossRef]
  9. Vital, L.F.R.; Takahashi, H.; Barros, D.; Carmo, S.C.; Carrasco, A.J.; Wrasse, C.M.; Figueiredo, C.A.O.B. Seasonal and Solar Cycle Dependency of Relationship Between Equatorial Plasma Bubbles and Rayleigh-Taylor Instability Growth Rate. Space Weather 2024, 22, e2024SW003959. [Google Scholar] [CrossRef]
  10. Rajana, S.S.K.; Panda, S.K.; Jade, S.; Vivek, C.G. Morphology of Equatorial F-Region Irregularities over the Indian Longitude Sector Using GPS-Derived ROTI Observations. Adv. Space Res. 2024, 74, 3361–3377. [Google Scholar] [CrossRef]
  11. Fejer, B.G.; Scherliess, L.; de Paula, E.R. Effects of the Vertical Plasma Drift Velocity on the Generation and Evolution of Equatorial Spread F. J. Geophys. Res. Space Phys. 1999, 104, 19859–19869. [Google Scholar] [CrossRef]
  12. Gentile, L.C.; Burke, W.J.; Roddy, P.A.; Retterer, J.M.; Tsunoda, R.T. Climatology of Plasma Density Depletions Observed by DMSP in the Dawn Sector. J. Geophys. Res. Space Phys. 2011, 116, A03321. [Google Scholar] [CrossRef]
  13. Huang, C.S. Occurrence of Equatorial Plasma Bubbles during Intense Magnetic Storms. Int. J. Geophys. 2011, 2011, 401858. [Google Scholar] [CrossRef]
  14. Cherniak, I.; Zakharenkova, I.; Sokolovsky, S. Multi-Instrumental Observation of Storm-Induced Ionospheric Plasma Bubbles at Equatorial and Middle Latitudes. J. Geophys. Res. Space Phys. 2019, 124, 1491–1508. [Google Scholar] [CrossRef]
  15. Abdu, M.A.; Kherani, E.A.; Batista, I.S.; Sobral, J.H.A. Equatorial Evening Prereversal Vertical Drift and Spread F Suppression by Disturbance Penetration Electric Fields. Geophys. Res. Lett. 2009, 36, L19103. [Google Scholar] [CrossRef]
  16. Wan, X.; Xiong, C.; Wang, H.; Zhang, K.; Zheng, Z.; He, Y.; Yu, L. A Statistical Study on the Climatology of the Equatorial Plasma Depletions Occurrence at Topside Ionosphere During Geomagnetic Disturbed Periods. J. Geophys. Res. Space Phys. 2019, 124, 8023–8038. [Google Scholar] [CrossRef]
  17. Jimoh, O.; Lei, J.; Huang, F.; Zhong, J. The Study of Topside Ionospheric Irregularities during Geomagnetic Storms in 2015. J. Space Weather Space Clim. 2022, 12, 32. [Google Scholar] [CrossRef]
  18. Nayak, C.; Tsai, L.C.; Su, S.Y.; Galkin, I.A.; Caton, R.G.; Groves, K.M. Suppression of Ionospheric Scintillation during St. Patrick’s Day Geomagnetic Super Storm as Observed over the Anomaly Crest Region Station Pingtung, Taiwan: A Case Study. Adv. Space Res. 2017, 60, 396–405. [Google Scholar] [CrossRef]
  19. Rajana, S.S.K.; Panda, S.K.; Jade, S.; Vivek, C.G.; Upadhayaya, A.K.; Bhardwaj, A.; Jorphail, S.; Seemala, G.K. Impact of Two Severe Geomagnetic Storms on the Ionosphere over Indian Longitude Sector during March-April 2023. Astrophys. Space Sci. 2024, 369, 3. [Google Scholar] [CrossRef]
  20. Abdu, M.A.; Sorral, J.H.A.; Nelson, R.; Bat, I.S. Solar Cycle Related Range Type Spread-F Occurrence Characteristics over Equatorial and Low Latitude Stations in Brazil. J. Atmos. Sol. Terr. Phys. 1985, 47, 901–905. [Google Scholar] [CrossRef]
  21. Burke, W.J.; Gentile, L.C.; Huang, C.Y.; Valladares, C.E.; Su, S.Y. Longitudinal Variability of Equatorial Plasma Bubbles Observed by DMSP and ROCSAT-1. J. Geophys. Res. Space Phys. 2004, 109, A12301. [Google Scholar] [CrossRef]
  22. Carter, B.A.; Yizengaw, E.; Pradipta, R.; Retterer, J.M.; Groves, K.; Valladares, C.; Caton, R.; Bridgwood, C.; Norman, R.; Zhang, K. Global Equatorial Plasma Bubble Occurrence during the 2015 St. Patrick’s Day Storm. J. Geophys. Res. Space Phys. 2016, 121, 894–905. [Google Scholar] [CrossRef]
  23. Tulasi Ram, S.; Yokoyama, T.; Otsuka, Y.; Shiokawa, K.; Sripathi, S.; Veenadhari, B.; Heelis, R.; Ajith, K.K.; Gowtam, V.S.; Gurubaran, S.; et al. Duskside Enhancement of Equatorial Zonal Electric Field Response to Convection Electric Fields during the St. Patrick’s Day Storm on 17 March 2015. J. Geophys. Res. Space Phys. 2016, 121, 538–548. [Google Scholar] [CrossRef]
  24. Venkatesh, K.; Tulasi Ram, S.; Fagundes, P.R.; Seemala, G.K.; Batista, I.S. Electrodynamic Disturbances in the Brazilian Equatorial and Low-Latitude Ionosphere on St. Patrick’s Day Storm of 17 March 2015. J. Geophys. Res. Space Phys. 2017, 122, 4553–4570. [Google Scholar] [CrossRef]
  25. Vankadara, R.K.; Panda, S.K.; Amory-Mazaudier, C.; Fleury, R.; Devananboyina, V.R.; Pant, T.K.; Jamjareegulgarn, P.; Haq, M.A.; Okoh, D.; Seemala, G.K. Signatures of Equatorial Plasma Bubbles and Ionospheric Scintillations from Magnetometer and GNSS Observations in the Indian Longitudes during the Space Weather Events of Early September 2017. Remote Sens. 2022, 14, 652. [Google Scholar] [CrossRef]
  26. Dugassa, T.; Habarulema, J.B.; Nigussie, M. Longitudinal Variability of Occurrence of Ionospheric Irregularities over the American, African and Indian Regions during Geomagnetic Storms. Adv. Space Res. 2019, 63, 2609–2622. [Google Scholar] [CrossRef]
  27. Tulasi Ram, S.; Ajith, K.K.; Yamamoto, M.; Otsuka, Y.; Yokoyama, T.; Niranjan, K.; Gurubaran, S. Fresh and Evolutionary-Type Field-Aligned Irregularities Generated near Sunrise Terminator Due to Overshielding Electric Fields. J. Geophys. Res. Space Phys. 2015, 120, 5922–5930. [Google Scholar] [CrossRef]
  28. Zakharenkova, I.; Astafyeva, E.; Cherniak, I. Early Morning Irregularities Detected with Spaceborne GPS Measurements in the Topside Ionosphere: A Multisatellite Case Study. J. Geophys. Res. Space Phys. 2015, 120, 8817–8834. [Google Scholar] [CrossRef]
  29. Wu, K.; Xu, J.; Yue, X.; Xiong, C.; Wang, W.; Yuan, W.; Wang, C.; Zhu, Y.; Luo, J. Equatorial Plasma Bubbles Developing around Sunrise Observed by an All-Sky Imager and Global Navigation Satellite System Network during Storm Time. Ann. Geophys. 2020, 38, 163–177. [Google Scholar] [CrossRef]
  30. Luo, W.; Xiong, C.; Xu, J.; Zhu, Z.; Chang, S. The Low-Latitude Plasma Irregularities after Sunrise from Multiple Observations in Both Hemispheres during the Recovery Phase of a Storm. Remote Sens. 2020, 12, 2897. [Google Scholar] [CrossRef]
  31. Sun, W.; Li, G.; Lei, J.; Zhao, B.; Hu, L.; Zhao, X.; Li, Y.; Xie, H.; Li, Y.; Ning, B.; et al. Ionospheric Super Bubbles Near Sunset and Sunrise During the 26–28 February 2023 Geomagnetic Storm. J. Geophys. Res. Space Phys. 2023, 128, e2023JA031864. [Google Scholar] [CrossRef]
  32. Carmo, C.; Denardini, C.; Figueiredo, C.; Resende, L.; Moro, J.; Silva, R.; Nogueira, P.; Chen, S.; Picanço, G.; Neto, P.B. Findings of the unusual plasma bubble occurrences at dawn during the recovery phase of a moderate geomagnetic storm over the Brazilian sector. J. Atmos. Sol. Terr. Phys. 2022, 235, 105908. [Google Scholar] [CrossRef]
  33. Huang, F.Q.; Lei, J.H.; Xiong, C.; Zhong, J.H.; Li, G.Z. Observations of Equatorial Plasma Bubbles during the Geomagnetic Storm of October 2016. Earth Planet. Phys. 2021, 5, 416–426. [Google Scholar] [CrossRef]
  34. Pi, X.; Mannucci, A.J.; Lindqwister, U.J.; Ho, C.M. Monitoring of Global Ionospheric Irregularities Using the Worldwide GPS Network. Geophys. Res. Lett. 1997, 24, 2283–2286. [Google Scholar] [CrossRef]
  35. Basu, S.; Groves, K.M.; Quinn, J.M.; Doherty, P. A Comparison of TEC fluctuations and Scintillations at Ascension Island. J. Atmos. Sol. Terr. Phys. 1999, 61, 1219–1226. [Google Scholar] [CrossRef]
  36. Nguyen Thanh, D.; Le Huy, M.; Amory-Mazaudier, C.; Fleury, R.; Saito, S.; Nguyen Chien, T.; Pham Thi Thu, H.; Le Truong, T.; Nguyen Thi, M. Characterization of Ionospheric Irregularities over Vietnam and Adjacent Region for the 2008–2018 Period Characterization of Ionospheric Irregularities over Vietnam and Adjacent Region for the Characterization of Ionospheric Irregularities over Vietnam and Adjacent Region for the 2008-2018 Period. Vietnam J. Earth Sci. 2008, 43, 465–484. [Google Scholar] [CrossRef]
  37. Wessel, P.; Luis, J.F.; Uieda, L.; Scharroo, R.; Wobbe, F.; Smith, W.H.F.; Tian, D. The Generic Mapping Tools Version 6. Geochem. Geophys. Geosystems 2019, 20, 5556–5564. [Google Scholar] [CrossRef]
  38. Abadi, P.; Muafiry, I.N.; Pratama, T.N.; Putra, A.Y.; Suraina. Database of Ionospheric Rate of TEC Change Index (ROTI) Map Derived from Indonesian GNSS Receiver Network [Data set]. Zenodo 2024. [Google Scholar] [CrossRef]
  39. Nishida, A. Coherence of Geomagnetic DP 2 Fluctuations with Interplanetary Magnetic Variations. J. Geophys. Res. 1968, 73, 5549–5559. [Google Scholar] [CrossRef]
  40. Kikuchi, T.; Lühr, H.; Kitamura, T.; Saka, O.; Schlegel, K. Direct Penetration of the Polar Electric Field to the Equator during a DP 2 Event as Detected by the Auroral and Equatorial Magnetometer Chains and the EISCAT Radar. J. Geophys. Res. Space Phys. 1996, 101, 17161–17173. [Google Scholar] [CrossRef]
  41. Kelley, M.C.; Fejer, B.G.; Gonzales, C.A. An Explanation for Anomalous Equatorial Ionospheric Electric Fields Associated with a Northward Turning of the Interplanetary Magnetic Field. Geophys. Res. Lett. 1979, 6, 301–304. [Google Scholar] [CrossRef]
  42. Sripathi, S.; Abdu, M.A.; Patra, A.K.; Ghodpage, R.N. Unusual Generation of Localized EPB in the Dawn Sector Triggered by a Moderate Geomagnetic Storm. J. Geophys. Res. Space Phys. 2018, 123, 9697–9710. [Google Scholar] [CrossRef]
  43. Fejer, B.G.; Gonzales, C.A.; Farley, D.T.; Kelley, M.C.; Woodman, R.F. Equatorial electric fields during magnetically disturbed conditions 1. The effect of the interplanetary magnetic field. J. Geophys. Res. 1979, 84, 5797–5802. [Google Scholar] [CrossRef]
  44. Rastogi, R.G.; Patel, V.L. Effect of interplanetary magnetic field on ionosphere over the magnetic equator. Proc. Indian Acad. Sci. 1975, 82, 121–141. [Google Scholar] [CrossRef]
  45. Abdu, M.A. Equatorial Spread F/Plasma Bubble Irregularities under Storm Time Disturbance Electric Fields. J. Atmos. Sol. Terr. Phys. 2012, 75–76, 44–56. [Google Scholar] [CrossRef]
Figure 1. The geographic locations of GISTM, GNSS, and Digisonde stations used for analysis in this study.
Remotesensing 17 01100 g001
Figure 2. Geomagnetic and interplanetary parameters from 18 to 21 April 2024. The vertical red line in each panel indicates the time of storm sudden commencement (SSC).
Remotesensing 17 01100 g002
Figure 3. GISTM receiver-derived S4 from the low-latitude station KLEF at Vijayawada from 18 to 21 April 2024. Each color indicates the unique satellite PRN number.
Remotesensing 17 01100 g003
Figure 4. GPS-derived ROTI from the southern EIA region station to the northern pole-ward edge EIA region station (bottom to top) from 18 to 21 April 2024 in the 70–80°E longitude region. Each color indicates the unique satellite PRN number.
Remotesensing 17 01100 g004
Figure 5. GPS-derived ROTI from the northern EIA region station to the pole-ward edge EIA region station (bottom to top) from 18 to 21 April 2024 in the 90°E longitude region. Each color indicates the unique satellite PRN number.
Remotesensing 17 01100 g005
Figure 6. GPS-derived ROTI from the northern low-latitude region station to the EIA region station (bottom to top) from 18 to 21 April 2024 in the 100–110°E longitude region. Each color indicates the unique satellite PRN number.
Remotesensing 17 01100 g006
Figure 7. GPS-derived ROTI from the southern pole-ward edge EIA region station to the low-latitude region station (bottom to top) from 18 to 21 April 2024 in the 100–110°E longitude region. Each color indicates the unique satellite PRN number.
Remotesensing 17 01100 g007
Figure 8. GPS-derived ROTI maps from the Indonesian regional network from 2200 UT to 2350 UT on 19 April. The color bars on the right hand side of the figures indicate the range of ROTI values.
Remotesensing 17 01100 g008
Figure 9. Digisonde-derived foF2 and h’F at the Cocos Island location from 18 to 21 April 2024 along with the quiet-days average of April 2024.
Remotesensing 17 01100 g009
Figure 10. Swarm-A and Swarm-C satellite-derived electron density profiles at 85°E and 110°E longitudes on 20 April.
Remotesensing 17 01100 g010
Figure 11. PPEEFM-derived eastward electric field from 18 to 21 April 2024 at 85°E and 110°E longitudes. The pink circle in the figure indicate the existence of penetrating electric field.
Remotesensing 17 01100 g011
Table 1. Geographic and geomagnetic coordinates of GISTM, GNSS receiver, and Digisonde locations considered in this study.
Station CodeGeographic Latitude (°N)Geographic Longitude (°E)Geomagnetic Latitude (°N)Geomagnetic
Longitude (°E)
Observation Type
DGAR7.2772.37−14.77144.07GNSS
SGOC6.8979.87−1.38152.73GNSS
KODI10.2377.462.11150.70GNSS
IISC13.0277.574.86150.94GNSS
KLEF16.4480.628.03154.25GISTM
HYDE17.4278.559.15152.24GNSS
IITK26.5280.2318.06154.65GNSS
HRNP21.8289.4612.85163.06GNSS
JRSN22.2589.3513.29162.98GNSS
KHL222.8089.5313.83163.19GNSS
SHLG25.6791.9116.58165.57GNSS
LUMA26.2294.4817.03168.01GNSS
COCO−12.1896.83−21.20169.07GNSS
CS31K−12.1896.83−21.20169.07Digisonde
XMIS−10.450105.69−19.64178.27GNSS
JOG2−7.76110.37−16.96−176.86GNSS
CIBG−6.49106.85−15.70179.58GNSS
NTUS1.35103.68−7.91171.74GNSS
CUSV13.74100.534.45173.36GNSS
TOAY16.07105.156.72177.88GNSS
NKAY17.72105.158.35178.24GNSS
CMUM18.7698.939.48171.92GNSS
BNEU21.64101.9212.29174.83GNSS
Disclaimer/Publisher’s Note: The statements, opinions and data contained in all publications are solely those of the individual author(s) and contributor(s) and not of MDPI and/or the editor(s). MDPI and/or the editor(s) disclaim responsibility for any injury to people or property resulting from any ideas, methods, instructions or products referred to in the content.

