Article

A Preliminary Assessment of the VIIRS Cloud Top and Base Height Environmental Data Record Reprocessing

1
School of Natural Resources, University of Missouri, Columbia, MO 65211, USA
2
Environmental Science and Technology Center, George Mason University, Fairfax, VA 22030, USA
3
Earth System Science Interdisciplinary Center, University of Maryland, College Park, MD 20740, USA
4
NOAA Center for Satellite Applications and Research, College Park, MD 20740, USA
*
Author to whom correspondence should be addressed.
Remote Sens. 2025, 17(6), 1036; https://doi.org/10.3390/rs17061036
Submission received: 31 December 2024 / Revised: 5 March 2025 / Accepted: 12 March 2025 / Published: 15 March 2025
(This article belongs to the Special Issue Satellite-Based Climate Change and Sustainability Studies)

Abstract

:
The Visible Infrared Imaging Radiometer Suite (VIIRS) onboard the Suomi National Polar-orbiting Partnership (SNPP) satellite has been continuously providing global environmental data records (EDRs) for more than one decade since its launch in 2011. Recently, the VIIRS EDRs of cloud features have been reprocessed using unified and consistent algorithm for selected periods to minimize or remove the inconsistencies due to different versions of retrieval algorithms as well as input VIIRS sensor data records (SDRs) adopted by different periods of operational EDRs. This study conducts the first simultaneous quality and accuracy assessment of reprocessed Cloud Top Height (CTH) and Cloud Base Height (CBH) products against both the operational VIIRS EDRs and corresponding cloud height measurements from the active sensors of NASA’s CloudSat-CALIPSO system. In general, the reprocessed CTH and CBH EDRs show strong similarities and correlations with CloudSat-CALIPSOs, with coefficients of determination ( R 2 ) reaching 0.82 and 0.77, respectively. Additionally, the reprocessed VIIRS cloud height products demonstrate significant improvements in retrieving high-altitude clouds and in sensitivity to cloud height dynamics. It outperforms the operational product in capturing very high CTHs exceeding 15 km and exhibits CBH probability patterns more closely aligned with CloudSat-CALIPSO measurements. This preliminary assessment enhances data applicability of remote sensing products for atmospheric and climate research, allowing for more accurate cloud measurements and advancing environmental monitoring efforts.

1. Introduction

Clouds are widely known for influencing the energy budget of the whole Earth system and further impact both the daily weather dynamics and long-term climate patterns [1,2]. Among all the cloud properties, cloud top and base height are essential to determine the thermal cloud radiative forcing [3]. For example, thicker clouds with lower height help block the incoming solar radiation from reaching the ground, while thinner high-level clouds can trap and prevent outgoing energy from escaping the Earth surface like greenhouse gases [4]. These cooling and warming effects of different altitudinal levels of clouds are one of the major uncertainties in climate and weather prediction models. Therefore, the accuracy and performance of both cloud base and top height datasets are critical for climate system modeling, analysis, and prediction. Due to the importance of cloud-height information, numerous retrieval methods of CTH and CBH have been developed and assessed over the past few decades using satellite observations [1,5]. For instance, Hamann et al. [6] validated ten CTH retrieval algorithms using observations of the Spinning Enhanced Visible and InfraRed Imager (SEVIRI) onboard the geostationary Meteosat Second Generation (MSG) platform. The ten retrieval methods are also compared with CTH data derived from Cloud-Aerosol Lidar and Infrared Pathfinder Satellite Observations (CALIPSO) Cloud-Aerosol Lidar with Orthogonal Polarization (CALIOP) and CloudSat Cloud Profiling Radar (CPR) observations. Their results showed that the SEVIRI algorithms tended to underestimate the CALIOP data by ~1–2.5 km with correlation coefficients (R) ranging from ~0.77–0.90. On the other hand, the difference between SEVIRI and CPR data are ~0.6–0.8 km with R values from 0.82 to 0.86. Estimation accuracies have improved with the evolution and development of hardware and sensors, computational resources, and AI technologies [7]. For example, Tan et al. [8] estimated CBH from a satellite-based passive imaging radiometer, the Advanced Himawari Imager (AHI), using a Random Forest (RF) model and evaluated the retrieval accuracy with ground-based Ka radar measurements. They illustrated that the satellite-derived CBH estimations perform best on non-precipitating single-layer clouds, with a mean difference of −0.2 ± 1.7 km. The results for multi-layer clouds mostly overestimated the CBHs observed by the ground radar, especially for low-altitude clouds overlapped by cirrus clouds
Among all the satellite-based cloud products, the Visible Infrared Imaging Radiometer Suite (VIIRS) onboard the Suomi National Polar-orbiting Partnership (SNPP) satellite has been continuously providing various global environmental data records (EDRs) of cloud properties as well as other environmental parameters, such as aerosol properties, Earth’s albedo, ocean and land surface temperature, ice, snow cover, fire, vegetation health, and volcanic ash [7,9,10,11], since its launch on 28 October 2011. Since SNPP-VIIRS has been providing EDRs for more than one decade, the retrieval algorithms of EDRs have been updated for several versions, from version 1.1 to version 3.2, over the mission time [12,13,14,15,16]. The performances of the operational VIIRS cloud height products have been assessed and validated thoroughly [17,18]. For example, Heidinger et al. [19] investigated the sensitivity of the operational CTH algorithm to cloud top properties in infrared observations from VIIRS and the Advanced Baseline Imager (ABI), using data from CALIPSO. They concluded that the channels utilized by the operational VIIRS algorithm offer a solution for retrieving optically thin cirrus above 200 hPa; Noh et al. [20] compared the initial [21] and a previous version of operational CBH EDR algorithm with cloud products provided by the CloudSat system. The initial CBH product yields an average root-mean-square error (RMSE) of 3.7 km for all kinds of clouds over the globe, and more than half of all VIIRS and CloudSat matchups have errors larger than the 2 km error requirement, whereas the operational CBH EDR improves the overall RMSE to 1.7 km.
Despite previous evaluation efforts of cloud heights products, further validation and quality assessment are still needed for newly developed or updated retrieval algorithms, especially their applications to the historical dataset. The latest CTH and CBH algorithm of VIIRS EDRs, version 3.2, have never been comprehensively assessed since they were operationally implemented in March and April of 2023, respectively. Additionally, the VIIRS CBH retrieval algorithm relies on the upstream CTH retrieval as a critical input. A comprehensive evaluation of both CTH and CBH is essential and urgent for the operation and provision of VIIRS EDR product users. Consequently, this study reprocesses the VIIRS CTH and CBH EDRs from August 2018 to July 2019 using the latest retrieval algorithms, which will be discussed separately in Section 2, and presents the first simultaneous assessment of the reprocessed SNPP VIIRS CTH and CBH products. The reprocessed cloud EDRs are compared with both operational data of the study period (Version 2.0) and cloud height measurements from the active sensors of NASA’s CloudSat mission, which is a combined product of CloudSat’s Cloud Profiling Radar (CPR) and CALIPSO’ s Lidar observations. The results will offer a scientific evaluation of the performance and reliability of the new retrieval algorithm.
On the other hand, the most essential inputs for deriving VIIRS EDRs are the VIIRS Level-1 Sensor Data Records (SDRs), which were developed in various stages of maturity during the operation period: the beta (April 2013), provisional level (October 2013), and validated (March 2014) maturity levels. The SNPP VIIRS SDRs since January 2012 have been reprocessed at NOAA/National Environmental Satellite, Data, and Information Service (NESDIS)/Center for Satellite Applications and Research (STAR) using the latest calibration algorithms [9,22], with major improvements, including the following: (1). The previous solar irradiance model from MODTRAN has been replaced with the model proposed by Thuillier et al. [23] for improving the simulation performance. (2). The decreasing artificial trend, abnormal spikes, and oscillations in the long-term time series caused by updating calibration parameters and algorithms frequently in the early stage of operational SDRs are effectively eliminated. (3). The ~1.5%–2% bias is also fixed in the reprocessed data [22]. To satisfy the protocol of VIIRS EDR reprocessing based on the new algorithm and ensure consistency between VIIRS historical data reprocessing and future EDR production, the study performs the reprocessing using this reprocessed SDR as input.
The remainder of this paper is structured as follows: Section 2 discusses the comparisons between operational and reprocessed VIIRS CTH and CBH algorithms. Section 3 presents the datasets used in the study. Section 4 introduces the collocation method between VIIRS data and CloudSat-CALIPSO system measurements, along with the quality control methods and evaluation metrics; the assessment results are covered in Section 5; and the discussions and conclusions are outlined in Section 6.

2. Retrieval Algorithm of VIIRS CTH and CBH EDR

2.1. VIIRS Cloud Top Height Retrieval

The operational VIIRS CTH retrieval algorithms of the study period [24] are merged from the operational cloud height algorithms of the Polar Orbiting Environmental Satellite (POES) and Geostationary Operational Environmental Satellites (GOES) imagers [25] operated by NESDIS due to more available cloud-property-related channels. The algorithm combines the C O 2 slicing method applied to 11 and 13.3 μm channels of GOES-NOP (GOES-N, O, P designated GOES-13, 14, 15 after launching, respectively) [26,27] and the split-window method based on the 11 and 12 μm channels of the POES AVHRR [5], which is referred to a C O 2 /Split-Window method. This method combines the sensitivity to cloud height provided by the C O 2 channel with the sensitivity to cloud microphysics offered by the window channels, enhancing the performance of cloud height products compared to those derived from current operational imagers [28].
The updated Version 3.2 retrieval algorithm of reprocessed VIIRS CTH EDR is based on a similar model as the operational Version 2.0 algorithm with several updates as follows [29]: (1). Incorporation of multiple channel combinations, including the following wavelengths: 3.75, 6.2, 6.7, 7.3, 8.5, 10.4, 11, 12, 13.3, 13.6, 13.9, and 14.2 µm; (2). Upgrading the microphysical index (β) fitting method from linear to a higher-order polynomial to better account for the multiple scattering effects in the 3.75 µm channel; (3). Adding ice fraction as a fifth output parameter in the optimal estimation algorithm; (4). Enhancing the application of the KD-tree technique and utilizing the NOAA Unique Combined Atmospheric Processing System Environmental Data Record (NUCAPS) data. (Table A1)

2.2. VIIRS Cloud Base Height Retrieval

The VIIRS CBH retrievals rely on its relationship with CTH and cloud geometric thickness (CGT), as shown in Equation (1) [20]:
CBH = CTH − CGT
The initial operational CBH retrieval algorithm is an interface data-processing segment (IDPS) model [30,31], which calculates the CGT by a ratio of the retrieved Cloud Water path (CWP, liquid, and ice) and the water content based on different cloud types, as shown in Equations (2) and (3) for water and ice cloud, respectively:
C G T l i q u i d = L W P L W C
C G T i c e = I W P I W C
where LWP and IWP represent liquid and ice water path, and LWC and IWC are liquid and ice water content, respectively. A detailed methodology can be found in the paper by Seaman et al. [21]. However, the cloud type is a distinctly defined category that is associated with a characteristic liquid or ice water content and introduces significant retrieval uncertainties. Considering the relatively poor validation outcomes, a statistical regression method was developed [29] to improve CBH retrievals by utilizing the direct CGT measurements and serves as the operational CBH retrieval method. In this algorithm, the CGT is derived based on a height-dependent linear regression model:
C G T = a × C W P + b
where a and b are two constants selected from the lookup table shown in Appendix A (Table A2). A detailed description of this method can be found in the research of Noh et al. [20]. The reprocessed EDR to be evaluated in this paper is produced following this method but with the reprocessed upstream CTH values introduced in Section 3.1.

3. Datasets

3.1. SNPP VIIRS Dataset

This study utilized the reprocessed SNPP VIIRS SDRs to generate CTH and CBH EDRs based on the up-to-date retrieval algorithms, Version 3.2. A study period of October 2018~June 2019 is used to validate algorithm performance. VIIRS is a whiskbroom radiometer which has 22 spectral bands with wavelength ranging from 0.41 μ m to 12.01 μ m and a nadir resolution of 750 m. The input SDR data for CTH retrieval includes recalibrated solar reflectance for 0.67, 0.87, 1.38, 1.61 μ m channels; recalibrated radiances for 3.75, 8.55, 10.76, and 12.01 μ m channels; recalibrated VIIRS DNB reflectance; as well as their recalibrated and reprocessed geolocation information. The CTH product uses all the previously mentioned SDR channels, while the CBH product only employs the 8.55, 10.76, and 12.01 μ m channels along with their geolocation data. The reprocessed VIIRS SDR dataset can be downloaded from the NOAA Comprehensive Large Array-data Stewardship System (CLASS).
In addition, the corresponding operational Version 2.0 VIIRS CTH and CBH data of the study period are obtained from the NOAA/CLASS repository to compare with the reprocessed products in this study. According to the data archive website, the operational VIIRS CBH are not available until 9 March 2019. Therefore, operational EDRs are not included in the comparison during this period.
Besides the VIIRS SDRs, CTH, and CBH EDRs, the SNPP VIIRS Cloud Optical Thickness (COT) retrievals over the same period with cloud height products are also used to conduct further quality control for minimizing the systematic difference between passive and active remote sensing sensors. A detailed quality control method is introduced in Section 4.1.

3.2. CloudSat-CPR and CALIPSO-Lidar Estimations

To further evaluate and visualize on the performance of VIIRS CTH and CBH algorithms for different cloud types, the cloud height measurements from the level 2B cloud class product, 2B-CLDCLASS-LIDAR, are utilized as the “truth” to assess VIIRS CTH and CBH retrieval accuracies. This product combines measurements from CPR onboard NASA’S CloudSat satellite and CALIPSO’s CALIOP Lidar, produced by the Data Processing Center (DPC) at Colorado State University (https://www.cloudsat.cira.colostate.edu/, Accessed Date: 1 October 2024). The CloudSat CPR is a 94 GHz (W-band) nadir-pointing cloud radar (0.16 ° forward), which has a field of view (FOV) of approximately 1.3 km across-track and 1.7 km along-track, with a 500 m vertical resolution, while CALIOP emits two laser pulses (532 nm and 1064 nm wavelengths) and a pulse repetition frequency (PRP) of 20.16 Hz. Its horizontal and vertical resolutions are 333 m and 30 m, respectively. The cloud measurements of this combined CloudSat-CALIPSO system take advantage of both active sensors to yield better results for different cloud types and phases. To be noticed, the 2B-CLDCLASS-LIDAR products are not available during 20 August~9 October 2018; thus, this period cannot be included in the assessment.

3.3. Ancillary Data

The VIIRS CTH and CBH retrievals also require ancillary data, including numerical weather prediction (NWP) Global Forecast System GRIB2 Forecast Files, daily Interactive Multi-sensor Snow and Ice Mapping System (IMS)/SSMI snow map, Canadian Meteorological Center (CMC) global SST analysis dataset with a resolution of 0.1 degrees, and VIIRS Surface Type.
The period of each type of data used in the study is summarized in Table A3.

4. Assessment Methodology

4.1. Quality Control

This study conducts a series of quality controls to mitigate the uncertainties caused by the systematic errors and mechanical differences between passive and active remote sensing:
(1)
Pixels with any out-of-range values and poor quality assigned by the quality flags for all the cloud properties are excluded from the comparison. These properties include VIIRS CTH, CBH and COT retrievals, and CloudSat-CALIPSO CTH and CBH measurements.
(2)
In contrast to active sensors such as CloudSat-Radar and CALIPSO-Lidar, which can capture the vertical structures and overlaps of cloud systems, VIIRS is less effective at measuring the properties of multi-layer clouds. Therefore, only single-layer clouds are included in the evaluation and comparison of CTH algorithms.
(3)
Since the quality of the upstream CTH product is critical for CBH retrieval, this paper follows the quality control strategy adopted by the VIIRS CBH algorithm development team in the CBH quality evaluation: only the cloudy pixels where the CTH differences between VIIRS and CloudSat-CALIPSO are smaller than 2 km when COT < 1 and smaller than 1 km when COT > 1 are included in CBH evaluations [20].
(4)
To avoid ground cluster contamination, pixels with CBH lower than 1000 m in both VIIRS and CloudSat-CALIPSO data are not considered in the assessment [32].
(5)
Since the VIIRS CBH retrieval algorithm is based on an estimation of the height of the base of the topmost cloud layer above mean sea level, the CBH of the topmost layer in the CloudSat-CALIPSO products will be used in the evaluation.

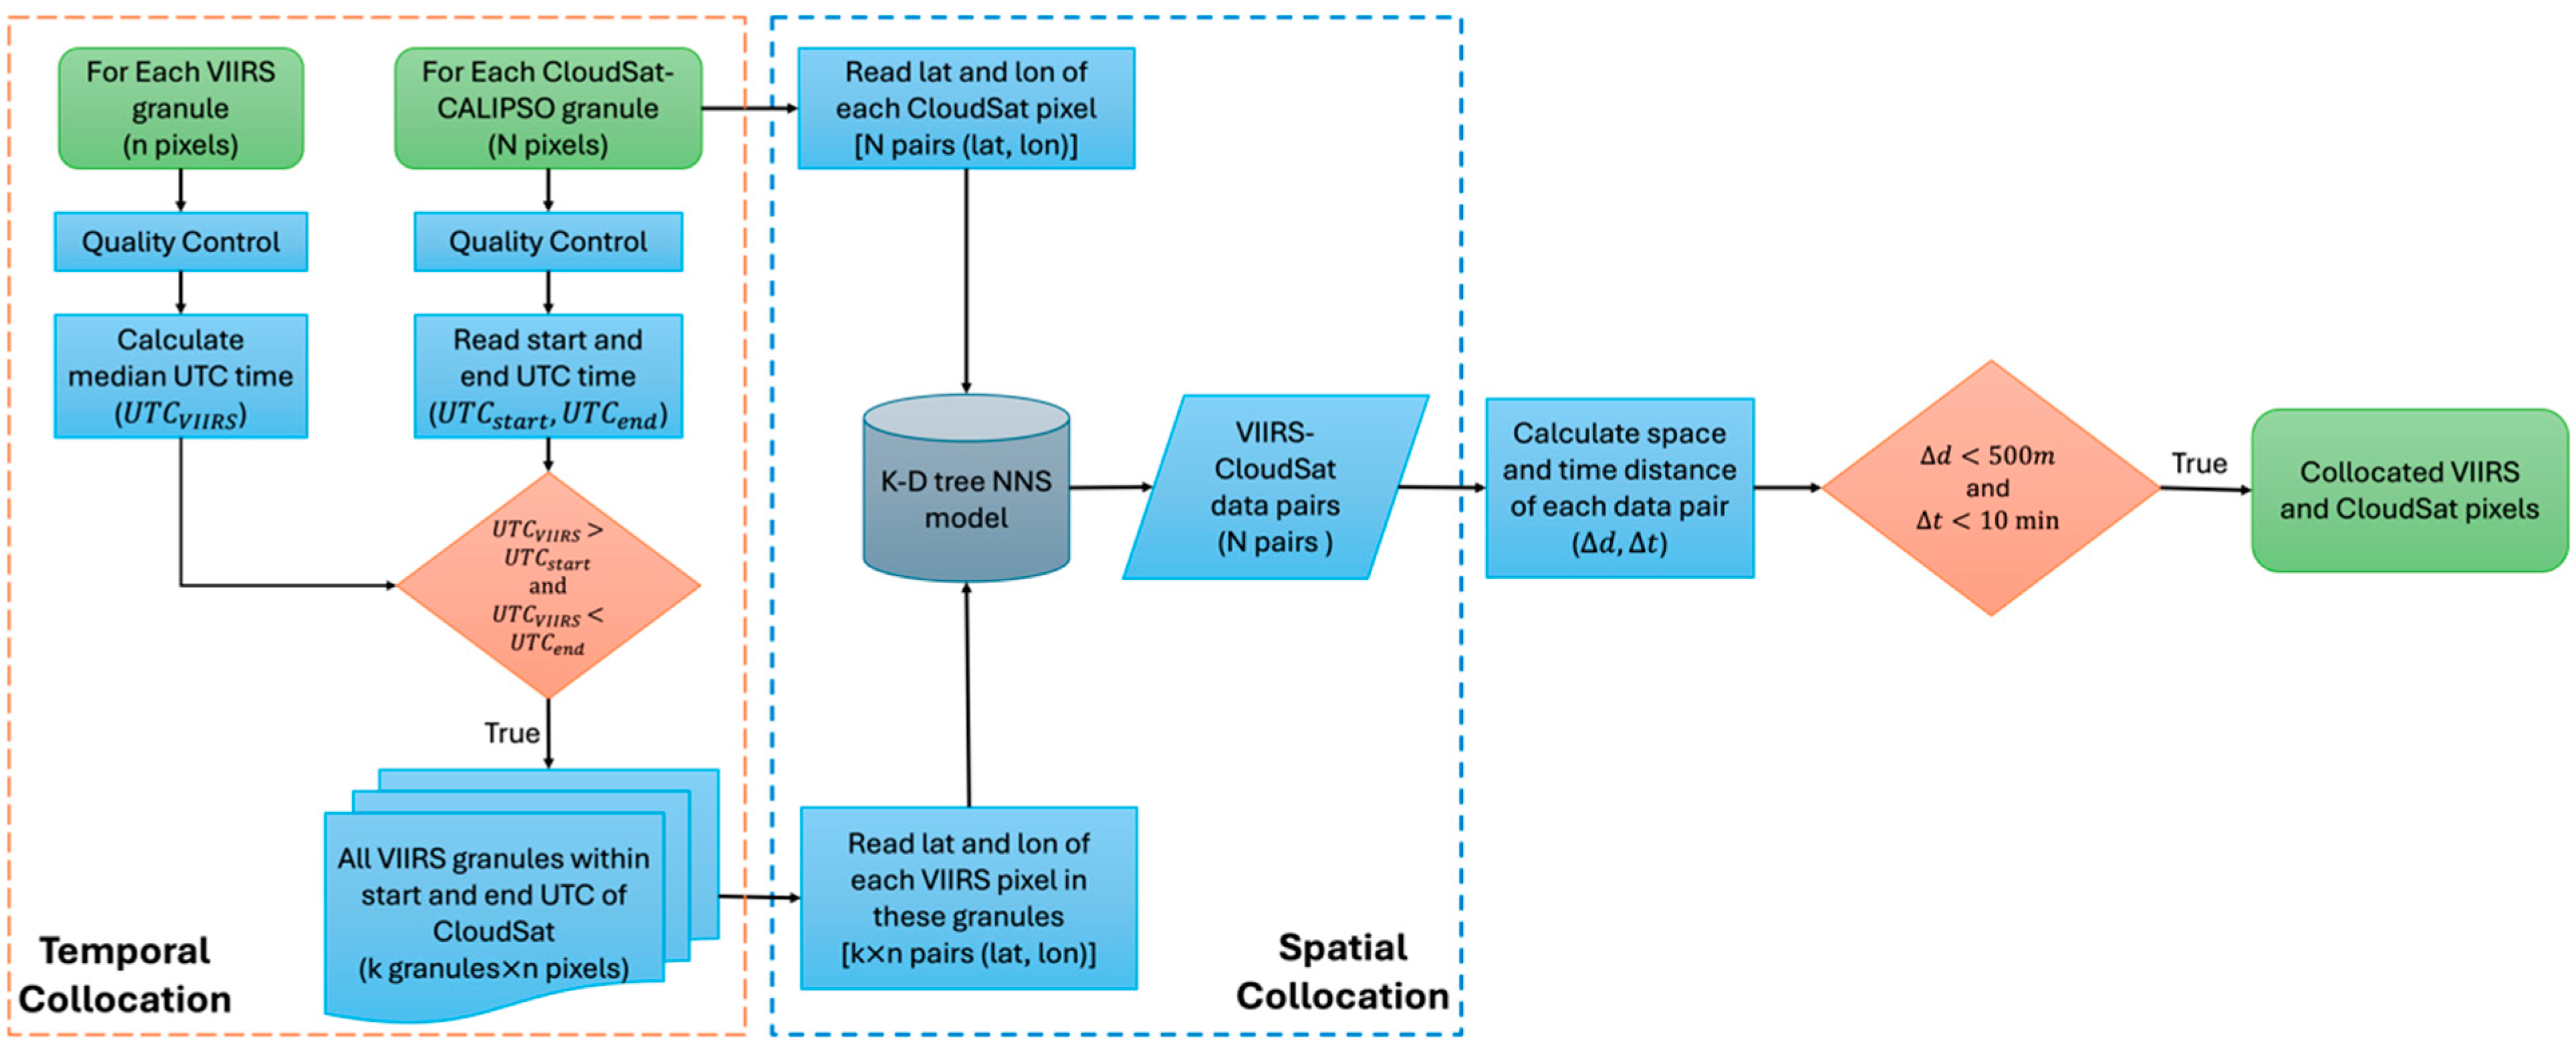
4.2. Spatiotemporal Collocation Between SNPP-VIIRS and CloudSat-CALIPSO Dataset

The key to conduct an accurate assessment for a data product is to build a correct relationship between the target VIIRS EDRs (CTH and CBH) and the “truth” (CloudSat-CALIPSO). The following five-step spatiotemporal collocation framework is used in this study:
(1)
For each CloudSat granule, retrieve the start and end time from the dataset.
(2)
Search for all the VIIRS granules that have a median scanning time within the starting and ending time frame of each respective CloudSat granule.
(3)
For each pixel in this Cloudsat granule, the collocation framework identifies a VIIRS pixel within the VIIRS-granule pool formed in the second step that has the nearest spatial distance with this CloudSat pixel using the nearest neighbor search (NNS) algorithm based on the K-Dimensional (K-D) Tree model [33,34]. This search algorithm identifies the pixel that is nearest to the given input point in a binary tree structure, considering the pixel longitude and latitude values.
(4)
Calculate the spatial and temporal difference between each VIIRS and CloudSat pixel pair based on their longitude and latitude information.
(5)
In the last step, a spatiotemporal filter is applied to every CloudSat-VIIRS pixel pair, and all the pairs with spatiotemporal distances exceeding a defined threshold are excluded from the comparison. In this study, the temporal and spatial thresholds are set to be 10 min and 500 m considering the pixel size of VIIRS (750 m) and typical movement speed of clouds (~800 m/min, [35]). Thus, both the thresholds are widely adopted in previous cloud height evaluations [36,37,38].
The collocation method is summarized in the flowchart shown in Figure 1. The temporal collocation is highlighted in the orange dash box, and the spatial collocation is highlighted in the blue dash box.

4.3. Evaluation Metrics

We evaluate the reprocessed EDRs using four metrics: coefficient of determination ( R 2 ), root mean squared error (RMSE), mean bias error (MBE), and percentage within 250 m of CloudSat-CALIPSO (Accurate%):
R 2 = 1 i = 1 N ( C l o u d S a t i V I I R S i ) 2 i = 1 N ( C l o u d S a t i C l o u d S a t ¯ ) 2
R M S E = 1 N i = 1 N ( V I I R S i C l o u d S a t i ) 2
M B E = 1 N i = 1 N ( V I I R S i C l o u d S a t i )
A c c u r a t e % = N V I I R S i C l o u d S a t i < 250   m N × 100 %
where N is the total number of valid matchups between the VIIRS retrievals and CloudSat measurements; C l o u d S a t ¯ is the mean of the CloudSat values; N V I I R S i C l o u d S a t i < 250   m is the number of valid pixels where the difference between VIIRS retrievals and CloudSat measurements are smaller than 250 m.

5. Results

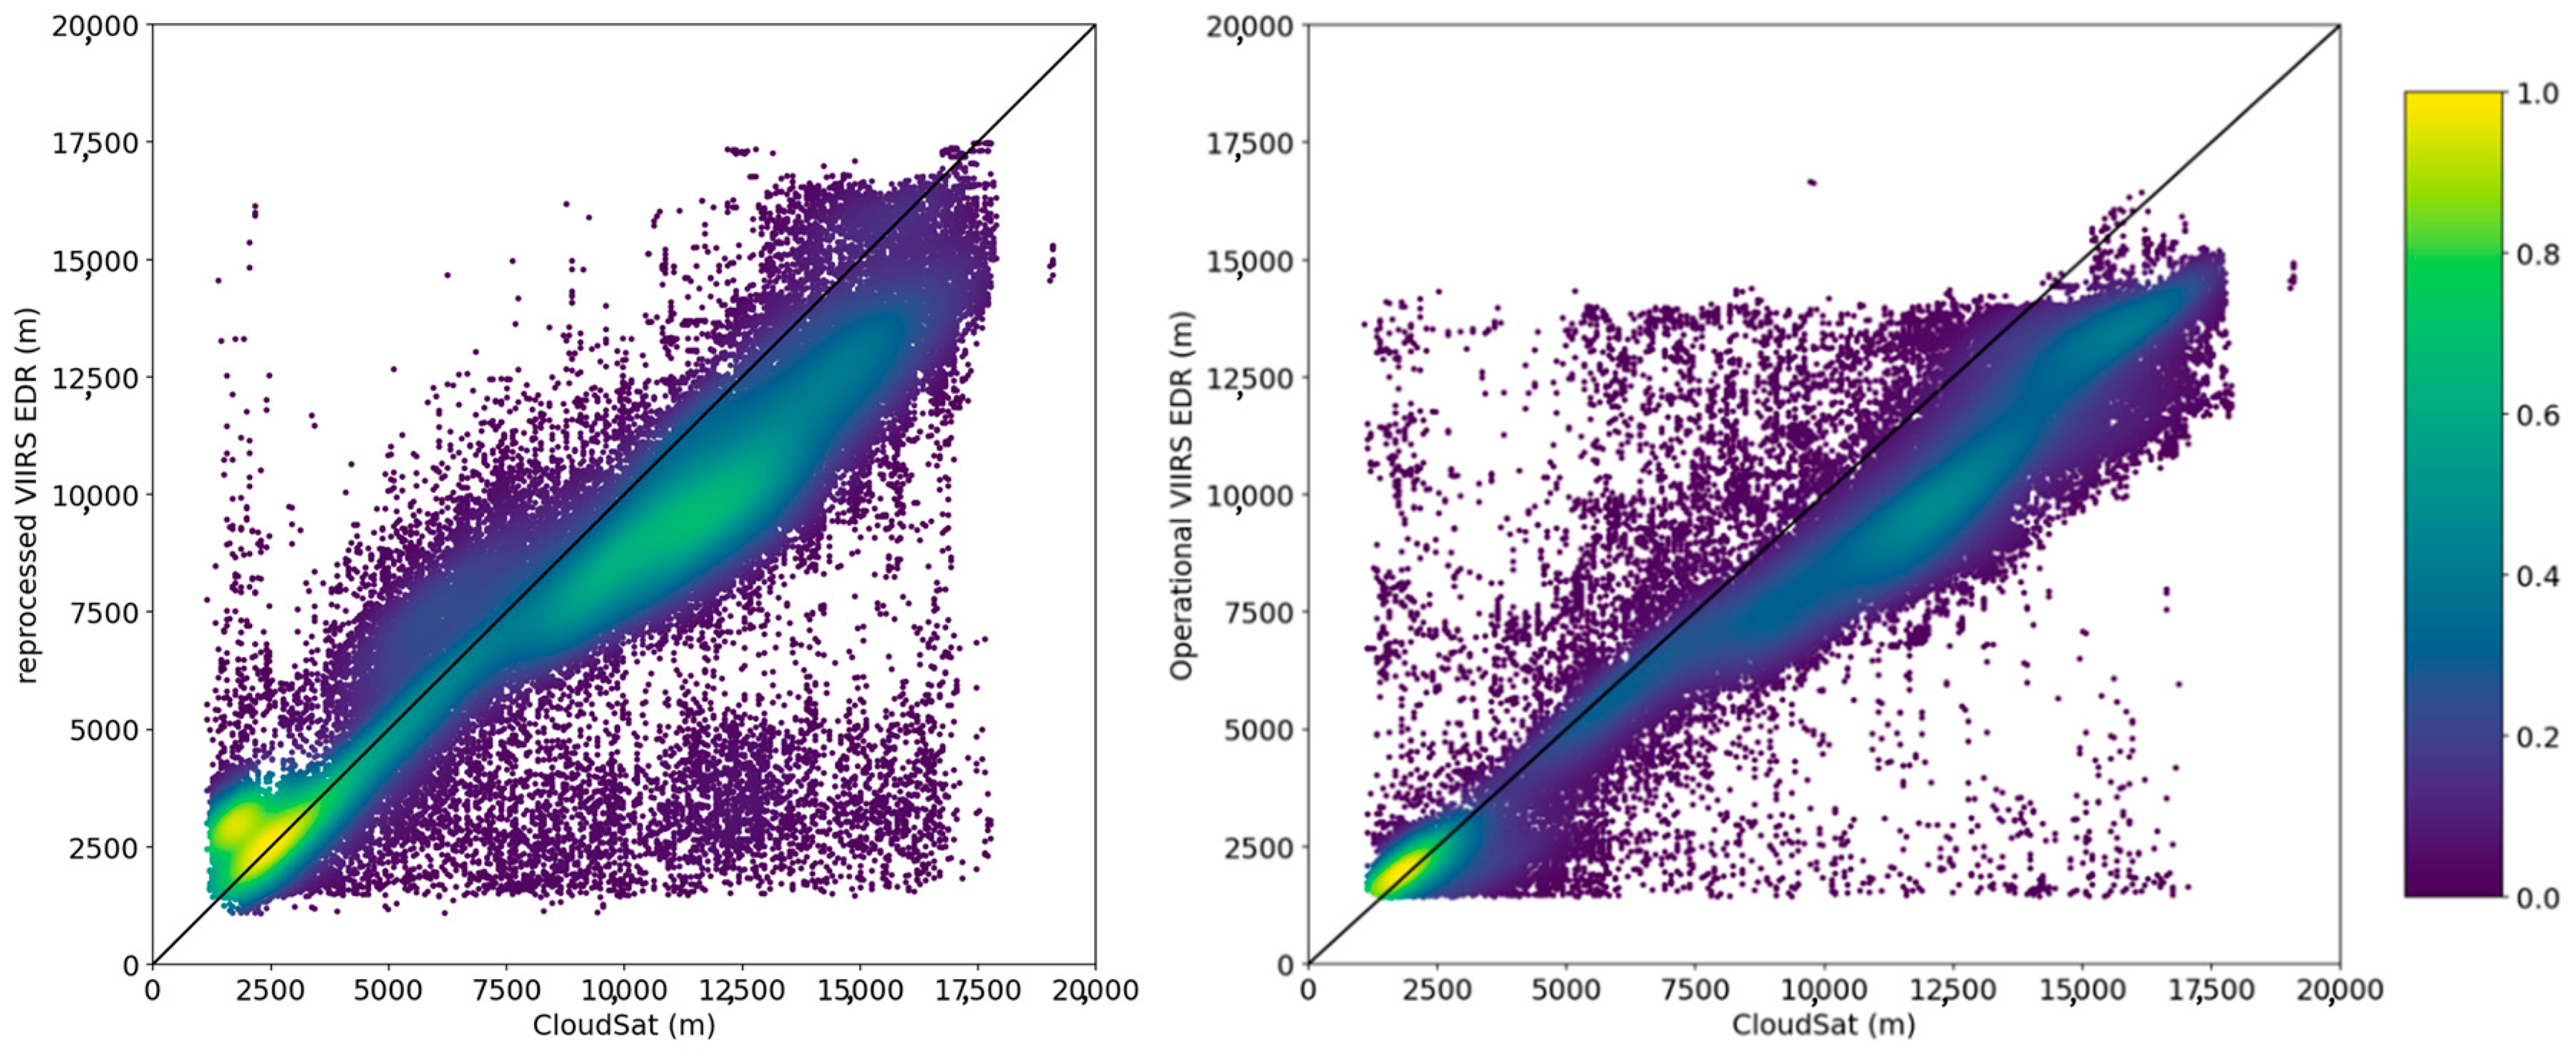
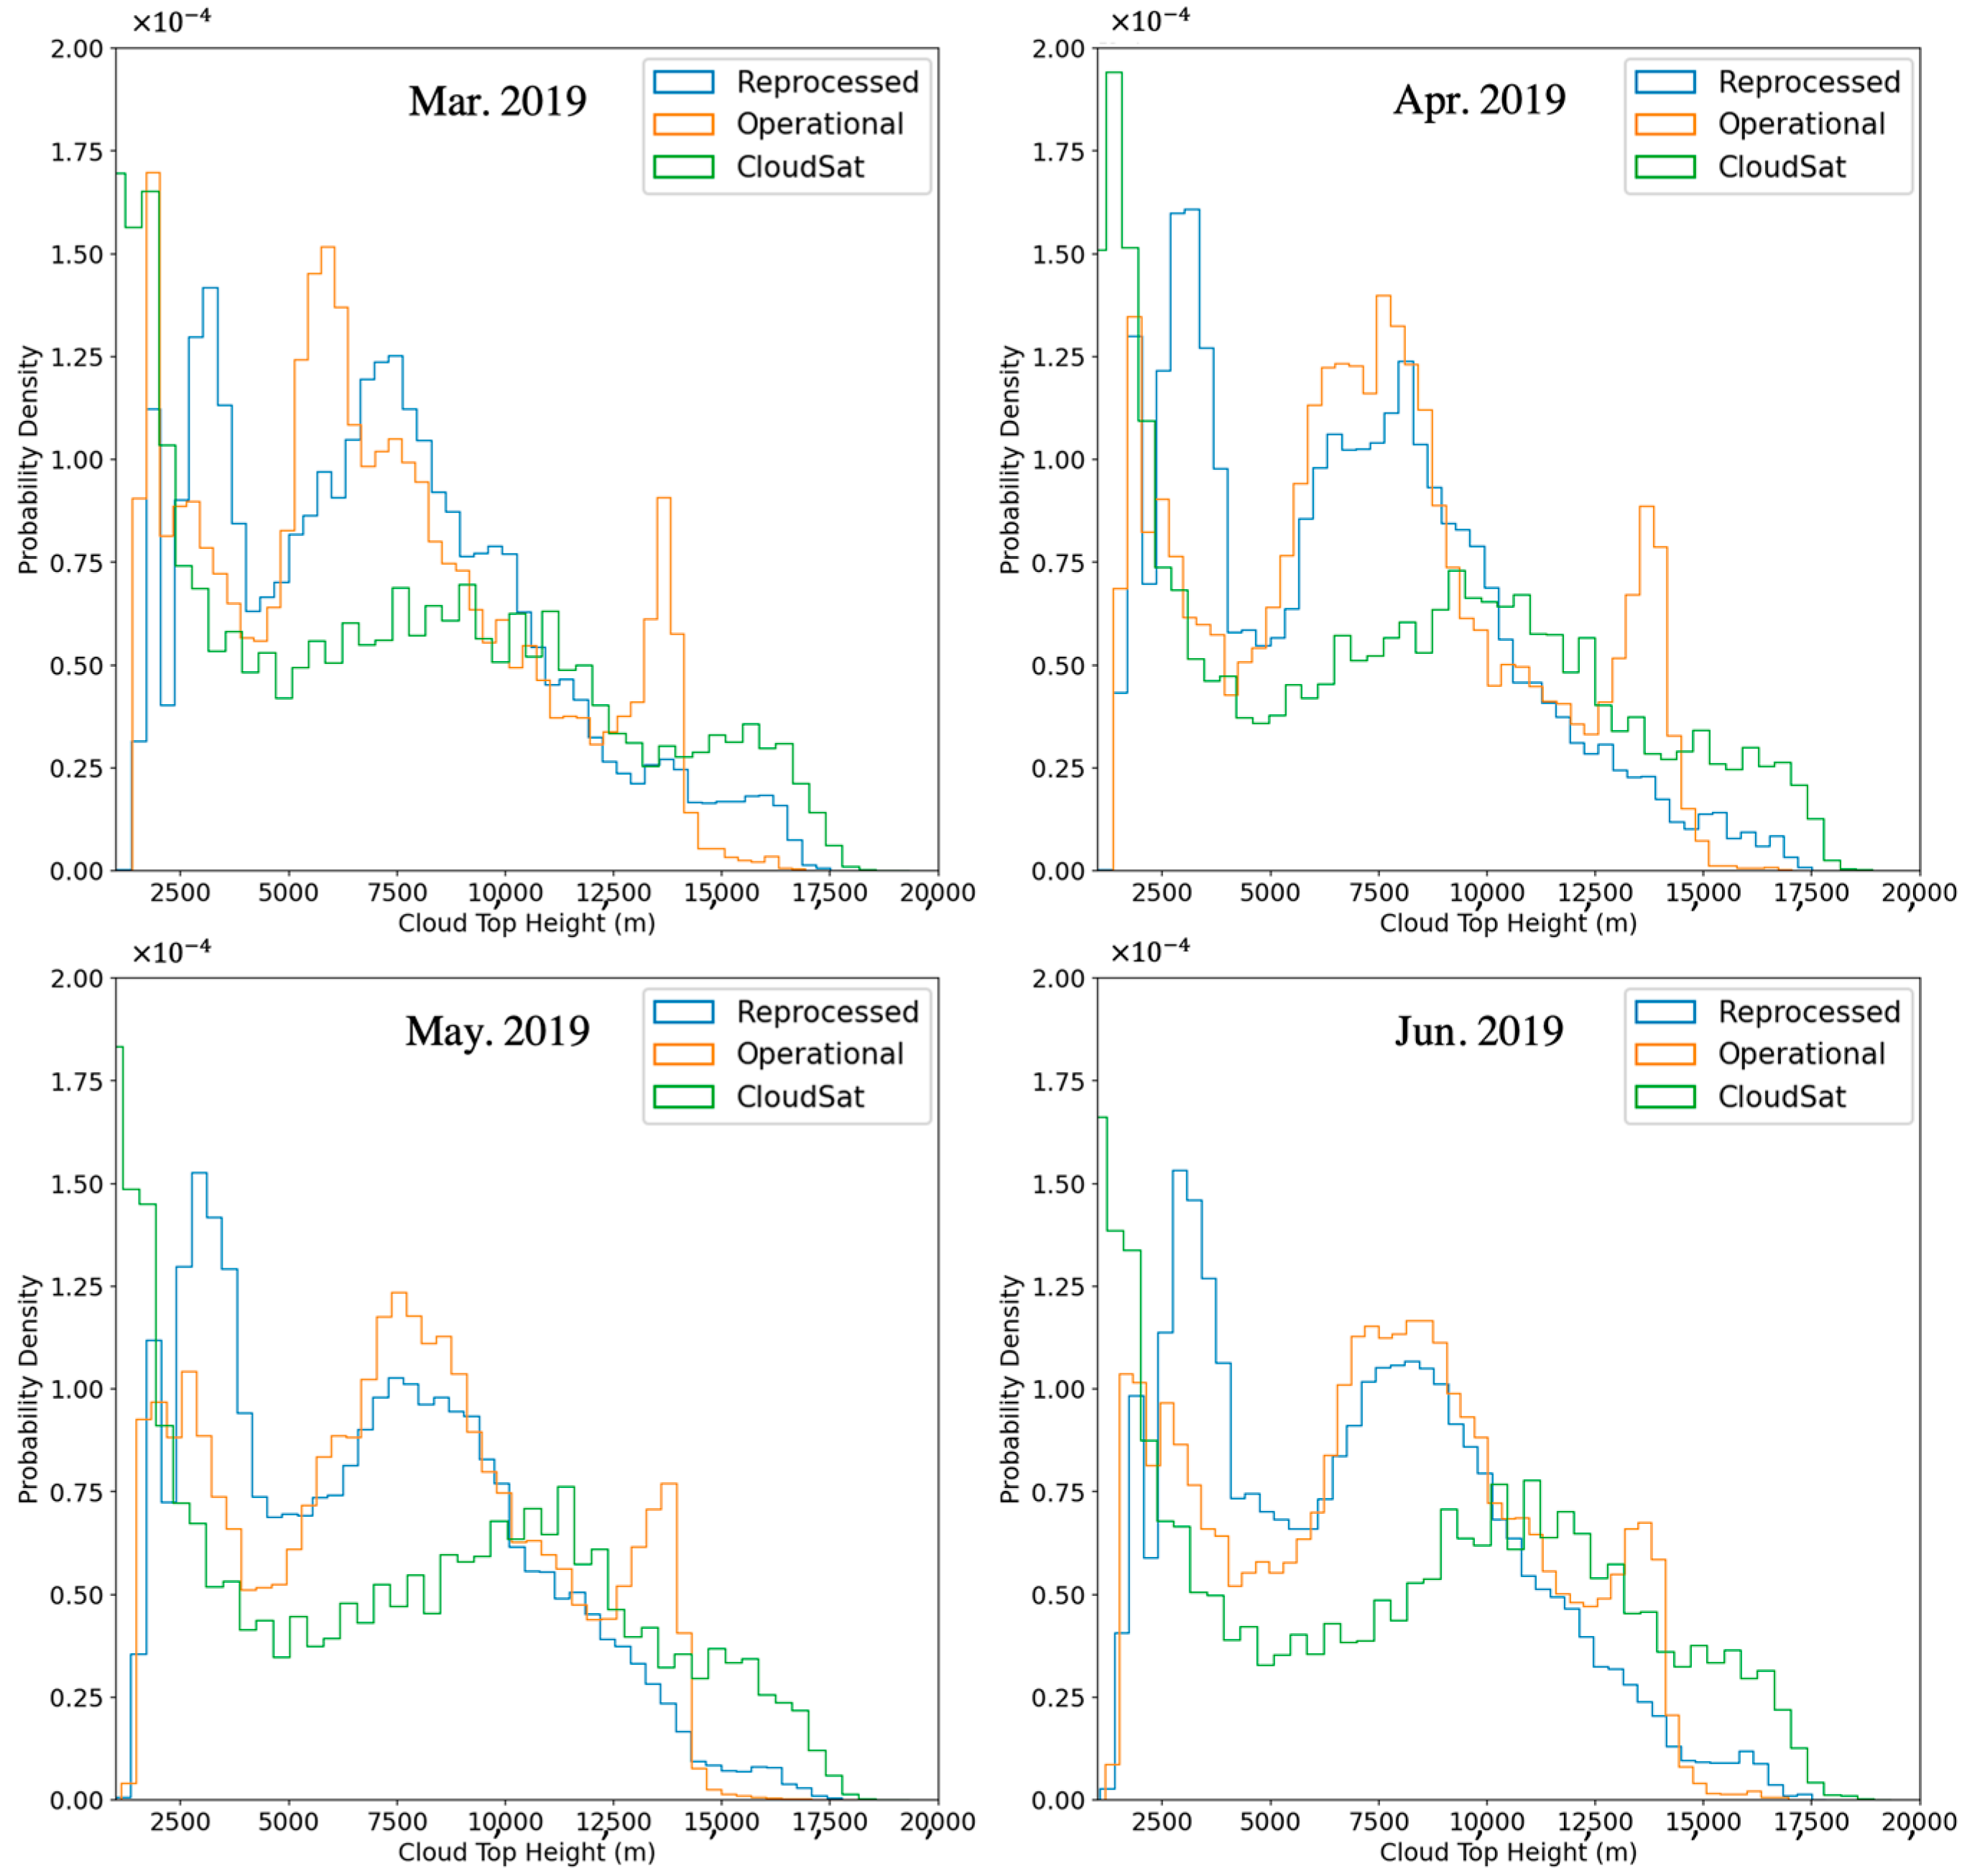
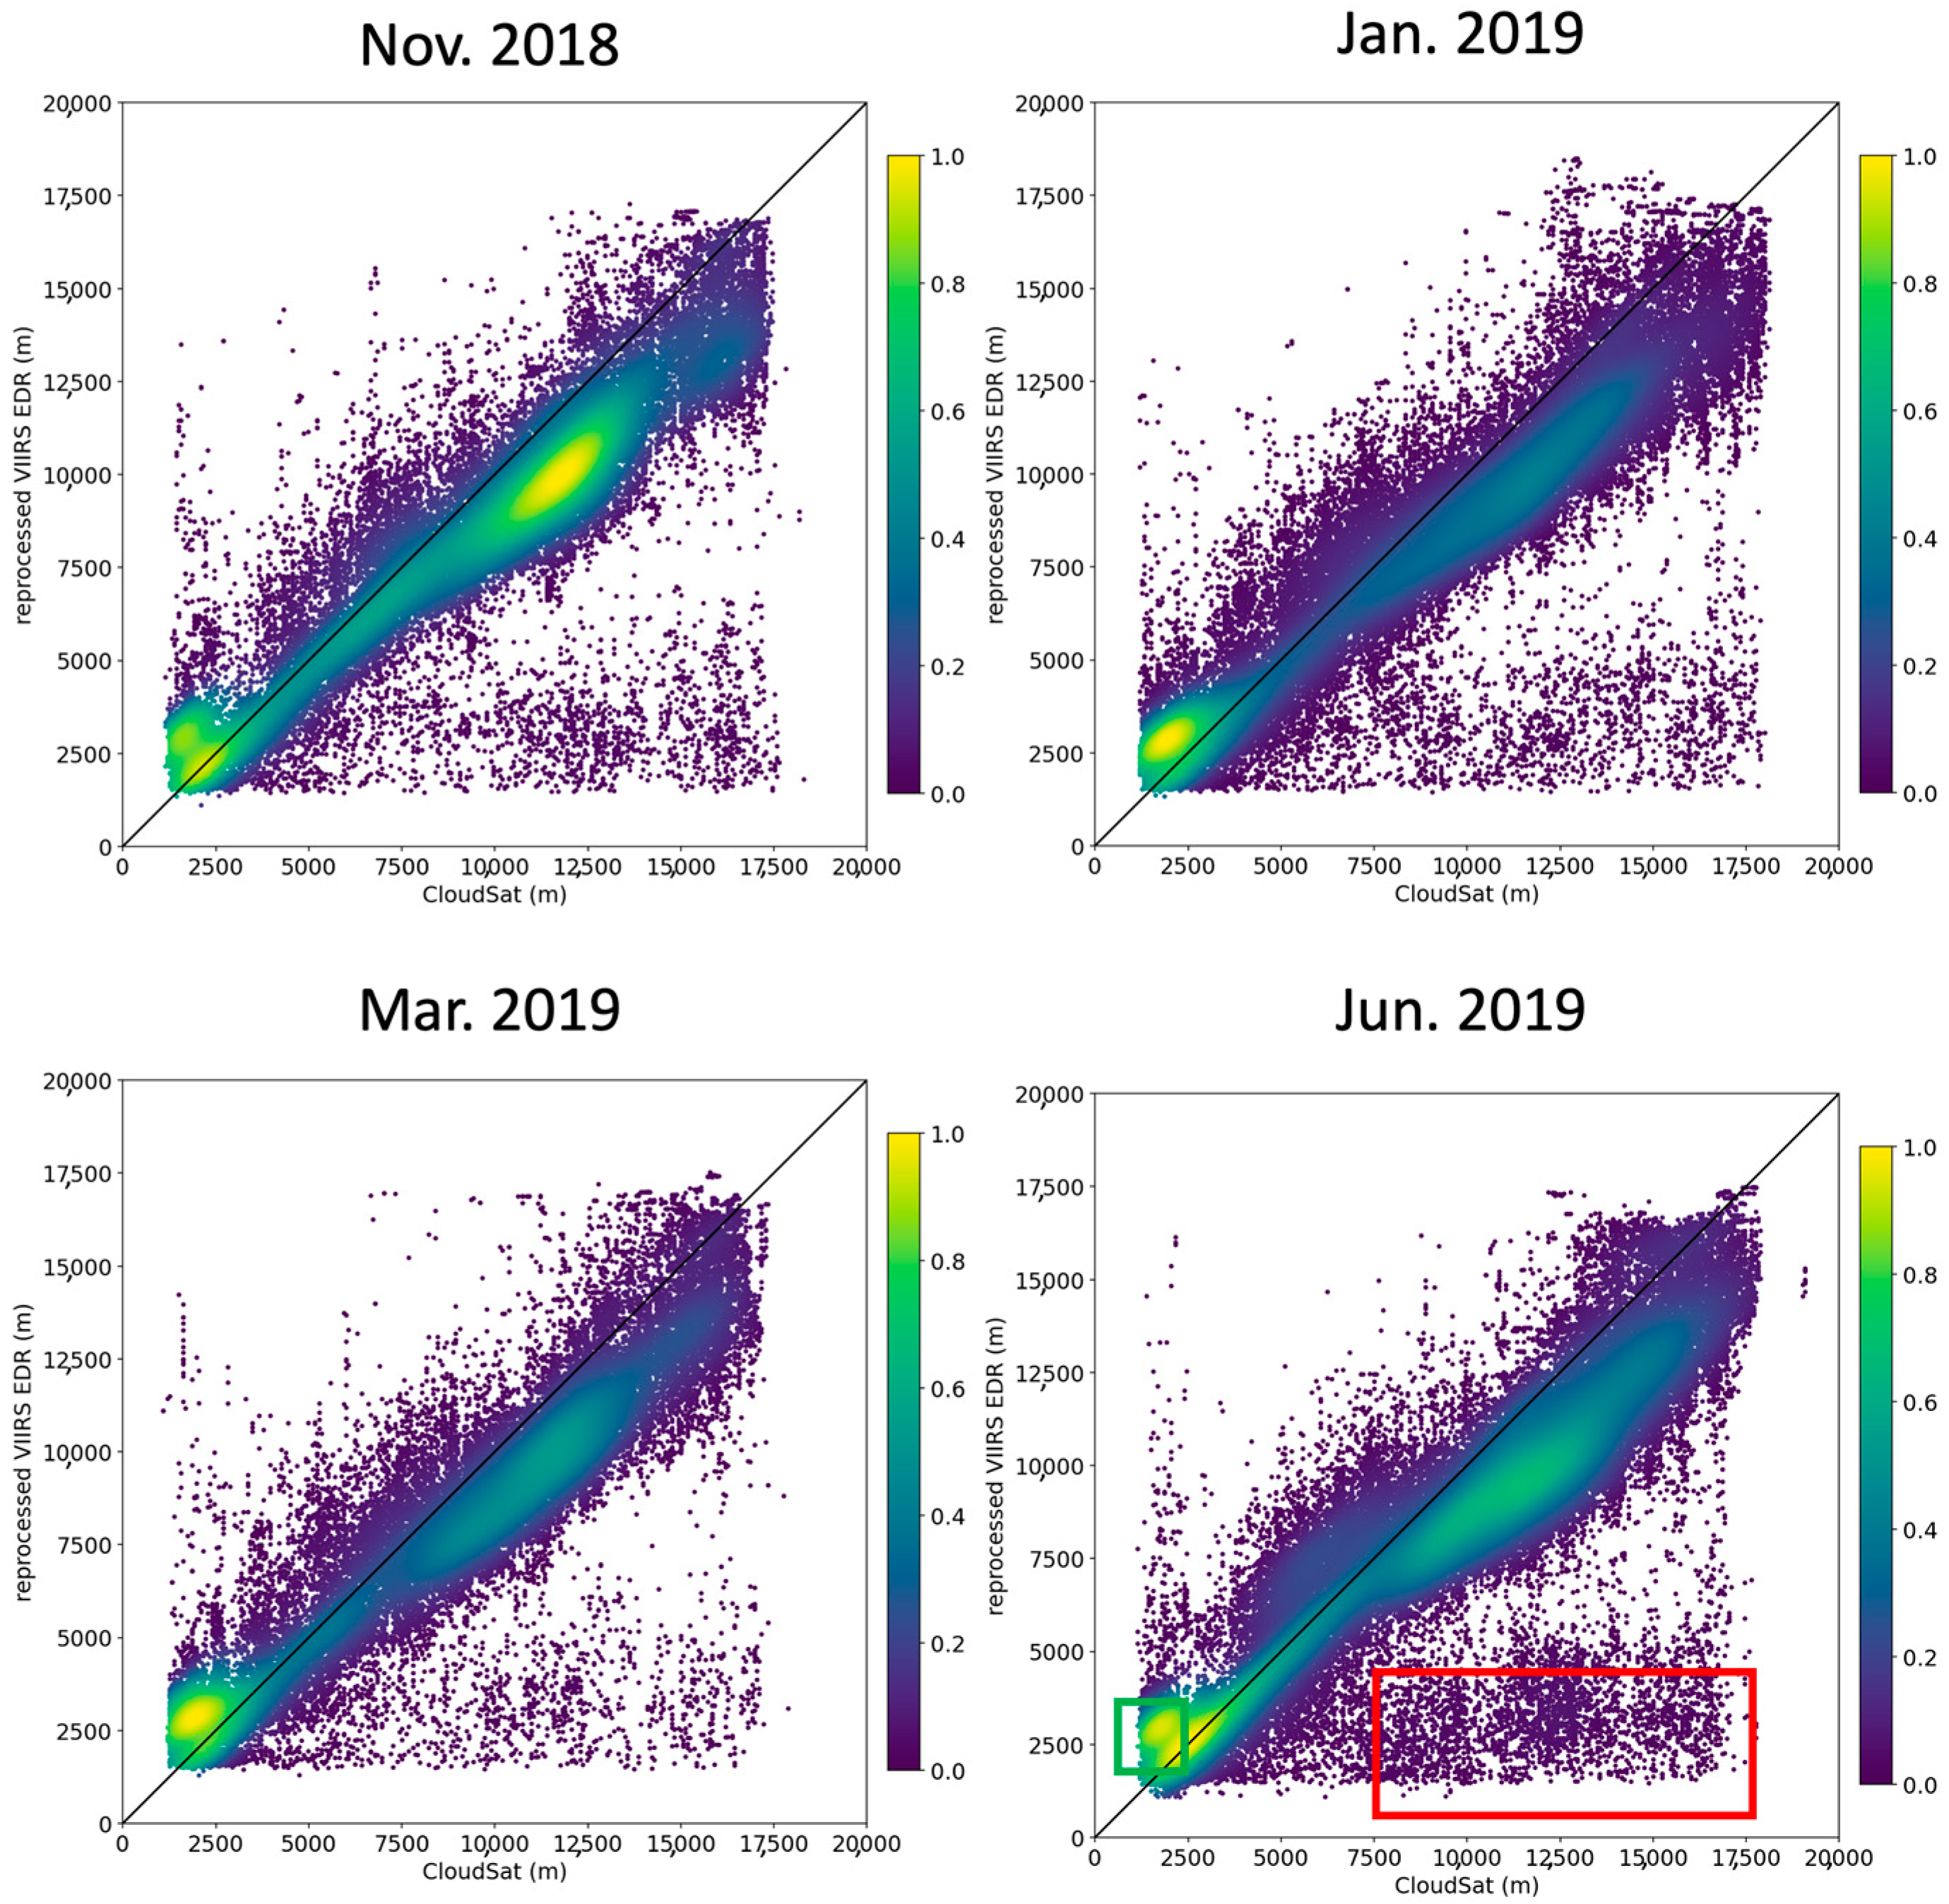
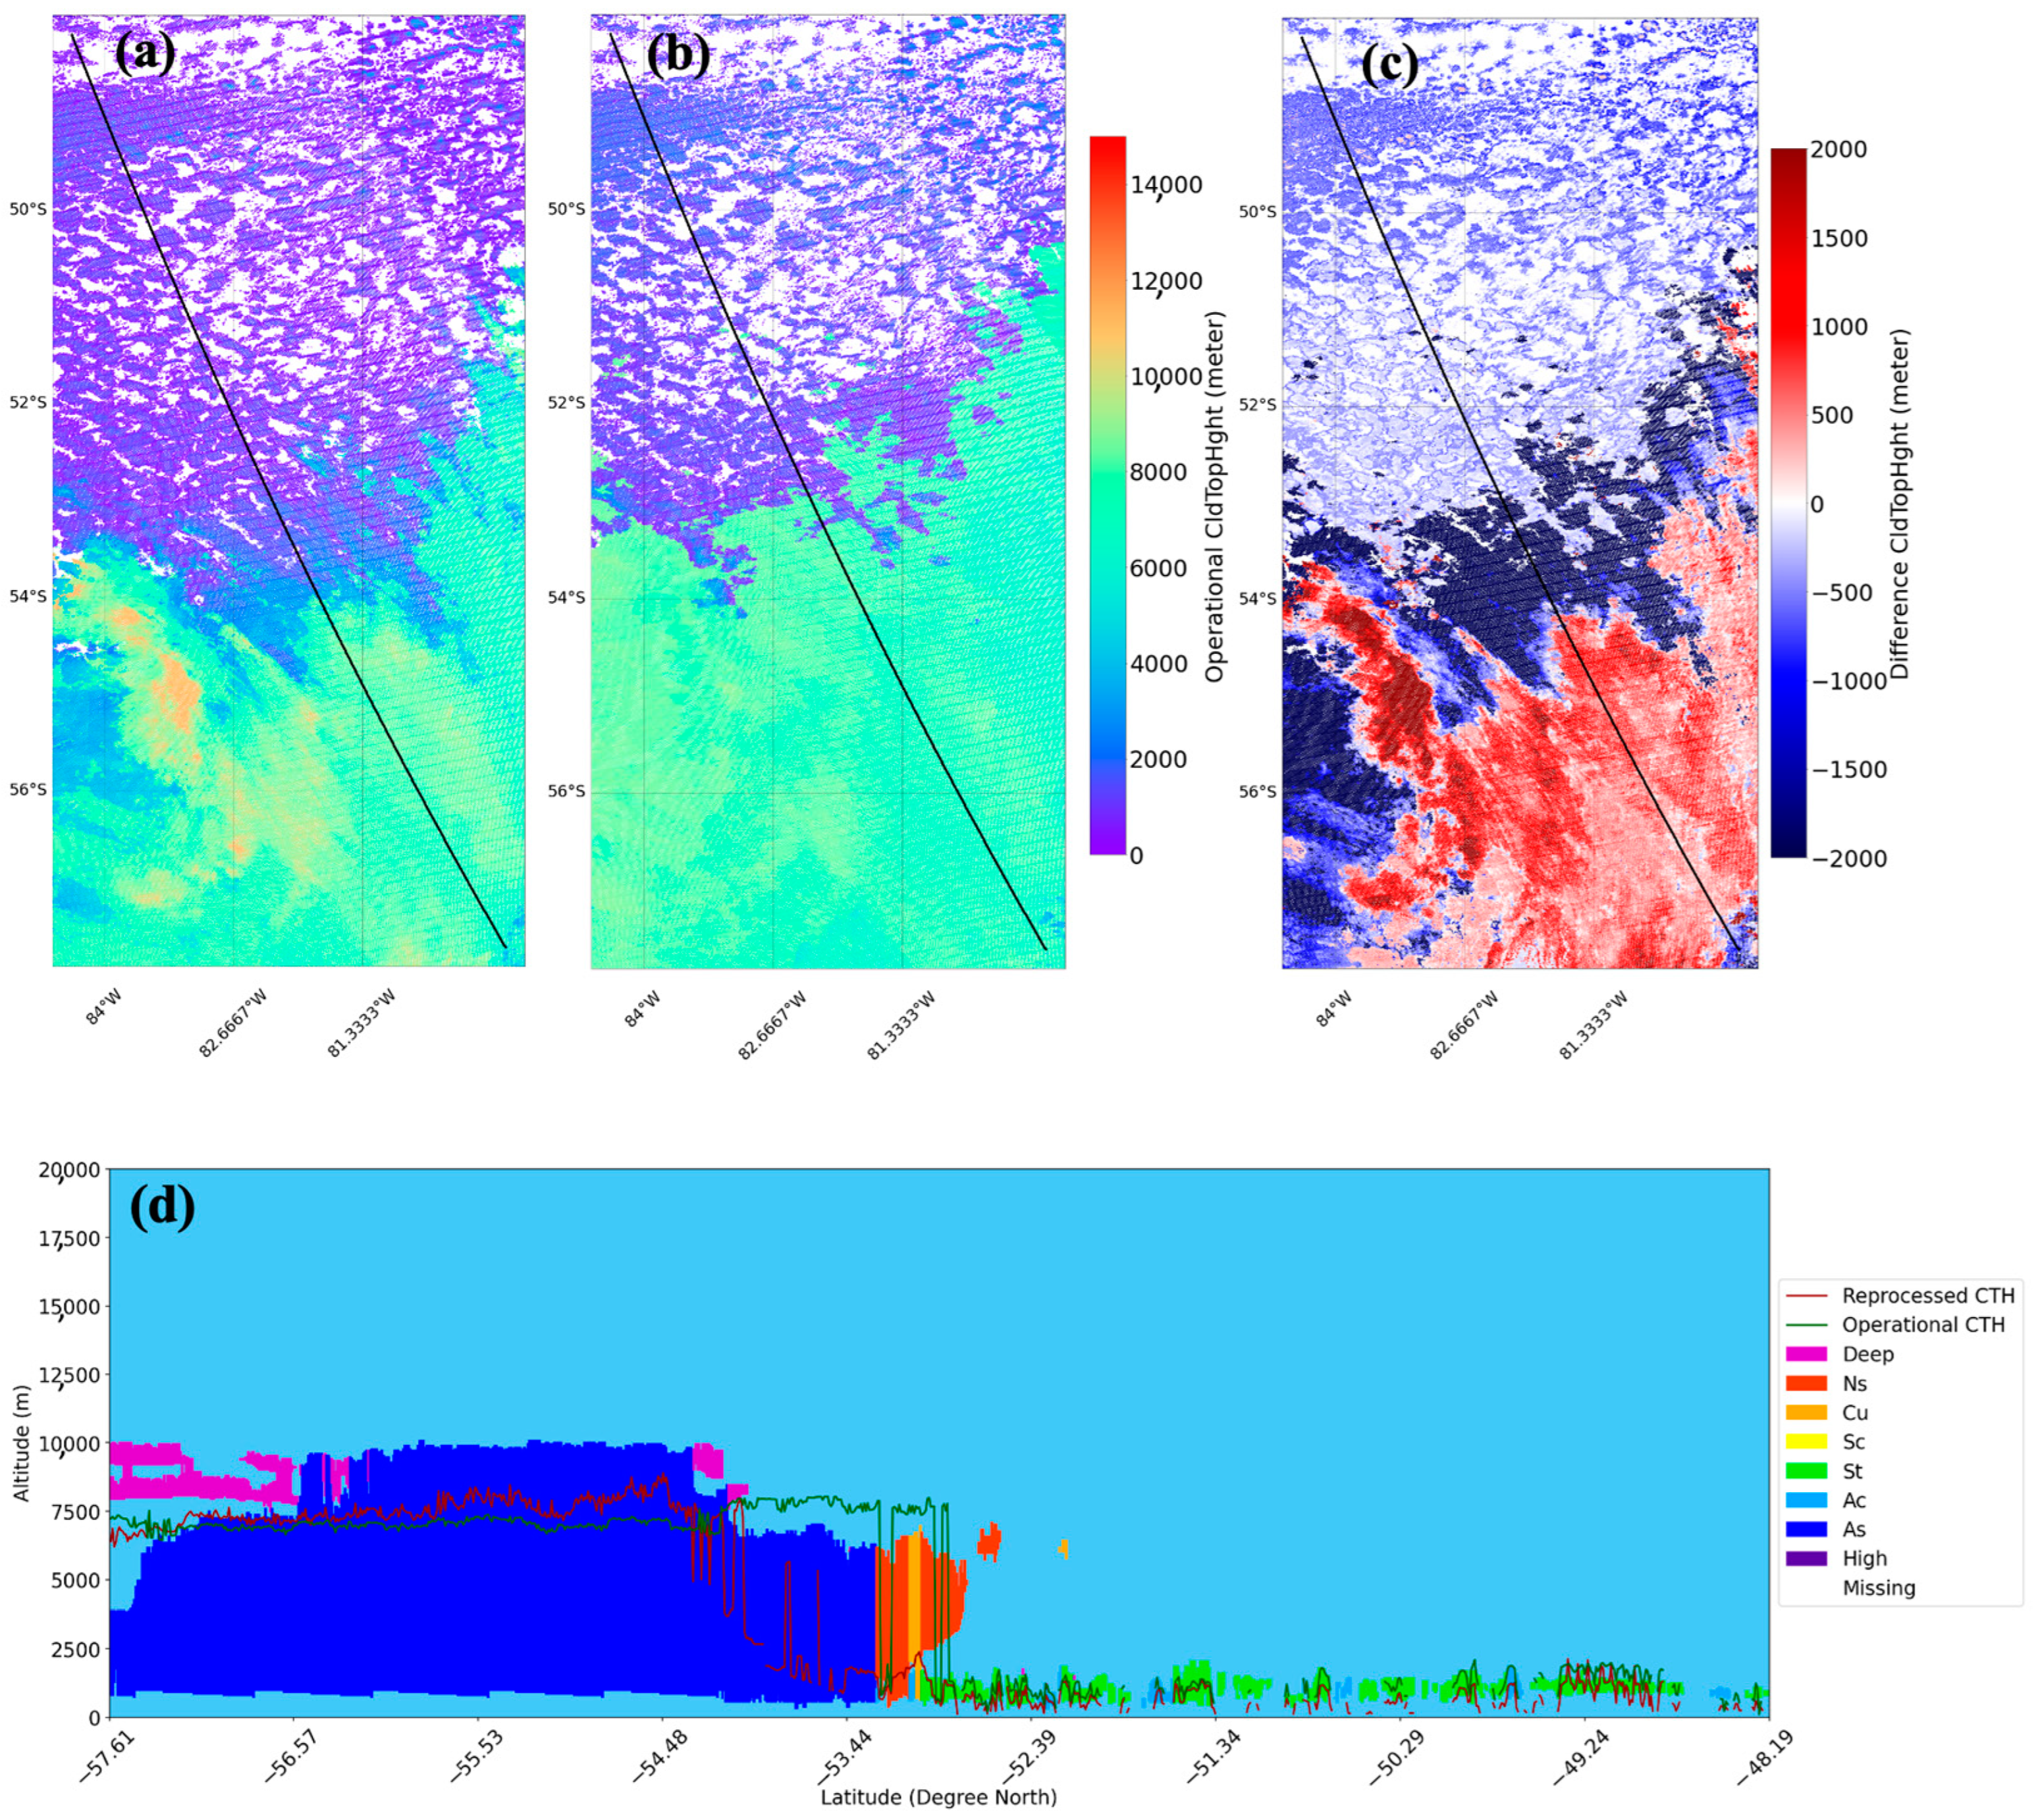
5.1. Cloud Top Height

Figure 2 illustrates the probability density (PD) patterns of reprocessed and operational VIIRS CTH retrievals, along with CTH observations from the CloudSat-CALIPSO system for March–June 2019. The CTH retrievals from reprocessed VIIRS and CloudSat-CALIPSO exhibit two PD peaks: one in the lower CTH range (below ~3 km) and another at ~7.5 km for reprocessed VIIRS and ~10 km for CloudSat-CALIPSO. In contrast, the operational VIIRS CTH shows three PD peaks, including an additional peak at ~13 km. Additionally, while both reprocessed VIIRS and CloudSat-CALIPSO CTH data feature a valley around 4 km, the operational VIIRS CTH displays a second valley near ~12 km. Notably, the operational VIIRS data include almost no CTH retrievals above 15 km. In contrast, the reprocessed product aligns more closely with the CloudSat-CALIPSO sensors, effectively retrieving CTHs up to approximately 17.5 km. Overall, the PD pattern of reprocessed VIIRS CTH shows better alignment with CloudSat-CALIPSO data than the operational product.
Figure 3 shows the density plots of the reprocessed VIIRS CTH estimates with CloudSat-CALIPSO measurements as “truths” for November 2018, January 2019, March 2019, and June 2019. The color indicates the samples density at corresponding CTH values based on Kernel density estimation. For all these months, most of the CTH matchups are clustered near the 1:1 agreement line, showing an overestimation for low clouds and an underestimation of high clouds. Similar errors are also present in operational data (Figure A1). The most significant errors primarily arise from the overestimation of ‘truth’ CTH below 2.5 km and underestimation above 5 km (e.g., highlighted in green and red boxes, respectively, in the June 2019 plot).
The underestimation of the high-cloud retrieval is mainly due to passive sensors, especially infrared (IR) radiometers, which determine the cloud top height by matching the observed radiance to a temperature profile from atmospheric models. High-altitude clouds such as cirrus are optically thin and allow some radiation from lower and warmer layers to pass through, leading to an overestimation of cloud-top temperature and an underestimation of height [39,40]. On the other hand, active sensors like Lidar operate by sending a laser pulse and measuring the backscattered signal. Since lidar is highly sensitive, it can detect the very thin and optically tenuous top-most parts of the clouds, which cannot be detected by passive sensors. As a result, Lidar tends to record higher cloud tops than passive sensors [41].
In contrast, low clouds are typically optically thick, and passive sensors like VIIRS have limited capability to penetrate such dense cloud layers. This can result in an overestimation of the ‘truth’ CTH, revealing the limitation of passive sensors in capturing cloud features. Another potential factor is the parallax issue associated with VIIRS, which may cause it to observe a different cloud top than active sensors. Although the study implements strict quality control measures that help partially mitigate the parallax effect, some residual biases may still persist due to geometric displacement in satellite observations. Similar biases in estimating low CTH using passive sensors are also documented by other studies [42,43].
The study quantitatively analyzes the performance of the new VIIRS CTH retrieval algorithm over each month of the study period, and the results of the assessment metrics mentioned in Section 4.3. are shown in Table 1. The available operational VIIRS CTH EDRs are also evaluated for Spring and Summer, as shown in brackets. In order to ensure a sufficient sample size, valid matchups between reprocessed and operational VIIRS data and CloudSat measurements are selected separately for calculating these metrics.
The R 2 values between the reprocessed VIIRS CTH and CloudSat-CALIPSO products are relatively high, ranging from 0.69 to 0.82 across all the study months. These high R 2 s present a strong correlation and similarity between reprocessed VIIRS CTH and CloudSat observations. The R 2 values of operational VIIRS CTH are even higher than the reprocessed data for March–June 2019 (0.85 vs. 0.82, 0.84 vs. 0.72, 0.82 vs. 0.69, and 0.85 vs. 0.73, respectively). The comparison between the retrieval accuracies of reprocessed and operational VIIRS CTH for Jun. 2019 are shown in Figure A1. The operational VIIRS data outperform the reprocessed product in the retrievals of low-CTH pixels; however, it tends to overestimate the “truth” at 6~11 km CTH. Additionally, the operational algorithm of the study period is inadequate for retrieving very high CTHs, as it captures very few CTHs above 15 km. On the contrary, the reprocessed product performs much better at these heights, aligning closely to the 1:1 agreement line. The reprocessing algorithm upgrades the microphysical index (β) fitting method from linear to a higher-order polynomial, which has more degrees of freedom, leading to overfitting. This means that the model starts capturing not just the underlying trend of the data but also the noise or fluctuations [44]. As a result, the fitted β might be excessively sensitive to small variations in the data, especially in the low ends of the cloud-top measurements, and cause more significant fluctuations.
In general, both the reprocessed and operational VIIRS CTH algorithm tend to underestimate the CloudSat “truth” with negative MBEs for all the study months. These MBEs are all ~1 km except for VIIRS operational data during June 2019 that show a larger difference (−1.31 km) from “truth”. The RMSE of reprocessed CTH ranges from ~2.14 to 2.66 km. These values are slightly larger than those of the operational VIIRS CTH during March–June 2019. The reprocessed VIIRS CTH achieves up to 15% of pixels accurately retrieved (within 250 m of CloudSat-CALIPSOs), which is similar to the operational data. The operational data exhibit stronger correlations with the “truth”, with all R2 values exceeding 0.80 for the overlapping months.
Figure 4 and Figure 5 visualize the comparison of CTH values among reprocessed and operational VIIRS retrievals and CloudSat-CALIPSO measurements for two case studies on 1 May 2019, 20:00:46–20:03:25 UTC, and 8 June 2019, 08:11:27–08:14:06 UTC. The tracks of the matched CloudSat-CALIPSO data are shown in the black lines. As can be seen in Figure 4a–c, the estimations of lower CTH are smaller in the reprocessed VIIRS data than those retrieved by the operational algorithm. In contrast, the higher CTH are even larger in the reprocessed data. The reprocessed CTH effectively captures the lower values along the edge of the high cloud. Figure 4d shows a detailed comparison of reprocessed (red line) and operational (green line) VIIRS CTH retrievals against CloudSat-CALIPSO measurements with cloud type indicated in the background, including stratus (St), stratocumulus (Sc), cumulus (Cu, including cumulus congestus), nimbostratus (Ns), altocumulus (Ac), altostratus (As), deep convective (deep), and high (cirrus and cirrostratus). According to Figure 4d, this case study contains a series of thick altostratus and nimbostratus clouds followed by some thin stratus clouds. Both the reprocessed and operational VIIRS algorithms tend to underestimate the CTH of those high cloud tops at around 10 km in CloudSat data by ~2.5 km. Although operational data appear closer to the “truth” when the cloud tops drop to ~7.5 km in the CloudSat data near a 54 ° S latitude, the reprocessed VIIRS successfully represents this decreasing trend with drastic fluctuations, whereas the operational CTH estimates slightly increase and overestimate CloudSat CTH values. This may be linked to the use of high-order polynomials to address the effects of multiple scattering in the reprocessing of the VIIRS cloud algorithm [29]. For lower clouds, which primarily consist of liquid cloud particles, accurately capturing the intense scattering signals from these particles (or raindrops) is challenging, even with high-order polynomial equations. Moreover, the use of such polynomials can introduce significant fluctuations in CTH retrievals, as shown in Figure 4. The lower R 2 of reprocessed CTH may also be caused by these significant fluctuations. This is due to the fact that the polynomial fitting method adopted by the reprocessing algorithm can exaggerate rapid changes in the data. For those thin clouds with low CTHs from the 53 ° S~48 ° S latitude identified by CloudSat, both the reprocessed and operational VIIRS algorithms yield relatively accurate and effective retrievals.
The case study of 8 June 2019, presented in Figure 5, includes a cluster of deep and nimbostratus clouds as observed by CloudSat-CALIPSO. Overall, the majority of cloudy pixels in the reprocessed VIIRS EDR show higher CTH values compared to the operational data, with only a small portion displaying similar or slightly lower retrievals over areas of high CTH. The reprocessed data align more closely with the “truth” values measured by the CloudSat-CALIPSO system for corresponding matchups. However, both the two VIIRS CTH EDRs tend to underestimate the “truth” and exhibit notable fluctuations over multi-layer cloud structures.

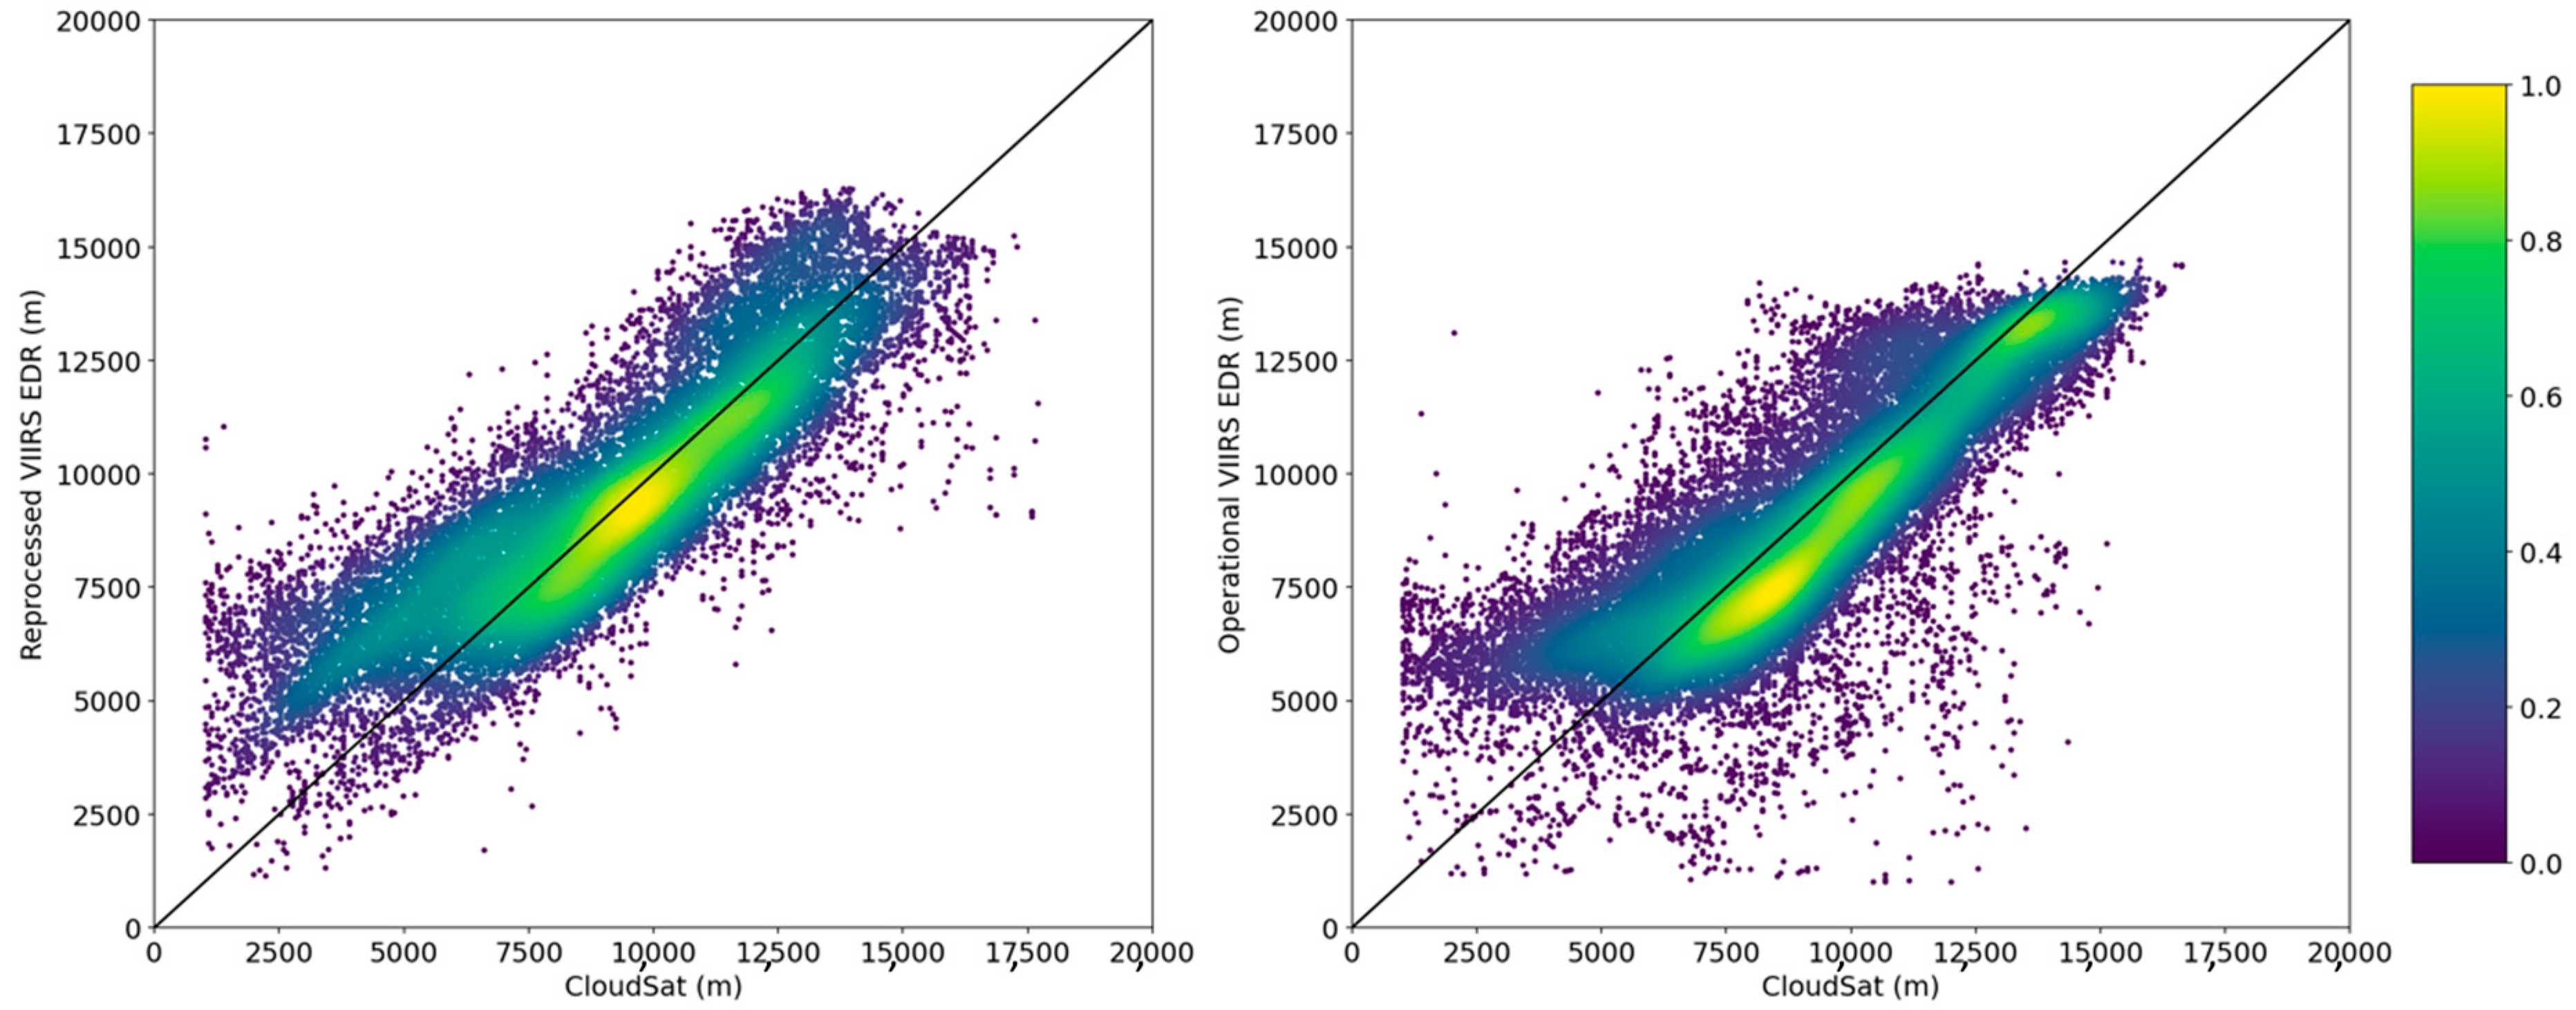
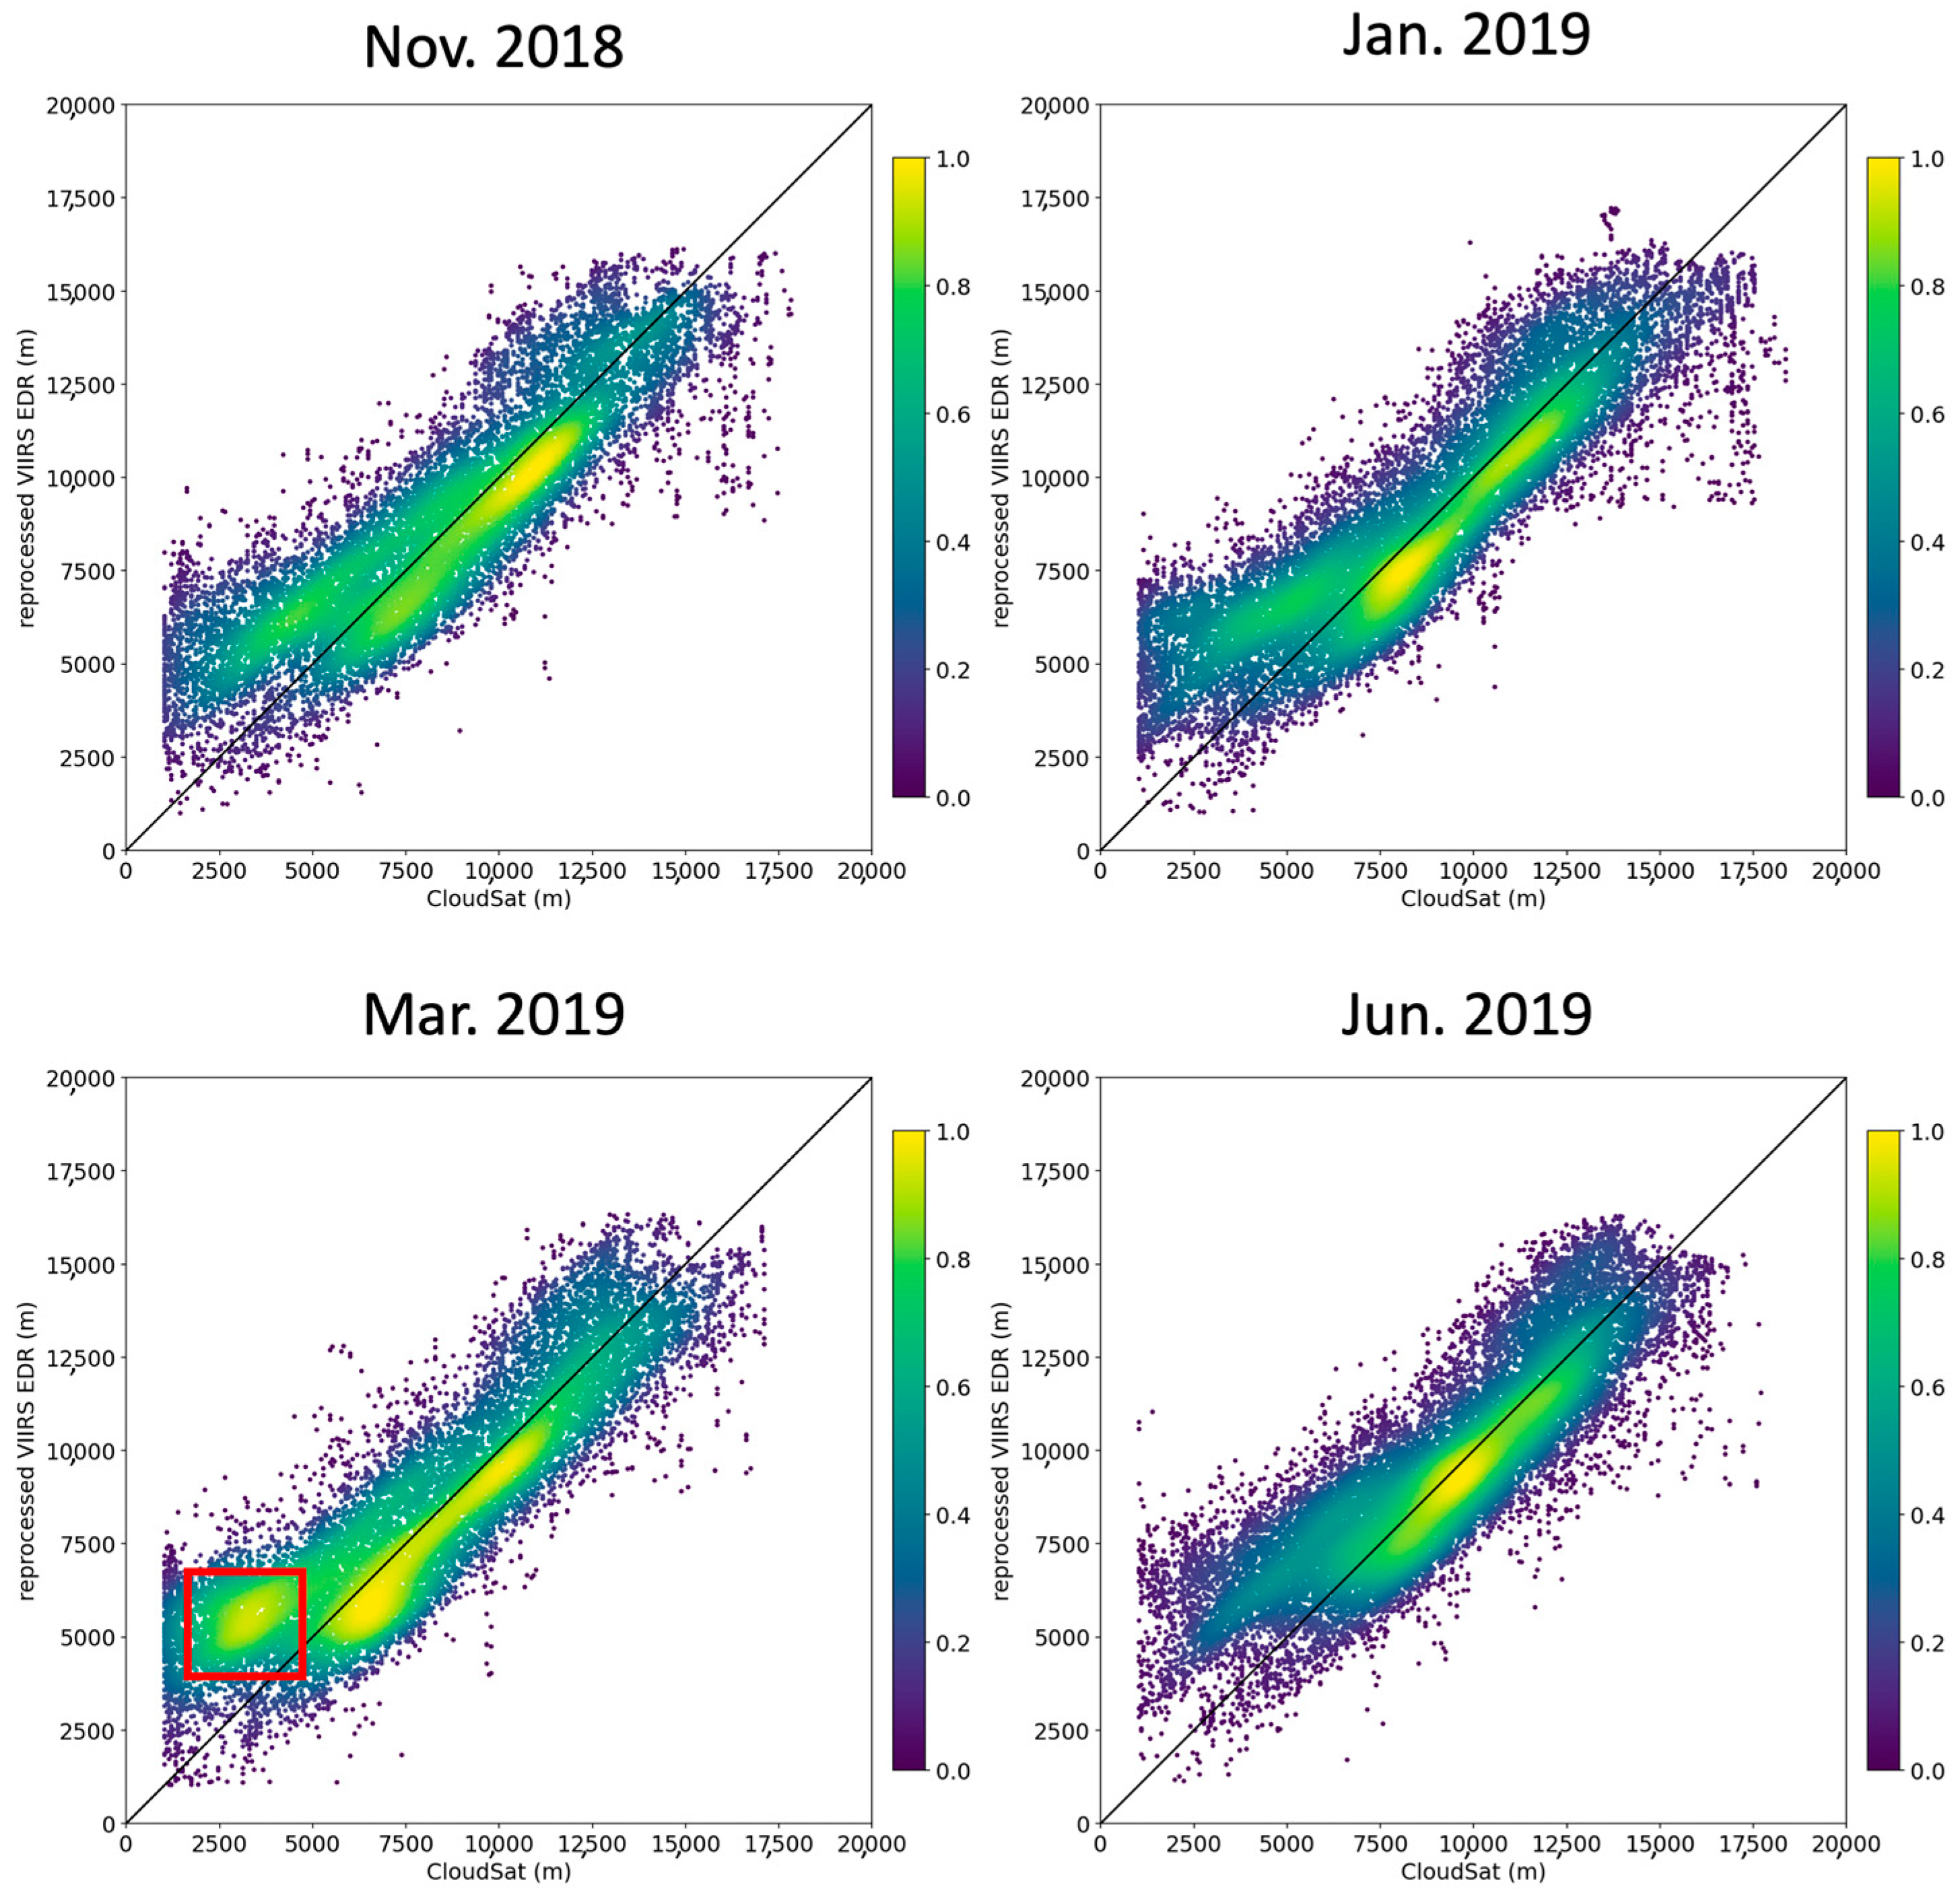
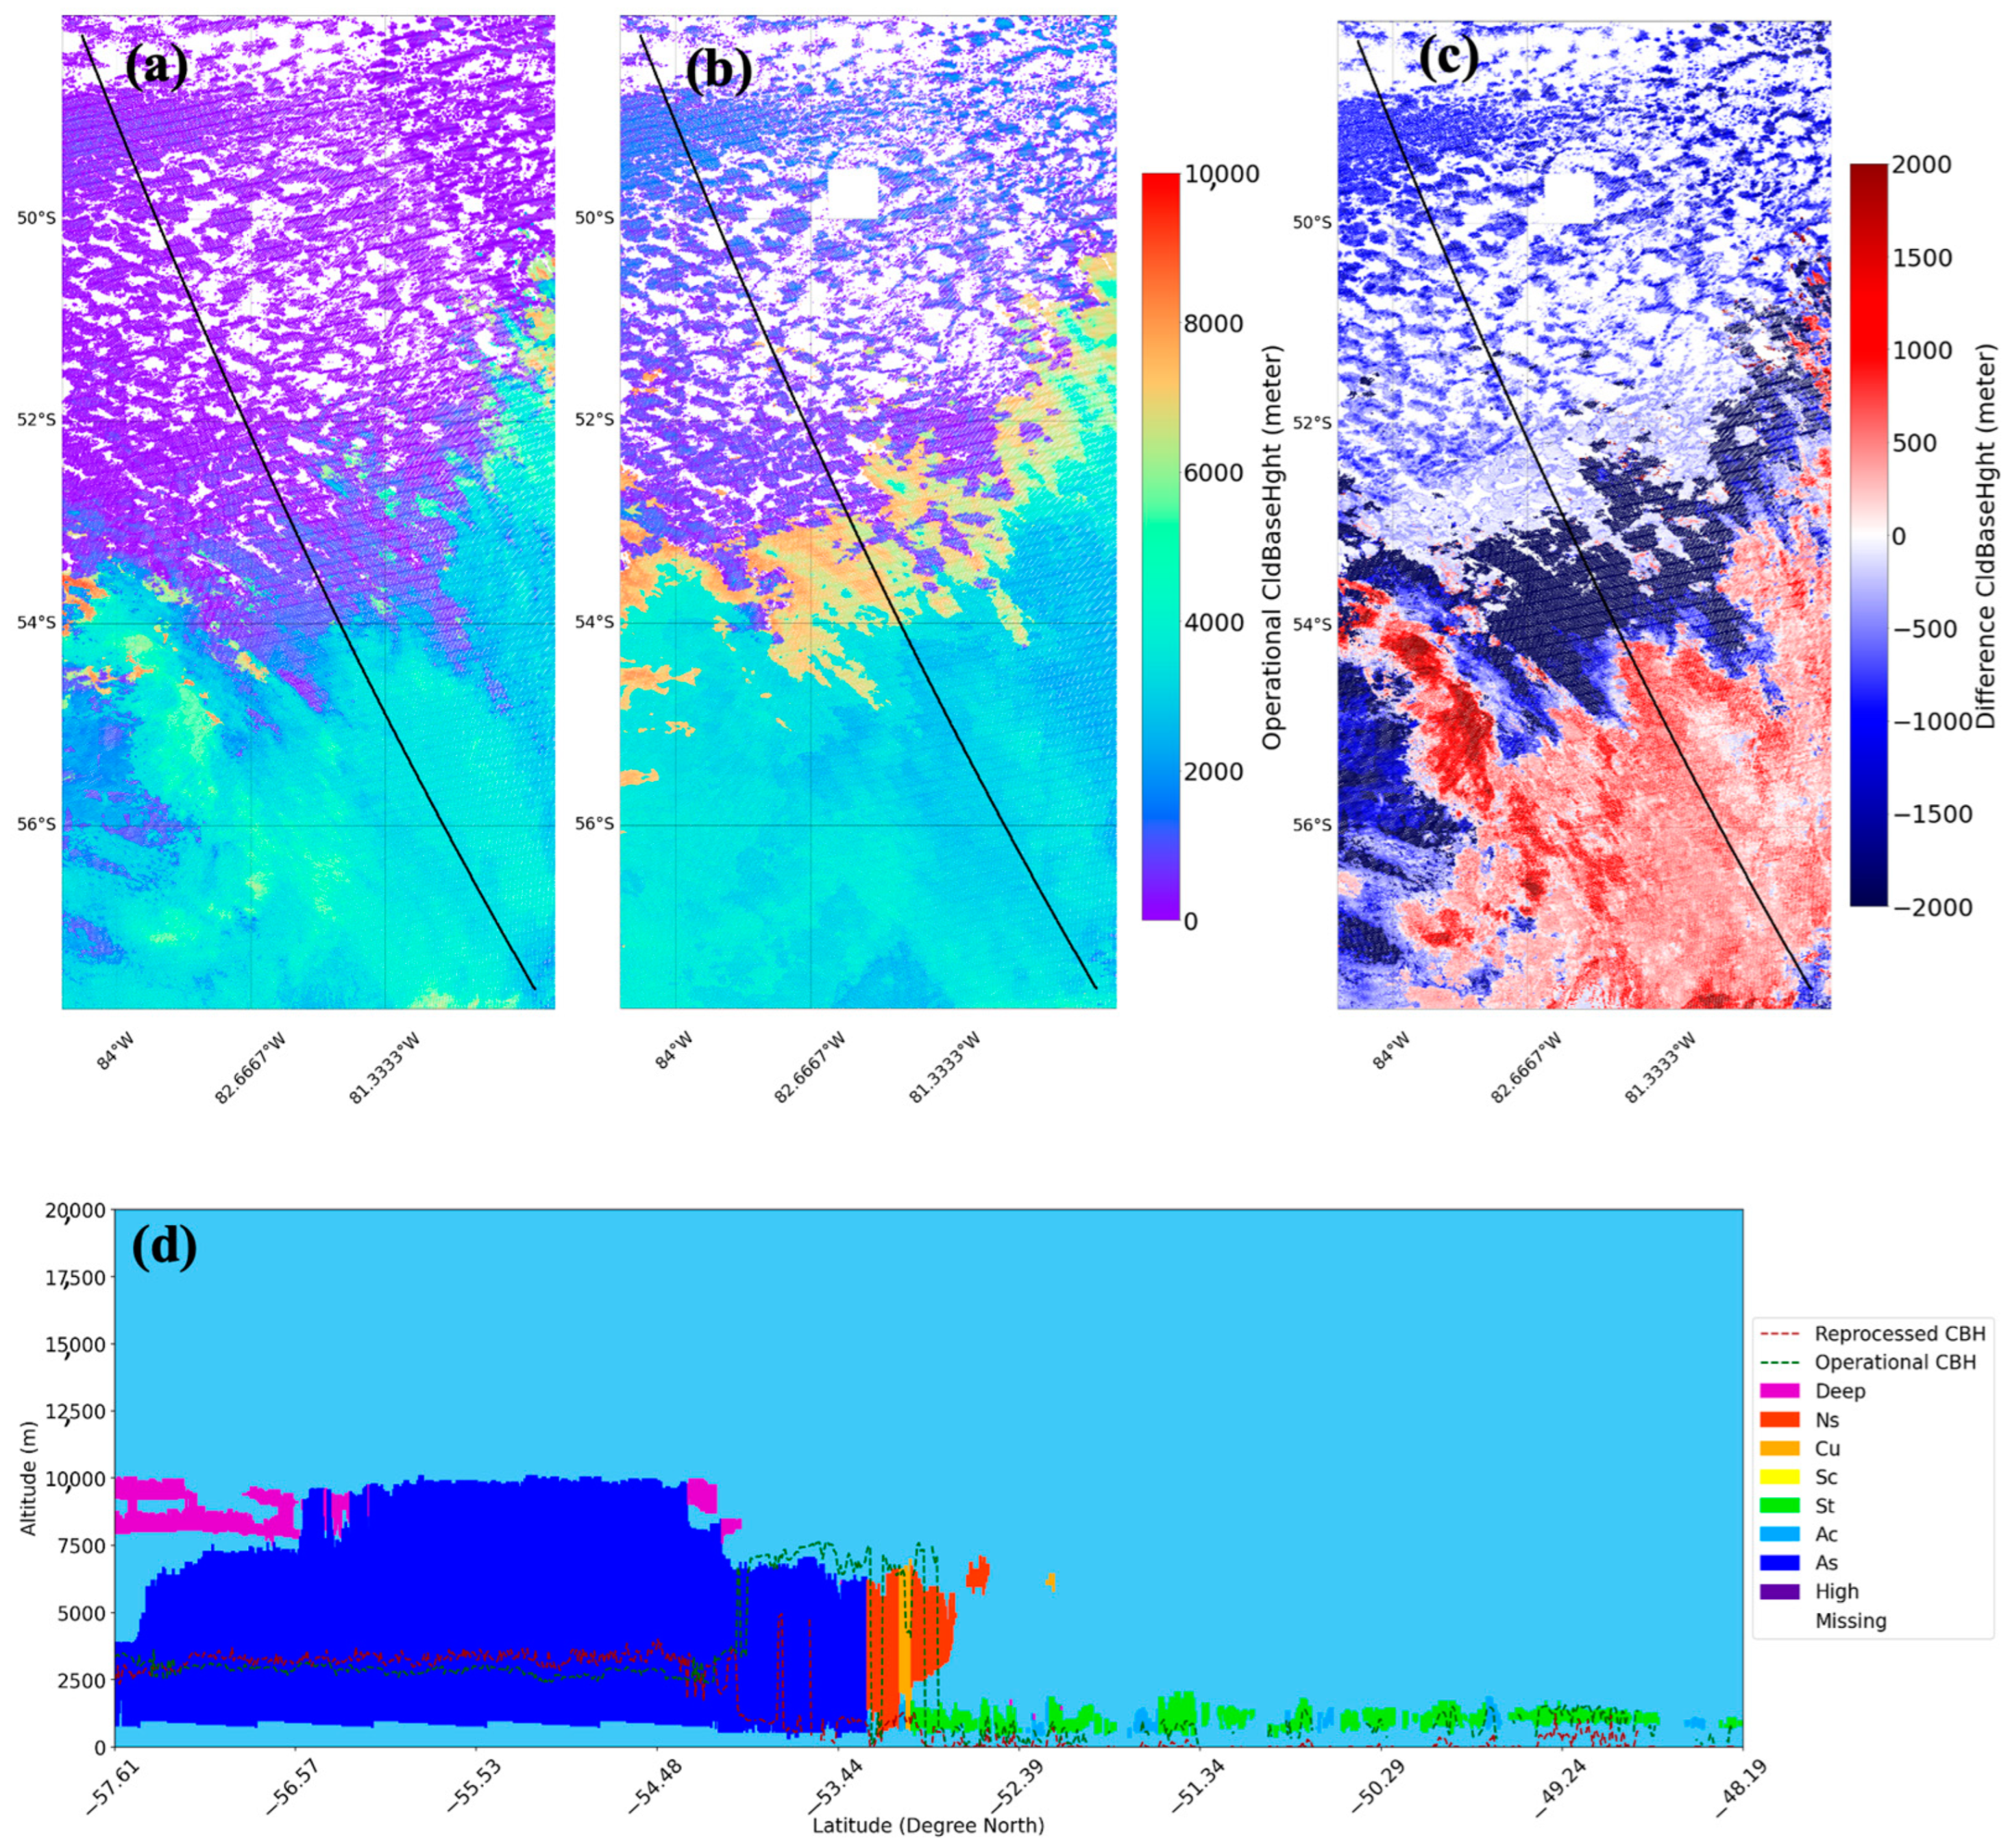
5.2. Cloud Base Height

Figure 6 illustrates the PDs of reprocessed (blue) and operational (orange) VIIRS CBH retrievals and CloudSat-CALIPSO CBH observations (green) from March to June 2019. The PDs of reprocessed VIIRS CBH demonstrate a decreasing trend with the increase in CBH, which closely resembles the CBH observed by CloudSat-CALIPSO. On the contrary, the PDs of CBH values in the operational data decline around 2 km and increase significantly between ~2.5 and 3 km.
Table 2 shows evaluation metrics for VIIRS CBH with CloudSat-CALIPSOs as “truth”. As can be noted from valid pixel numbers, less valid matchups are extracted from reprocessed VIIRS CBH compared to the operational data. This discrepancy is due to the reprocessing algorithm adopting stricter and more detailed CBH quality flags (refer to Table A4 and Table A5 for details), and this research only includes pixels with the highest data quality. The RMSE of the reprocessed CBH varies between 1.70 and 1.90, which satisfies the uncertainty requirement of Joint Polar Satellite System (JPSS) measurements for VIIRS CBH EDRs (2 km). The relatively low RMSE indicates that the new CBH algorithm agrees well with CloudSat-CALIPSOs, provided that the accuracy requirement for upstream CTH is met. The RMSEs of the operational VIIRS CTH data are similar to those of the reprocessed retrievals, with higher values for April (1.76 km vs. 1.73 km) and May (1.73 km vs. 1.70 km) 2019 and slightly lower values for March (1.85 km vs. 1.90 km) and June (1.72 km vs. 1.74 km) 2019. However, the R 2 values for the reprocessed CBH show improvement across all overlapping months compared to the operational data, consistently exceeding 0.74 (0.74~0.77) throughout the study period.
The relatively high accuracy of reprocessed VIIRS CTH can further be proved by the density plots shown in Figure 7. When filtered by the conditions applied to upstream CTH values, the majority of CBH matchups are concentrated along the 1:1 diagonal line, showing the highest densities. However, a noticeable number of pixels are overestimated by approximately 2 km when the “true” CBH is between 2 and 4 km, particularly in the March 2019 data, as highlighted in the red box. The overestimations shown in the density plots align with the positive MBEs calculated in Table 2 for reprocessed data. The VIIRS CBH retrievals depend on its relationship with CTH and CGT, as shown in Equation (1). Consequently, the overestimations of low CBH are primarily caused by the overestimations of CTH for low clouds.
A comparison between the density plots of reprocessed and operational VIIRS CBH EDR against CloudSat-CALIPSO data for June 2019 is shown Figure A2. Most matchups between the operational data and the “truth” deviate to the right of the 1:1 agreement line, indicating a slight underestimation. Additionally, a substantial number of matchups with a “true” CBH below 5 km are overestimated by the operational CBH algorithm. Since the updated CBH retrieval algorithm relies on the difference between CTH and CGT, as shown in Equation (1), the significant overestimation of low CBH is attributed to the overestimation of CTH for low clouds. This combination of under- and over-estimations accounts for the smaller negative MBEs in the operational CBH data compared to the reprocessed data for April to June 2019. Furthermore, clouds with base heights above 13 km are rarely captured or are filtered out due to low quality in the operational product, while the reprocessed VIIRS CBH product exhibits improvements in these aspects.
Figure 8 and Figure 9 are CBH comparison plots for the case studies of 1 May 2019, 20:00:46–20:03:25 UTC, and 8 June 2019, 08:11:27–08:14:06 UTC. Similarly to the CTH, the reprocessed VIIRS CBH yields higher estimates for thick clouds and lower values for thin clouds in the 1 May 2019 case study. The negative differences between the two datasets are most significant along the boundaries between these cloud types. Both the reprocessed and operational VIIRS CBH data overestimate the CloudSat-CALIPSO measurements by approximately 2 km for thick altostratus clouds between 57.6 ° S and 64 ° S latitude, with the operational data performing slightly better in this region. Conversely, the reprocessed VIIRS EDR accurately captures the CBH of altostratus and nimbostratus clouds with lower CTH values, although with some fluctuations. The operational VIIRS EDR produces inaccurate CBH estimates in this region, with values even higher than the actual CTH. Considering the physical limitations of passive remote sensing methods for cloud retrieval, it is understandable that CBH retrievals, particularly in multi-layer cloud conditions, may not be as accurate as active sensors.
In the case study of 8 June 2019, both the reprocessed and operational VIIRS CBH algorithms underestimate the CloudSat-CALIPSOs in most matchups; however, they effectively capture the general trends and patterns of the “true” CBHs. The reprocessed VIIRS CBH exhibits more significant underestimations over low-base nimbostratus clouds compared to the operational data. Similarly to CTH retrievals, the VIIRS CBH estimations display sharp fluctuations over multi-layer clouds. The reprocessed VIIRS CBH also shows higher underestimations for the low and thin stratus clouds over the 53 ° S–48 ° S latitude. In summary, the new CBH algorithm shows greater sensitivity to the boundary regions between different cloud types and to signals emitted by ground objects. This increased sensitivity is likely due to the reprocessing of input SDRs and upstream CTHs, which impact the CGT calculation results.

6. Discussion

This study conducts the reprocessing of VIIRS CTH and CBH EDR based on the latest algorithms and performs simultaneous evaluation of the reprocessing accuracy for a study period of 1 October 2018~30 June 2019. The qualities of the reprocessed VIIRS cloud height EDRs are compared with both the operational Version 2.0 data and CloudSat-CALIPSO active sensors through statistical metrics, probability density patterns, case studies, and correlation analysis. Based on this comprehensive assessment, this study has reached the following conclusions and discussions regarding the reprocessing quality of VIIRS CTH and CBH EDRs:
(1)
The reprocessed VIIRS CTH EDRs show relatively high quality for single-layer clouds, which is comparable to the operational data, with enhanced retrieval accuracy for high-top clouds, particularly those above 15 km.
(2)
With quality controls on upstream CTH retrievals, the reprocessed CBH product demonstrates higher correlations and fewer outliers compared to CloudSat-CALIPSO measurements than the operational data across all overlapping periods.
(3)
The new VIIRS CBH algorithm enhances the retrieval of very high CBH values above 13 km compared to the operational data, but it is less accurate in estimating low CTH values. This could be due to the upgrade in the microphysical index (β) fitting method from a linear to a higher-order polynomial, which provides more degrees of freedom and leads to overfitting. The overfitting results in increased fluctuations when estimating low CTH values.
(4)
Both the reprocessed VIIRS CTH and CBH EDRs exhibit greater sensitivity to the boundary regions of different cloud heights and are more effective in detecting and representing these dynamics in adjacent clouds. However, ground signals tend to have a stronger influence on the new CBH algorithm over these boundary areas, introducing more fluctuations in the cloud height estimations produced by the reprocessing algorithm.
(5)
Both reprocessed and operational cloud height products show lower accuracies and greater uncertainties over multi-layer clouds observed by the active sensors of the CloudSat-CALIPSO system. This is understandable given the limited capability of passive remote sensing sensors to penetrate the internal structures of cloud systems.
(6)
The reprocessed CTH data tend to underestimate high cloud tops and overestimate low cloud tops. The underestimation of high CTH is largely due to active sensors being more sensitive to the tops of very high and optically thin clouds, whereas passive IR sensors have limitations to detect these tenuous uppermost layers. Additionally, emissions from lower atmospheric layers beneath high clouds can cause the cloud-top temperature detected by IR sensors to be higher than the actual cloud-top temperature, leading the algorithm to assign a lower CTH. On the other hand, the overestimation of low CTH may be due to the limited capability of passive sensors like VIIRS to accurately estimate the features of optically thick clouds.
(7)
The parallax issue also introduces bias in the comparison between VIIRS and CloudSat-CALIPSO data by causing a displacement between cloud observations in the two datasets. This occurs because passive sensors like VIIRS observe clouds at an angle rather than directly from above, resulting in a shift in the detected cloud position compared to the nadir-viewing active sensors on CloudSat and CALIPSO.

7. Conclusions

Overall, the performance of the SNPP-VIIRS CTH and CBH EDR reprocessing based on the latest algorithm is quite promising, demonstrating significant improvements in the retrievals of clouds at high altitudes and in the sensitivity to cloud height dynamics. In the future, the study will focus on the following aspects:
(1)
Calibration changes across different maturity levels of input SDR introduce inconsistencies in the operational SNPP VIIRS EDRs, resulting in spurious trends in long-term climate change analysis and monitoring. Additionally, artificial fluctuations and inconsistencies in long-term EDR data are also caused by changes in retrieval algorithms. Therefore, it is critical to reprocess the SNPP VIIRS EDR products over the whole sensor lifetime with uniform input data sources and retrieval algorithms to avoid deceptive trends and dynamics that are non-climate change signals. As a result, future studies will focus on reprocessing all kinds of VIIRS EDRs over the entire lifespan of the sensor, including clouds, ice thickness and age, snow cover, etc.
(2)
As more VIIRS EDR variables are reprocessed in the future, including Cloud Cover Layer (CCL), Cloud Phase (CP), Daytime/Nighttime Cloud Optical and Microphysical Properties (D/NCOPMP), Snow Cover, and Ice Thickness and Age, their quality will be assessed.
(3)
With the entire lifecycle of VIIRS EDRs reprocessed, the long-term spatiotemporal patterns of these reprocessed EDRs will be analyzed and compared with both operational VIIRS products and measurements from active sensors.
(4)
Using the long-term reprocessed EDRs for climate change assessment. Due to the relatively short history of VIIRS data (~14 years), we plan to develop new algorithms, particularly leveraging Artificial Intelligence (AI) technologies, to retrieve VIIRS EDRs using spectral data from satellite sensors with longer data records and similar wavelengths, such as MODIS. This approach aims to reduce biases caused by differences between satellite sensors, including spatiotemporal resolution, retrieval algorithms, geolocation accuracy, and product availability.

Author Contributions

Q.L.: algorithm deployment, data processing, conceptualization, investigation, visualization, writing—original draft. X.H.: computational environment setup, algorithm deployment. C.-Z.Z.: conceptualization, supervision, writing—review and editing, funding acquisition. L.W.: funding acquisition, writing—review and editing. J.J.Q.: conceptualization, funding acquisition, writing—review and editing. B.Y.: funding acquisition, writing—review and editing. All authors have read and agreed to the published version of the manuscript.

Funding

This study was supported by NOAA grant NA24NESX432C0001 (Cooperative Institute for Satellite Earth System Studies-CISESS) at the University of Maryland/ESSIC.

Data Availability Statement

VIIRS Operational data are from the NOAA Comprehensive Large Array-data Stewardship System (CLASS, https://www.aev.class.noaa.gov/saa/products/search?sub_id=0&datatype_family=RPVIIRSSDR&submit.x=32&submit.y=13, Accessed Date: 1 September 2024); The CloudSat-CALIPSO data are from the Data Processing Center (DPC) at Colorado State University: https://www.cloudsat.cira.colostate.edu/, Accessed Date: 1 October 2024.

Conflicts of Interest

The authors declare that they have no known competing financial interests or personal relationships that could have appeared to influence the work reported in this paper. The scientific results and conclusions, as well as any views or opinions expressed herein, are those of the authors and do not necessarily reflect those of NOAA or the Department of Commerce.

Appendix A

Table A1. Table of version changes in CTH algorithm [29].
VersionChanges
Version 2.0 to 2.3(1) Support of combinations of multiple channels, including the following: 6.2, 6.7, 7.3, 8.5, 10.4, 11, 12, 13.3, 13.6, 13.9, and 14.2 μm; (2) flexibility of using 10.4 μm to replace 11 μm observations (GOES-17 only); (3) changes in microphysical index β fitting from linear to high-order polynomial to account for multiple scattering impact of the 3.75 μm; (4) including ice fraction as the fifth output from the optimal estimation algorithm.
Version 2.3 to 3.2Changes are made to reflect all current supported channel combinations and include in Appendix A the GOES17 mitigation work. Some other updates, such as use of the KD-tree technique and NUCAPS data, are also briefly discussed.
Table A2. Regression coefficients and median CWP binning by CTH (every 2 km), which are used to compute CGT for CBH.
Cloud Top Height (km)CWP Thresholds
(g/m2)
Constant a
(Slope)
Constant b
(y-int)
0 < CTH < 2712.25810.4056
0.99700.5170
2 ≤ CTH < 41146.10980.6648
0.91301.3570
4 ≤ CTH < 611011.55741.2253
1.37922.5866
6 ≤ CTH < 812314.53821.7057
1.68713.6228
8 ≤ CTH < 101319.09862.1425
2.45953.8696
10 ≤ CTH < 1212713.57721.8655
4.83093.5314
12 ≤ CTH < 1411516.07931.6497
5.05173.9861
14 ≤ CTH < 1611614.60302.0001
6.06444.0330
16 ≤ CTH999.26582.2964
6.60433.2644
Table A3. Period of each data type used in the study.
DatasetPeriod
Reprocessed VIIRS EDR10 October 2018~7 July 2019
Operational VIIRS EDR10 March 2019~7 July 2019
the 2B-CLDCLASS-LIDAR10 October 2018~7 July 2019
Figure A1. Comparison of density plots between reprocessed and operational VIIRS CTH against CloudSat-CALIPSOs for June 2019 as “truth”.
Remotesensing 17 01036 g0a1
Figure A2. Comparison of density plots between reprocessed and operational VIIRS CBH against CloudSat-CALIPSOs for June 2019 as “truth”.
Remotesensing 17 01036 g0a2
Table A4. Quality control (QC) flags of reprocessed VIIRS CBH.
QC FlagsDefinition
0Valid retrieval
1Invalid due to the upstream input being invalid or clear
2Out of range due to CBH lower than terrain (set to TBH = terrain)
3Out of range due to CBH < minCBH (0 km) or CBH > maxCBH (20 km)
4Invalid due to CBH ≥ CTH
5Valid CBH from the extinction method
6Valid CBH from CWP_NWP for deep convection
Table A5. Quality flags of operational VIIRS CBH.
QC FlagsDefinition
0Good Retrieval
1Invalid Retrieval
2Bad Retrieval

References

  1. Liu, Q.; Xu, H.; Houser, P.R.; Sun, D.; Rice, M.; Wang, L.; Duffy, D.Q.; Yang, C. Cross-track infrared sounder cloud fraction retrieval using a deep neural network. Comput. Geosci. 2023, 170, 105268. [Google Scholar] [CrossRef]
  2. Liu, Q.; Xu, H.; Sha, D.; Lee, T.; Duffy, D.Q.; Walter, J.; Yang, C. Hyperspectral infrared sounder cloud detection using deep neural network model. IEEE Geosci. Remote Sens. Lett. 2020, 19, 1–5. [Google Scholar]
  3. Bony, S.; Stevens, B.; Frierson, D.M.; Jakob, C.; Kageyama, M.; Pincus, R.; Shepherd, T.G.; Sherwood, S.C.; Siebesma, A.P.; Sobel, A.H.; et al. Clouds, circulation and climate sensitivity. Nat. Geosci. 2015, 8, 261–268. [Google Scholar]
  4. Stephens, G.L.; Webster, P.J. Clouds and climate: Sensitivity of simple systems. J. Atmos. Sci. 1981, 38, 235–247. [Google Scholar]
  5. Simpson, J.J.; McIntire, T.; Jin, Z.; Stitt, J.R. Improved cloud top height retrieval under arbitrary viewing and illumination conditions using AVHRR data. Remote Sens. Environ. 2000, 72, 95–110. [Google Scholar] [CrossRef]
  6. Hamann, U.; Walther, A.; Baum, B.; Bennartz, R.; Bugliaro, L.; Derrien, M.; Francis, P.N.; Heidinger, A.; Joro, S.; Kniffka, A.; et al. Remote sensing of cloud top pressure/height from SEVIRI: Analysis of ten current retrieval algorithms. Atmos. Meas. Tech. 2014, 7, 2839–2867. [Google Scholar] [CrossRef]
  7. Liu, Q.; Sha, D.; Liu, W.; Houser, P.; Zhang, L.; Hou, R.; Lan, H.; Flynn, C.; Lu, M.; Hu, T.; et al. Spatiotemporal patterns of COVID-19 impact on human activities and environment in mainland China using nighttime light and air quality data. Remote Sens. 2020, 12, 1576. [Google Scholar] [CrossRef]
  8. Tan, Z.; Huo, J.; Ma, S.; Han, D.; Wang, X.; Hu, S.; Yan, W. Estimating cloud base height from Himawari-8 based on a random forest algorithm. Int. J. Remote Sens. 2021, 42, 2485–2501. [Google Scholar]
  9. Cao, C.; Xiong, X.; Blonski, S.; Liu, Q.; Guenther, B.; Weng, F. Suomi NPP VIIRS on-orbit performance, data quality, and new applications. In Earth Observing Missions and Sensors: Development, Implementation, and Characterization II; SPIE: Pune, India, 2012; Volume 8528, pp. 49–56. [Google Scholar]
  10. Skoufias, E.; Strobl, E.; Tveit, T. Can we rely on VIIRS nightlights to estimate the short-term impacts of natural hazards? Evidence from five South East Asian countries. Geomat. Nat. Hazards Risk 2021, 12, 381–404. [Google Scholar]
  11. Sun, S.; Li, L.; Wu, Z.; Gautam, A.; Li, J.; Zhao, W. Variation of industrial air pollution emissions based on VIIRS thermal anomaly data. Atmos. Res. 2020, 244, 105021. [Google Scholar]
  12. Butler, J.J.; Xiong, X.; Barnes, R.A.; Patt, F.S.; Sun, J.; Chiang, K. An overview of Suomi NPP VIIRS calibration maneuvers. Earth Obs. Syst. XVII 2012, 8510, 603–615. [Google Scholar]
  13. Xiong, X.; Butler, J.; Chiang, K.; Efremova, B.; Fulbright, J.; Lei, N.; McIntire, J.; Oudrari, H.; Sun, J.; Wang, Z.; et al. VIIRS on-orbit calibration methodology and performance. J. Geophys. Res. Atmos. 2014, 119, 5065–5078. [Google Scholar] [CrossRef]
  14. Xiong, X.; Sun, J.; Fulbright, J.; Wang, Z.; Butler, J.J. Lunar calibration and performance for S-NPP VIIRS reflective solar bands. IEEE Trans. Geosci. Remote Sens. 2015, 54, 1052–1061. [Google Scholar] [CrossRef]
  15. Xiong, X.; Butler, J.J. MODIS and VIIRS calibration history and future outlook. Remote Sens. 2020, 12, 2523. [Google Scholar] [CrossRef]
  16. Xiong, X.; Angal, A.; Chang, T.; Chiang, K.; Lei, N.; Li, Y.; Sun, J.; Twedt, K.; Wu, A. MODIS and VIIRS calibration and characterization in support of producing long-term high-quality data products. Remote Sens. 2020, 12, 3167. [Google Scholar] [CrossRef]
  17. Weisz, E.; Li, J.; Menzel, W.P.; Heidinger, A.K.; Kahn, B.H.; Liu, C.Y. Comparison of AIRS, MODIS, CloudSat and CALIPSO cloud top height retrievals. Geophys. Res. Lett. 2007, 34, L17811. [Google Scholar] [CrossRef]
  18. Li, Y.; Baum, B.A.; Heidinger, A.K.; Menzel, W.P.; Weisz, E. Improvement in cloud retrievals from VIIRS through the use of infrared absorption channels constructed from VIIRS+ CrIS data fusion. Atmos. Meas. Tech. 2020, 13, 4035–4049. [Google Scholar] [CrossRef]
  19. Heidinger, A.K.; Pavolonis, M.J.; Holz, R.E.; Baum, B.A.; Berthier, S. Using CALIPSO to explore the sensitivity to cirrus height in the infrared observations from NPOESS/VIIRS and GOES-R/ABI. J. Geophys. Res. Atmos. 2010, 115. [Google Scholar]
  20. Noh, Y.J.; Forsythe, J.M.; Miller, S.D.; Seaman, C.J.; Li, Y.; Heidinger, A.K.; Lindsey, D.T.; Rogers, M.A.; Partain, P.T. Cloud-base height estimation from VIIRS. Part II: A statistical algorithm based on A-Train satellite data. J. Atmos. Ocean. Technol. 2017, 34, 585–598. [Google Scholar] [CrossRef]
  21. Seaman, C.J.; Noh, Y.J.; Miller, S.D.; Heidinger, A.K.; Lindsey, D.T. Cloud-base height estimation from VIIRS. Part I: Operational algorithm validation against CloudSat. J. Atmos. Ocean. Technol. 2017, 34, 567–583. [Google Scholar] [CrossRef]
  22. Zou, C.Z.; Zhou, L.; Lin, L.; Sun, N.; Chen, Y.; Flynn, L.E.; Zhang, B.; Cao, C.; Iturbide-Sanchez, F.; Beck, T.; et al. The reprocessed Suomi NPP satellite observations. Remote Sens. 2020, 12, 2891. [Google Scholar] [CrossRef]
  23. Thuillier, G.; Hersé, M.; Labs, D.; Foujols, T.; Peetermans, W.; Gillotay, D.; Simon, P.C.; Mandel, H. The solar spectral irradiance from 200 to 2400 nm as measured by the SOLSPEC spectrometer from the ATLAS and EURECA missions. Sol. Phys. 2003, 214, 1–22. [Google Scholar]
  24. Heidinger, A.K.; Li, Y. Enterprise AWG Cloud Height Algorithm (ACHA) Version 3.2. 2018. Available online: https://www.ssec.wisc.edu/~daves/ACHA_ATBD.pdf (accessed on 8 November 2024).
  25. Heidinger, A.K.; Pavolonis, M.J.; Calvert, C.; Hoffman, J.; Nebuda, S.; Straka, W., III; Walther, A.; Wanzong, S. ABI cloud products from the GOES-R series. In The GOES-R Series; Elsevier: Amsterdam, The Netherlands, 2020; pp. 43–62. [Google Scholar]
  26. Menzel, W.P.; Frey, R.A.; Baum, B.A.; Zhang, H. Cloud Top Properties and Cloud Phase—Algorithm Theoretical Basis Document. 2006. Available online: https://modis.gsfc.nasa.gov/data/atbd/atbd_mod04.pdf (accessed on 8 November 2024).
  27. Zhang, H.; Menzel, W.P. Improvement in thin cirrus retrievals using an emissivity-adjusted CO2 slicing algorithm. J. Geophys. Res. Atmos. 2002, 107, AAC-2. [Google Scholar]
  28. Heidinger, A.K.; Bearson, N.; Foster, M.J.; Li, Y.; Wanzong, S.; Ackerman, S.; Holz, R.E.; Platnick, S.; Meyer, K. Using sounder data to improve cirrus cloud height estimation from satellite imagers. J. Atmos. Ocean. Technol. 2019, 36, 1331–1342. [Google Scholar] [CrossRef]
  29. Heidinger, A.K.; Li, Y.; Wanzong, S. Enterprise AWG Cloud Height Algorithm (ACHA) Version 3.4. 2020. Available online: https://www.star.nesdis.noaa.gov/jpss/documents/ATBD/ATBD_EPS_Cloud_ACHA_v3.4.pdf (accessed on 8 November 2024).
  30. Hutchison, K.D. The retrieval of cloud base heights from MODIS and three-dimensional cloud fields from NASA’s EOS Aqua mission. Int. J. Remote Sens. 2002, 23, 5249–5265. [Google Scholar] [CrossRef]
  31. Hutchison, K.; Wong, E.; Ou, S.C. Cloud base heights retrieved during night-time conditions with MODIS data. Int. J. Remote Sens. 2006, 27, 2847–2862. [Google Scholar] [CrossRef]
  32. Marchand, R.; Mace, G.G.; Ackerman, T.; Stephens, G. Hydrometeor detection using CloudSat—An Earth-orbiting 94-GHz cloud radar. J. Atmos. Ocean. Technol. 2008, 25, 519–533. [Google Scholar] [CrossRef]
  33. Friedman, J.H.; Bentley, J.L.; Finkel, R.A. An algorithm for finding best matches in logarithmic expected time. ACM Trans. Math. Softw. 1977, 3, 209–226. [Google Scholar]
  34. Bentley, J.L. K-d trees for semidynamic point sets. In Proceedings of the Sixth Annual Symposium on Computational Geometry, New York, NY, USA, 7–9 June 1990; pp. 187–197. [Google Scholar]
  35. Doraiswamy, H.; Natarajan, V.; Nanjundiah, R.S. An exploration framework to identify and track movement of cloud systems. IEEE Trans. Vis. Comput. Graph. 2013, 19, 2896–2905. [Google Scholar] [CrossRef]
  36. Tan, Z.; Zhao, X.; Hu, S.; Ma, S.; Wang, L.; Wang, X.; Ai, W. Climatology of Cloud Base Height Retrieved from Long-Term Geostationary Satellite Observations. Remote Sens. 2023, 15, 3424. [Google Scholar] [CrossRef]
  37. Dong, Y.; Sun, X.; Li, Q. A method for retrieving cloud-top height based on a machine learning model using the Himawari-8 combined with near infrared data. Remote Sens. 2022, 14, 6367. [Google Scholar] [CrossRef]
  38. Yang, X.; Ge, J.; Hu, X.; Wang, M.; Han, Z. Cloud-top height comparison from multi-satellite sensors and ground-based cloud radar over SACOL site. Remote Sens. 2021, 13, 2715. [Google Scholar] [CrossRef]
  39. Holz, R.E.; Ackerman, S.A.; Nagle, F.W.; Frey, R.; Dutcher, S.; Kuehn, R.E.; Vaughan, M.A.; Baum, B. Global Moderate Resolution Imaging Spectroradiometer (MODIS) cloud detection and height evaluation using CALIOP. J. Geophys. Res. Atmos. 2008, 113, D00A19. [Google Scholar] [CrossRef]
  40. Heidinger, A.K.; Foster, M.J.; Walther, A.; Zhao, X. The Pathfinder Atmospheres–Extended AVHRR climate dataset. Bull. Am. Meteorol. Soc. 2012, 95, 909–922. [Google Scholar] [CrossRef]
  41. Di Michele, S.; McNally, T.; Bauer, P.; Genkova, I. Quality assessment of cloud-top height estimates from satellite IR radiances using the CALIPSO lidar. IEEE Trans. Geosci. Remote Sens. 2012, 51, 2454–2464. [Google Scholar]
  42. Sporre, M.K.; O’Connor, E.J.; Håkansson, N.; Thoss, A.; Swietlicki, E.; Petäjä, T. Comparison of MODIS and VIIRS cloud properties with ARM ground-based observations over Finland. Atmos. Meas. Tech. 2016, 9, 3193–3203. [Google Scholar]
  43. Marchand, R.; Ackerman, T.; Smyth, M.; Rossow, W.B. A review of cloud top height and optical depth histograms from MISR, ISCCP, and MODIS. J. Geophys. Res. Atmos. 2010, 115, D16206. [Google Scholar]
  44. Bilbao, I.; Bilbao, J. December. Overfitting problem and the over-training in the era of data: Particularly for Artificial Neural Networks. In Proceedings of the 2017 Eighth International Conference on Intelligent Computing and Information Systems (ICICIS), Cairo, Egypt, 5–7 December 2017; pp. 173–177. [Google Scholar]
Figure 1. Flowchart of spatiotemporal collocation between VIIRS and CloudSat-CALIPSO data.
Remotesensing 17 01036 g001
Figure 2. Histograms of probability density for reprocessed VIIRS (blue), operational VIIRS (orange), and CloudSat-CALIPSO (green) CTH data for March–June 2019.
Remotesensing 17 01036 g002
Figure 3. Scatter plots comparing reprocessed VIIRS CTH retrievals and CloudSat-CALIPSO measurements in November 2018, January 2019, March 2019, and June 2019. The color indicates the probability density function (PDF) at corresponding CTH values based on Kernel density estimation. The green box highlights the overestimations for low CTH values, and the red box highlights the underestimations for high CTH values.
Remotesensing 17 01036 g003
Figure 4. Comparison among reprocessed (a) and operational (b) SNPP-VIIRS CTH on 1 May 2019, 20:00:46–20:03:25 UTC, and their comparisons to the CloudSat-CALIPSO measurements (d). (c) is (a,b).
Remotesensing 17 01036 g004
Figure 5. Comparison among reprocessed (a) and operational (b) SNPP-VIIRS CTH on 8 June 2019, 08:11:27~08:14:06 UTC, and their comparisons to the CloudSat-CALIPSO measurements (d). (c) is (a,b).
Remotesensing 17 01036 g005
Figure 6. Histograms of probability density for reprocessed VIIRS (blue), operational VIIRS (orange), and CloudSat-CALIPSO (green) CBH data for March–June 2019.
Remotesensing 17 01036 g006
Figure 7. Scatter plots comparing reprocessed VIIRS CBH retrievals and CloudSat-CALIPSO measurements in November 2018, January 2019, March 2019, and June 2019. The color indicates the probability density function (PDF) at corresponding CBH values based on Kernel density estimation. The red box highlights the overestimations for low CBH values.
Remotesensing 17 01036 g007
Figure 8. Comparison among reprocessed (a) and operational (b) SNPP-VIIRS CBH on 1 May 2019, 20:00:46–20:03:25 UTC, and their comparisons to the CloudSat-CALIPSO measurements (d). (c) is (a,b).
Remotesensing 17 01036 g008
Figure 9. Comparison among reprocessed (a) and operational (b) SNPP-VIIRS CBH on 8 June 2019, 08:11:27~08:14:06 UTC, and their comparisons to the CloudSat-CALIPSO measurements (d). (c) is (a,b).
Remotesensing 17 01036 g009
Table 1. Accuracy statistics of reprocessed VIIRS CTH based on quality-controlled VIIRS–CloudSat matchups for each month in the study period. The corresponding results of operational VIIRS EDR algorithm are listed in the brackets.
Reprocessed (Operational) R 2 RMSE (km)MBE (km)Accurate%Valid Pixel Amount
October 20180.772.31−0.8112.3431,673
November 20180.762.50−1.0112.0245,828
December 20180.792.42−0.8112.9147,233
January 20190.802.34−0.7612.5161,464
February 20190.812.26−0.6515.6961,649
March 20190.82
(0.85)
2.14
(2.12)
−0.70
(−0.97)
12.83
(15.57)
47,503
(39,961)
April 20190.72
(0.84)
2.64
(2.12)
−0.96
0.88)
12.91
(15.02)
24,961
(34,319)
May 20190.69
(0.82)
2.84
(2.32)
−1.29
(−1.23)
13.31
(11.26)
65,841
(82,873)
June 20190.73
(0.85)
2.66
(2.32)
−1.10
(−1.31)
13.27
(12.69)
75,206
(74,818)
Table 2. Accuracy statistics of reprocessed VIIRS CBH based on quality-controlled VIIRS–CloudSat matchups for each month in the study period. The results of operational VIIRS EDR algorithm are listed in the brackets.
Reprocessed (Operational) R 2 RMSE (m)MBEAccurate%Valid Pixel Amount
October 20180.741.890.6310.689680
November 20180.751.890.4210.4615,444
December 20180.771.890.4711.1017,563
January 20190.771.910.4410.8519,851
February 20190.761.880.4710.9020,517
March 20190.77
(0.76)
1.90
(1.85)
0.55
(0.64)
10.25
(11.14)
16,683
(18,922)
April 20190.74
(0.73)
1.73
(1.76)
0.36
(0.10)
11.90
(13.27)
8747
(15,842)
May 20190.76
(0.74)
1.70
(1.73)
0.34
(−0.06)
12.10
(12.55)
21,022
(41,046)
June 20190.74
(0.69)
1.74
(1.72)
0.43
(−0.15)
12.32 (12.95)21,670 (32,807)
Disclaimer/Publisher’s Note: The statements, opinions and data contained in all publications are solely those of the individual author(s) and contributor(s) and not of MDPI and/or the editor(s). MDPI and/or the editor(s) disclaim responsibility for any injury to people or property resulting from any ideas, methods, instructions or products referred to in the content.

