Article

Remote Sensing Identification and Analysis of Global Building Electrification (2012–2023)

1
International Research Center of Big Data for Sustainable Development Goals, State Key Laboratory of Remote Sensing Science, Aerospace Information Research Institute, Chinese Academy of Sciences, Beijing 100094, China
2
University of Chinese Academy of Sciences, Beijing 100049, China
3
International Cooperation Office, Aerospace Information Research Institute, Chinese Academy of Sciences, Beijing 100094, China
*
Author to whom correspondence should be addressed.
Remote Sens. 2025, 17(5), 777; https://doi.org/10.3390/rs17050777
Submission received: 12 January 2025 / Revised: 18 February 2025 / Accepted: 21 February 2025 / Published: 23 February 2025
(This article belongs to the Special Issue Big Earth Data in Support of the Sustainable Development Goals)

Abstract

:
The accurate collection of spatially distributed electrification data is considered of great importance for tracking progress toward target 7.1 of the sustainable development goals (SDGs) and the formulation of policy decisions on electricity access issues. However, the existing datasets face severe limitations in terms of temporal discontinuity and restricted threshold selection. To effectively address these issues, in this work, an improved remote sensing method was proposed to monitor global building electrification. By integrating global land cover data, built-up area data, and annual NPP/VIIRS nighttime light images, a regional threshold method was used to identify electrified and unelectrified areas yearly, generating a global building electrification dataset for 2012–2023. Based on our analysis, we found the following: (1) The five assessment metrics of the product—Accuracy (0.9856), Precision (0.9734), Recall (0.9984), F1-score (0.9858), and Matthews Correlation Coefficient (0.9715)—all exceed 0.9, demonstrating that our method achieves high reliability in identifying electrified buildings. (2) In 2023, 91.88% of global building areas were electrified, with the unelectrified buildings being predominantly located in rural regions of developing countries. (3) Between 2012 and 2023, the global electrified building area increased by 2.4199 million km2, with rural areas experiencing a faster growth rate than town areas. The annual reduction rate of unelectrified building area was 0.62%. However, to achieve universal electricity access by 2030, this rate must nearly double. (4) External factors such as the COVID-19 pandemic, extreme weather events, and armed conflicts significantly affect global electrification progress, with developing countries being particularly vulnerable. In our work, remote sensing methodologies and datasets for monitoring electrification trends were refined, and a detailed spatial representation of unelectrified areas worldwide was provided.

1. Introduction

Undoubtedly, electricity is crucial for both socio-economic development and the growth of economic sectors [1]. To advance global electricity access, the United Nations 2030 Agenda for Sustainable Development identifies SDG7.1.1, which measures electrification rates (ERs) as a key indicator for SDG7. However, World Bank (WB) data show that the global electricity supply gap is widening as population growth outpaces the expansion of electricity access [2]. In 2022, the global population without electricity increased for the first time, with 685 million people still lacking access. Of these people, over 570 million are located in Sub-Saharan Africa, accounting for more than 80% of the global unelectrified population [3]. Between 2019 and 2021, the growth rate of global electrification slowed, largely due to the COVID-19 pandemic and the complexities of providing electricity to remote and impoverished areas [4]. Therefore, obtaining continuous electrification data for each country by accurately identifying the distribution of unelectrified populations and analysing the trends and causes of electrification over the past decade is crucial for accelerating progress toward achieving SDG7.
The ER, defined as the proportion of the population with access to electricity, is considered a key indicator of a country’s level of electrification. Currently, the global ER data are regularly published by the International Energy Agency (IEA) and the WB [2,5,6]. These data are obtained through traditional statistical survey methods, which present several challenges: these methods are time-consuming, labour-intensive, and costly; historical data are also missing for some countries; in certain developing nations, political instability has led to a lack of statistical agencies, resulting in gaps in electrification data; and disparities in statistical capabilities across countries affect the quality and comparability of the recorded data. Furthermore, the indicator ER has its limitations. While it indicates the number of people without electricity access in a country, it lacks spatial precision and geographic coordinates. For investment decisions, the collection of spatially explicit electrification data with geographic coordinates offers more accurate support for decision-making.
Given these challenges, the development of remote sensing (RS) methods for monitoring global electrification is emerging as a useful tool that complements traditional statistical surveys. RS technology offers comparative advantages such as global coverage, periodic observations, and long-term data acquisition, making it a popular tool in monitoring progress toward the SDGs. The Chinese Academy of Sciences has published the Big Earth Data in Support of the SDGs report for six consecutive years, summarizing research achievements in spatial information monitoring for the SDGs [7]. In 2022, this report was expanded to include the goal of affordable and clean energy (SDG7), with a focus on electricity supply, renewable energy, and international energy cooperation [8].
As built-up areas are the main centres of human activity, the concept of ER was adapted here to define the building electrification rate. This approach reflects the proportion of a country’s electrified buildings relative to its total building area, providing an overview of the country’s overall electrification status. Numerous research works in the literature have demonstrated that nighttime light (NTL) RS can effectively detect urban lights, low-intensity lights in small residential areas, and traffic, distinguishing them from the dark, non-urban background, thereby enabling the spatial monitoring of the electrification progress [9,10,11,12]. Min et al. used DMSP/OLS (Defense Meteorological Satellite Program/Operational Linescan System) NTL imagery combined with ground survey data from villages in Senegal and Mali to study rural ERs. The authors found that the brightness of electrified villages consistently exceeded that of unelectrified ones, confirming the feasibility of using NTL imagery to monitor global ERs [12]. Subsequently, Min and Gaba’s study in Vietnam revealed that even rural areas without public streetlights could be detected by DMSP/OLS NTL imagery, with the brightness level increasing with the addition of every 60–70 streetlights or 240–270 electrified houses [13]. Dugoua et al. explored the correlation between the NTL values from 2011 DMSP/OLS NTL images and the number of electrified households in rural India. A strong correlation in linear models was found, although the detection accuracy declined under unstable power supply conditions [14]. Salat et al. utilized NOAA’s 2013 NTL image to calculate NTL intensity for each Voronoi cell to assess ERs in Senegal, which aligned well with the census data [15]. In another interesting work, Ramdani et al. manually defined different brightness intervals using DMSP/OLS NTL images to evaluate the electrification progress in Indonesia in 1993, 2003, and 2013 [16]. Bertheau et al. compared NPP/VIIRS (National Polar-orbiting Partnership/Visible Infrared Imaging Radiometer Suite) NTL imagery with the IEA’s ERs, analysing the impact of NTL thresholds on identifying electrified areas in Sub-Saharan Africa [17]. Andrade-Pacheco et al. employed DMSP/OLS NTL images, using geostatistical methods to denoise, and produced a probability map of electricity access in Africa from 2000 to 2013 [18]. Falchetta et al. set thresholds to eliminate the calibration noise and transient lights from 2014 and 2018 NPP/VIIRS NTL images, identifying electrified and unelectrified areas. The authors also created a 1 km resolution dataset of electrification status in Sub-Saharan Africa [19]. However, their study did not account for the distribution of light values in electrified areas and failed to exclude water bodies with elevated light values. Principe et al. used DMSP-OLS and VIIRS-DNB annual average data, setting thresholds of 0 nW·cm⁻2·sr⁻1 and 5 nW·cm⁻2·sr⁻1 and treating pixels below these thresholds as unelectrified. Electrified areas in the Asia-Pacific region from 2000 to 2016 were identified [20]. However, the high threshold set for VIIRS-DNB NTL imagery led to the under-identification of many electrified areas. Moreover, although the utilization of only NTL imagery with threshold methods can identify electrified areas, the unelectrified building (UNEB) regions cannot be detected. To achieve universal electrification, it is essential to incorporate built-up area data for accurate identification, as recognising UNEB areas is more crucial for government decision-making. Gao et al. improved upon this by creating a sample library and selecting the NTL value with the highest classification accuracy as the threshold for identifying electrified areas in NPP/VIIRS NTL images. In parallel, and for the first time, built-up area data were combined to produce a 500 m resolution global dataset for the electrification status in major towns in 2014 and 2020 [21].
These studies confirm the scientific validity and feasibility of using NTL RS to monitor global electrification status. By combining threshold methods with built-up area data, the successful monitoring of global building electrification has also been demonstrated. However, there are several issues that must be addressed: (1) NPP/VIIRS NTL imagery is affected by stray light, leading to radiance variations caused by latitude differences and angular effects [22,23,24]. This effect renders the single threshold unreliable for assessing electrification in high-latitude regions. (2) The existing works in the literature have largely failed to monitor the electrification of rural areas worldwide. (3) The detectable brightness of lights is affected by various factors, such as epidemics [25,26], seasons [27], natural disasters (e.g., earthquakes [28,29]), and holiday periods [30]. Consequently, the annual average NTL imagery might inaccurately represent actual electrification in areas with unstable power supply, particularly in rural regions with high population mobility [14,15,17,19,20,21]. (4) The currently available RS-based electrification monitoring products lack temporal continuity and do not include data from the past three years, limiting the ability to track dynamic changes in global electrification over time.
To address these issues, an enhanced RS method for achieving accurate global building electrification monitoring was proposed in this work, with the following key objectives: (1) Developing a regional threshold method to mitigate misestimation of electrification status resulting from latitudinal variations in NTL radiance. (2) Expanding monitoring coverage to include all building grid cells within built-up area data, and separately assessing electrification status across city, township, and rural scales. (3) Combining the annual median NPP/VIIRS NTL imagery (med_VNL) and the annual maximum NPP/VIIRS NTL imagery (max_VNL) to minimize noise in unelectrified areas and improve the accuracy of detecting short-term human habitation [23]. (4) Producing a global building electrification monitoring product for the years 2012–2023, enabling the long-term tracking and assessment of SDG7.1.

2. Study Area and Datasets

2.1. Study Area

Due to the influence of the Earth’s curvature, terrain, and climatic conditions, NPP/VIIRS NTL imagery experiences data gaps in high-latitude regions [22]. Therefore, the study area was limited to countries and regions between 75°N and 65°S to ensure consistency within the coverage of the NTL imagery (Figure 1) [23]. The mapping data comprise the unprocessed 2023 annual maximum composite NTL data, the United Nations M49 standard regional map, and Google imagery.

2.2. Data

2.2.1. NPP/VIIRS Annual NTL Imagery

Currently, the most widely used NTL images include DMSP/OLS and NPP/VIIRS. The DMSP/OLS NTL imagery, with a spatial resolution of 1 km, covers images from 1992 to 2013 [31]. However, due to the limitations of the OLS sensor, such as a Digital Number (DN) value ceiling of 63, high-brightness areas often exhibit light saturation [32]. In 2011, NASA launched the Suomi NPP satellite, which features the next-generation VIIRS sensor, offering significant improvements in sensitivity, dynamic range, and spatial resolution. Numerous works have demonstrated that NPP/VIIRS NTL imagery outperforms DMSP/OLS in various applications [22,33,34,35,36,37,38,39].
Annual NPP/VIIRS NTL imagery at a 500 m spatial resolution for 2012–2023, using the GCS_WGS_1984 coordinate system, can be freely downloaded from the Earth Observation Group (EOG) website (https://eogdata.mines.edu, accessed on 1 March 2024). The V2.x series of NPP/VIIRS data incorporates several advancements, including the use of ‘vcmsl’ day data corrected for stray light to enhance coverage in polar regions. These daily observations are synthesized into monthly composites and further processed using maximum, median, average, and minimum value methods to produce annual products. This approach not only improves data comparability but also reduces preprocessing time, making it highly suitable for long-term change detection studies. Specifically, the max_VNL product performs better in monitoring dimly lit areas such as suburban roads and villages, while the med_VNL product is more effective in removing transient background noise [23,40]. We used max_VNL and med_VNL from the V2.1 (2012–2021) and V2.2 (2022–2023) products.

2.2.2. Global Human Settlement Layer

The Global Human Settlement Layer (GHSL), developed by the European Commission’s Joint Research Centre (JRC), integrates satellite imagery from Sentinel-1/2, Spot 4/5, and Landsat 4-8, utilizing advanced Symbolic Machine Learning and artificial intelligence methods [41]. Derived from GHSL, the GHS-BUILT-S_GLOBE_R2023A dataset provides global built-up area grid data at 100 m and 1 km spatial resolutions, available in the Mollweide coordinate system. This dataset, freely accessible for download (https://ghsl.jrc.ec.europa.eu, accessed on 1 March 2024), covers five-year intervals from 1975 to 2030, with data for 2020, 2025, and 2030 projected based on historical spatial and temporal trends [42]. According to the GHSL definition, ‘built-up areas’ refers to any ground structures used for shelter or economic production [43].
To ensure temporal alignment with the NPP/VIIRS Annual NTL Imagery and provide a detailed representation of built-up areas, we utilized the 100 m resolution data from the GHS-BUILT-S R2023 dataset for the years 2010, 2015, and 2020. Each 100 m grid cell in the GHSL raster represents the proportional size of the built-up area within that cell, enabling precise spatial analysis of urbanization patterns.

2.2.3. ESA_CCI Land Cover Data

The European Space Agency’s (ESA) Climate Change Initiative (CCI) land cover raster dataset provides global high-resolution (300 m) land cover classification information using the GCS_WGS_1984 coordinate system [44]. This dataset, based on data from ENVISAT’s MERIS instrument and subsequent Sentinel satellites, is designed to support climate change monitoring and prediction. It includes 38 land cover types, such as ‘190’ for ‘urban areas’, ‘210’ for ‘water bodies’, and ‘220’ for ‘permanent snow and ice’. The data can be freely downloaded from the Copernicus Climate Change Service (C3S) website (https://cds.climate.copernicus.eu, accessed on 1 March 2024). Version 2.0.7 covers the years 1992–2015, while version 2.1.1 includes data from 2016 onwards. The global land cover data from 2012 to 2022 were used.

2.2.4. Field Survey Data

According to WB statistics, China achieved universal electricity access after 2013. However, Gao et al. found that among countries reported to have 100% electrification in 2014, the electrified built-up area in China’s major urban regions was only 89.39% in 2014 and 97.86% in 2020. This contradicts the WB’s conclusion of universal electrification. High-resolution satellite imagery analysis revealed that unelectrified built-up areas were primarily concentrated in Henan, where the electrified built-up area was approximately 79.07% in 2014 and 85.29% in 2020 [21]. This suggests that a substantial number of electrified villages were not detected.
To investigate these discrepancies and refine the dataset, the research team conducted field surveys in Henan from 15 June to 20 June 2023, randomly selecting 24 villages classified as unelectrified in Gao et al.’s 2014 dataset. The survey methods included: (1) On-site observation: Around 9:00 PM, the extent of the built-up areas in the villages was observed to verify the accuracy of the GHSL and check for light produced by the houses. (2) Interviews: Residents were randomly interviewed to understand the status of vacant houses, electricity usage habits, and daily routines. The survey results are listed in Table S3, which can be used to analyse the monitoring effect and purpose of the electrified buildings (EBs) in rural areas. Meanwhile, it is important to note that due to significant differences in artificial lighting usage habits, the correction applied to Henan Province, China, may not be applicable to other regions or countries.

2.3. Data Preprocessing

The 100 m GHSLs were aggregated to a 500 m resolution to match the spatial resolution of NTL imagery. To classify built-up areas into different urbanization levels, we adopted a threshold-based approach informed by both prior research and a comprehensive case study. Specifically, regions with a built-up area percentage ≥25% were classified as ‘city’ (including city centres, large townships, and large villages), those with <25% but ≥7% as ‘township’ (including suburban, medium townships, and medium villages), and those with <7% as ‘rural’ (mainly small villages and isolated single-family structures). This classification scheme enables the analysis of the building electrification status at multiple scales, with ‘city’ and ‘township’ collectively referred to as ‘town’ when compared to rural areas.
The 25% threshold was adopted based on Gao et al., who demonstrated that classifying areas with a built-up area percentage ≥25% significantly enhances electrification monitoring accuracy [21]. This threshold effectively delineates urban centers, large towns, and sizable villages, allowing for direct comparison with Gao et al.’s electrification products. The 7% threshold was derived from a case study integrating high-resolution historical imagery and WB electrification data. Using WB 2022 electrification data, we randomly selected 500 villages and towns of a certain size across 133 fully electrified countries, including China, the United States, and Australia. Testing multiple thresholds (≥1%, 2%, 3%, …, 15%) revealed that 7% consistently achieved over 99% accuracy in identifying electrified EBs, and this threshold effectively delineates village and town boundaries in the sample. Rural areas, defined by a built-up area percentage of <7%, comprise approximately 32.89% of the global built-up area. Accurately identifying UNEBs within these regions is crucial for monitoring progress toward universal electrification and achieving SDG7.

3. Methodology

An improved method for the RS monitoring of the global building electrification status was proposed. First, a random sample library was constructed by extracting non-built-up areas’ med_VNL from GHSLs as unelectrified samples (UNESs) and max_VNL from built-up areas as electrified samples (ESs). All samples were overlaid with ESA_CCI land cover data to remove outliers and visually verified using high-resolution RS images. Two-thirds of the samples were used for classification, while one-third was used for validation. Next, based on the latitude variation of med_VNL marine background radiance and the spatial distribution of the two sample types, the NTL imagery was divided into seven regions by latitude. Annual Max_VNL and med_VNL data were overlaid to visually identify UNESs within the ES set and noise samples within the UNES set. The average of the minimum values for ESs and the maximum values for UNESs from effective samples was calculated as the classification threshold for each year and region, to distinguish between the electrified and unelectrified areas. Finally, GHSLs were used to mask and denoise the classification results. The detailed technical process flow is shown in Figure 2.

3.1. Sample Creation and Validation

Ideally, no lighting exists in non-built-up areas, making them suitable for selecting UNESs and simplifying the sample selection process. GHSLs were classified into built-up and non-built-up zones, which were subsequently overlaid on NTL imagery. Non-built-up area med_VNL data were randomly chosen as UNESs to minimize noise interference, while built-up area max_VNL data were selected as ESs to enhance the monitoring of short-term occupancy conditions. To avoid the impact of light spilling from built-up areas into UNESs, a 500 m buffer around built-up areas was created, and UNESs within this buffer were excluded.
To prevent GHSL errors from affecting the sample selection process, ESA_CCI land cover data from 2012 to 2022 were first overlaid to preliminarily filter out unsuitable samples. High-resolution RS images were then used to verify the accuracy of sample points individually, resulting in the removal of incorrect samples, including the following: (1) UNESs located in water bodies (ESA_CCI value ‘210’) or perennial snow regions (ESA_CCI value ‘220’), which have high reflectance and NTL values, making them difficult to distinguish from EBs. (2) Non-pure pixel samples. Since 500 m resolution grid pixels were resampled from 100 m built-up area data, building and non-building areas may become mixed, mainly including non-built-up area ESs (ESA_CCI value ‘190’) and built-up area UNESs (ESA_CCI value other than ‘190’). Additionally, the average value of UNESs over twelve years, ‘aveMED’, was calculated and controlled within the range of 2 nW·cm⁻2·sr⁻1, further excluding UNESs heavily affected by brightness value contamination by aurora.
Based on empirical rules and statistical practices, the data were divided into two-thirds for training and one-third for testing to ensure sufficient data for model training without compromising the reliability of model assessment. The final sample library included 627,276 sample points: (1) 209,428 UNESs and 208,756 ESs were used for classification, with a focus on selecting ESs from rural areas, especially dispersed villages. This ensures the accurate assessment of rural electrification status. (2) 104,546 samples each of unelectrified and electrified types were used for accuracy validation to ensure balanced assessment results. ESs in the validation set were mainly from township and city areas, which typically have a stable power supply, while UNESs were selected from areas with minimal noise.

3.2. Regional Identification of Electrified Areas

We randomly generated 309,758 sample points at 500 m intervals across global ocean surfaces, and then scatter plots of sample point radiance versus latitude were created by overlaying stable background med_VNL data. Based on our analysis, it was found that the radiance of annual med_VNL increased progressively with latitude from south to north, with a significant increase beyond 45°S and 55°N (Figure 3). This finding is largely consistent with the conclusions of Elvidge et al. [45]. Consequently, using a single threshold to assess electrification status could lead to errors, particularly in high-latitude regions. Latitude was employed as one of the key factors because it is associated with variations in residents’ nighttime rest periods resulting from changes in solar illumination duration and seasonal shifts [46], and also to reduce the influence of auroral activity on lighting patterns across different latitudinal regions. Therefore, we utilized a regional threshold method. This approach is effective for handling unevenly illuminated images. The imagery was divided into several regions, and the thresholds for each sub-region were calculated based on its characteristics, classifying the imagery as ‘1’ (objects) and ‘0’ (background) [47].
Meanwhile, the level of urban economic development demonstrates an overall positive trend in terms of population dynamics and urbanization, as evidenced by the spatial characteristics of built-up area expansion [48,49,50]. Given that economically developed countries typically exhibit larger and more numerous built-up areas, the random sample points generated based on these areas are proportionally greater. In contrast, the sparsely populated Southern Hemisphere yields fewer random sample points due to its limited built-up areas. Therefore, during the sub-region division process, we prioritized, ensuring that each region contained at least 30 UNESs and 30 ESs [51]. Given that the area south of 53°54′S in South America has almost no built-up areas or ESs (Figure 4), and considering the variability in oceanic background radiance [45], we finally divided the global NTL imagery into seven latitudinal zones, each spanning 20° of latitude. We also found that, after removing brightness value contamination by aurora from mid- to high-latitude areas, the annual radiance variations of background sample points showed no significant longitudinal dependence, remaining consistently within 0.3 nW·cm⁻2·sr⁻1. Consequently, we did not divide the longitude.
When the number of streetlights or electrically powered buildings in built-up areas increases, their brightness becomes detectable in NTL imagery. Consequently, the samples in those areas can be identified as ‘electrified’ and can be distinctly separated from unelectrified regions [19,20,21]. However, the minimum detectable radiance values exhibit unstable fluctuations due to factors such as human occupancy patterns, which influence the electrification status of buildings (i.e., whether they emit detectable light at night). If weights are directly calculated based on the sample library [21], the reliability of the results may be questionable. Since large-scale field surveys on building electrification rates are currently unfeasible, we overlaid annual max_VNL and med_VNL data by region, combined with visual inspection of ground truth data (e.g., high-resolution satellite imagery), to identify noise samples within UNESs and ESs. Taking 2023 as an example, the specific steps are as follows:
(1)
Image stretching: The 2023 max_VNL and med_VNL data were imported into ArcGIS, and a ‘standard deviation’ stretch method was applied to the image (Gamma = 0.5) to reduce contrast in darker areas and enhance contrast in brighter areas.
(2)
Determining the minimum radiance for actual ESs: High-resolution historical imagery and the ESs from the validation set were imported. The radiance of ESs was sorted in ascending order and examined individually until an ES was identified that both fell within a built-up area and exhibited a radiance distinctly different from surrounding pixels in the max_VNL. Its radiance was considered the minimum radiance for actual ESs.
(3)
Determining the maximum radiance for actual UNESs: The UNESs from the validation set were imported. Their radiance values were sorted in descending order and examined individually until a UNES was identified that both fell within a non-built-up area and exhibited a radiance consistent with surrounding non-built-up pixels in the med_VNL. Its radiance was considered the maximum radiance for actual UNESs.
(4)
Threshold calculation: A traditional mean value method was implemented to segment max_VNL data and distinguish electrified from unelectrified areas. The final output is a series of annual binary global NTL images, using the following calculation method:
V binary = A V E R A G E ( T D _ V min + n T D _ V max )
where V binary is the classification threshold for the sub-region, T D _ V min is the minimum radiance of actual ESs, and n T D _ V max is the maximum radiance of actual UNESs.

3.3. Accuracy Assessment

We employed five metrics—Accuracy, Precision, Recall, F1-score, and Matthews Correlation Coefficient (MCC)—to comprehensively evaluate the binary NTL images on an annual basis. Accuracy represents the proportion of correct predictions; Precision is the proportion of true positive samples among those predicted as positive; Recall refers to the proportion of actual positive samples correctly predicted; F1-score indicates the harmonic mean of Precision and Recall, assessing their balance; and MCC evaluates the overall performance of the classifier in binary classification problems. The range of the first four metrics is from 0 to 1, while MCC ranges from −1 to 1. Typically, higher values for these metrics indicate better performance. The accuracy and F1-score are most commonly used when classes are balanced, directly reflecting the overall correctness of the classification model, whereas MCC provides a more comprehensive assessment. The following formulas were used to calculate these metrics:
A c c u r a c y = T P + T N T P + T N + F P + F N Pr e c i s i o n = T P T P + F P Re c a l l = T P T P + F N F 1 - s c o r e = 2 × Pr e c i s i o n × Re c a l l Pr e c i s i o n + Re c a l l M C C = T P × T N - F P × F N ( T P + F P ) × ( T P + F N ) × ( T N + F P ) × ( T N + F N )
where True Positive ( T P ) is the number of positive samples that were correctly predicted as positive; True Negative ( T N ) is the number of negative samples that were correctly predicted as negative; False Positive ( F P ) is the number of negative samples that were incorrectly predicted as positive; and False Negative ( F N ) is the number of positive samples that were incorrectly predicted as negative. Here, ‘negative samples’ refers to unelectrified pixels (i.e., pixels with a value of 0 in the binary image), while ‘positive samples’ refers to electrified pixels (i.e., pixels with a value of 1 in the binary image).

3.4. Identification of Building Electrification Status

Building data from 2010, 2015, and 2020 were used to mask the binary images, thereby removing noise from non-built-up areas and enhancing the accuracy of the results. The specific correspondences are as follows: 2010 building data correspond to NTL images from 2012 to 2014; 2015 building data correspond to NTL images from 2015 to 2019; and 2020 building data correspond to NTL images from 2020 to 2023. Using this method, buildings located in electrified areas are classified as EBs, while those in unelectrified areas are classified as UNEBs. This process generated global building electrification status products for the years 2012–2023. By annually calculating the EB and UNEB areas for each country, the spatiotemporal dynamics of electrification status can be analysed. The calculation method for the proportion of EB and UNEB areas in each country is as follows:
R NW = A NW / A B R NB = A NB / A B
where A B is the total building area; R NW indicates the proportion of EB area; A NW is the EB area; R NB is the proportion of UNEB area; and A NB is the UNEB area.

4. Results

4.1. Determination of Thresholds for Electrified Buildings Across Global Regions

As shown in Figure 5, the classification thresholds for different regions of the world within the same year increase with latitude, with thresholds in the Northern Hemisphere being higher than those in the Southern Hemisphere. The reason is that the Northern Hemisphere has a larger land area, leading to a broader range of aurora-induced noise [45], resulting in a higher noise ceiling for UNESs. From 2012 to 2023, the classification thresholds for the same region also exhibited a trend of gradual increase each year, although there were fluctuations due to varying auroral activity. This trend became particularly evident after 2017, primarily due to adjustments in lunar corrections and the launch of the new satellite equipped with VIIRS (JPSS J1) in 2017 [52]. By analysing the distribution of radiance of the global ocean surface background across latitudes, the changes in the noise of the upper and lower limits of NTL images before and after 2017 were identified. Since 2017, the background values of NTL images have consistently shown positive radiance, whereas they typically showed massive zero radiance before that.

4.2. Accuracy Verification

Table 1 shows the results of the accuracy assessment. There were a total of 1947 FNs and 34,179 FPs. For all classification samples together, the accuracy was 0.9856, indicating a high level of classification accuracy; the Precision was 0.9734, meaning that most of the samples predicted as positive were indeed positive; the Recall was 0.9984, showing that the model was effective in identifying true positive samples; the F1-score was 0.9858, demonstrating a good balance between Precision and Recall; and the MCC was 0.9715, further confirming the robustness and reliability of the model. Overall, using the regional threshold method to determine whether built-up areas are electrified has a high accuracy rate.
To ensure consistency and comparability in product accuracy assessment, our study applied the same validation dataset to products from 2012 to 2023. The ESs in the dataset were primarily located in built-up areas with significant populations. As urbanisation progressed, these areas experienced population growth and improved electricity infrastructure, making nighttime illumination increasingly detectable via RS. Consequently, the number of FN pixels gradually decreased over time, in some cases approaching zero. However, as the existing validation dataset does not cover all building grids and no separate validation datasets were created for individual years, FN pixels may still occur in the 2023 product if extra ESs are collected from abandoned built-up areas.
We acknowledge the presence of artifacts in the processed images or data sources, which mainly fall into two categories: (1) Built-up area artifacts result primarily from the spatial resolution limitations of the data source. At a 500 m resolution, the VIIRS–DNB NTL product uses a maximum-value composite method. If an unoccupied building shares a grid cell with illuminated structures, it may be mistakenly classified as electrified. (2) Non-built-up area artifacts result primarily from noise in the VIIRS–DNB NTL product. For example, in the 2012 global binary NTL image (Figure 6), striping effects in the VIIRS sensor caused misclassification of the affected grid cells as electrified. Additionally, strong auroral activity in mid-to-high latitudes can interfere with the detection of electrified buildings, an issue that persists across different years and that can be assessed through annual FP counts.
Given the substantial noise pollution in the max_VNL background areas (such as auroras, city neon lights, fishing boats, and mining lights), the higher number of FPs compared to FNs is reasonable. Visual inspection revealed that FPs were primarily concentrated in the mid-to-high latitudes of the Northern Hemisphere and the high-latitude aurora regions of the Southern Hemisphere. Aurora pollution raised the noise ceiling, leading to misclassification of background areas as electrified. The highest number of FNs occurred in 2012, with 1,029 cases which were mainly in rural areas. High-resolution RS imagery analysis showed that these FPs were mostly scattered low-rise houses near farmland, likely temporary structures set up during busy farming seasons, with a low probability of being connected to the power grid.

4.3. Global Electrification Status Identification Results

To assess a country’s overall electrification status, the concept of ER was adopted to calculate the proportion of UNEB area in each country. The electrification status was categorized into six levels based on the proportion of unelectrified built-up area. A smaller proportion of UNEB area leads to a larger EB area, indicating better electrification. Detailed data on UNEB areas for each country are provided in Tables S1 and S2. Using a 100 km grid to depict our product, the visualized result of global building electrification status for 2022 (Figure 7) reflects a high consistency between the satellite-monitored UNEB areas and the distribution of unelectrified populations reported by the WB (Figure 8) [2]. The regions with insufficient electricity supply are primarily concentrated in Sub-Saharan Africa.
Since built-up areas represent major regions of human activity, residents living in EBs are more likely to have access to electricity services. Therefore, the annual trend in the proportion of EB areas globally from 2012 to 2023 (Figure 9) is also closely aligned with the trend in ERs (measured as a percentage of the population) reported by the WB from 2012 to 2022, which indicates that our product is suitable for temporal research on building electrification status.

5. Discussion

5.1. Comparison with Existing Methods

5.1.1. Global Accuracy Comparison

Three different methods were used to produce ER RS products for the years 2014 and 2020. The first method was based on the study by Gao et al. [21], which used ave_VNL and a single-threshold approach. In the second method, we used max_VNL for product generation without altering the threshold selection method. In the third method, we combined max_VNL with a regional threshold approach. Methods two and three used the same classification samples.
According to Table 2, the monitoring capabilities of the three methods were evaluated using 104,546 validation samples. The results showed the following: (1) Using a single-threshold method, the products based on max_VNL demonstrated a significant improvement in monitoring EBs compared to those based on ave_VNL. Recall increased by 6.09% in 2014 and 0.68% in 2020. (2) When using max_VNL, the regional threshold method further enhanced the monitoring ability of EBs compared to the single threshold method, with Recall improving by 1.95% in 2014 and 0.54% in 2020. (3) Compared to the products from Gao et al., our products achieved Recall improvements of 8.04% in 2014 and 1.22% in 2020. On balance, the max_VNL can significantly enhance the monitoring capabilities for human short-term residency, and the regional threshold method more accurately reflects the electrification status across different regions.

5.1.2. Accuracy Comparison in Rural Areas

The ER RS products generated by Gao et al. using ave_VNL only monitored areas with building coverage ≥25%, which were major urban areas. The authors used the 250 m built-up area data in 2014 from the GHSL R2019 version to assess EB for 2014 and 2020 [53], without considering the impact of new buildings. In contrast, we utilized 100 m built-up area data from the GHS-BUILT-S_GLOBE_R2023A version to monitor EB from 2012 to 2023, covering data for 2010, 2015, and 2020, thereby accounting for the impact of new constructions. The higher spatial resolution of the GHSL data also improved the accuracy of identifying electrification status in dispersed built-up areas. Additionally, we extended the monitoring coverage to rural areas, providing the first spatial depiction of unelectrified villages globally.
The field surveys of 24 villages in Henan revealed that all villages had a resident population of over 2,000 and were classified as large towns or large villages. According to resident interviews, all houses were electrified in 2014, though the installation of streetlights varied by village. In 2014, the only village with streetlights recorded was Dalizhuang Township, where the streetlights were installed by the local government. Other villages’ streetlights were primarily installed between 2019 and 2020. The field survey results showed that the original product identified electrified villages at rates of 4.17% and 54.17%, respectively, while our product achieved identification rates of 87.5% and 100% for the corresponding years (Table 2). Overall, at the town scale, the original product only identified villages with functioning streetlights, and ave_VNL often averaged out the temporary lighting from human activities, making it harder to monitor EBs.
As shown in Figure 10, the original product reported an EB area proportion of only 57.35% for Henan in 2014, while our product reached 89.84%. UNEBs were mainly located in the southern mountainous regions, where buildings are more dispersed and vacancy rates are higher. With ongoing rural infrastructure improvements by the Chinese government, the number of electrified houses and streetlights in rural areas has increased annually, contributing to the enhanced accuracy observed in the 2020 data. Based on resident interviews and relevant reports, nearly all 24 surveyed villages in Henan Province installed streetlights between 2019 and 2020 (Table S3), which significantly improved the detection of electrified buildings in rural areas. Overall, the ER products based on max_VNL significantly enhanced the monitoring of electrified rural houses, substantially reduced the number of temporarily ‘hollow villages’ detected, and improved the accuracy of identifying actual UNEBs. This has important implications for governments in effectively planning urban and rural development and avoiding unnecessary resource waste.

5.2. Analysis of Global Electrification Status Spatial Distribution Differences

As of 2023, the proportion of EBs globally is 91.88%, with 1.3513 million km2 of UNEBs, primarily concentrated in Africa and Asia, reflecting significant regional and urban–rural differences.
(1)
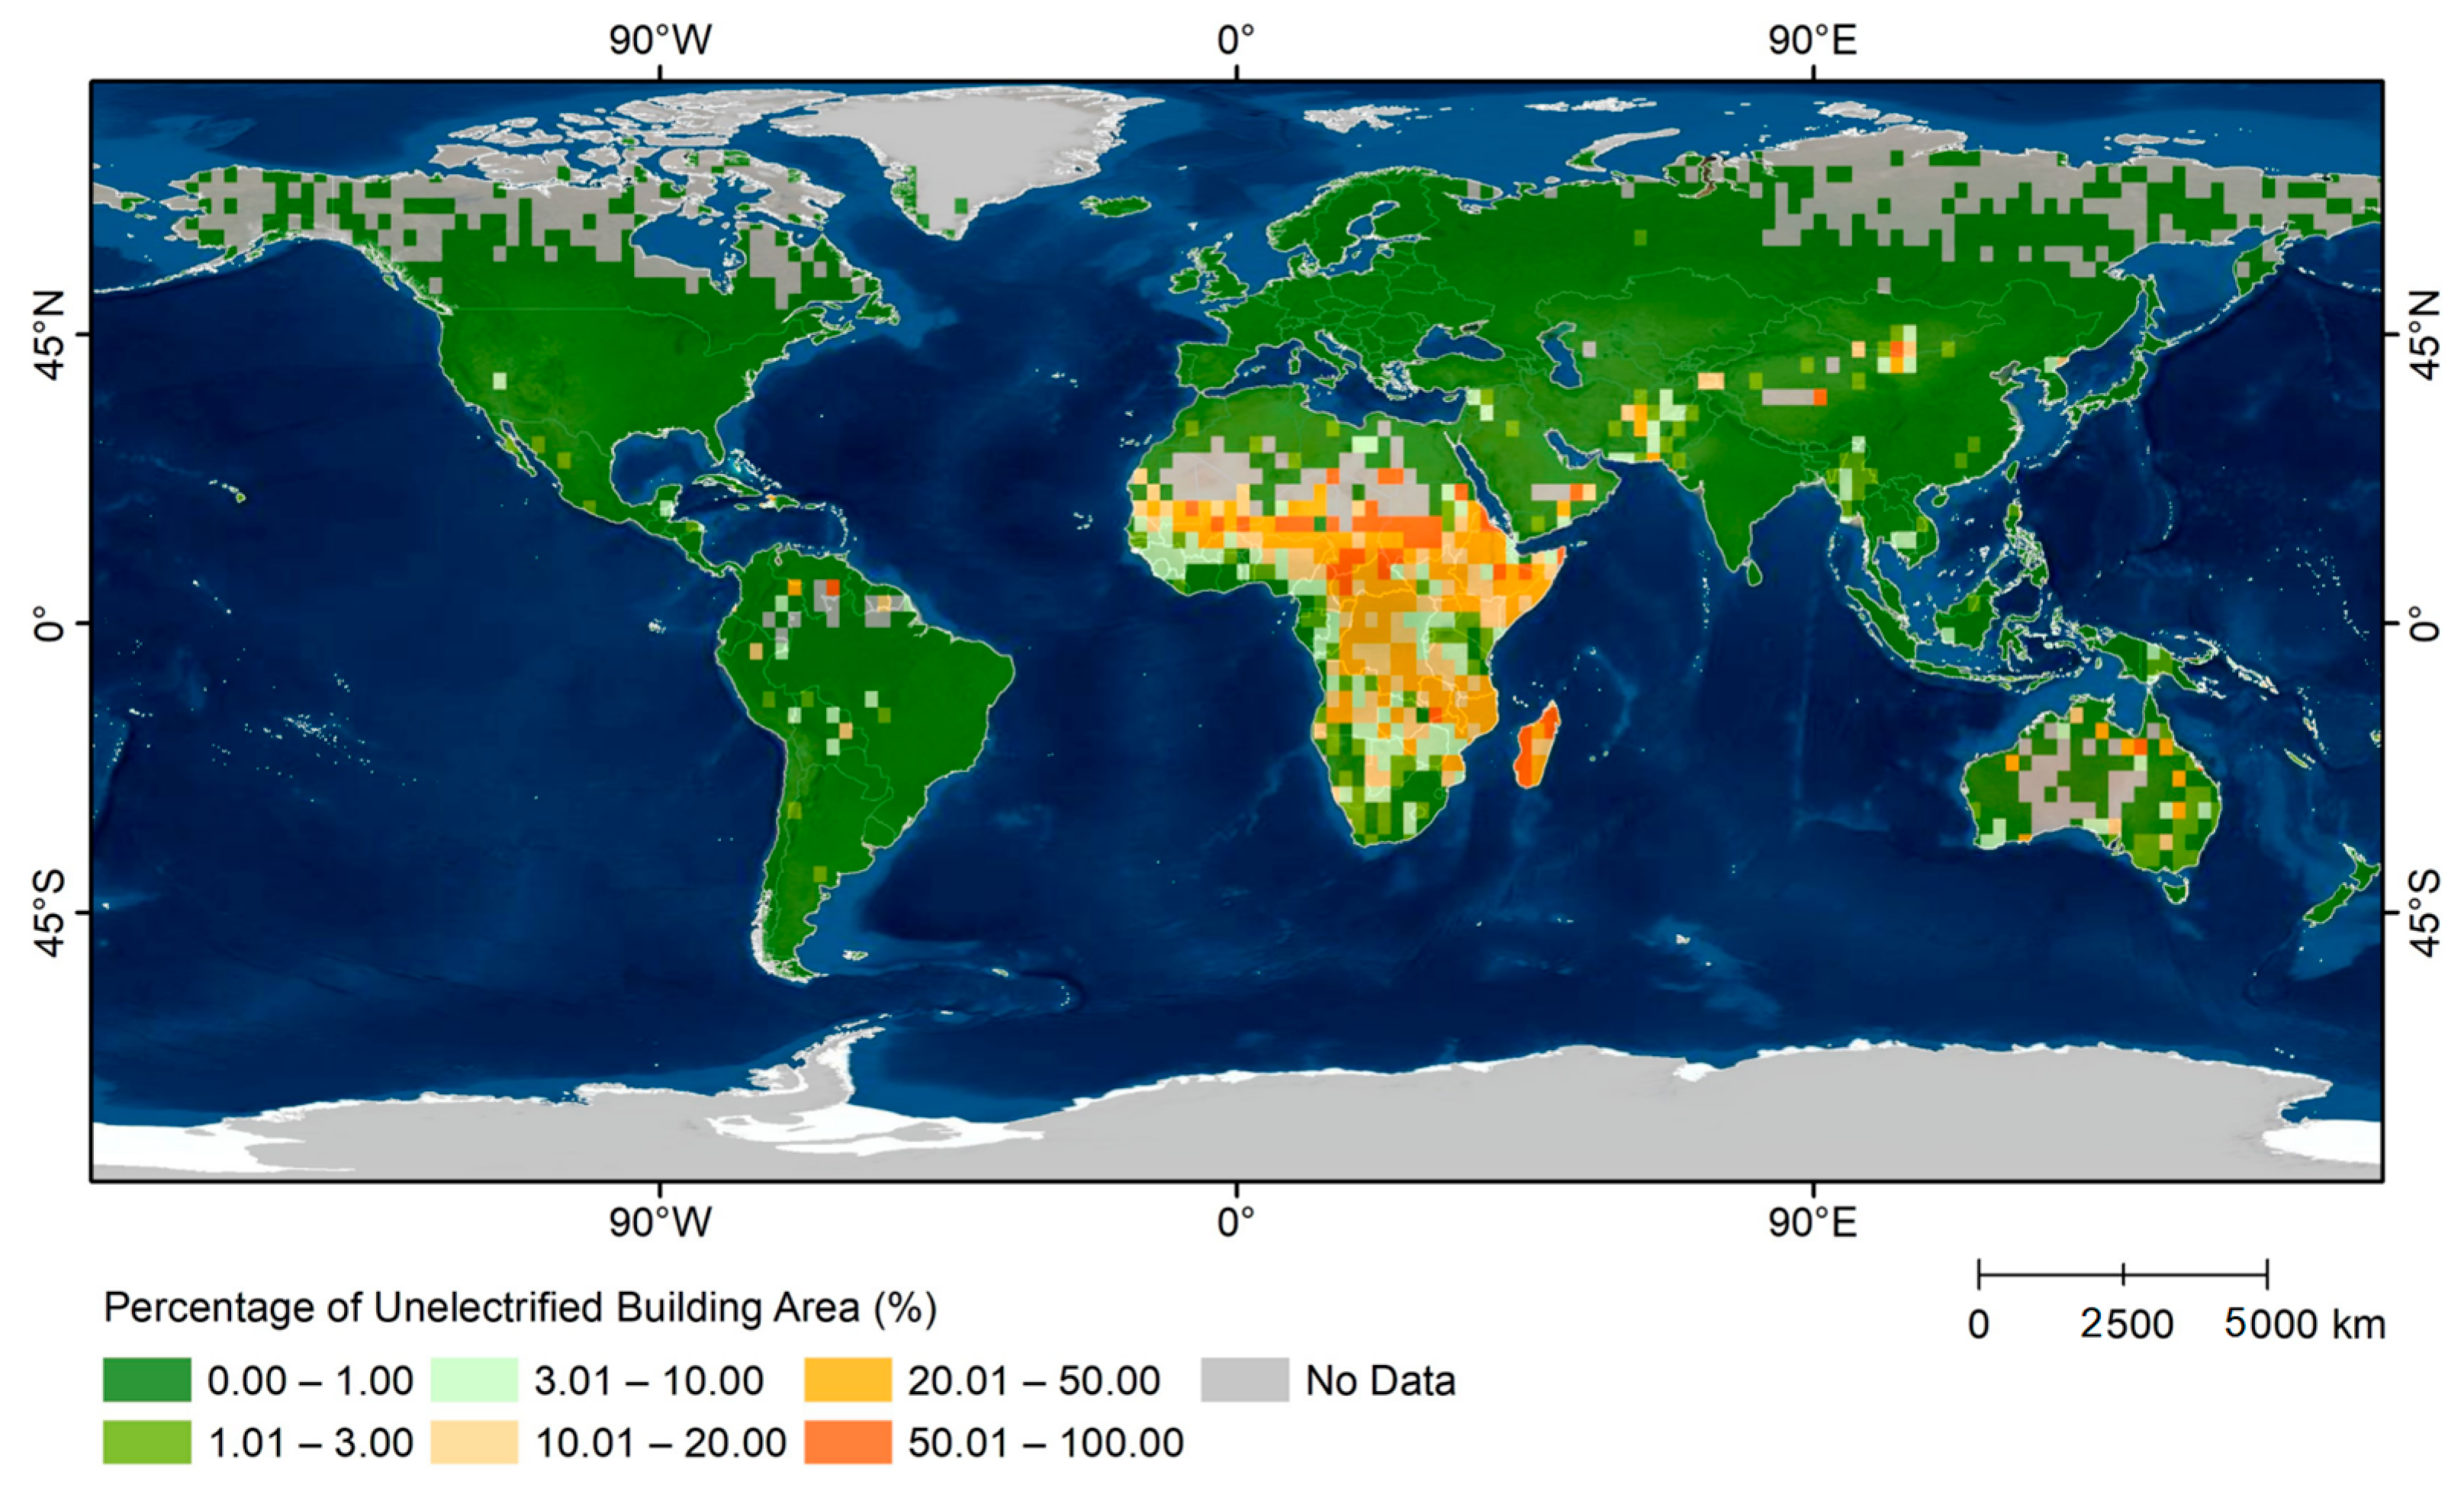
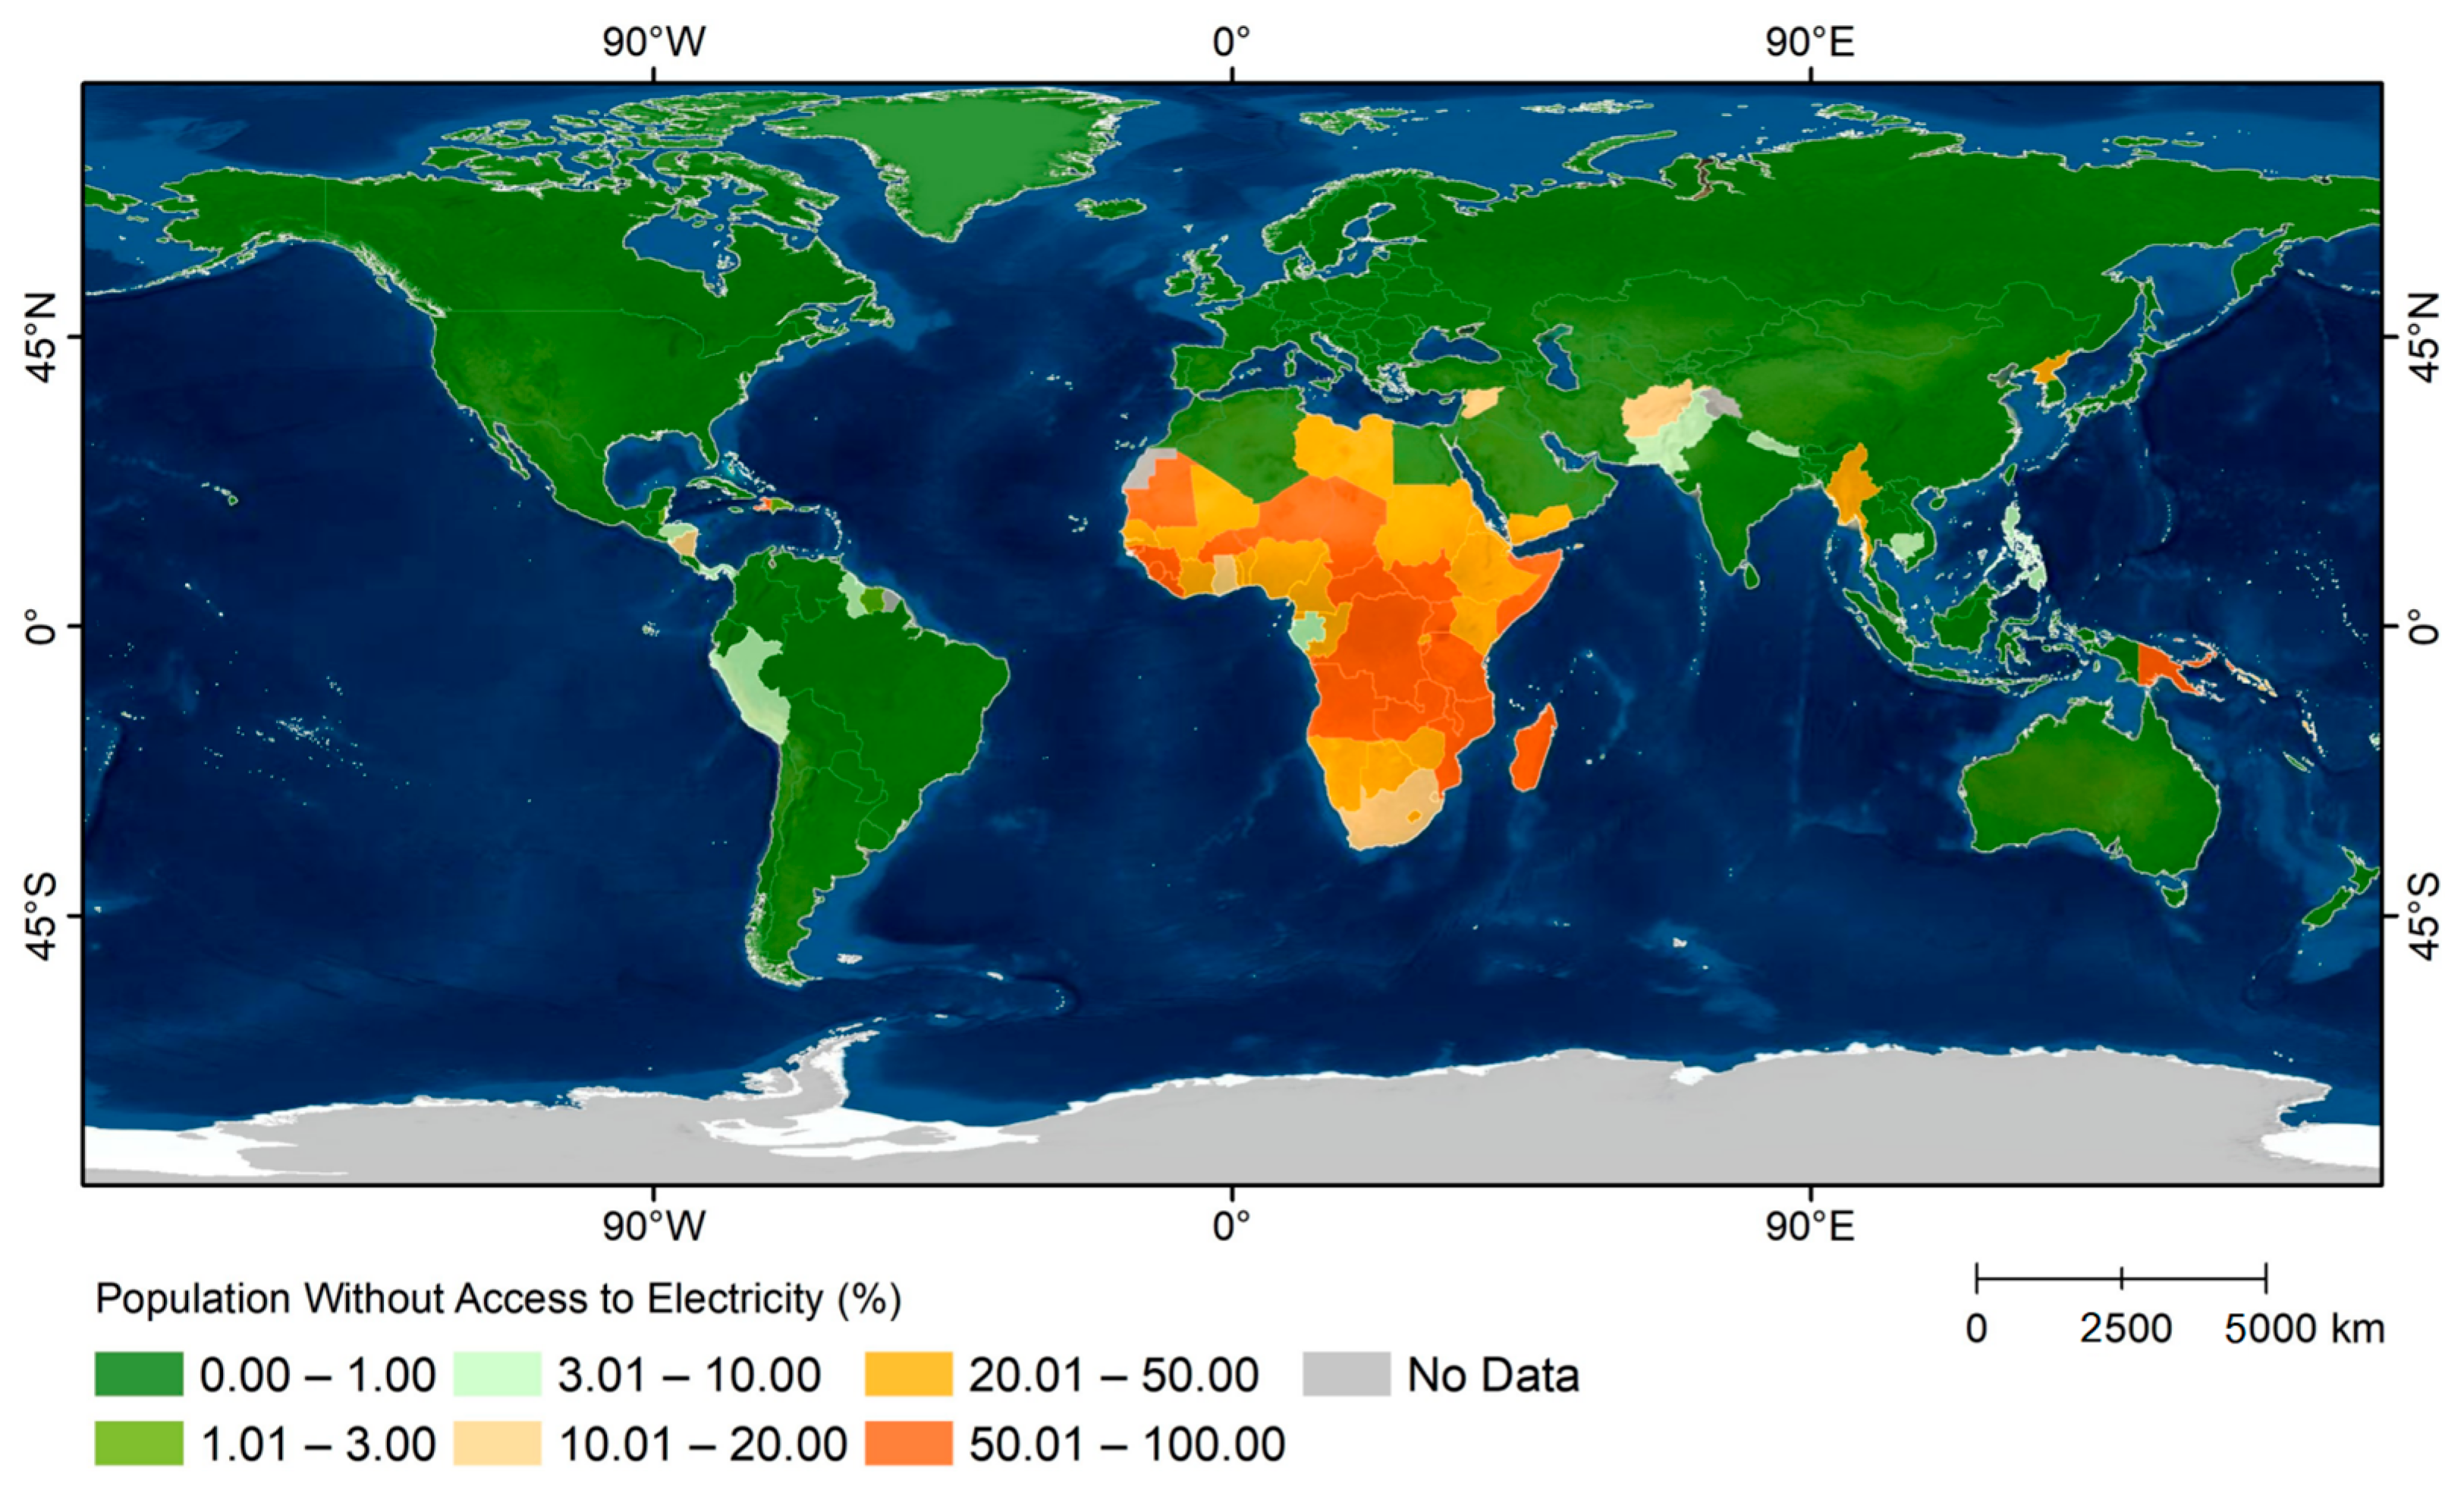
Regional differences: UNEBs are mainly found in developing countries. In developed nations and countries with mid-to-high development levels, the proportion of UNEBs is 4.07%. These countries have stronger economic foundations and better-developed electrical infrastructure. In contrast, the proportion of UNEBs in Least Developed Countries (LDC), Land Locked Developing Countries (LLDC), and Small Island Developing States (SIDS) is 44.10%, 37.46%, and 29.96%, respectively. Among the top 20 countries with the highest proportion of UNEBs, except for Pitcairn Islands and Norfolk Island, all are developing countries, with 70% located in Sub-Saharan Africa. Although the Pitcairn Islands and Norfolk Island are overseas territories of developed countries, their small size and limited resources result in a relatively high proportion of UNEBs.
(2)
Urban–rural differences: UNEBs are primarily concentrated in rural areas of developing countries. Globally, the proportion of UNEBs in rural areas (9.55%) is 11.5 times higher than that in town areas (0.83%). The proportions of UNEBs in city, township, and rural areas are 0.05%, 1.63%, and 98.32%, respectively. In countries where the proportion of UNEBs in towns is ≥1%, all 55 are developing countries, with 40 located in Sub-Saharan Africa. In these countries, the proportions of UNEBs in towns and rural areas are 14.99% and 52.48%, respectively. In rural areas, the proportion of UNEBs in developing countries (13.78%) is 4.23 times higher than in developed countries (3.26%). There are 97 countries where the proportion of UNEBs is ≥10%; except Australia and Uruguay, all are developing countries. The respective proportions of UNEBs in towns and rural areas are 99.36% and 57.79% in Australia, and 100% and 80.71% in Uruguay. Typically, there are small-scale UNEBs in rural areas, and investment in electrical infrastructure may be insufficient.
Combining regional and urban–rural differences, it can be seen that the proportion of UNEBs in rural areas of developing countries reaches 84.85% globally. Providing electricity to rural areas often requires significant government investment in electrical infrastructure. In developing countries, buildings in rural areas are dispersed, and the cost of installing a kilometre of transmission line can range from USD 11,000 to USD 15,000 or more [54,55]. Additionally, rural areas have lower electricity consumption and residents’ ability to pay compared to urban areas [56], making electrification projects typically low-return and high-risk [57]. In countries where the private sector dominates the electricity market, energy utility companies often prioritize high-profit potential and low-cost projects [58,59]. Therefore, in remote rural areas, considering fuel prices, transportation costs, and investment returns, developing wind-based or solar-based microgrids can be more cost-effective than extending the main power grid [60].

5.3. Analysis of Temporal Dynamics of Global Electrification Status

The transition of buildings from ‘unelectrified’ to ‘electrified’ indicates an improvement in electrification status. An increase in EBs signifies substantial progress, while a decrease suggests regression. By 2023, the global EB area had increased by 2.4199 million km2 compared to 2012, with the proportion rising by 6.79%. The electrification status has significantly improved overall; however, temporal changes in building electrification status vary markedly across different research scales.

5.3.1. Differences in Electrification Status of New Versus Existing Buildings

Between 2012 and 2023, the global total building area increased by 1.515 million km2, with 22.99% of the newly added building area remaining unelectrified. At the same time, the electrification status of existing buildings improved, with the proportion of UNEBs decreasing from 14.91% to 6.63%. New buildings are often concentrated in expanding urban areas, which may face various challenges, such as low occupancy rates and inadequate electrical infrastructure. Additionally, most factories in suburbs experience nighttime shutdowns due to external factors, which affect the monitoring capabilities of the actual electrification status of new buildings.

5.3.2. Comparative Analysis of Electrification Improvement Rates in City, Township, and Rural Areas

The rate of improvement in electrification status varies significantly among city, township, and rural areas, with rural areas showing higher improvement rates compared to city and township areas. In city areas, the proportion of UNEBs decreased from 0.36% to 0.12%, while in township areas, it decreased from 2.71% to 1.03%. As city and township areas are major centres of human activity, changes in building electrification status are relatively stable and less influenced by external factors. In contrast, the proportion of UNEBs in rural areas decreased from 17.17% to 9.55%, with an annual reduction rate exceeding that of city and township areas, indicating a faster reduction in UNEB area and significant improvement in electrification status in remote regions.

5.3.3. Regional Analysis of Global Changes in Building Electrification Status

To assist governments, businesses, and the international community in identifying regions with insufficient electrification, further analysis of the spatial distribution of buildings with improved or deteriorated electrification status is required. The changes in building electrification status from 2012 to 2023 reveal the following:
(1)
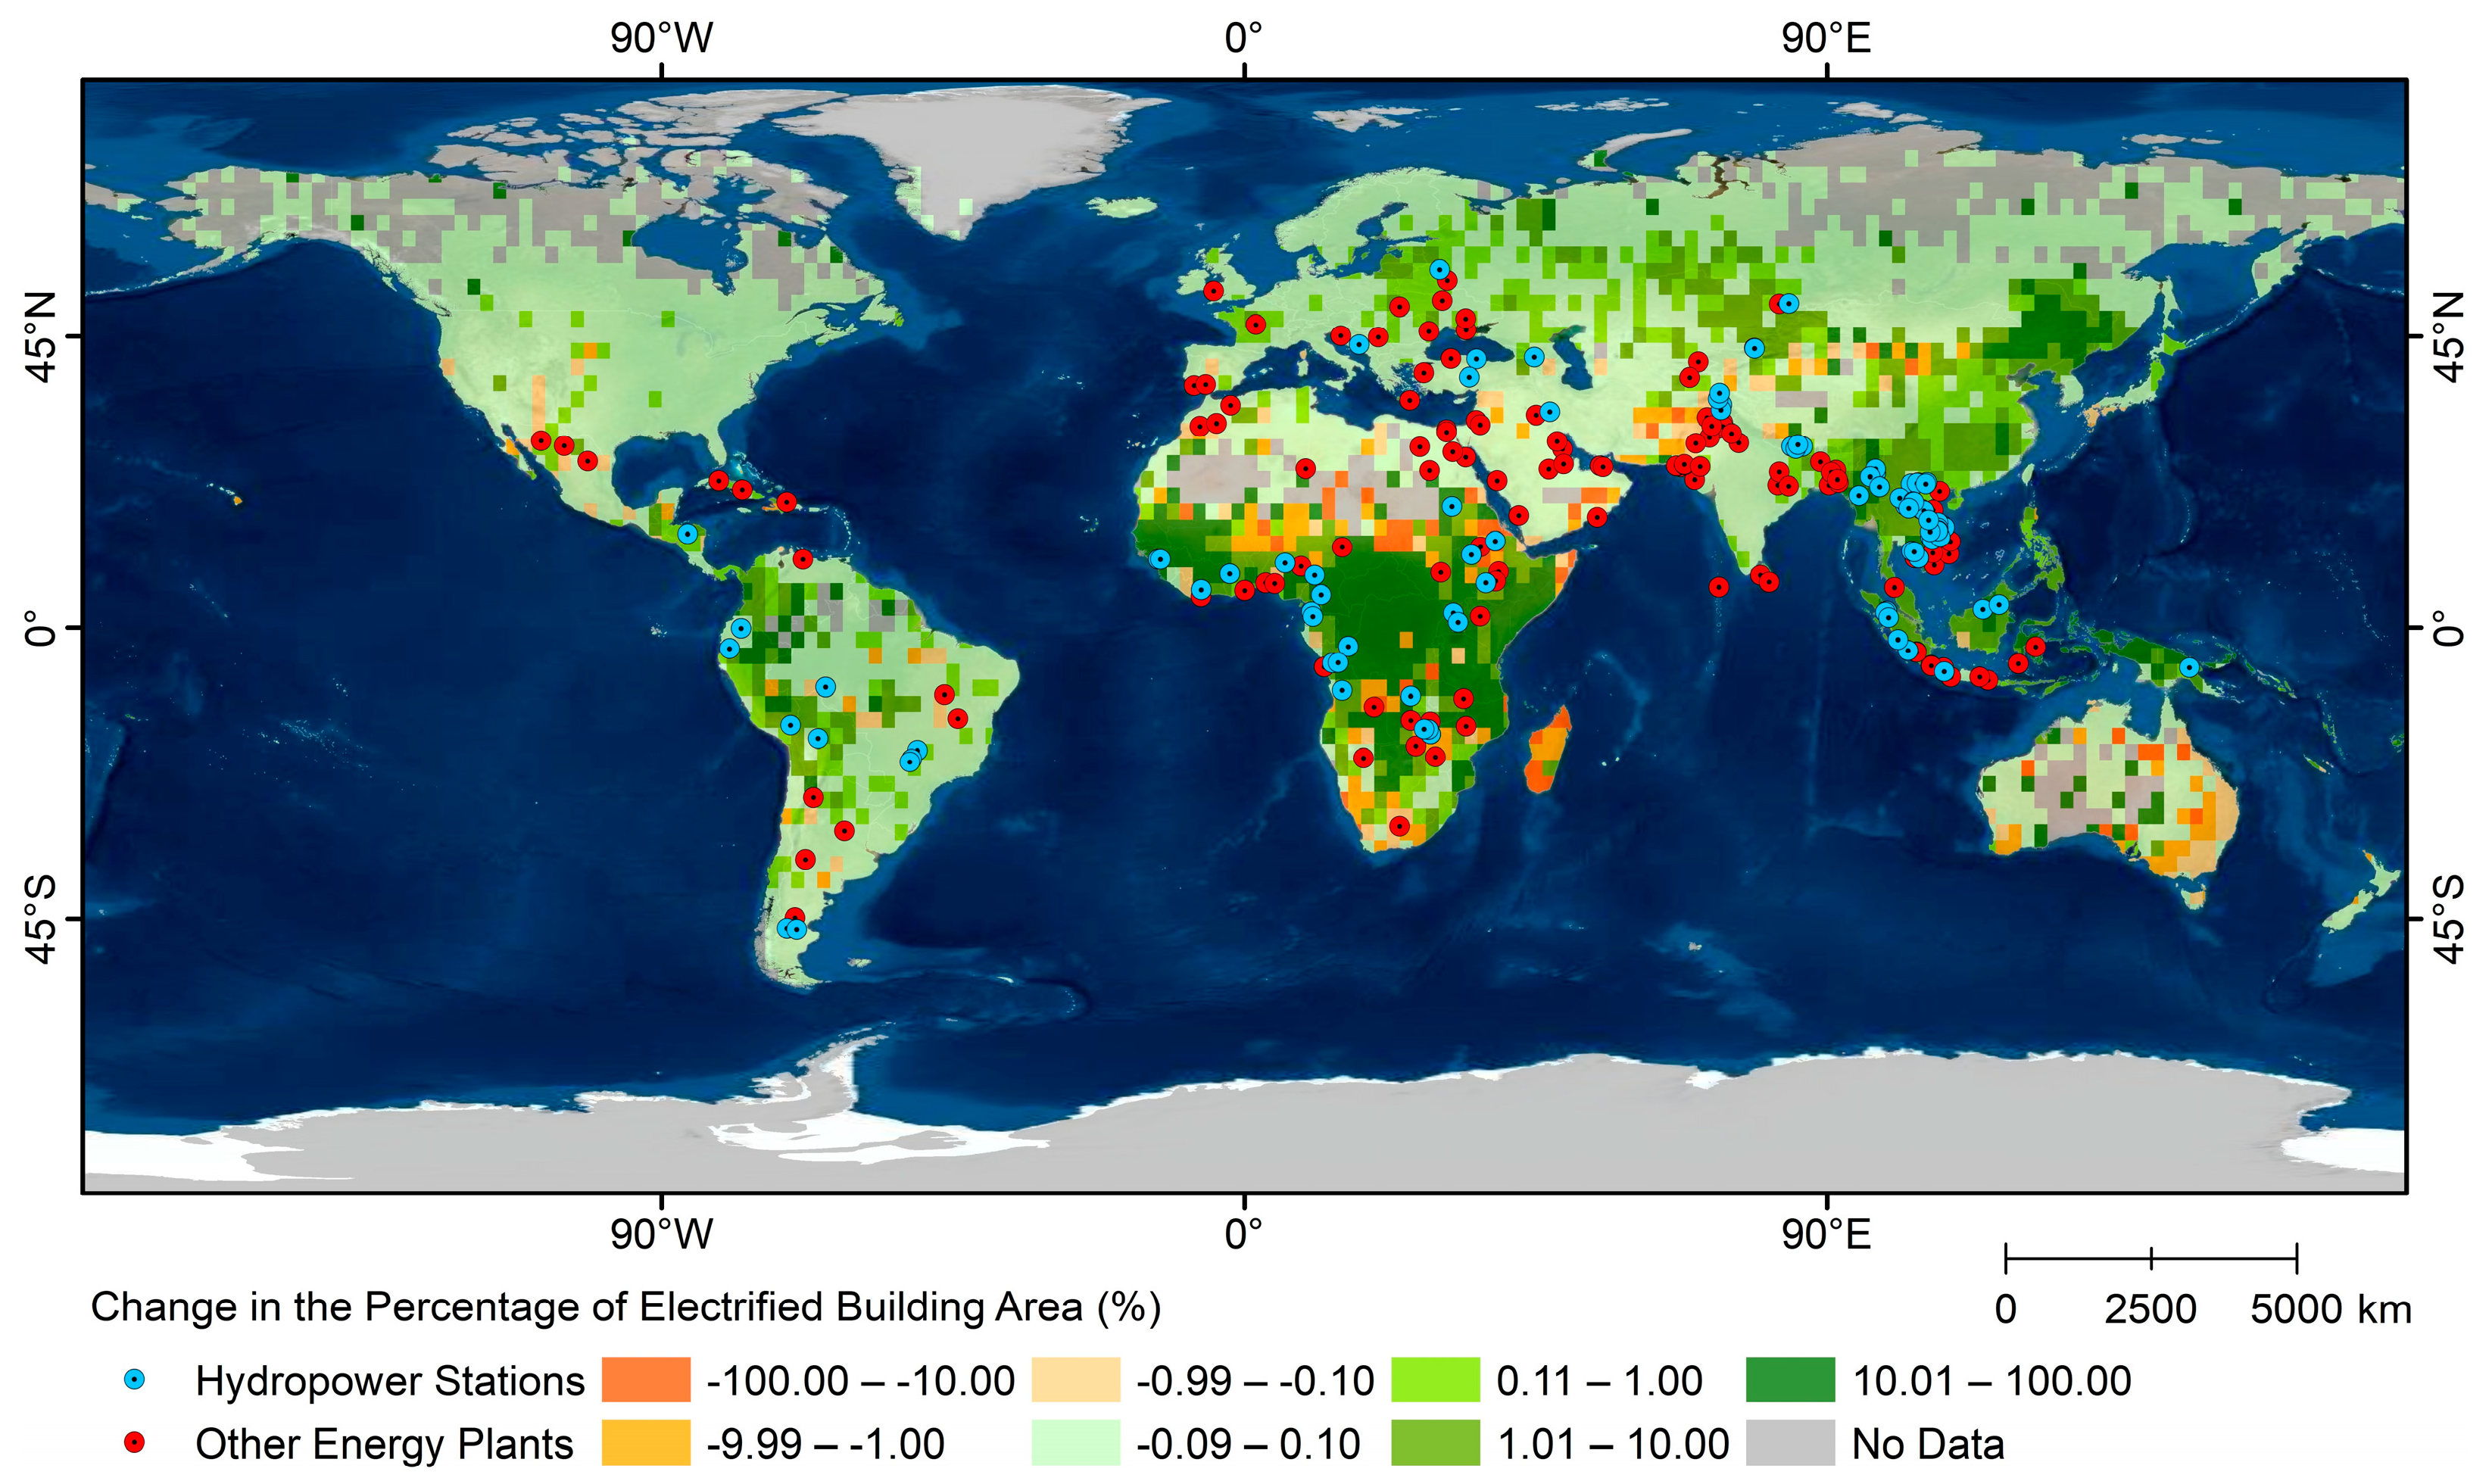
Buildings with improved electrification status are primarily concentrated in the interior regions of Africa and urban areas of Southeast Asia. Economic globalization has led to increased financial and trade openness, boosting electricity supply and narrowing regional electricity gaps [61]. The rise in power stations, especially renewable energy stations, has not only met economic and social needs but also provided stable power for various sectors, such as industry, commerce, and agriculture [62]. In 2023, the proportion of UNEB area decreased by 18.50% in Sub-Saharan Africa and by 28.68% in Southeast Asia. The international community has undertaken several power station projects in these regions, increasing the rate of electrification for buildings. For instance, by 2020, China had invested in 109 hydropower stations and 124 other energy stations (Figure 11) worldwide [63,64]. Among these, 30 hydropower stations and 20 other energy stations were in Sub-Saharan Africa, and 46 hydropower stations and 18 other energy stations were in Southeast Asia. The analysis indicates that the proportion of UNEB area in the 70 countries hosting these 233 stations decreased from 21.03% in 2012 to 11.85% in 2023. Notably, Cambodia experienced the most significant improvement, where China constructed six hydropower stations and one thermal power station, resulting in a 76.71% increase in the EB area.
(2)
Buildings with deteriorated electrification status are mainly found in mountainous regions. These areas have low building density, and as urbanization accelerates, populations concentrate in towns and plains, leading to abandoned buildings with no nighttime lighting. Consequently, these buildings are identified as ‘unelectrified’.
Figure 11. Changes in global electrified building area proportion between 2012 and 2023.
Remotesensing 17 00777 g011

5.3.4. Analysis of the Gap in Achieving the 2030 Global Electricity Access Goal

From 2012 to 2019, the annual average rate of reduction in the global UNEB area was 0.83%. However, due to the COVID-19 pandemic and the increased complexity of providing electricity to remote and impoverished areas, the UNEB area increased by 1.69% in 2020 compared to 2019. From 2021 to 2023, the annual average reduction rate decreased to 0.12%, indicating a slowdown in the electrification process. If the annual average reduction rate of 0.62% observed from 2012 to 2023 continues, 3.78% of global built-up areas will remain unelectrified by 2030. To achieve zero UNEBs by 2030, the annual average reduction rate needs to be increased to 1.88 times the current level.

5.4. Analysis of Factors Affecting Global Electrification Status

Access to electricity is a multifaceted challenge involving social, economic, environmental, technological, and public-policy factors. Although global building electrification status has improved from 2012 to 2023, statistics indicate that the electricity supply in many developing countries, especially in non-city areas of Africa, remains easily disturbed by external factors.

5.4.1. Impact of the COVID-19 Pandemic

The COVID-19 pandemic in 2019 had a significant impact on the global building electrification status. In 2020, the proportion of EBs markedly decreased compared to 2018, with the decline concentrated in developing countries, particularly in the inland regions of Sub-Saharan Africa (Figure 12).
We found that during this period, by regional statistical analysis, the proportion of UNEB area in town areas increased by 0.36%, and in rural areas it was 4.15 times that of town areas. The proportion of UNEB area increased by 12.28% in Sub-Saharan Africa, 5.74% in Melanesia, 3.59% in Micronesia, 1.09% in Northern Europe, 1.03% in South Asia, and 0.48% in Southeast Asia. Among the LDC, LLDC, and SIDS, the proportions increased by 12.99%, 8.05%, and 2.90%, respectively. These changes indicate that pandemic control measures led to a widespread decrease in nighttime luminosity [26], with factory shutdowns and store closures significantly affecting electrification status. In the post-pandemic era, particularly in the context of energy transition, there is a need to increase investment in stable renewable energy sources to improve the stability of electricity supply globally, especially in vulnerable regions.

5.4.2. Analysis of the Impact of Extreme Climate Events

In recent years, persistent extreme heat has caused varying degrees of shrinkage and degradation in global lakes, leading to power crises in several hydroelectric-dependent countries and regions. For example, New Zealand, which relies heavily on hydropower, faced a severe drought in parts of its South Island due to the super El Niño event in 2015 [65], which resulted in insufficient reservoir levels, causing electricity prices to skyrocket in the short term. As a result, the proportion of their UNEB area jumped from 28.73% in 2014 to 47.60% in 2015. Hydropower is highly susceptible to climatic variability; therefore, the regional climate strongly affects the output. As previously mentioned, the construction of numerous power plants, especially hydropower stations, has improved electrification in Sub-Saharan Africa. However, with hydropower increasingly concentrated in the Nile (accounting for 62% of the region’s total capacity in 2015) and Zambezi (73% in 2015) river basins, the risk of climate-related power supply disruptions in the region has somewhat increased [66].
Extreme heat has profound impacts on rural areas, affecting multiple SDGs. Although remote regions in Australia have improved power supply through distributed generation systems (e.g., diesel generators, solar power, and photovoltaics [67]), our product shows that rural building ERs have remained below 50% over a long period, reflecting the instability of power supply in remote communities. Extreme heat not only increases rural electricity demand, which can destabilize the reliability and affordability of power supply, but it also raises mortality rates among rural residents and increases housing vacancy rates, especially in the context of aging populations [68,69]. To eliminate all forms of poverty, including energy poverty [70], it is essential to address the accessibility and stability of electricity in remote regions and strengthen health-related infrastructure to enhance the resilience of poor and vulnerable groups to climate-related shocks, such as extreme heat.

5.4.3. Analysis of the Impact of Armed Conflicts

Electricity is crucial for all industries and the daily lives of residents, but it often becomes a target during wars. When electrical infrastructure is damaged, overall building illumination decreases, allowing the progression of war to be observed through changes in building electrification status. The war in Yemen, which erupted in 2014, is one of the longest and most complex conflicts currently ongoing in the Middle East. Our product reveals a significant increase in the proportion of UNEBs in Yemen after 2014, with rates exceeding 30% annually from 2015 to 2017, and peaking at 46.34% in 2016, a period when the conflict was at its most intense. In 2021, following the United States’ announcement that it would no longer support Saudi Arabia’s offensive actions in Yemen and its efforts to promote peace, the proportion of UNEBs fell to 17.95%.
War severely damages infrastructure, posing significant challenges for the restoration and development of power systems. In Ethiopia, for instance, the Tigray War that erupted in late 2020 caused the proportion of UNEBs to rise from 52.88% in 2021 to 76.27% in 2022. Due to the weaker recovery capacity of rural infrastructure compared to town areas, the EB area of town in 2023 (83.50%) nearly returned to the 2021 level (84.39%), while the EB area of rural areas was still 6.34% lower than 45.97% in 2021.
In a word, even after a war ends, post-war reconstruction—particularly in rural areas—remains a challenge [71,72]. To achieve the 2030 SDGs and their core commitment to ‘leave no one behind’, maintaining a peaceful international environment is crucial for global progress toward SDG7 and other SDGs.

5.5. Analysis of Errors and Limitations

Our study makes a significant contribution toward the RS-based monitoring of ERs, but several errors and limitations must be acknowledged:
(1)
To address noise issues such as aurora pollution in NPP/VIIRS NTL imagery, the regional threshold method and mask-denoising approach were used. Nonetheless, the noise was not completely eliminated. Recent advancements in NTL data processing [24,73,74,75] have further enhanced the quality of NPP/VIIRS datasets by addressing angular effects, geolocation mismatches, and short-term variability. Building on these advancements, future research will explore the potential of higher-quality datasets, including other advanced products such as VNP46A2, VNP46A3, and VNP46A4 from NASA’s NPP/VIIRS Black Marble suite.
(2)
The accuracy of the GHS-BUILT-UP-S R2023 dataset is relatively low in Central and Southern Africa (86.4% and 83.8%, respectively) [41]. Errors in depicting built-up areas can reduce the accuracy of identifying the electrification status of dispersed buildings. Meanwhile, the mismatch between the GHSL data and NTL data years may lead to errors. Improving the temporal resolution of built-up area data remains a potential area for future research.
(3)
NTL imagery with a spatial resolution of 20 m or higher can more effectively reflect detailed information about built-up areas [76,77]. The 500 m resolution NTL images used in our study provide a relatively coarse assessment of electrification in built-up areas, limiting monitoring capabilities. Future research should utilize higher-resolution data, such as the 10 m resolution NTL data from the Sustainable Development Goals Satellite-1 (SDGSAT-1) [78].
(4)
The NPP/VIIRS satellite passes overhead around 01:30 local time. If residents turn off their lights before this, monitoring ‘unelectrified’ buildings may lead to misinterpretation. Therefore, field research should be used to validate the results when applying our product. Notably, numerous recently launched or planned nighttime satellites operate earlier at night. For instance, SDGSAT-1’s NTL imagery is captured around 22:30 local time [78], significantly reducing the risk of misclassifying unelectrified areas. In addition, satellite constellations will be able to reveal the change in upward artificial lighting over the course of the night, with the benefit of finding out the habits of lighting usage.
(5)
Natural disasters such as earthquakes, floods, and typhoons can also affect power supply. However, due to their episodic nature and the inherent recovery capacity of cities, it is challenging to assess their impact on building electrification over an annual timescale [28,29]. Future research could estimate these effects using daily NTL imagery [74,79].
(6)
Due to the absence of spatial distribution data for known UNEBs, the accuracy assessment focuses solely on the binary global NTL data, which may result in errors in the classification accuracy for UNEBs. Future research could incorporate field survey statistics on UNEBs to further validate and refine classification accuracy.
(7)
UNEB areas represent the location and extent of unelectrified regions. The next step should involve the integration of gridded population data to estimate the impact at the population level, thereby fully aligning with the concept of ER in WB [2,3].

6. Conclusions

Our research improved RS methods for monitoring ERs by utilizing max_VNL, med_VNL, GHSL data, and land cover data. Based on this, we accurately mapped the spatial distribution of unelectrified villages globally for the first time and produced a global 500 m spatial distribution product of EBs for the period from 2012 to 2023. Our work enhances RS methodologies and datasets for assessing global electrification status and enables spatiotemporal analysis of electrification trends worldwide. The main conclusions are as follows:
(1)
The accuracy metrics of our product—Accuracy, Precision, Recall, F1-score, and MCC—were all above 0.9, indicating a high level of accuracy in determining electrification status by combining max_VNL with the regional threshold method. Compared to existing products, Recall for 2014 and 2020 improved by 8.04% and 1.22%, respectively.
(2)
In 2023, the global EB area accounted for 91.88%. Meanwhile, there are significant regional and urban–rural disparities in the spatial distribution of UNEBs. Among the top 20 countries with the highest proportions of UNEB areas, 70% are located in Sub-Saharan Africa. Due to the challenges of grid expansion and maintenance, unelectrified buildings are predominantly concentrated in the rural areas of developing countries.
(3)
From 2012 to 2023, the global EB area increased by 2.4199 million km2, with rural areas experiencing a faster rate of electrification than town areas. The annual decrease in the UNEB area was approximately 0.62%. To achieve SDG7 by 2030, the rate of reduction in UNEB areas needs to be increased by 1.88 times.
(4)
The COVID-19 pandemic, extreme climate events, and armed conflicts are the primary factors affecting global electrification. Power supply in developing countries is particularly vulnerable to external disruptions, necessitating increased investment in stable renewable energy sources to mitigate the impact of these crises on global regions’ power supply, especially those that are fragile.

Supplementary Materials

The following supporting information can be downloaded at: https://www.mdpi.com/article/10.3390/rs17050777/s1, Table S1: Building electrification status across countries or regions (including rural areas) from 2012 to 2023; Table S2: Building electrification status in town areas of various countries or regions (2012–2023); Table S3: Results of field survey in 24 ‘Hollow Villages’ in Henan.

Author Contributions

Conceptualization, M.W. (Mingquan Wu) and Z.N.; methodology, M.W. (Mingquan Wu) and S.O.; writing—original draft preparation, S.O.; writing—review and editing, M.W. (Mingquan Wu), F.C. and S.O.; visualization, S.O., M.W. (Mingquan Wu) and D.T.; overall project responsibility, M.W. (Mingquan Wu) and Z.N.; supervision M.W. (Mingquan Wu), J.L. and M.W. (Meng Wang); funding acquisition, M.W. (Meng Wang), J.L. and Z.N. All authors have read and agreed to the published version of the manuscript.

Funding

This research was funded by the International Research Center of Big Data for Sustainable Development Goals (CBAS), grant number E43Z05010T.

Data Availability Statement

The original contributions presented in this study are included in the article/Supplementary Materials. Further inquiries can be directed to the corresponding author.

Conflicts of Interest

The authors declare no conflicts of interest.

References

  1. Rajkumari, L. Relation between electricity consumption and economic growth in Karnataka, India: An aggregate and sector-wise analysis. Electr. J. 2020, 33, 106768. [Google Scholar] [CrossRef]
  2. Wb. World Bank Database. 2024. Available online: https://data.worldbank.org.cn/indicator/EG.ELC.ACCS.ZS (accessed on 10 February 2025).
  3. World Health Organization. Tracking SDG7: The Energy Progress Report 2023. 2023. Available online: https://www.iea.org/reports/tracking-sdg7-the-energy-progress-report-2023 (accessed on 1 March 2024).
  4. Li, D.; Bae, J.H.; Rishi, M. Sustainable development and SDG-7 in Sub-Saharan Africa: Balancing energy access, economic growth, and carbon emissions. Eur. J. Dev. Res. 2023, 35, 112. [Google Scholar] [CrossRef] [PubMed]
  5. IEA. World Energy Outlook 2019; International Energy Agency: Paris, France, 2019. [Google Scholar]
  6. IEA. World Energy Outlook 2020; International Energy Agency: Paris, France, 2020. [Google Scholar]
  7. Guo, H.; Liang, D.; Chen, F.; Sun, Z.; Liu, J. Big earth data facilitates sustainable development goals. Bull. Chin. Acad. Sci. (Chin. Version) 2021, 36, 874–884. [Google Scholar]
  8. Guo, H. Big Earth Data in Support of the Sustainable Development Goals (2022)—The Belt and Road; Springer: Berlin/Heidelberg, Germany, 2024. [Google Scholar]
  9. Doll, C.N.; Pachauri, S. Estimating rural populations without access to electricity in developing countries through night-time light satellite imagery. Energy Policy 2010, 38, 5661–5670. [Google Scholar] [CrossRef]
  10. Elvidge, C.D.; Baugh, K.E.; Sutton, P.C.; Bhaduri, B.; Tuttle, B.T.; Ghosh, T.; Ziskin, D.; Erwin, E.H. Who’s in the dark-satellite based estimates of electrification rates. In Urban Remote Sensing: Monitoring, Synthesis and Modeling in the Urban Environment; Wiley Blackwell: Hoboken, NJ, USA, 2011; pp. 211–224. [Google Scholar]
  11. Burlig, F.; Preonas, L. Out of the darkness and into the light? development effects of rural electrification. J. Political Econ. 2024, 132, 2937–2971. [Google Scholar] [CrossRef]
  12. Min, B.; Gaba, K.M.; Sarr, O.F.; Agalassou, A. Detection of rural electrification in Africa using DMSP-OLS night lights imagery. Int. J. Remote Sens. 2013, 34, 8118–8141. [Google Scholar] [CrossRef]
  13. Min, B.; Gaba, K.M. Tracking electrification in Vietnam using nighttime lights. Remote Sens. 2014, 6, 9511–9529. [Google Scholar] [CrossRef]
  14. Dugoua, E.; Kennedy, R.; Urpelainen, J. Satellite data for the social sciences: Measuring rural electrification with night-time lights. Int. J. Remote Sens. 2018, 39, 2690–2701. [Google Scholar] [CrossRef]
  15. Salat, H.; Schläpfer, M.; Smoreda, Z.; Rubrichi, S. Analysing the impact of electrification on rural attractiveness in Senegal with mobile phone data. R. Soc. Open Sci. 2021, 8, 201898. [Google Scholar] [CrossRef] [PubMed]
  16. Ramdani, F.; Setiani, P. Multiscale assessment of progress of electrification in Indonesia based on brightness level derived from nighttime satellite imagery. Environ. Monit. Assess. 2017, 189, 1–15. [Google Scholar] [CrossRef]
  17. Bertheau, P.; Oyewo, A.S.; Cader, C.; Breyer, C.; Blechinger, P. Visualizing national electrification scenarios for sub-saharan African countries. Energies 2017, 10, 1899. [Google Scholar] [CrossRef]
  18. Andrade-Pacheco, R.; Savory, D.J.; Midekisa, A.; Gething, P.W.; Sturrock, H.J.; Bennett, A. Household electricity access in Africa (2000–2013): Closing information gaps with model-based geostatistics. PLoS ONE 2019, 14, e0214635. [Google Scholar] [CrossRef]
  19. Falchetta, G.; Pachauri, S.; Parkinson, S.; Byers, E. A high-resolution gridded dataset to assess electrification in sub-Saharan Africa. Sci. Data 2019, 6, 110. [Google Scholar] [CrossRef] [PubMed]
  20. Principe, J.; Takeuchi, W. Supply and demand assessment of solar PV as Off-Grid option in asia pacific region with remotely sensed data. Remote Sens. 2019, 11, 2255. [Google Scholar] [CrossRef]
  21. Gao, X.; Wu, M.; Niu, Z.; Chen, F. Global Identification of Unelectrified Built-Up Areas by Remote Sensing. Remote Sens. 2022, 14, 1941. [Google Scholar] [CrossRef]
  22. Elvidge, C.D.; Baugh, K.E.; Zhizhin, M.; Hsu, F.C. Why VIIRS data are superior to DMSP for mapping nighttime lights. Proc. Asia-Pac. Adv. Netw. 2013, 35, 62. [Google Scholar] [CrossRef]
  23. Elvidge, C.D.; Zhizhin, M.; Ghosh, T.; Hsu, F.C.; Taneja, J. Annual time series of global VIIRS nighttime lights derived from monthly averages: 2012 to 2019. Remote Sens. 2021, 13, 922. [Google Scholar] [CrossRef]
  24. Li, X.; Ma, R.; Zhang, Q.; Li, D.; Liu, S.; He, T.; Zhao, L. Anisotropic characteristic of artificial light at night–Systematic investigation with VIIRS DNB multi-temporal observations. Remote Sens. Environ. 2019, 233, 111357. [Google Scholar] [CrossRef]
  25. Elarde, J.; Kim, J.S.; Kavak, H.; Züfle, A.; Anderson, T. Change of human mobility during COVID-19: A United States case study. PLoS ONE 2021, 16, e0259031. [Google Scholar] [CrossRef]
  26. Xu, G.; Wang, C.; Meng, Q.; Xiu, T.; Li, X. Spatio-temporal variations of night-time lights at early stages of the COVID-19 epidemic in the United States. Natl. Remote Sens. Bull. 2023, 26, 1777–1788. [Google Scholar]
  27. Chen, Z.; Yu, B.; Ta, N.; Shi, K.; Yang, C.; Wang, C.; Zhao, X.; Deng, S.; Wu, J. Delineating seasonal relationships between Suomi NPP-VIIRS nighttime light and human activity across Shanghai, China. IEEE J. Sel. Top. Appl. Earth Obs. Remote Sens. 2019, 12, 4275–4283. [Google Scholar]
  28. Yu, B.; Chen, F.; Wang, N.; Wang, L.; Guo, H. Assessing changes in nighttime lighting in the aftermath of the Turkey-Syria earthquake using SDGSAT-1 satellite data. Innovation 2023, 4, 100419. [Google Scholar] [CrossRef]
  29. Li, X.; Cao, H.; Gong, Y. Earthquake hazard assessment in Turkey and Syria using high-resolution night-light images. Geomat. Inf. Sci. Wuhan Univ. 2023, 48, 1697–1705. [Google Scholar]
  30. Román, M.O.; Stokes, E.C. Holidays in lights: Tracking cultural patterns in demand for energy services. Earth’s Future 2015, 3, 182–205. [Google Scholar] [CrossRef]
  31. Levin, N.; Kyba, C.C.; Zhang, Q.; de Miguel, A.S.; Román, M.O.; Li, X.; Portnov, B.A.; Molthan, A.L.; Jechow, A.; Miller, S.D.; et al. Remote sensing of night lights: A review and an outlook for the future. Remote Sens. Environ. 2020, 237, 111443. [Google Scholar] [CrossRef]
  32. Chen, J.; Zheng, Z.; Wu, Z.; Qian, Q. Review and prospect of application of nighttime light remote sensing data. Prog. Geogr. 2019, 38, 205–223. [Google Scholar]
  33. Chai, Z.; Wang, S.; Qiao, J. Township GDP estimation of the Pearl River Delta based on the NPP-VIIRS night-time satellite data. Trop. Geogr. 2015, 35, 379–385. [Google Scholar]
  34. Shi, K.; Yu, B.; Huang, Y.; Hu, Y.; Yin, B.; Chen, Z.; Chen, L.; Wu, J. Evaluating the ability of NPP-VIIRS nighttime light data to estimate the gross domestic product and the electric power consumption of China at multiple scales: A comparison with DMSP-OLS data. Remote Sens. 2014, 6, 1705–1724. [Google Scholar] [CrossRef]
  35. Li, X.; Chen, Z.; Wu, J.; Wang, W.; Qu, L.; Zhou, S.; Han, X. Gridding methods of city permanent population based on night light data and spatial regression models. J. Geo-Inf. Sci. 2017, 19, 1298–1305. [Google Scholar]
  36. Gao, Y.; Wang, H.; Wang, P.T.; Sun, X.Y.; Lv, T.T. Population spatial processing for Chinese coastal zones based on census and multiple night light data. Resour. Sci. 2013, 35, 2517–2523. [Google Scholar]
  37. Hu, Y.; Zhao, G.; Zhang, Q.L. Spatial distribution of population data based on nighttime light and LUC data in the Sichuan-Chongqing Region. J. Geo-Inf. Sci. 2018, 20, 68–78. [Google Scholar]
  38. Shi, K.; Huang, C.; Yu, B.; Yin, B.; Huang, Y.; Wu, J. Evaluation of NPP-VIIRS night-time light composite data for extracting built-up urban areas. Remote Sens. Lett. 2014, 5, 358–366. [Google Scholar] [CrossRef]
  39. Cao, Z.Y. Estimating the Spatial Distribution of GDP Based on Nighttime Light Image and Analysis of Correlation Between It and PM2.5 Concentration; Graduate University of Chinese Academy of Sciences (Guangzhou Institute of Geochemistry): Guangzhou, China, 2016. [Google Scholar]
  40. Burger, W.; Burge, M.J. Digital Image Processing: An Algorithmic Introduction; Springer: Berlin/Heidelberg, Germany, 2022. [Google Scholar]
  41. European Commission. GHSL Data Package 2023; Publications Office of the European Union: Luxembourg, 2024; Available online: https://human-settlement.emergency.copernicus.eu/download.php?ds=pop (accessed on 1 April 2024).
  42. Pesaresi, M.; Politis, P. GHS-BUILT-S R2023A—GHS Built-Up Surface Grid, Derived from Sentinel2 Composite and Landsat, Multitemporal (1975–2030) European Commission, Joint Research Centre (JRC). 2023. Available online: http://data.europa.eu/89h/9f06f36f-4b11-47ec-abb0-4f8b7b1d72ea (accessed on 1 March 2024).
  43. Pesaresi, M.; Huadong, G.; Blaes, X.; Ehrlich, D.; Ferri, S.; Gueguen, L.; Halkia, M.; Kauffmann, M.; Kemper, T.; Lu, L.; et al. A global human settlement layer from optical HR/VHR RS data: Concept and first results. IEEE J. Sel. Top. Appl. Earth Obs. Remote Sens. 2013, 6, 2102–2131. [Google Scholar] [CrossRef]
  44. Store, C.C.D. Land cover classification gridded maps from 1992 to present derived from satellite observations. Copernic. Clim. Change Serv. 2019, 7–9. [Google Scholar]
  45. Elvidge, C.D.; Baugh, K.; Zhizhin, M.; Hsu, F.C.; Ghosh, T. VIIRS night-time lights. Int. J. Remote Sens. 2017, 38, 5860–5879. [Google Scholar] [CrossRef]
  46. Monsivais, D.; Bhattacharya, K.; Ghosh, A.; Dunbar, R.I.; Kaski, K. Seasonal and geographical impact on human resting periods. Sci. Rep. 2017, 7, 10717. [Google Scholar] [CrossRef]
  47. Shi, Z.; Liu, S.; Xia, H. A remote sensing image registration method combining feature information clustering and partitioning. J. Univ. Chin. Acad. Sci. 2024, 41, 97. [Google Scholar]
  48. Fan, P.; Chen, J.; Ouyang, Z.; Groisman, P.; Loboda, T.; Gutman, G.; Prishchepov, A.V.; Kvashnina, A.; Messina, J.; Moore, N.; et al. Urbanization and sustainability under transitional economies: A synthesis for Asian Russia. Environ. Res. Lett. 2018, 13, 095007. [Google Scholar] [CrossRef]
  49. Wang, J.; Qiu, S.; Du, J.; Meng, S.; Wang, C.; Teng, F.; Liu, Y. Spatial and temporal changes of urban built-up area in the Yellow River Basin from nighttime light data. Land 2022, 11, 1067. [Google Scholar] [CrossRef]
  50. Deng, C.; Zhou, D.; Wang, Y.; Wu, J.; Yin, Z. Association between Land Use and Urban Vitality in the Guangdong–Hong Kong–Macao Greater Bay Area: A Multiscale Study. Land 2024, 13, 1574. [Google Scholar] [CrossRef]
  51. Wang, J.; Xu, C. Geographic detectors: Principles and prospects. Geogr. J. 2017, 72, 116–134. [Google Scholar]
  52. Zhou, L.; Divakarla, M.; Liu, X. An overview of the joint polar satellite system (JPSS) science data product calibration and validation. Remote Sens. 2016, 8, 139. [Google Scholar] [CrossRef]
  53. Corbane, C.; Florczyk, A.; Pesaresi, M.; Politis, P.; Syrris, V. GHS Built-Up Grid, Derived from Landsat, Multitemporal (1975–1990–2000–2014); R2018A; European Commission, Joint Research Centre (JRC): Petten, The Netherlands, 2018. [Google Scholar] [CrossRef]
  54. Aglina, M.K.; Agbejule, A.; Nyamuame, G.Y. Policy framework on energy access and key development indicators: ECOWAS interventions and the case of Ghana. Energy Policy 2016, 97, 332–342. [Google Scholar] [CrossRef]
  55. Wassie, Y.T.; Adaramola, M.S. Socio-economic and environmental impacts of rural electrification with Solar Photovoltaic systems: Evidence from southern Ethiopia. Energy Sustain. Dev. 2021, 60, 52–66. [Google Scholar] [CrossRef]
  56. Daka, K.R.; Ballet, J. Children’s education and home electrification: A case study in northwestern Madagascar. Energy Policy 2011, 39, 2866–2874. [Google Scholar] [CrossRef]
  57. Markandya, A.; Wilkinson, P. Electricity generation and health. Lancet 2007, 370, 979–990. [Google Scholar] [CrossRef]
  58. Vernet, A.; Khayesi, J.N.; George, V.; George, G.; Bahaj, A.S. How does energy matter? Rural electrification, entrepreneurship, and community development in Kenya. Energy Policy 2019, 126, 88–98. [Google Scholar] [CrossRef]
  59. Javadi, F.S.; Rismanchi, B.; Sarraf, M.; Afshar, O.; Saidur, R.; Ping, H.W.; Rahim, N.A. Global policy of rural electrification. Renew. Sustain. Energy Rev. 2013, 19, 402–416. [Google Scholar] [CrossRef]
  60. Alqahtani, B.J.; Patino-Echeverri, D. Identifying economic and clean strategies to provide electricity in remote rural areas: Main-grid extension vs. Distributed electricity generation. Energies 2023, 16, 958. [Google Scholar] [CrossRef]
  61. Noumba, I.; Nguea, S.M. Assessing the role of globalization for universal electricity access. Int. Econ. 2023, 174, 180–195. [Google Scholar] [CrossRef]
  62. Li, X.; Gong, Y.; Shao, Z.; Li, X. Evaluation of China’s Aid to Central Asia from the Perspective of Night-Time Light Remote Sensing. Geomat. Inf. Sci. Wuhan Univ. 2023, 48, 1914–1922. [Google Scholar]
  63. Yin, F.; Wu, M.; Xiao, J.; Niu, Z. Dataset of China’s overseas hydropower station projects from 2002 to 2019. Chin. Sci. Data 2019, 4. [Google Scholar] [CrossRef]
  64. Jiang, Y.; Wu, M.; Huang, C.; Niu, Z. China Overseas Power Project Information Dataset 2000–2019. Chin. Sci. Data 2019, 4. [Google Scholar] [CrossRef]
  65. Vera, C.S.; Osman, M. Activity of the Southern Annular Mode During 2015–2016 El Niño Event and Its Impact on Southern Hemisphere Climate Anomalies. Int. J. Climatol. 2018, 38, e1288–e1295. [Google Scholar] [CrossRef]
  66. Conway, D.; Dalin, C.; Landman, W.A.; Osborn, T.J. Hydropower plans in eastern and southern Africa increase risk of concurrent climate-related electricity supply disruption. Nat. Energy 2017, 2, 946–953. [Google Scholar] [CrossRef]
  67. Jamal, T.; Urmee, T.; Calais, M.; Shafiullah, G.M.; Carter, C. Technical challenges of PV deployment into remote Australian electricity networks: A review. Renew. Sustain. Energy Rev. 2017, 77, 1309–1325. [Google Scholar] [CrossRef]
  68. Brumby, S.; Adams, J.; Kloot, K.; Baker, T.; Hewson, E. O-371 High Heat Days, Thermal Impacts And Emergency Presentations Across Rural Southwest Victoria, Australia. Occup. Med. 2024, 74 (Suppl. 1), 1349. [Google Scholar] [CrossRef]
  69. Blackberry, I.; Morris, N. The impact of population ageing on rural aged care needs in Australia: Identifying projected gaps in service provision by 2032. Geriatrics 2023, 8, 47. [Google Scholar] [CrossRef]
  70. Jevtic, M.; Matkovic, V.; Bouland, C. Poverty and energy issues as environmental and health challenges in SDGs. Eur. J. Public Health 2021, 31 (Suppl. 3), ckab164-734. [Google Scholar] [CrossRef]
  71. Wang, S.; Li, X. Use of Nighttime Light Images in Evaluating Refugee Settlement. IEEE J. Sel. Top. Appl. Earth Obs. Remote Sens. 2024, 17, 14122–14132. [Google Scholar] [CrossRef]
  72. Li, X.; Liu, S.; Jendryke, M.; Li, D.; Wu, C. Night-time light dynamics during the Iraqi civil war. Remote Sens. 2018, 10, 858. [Google Scholar] [CrossRef]
  73. Cao, H.; Wang, Y.; Li, X.; Hu, S.; Qiu, S.; Wei, Y. Detecting Farmland Fire in VIIRS Night-time Light Images. Geomat. Inf. Sci. Wuhan Univ. 2023. [Google Scholar] [CrossRef]
  74. Li, T.; Zhu, Z.; Wang, Z.; Román, M.O.; Kalb, V.L.; Zhao, Y. Continuous monitoring of nighttime light changes based on daily NASA’s Black Marble product suite. Remote Sens. Environ. 2022, 282, 113269. [Google Scholar] [CrossRef]
  75. Hu, Y.; Zhou XYamazaki, D.; Chen, J. A self-adjusting method to generate daily consistent nighttime light data for the detection of short-term rapid human activities. Remote Sens. Environ. 2024, 304, 114077. [Google Scholar] [CrossRef]
  76. Zhong, Q.; Xiao, R.; Cao, H.; Li, X.; Wu, J. Evaluation of Venusstar-1 nighttime light images. Geomat. Inf. Sci. Wuhan Univ. 2023, 48, 1273–1285. [Google Scholar]
  77. Shi, Q.; Zhu, J.; Liu, Z.; Guo, H.; Gao, S.; Liu, M.; Liu, Z.; Liu, X. The Last Puzzle of Global Building Footprints—Mapping 280 Million Buildings in East Asia Based on VHR Images. J. Remote Sens. 2024, 4, 0138. [Google Scholar] [CrossRef]
  78. Guo, H.; Dou, C.; Chen, H.; Liu, J.; Fu, B.; Li, X.; Zou, Z.; Liang, D. SDGSAT-1: The world’s first scientific satellite for sustainable development goals. Sci. Bull. 2023, 68, 34–38. [Google Scholar] [CrossRef] [PubMed]
  79. Jia, M.; Li, X.; Gong, Y.; Belabbes, S.; Dell’Oro, L. Estimating natural disaster loss using improved daily night-time light data. Int. J. Appl. Earth Obs. Geoinf. 2023, 120, 103359. [Google Scholar] [CrossRef]
Figure 1. Coverage area of NPP/VIIRS NTL imagery.
Remotesensing 17 00777 g001
Figure 2. Technical flowchart for global building electrification status remote sensing monitoring.
Remotesensing 17 00777 g002
Figure 3. Latitudinal variations in average med_VNL radiance from 2012 to 2023.
Remotesensing 17 00777 g003
Figure 4. NTL imagery zones and spatial distribution of classification samples.
Remotesensing 17 00777 g004
Figure 5. Regional classification thresholds from 2012 to 2023.
Remotesensing 17 00777 g005
Figure 6. Binarized global NTL image representing 2012.
Remotesensing 17 00777 g006
Figure 7. Proportion of global unelectrified building area in 2022.
Remotesensing 17 00777 g007
Figure 8. Proportion of global population without electricity in 2022. Note: Data were acquired on 18th September 2024 and were updated only to 2022. For data from other years, please visit the World Bank Open Data website (https://data.worldbank.org.cn, accessed on 1 March 2024).
Remotesensing 17 00777 g008
Figure 9. Changes in proportion of electrified building area from 2012 to 2023.
Remotesensing 17 00777 g009
Figure 10. Electrification status of Henan in 2014: Original Product (a) vs. Current Product (b).
Remotesensing 17 00777 g010
Figure 12. Changes in global electrified building area proportion between 2018 and 2020.
Remotesensing 17 00777 g012
Table 1. Accuracy assessment of global building electrification status product.
TimeTNFPFNTPAccuracyPrecisionRecallF1-ScoreMCC
2012102,89316531029103,5170.98720.98430.99020.98720.9744
2013101,9932553382104,1640.98600.97610.99630.98610.9721
2014102,6871859178104,3680.99030.98250.99830.99030.9806
2015100,5034043108104,4380.98010.96270.99900.98050.9610
2016102,6641882111104,4350.99050.98230.99890.99050.9811
201799,977456964104,4820.97780.95810.99940.97830.9566
2018102,814173227104,5190.99160.98370.99970.99170.9833
201999,185536112104,5340.97430.95120.99990.97490.9499
2020103,025152123104,5230.99260.98570.99980.99270.9853
2021102,10124456104,5400.98830.97710.99990.98840.9768
2022101,21533317104,5390.98400.96910.99990.98430.9686
2023101,31632300104,5460.98460.97001.00000.98480.9696
Total1,220,37334,17919471,252,6050.98560.97340.99840.98580.9715
Table 2. Accuracy comparison of electrification rate products produced by different methods.
TimeDataThreshold Selection MethodClassification Threshold
(nW·cm⁻2·sr⁻1)
Identification Rate of Villages with Electricity (%)FNTPRecall
2014ave_VNLSingle Threshold0.354.17 943395,1130.9098
max_VNLSingle Threshold0.453433.33 3061101,4850.9707
max_VNLRegional Threshold0.293887.50 1029103,5170.9902
2020ave_VNLSingle Threshold0.4854.17 1663102,8830.9841
max_VNLSingle Threshold0.657858.33 951103,5950.9909
max_VNLRegional Threshold0.4488100.00 382104,1640.9963
Disclaimer/Publisher’s Note: The statements, opinions and data contained in all publications are solely those of the individual author(s) and contributor(s) and not of MDPI and/or the editor(s). MDPI and/or the editor(s) disclaim responsibility for any injury to people or property resulting from any ideas, methods, instructions or products referred to in the content.

