Article

Spatiotemporal Variation in Carbon and Water Use Efficiency and Their Influencing Variables Based on Remote Sensing Data in the Nanling Mountains Region

1
Guangzhou Institute of Geochemistry, Chinese Academy of Sciences, Guangzhou 510640, China
2
Guangdong Nanling Forest Ecosystem National Field Scientific Observation and Research Station, Guangzhou Institute of Geography, Guangdong Academy of Sciences, Guangzhou 510070, China
3
University of Chinese Academy of Sciences, Beijing 100049, China
4
National Ecological Science Data Center Guangdong Branch, Guangzhou 510650, China
*
Author to whom correspondence should be addressed.
Remote Sens. 2025, 17(4), 648; https://doi.org/10.3390/rs17040648
Submission received: 29 December 2024 / Revised: 29 January 2025 / Accepted: 30 January 2025 / Published: 14 February 2025
(This article belongs to the Special Issue Big Earth Data in Support of the Sustainable Development Goals)

Abstract

:
A comprehensive evaluation of the variations in carbon use efficiency (CUE) and water use efficiency (WUE) in the Nanling Mountains Region (NMR) is crucial for gaining insights into the intricate relationships between climate change and ecosystem processes. This study evaluates the spatiotemporal rates of dynamics in CUE, WUE, gross primary productivity (GPP), net primary productivity (NPP), and evapotranspiration (ET) over the period from 2001 to 2023, using remote sensing data and linear regression analysis. Trend analysis, Hurst exponent analysis, and stability analysis were applied to examine the long-term patterns of CUE and WUE, while partial correlation analysis was employed to explore the spatial relationships between these efficiencies and climatic factors. The main findings of the study are as follows: (1) The CUE and WUE of the NMR decreased geographically from 2001 to 2023, and both the CUE and WUE of NMR showed a significant declining trend (p < 0.05) with the CUE decreasing at a rate of 0.0014/a (a: year) and the WUE falling at a rate of 0.0022/a. (2) The average values of the CUE and WUE of the NMR from 2001 to 2023 were 0.47 and 0.82 g C·m−2·mm−1, respectively, with a clear geographical difference. (3) The CUE and WUE in the NMR showed widespread degradation trends with some localized improvements, yet sustainability analysis indicates a likely continued decline across most areas, particularly for forests, while grasslands exhibit the greatest resilience. (4) Precipitation had a significantly stronger impact on WUE, while temperature appeared to exert a more substantial effect on CUE, with vegetation types responding differently; notably, shrubland displayed a direct association between CUE and temperature. In summary, multi-source data were employed to comprehensively analyze the spatiotemporal dynamics of CUE and WUE in the NMR over the past 23 years. We also examined the features of their responses to global warming, offering valuable theoretical insights into the carbon and water dynamics within the terrestrial ecosystems of the NMR.

1. Introduction

Carbon and hydrological processes are integral components of the terrestrial ecosystem cycle [1]. Understanding the driving factors behind the interactions between terrestrial environmental systems and climatic shifts is crucial, especially the global rise in temperatures and the rising occurrence of severe weather phenomena [2,3]. Vegetation carbon use efficiency (CUE) and water use efficiency (WUE), as key indicators characterizing the carbon–water cycles of terrestrial ecosystems, have consistently been focal topics in studies related to climate variability and environmental change [4,5,6,7]. CUE is commonly defined as the ratio of net primary productivity (NPP) to gross primary productivity (GPP), reflecting the capacity of ecosystems to capture and retain carbon [7]. WUE represents the amount of water lost for each unit of carbon assimilated by vegetation, typically reflected as the ratio of vegetation productivity (e.g., NPP or GPP) to evapotranspiration (ET), and serves as an indicator of an ecosystem’s carbon sequestration capacity per unit area, characterizing its response to water resource changes [8]. With the intensification of global warming, the potential for vegetation carbon sequestration is expected to accelerate, alongside an increase in water evaporation [9,10]. In the context of ongoing environmental shifts, terrestrial ecosystems are undergoing systemic alterations in both their carbon and water cycles, posing significant threats to ecosystem stability and sustainability [11]. Therefore, exploring the factors influencing CUE and WUE and their relationships with environmental variables is crucial for tackling environmental issues, preserving ecosystem integrity, and optimizing resource allocation while promoting sustainable socioeconomic development.
Traditionally, research on vegetation CUE and WUE at finer scales utilized observational techniques like eddy covariance and thermal diffusion methods [12,13,14]. Vegetation CUE can be estimated through various approaches, including ground-based measurements, eddy covariance techniques, and biogeochemical models [12,13]. Similarly, vegetation WUE can be derived using plant-scale experiments, remote sensing-based inversion, eddy covariance methods, and stable isotope analysis [14]. These diverse methodologies have been widely applied and validated across varying spatial scales and ecological contexts, offering robust theoretical and technical support for advancing our understanding of carbon–water coupling in ecosystems. Recently, advancements in satellite-based observation technologies have provided long-term remote sensing datasets, offering new perspectives for research on carbon and water cycles [15]. Numerous studies have utilized satellite observation data to examine the patterns of variation and the driving forces behind vegetation carbon and water use efficiency across different geographical extents and timeframes [16,17]. At the regional level, Liu et al. [16] found a slight increasing trend in annual vegetation CUE across China from 2000 to 2013, with greater values in the west and smaller values in the east; grasslands exhibited the highest CUE (0.21) and shrubs the lowest (0.06). Using CMIP5 models to simulate the future CUE of China’s terrestrial biotic communities and analyze its potential changes, the results indicated that the future CUE is projected to range between 0.332 and 0.617, with a slight decline over time [18]. In central Asia, the mean WUE value from 2001 to 2021 was 3.011 g C kg−1 H2O, showing a general decline in WUE over time [18]. At smaller scales, such as a watershed, the long-term average CUE (0.458) and WUE (0.682 g C kg−1 H2O) in the Poyang lake basin showed a moderate decrease from 2000 to 2014, with grasslands having the highest CUE and forests the highest WUE [19]. In addition, Liu et al. [20] observed an overall increasing trend in WUE across the Loess Plateau over the past 15 years, with intra-annual WUE in different vegetation ecosystems predominantly exhibiting a “bimodal” distribution, with peaks observed in April–May and September–October. These findings revealed the spatiotemporal variability of vegetation CUE and WUE across regions, ecosystems, and time scales, shaped by regional climate, vegetation types, and human impacts. Despite advancements in understanding regional dynamics of CUE and WUE, critical knowledge gaps remain. Specifically, there is a lack of comprehensive investigations into the spatiotemporal interactions between CUE and WUE within the same region, particularly across diverse plant functional types. Furthermore, their responses to climate change, including feedback mechanisms and implications for carbon–water coupling, remain insufficiently explored.
Prior research indicates that vegetation CUE and WUE exhibit high sensitivity to environmental and climatic variations [15,17]. Zhang et al. [21] revealed that temperature has an inverse relationship with CUE in global carbon utilization, while precipitation shows a direct relationship with CUE. Temperature identified as the primary driving factor of CUE in alpine environments [22]. In contrast, in Heilongjiang, both vegetation CUE and WUE exhibited a positive relationship with temperature and an inverse relationship with precipitation [23]. In high-altitude regions, an increase in both precipitation and temperature enhanced vegetation WUE [24]. However, vegetation WUE exhibits a negative feedback response to temperature and precipitation under arid conditions [25]. Most of these studies are limited to examining the response of a single indicator (CUE or WUE) to climate at a regional scale, with little attention given to the CUE and WUE in the subtropical region of South China and their responses to climate variability. In addition, the carbon dioxide fertilization effect [6], nitrogen deposition [26], and vegetation greening degree [27] may affect the carbon sequestration potential of the ecosystem and the water cycle process, thereby affecting carbon and water utilization efficiency. Du et al. [28] found that decrease in WUE may be associated with ecosystem degradation, while ecosystem restoration tends to enhance WUE. Prior research has demonstrated the high sensitivity of vegetation CUE and WUE to environmental and climatic variations, highlighting complex and region-specific responses, while underscoring the need for more comprehensive studies in subtropical regions to address knowledge gaps regarding their spatiotemporal dynamics and interactions with climate variability and ecosystem changes. The Nanling Mountains Region (NMR), located in southern China, serves as a critical ecological barrier and biodiversity hotspot, connecting the eastern and western parts of China’s subtropical zone. The region is characterized by complex topography, high climatic heterogeneity, and diverse vegetation types. However, the region is highly vulnerable to climate change, with recent decades witnessing increasing temperatures, altered precipitation patterns, and extreme weather events. In recent years, the NMR has undergone varying degrees of degradation, with degraded areas accounting for 31.78% of the total region [29]. Yet, studies on the factors influencing CUE and WUE in degraded mountain ecosystems remain limited, and it is still unclear how the CUE and WUE of various land use types in degraded mountain regions respond to global warming. Compared to previous studies, this study integrates remote sensing data with analytical methods such as linear regression, trend analysis, Hurst exponent analysis, and stability analysis to examine the spatiotemporal dynamics of CUE and WUE in the NMR, focusing on vegetation type differences and their climatic responses. Thus, the two goals of this study are as follows: (1) to investigate the spatiotemporal distribution and trends in vegetation CUE and WUE in the NMR over the past 23 years based on global MODIS data; (2) to examine how the CUE and WUE across various plant functional types respond to climatic factors in the NMR.

2. Materials and Methods

2.1. Study Area

The Nanling Mountains Barrier Zone (23°37′N–27°14′N, 109°43′E–116°41′E) is located across the five provinces of Guangdong, Guangxi, Hunan, Jiangxi, and Fujian in China. The study area spans approximately 700 km in the east–west direction and 400 km in the north–south direction (Figure 1a), covering a total area of 165,234 km2. The region has an estimated population of 32.8 million people [30]. This region is recognized as a climate-sensitive region [31], with total annual precipitation varying between 1219.98 mm and 2061.35 mm and the average annual temperature ranging from 10.15 °C to 22.45 °C. As of 2017, the Guangdong Nanling National Nature Reserve, located in the Nanling Mountains, has recorded a total of 555 species of terrestrial vertebrates across 31 orders and 100 families. Additionally, the reserve has documented a cumulative total of 3890 species of wild higher plants, belonging to 287 families and 1262 genera [30,32]. The principal vegetation types include forest, grasslands, croplands, and shrublands (Figure 1b). The NMR serve as one of China’s most important natural geographical boundaries, as well as the most significant ecological oasis at this latitude globally. It is also the most critical ecological barrier in Guangdong province.

2.2. Data Acquisition

The vegetation GPP, NPP, and ET remote sensing data used were obtained from MODIS data products, specifically MOD17A3H, MOD17A3H, and MOD16A2. MODIS data products are obtained from the Terra polar-orbiting satellite, which was launched by NASA in 1999. These data have been extensively utilized in research on land cover change, biodiversity dynamics, and environmental monitoring [33,34]. The NPP data have an annual temporal resolution, while GPP and ET data have an 8-day temporal resolution. All datasets have a spatial resolution of 500 m, cover the timeframe from 2001 to 2023, use the WGS-84 geographic coordinate system, and are provided in GeoTIFF format. To avoid traditional challenges associated with downloading data, such as re-projection and mosaicking, this study utilized the Google Earth Engine (GEE) platform for data acquisition. Based on the GEE platform, outliers were removed from the raw data, and annual totals for GPP and ET were calculated. The processed data were exported in GeoTIFF format via Google Drive. Using ArcGIS 10.7, batch masking was performed based on the vector boundaries of the NMR, resulting in the final analyzable datasets. Specific data are detailed in Table 1.
Land cover datasets were sourced from the MCD12Q1 products based on the GEE platform, which has a spatial resolution of 500 m. As classified under the system established by the International Geosphere-Biosphere Program (IGBP) and the specific objectives of this study, the data were reclassified into seven categories, included forest, grasslands, croplands, shrublands, and barren lands, among others. The analysis primarily concentrated on the spatiotemporal variation in CUE and WUE for forest, grasslands, croplands, and shrublands.
Precipitation and temperature were derived from the 1 km monthly datasets, both published by the National Tibetan Plateau Data Center. These datasets, produced through the downscaling approach using the CRU 0.5° global data from WorldClim, have been cross-verified with measurements from approximately 500 meteorological stations across China, ensuring their precision and dependability [35]. The boundary data for the NMR were used in conjunction with ArcGIS 10.7 to clip the datasets and resample them to a spatial resolution of 500 m. This process enabled the generation of annual-scale meteorological raster data for the study area, which were later employed to examine the determinants affecting vegetation CUE and WUE.

2.3. Methods

2.3.1. Estimation of CUE and WUE Values

CUE is characterized as the quotient of NPP to GPP, whereas WUE is described as the quotient of NPP to ET [16,17]. The corresponding formulas for their calculation are as follows:
C U E = N P P G P P
W U E = N P P E T
where CUE is a dimensionless value, while WUE is expressed in grams of carbon per square meter per millimeter (g C·m−2·mm−1). ET, measured in millimeters, represents the ecosystem’s water loss. NPP (g C·m−2), GPP (g C·m−2), and ET (mm) were all obtained from remote sensing datasets.

2.3.2. Trends Analysis

This research utilizes the Theil–Sen slope estimator and Mann–Kendall test to analyze the trends in vegetation CUE and WUE within the NMR over the past 23 years. The Theil–Sen slope estimator minimizes the impact of missing data and outliers on the time series, providing more reliable outcomes compared to simple linear regression or conventional least squares methods [36]. The Mann–Kendall (MK) test, known for its robustness against measurement errors and its ability to handle outliers, is extensively applied in trend analysis for time series data [37]. Additionally, the MK test is applied to evaluate the statistical significance of the observed trends in CUE and WUE in the study region. The respective calculation formulas are as follows:
θ s l o p e = m e d i a n x j x i j i ,   2001 i < j 2023
where θslope represents the trend in vegetation NEP, a value of θslope > 0 signifies an upward trend, θslope = 0 signifies stability, and θslope < 0 signifies a downward trend.
Z = S 1 s ( S ) ,   S > 0 0 , S = 0 S 1 s ( S ) , S < 0
S = j = 1 n 1 i = j + 1 n s g n [ x j x i ]
s g n x j x i = 1 ,   x j x i > 0 0 ,   x j x i = 0 1 ,   x j x i < 0
s S = n ( n 1 ) ( 2 n + 5 ) 18
where NEPi and NEPj represent the NEP values for the years i and j, respectively, measured in grams per square meter (g·m−2), n denotes the duration of the study period, sgn refers to the sign function, and Z is the standardized test statistic. For a specified significance level α, a trend is considered statistically significant if |Z| > Z1-α/2, indicating a meaningful trend in the time series at the α level. Conversely, if |Z| < Z1-α/2, the trend is not deemed significant. In this study, a change is defined as minor when the trend significance level is below α = 0.05 and significant when it is below α = 0.01.

2.3.3. Hurst Exponent Analysis

The R/S method is a classic and widely recognized approach for calculating the Hurst exponent [38]. The main steps involved in the calculation are as follows [39]:
ξ τ =   1 τ t = 1 τ x t ,     τ = 1 ,   2 , ,   n
X t ,   τ = u = 1 t ξ μ ξ τ ,     1 t τ
R τ = X t ,   τ 1 t τ m a x X t ,   τ ,     τ = 1 ,   2 , ,   n 1 t τ m i n
S τ = 1 τ t = 1 τ ξ t ξ τ 2 1 2 ,     τ = 1 ,   2 , ,   n
R τ S τ = c τ H
Based on the work of Hurst (H) [40] and Mandelbrot and Wallis [41], the H ranges from 0 to 1. When H is equal to 0.5, it signifies that the time series follows a random walk, with no persistence, meaning that future trends are independent of past trends. A value greater than 0.5 suggests positive persistence, where future trends are likely to align with past trends, with the degree of persistence increasing as the value rises. Conversely, a value below 0.5 signifies negative persistence (anti-persistence), implying that upcoming patterns tend to oppose past trends, with the opposition becoming stronger as the value decreases.

2.3.4. Stability Analysis

The coefficient of variation (CV) is a statistical metric used to quantify the spread of data points in relation to the average value in a given dataset [42]. This is determined by dividing the standard deviation by the average, making it a valuable indicator for comparing the variability between different datasets. In this research, CV is utilized to evaluate the geographic and temporal fluctuations of WUE and CUE within the NMR. The calculation of the CV value is as follows:
C V = i = 1 n x i x ¯ n 1 x ¯
where x denotes the mean value of CUE or WUE, n is the number of years in the time series, and xi represents the CUE or WUE of vegetation in the NMR for the i-th year. A smaller CV indicates a lower fluctuation in the data over time, suggesting greater stability, whereas a larger CV indicates higher variability, reflecting instability in the data.

2.3.5. Partial Correlation Analysis

This method was utilized to assess how CUE and WUE are influenced by fluctuations in climatic factors, including precipitation and temperature. This method allows for the examination of the connection between two factors while accounting for the effect of a third factor [43]. The process starts with determining the strength of the relationship between the two variables, followed by estimating the adjusted correlation that accounts for the influence of an additional variable. The formula for calculating the coefficient is as follows:
R x y = i = 1 n ( x i x ¯ ) ( y i y ¯ ) i = 1 n x i x ¯ 2 i = 1 n y i y ¯ 2
R a b , c = r a b r a c r b c 1 r a c 2 1 r b c 2
where Rxy denotes the measure of association between variables x and y; xi and yi donate the values in a given year; x represents the mean value; y denotes the cumulative value over the corresponding period; and n indicates the duration of the research timeframe.

3. Results

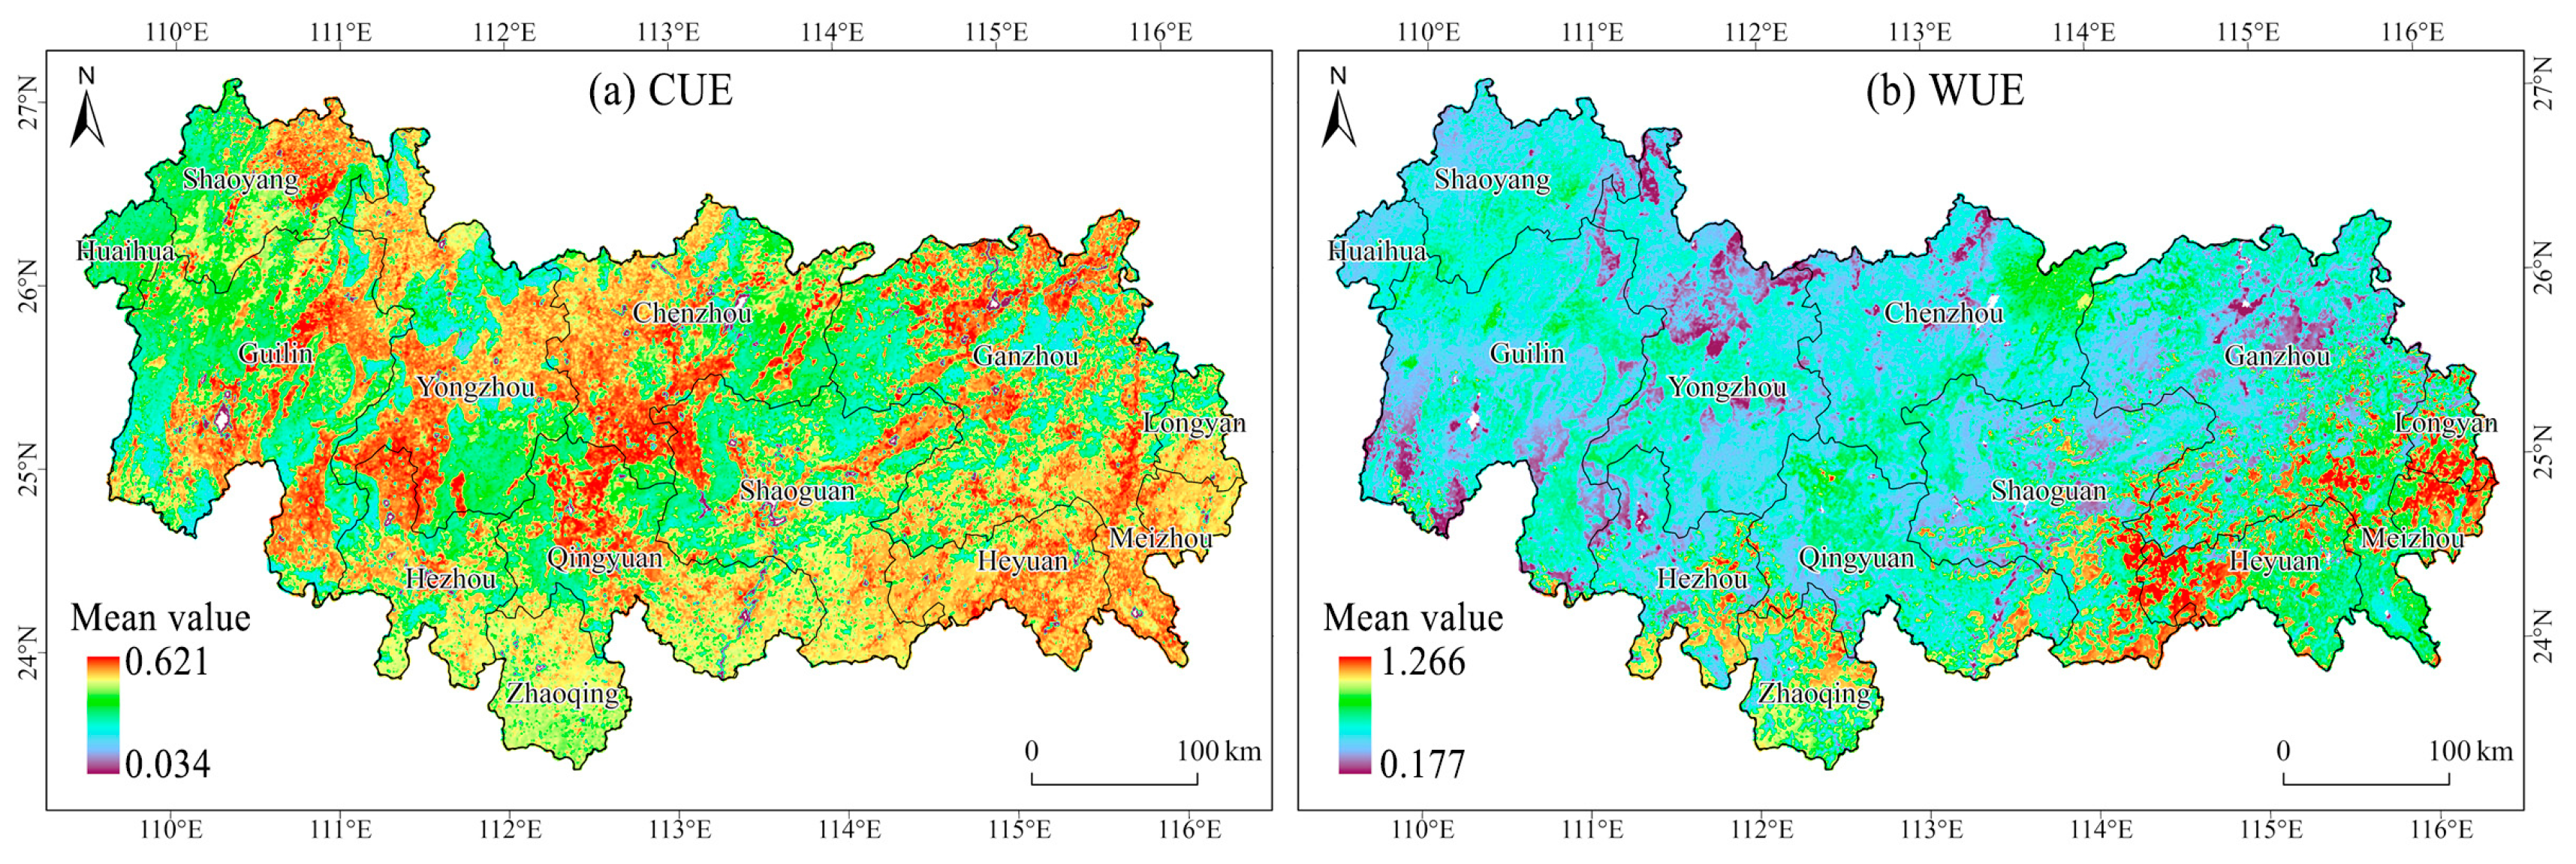
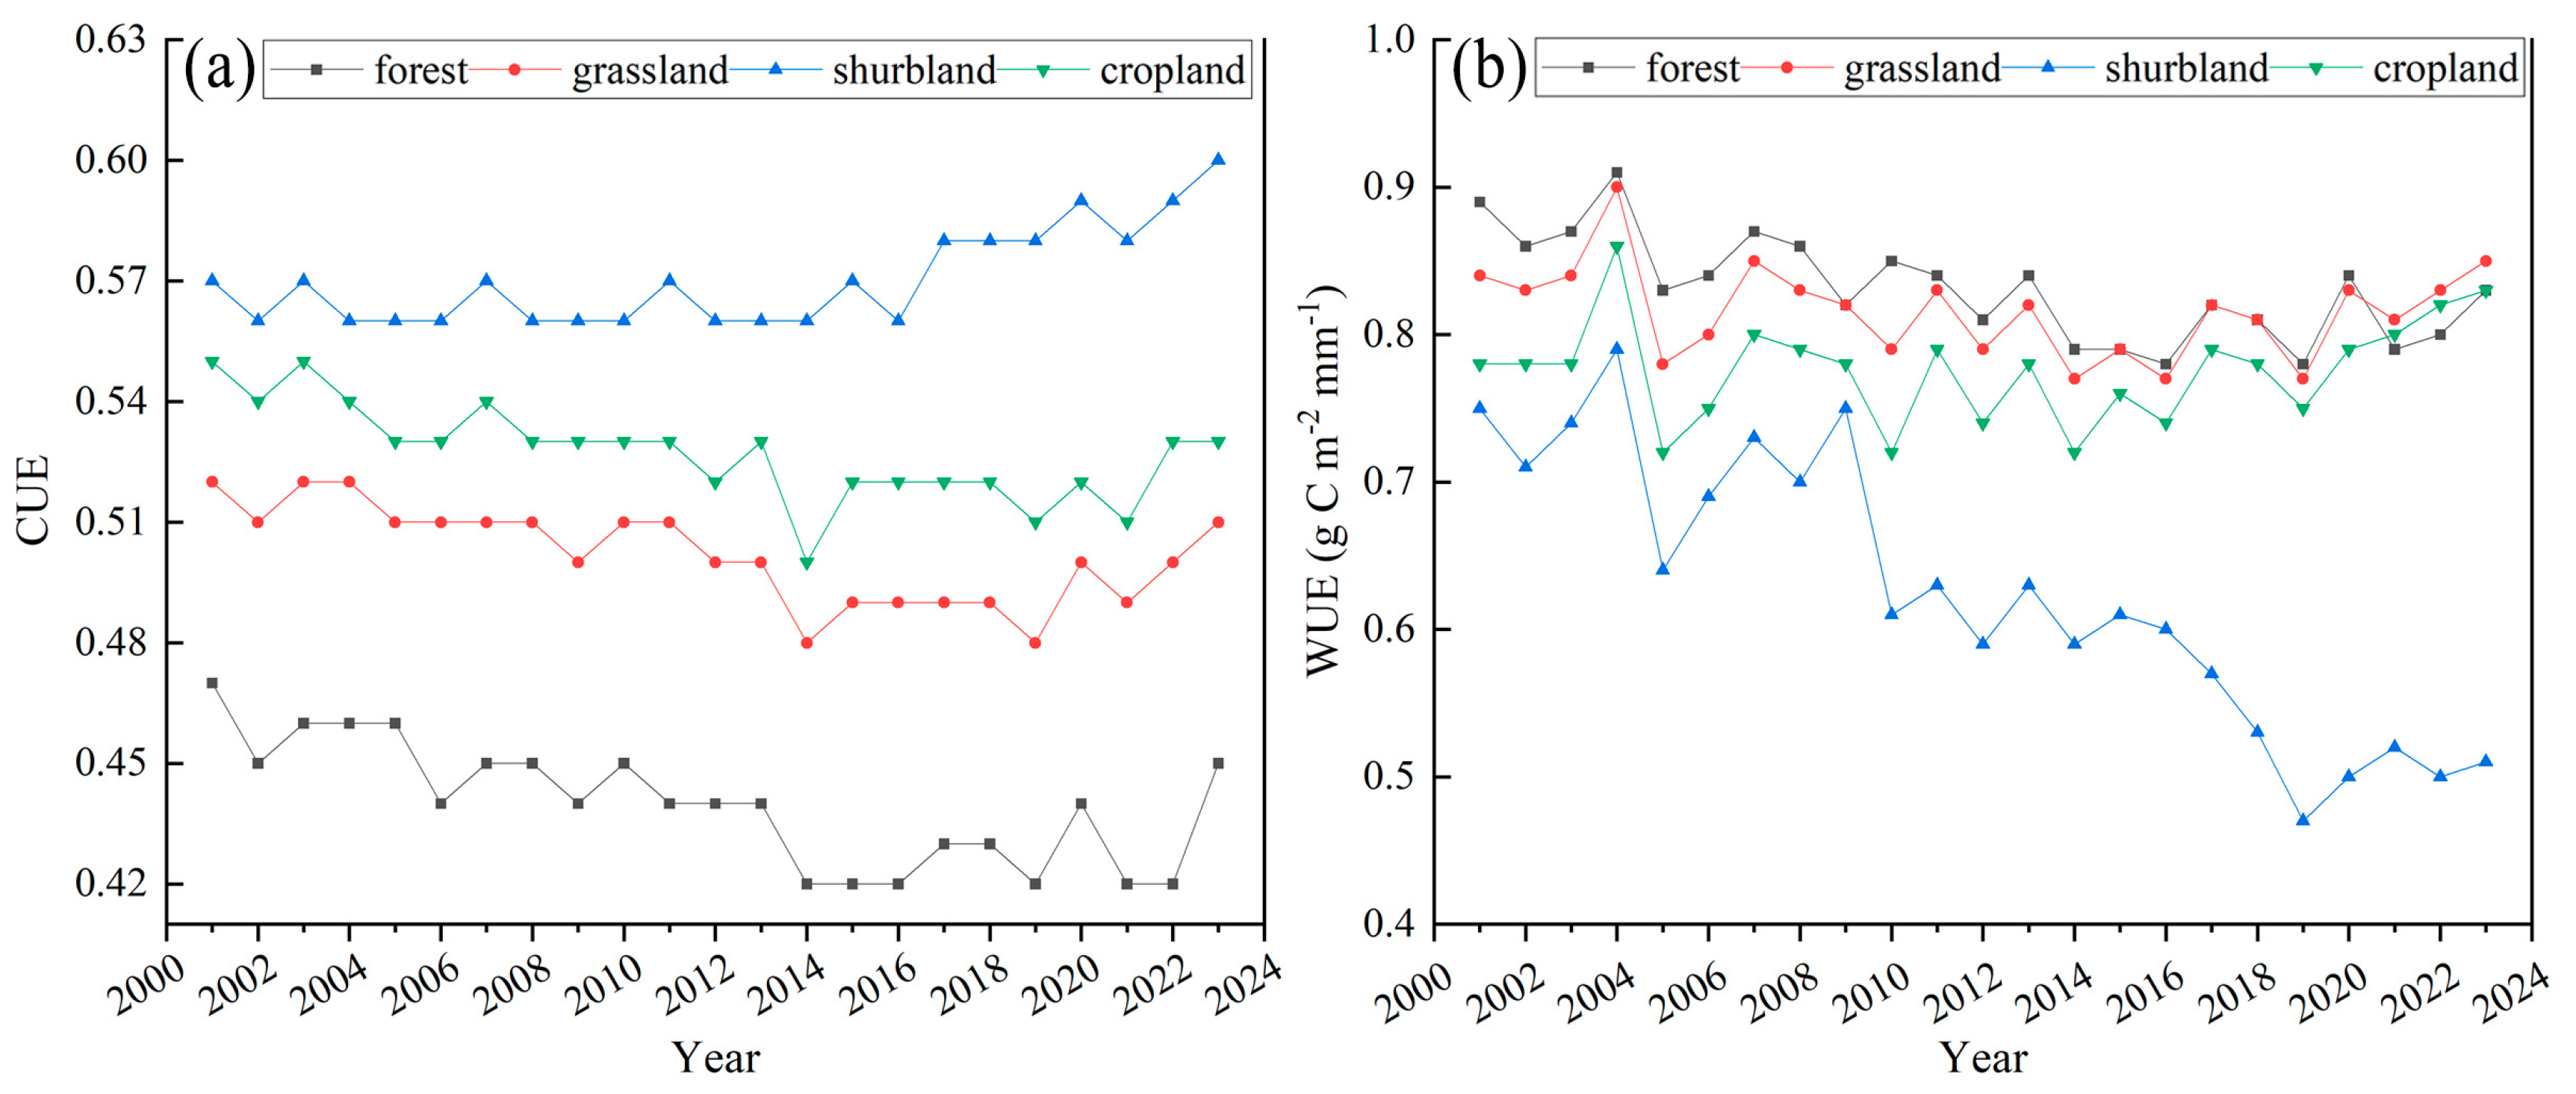
3.1. Spatial and Temporal Characteristics of Vegetation CUE and WUE

From 2001 to 2023, the average annual total values of GPP, NPP, and ET in the NMR were 1821.28 g C·m−2·a−1, 846.01 g C·m−2·a−1, and 1025 mm·a−1, respectively. These three vegetation indicators exhibited similar spatial distribution patterns, displaying a trend of “lower values in the northwest and higher values in the southeast”. All three indicators exhibited an upward trend throughout the study period, with GPP, NPP, and ET increasing at rates of 8.899 g C·m−2·a−1, 5.121 g C·m−2·a−1, and 1.864 mm·a−1, respectively (Figure 2). These results highlight the favorable vegetation growth conditions in the NMR and the significant improvements in ecological restoration outcomes.
The NMR’s CUE and WUE experienced a notable decrease (p < 0.05) between 2001 and 2023, with average values of 0.47 and 0.82 g C·m−2·mm−1, respectively. The annual rates of reduction were 0.0014 for CUE and 0.0022 for WUE, indicating that the year-to-year variations in CUE and WUE exhibited relative stability over the study duration. This study revealed an overall significantly declining trend in both CUE and WUE (p < 0.05), caused by the increases in GPP and ET outpacing that of NPP, leading to a reduction in the long-term averages of CUE and WUE in the NMR from 2001 to 2023. This steadiness was impacted by notable growth in GPP and ET (p < 0.01), alongside a non-significant increase in NPP (Figure 2). The minimum CUE value was noted in 2014, whereas the maximum was in 2001. For WUE, the peak value appeared in 2004, and the lowest was recorded in 2019. The CUE and WUE across the study region displayed marked spatial variability (Figure 3), generally reflecting a trend of “lower in the northwest and higher in the southeast”. Areas where CUE exceeded 0.5 made up 50.11% of the entire study region, while approximately 49.89% had a CUE below 0.5. For WUE, 49.91% of the area had values below 0.8, 38.49% fell between 0.8 and 1.0, and approximately 11.60% exceeded 1.0. Overall, among different vegetation types, the mean CUE was found to be highest in shrublands and lowest in forests, whereas the mean WUE was highest in forests and lowest in shrublands (Figure 4). The variation in CUE among different vegetation types was relatively small, with mean values ranking as follows: shrubland (0.570) > cropland (0.528) > grassland (0.502) > forest (0.440). In contrast, the mean WUE values varied more notably among vegetation types, ranking as follows: forest (0.831 g C·m−2·mm−1) > grassland (0.818 g C·m−2·mm−1) > cropland (0.776 g C·m−2·mm−1) > shrubland (0.624 g C·m−2·mm−1). The variations in CUE across various vegetation types were relatively small, and areas where CUE exceeds 0.5 accounted for 50.11% of the study region. The highest average CUE was found in shrubland (0.570), while the lowest was in forest (0.440), with a difference of 0.130. The WUE demonstrated considerable variation across different vegetation categories, highlighting significant distinctions in how various vegetation types utilize water resources. In particular, forested regions exhibited the highest WUE, reaching 0.831 g C·m−2·mm−1, whereas shrubland showed the lowest WUE at 0.624 g C·m−2·mm−1, resulting in a discrepancy of 0.207 g C·m−2·mm−1 between the highest and lowest values.

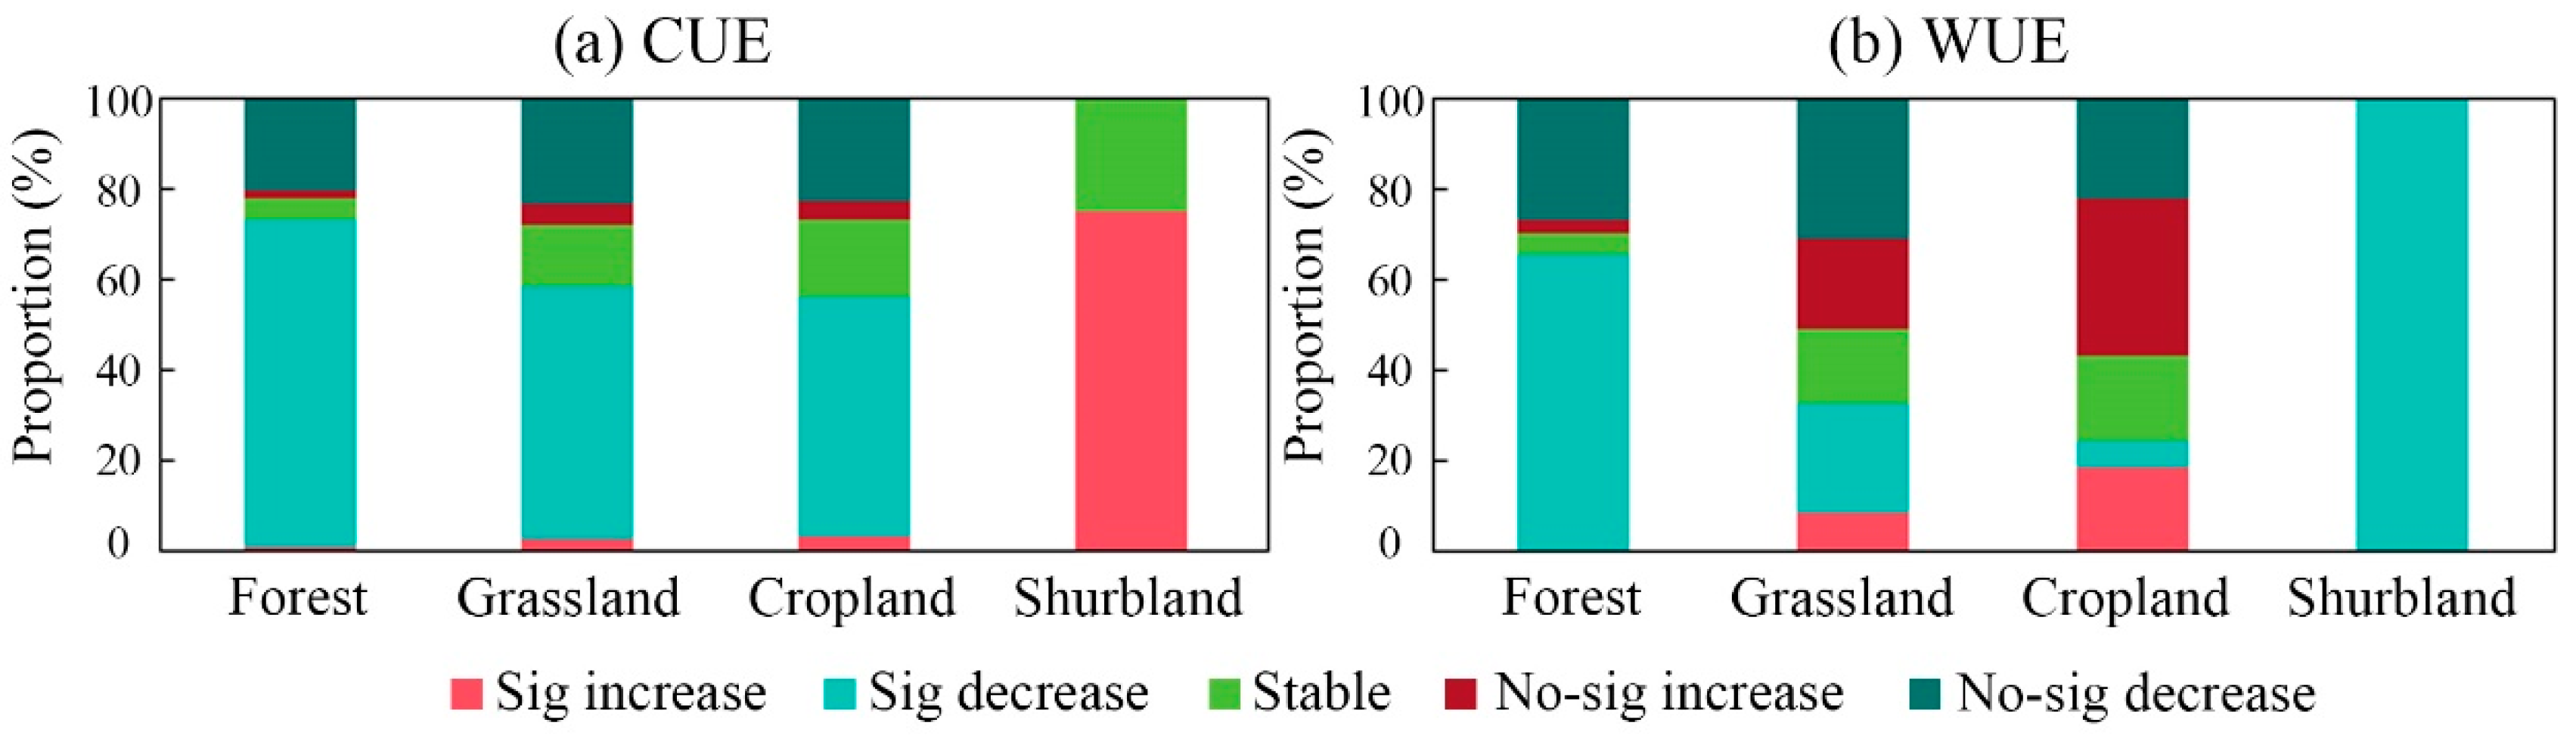
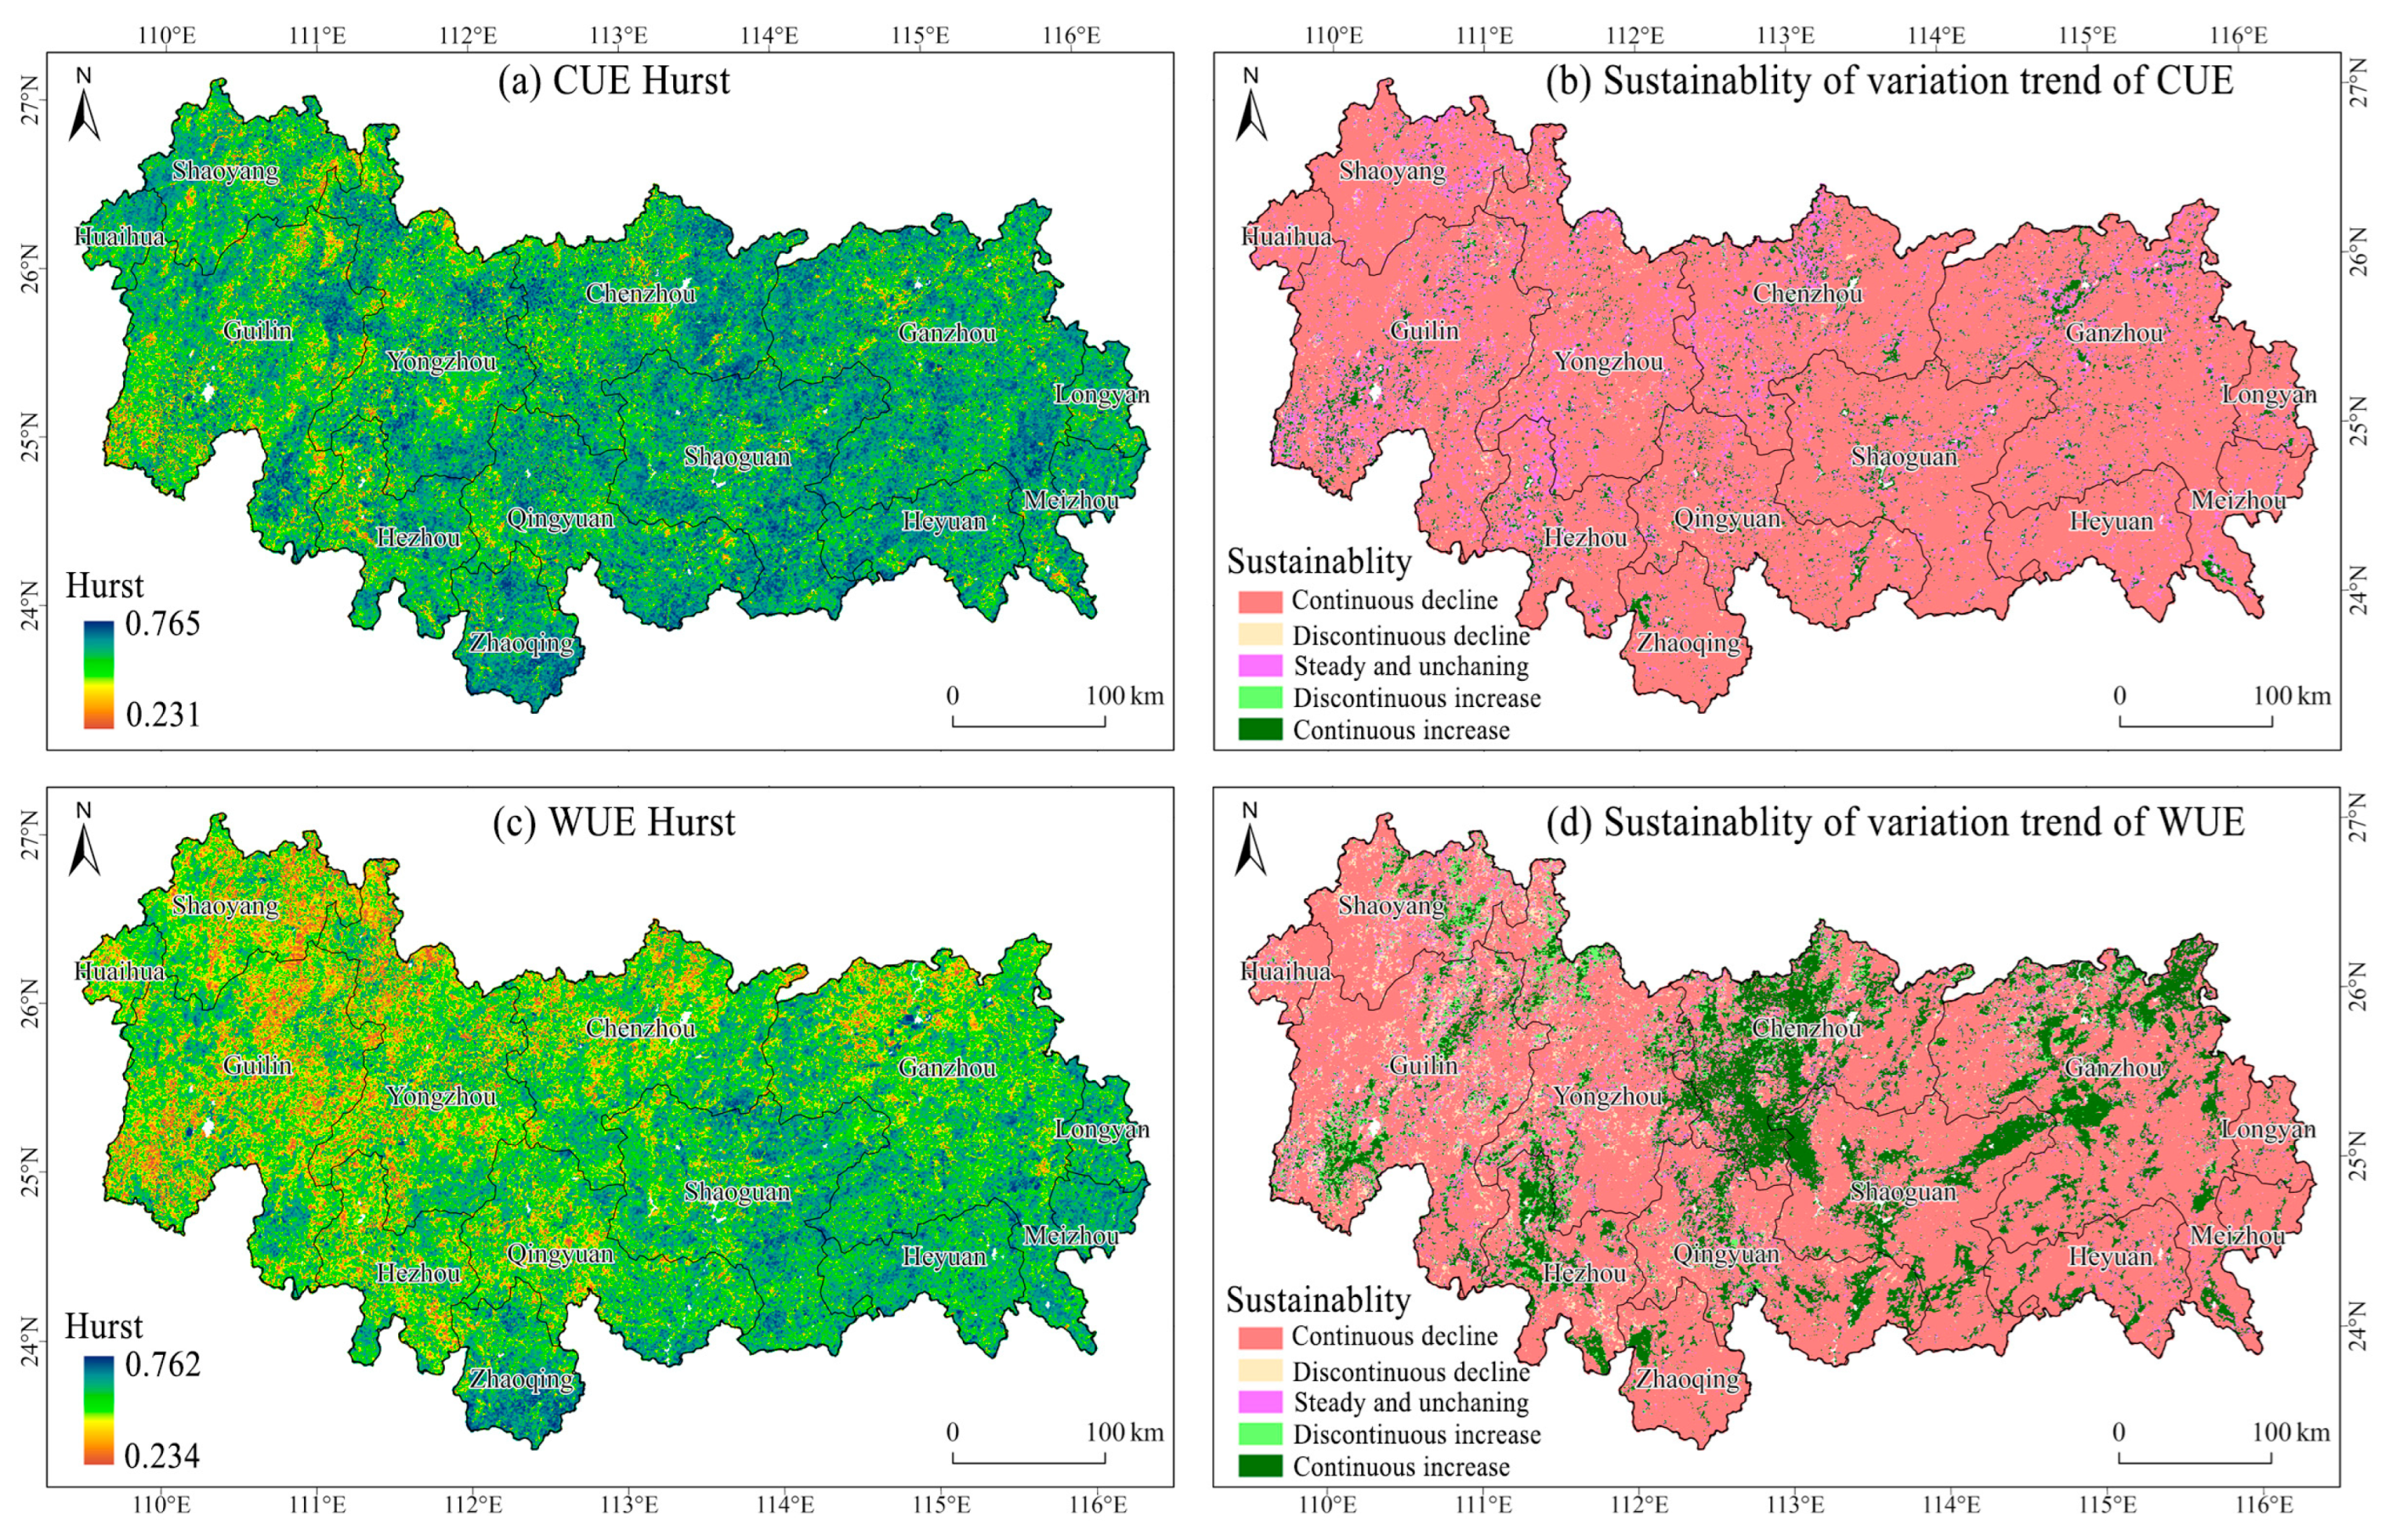
3.2. Analysis of Vegetation CUE and WUE Trends in the NMR

According to the Sen trend analysis of CUE and WUE development in the NMR (Figure 5a,c), the variation rate of CUE spanned from −0.015 to 0.019. Degrading regions (θ < 0) in CUE accounted for 90.03% of the total area, while improving regions (θ > 0) made up 9.97%, with the latter scattered sparsely distributed across the NMR. The WUE variation rate extended from −0.016 g C·m−2·mm−1 to 0.019 g C·m−2·mm−1, with degrading regions covering 73.60% of the area and improving regions accounting for 26.40%, primarily concentrated in the northern parts of the NMR. The Mann–Kendall (MK) test was employed to evaluate the significance of the CUE and WUE trends, dividing the study region into five distinct groups (Figure 5b,d). The analysis revealed that approximately 64.14% of the plant cover within the research region exhibited a significant degrading trend in CUE, 3.44% showed a significant improving trend, and 11.32% remained stable. The areas showing notable enhancements in CUE were primarily located in Zhaoqing, Ganzhou, Guilin, and Meizhou. For WUE, 39.88% of the region experienced a marked declining trend, 6.72% displayed a significant improving trend, and 8.31% remained stable. Regions with significant improvements in WUE were primarily located in Chenzhou, Ganzhou, Hezhou, and Guilin. The trends in the CUE and WUE of the NMR varied significantly across different vegetation types (Figure 6). For CUE, grassland showed the largest area of improvement, which was estimated at about 2.17 × 10³ km2, representing 2.39% of the entire grassland region. However, grassland also experienced the most extensive degradation, with a degraded area of 5.10 × 10⁴ km2, representing 55.92% of the grassland area. Forests exhibited the second most severe degradation, with a degraded region of approximately 4.42 × 10⁴ km2, which represents 72.72% of the total forest region. For WUE, grassland again demonstrated the largest improvement, with an improved area of 7.70 × 10³ km2, representing 8.45% of the grassland area. Conversely, forests experienced the most significant degradation, with a degraded area of 3.97 × 10⁴ km2, representing 65.45% of the overall forest region. Grassland followed as the second most severely degraded vegetation type, with a degraded area of approximately 2.19 × 10⁴ km2, representing 24.05% of the overall grassland region.
To gain deeper insights into the sustainability of CUE and WUE dynamics in the NMR, the Hurst exponent was calculated for pixel-level time series of CUE and WUE. Combined with the Sen analysis, the future trends and sustainability of CUE and WUE were evaluated (Figure 7). The Hurst exponent of CUE ranged from 0.231 to 0.765, while that of WUE ranged from 0.234 to 0.762 (Figure 7a,c). Areas where the Hurst exponent exceeded 0.5 comprised 95.95% of the region for CUE and 88.87% for WUE, indicating overall sustainability. Future projections show that vegetation CUE in the NMR is predominantly on a declining trajectory, with 81.67% of the area experiencing a sustained decline, widely distributed across the region. Areas with a sustained increase accounted for 5.54%, mainly concentrated in Ganzhou, Guilin, and Zhaoqing. Stable regions accounted for 11.32%, primarily surrounding areas of sustained improvement. Similarly, WUE is also expected to decline, with 65.16% of the area showing a sustained decline, extensively spread across the eastern and western regions of the NMR. Regions with a sustained increase in WUE accounted for 17.90%, primarily concentrated in Chenzhou, Ganzhou, and Shaoguan. Stable regions made up 8.31%, scattered around the NMR.

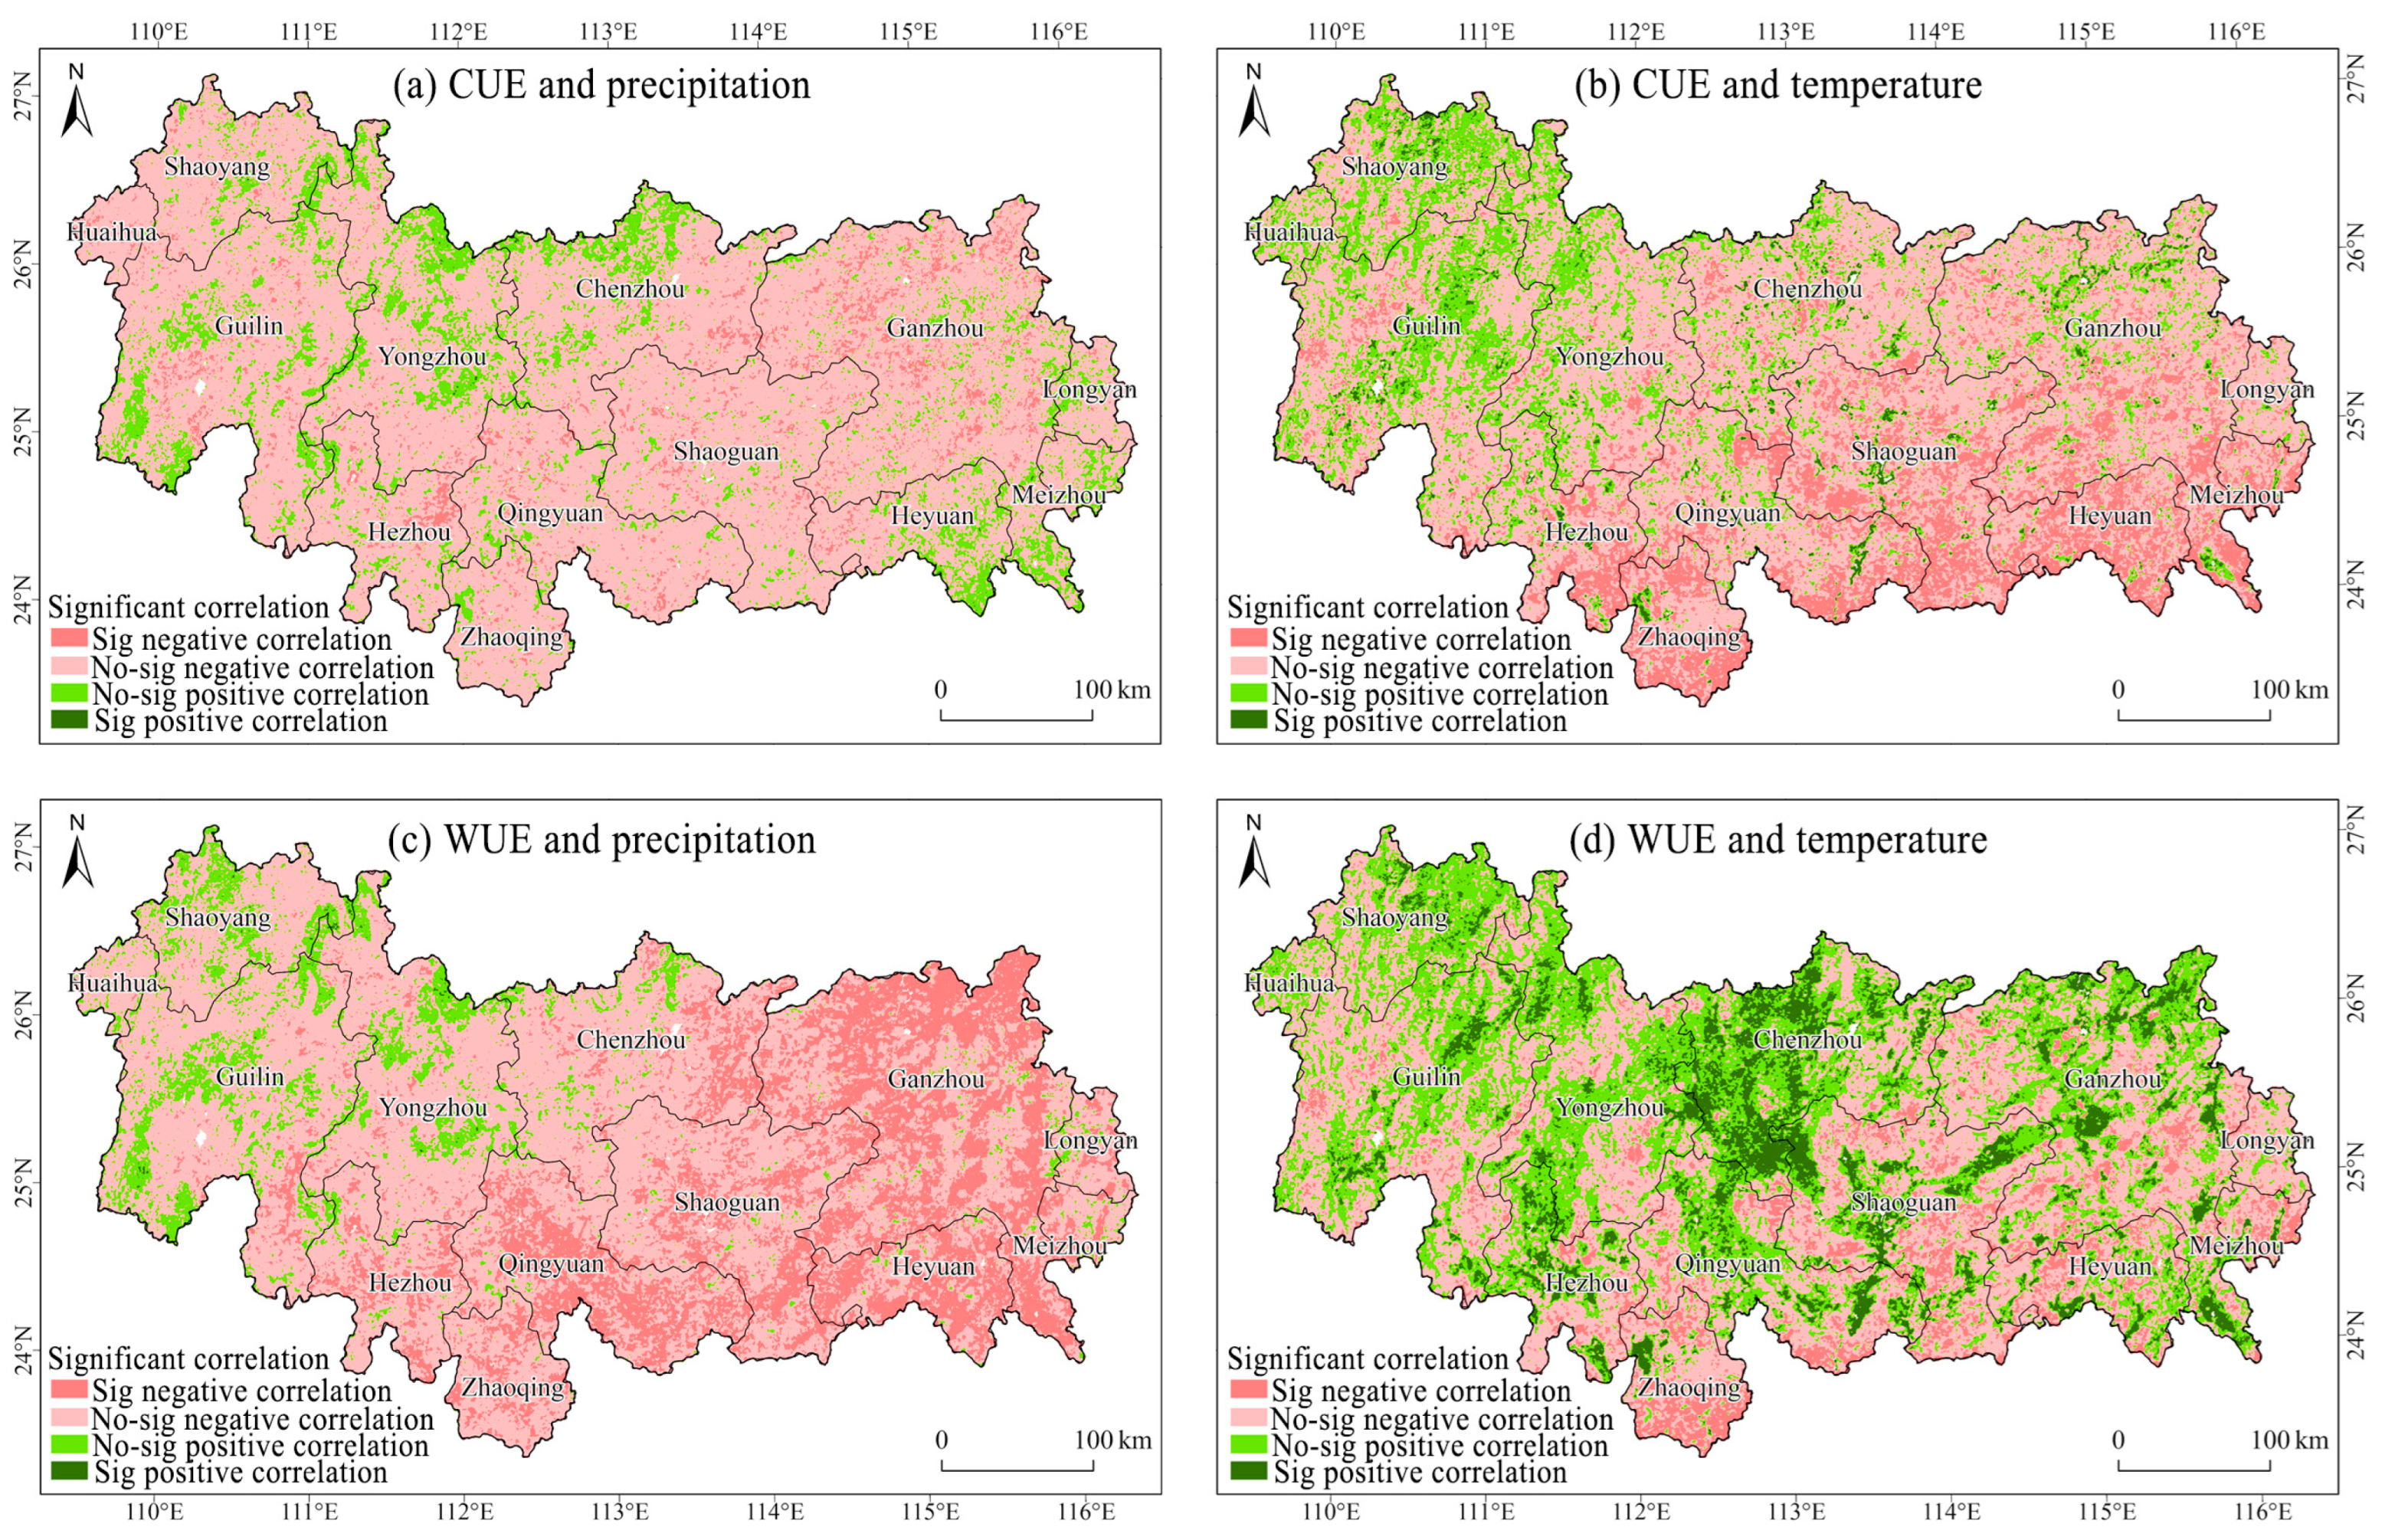
3.3. Response of Vegetation CUE and WUE to Changes in Precipitation and Temperature in the NMR

Temperature and precipitation are critical factors influencing variations in vegetation CUE and WUE. The impacts were evaluated by calculating the partial correlation coefficients connecting temperature, precipitation, and both CUE and WUE at the pixel level (Figure 8). The association between vegetation CUE and precipitation was primarily negative (85.65%), with partial correlation values ranging from −0.809 to 0.690 (Figure 9), which had an average coefficient of −0.173. The majority of these correlations were non-significant negative correlations (80.65%). Direct relationships linking CUE to precipitation were mainly found in the northwest and southeast parts of the research region, with a specific focus on Yongzhou, Chenzhou, Guilin, Heyuan, Meizhou, and Longyan. Significant positive correlations (0.06%) were scattered across the region. Significant negative correlations (5.03%) between CUE and precipitation were detected in the southern and northeastern sections of the research region, particularly in Hezhou, Ganzhou, and Shaoguan. Similarly, the association between vegetation CUE and temperature was predominantly negative (79.56%), with partial correlation values spanning from −0.882 to 0.852 (Figure 9), which had an average coefficient of −0.195. Significant negative correlations (18.09%) were primarily detected in the southeastern regions of the research area, particularly in Hezhou, Shaoguan, Qingyuan, Heyuan, and Meizhou, while significant positive correlations (1.89%) were observed in the northwestern regions, particularly in Shaoyang and Guilin. These findings suggest that temperature exerts a stronger influence on vegetation CUE compared to precipitation. For vegetation WUE, the majority of the relationships with precipitation were negative (90.57%), with coefficients spanning from −0.869 to 0.638 (Figure 9), which had a mean value of −0.276. Notable inverse relationships (25.14%) between WUE and precipitation were primarily distributed in Qingyuan, Shaoguan, Heyuan, Meizhou, and Ganzhou, whereas positive correlations (9.43%) were mainly found in Guilin, Shaoyang, and Yongzhou. The association of vegetation WUE with temperature was also predominantly negative (54.92%), with the coefficients spanning from −0.824 to 0.838 (Figure 9), which had a mean value of −0.019. Notable inverse relationships (8.94%) linking WUE to temperature were identified in Zhaoqing, Shaoguan, Qingyuan, and Meizhou, while significant positive correlations (10.39%) were concentrated in Chenzhou and Ganzhou. These results indicate that, while temperature also has an effect, it is precipitation that plays a significantly more prominent role in influencing vegetation WUE.
Vegetation CUE showed a predominantly inverse relationship to precipitation. The average correlation coefficients between CUE and precipitation for forest, grassland, shrub, and cropland were all negative, with grassland showing the largest negative correlation coefficient (−0.19) and shrubland the smallest (−0.03) (Figure 10). Notably, 2.88% of cropland areas demonstrated a marked inverse relationship to precipitation, covering approximately 178.48 km2, the largest proportion among the four vegetation types. Additionally, shrubland exhibited a notable inverse relationship linking CUE to precipitation. Similarly, CUE and temperature were also primarily negatively correlated. Interestingly, shrubland had a mean positive correlation value of 0.55 (Figure 10), indicating a strong direct relationship linking CUE to temperature, while all other vegetation types showed negative correlations. Furthermore, 20.57% of forest areas demonstrated a marked inverse relationship linking CUE to temperature, covering approximately 8724.20 km2, which was the largest proportion among the four vegetation types.
For vegetation WUE, negative correlations with precipitation were dominant, with the mean correlation coefficients for forest, grassland, shrub, and cropland all being negative (the largest being −0.37 for shrubland and the smallest −0.20 for forest) (Figure 10). Notably, 32.20% of grassland areas exhibited a significant negative correlation with precipitation, covering approximately 22,300 km2, the largest proportion among the four vegetation types. In terms of the connection linking WUE to temperature, the association was predominantly negative for forest and shrubland, with average values of −0.22 and −0.53, respectively (Figure 10). Conversely, grassland and cropland showed positive correlations with temperature, with average correlation coefficients of 0.08 and 0.30, respectively. This indicates that the association between WUE and temperature is largely inverse for forest and shrubland, whereas it tends to be positive for grassland and cropland. Furthermore, 27.12% of cropland areas exhibited a significant positive correlation with temperature, covering approximately 1424.05 km2, while 14.09% of forest areas exhibited a significant negative correlation, covering approximately 5942.79 km2.

4. Discussion

4.1. Spatial and Temporal Dynamic and Distribution of CUE and WUE in NMR

Based on remote sensing observations and reanalysis data, this paper analyzed the CUE and WUE of vegetation in the NMR from 2001 to 2023. The results revealed that the average value of vegetation CUE and WUE on the NMR was 0.47 and 0.82 g C·m−2·mm−1 for the 23-year period, respectively. In Chinese terrestrial ecosystems, the overall vegetation CUE spanned from 0.44 to 0.53, and the average value, which remained relatively stable, was 0.5 [44]. Yang et al. discovered the average CUE for open shrublands to be significantly higher compared to other grassland categories worldwide [45]. The findings of the aforementioned studies align closely with what has been observed in this research. The study identified a significant overall decline in both CUE and WUE (p < 0.05) in the NMR from 2001 to 2023, primarily driven by the faster increases in GPP and ET compared to NPP, which resulted in reductions in the long-term averages of CUE and WUE. Globally, CUE exhibited a slight reduction from 2000 to 2009 [46], while WUE demonstrated a negligible decline from 2000 to 2012 (p > 0.05) [47]. In the Chinese terrestrial ecosystem, the annual CUE of vegetation showed a slight overall increasing trend from 2007 to 2013 [17], and the annual WUE of vegetation, based on remote sensing-driven analytical models, rose markedly at a pace of 0.021 g C mm−1 H2O y−1 from 2000 to 2016 (p < 0.01) [48]. Additionally, Qin et al. [18] reported a slight annual decline in WUE across Central Asia from 2001 to 2021 (p > 0.05), whereas the yearly mean WUE of vegetation in China showed an upward trend of 0.003 g C·m−2·mm−1·a−1. Despite this, some researchers have observed increasing trends in vegetation CUE and WUE within specific study regions over certain periods. For instance, vegetation CUE on the Mongolian Plateau showed a notable rise from 2000 to 2019, growing at an annual pace of 0.2% [23], while vegetation ecosystem WUE on the Loess Plateau also exhibited a marked increase between 2000 and 2014, rising by 0.02 g C·kg−1 H2O annually (p < 0.001) [21]. This indicates that the distribution of vegetation CUE and WUE exhibits significant geographical variation, influenced by differences in study regions and time periods. Such variations highlight the complex interactions between vegetation productivity, water use efficiency, and regional climatic and ecological factors, underscoring the need for spatially and temporally explicit analyses to better understand ecosystem processes and their responses to environmental changes.
In terms of spatial distribution, both vegetation CUE and WUE exhibit distinct spatial heterogeneity, generally following a trend in smaller values in the northwest and greater values in the southeast. Studies have shown that topographic factors, such as higher altitudes, often lead to an increase in vegetation CUE. In higher elevation areas, cooler temperatures reduce autotrophic respiration, which in turn enhances carbon sequestration by vegetation, resulting in a higher CUE [25]. However, the relationship linking vegetation CUE to elevation in this research is not significant, with higher-altitude areas not exhibiting higher CUE. Similarly, vegetation WUE follows a pattern comparable to CUE, suggesting that a variety of factors play a role in shaping the spatial patterns of both CUE and WUE, rather than strictly following the expected patterns. The investigation into future tendencies and the stability of vegetation CUE in the NMR indicates notable patterns, with 90.03% of the study area experiencing a decline. This pattern is consistent with long-term trends in vegetation CUE in South China, as well as predictions for future changes [17]. Likewise, areas with higher vegetation CUE in the study region exhibit lower coefficients of variation, indicating low fluctuation, which aligns with observed CUE changes in vegetation across China [17]. The variations in CUE across different vegetation types were relatively minor, with areas where CUE exceeded 0.5 comprising 50.11% of the study region. Shrubland exhibited the highest average CUE (0.570), whereas forest displayed the lowest (0.440), resulting in a difference of 0.130. The reduced CUE observed in forests can be explained by a combination of factors. Irregular seasonal rainfall in the region increases physiological stress on vegetation during the dry season, which reduces its carbon fixation capacity [49]. The complex structure of forest stands may lead to the uneven distribution of light and resources, further impacting the CUE of certain vegetation [50]. Moreover, studies indicate that human activities in South China, such as deforestation and afforestation, have led to frequent land use changes, which can disrupt the balance of existing ecosystems and influence vegetation CUE [51]. The geographic distribution of vegetation WUE typically shows greater values in the southeast and smaller values in the northwest. WUE showed substantial variation among different vegetation types, underscoring significant differences in water resource utilization across vegetation categories. Forested regions demonstrated the highest WUE at 0.831 g C·m−2·mm−1, while shrubland exhibited the lowest WUE at 0.624 g C·m−2·mm−1, resulting in a notable difference of 0.207 g C·m−2·mm−1 between the two extremes. This disparity can be attributed to several factors. On the one hand, forest ecosystems tend to have dense canopies, which enhance photosynthetic efficiency [52]. Additionally, the well-developed root systems of forest vegetation contribute to better water retention. On the other hand, the long-term execution of the “Grain for Green” initiative within the study region has improved vegetation conditions, thereby enhancing water conservation functions [53]. In contrast, the lower WUE in croplands may be due to poorer soil texture, which affects soil permeability and water retention capacity, thereby reducing WUE [54].

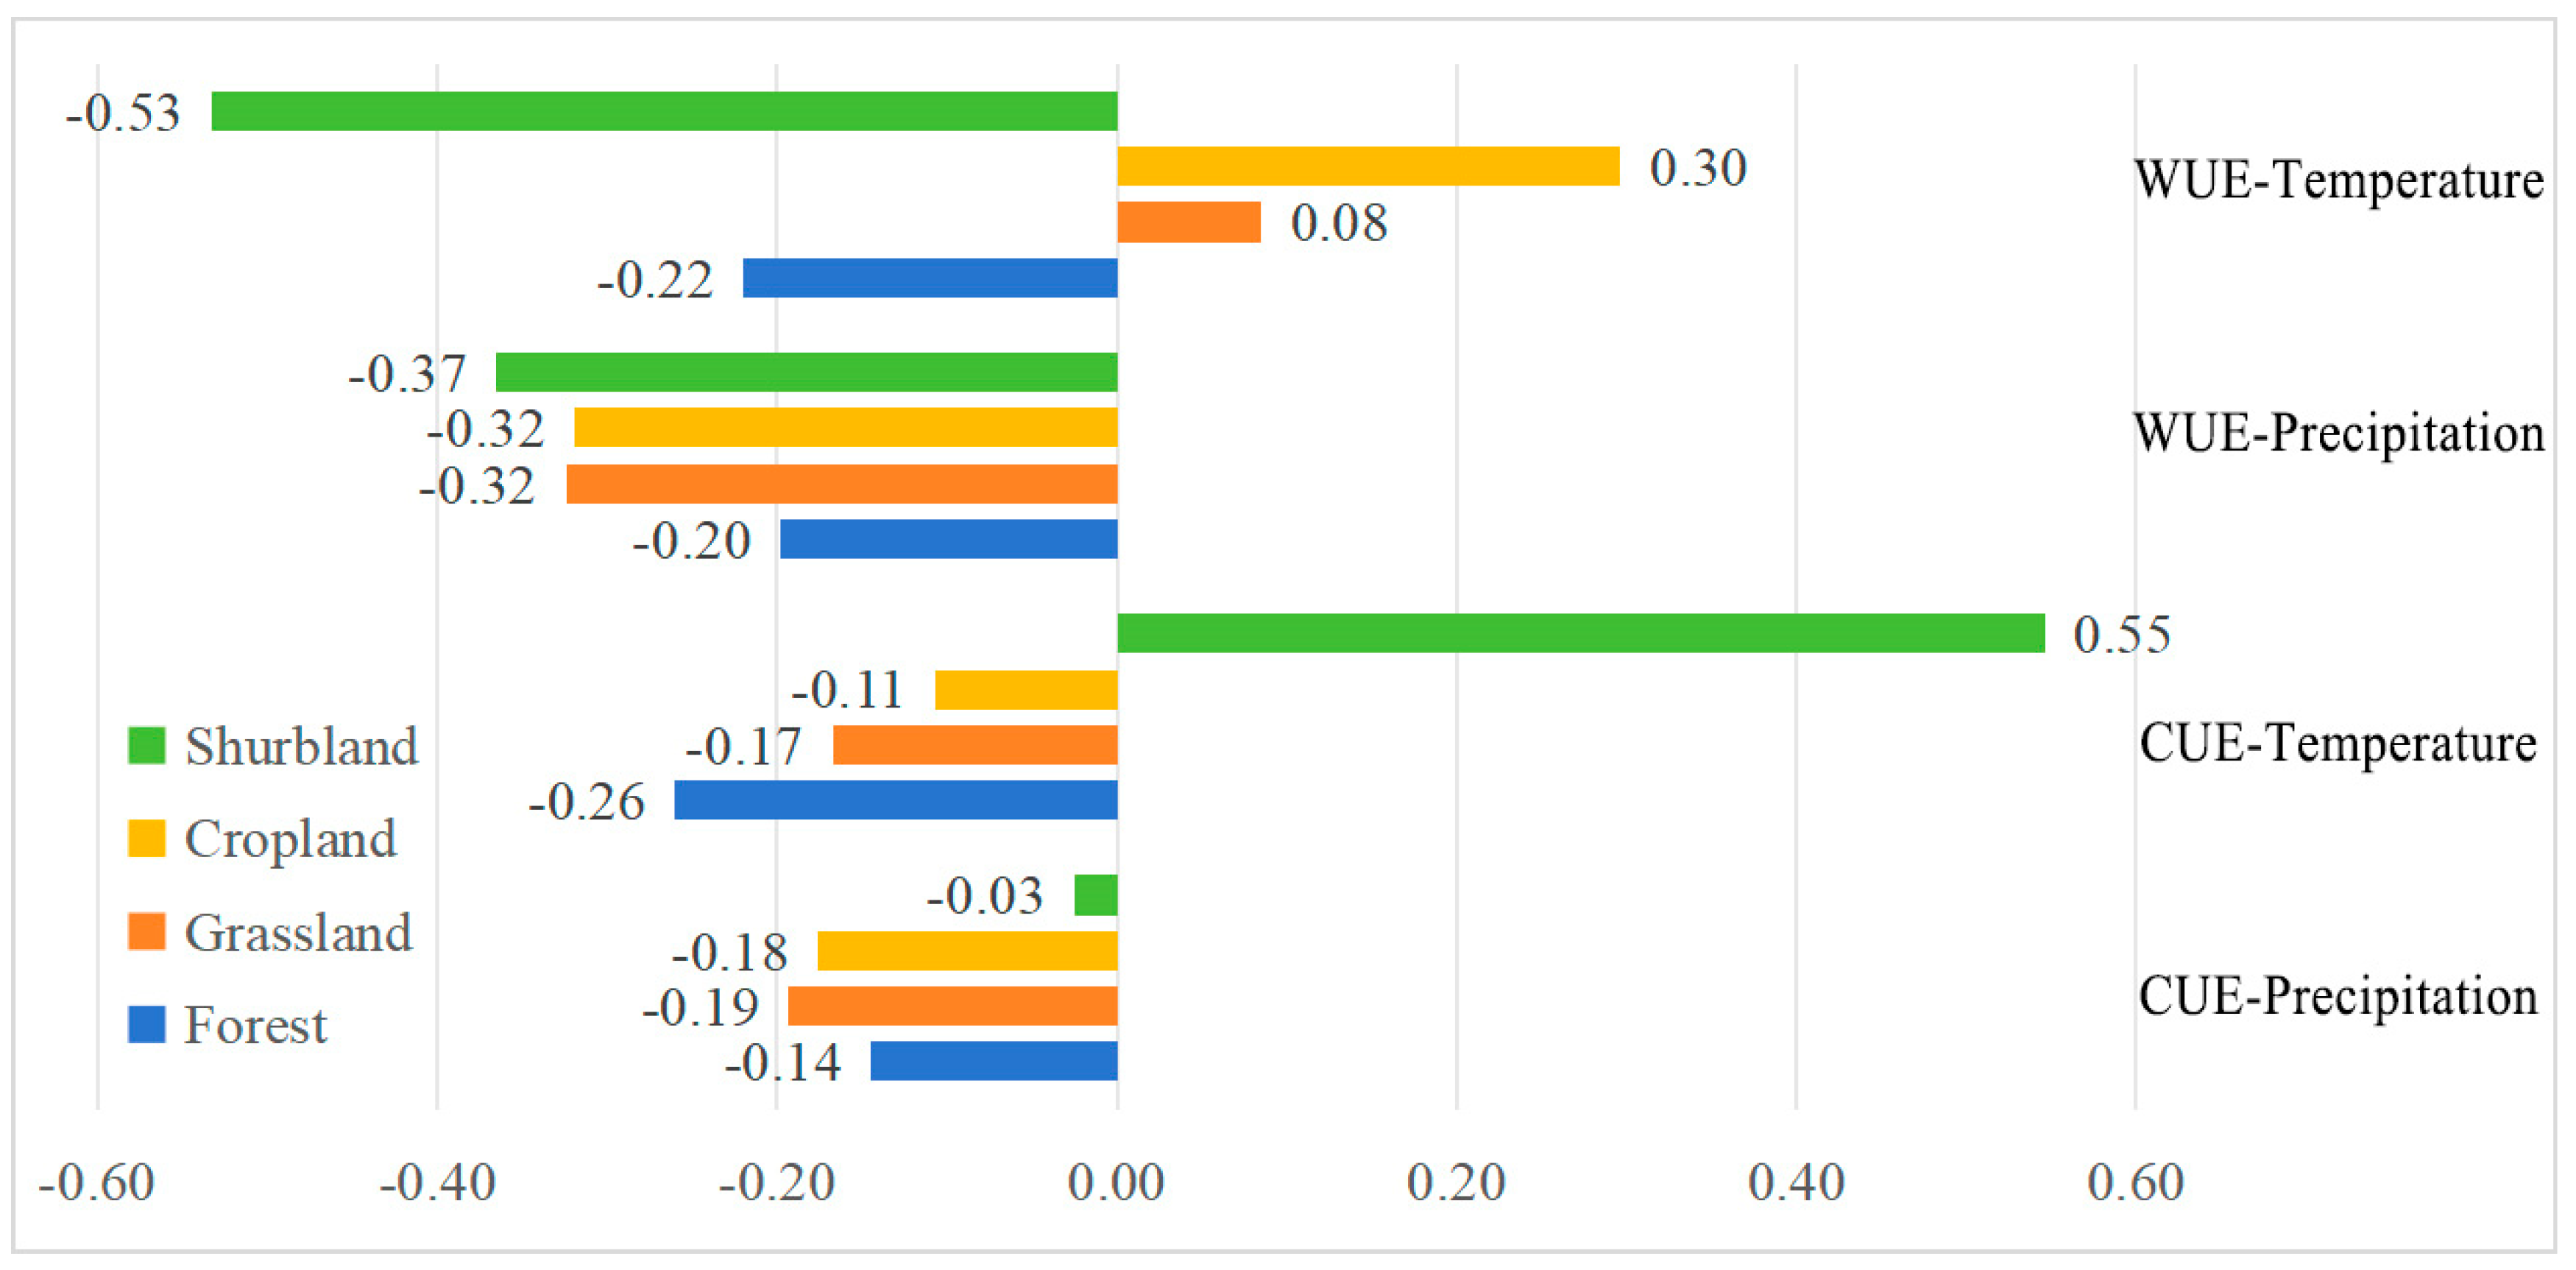
4.2. Influencing Factors of CUE and WUE Variation in the NMR

The vegetation CUE of NMR tended to have an inverse relationship with precipitation (80.65%), with the majority of areas showing a non-significant negative correlation. This result aligns with findings from previous studies in South China, where vegetation CUE showed a weak inverse relationship to precipitation that was not statistically significant [17]. Regions showing a notable inverse relationship linking CUE to precipitation (5.03%) are situated in the southern and northeastern sections of the NMR, especially around Hezhou, Ganzhou, and Shaoguan. This may be due to frequent precipitation, which is often accompanied by cloudy weather, reducing sunlight and consequently affecting photosynthetic efficiency, thereby lowering CUE [55]. Furthermore, excessive precipitation may lead to soil moisture saturation, disrupting root respiration and soil microbial activity, which further diminishes CUE [56]. Conversely, areas (0.06%) showing a strong direct relationship linking CUE to precipitation are scattered, suggesting that moderate rainfall in these areas can enhance photosynthesis and favor the accumulation of organic carbon in shallow plant roots, ultimately increasing CUE [57]. Vegetation CUE also exhibits a primary negative correlation with temperature (79.56%), aligning with the findings of earlier research [17]. Temperature changes affect plant respiration rates, and a moderate increase in temperature leads to higher organic matter consumption through respiration, reducing carbon sequestration [58]. Conversely, overly elevated temperatures may hinder the photosynthetic process and suppress plant growth, further decreasing carbon fixation [59]. Regions exhibiting a notable inverse relationship linking CUE to temperature (18.09%) are predominantly situated in the southeastern section of the NMR, particularly in Hezhou, Shaoguan, Qingyuan, Heyuan, and Meizhou. These regions, compared to others, have higher population densities, greater urbanization, and more pronounced temperature fluctuations, which could account for the marked inverse relationship observed between vegetation CUE and temperature in these areas. Vegetation WUE is predominantly negatively correlated with precipitation (90.57%), aligning with the results reported by Zhao et al [48]. Increased temperatures lead to higher evapotranspiration rates and greater water loss, thus reducing vegetation water use efficiency [60]. Similarly, vegetation WUE exhibits an overall negative correlation with temperature (54.92%), but the proportion of positive correlation (45.08%) is not much smaller than the negative correlation. Regions exhibiting a strong direct relationship linking WUE to temperature (10.39%) are primarily concentrated in Chenzhou and Ganzhou. On one hand, favorable temperature conditions may enhance photosynthesis, while sufficient precipitation ensures that plants can effectively use water even under higher temperatures [61]. On the other hand, the temperature increase in these areas may be linked to longer growing seasons and enhanced photosynthetic activity, contributing to the observed direct relationship linking WUE to temperature [62]. The findings highlighted the complex and region-specific interactions between vegetation efficiency metrics (CUE and WUE) and climatic variables. Future research should focus on incorporating additional factors, such as soil nutrient availability, land use changes, and atmospheric CO2 concentrations, to better understand their combined effects on vegetation CUE and WUE. Additionally, the role of climate extremes, such as droughts and heatwaves, deserves further exploration to predict ecosystem responses under future climate scenarios.
The differing responses of vegetation types to precipitation and temperature highlight the complexity of ecosystem processes in the NMR. Grasslands are the vegetation types that show the strongest inverse relationship linking CUE to precipitation, while the weakest is shrubland. In the NMR, which are dominated by subtropical forest ecosystems, water availability becomes a major limiting factor for grassland growth [45]. This may be because grasslands are significantly limited by insufficient water, which leads to reduced carbon absorption efficiency. In contrast, an overabundance of rainfall can lead to water saturation or oxygen depletion in the soil, inhibiting the growth and photosynthetic activity of shrubs, thereby reducing their carbon use efficiency [63]. Shrubland CUE exhibits a significant negative correlation with precipitation, likely due to the deeper root systems of shrubs, which can access groundwater during periods of low rainfall. However, with increased precipitation, excess water may lead to soil anoxia or water retention, adversely affecting root respiration and carbon conversion efficiency, resulting in a decrease in CUE [64]. Notably, temperature exhibits a strong direct relationship with shrubland CUE, whereas it is negatively correlated with CUE in other vegetation types. This could be because shrubs are more drought-tolerant and can utilize water and nutrients more effectively in high-temperature environments, whereas other vegetation types are more constrained by water evaporation, leading to a reduction in CUE [20]. Precipitation is negatively correlated with the WUE of forests, grasslands, shrublands, and croplands, with shrublands exhibiting the strongest negative correlation (−0.37) and forests the weakest (−0.20). On one hand, excessive precipitation leads to water retention, which limits the water use efficiency of shrublands [26]. On the other hand, forests have a strong water regulation capacity, and increases in precipitation do not significantly impact their water use efficiency [48]. Grasslands and croplands show a predominantly positive correlation with temperature in terms of WUE, whereas forests and shrublands primarily exhibit a negative correlation. Grasslands and croplands have high photosynthetic efficiency and short growing cycles, allowing them to rapidly enhance photosynthesis and transpiration in response to rising temperatures, thereby improving water use efficiency [65]. In contrast, forests and shrublands have larger biomass and deeper root systems. As temperatures rise, they experience increased transpiration, leading to greater water expenditure and a decline in effective water utilization efficiency [4]. Future research should focus on examining the interplay between soil characteristics, vegetation attributes, and climatic factors to gain a deeper understanding of the mechanisms driving these relationships.

4.3. Uncertainty and Limitation

This research investigated the spatiotemporal dynamics of vegetation CUE and WUE in the NMR and analyzed how these efficiencies are affected by climate change. The findings offer important perspectives on the processes governing ecosystem carbon and water dynamics. However, several uncertainties and limitations should be acknowledged. Firstly, although CUE and WUE were estimated using remote sensing products, the NPP, GPP, and ET datasets were derived from worldwide datasets. The lack of flux tower observations may impact the accuracy of the results. However, as flux tower networks in the NMR are developed and expanded, this limitation is expected to be mitigated. The uncertainty associated with WUE and CUE calculations based on MODIS data is generally within an acceptable range. Tang et al. [66] validated the MODIS-derived WUE results using flux tower data from 32 sites, reporting R2 values ranging from 0.74 to 0.963 across different vegetation types. He et al. [67] validated MODIS-derived CUE estimates using eddy covariance flux tower data (Fluxnet), demonstrating a strong correlation between MODIS estimates and tower-based measurements across different vegetation types, with R2 values ranging from 0.68 to 0.91. Additionally, this study primarily focused on precipitation and temperature as the primary climatic variables influencing CUE and WUE. However, other potential factors, such as human activities (e.g., land use changes) [64], increased CO2 concentration [6], and soil physicochemical properties (e.g., soil nutrient availability, pH, and moisture content) [68], can also affect vegetation CUE and WUE. The transition from high vegetation cover to low vegetation cover can lead to a relative decline in WUE. This shift may influence vegetation WUE by altering soil water retention capacity and vegetation transpiration [69]. Elevated CO2 concentrations typically enhance vegetation WUE, as plants can utilize water more efficiently in high-CO2 environments while reducing stomatal opening to minimize water loss [70]. Increased soil nutrients can enhance vegetation photosynthetic efficiency, promoting an improvement in CUE, while changes in soil moisture content directly influence plants’ water uptake capacity and subsequently affect WUE [71]. To further enhance the accuracy of identifying the principal drivers of CUE and WUE, it is crucial to integrate flux tower observational data with remote sensing information. This comprehensive method would enable a clearer insight into the regional and temporal variations in vegetation CUE and WUE, particularly in more localized regions.

5. Conclusions

This study investigated the spatiotemporal evolution of vegetation CUE and WUE, utilizing remote sensing data to identify potential influencing variables. The results revealed a significant decline in both CUE and WUE over the period from 2001 to 2023, with rates of change of 0.0014/a and 0.0022/a, respectively. Meanwhile, this pattern was found to be statistically significant (p < 0.05). The average CUE and WUE values in the NMR during this time were 0.47 and 0.82 g C·m−2·mm−1, respectively, exhibiting clear geographic variation. Specifically, a noticeable geographic trend was identified, with smaller values in the northwest and larger values in the southeast. Moreover, the trends in CUE and WUE exhibited notable variation across different vegetation types. Sen trend analysis revealed that CUE showed widespread degradation, with 90.03% of the area experiencing a negative rate of change. WUE also exhibited a marked degradation trend across 73.60% of the region. The Mann–Kendall test confirmed significant declining trends in 64.14% of the CUE values and 39.88% of WUE values, with some regions, such as Zhaoqing, Ganzhou, and Guilin, showing improvements. The Hurst exponent analysis showed sustainability in the trends across most of the areas, with 95.95% for CUE and 88.87% for WUE. However, future projections suggest that the overall trajectory for both CUE and WUE in the NMR is likely to continue declining. The decline in CUE and WUE was linked to climate factors, with precipitation strongly influencing WUE and temperature having a greater impact on CUE. Despite some regions showing potential for recovery, projections suggest continued decline in both CUE and WUE across most of the region, influenced by environmental shifts and anthropogenic factors.

Author Contributions

Conceptualization, S.L. and P.Z.; methodology, J.L.; software, Z.T.; validation, S.L., P.Z. and Z.T.; formal analysis, J.H.; investigation, P.Y.; resources, H.C.; data management, S.L.; writing—original draft preparation, S.L.; writing—review and editing, P.Z.; visualization, S.L.; supervision, P.Z.; project administration, J.H.; funding acquisition, P.Z. All authors have read and agreed to the published version of the manuscript.

Funding

This research was funded by GDAS’ Project of Science and Technology Development (2022GDASZH-2022010201-01), GDAS’ Project of Science and Technology Development (2022GDASZH-2022010106), the Science and Technology Program of Guangdong (No. 2024B1212080005), and the Science and Technology Planning Project of Guangdong Forestry Bureau (LC-2021124).

Data Availability Statement

No new data were created or analyzed in this study. Data sharing is not applicable to this article.

Conflicts of Interest

The authors declare no conflicts of interest.

References

  1. Mystakidis, S.; Davin, E.L.; Gruber, N.; Seneviratne, S.I. Constraining future terrestrial carbon cycle projections using observation-based water and carbon flux estimates. Glob. Change Biol. 2016, 22, 2198–2215. [Google Scholar] [CrossRef] [PubMed]
  2. Piao, S.; Fang, J.; Ciais, P.; Peylin, P.; Huang, Y.; Sitch, S.; Wang, T. The carbon balance of terrestrial ecosystems in China. Nature 2009, 458, 1009–1013. [Google Scholar] [CrossRef] [PubMed]
  3. Zou, J.; Ding, J.; Welp, M.; Huang, S.; Liu, B. Using MODIS data to analyse the ecosystem water use efficiency spatial-temporal variations across Central Asia from 2000 to 2014. Environ. Res. 2020, 182, 108985. [Google Scholar] [CrossRef]
  4. Keenan, T.F.; Hollinger, D.Y.; Bohrer, G.; Dragoni, D.; Munger, J.W.; Schmid, H.P.; Richardson, A.D. Increase in forest water-use efficiency as atmospheric carbon dioxide concentrations rise. Nature 2013, 499, 324–327. [Google Scholar] [CrossRef] [PubMed]
  5. Hatfield, J.L.; Dold, C. Water-use efficiency: Advances and challenges in a changing climate. Front. Plant Sci. 2019, 10, 103. [Google Scholar] [CrossRef]
  6. Umair, M.; Kim, D.; Choi, M. Impact of climate, rising atmospheric carbon dioxide, and other environmental factors on water-use efficiency at multiple land cover types. Sci. Rep. 2020, 10, 11644. [Google Scholar] [CrossRef] [PubMed]
  7. Xiao, B.; Bai, X.; Zhao, C.; Tan, Q.; Li, Y.; Luo, G.; Wu, L.; Chen, F.; Li, C.; Ran, C.; et al. Responses of carbon and water use efficiencies to climate and land use changes in China’s karst areas. J. Hydrol. 2023, 617, 128968. [Google Scholar] [CrossRef]
  8. Ye, X.; Liu, F.; Zhang, Z.; Xu, C.; Liu, J. Spatio-temporal variations of vegetation carbon use efficiency and potential driving meteorological factors in the Yangtze River Basin. J. Mt. Sci. 2020, 17, 1959–1973. [Google Scholar] [CrossRef]
  9. Li, G.; Chen, W.; Li, R.; Zhang, X.; Liu, J. Assessing the spatiotemporal dynamics of ecosystem water use efficiency across China and the response to natural and human activities. Ecol. Indic. 2021, 126, 107680. [Google Scholar] [CrossRef]
  10. Chen, Y.; Feng, X.; Tian, H.; Wu, X.; Gao, Z.; Feng, Y.; Piao, S.; Lv, N.; Pan, N.; Fu, B. Accelerated increase in vegetation carbon sequestration in China after 2010: A turning point resulting from climate and human interaction. Glob. Change Biol. 2021, 27, 5848–5864. [Google Scholar] [CrossRef]
  11. Yu, L.; Josey, S.A.; Bingham, F.M.; Lee, T. Intensification of the global water cycle and evidence from ocean salinity: A synthesis review. Ann. N. Y. Acad. Sci. 2020, 1472, 76–94. [Google Scholar] [CrossRef] [PubMed]
  12. Cai, W.; Ullah, S.; Yan, L.; Lin, Y. Remote sensing of ecosystem water use efficiency: A review of direct and indirect estimation methods. Remote Sens. 2021, 13, 2393. [Google Scholar] [CrossRef]
  13. Jiang, S.; Liang, C.; Cui, N.; Zhao, L.; Liu, C.; Feng, Y.; Hu, X.; Gong, D.; Zou, Q. Water use efficiency and its drivers in four typical agroecosystems based on flux tower measurements. Agric. For. Meteorol. 2020, 295, 108200. [Google Scholar] [CrossRef]
  14. Bai, Y.; Li, X.; Zhou, S.; Yang, X.; Yu, K.; Wang, M.; Liu, S.; Wang, P.; Wu, X.; Wang, X.; et al. Quantifying plant transpiration and canopy conductance using eddy flux data: An underlying water use efficiency method. Agric. For. Meteorol. 2019, 271, 375–384. [Google Scholar] [CrossRef]
  15. Gago, J.; Douthe, C.; Florez-Sarasa, I.; Escalona, J.M.; Galmes, J.; Fernie, A.R.; Flexas, J.; Medrano, H. Opportunities for improving leaf water use efficiency under climate change conditions. Plant Sci. 2014, 226, 108–119. [Google Scholar] [CrossRef] [PubMed]
  16. Zhang, Q.; Lu, J.; Xu, X.; Ren, X.; Wang, J.; Chai, X.; Wang, W. Spatial and Temporal Patterns of Carbon and Water Use Efficiency on the Loess Plateau and Their Influencing Factors. Land 2020, 12, 77. [Google Scholar] [CrossRef]
  17. Liu, Y.; Wang, Q.; Yang, Y.; Tong, L.; Li, J. Spatiotemporal Dynamic of Vegetation Carbon Use Efficiency and Its Relationship with Climate Factors in China During the Period 2000–2013. Res. Soil Water Conserv. 2019, 26, 278–286. [Google Scholar]
  18. Qin, S.; Ding, J.; Ge, X.; Wang, J.; Wang, R.; Zou, J.; Tan, J.; Han, L. Spatio-temporal changes in water use efficiency and its driving factors in Central Asia (2001–2021). Remote Sens. 2023, 15, 767. [Google Scholar] [CrossRef]
  19. Yuan, M.; Li, M.; Cheng, H.; Ding, J.; Li, H. Future trends in carbon use efficiency for Chinese terrestrial ecosystem based on CMIP5 model results. J. Univ. Chin. Acad. Sci. 2017, 34, 452–461. [Google Scholar]
  20. Liu, F.; Ye, X.; Guo, Q.; Li, X.; Liu, J. Spatio-temporal variation of carbon and water use efficiency of different land cover in the Poyang Lake Basin and their correlations with climate factors. Acta Ecol. Sin. 2021, 41, 694–706. [Google Scholar]
  21. Liu, X.; Hu, B.; Ren, Z. Spatiotemporal variation of water use efficiency and its driving forces on the Loess Plateau during 2000–2014. Chin. Agric. Sci. 2018, 51, 302–314. [Google Scholar] [CrossRef]
  22. Zhang, Y.; Xu, M.; Chen, H.; Adams, J. Global pattern of NPP to GPP ratio derived from MODIS data: Effects of ecosystem type, geographical location and climate. Glob. Ecol. Biogeogr. 2009, 18, 280–290. [Google Scholar] [CrossRef]
  23. Yin, C.; Luo, M.; Meng, F.; Sa, L.; Bao, Y. The spatiotemporal variation and influencing factors of vegetation carbon and water use efficiency in the Mongolian Plateau. Chin. J. Ecol. 2022, 41, 1079–1089. [Google Scholar]
  24. Jiang, L.; Wu, Y.; He, X.; Fu, Q.; Wang, Z.; Jiang, Q. Dynamic simulation and coupling coordination evaluation of water footprint sustainability system in Heilongjiang province, China: A combined system dynamics and coupled coordination degree model. J. Clean. Prod. 2022, 380, 135044. [Google Scholar] [CrossRef]
  25. Lan, Y.; Cao, S.; Cao, G.; Li, X.; Yang, Y.; Lei, Y. Temporal and spatial dynamics of vegetation carbon use efficiency in Qinghai Lake Basin. Ecol. Sci. 2020, 39, 156–166. [Google Scholar]
  26. Zhao, J.; Feng, H.; Xu, T.; Xiao, J.; Guerrieri, R.; Liu, S.; Wu, X.; He, X.; He, X. Physiological and environmental control on ecosystem water use efficiency in response to drought across the northern hemisphere. Sci. Total Environ. 2021, 758, 143599. [Google Scholar] [CrossRef]
  27. Huang, Z.; Liu, B.; Davis, M.; Sardans, J.; Peñuelas, J.; Billings, S. Long-term nitrogen deposition linked to reduced water use efficiency in forests with low phosphorus availability. New Phytol. 2016, 210, 431–442. [Google Scholar] [CrossRef]
  28. Naeem, S.; Zhang, Y.; Zhang, X.; Rehman, A.U.; Tang, Z.; Xu, Z.; Li, C.; Azeem, T. Recent change in ecosystem water use efficiency in China mainly dominated by vegetation greening and increased CO2. Remote Sens. Environ. 2023, 298, 113811. [Google Scholar] [CrossRef]
  29. Du, L.; Zeng, Y.; Ma, L.; Qiao, C.; Wu, H.; Su, Z.; Bao, G. Effects of anthropogenic revegetation on the water and carbon cycles of a desert steppe ecosystem. Agric. For. Meteorol. 2021, 300, 108339. [Google Scholar] [CrossRef]
  30. Wu, D.; Zou, C.; Gao, J.; Lin, N. Ecological status changes of water conservation key ecological function areas in China. Environ. Sci. Technol. 2017, 40, 174–179. [Google Scholar]
  31. Zhou, G.; Zhang, H.; Zhou, P. Multi-disciplinary research values of the Nanling Mountains. Trop. Geogr. 2018, 38, 293–298. [Google Scholar]
  32. Duan, H.; Cao, F. Characteristics and trends of climate change of Chinese subtropical Nanling Mountain. J. Cent. South Univ. For. Technol. 2012, 32, 110–113. [Google Scholar]
  33. Lin, D.; Zhou, P.; Xu, W.; Li, J.; Lin, W. Carbon budget of different vegetation types in Nanling based on IBIS. Acta Ecol. Sin. 2024, 44, 1429–1440. [Google Scholar]
  34. Baeza, S.; Paruelo, J.M. Land use/land cover change (2000–2014) in the Rio de la Plata grasslands: An analysis based on MODIS NDVI time series. Remote Sens. 2020, 12, 381. [Google Scholar] [CrossRef]
  35. Zhao, H.; Li, X.; Zhang, D.; Xiao, R. Aboveground biomass in grasslands in Qinghai Province estimated from MODIS data and its influencing factors. Acta Prataculturae Sin. 2020, 29, 5. [Google Scholar]
  36. Peng, S.; Ding, Y.; Liu, W.; Li, Z. 1 km monthly temperature and precipitation dataset for China from 1901 to 2017. Earth Syst. Sci. Data 2019, 11, 1931–1946. [Google Scholar] [CrossRef]
  37. Xu, L.; Meng, P.; Tong, X.; Zhang, J.; Li, J.; Wang, X.; Xie, H.; Liu, P. Productivity and water use efficiency of Pinus tabulaeformis responses to climate change in the temperate monsoon region. Agric. For. Meteorol. 2022, 327, 109188. [Google Scholar] [CrossRef]
  38. Yin, Y.; Xu, C.; Chen, H.; Li, L.; Xu, H.; Li, H.; Jain, S.K. Trend and concentration characteristics of precipitation and related climatic teleconnections from 1982 to 2010 in the Beas River basin, India. Glob. Planet. Change 2016, 145, 116–129. [Google Scholar] [CrossRef]
  39. Peng, J.; Liu, Z.; Liu, Y.; Wu, J.; Han, Y. Trend analysis of vegetation dynamics in Qinghai–Tibet Plateau using Hurst Exponent. Ecol. Indic. 2012, 14, 28–39. [Google Scholar] [CrossRef]
  40. Granero, M.S.; Segovia, J.T.; Pérez, J.G. Some comments on Hurst exponent and the long memory processes on capital markets. Phys. A Stat. Mech. Its Appl. 2008, 387, 5543–5551. [Google Scholar] [CrossRef]
  41. Hurst, H.E. Long-term storage capacity of reservoirs. Trans. Am. Soc. Civ. Eng. 1951, 116, 770–799. [Google Scholar] [CrossRef]
  42. Mandelbrot, B.B.; Wallis, J.R. Robustness of the rescaled range R/S in the measurement of noncyclic long run statistical dependence. Water Resour. Res. 1969, 5, 967–988. [Google Scholar] [CrossRef]
  43. Lin, Z.; Wen, Z.; Liu, Y.; Yao, H.; Zhou, R.; Ren, H.; Yuan, L. Spatiotemporal variation and attribution of carbon and water use efficiency in the Yellow River Basin based on remote sensing data. Acta Ecol. Sin. 2024, 44, 377–391. [Google Scholar]
  44. Chen, Z.; Yu, G.; Wang, Q. Ecosystem carbon use efficiency in China: Variation and influence factors. Ecol. Indic. 2018, 90, 316–323. [Google Scholar] [CrossRef]
  45. Yang, Y.; Wang, Z.; Li, J.; Gang, C.; Zhang, Y.; Odeh, I.; Qi, J. Assessing the spatiotemporal dynamic of global grassland carbon use efficiency in response to climate change from 2000 to 2013. Acta Oecol. 2017, 81, 22–31. [Google Scholar] [CrossRef]
  46. Zhang, Y.; Yu, G.; Yang, J.; Wimberly, M.C.; Zhang, X.; Tao, J.; Jiang, Y.; Zhu, J. Climate-driven global changes in carbon use efficiency. Glob. Ecol. Biogeogr. 2014, 23, 144–155. [Google Scholar] [CrossRef]
  47. Xia, L.; Wang, F.; Mu, X.; Jin, K.; Sun, W.; Gao, P.; Zhao, G. Water use efficiency of net primary production in global terrestrial ecosystems. J. Earth Syst. Sci. 2015, 124, 921–931. [Google Scholar] [CrossRef]
  48. Zhao, F.; Wu, Y.; Ma, S.; Lei, X.; Liao, W. Increased water use efficiency in China and its drivers during 2000–2016. Ecosystems 2022, 25, 1476–1492. [Google Scholar] [CrossRef]
  49. Gao, J.; Zhao, P.; Shen, W.; Rao, X.; Hu, Y. Physiological homeostasis and morphological plasticity of two tree species subjected to precipitation seasonal distribution changes. Perspect. Plant Ecol. Evol. Syst. 2017, 25, 1–19. [Google Scholar] [CrossRef]
  50. Xu, Q.; Yang, J.; Huang, L.; Zhang, X.; Tan, X.; Zhang, L. Influence of canopy structure on understory vegetation of secondary evergreen broadleaf forest communities. J. Zhejiang A F Univ. 2019, 36, 1151–1157. [Google Scholar]
  51. Wu, Z.; Dai, E.; Lin, M. Simulating the effect of climate change and human activities on the forest ecosystem in the hilly red soil region of southern China: A case study in Taihe county, Jiangxi province. Geogr. Res. 2018, 37, 2141–2152. [Google Scholar]
  52. Ren, H.; Chen, H.; Li, L.; Li, P.; Hou, C.; Wang, H.; Zhang, Q.; Zhang, P. Spatial and temporal patterns of carbon storage from 1992 to 2002 in forest ecosystems in Guangdong, Southern China. Plant Soil 2013, 363, 123–138. [Google Scholar] [CrossRef]
  53. Wu, X.; Shi, W.; Guo, B.; Tao, F. Large spatial variations in the distributions of and factors affecting forest water retention capacity in China. Ecol. Indic. 2020, 113, 106152. [Google Scholar] [CrossRef]
  54. Liu, Y.; Cai, Z.; Yu, Q.; Wu, W.; Zhou, Q. Spatial variation evaluation of cultivated land quality from the perspective of crop rotation for a typical lateritic red soil farming area in south China. J. Agric. Resour. Environ. 2021, 38, 1051–1063. [Google Scholar]
  55. Feldman, A.F.; Feng, X.; Felton, A.J.; Konings, A.G.; Knapp, A.K.; Biederman, J.A.; Poulter, B. Plant responses to changing rainfall frequency and intensity. Nat. Rev. Earth Environ. 2024, 5, 276–294. [Google Scholar] [CrossRef]
  56. Lv, P.; Sun, S.; Zhao, X.; Li, Y.; Zhao, S.; Zhang, J.; Hu, Y.; Guo, A.; Yue, P.; Zuo, X. Effects of altered precipitation patterns on soil nitrogen transformation in different landscape types during the growing season in northern China. Catena 2023, 222, 106813. [Google Scholar] [CrossRef]
  57. Zhou, J.; Zhang, J.; Lambers, H.; Wu, J.; Qin, G.; Li, Y.; Li, Y.; Li, Z.; Wang, J.; Wang, F. Intensified rainfall in the wet season alters the microbial contribution to soil carbon storage. Plant Soil 2022, 476, 337–351. [Google Scholar] [CrossRef]
  58. Atkin, O.K.; Tjoelker, M.G. Thermal acclimation and the dynamic response of plant respiration to temperature. Trends Plant Sci. 2023, 8, 343–351. [Google Scholar] [CrossRef]
  59. Dusenge, M.E.; Duarte, A.G.; Way, D.A. Plant carbon metabolism and climate change: Elevated CO2 and temperature impacts on photosynthesis, photorespiration and respiration. New Phytol. 2019, 221, 32–49. [Google Scholar] [CrossRef]
  60. Hou, Q.; Pei, T.; Yu, X.; Chen, Y.; Ji, Z.; Xie, B. The seasonal response of vegetation water use efficiency to temperature and precipitation in the Loess Plateau, China. Glob. Ecol. Conserv. 2022, 33, e01984. [Google Scholar] [CrossRef]
  61. Crous, K.Y.; Uddling, J.; De Kauwe, M.G. Temperature responses of photosynthesis and respiration in evergreen trees from boreal to tropical latitudes. New Phytol. 2022, 234, 353–374. [Google Scholar] [CrossRef]
  62. Liu, Q.; Piao, S.; Janssens, I.A.; Fu, Y.; Peng, S.; Lian, X.; Ciais, P.; Myneni, R.B.; Peñuelas, J.; Wang, T. Extension of the growing season increases vegetation exposure to frost. Nat. Commun. 2018, 9, 426. [Google Scholar] [CrossRef] [PubMed]
  63. Bai, Y.; She, W.; Zhang, Y.; Qiao, Y.; Fu, J.; Qin, S. N enrichment, increased precipitation, and the effect of shrubs collectively shape the plant community in a desert ecosystem in northern China. Sci. Total Environ. 2020, 716, 135379. [Google Scholar] [CrossRef]
  64. Chen, J.; Pu, J.; Li, J.; Zhang, T. Response of carbon-and water-use efficiency to climate change and human activities in China. Ecol. Indic. 2024, 160, 111829. [Google Scholar] [CrossRef]
  65. Hai, X.; Li, J.; Li, J.; Liu, Y.; Dong, L.; Wang, X.; Lv, W.; Hu, Z.; Shangguan, Z.; Deng, L. Variations in plant water use efficiency response to manipulated precipitation in a temperate grassland. Front. Recent Dev. Plant Sci. 2022, 13, 881282. [Google Scholar] [CrossRef] [PubMed]
  66. Tang, X.; Li, H.; Desai, A.R.; Nagy, Z.; Luo, J.; Kolb, T.E.; Olioso, A.; Xu, X.; Yao, L.; Kutsch, W.; et al. How is water-use efficiency of terrestrial ecosystems distributed and changing on Earth? Sci. Rep. 2014, 4, 7483. [Google Scholar] [CrossRef] [PubMed]
  67. He, L.M.; Chen, J.M.; Pan, Y.; Pan, Y.D.; Birdsey, R.; Kattge, J. Relationships between net primary productivity and forest stand age in US forests. Glob. Biogeochem. Cycles 2012, 26, GB3009. [Google Scholar] [CrossRef]
  68. Chen, Z.; Yu, G. Spatial variations and controls of carbon use efficiency in China’s terrestrial ecosystems. Sci. Rep. 2019, 9, 19516. [Google Scholar] [CrossRef]
  69. Fu, Y.; Jian, S.; Yu, X. Water use efficiency in China is impacted by climate change and land use and land cover. Environ. Sci. Pollut. Res. 2024, 31, 42840–42856. [Google Scholar] [CrossRef]
  70. Boretti, A. Evaluating water use efficiency and CO₂ absorption in plants under rising atmospheric carbon dioxide levels. J. Atmos. Sol.-Terr. Phys. 2024, 266, 106409. [Google Scholar] [CrossRef]
  71. Chen, T.; Peng, L.; Wang, Y. Prediction of global water use efficiency and its response to vapor pressure deficit and soil moisture coupling in the 21st century. J. Hydrol. 2024, 635, 131203. [Google Scholar] [CrossRef]
Figure 1. Elevation maps and plant types of the NMR.
Remotesensing 17 00648 g001
Figure 2. Variation in (a) vegetation CUE and WUE from 2001 to 2023 in the NMR. (b) NPP, GPP, and ET from 2001 to 2023 in the NMR. Statistical significance is indicated as follows: * for p < 0.05 and ** for p < 0.01.
Remotesensing 17 00648 g002
Figure 3. Spatial distribution patterns of vegetation CUE (a) and WUE (b) in the NMR.
Remotesensing 17 00648 g003
Figure 4. Variation in CUE (a) and WUE (b) across different vegetation types from 2001 to 2023 in the NMR.
Remotesensing 17 00648 g004
Figure 5. Spatial variation rates and their significance tests of vegetation CUE (a,b) and WUE (c,d) in the NMR from 2001 to 2023.
Remotesensing 17 00648 g005
Figure 6. The area proportions of vegetation CUE and WUE trend changes for different vegetation types in the NMR.
Remotesensing 17 00648 g006
Figure 7. Sustainability of vegetation CUE (a,b) and WUE (c,d) trends in the NMR from 2001 to 2023.
Remotesensing 17 00648 g007
Figure 8. Significant correlations between vegetation CUE and WUE with precipitation (a,b) and temperature (c,d) in the NMR from 2001 to 2023.
Remotesensing 17 00648 g008
Figure 9. Spatial patterns of correlation coefficients between CUE and WUE with precipitation (a,b) and temperature (c,d) in the NMR from 2001 to 2023.
Remotesensing 17 00648 g009
Figure 10. Mean correlation coefficients between CUE and WUE with precipitation and temperature across different vegetation types in the NMR from 2001 to 2023.
Remotesensing 17 00648 g010
Table 1. Data sources.
DataData SourceSpatial ResolutionTemporal Resolution
GPPMOD17A3HGFv061 (https://lpdaac.usgs.gov/products/mod17a3hgfv061/, accessed on 1 September 2024)500 m1a
NPPMOD17A3HGFv061 (https://lpdaac.usgs.gov/products/mod17a3hgfv061/, accessed on 1 September 2024)500 m1a
ETMOD16A2GFv061 (https://lpdaac.usgs.gov/products/mod16a2gfv061/, accessed on 1 September 2024)500 m8d
TemperatureNational Earth System Science Data Center (https://loess.geodata.cn, accessed on 1 September 2024)1 km1 mon
PrecipitationNational Earth System Science Data Center (https://loess.geodata.cn, accessed on 1 September 2024)1 km1 mon
Land useMCD12Q1v061 (https://lpdaac.usgs.gov/products/mcd12q1v061/, accessed on 1 September 2024)500 m1a
Disclaimer/Publisher’s Note: The statements, opinions and data contained in all publications are solely those of the individual author(s) and contributor(s) and not of MDPI and/or the editor(s). MDPI and/or the editor(s) disclaim responsibility for any injury to people or property resulting from any ideas, methods, instructions or products referred to in the content.

