Abstract
Thermally driven local-scale precipitation (LSP) is an important type of summer precipitation over China, but the prestorm environmental conditions remain unclear. In order to investigate the major factors controlling the LSP intensity, the meteorological parameters preceding the occurrence of light and heavy afternoon LSP over Eastern China during 2018–2022 are examined using rain gauge, radiosonde sounding, and satellite observations. The temperature differences between heavy and light LSP events are relatively small, but heavy LSP events exhibit larger water vapor mixing ratios (Qv) below a 5 km altitude than light LSP. With an almost identical vertical temperature distribution, an increment in Qv increases the relative humidity (RH) in the lower troposphere. Furthermore, large eddy simulations with spectral bin microphysics are performed to investigate the impacts of humidity and aerosols on the LSP intensity. Increased low-level RH leads to larger mass concentrations of rain and graupel at the expense of cloud droplets due to enhanced drop collisions and the riming of ice particles, respectively, thereby reinforcing the LSP. However, an increased aerosol concentration leads to more cloud water but reduced rain water content, resulting mainly from suppressed drop collisions. The graupel mixing ratio exhibits a non-monotonic trend with aerosols, mostly contributed by riming. As a result, the LSP intensity first increases and then decreases with an increment in the aerosol concentration in both dry and humid air. Moreover, more aerosols lead to the humidification of the surrounding air due to the enhanced evaporation of cloud droplets, particularly under lower-RH conditions. These findings provide an enhanced understanding of the effects of covariations in humidity and aerosol concentrations on the afternoon LSP intensity over Eastern China.
1. Introduction
Summer precipitation plays a critical role in the energy balance and is a major source of freshwater over Eastern China [1,2], with short- and long-duration rainfall peaks in the afternoon and early morning, respectively [3]. The former type, driven by solar-induced thermal convection [4,5], is a key feature of local-scale precipitation (LSP) [6], which often manifests as short-term thunderstorms or rainfall and occurs quickly during summer afternoons over Eastern China (14:00–18:00, local time [7,8,9]) [10,11,12,13]. The occurrence of afternoon LSP is associated with the rising surface temperature, the high spatial inhomogeneity of local surface energy, and increasing atmospheric instability [1,14,15]. The prediction of afternoon LSP faces great challenges due to the complex interactions between the underlying surface and multi-scale processes [16].
Most LSP events are found to occur when specific thermal and humid conditions are present, such as a moisture-rich environment with high precipitable water and an unstable atmosphere, which promotes the rising of air parcels [17,18]. Compared to mesoscale convective systems, which commonly occur in environments with strong vertical wind shear (VWS), the VWS strength is weak for LSP [19,20,21]. Zhang et al. [22] discovered that the occurrence of LSP is largely dependent on the preceding environmental characteristics, such as a weaker VWS and a larger CAPE value than in non-local-scale precipitation. The relative humidity (RH) in the lower atmosphere plays a critical role in influencing the intensity of convective storms [23,24,25] and contributes to the increase in the variability in precipitation [26]. RH is also a key factor that significantly impacts cloud microphysics and dynamics, shaping their properties and behavior [27,28]. As the RH increases, the environmental CAPE also rises, leading to stronger condensation, which in turn promotes more vigorous cloud development and results in an increase in the maximum precipitation intensity [27,29].
In addition to meteorological factors, the LSP intensity may also be impacted by the background aerosol concentration. Aerosols can affect cloud and radiative forcing through direct, semi-direct, and indirect effects [30,31,32,33]. The direct effects of aerosols are presented as the scattering and absorption of solar radiation [34,35]. Absorbing aerosols can potentially reduce low cloud cover through atmospheric heating and decreasing relative humidity, a phenomenon known as the semi-direct effect of aerosols [36,37,38,39]. Moreover, aerosols can also act as cloud condensation nuclei (CCN) or ice nuclei (IN) and affect cloud reflectance indirectly through the modification of the cloud’s properties, such as the cloud depth, coverage, and lifetime [31,40]. CCN or IN can facilitate the formation of cloud droplets or ice crystals, thereby impacting clouds’ water content or cloud ice and eventually affecting the precipitation intensity and cloud structure [41,42,43]. Aerosols’ indirect effects are still highly uncertain due to the complicated feedback between cloud microphysics and dynamics [44].
The influences of aerosols on clouds may exhibit distinct differences in humid versus dry environments due to the enhanced condensation and evaporation, respectively [27,45,46,47]. In high-humidity conditions, an increase in the CCN concentration leads to enhanced condensation, resulting in relatively higher cloud water content and more vigorous cloud development [31,42,48]. The formation and growth of ice crystals, snow, and graupel can also be promoted, which can potentially intensify precipitation [30,41,49]. An increase in the IN concentration results in a higher concentration of ice crystals and the intensification of the Wegener–Bergeron–Findeisen process (i.e., the rapid growth of ice crystals at the expense of the evaporation of surrounding cloud droplets due to the lower saturation vapor pressure with respect to the ice phase compared to the liquid phase [50,51,52,53]). It also leads to the more frequent glaciation of supercooled clouds to enhance precipitation [41,54]. Previous research also has emphasized the significant role of RH in shaping cloud microphysics and dynamics, highlighting that aerosols have a more pronounced effect on precipitation in humid conditions [27,55]. In dry environments, aerosols may lead to increased evaporation rates around cloud edges [55,56], which can suppress precipitation [57].
Previous studies (e.g., Zhang et al. [22]) have revealed the distinct prestorm meteorological environments associated with LSP and non-local-scale precipitation. However, few studies have focused on the relationship between these environments and the intensity of LSP [18,58,59]. The evolution of LSP may be influenced by various thermodynamic conditions, including the temperature lapse rate [60], atmospheric instability [61], and RH [23]. Nevertheless, it remains unclear which meteorological factor predominates in determining the intensity of the LSP over Eastern China. In addition, as Eastern China has been experiencing air pollution in recent decades [62], and since aerosols also have significant effects on precipitation, we are motivated to investigate the joint impacts of the prestorm meteorological conditions and aerosols on the LSP intensity.
In the present study, we utilize radiosonde measurements, infrared observations from the Himawari-8 geostationary satellite, and hourly rain gauge data to investigate the differences in the prestorm environments of light and heavy LSP. We also obtain the corresponding vertical profiles of the temperature and relative humidity, which are employed in large eddy simulations equipped with spectral bin microphysics to explore the LSP responses to varying initial aerosol concentrations and meteorological environments. Special attention is given to the following question: how do light and heavy LSP respond to variations in thermodynamic conditions and aerosol concentrations? In Section 2, we present the data and methods employed in the analysis, while Section 3 and Section 4 provide the results and discussion, respectively. Finally, a summary is provided in Section 5.
2. Data and Methods
2.1. Dataset
In the present study, we analyze the hourly precipitation data over Eastern China (105–125°E, 18–40°N) during the summer months (June, July, and August) from 2018 to 2022. The rainfall data are recorded by rain gauges at weather stations operated by the China Meteorological Administration (CMA). Approximately 1800 weather stations equipped with rain gauges are located within the study region, of which 42 stations also conduct radiosonde measurements (Figure 1, indicated by red diamonds) to obtain sounding parameters at 08:00 local time (LT, 00:00 UTC). These parameters include vertical profiles of the temperature, water vapor mixing ratio, wind speed, and direction [63]. All radiosonde datasets underwent quality control prior to further analysis [14,64].
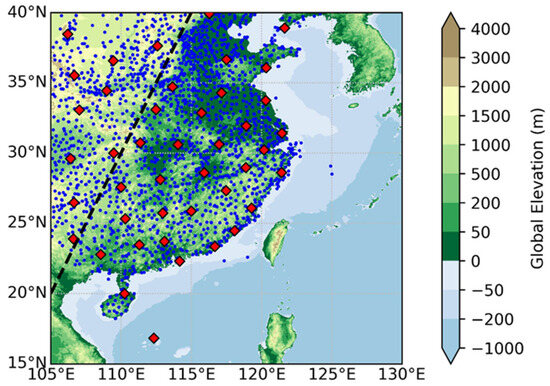
Figure 1.
The spatial distribution of atmospheric sounding stations (indicated by red diamonds) and automatic rain gauges (represented by blue dots) in Eastern China. The black dashed line denotes the approximate boundary between the second and third staircases of China’s terrain.
To analyze the cloud properties of the local storm, cloud type and cloud top height (CTH) data from the Himawari-8 satellite are collected using the Advanced Himawari Imager (AHI) [65,66,67,68]. The CTH retrieval algorithm of AHI employs radiative transfer codes [69] developed by the European Organization for the Exploitation of Meteorological Satellites, as well as numerical predictions of vertical profiles of the temperature and humidity, to calculate the radiance of four infrared bands (wavelengths of 6.2, 7.3, 11.2, and 13.3 μm). This algorithm incorporates the intercept method, the interpolation method, and the CO2 slicing method. The interpolation method is applied to opaque clouds, while the intercept method is preferred for optically thin clouds, followed by the CO2 slicing and intercept methods [70,71,72]. The cloud information observed by Himawari-8 is classified into 9 categories according to the International Satellite Cloud Climatology Project’s (ISCCP) definition of cloud types, which is based on the cloud optical thickness and cloud top pressure [73,74,75,76]. These categories include cirrus (Ci), cirrostratus (Cs), deep convection (DC), altocumulus (Ac), altostratus (As), nimbostratus (Ns), cumulus (Cu), stratocumulus (Sc), and stratus (St). It has been found that the CTH data inferred from AHI are slightly underestimated, with the bias primarily attributed to thin clouds [77]. The Cloud Property data from the Himawari-8 satellite have a temporal resolution of 10 min and a spatial resolution of 5 km.
To investigate the aerosol conditions preceding the occurrence of LSP, we utilize aerosol optical depth (AOD) data (Level 3) from Himawari-8, recorded at 08:00 LT, which features a spatial resolution of 5 km and a temporal resolution of 1 h. The AHI AOD retrieval method employs a deep-blue-type approach, utilizing the pre-calculated static surface reflectance, and was originally designed for bright surfaces [78]. It has been found that the AHI AOD data are reliable in polluted regions, such as Eastern China [79].
2.2. Identification of LSP
To analyze the LSP, precipitation data are selected with the following criteria based on the methods proposed by Guo et al. [1,14], Zhang et al. [22], and Fan et al. [80]: (1) no rainfall is recorded at the central location between 08:00 and11:00 LT, while rainfall occurs during 11:00 to19:00 LT; (2) the number of stations located within a 150 km radius of the central station (N150km) should be greater than 5; (3) the ratio of the precipitation station number to N150km should be below 25% during the rainy period (excluding the precipitation station at the center); (4) similar to criterion (3), but the ratio within a 50 km radius should be less than 50%. Since the sounding data are collected at 08:00 LT, the first criterion—specifically, the absence of rainfall during the 3 h preceding the LSP—serves to exclude cases with preexisting rainfall, which is likely attributable to non-local-scale precipitation, as mentioned by Fan et al. [80].
During the period from 2018 to 2022, approximately 180,000 precipitation events were recorded in the study region. Of these, 79,605 events were classified as LSP, accounting for 44.2% of the total precipitation events. To investigate the prestorm meteorological environments associated with varying intensities of LSP, the identified events were sorted by rain rate and categorized into 2 groups: light LSP (below the 33rd percentile, <5.4 mm h−1) and heavy LSP (above the 67th percentile, >8.1 mm h−1). Subsequently, the average temperature and humidity profiles, along with the prestrom thermodynamic parameters for each group, were calculated. These parameters include the convective available potential energy (CAPE), convective inhibition (CIN), precipitable water (PW), lifting condensation level (LCL), level of free convection (LFC), equilibrium level (EL), water vapor mixing ratio (Qv) at the surface, K index, and moist static energy (MSE) from the surface to an altitude of 1 km. The methods for the calculation of the CAPE, CIN, PW, K index, and MSE are described in detail in Appendix A.
The locations of each weather station were matched with corresponding grid points from the Himawari-8 satellite data. To investigate the characteristics of the CTH for the LSP, the maximum CTH is defined as the highest CTH value observed within the coverage of each LSP event, which encompasses a radius of 150 km from the central station (comprising 30 grid points) and includes all cloud types recorded by Himawari-8, excluding Ci and Cs. The AOD at a given station is calculated as the average of the AOD values from the grid point associated with the station location and its eight adjacent grid points.
2.3. Numerical Experimental Design
To investigate the impacts of the prestorm environment and aerosols on precipitation and convective clouds, this study employs the Weather Research and Forecasting Model (WRF model, version 4.2 [81]) coupled with spectral bin microphysics (SBM) to conduct idealized large eddy simulations (LES [82,83,84,85,86,87,88]) under varying prestorm meteorological conditions and background CCN concentrations.
An updated fast version of the SBM scheme is employed in this study [89,90,91], which represents five types of hydrometeors—cloud droplets, raindrops, ice crystals, snow, and graupel—utilizing doubled mass grids containing 33 bins. The cloud droplets and raindrops are calculated using a single mass grid (one distribution function). To enhance the computational efficiency, the ice crystals and snow are also calculated using a single mass grid [89,90]. The SBM scheme is regarded as one of the best tools for the investigation of aerosol–cloud interactions [92], particularly when compared to other bulk microphysics methods. For instance, Khain et al. [28] demonstrated that the sensitivity of the spatial distribution of precipitation simulated by the Thompson scheme to aerosols was significantly lower than that from the SBM scheme. Furthermore, the results derived from the SBM scheme are often considered to be benchmarked due to the calculation of the hydrometeor size distribution by solving microphysical equations explicitly [93].
Due to the lack of aerosol spectrum observations during LSP events in the study region, a three-mode lognormal distribution of the background continental aerosol spectrum, as proposed by Jaenicke [94], is employed to initialize the LES run (Table 1). The total aerosol concentration is ~6100 cm−3. Considering that the aerosols are externally mixed, the soluble percentages of aerosol concentrations (that can serve as CCN) for the Aitken (mode 1 and mode 2) and accumulation modes (mode 3) are set at 5% and 20%, respectively, following the methodologies of Yin et al. [95] and Liu et al. [96]. Consequently, the initial CCN concentration at the surface is ~300 cm−3 (referred to as CCN300), which is comparable to the values used in the clean run reported by Fan et al. [97] (~280 cm−3). To investigate the effects of varying aerosol concentrations, three additional CCN number categories (90 cm−3, 900 cm−3, and 1800 cm−3) are utilized in Section 3.3 for cloud simulations, representing conditions ranging from extremely clean to polluted. This is achieved by multiplying N1, N2, and N3 (as shown in Table 1) of CCN300 by 0.3, 3, and 6 (referred to as CCN90, CCN900, and CCN1800), respectively. The number concentrations of ice nuclei increase proportionally with the total aerosol concentration. The highest CCN number (1800 cm−3) reflects the current level of air pollution over Eastern China, as indicated by Fan et al. [97], who also report that the CCN concentration in polluted conditions is 6 times that in the clean case. It is assumed that the aerosol concentration decreases exponentially above 2 km, while remaining constant below this altitude [98].

Table 1.
Initial aerosol condensation * [94].
The simulation experiments for heavy and light LSP were conducted over a domain of 20 km (x) × 20 km (y) × 20 km (z), with a horizontal resolution of 100 m and 60 vertical levels utilizing sigma coordinates. Periodic boundary conditions were applied in the horizontal direction. To eliminate the influence of other factors, land surface processes and atmospheric radiation transfer were not considered. The integration time for each experiment was 3.5 h (the 1st h is taken as spin-up), with a time step of 1 s and an output interval of 3 min. For a clearer understanding of the experimental design adopted in this study, a flow chart is provided in Appendix B (Figure A1).
3. Results
3.1. Climatological Characteristics of LSP over Eastern China
Figure 2a,b illustrate the mean rain rate and frequency of precipitation between 11:00 and 19:00 LT during the summer season from 2018 to 2022. Notable regional differences in both the rain rate and frequency are observed in the research area, attributed to the varying surface conditions and the inhomogeneity of mereological factors. The spatial distribution of the mean rain rate exhibits a decreasing trend from the southeastern to the northwestern part of the study region, with the peak values reaching 0.8 mm h−1 in Southeastern China (Figure 2a), which also records the highest rainfall frequency (22.03%, Figure 2b). In contrast, the frequency of occurrence of precipitation displays a different pattern from that of the rain rate, with relatively larger values across the study region (>5%), except in the southwestern and northeastern areas. The spatial distributions of the rain intensity and precipitation frequency in Eastern China are generally consistent with the findings of Zhang et al. [22], albeit with slightly larger values. This discrepancy may be attributed to the different identification methods used for LSP (with rainfall samples collected between 11:00 and 19:00 LT in the present study vs. 13:20 to 15:20 LT in Zhang et al. [22]) and variations in the study periods (June to August 2018–2022 in the present study vs. May to October 2013–2020 in Zhang et al. [22]).
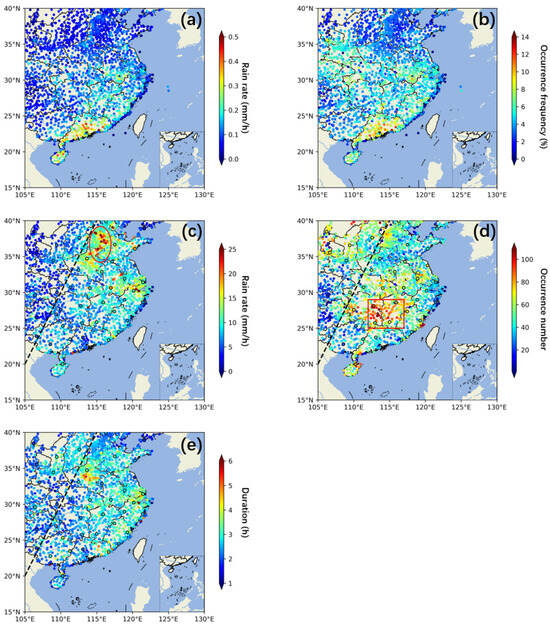
Figure 2.
The spatial distribution of (a) the mean rain rate (mm h−1) and (b) the occurrence frequency (%) for all precipitation events during the period 11:00–19:00 LT throughout the summer season (June–August) from 2018 to 2022 over Eastern China; the spatial distribution of (c) the rain rate (mm h−1) and (d) the occurrence of local-scale precipitation (LSP), with red circles and squares highlighting regions with high values in (c) and (d), respectively; (e) the spatial distribution of the LSP duration (hour). The black dashed lines represent the boundary of the second and third staircases of China’s terrain. The occurrence frequency in (b) is calculated as the ratio of the rain duration to the entire research period, while the occurrence number in (d) represents the number of LSP events. The maximum hourly rainfall recorded at the sampled stations during an LSP event is regarded as the LSP intensity, and the average LSP intensity for a given station shown in (c) is calculated as the mean rain rate over all LSP events experienced by that station.
To examine the characteristics of the summer LSP over Eastern China, Figure 2c–e display the spatial distributions of the averaged intensity, occurrence frequency, and duration of LSP. The patterns of the averaged LSP intensity and occurrence frequency demonstrate significant differences between overall precipitation events and LSP, indicating complex contributions from different types of weather systems to the precipitation process. The highest frequency of LSP is located in the south-central part of the research area (112–117°E, 25–29°N, marked by a red square in Figure 2d), specifically in Hunan and Jiangxi Provinces, with a maximum occurrence frequency of 109 during the study period. The eastern part of the study region exhibits a prolonged duration of LSP, at approximately 3 h. The black dashed lines in Figure 1 and Figure 2c–e denote the approximate boundary between the second and third staircases of China’s terrain [99]. It is shown that the most intense LSP event occurs on the east side of the oblique line (Taihang Mountains, approximately 113–117°E, 34–39°N, indicated by a red circle in Figure 2c), which is accompanied by a moderate occurrence frequency and relatively shorter duration. The coexistence of the Taihang Mountains and the solar heating of the terrain may force the airflow from the east to uplift along the slope, leading to local orographic precipitation. While orography-induced lifting is a persistent factor for LSP, the observed afternoon peak in precipitation over the Taihang Mountains is primarily attributed to thermally driven lifting [6], where the solar heating of elevated terrain enhances air parcel buoyancy and triggers convective clouds [100]. This mechanism aligns with findings derived from other regions, such as the eastern coast of India, where similar processes drive the diurnal cycle of precipitation [101,102]. The mean LSP intensity reaches up to 28.9 mm h−1 (Figure 2c), which appears high, as it reflects the maximum rain rate across all sampled stations and the duration of each LSP event.
Figure 3a illustrates that over 80% of the LSP events are associated with deep convective clouds, characterized by a cloud optical thickness exceeding 23 and a cloud top pressure lower than 440 hPa [73,74,75,103]. The CTH for all cloud types in light and heavy LSP exhibits a bimodal distribution (Figure 3b), displaying a reduced frequency of lower CTH and an increased frequency of higher CTH for heavy LSP events (>67%). Notably, the increased frequency of CTH is predominantly attributed to DC (Figure 3c), suggesting that heavy LSP is primarily driven by local deep convective clouds.
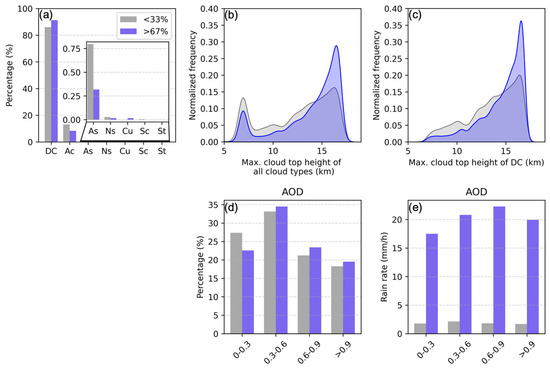
Figure 3.
(a) The percentage distribution of various cloud types associated with the identified LSP events, which are derived from data obtained from the Himawari-8 geostationary satellite. The abbreviations DC, Ac, As, Ns, Cu, Sc, and St refer to deep convection, altocumulus, altostratus, nimbostratus, cumulus, stratocumulus, and stratus, respectively. Also shown is the normalized frequency of the maximum cloud top height of (b) all cloud types and (c) DC during light (grey) and heavy LSP events (blue), respectively. (d) Probability density functions of the aerosol optical depth (AOD) preceding the occurrence of light (grey) and heavy LSP events (blue); (e) variation in light (grey) and heavy LSP events (blue) as a function of AOD.
Figure 3d illustrates that both light and heavy LSP can develop in environments ranging from clean (AOD < 0.3) to polluted (AOD > 0.9). The mean LSP intensity first increases to the maxima and then decreases with the increment in AOD, indicating the non-monotonic effect of aerosols on LSP.
3.2. Prestorm Meteorological Environments for Light and Heavy LSP
To investigate the meteorological conditions that favor LSP with different rain rates, several parameters were calculated from sounding observations made during light and heavy LSP events, as presented in Figure 4. These parameters include CAPE, CIN, PW, LCL, LFC, EL, Qv at the surface, K index, and MSE between the surface and a 1 km altitude. Notably, there is a significant distinction in the prestorm environment between light and heavy LSP events. Heavy LSP is characterized by increased values of CAPE, PW, EL, Qv, K index, and MSE, alongside decreased values of CIN, LCL, and LFC, when compared to light LSP. The elevated EL is consistent with the higher CTH observed in heavy LSP, as illustrated in Figure 4.
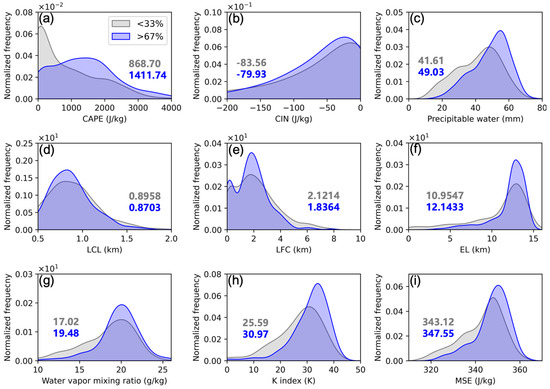
Figure 4.
(a) The normalized frequency of convective available potential energy (CAPE) under light (grey curves) and heavy LSP (blue curves) conditions, with mean values marked by the grey and blue text, respectively. (b–i) are similar to (a), but for (b) convective inhibition (CIN), (c) precipitation water (PW), (d) the lifting condensation level (LCL), (e) the level of free convection (LFC), (f) the equilibrium level (EL), (g) the water vapor mixing ratio (Qv) at the surface, (h) the K index, and (i) the moist static energy (MSE) between the surface and an altitude of 1 km, respectively.
Figure 5 shows the vertical profiles of the median temperature, Qv, and RH preceding light and heavy LSP events over Eastern China. The temperature exhibits relatively small changes with the LSP intensity (Figure 5a), with slightly larger values below 12 km for heavy LSP (Figure 5d). The increment in the temperature from light to heavy LSP is around 0.5~1.0 °C below 2 km (Figure 5d), which is consistent with the findings of Sun et al. [21] over the North China Plain. In contrast, the Qv below 5 km increases more notably than the temperature from light to heavy LSP conditions (Figure 5b), leading to higher low-level RH during heavy LSP events (Figure 5c). The increase in Qv (RH) below 5 km ranges from 9.82 to 10.88 g kg−1 (61.2%~66.5%, Figure 5b,c). Additionally, Figure 5f indicates that the RH is larger above 11 km during heavy LSP, which may influence the growth of strong convective clouds with high cloud tops.
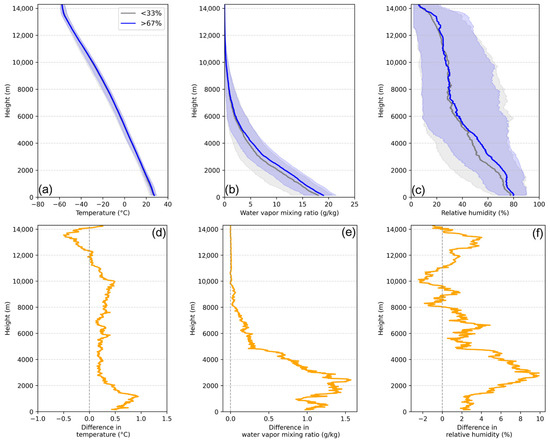
Figure 5.
Vertical distributions of the median (a) temperature, (b) water vapor mixing ratio, and (c) relative humidity for light (gray curves) and heavy LSP (blue curves) over Eastern China. The shaded areas represent the range between the 10th and 90th percentiles of the sampled values. (d–f) are similar to (a–c), but for the absolute differences in the (d) temperature, (e) water vapor mixing ratio, and (f) relative humidity between heavy and light LSP.
For the nearly identical ambient temperature profiles (Figure 5a), an increment in the surface Qv would reduce LCL and LFC, thereby decreasing CIN while simultaneously increasing CAPE (Figure 4). Additionally, the increased low-level Qv can enhance PW and MSE (Figure 4), which is conducive to stronger convection, a higher CTH, and increased precipitation. This underscores the significant role of low-level humidity as a critical determinant of the LSP intensity.
3.3. Idealized Simulations with Distinct Humidity Profiles
The distinct prestorm humidity profiles associated with light and heavy LSP (Figure 5b), as discussed in Section 3.2, were utilized to initialize two LES runs under the current level of aerosol concentrations, designated as L-RH-CCN1800 and H-RH-CCN1800. The maximum rain rates for L-RH-CCN1800 and H-RH-CCN1800 are 4.5 mm h−1 and 11.5 mm h−1 (Figure 6a), respectively, which match the sample conditions for light and heavy LSP, as shown in Section 2.2. In both L-RH-CCN1800 and H-RH-CCN1800, the solid curves (overall precipitation intensity) overlap with the dotted curves (liquid-phase precipitation), indicating the predominant role of the liquid phase in the summer LSP over Eastern China.
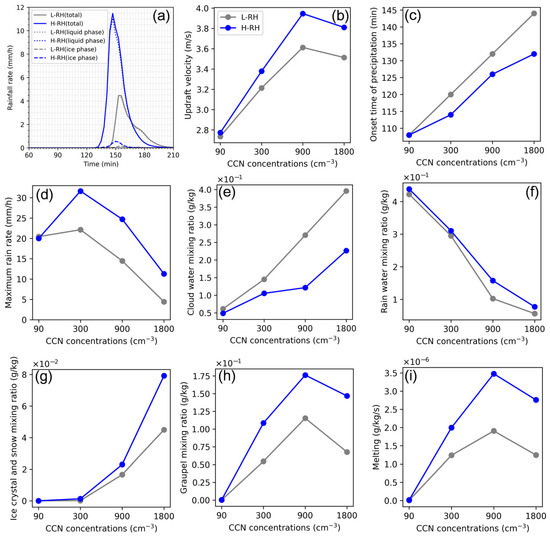
Figure 6.
(a) The time series of the averaged rain rate (solid curves) for convective clouds developed under low- (L-RH) and high-humidity conditions (H-RH) in CCN1800, with the dotted and dashed curves representing the intensities of liquid and ice precipitation, respectively. (b) P-mean values of the updraft velocity over the cloud core area (w > 1 m s−1) vs. the CCN number concentration for L-RH (grey lines) and H-RH cases (blue lines). (c–i) are similar to (b), but for (c) the onset time of precipitation, (d) the maximum rain rate, and the P-mean values of (e) the mixing ratios of cloud droplets, (f) raindrops, (g) ice crystals and snow, and (h) graupel and (i) the melting rate of ice particles, respectively.
The growth of convective clouds is more rapid and extensive in more humid environments, indicated by the larger condensate mass and steeper slopes with the evolution of time (Figure 7d,h). This shows that condensation is the dominant process contributing to the increase in cloud mass, which is reinforced by the raised humidity (Figure 8a,b). The effective radius of cloud droplets is larger due to enhanced condensation (Figure 9a,c), promoting the collision–coalescence of liquid drops (Figure 8e,f), which results in the earlier onset of precipitation (Figure 6a) and a larger raindrop size below 5 km (Figure 9b,d). The enhanced condensation also releases a larger amount of latent heat and contributes to stronger updrafts in the H-RH-CCN1800 case (Figure 7h), thereby lifting more cloud droplets upward to higher altitudes, where they are more efficiently frozen into ice particles at 9 km (Figure 10c,f). As ice crystals and snow are calculated at one mass grid (separated by a radius of 150 µm) in spectral bin microphysics [89], the mixing ratio, effective radius, and mass changing rate of ice-phase particles are shown together in Figure 7, Figure 9 and Figure 10.
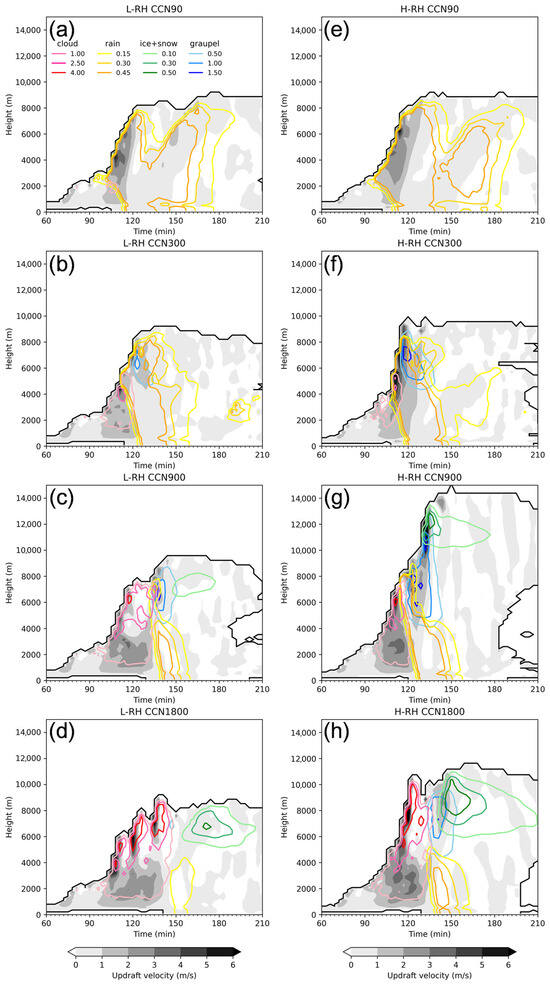
Figure 7.
(a) Time–height plot of the mean updraft velocity (shaded, m s−1) and the mixing ratios of cloud droplets (red contours, g kg−1), raindrops (orange contours, g kg−1), ice/snow (green contours, g kg−1), and graupel (blue contours, g kg−1) averaged over the cloudy region (defined as condensate mass exceeding 0.01 g kg−1) for the L-RH CCN90 case; (b–d) similar to (a), but for CCN concentrations of (b) 300 cm−3, (c) 900 cm−3, and (d) 1800 cm−3 for L-RH cases (left column); (e–h) similar to (a–d), but for H-RH cases (right column).
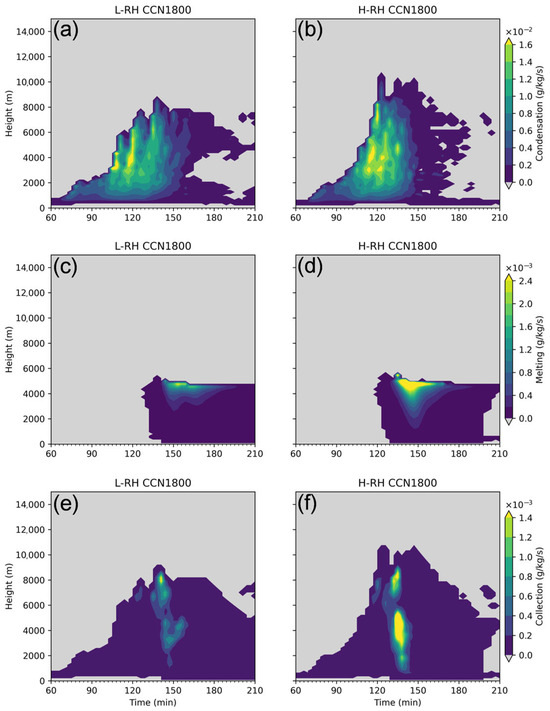
Figure 8.
Time–height plot of the mean (a,b) condensation rate of cloud droplets, (c,d) melting rate of ice particles, and (e,f) collection rate of liquid drops averaged over the cloudy region for L-RH (left column) and H-RH cases (right column).
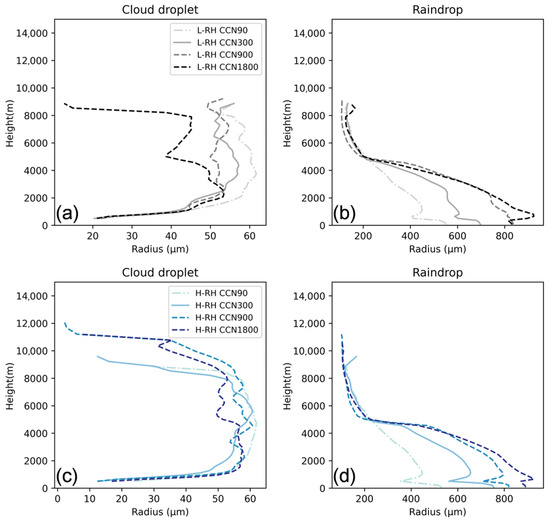
Figure 9.
The vertical profiles of the mean effective radius of (a) cloud droplets and (b) raindrops averaged over the cloudy region during the simulation period of 60–210 min for the L-RH (top row) and (c,d) for the H-RH cases (bottom row).
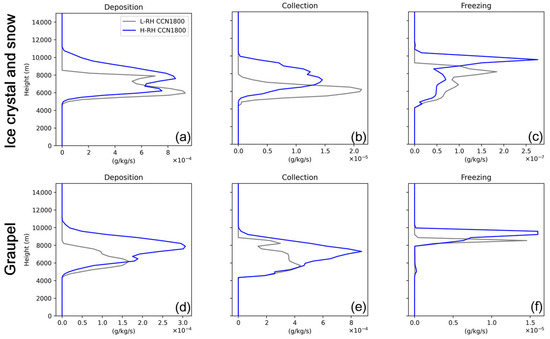
Figure 10.
The vertical profiles of the mean mass changing rates of ice crystals/snow (top row) and graupel (bottom row) due to (a,d) depositional growth, (b,e) collection, and (c,f) droplet freezing, averaged over the cloudy region during a simulation period of 60–210 min for L-RH (grey curves) and for H-RH cases (blue curves).
Moreover, the depositional growth of ice hydrometeors above 7 km is also stimulated by the larger amount of water vapor (Figure 10a,d), leading to a higher mass concentration of ice particles (Figure 7h). The effective radius of ice hydrometeors is enlarged due to more efficient collection processes (Figure 10b,e), such as aggregation among ice particles and the riming of supercooled liquid drops by the ice phase. Consequently, the melting of ice particles is expedited during their sedimentation (Figure 8d), which also partially contributes to enhanced liquid precipitation. As a result, the release of latent heat from condensation increases the buoyancy, accelerates the upward motion of hydrometeor particles, and causes the cloud top to rise higher (Figure 7d,h).
3.4. Effects of the Background Aerosol Concentration on Light and Heavy LSP
In order to understand the effects of aerosols on light and heavy LSP, sensitivity tests were conducted using four aerosol scenarios (CCN90, CCN300, CCN900, and CCN1800) for both L-RH and H-RH cases. For L-RH cases, the duration during which the mean updrafts exceeded 1 m s−1 is increased with enhanced aerosol loading, e.g., 99–117 min, 99–123 min, 96–135 min, and 96–141 min for the CCN30, 300, 900, and 1800 tests, respectively (Figure 7a–d). The responses of the mean updrafts to aerosols change from invigoration to suppression, with the maxima appearing at a CCN concentration of 900 cm−3 (Figure 6b), which can be attributed to changes in net buoyancy (Figure 11a). The maximum cloud top height does not change much with the aerosol concentration (Figure 7a–d).
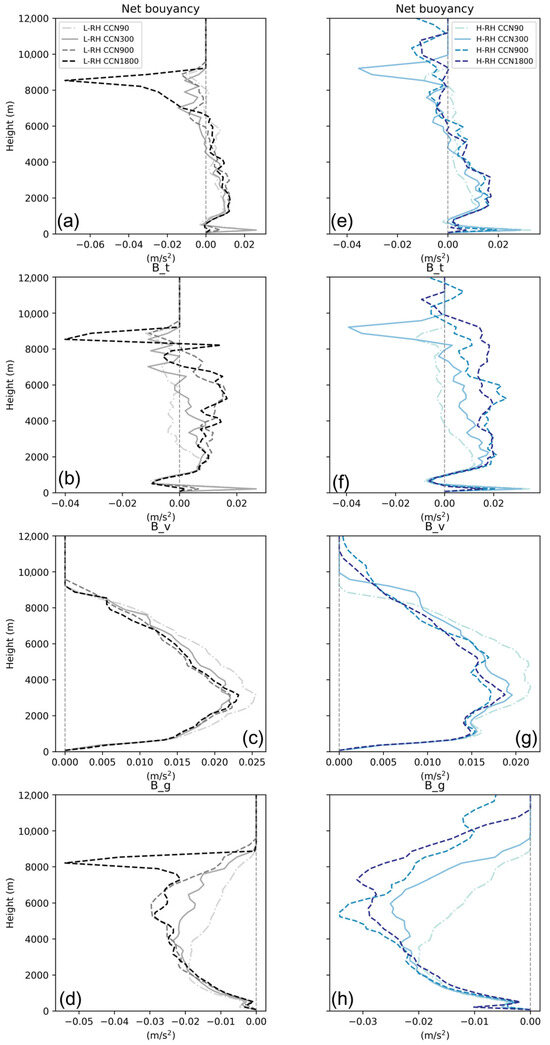
Figure 11.
The vertical profiles of the (a) mean total buoyancy (m s−2), (b) thermal buoyancy (m s−2), (c) water vapor buoyancy (m s−2), and (d) water loading buoyancy (m s−2) for L-RH cases over the convective core region (w > 1 m s−1) during the simulation period of 60–210 min (left column). (e–h) Similar to (a–d), but for H-RH cases (right column).
The net buoyancy is contributed by thermal buoyancy, water vapor buoyancy, and water loading (the calculation method is detailed in Appendix C). Figure 11b illustrates an increase in thermal buoyancy resulting from an enhanced latent heating rate (Figure 12a) as the CCN concentration rises from 90 cm−3 to 900 cm−3, primarily driven by condensation (Figure 12b). In the case of L-RH-CCN1800, net condensation is slightly suppressed due to the strong evaporation of smaller droplets (Figure 13b).
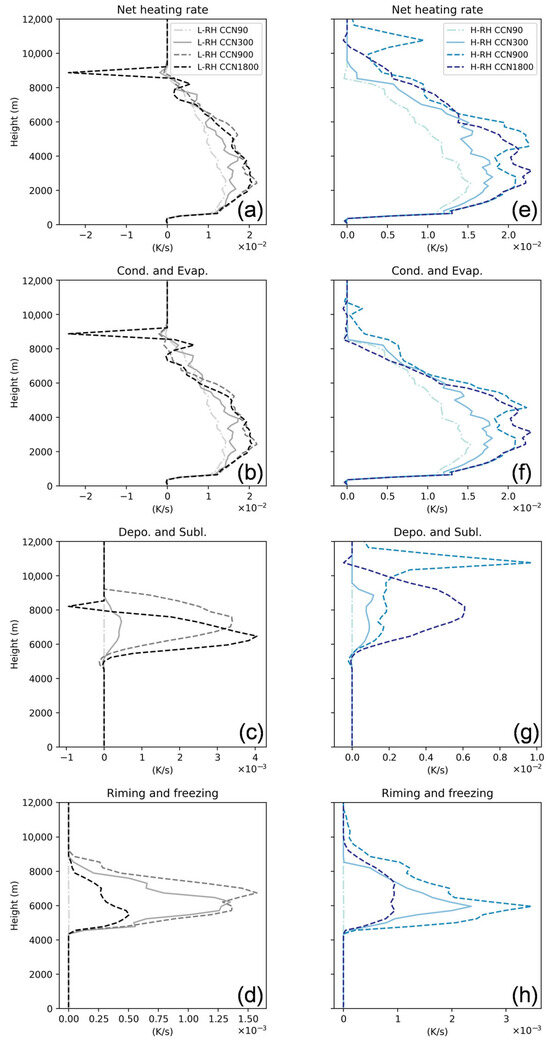
Figure 12.
The vertical profiles of (a) the averaged net heating and cooling rate, latent heat release from (b) condensation and evaporation, (c) deposition and sublimation, and (d) riming and freezing over the convective core region (w > 1 m s−1) during a simulation period of 60–210 min for the L-RH cases (left column). (e–h) Similar to (a–d), but for the H-RH cases (right column).
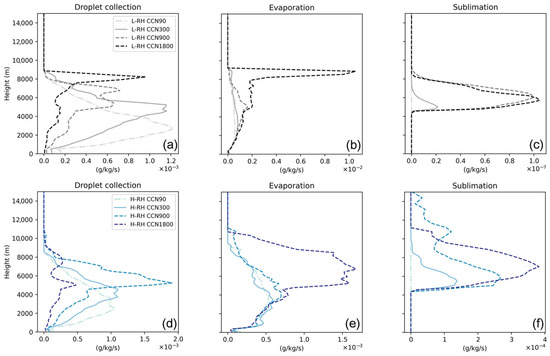
Figure 13.
The vertical profiles of the (a) mean collection rate, (b) evaporation rate of liquid drops, and (c) sublimation rate of ice particles over the convective core region (w > 1 m s−1) during a simulation period of 60–210 min for L-RH cases (top row); (d–f) the same as (a–c), but for H-RH cases (bottom row).
In the extremely clean condition (L-RH-CCN90), the cloud water is rapidly converted to rain water (Figure 7a), resulting in a high rain water mixing ratio but rather low cloud water content (Figure 6e,f). Moreover, it is difficult to form ice particles due to the very low IN concentration (Figure 6g,h), hence bringing about the complete inhibition of the deposition and freezing of liquid drops (Figure 12c,d). With the increment in the aerosol concentration, ice nucleation is enhanced due to the larger number of IN, resulting in increased latent heat released from deposition (Figure 12c). The heating rate associated with the riming and freezing of liquid drops is increased from CCN90 to CCN900 but decreased when the aerosol concentration continues to rise to CCN1800 (Figure 12d), which is likely due to the competing effects of the increased cloud water mixing ratio (Figure 6e) and the smaller size of cloud droplets (Figure 9a), which strengthen and weaken the riming/freezing of liquid drops, respectively [104]. Nevertheless, both the heating rates of net deposition and the riming/freezing of drops are an order of magnitude smaller than that of net condensation (Figure 12b–d).
Moreover, the water vapor content decreases under more polluted conditions in L-RH cases due to enhanced condensation, resulting in reduced water vapor buoyancy from CCN90 to CCN900 and an increasing trend from CCN900 to CCN1800 (Figure 11c). The water loading buoyancy remains consistently negative due to the dragging effect of hydrometeors, which is reduced above 3 km from CCN90 to CCN900, indicating the enhanced growth of hydrometeors in polluted environments. The responses of both the water vapor buoyancy and water loading buoyancy to the aerosol concentration exhibit the opposite trend compared to the thermal buoyancy (Figure 11c,d), but they are surpassed by the notable increment in thermal buoyancy, resulting in a slight increase in net buoyancy below 5 km from CCN90 to CCN900, followed by a decrease from CCN900 to CCN1800, which demonstrates that the aerosols induce a boomerang shape in the mean updrafts.
For the L-RH-CCN1800 run, the water loading buoyancy peaks at an altitude of 8.2 km (Figure 11d), where the condensate is primarily composed of cloud droplets with a smaller effective radius (Figure 7d and Figure 9a). The smaller droplets lead to stronger evaporation near the top of the cloud (Figure 13b) and generate negative thermal buoyancy (Figure 11b), combined with negative water loading buoyancy (Figure 11d), resulting in net buoyancy of 8.2 km (Figure 11a).
For H-RH cases, the aerosol effects on updrafts are similar to those for L-RH cases, i.e., a longer duration of strong updrafts below 5 km and a boomerang shape, but with a more notable trend, particularly under highly polluted conditions (Figure 11e–h). The more significant enhanced net condensation from CCN90 to CCN900 could explain the abovementioned trend (Figure 12f), leading to a larger net latent heating rate under higher humidity (Figure 12e) and, consequently, greater thermal buoyancy (Figure 11f). This results in a notable increase in net buoyancy below 5 km when compared to L-RH cases (Figure 11a,e). Another difference in the aerosol effects between H-RH and L-RH cases appears in the heating rate of net deposition, which is an order of magnitude larger in H-RH cases than in L-RH cases (Figure 12c,g) due to the sufficient water vapor supply from lower levels, indicating intense ice growth processes.
It was found that deposition can occur at altitudes exceeding 10 km for the H-RH-CCN900 run (Figure 12g), causing a larger latent heating rate at 11 km, which in turn generates positive thermal buoyancy herein (Figure 11f). The raised deposition is consistent with the rapidly lifted cloud top height, reaching up to 15 km for H-RH-CCN900 (compared to 9 km for H-RH-CCN90, Figure 7e,g). The significant increment in CTH can be attributed to the presence of a dry layer between 9 and11 km (Figure 5c). For all H-RH cases, except for H-RH-CCN900, the updrafts are not strong enough to penetrate the dry layer, resulting in the cloud top height remaining below 11 km. In contrast, the H-RH-CCN900 case is able to overshoot the dry layer and continue growing with the support of the humid layer in the upper troposphere (Figure 7g). A sensitivity test was conducted to eliminate the humid layer above 11 km, revealing that the convective clouds could only develop up to 11 km, highlighting the critical role of the dry layer for H-RH-CCN900.
Figure 6 shows the onset time of precipitation, the maximum rain rate for different simulations, and the population means (P-mean, [105]) of the mixing ratios of different types of hydrometeors (i.e., cloud droplets, raindrops, ice crystals and snow, and graupel). The P-mean represents the mean value of the parameters averaged over the entire simulated domain during the simulation period of 60–210 min.
For both L-RH and H-RH cases, the rain water dominates the cloud mass under extremely clean condition (CCN~90 cm−3). Increases in the aerosol concentration lead to a larger amount of cloud water (Figure 6e) but a reduction in rain water (Figure 6f) due to suppressed collision–coalescence among liquid drops (Figure 13a,d). The drop collision is delayed and the collection rate peaks at higher altitudes with enhanced aerosol loading (Figure 13a,d), resulting in an elevated altitude at which the initial raindrops form. The suppressed collision of liquid drops with rising aerosol concentrations also leads to the delayed onset of precipitation, and the aerosol impact is enhanced under more polluted and lower-RH conditions (Figure 6c). Cloud water eventually plays a more significant role in the total condensate than rain water as the aerosol concentration increases. The cloud water content is lower in H-RH cases compared to their L-RH counterparts (Figure 6e). Since cloud water provides the initial conditions for the formation of other hydrometeors, e.g., raindrops and ice particles, the reduced cloud water content can be attributed to the more efficient transition of water from cloud droplets to raindrops or graupel (Figure 6f,h).
Deposition is the dominant process governing the growth of ice and snow, a process that is enhanced with increasing aerosol concentrations (Figure 12c,g). This leads to a larger mixing ratio of ice crystals and snow for both L-RH and H-RH cases (Figure 6g). The graupel mass exhibits a non-monotonic trend with the raised aerosol concentration, increasing from extremely clean to intermediate conditions and then decreasing under more polluted conditions. The growth of graupel is mainly contributed by the riming of supercooled liquid drops by ice particles (Figure 12d,h). As the riming rate initially increases and then decreases with the aerosol concentration, there exists an optimal aerosol concentration (CCN~900 cm−3) for the graupel mass for both L-RH and H-RH cases (Figure 6h). The trend in the melting rate is similar to that of graupel collision, suggesting the predominant role of graupel in the melting process (Figure 6i). With a reduction in the rain mass and a non-monotonic variation in the graupel mass as the aerosol concentration rises, the maximum rain rate occurs under clean condition (CCN~300 cm−3, Figure 6d). The contribution of the freezing of liquid drops to the mass changing rate of ice particles is two to three orders of magnitude lower than that from deposition and riming, which are not depicted in Figure 6.
It is indicated that the aerosol impact on the mixing ratios of different types of hydrometeors exhibits a similar trend for L-RH and H-RH cases. However, L-RH cases demonstrate a relatively larger increase in the cloud water mixing ratio with the aerosol concentration (Figure 6e) due to the more prominent suppression effect on drop collisions (Figure 13a). The difference in the cloud water mixing ratio between L-RH and H-RH cases becomes more significant as the aerosol concentration rises, indicating that the aerosol suppression effect on drop collisions is more pronounced under lower-RH conditions (Figure 6e). Moreover, the variation in the ice and snow content with the aerosol concentration is more notable for H-RH cases compared to L-RH cases, particularly under polluted conditions (Figure 6g, CCN~1800 cm−3), due to the further strengthened deposition process facilitated by more abundant water vapor content (Figure 12c,g). At the same aerosol concentration, the graupel mass in H-RH cases is generally larger than that in L-RH cases, except under extremely clean conditions. This is due to the higher environmental moisture, which promotes the growth of ice-phase hydrometeors (Figure 6h).
In the present study, we found aerosol invigoration effects from CCN90 to CCN900, accompanied by an increase in the graupel mass content, while the response of the maximum surface rain rate to the aerosol concentration was different from that of convection, suggesting that other factors may be at play. With increased aerosol concentrations, the convective activity is enhanced. However, this enhancement is counterbalanced by intensified evaporation and sublimation processes (Figure 13), which reduce the total cloud mass (Figure 6). Consequently, the mass of ice-phase hydrometeors (e.g., ice crystals, snow, and graupel) increases, while the mass of rain water decreases. This redistribution of the water phases, along with the suppressed collision–coalescence process, ultimately led to a lower precipitation rate (Figure 6). Figure 14 shows that the domain-averaged evaporation and sublimation rates are larger, even though convection is invigorated under more polluted conditions, which may contribute to the reduced surface rainfall. For L-RH cases, the water vapor mixing ratio above 2 km is increased under more polluted conditions compared to CCN90 due to enhanced evaporation and sublimation (Figure 14b–d), and the increment trend is more pronounced under high aerosol concentrations, particularly from 2 km to 6 km for L-RH-CCN1800. We observed similar aerosol impacts for H-RH cases (Figure 14e–h), but with a more significant increase in the water vapor mixing ratio extending up to 10 km. Meanwhile, the temperature in the middle layer (3–7 km) decreased at the end of the precipitation in all experiments (Figure 14j–l,n–p), and this effect became more pronounced in the L-RH cases as the aerosol concentration increased. The more humid layer remaining after the dissipation of the convective cloud may play a role in the formation of subsequent clouds [106].
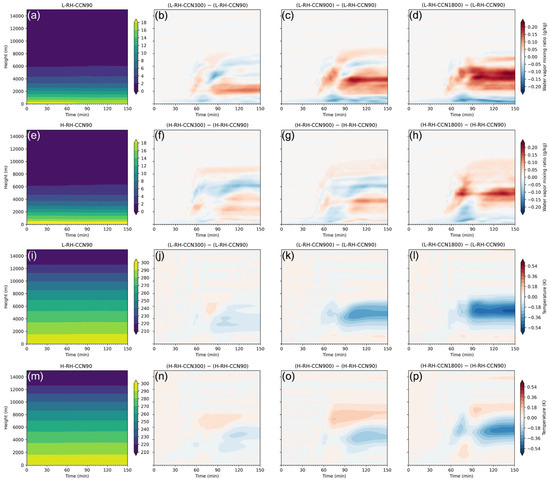
Figure 14.
(a) Time–height plot of the mean water vapor mixing ratio for the L−RH−CCN90 case; (b–d) time–height plots of the differences in the mean water vapor mixing ratio across various aerosol scenarios under lower-RH conditions compared to the L−RH−90 case; (e–h) similar to (a–d), but for H-RH cases; (i–l) and (m–p) are similar to (a–d) and (e–h), but showing the mean temperature for L-RH and H-RH cases, respectively.
4. Discussion
This study investigated the prestorm environment of LSP with different rain rates, which differs from the work of Zhang et al. [22], which studied the properties of local- and non-local-scale precipitation. There are slight differences in the overall precipitation distribution between the current study (Figure 2a,b) and the findings of Zhang et al. [22], which may be attributed to the specific season and time period examined, as detailed in Section 3.1. Nonetheless, our analysis reveals that the spatial distribution of LSP in Eastern China demonstrates significant heterogeneity concerning the rainfall intensity, occurrence frequency, and duration.
To investigate the factors influencing the LSP intensity, a comparative analysis of the prestorm meteorological environments for both light and heavy LSP events was conducted. The findings indicate that heavy rainfall events are associated with more favorable conditions for convection. Further analysis suggests that the vertical distributions of the temperature are nearly identical between light and heavy summer LSP events over Eastern China, while the distribution of the humidity is distinct, which is an interesting finding of the present study. The low-level water vapor content (below 5 km, Figure 5) plays a dominant role in the evolution of LSP, which is consistent with the findings reported in [107]. The sensitivity of temperature variations to the LSP intensity was not examined due to the relatively smaller differences in the temperature profiles between light and heavy LSP compared with the humidity. The strength of VWS is relatively weak for LSP compared to non-local-scale precipitation [22]; hence, the effect of VWS was also not examined in this study.
The simulation results indicate that an increase in low-level water vapor content strengthens convection and contributes to enhanced drop collisions and the melting process, which in turn results in a larger rain rate in H-RH cases. The effects of humidity on convective clouds in the present study were aligned with the findings of Gayatri et al. [104]. The maximum rain rate is generally higher for H-RH cases than that for L-RH cases, except under extremely clean conditions (CCN~90 cm−3), which can be considered aerosol-limited. The aerosol impacts on rainfall and the microphysical properties are similar between L-RH and H-RH cases (Figure 6), and the aerosol-induced changes in the maximum rain rate are larger than those induced by the RH, suggesting the important role of aerosols in the LSP over Eastern China.
Moreover, Figure 6d shows a suppression effect on precipitation when the CCN concentration increases from 300 cm−3 to 1800 cm−3 due to the rapidly reduced rain water content, which differs from other studies showing increased rainfall with the aerosol concentration [30,49,97]. The distinct aerosol effects may be linked to the locally developed convective cloud regime investigated in the present study, which exhibits different dynamical properties compared to non-local convective systems, e.g., large-scale or mesoscale convective systems.
5. Summary and Concluding Remarks
The present study investigated the properties of the thermodynamic parameters preceding the occurrence of summer LSP and their differences under light and heavy LSP conditions using hourly precipitation data, radiosonde, and satellite observations collected over Eastern China from 2018 to 2022. The LSP events in Eastern China exhibit spatial heterogeneity in terms of the precipitation intensity, occurrence frequency, and duration (Figure 2c–e). The statistical analysis of the satellite data reveals that LSP in Eastern China is closely associated with deep convective clouds (Figure 3a), confirming that most of the rainfall in the afternoon is due to thermal convection. It is found that the environmental temperature for light and heavy LSP events is identical; however, the average mixing ratio (relative humidity) below a 5 km altitude increases from 9.82 g kg−1 (61.2%) for light LSP to 10.88 g kg−1 (66.5%) for heavy LSP over Eastern China (Figure 5b,c).
Moreover, idealized large eddy simulations employing spectral bin microphysics were conducted based on the vertical profiles of the humidity derived from both light and heavy LSP events. In order to investigate the responses of the LSP intensity to different background aerosol concentrations, sensitivity tests were carried out with four aerosol scenarios for both L-RH and H-RH cases. Compared to low moisture (L-RH), the high-moisture (H-RH) environment significantly enhances the convection and precipitation intensity (Figure 6a) by promoting drop collisions and hastening ice-phase melting processes. In H-RH cases, the elevated water vapor content facilitates the rapid growth of cloud droplets and promotes efficient droplet coalescence, thereby accelerating the onset of precipitation.
Aerosols also invigorate LSP to a certain degree; however, the responses of microphysics to increased aerosol concentrations differ from those to elevated humidity. Higher aerosol concentrations lead to the enhanced condensational growth of cloud droplets, which release more latent heat and increase the thermal buoyancy (Figure 11 and Figure 12), thereby strengthening the updraft below a 5 km altitude (Figure 7). The aerosol invigoration effect becomes evident when the CCN concentration increases from 90 cm−3 to 900 cm−3 and is more significant in more humid environments (Figure 12b,f). In contrast to the decreased cloud water content induced by larger moisture, an increased aerosol concentration leads to more cloud water (Figure 6e) but a lower rain water mixing ratio (Figure 6f) due to suppressed collision–coalescence (Figure 13a,d). The reduction in cloud water under more humid conditions can be attributed to the more efficient conversion of cloud droplets to raindrops or ice-phase particles (Figure 6e–h). The mixing ratios of ice crystals and snow are also increased with more aerosols due to more efficient depositional growth. The increment in the mixing ratios of cloud droplets, ice crystals, and snow due to enhanced aerosol loading is more pronounced in moist environments. However, the maximum precipitation intensity initially increases (Figure 6d) and then decreases as the aerosol concentration rises, due to a reduction in rain water content and the boomerang-shaped trend of the graupel mass, regardless of the moisture conditions. The effects of the humidity are minimal in extremely clean environments (CCN~90 cm−3) but more pronounced in polluted circumstances. The differences in the mixing ratios of ice hydrometeors between L-RH and H-RH cases increase with enhanced aerosol concentrations (Figure 6a,b).
Although precipitation exhibits a non-monotonic response to the aerosol concentration, the domain-averaged water vapor mixing ratio increases under more polluted conditions for both L-RH and H-RH cases due to the evaporation of cloud droplets. The humidification effect is more pronounced under low-humidity conditions (Figure 14).
Our study highlights the significance of low-level moisture conditions and background aerosol concentrations in the formation of strong convection, which is beneficial in enhancing local convection warnings. When comparing the changes in the macro- and microphysical properties of LSP induced by aerosols to those contributed by humidity, our findings indicate that the effects of aerosols are more pronounced than those of moisture. This discrepancy may be attributed to the relatively smaller fluctuations in humidity observed between light and heavy LSP events over Eastern China, compared to the variations in the aerosol concentration examined in the present study. Furthermore, the aerosol-induced humidification effect may create a favorable environment for subsequent cloud formation, which would be a very interesting topic for further study. In addition, the impact of the aerosols’ chemical composition on the LSP intensity was not considered in the present study because the WRF model coupled with the chemical mode is essential in this context, but it is computationally expensive, particularly when simultaneously employing SBM as a microphysical scheme.
Author Contributions
Conceptualization, Q.C., J.G. and J.Y.; methodology, X.T., Q.C., J.G., J.C., Z.Z. and Y.S.; software, X.T., Z.Z. and J.C.; validation, X.T.; data curation, J.G.; writing—original draft preparation, X.T.; writing—review and editing, Q.C., J.G., J.Y., Z.Z., J.C. and Y.S.; visualization, X.T.; supervision, Q.C., J.G. and J.Y.; funding acquisition, Q.C. and J.G. All authors have read and agreed to the published version of the manuscript.
Funding
This work was jointly supported by the National Natural Science Foundation of China under grants 42275078, 42325501, U2142209, and 42230604; the Core Research and Development Project of Liaoning Meteorological Bureau of China under grant HXGGZ202402; and the National Key Scientific and Technological Infrastructure project “Earth System Numerical Simulation Facility” (EarthLab).
Data Availability Statement
The local-scale precipitation data can be acquired from Zhang et al. [22] and the sounding data used here are available through https://weather.uwyo.edu/upperair/sounding.html (accessed on 18 February 2025). Moreover, the cloud products from the Himawari-8 satellite are available through https://www.eorc.jaxa.jp/ptree/index.html (accessed on 18 February 2025).
Acknowledgments
This research used the Milkyway-2 computing resources at the National Supercomputer Center in Guangzhou, China and the supercomputing system at the Supercomputing Center of Nanjing University of Information Science & Technology.
Conflicts of Interest
The authors declare no conflicts of interest.
Appendix A
The atmospheric instability can be determined by analyzing the convective inhibition (CIN) and the convective available potential energy (CAPE), which are calculated using sounding data, as shown in Equations (A1) and (A2). Here, , , and represent the air pressure of the lifting convection, the level of free convection, and the level of neutral buoyancy, respectively. is the specific gas constant for dry air. and refer to the virtual temperatures of the parcel and the environment [108].
Precipitable water (PW) refers to the total amount of water vapor contained in a vertical column of air per unit area. This value represents the amount of precipitation that would be produced if all moisture in the air were to condense and fall as rain or snow [109]. It can be derived from sounding data such as specific humidity (). is the gravitational acceleration, and represents the density of liquid water. Additionally, and represent the pressure at the bottom and the top layer of the model, respectively.
Moisture stability energy (MSE) refers to the total energy, including internal energy (), potential energy (), and latent heat (), for a given amount of moist air [110]. This energy remains constant throughout wet adiabatic processes. MSE serves as a thermodynamic parameter that characterizes the state of an air parcel, while represents the specific heat at constant pressure, refers to the temperature, z is the height at which the air parcel is located, and is the latent heat of vaporization.
The K index is a metric used to assess atmospheric stability. A higher K index indicates a greater degree of environmental instability. The first, second, and third terms on the right side of Equation (A5) represent the temperature lapse rate, the water vapor conditions in the lower layers, and the level of saturation in the middle layers [111]. , , represent the temperature at 850 hPa, 700 hPa, and 500 hPa, respectively. and stand for the dew point temperature at 850 hPa and 700 hPa.

Table A1.
Parameters of environmental sounding observations for the precipitation events.
Table A1.
Parameters of environmental sounding observations for the precipitation events.
| Parameter | Abbreviation | Unit | Height Range |
|---|---|---|---|
| Convective available potential energy | CAPE | J kg−1 | Whole atmosphere |
| Convective inhibition | CIN | J kg−1 | Whole atmosphere |
| Lifting condensation level | LCL | km | Whole atmosphere |
| Level of free convection | LFC | km | Whole atmosphere |
| Equilibrium level | EL | km | Whole atmosphere |
| K index | K index | K | Whole atmosphere |
| Precipitable water | PW | mm | Whole atmosphere |
| Mixing ratio | Qv | g kg−1 | Ground surface |
| Moist static energy | MSE | J kg−1 | 0–1 km a.g.l |
Appendix B
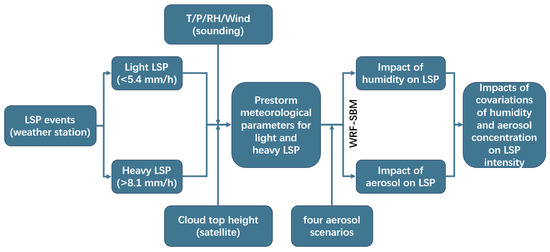
Figure A1.
The flow chart of the experiments in this study.
Appendix C
The cloud buoyancy can be expressed as follows [112]:
The first, second, and third terms on the right side of the equation are the thermal (B_t=), water vapor (B_v=, the virtual effect), and water-loading buoyancy (B_g=), respectively. Here, refers to the mean potential environment temperature, and represent the perturbation potential temperature and water vapor relative to the environment, and is the mixing ratio of all hydrometeors.
References
- Guo, J.; Su, T.; Li, Z.; Miao, Y.; Li, J.; Liu, H.; Xu, H.; Cribb, M.; Zhai, P. Declining Frequency of Summertime Local-Scale Precipitation over Eastern China from 1970 to 2010 and Its Potential Link to Aerosols: Declining Local-Scale Rainfall in China. Geophys. Res. Lett. 2017, 44, 5700–5708. [Google Scholar] [CrossRef]
- Chen, S.; Behrangi, A.; Tian, Y.; Hu, J.; Hong, Y.; Tang, Q.; Hu, X.-M.; Stepanian, P.M.; Hu, B.; Zhang, X. Precipitation Spectra Analysis Over China with High-Resolution Measurements from Optimally-Merged Satellite/Gauge Observations—Part II: Diurnal Variability Analysis. IEEE J. Sel. Top. Appl. Earth Obs. Remote Sens. 2016, 9, 2979–2988. [Google Scholar] [CrossRef]
- Yuan, W.; Yu, R.; Fu, Y. Study of Different Diurnal Variations of Summer Long-Duration Rainfall Between the Southern and Northern Parts of the Huai River. Chin. J. Geophys. 2014, 57, 145–153. (In Chinese) [Google Scholar] [CrossRef]
- Dai, A.; Giorgi, F.; Trenberth, K.E. Observed and Model-Simulated Diurnal Cycles of Precipitation over the Contiguous United States. J. Geophys. Res. Atmos. 1999, 104, 6377–6402. [Google Scholar] [CrossRef]
- Yuan, W.; Yu, R.; Zhang, M.; Lin, W.; Chen, H.; Li, J. Regimes of Diurnal Variation of Summer Rainfall over Subtropical East Asia. J. Clim. 2012, 25, 3307–3320. [Google Scholar] [CrossRef]
- Wu, Y.; Huang, A.; Huang, D.; Chen, F.; Yang, B.; Zhou, Y.; Fang, D.; Zhang, L.; Wen, L. Diurnal Variations of Summer Precipitation over the Regions East to Tibetan Plateau. Clim. Dyn. 2018, 51, 4287–4307. [Google Scholar] [CrossRef]
- Tang, J.; Chen, S.; Li, Z.; Gao, L. Mapping the Distribution of Summer Precipitation Types over China Based on Radar Observations. Remote Sens. 2022, 14, 3437. [Google Scholar] [CrossRef]
- Yang, S.; Smith, E.A. Convective–Stratiform Precipitation Variability at Seasonal Scale from 8 Yr of TRMM Observations: Implications for Multiple Modes of Diurnal Variability. J. Clim. 2008, 21, 4087–4114. [Google Scholar] [CrossRef]
- Yu, R.; Yuan, W.; Li, J.; Fu, Y. Diurnal Phase of Late-Night against Late-Afternoon of Stratiform and Convective Precipitation in Summer Southern Contiguous China. Clim. Dyn. 2010, 35, 567–576. [Google Scholar] [CrossRef]
- Berg, P.; Moseley, C.; Haerter, J.O. Strong Increase in Convective Precipitation in Response to Higher Temperatures. Nat. Geosci. 2013, 6, 181–185. [Google Scholar] [CrossRef]
- Freitag, B.M.; Nair, U.S.; Niyogi, D. Urban Modification of Convection and Rainfall in Complex Terrain. Geophys. Res. Lett. 2018, 45, 2507–2515. [Google Scholar] [CrossRef]
- Sutanto, S.J.; Hoffmann, G.; Worden, J.; Scheepmaker, R.A.; Aben, I.; Röckmann, T. Atmospheric Processes Governing the Changes in Water Isotopologues during ENSO Events from Model and Satellite Measurements. J. Geophys. Res. Atmos. 2015, 120, 6712–6729. [Google Scholar] [CrossRef]
- Yin, S.; Chen, D.; Xie, Y. Diurnal Variations of Precipitation during the Warm Season over China. Int. J. Climatol. 2009, 29, 1154–1170. [Google Scholar] [CrossRef]
- Guo, J.; Su, T.; Chen, D.; Wang, J.; Li, Z.; Lv, Y.; Guo, X.; Liu, H.; Cribb, M.; Zhai, P. Declining Summertime Local-Scale Precipitation Frequency Over China and the United States, 1981–2012: The Disparate Roles of Aerosols. Geophys. Res. Lett. 2019, 46, 13281–13289. [Google Scholar] [CrossRef]
- Yang, L.; Smith, J.A.; Baeck, M.L.; Bou-Zeid, E.; Jessup, S.M.; Tian, F.; Hu, H. Impact of Urbanization on Heavy Convective Precipitation under Strong Large-Scale Forcing: A Case Study over the Milwaukee–Lake Michigan Region. J. Hydrometeorol. 2014, 15, 261–278. [Google Scholar] [CrossRef]
- Keil, C.; Craig, G.C. Regime-Dependent Forecast Uncertainty of Convective Precipitation. Meteorol. Z. 2011, 20, 145–151. [Google Scholar] [CrossRef] [PubMed]
- Lee, Y.; Kummerow, C.D.; Ebert-Uphoff, I. Applying Machine Learning Methods to Detect Convection Using Geostationary Operational Environmental Satellite-16 (GOES-16) Advanced Baseline Imager (ABI) Data. Atmos. Meas. Tech. 2021, 14, 2699–2716. [Google Scholar] [CrossRef]
- Tian, F.; Zhang, X.; Sun, J.; Xia, K.; Hua, S.; Wei, Q.; Xue, L.; Yang, B. Climatology and Pre-Convection Environmental Conditions of Dry and Wet Thunderstorm High Winds over Eastern China. Theor. Appl. Clim. 2024, 155, 1493–1506. [Google Scholar] [CrossRef]
- Doswell, C.A.; Brooks, H.E.; Maddox, R.A. Flash Flood Forecasting: An Ingredients-Based Methodology. Weather Forecast. 1996, 11, 560–581. [Google Scholar] [CrossRef]
- Johns, R.H.; Doswell, C.A. Severe Local Storms Forecasting. Weather Forecast. 1992, 7, 588–612. [Google Scholar] [CrossRef]
- Sun, Y.; Wang, Y.; Zhao, C.; Zhou, Y.; Yang, Y.; Yang, X.; Fan, H.; Zhao, X.; Yang, J. Vertical Dependency of Aerosol Impacts on Local Scale Convective Precipitation. Geophys. Res. Lett. 2023, 50, e2022GL102186. [Google Scholar] [CrossRef]
- Zhang, J.; Guo, J.; Li, J.; Shao, J.; Tong, B.; Zhang, S. The Prestorm Environment and Prediction for Local- and Nonlocal-Scale Precipitation: Insights Gained from High-Resolution Radiosonde Measurements Across China. JGR Atmos. 2022, 127, e2021JD036395. [Google Scholar] [CrossRef]
- Dagan, G.; Koren, I.; Altaratz, O.; Heiblum, R.H. Aerosol Effect on the Evolution of the Thermodynamic Properties of Warm Convective Cloud Fields. Sci. Rep. 2016, 6, 38769. [Google Scholar] [CrossRef] [PubMed]
- Meyer, J.; Neuper, M.; Mathias, L.; Zehe, E.; Pfister, L. Atmospheric Conditions Favouring Extreme Precipitation and Flash Floods in Temperate Regions of Europe. Hydrol. Earth Syst. Sci. 2022, 26, 6163–6183. [Google Scholar] [CrossRef]
- Seeley, J.T.; Romps, D.M. Why Does Tropical Convective Available Potential Energy (CAPE) Increase with Warming? Geophys. Res. Lett. 2015, 42, 10429–10437. [Google Scholar] [CrossRef]
- Zhang, W.; Zhou, T.; Wu, P. Anthropogenic Amplification of Precipitation Variability over the Past Century. Science 2024, 385, 427–432. [Google Scholar] [CrossRef]
- Fan, J.; Zhang, R.; Li, G.; Tao, W.-K. Effects of Aerosols and Relative Humidity on Cumulus Clouds. J. Geophys. Res. Atmos. 2007, 112, D14204. [Google Scholar] [CrossRef]
- Khain, A.; Lynn, B. Simulation of a Supercell Storm in Clean and Dirty Atmosphere Using Weather Research and Forecast Model with Spectral Bin Microphysics. J. Geophys. Res. Atmos. 2009, 114, D19209. [Google Scholar] [CrossRef]
- Takemi, T. Dependence of the Precipitation Intensity in Mesoscale Convective Systems to Temperature Lapse Rate. Atmos. Res. 2010, 96, 273–285. [Google Scholar] [CrossRef]
- Gayatri, K.; Patade, S.; Prabha, T.V. Aerosol–Cloud Interaction in Deep Convective Clouds over the Indian Peninsula Using Spectral (Bin) Microphysics. J. Atmos. Sci. 2017, 74, 3145–3166. [Google Scholar] [CrossRef]
- Lohmann, U.; Feichter, J. Global Indirect Aerosol Effects: A Review. Atmos. Chem. Phys. 2005, 5, 715–737. [Google Scholar] [CrossRef]
- Stevens, B.; Feingold, G. Untangling Aerosol Effects on Clouds and Precipitation in a Buffered System. Nature 2009, 461, 607–613. [Google Scholar] [CrossRef] [PubMed]
- Twomey, S. Pollution and the Planetary Albedo. Atmos. Environ. 2007, 41, 120–125. [Google Scholar] [CrossRef]
- Chand, D.; Wood, R.; Anderson, T.L.; Satheesh, S.K.; Charlson, R.J. Satellite-Derived Direct Radiative Effect of Aerosols Dependent on Cloud Cover. Nat. Geosci. 2009, 2, 181–184. [Google Scholar] [CrossRef]
- Haywood, J.M.; Shine, K.P. The Effect of Anthropogenic Sulfate and Soot Aerosol on the Clear Sky Planetary Radiation Budget. Geophys. Res. Lett. 1995, 22, 603–606. [Google Scholar] [CrossRef]
- Johnson, B.T.; Shine, K.P.; Forster, P.M. The Semi-Direct Aerosol Effect: Impact of Absorbing Aerosols on Marine Stratocumulus. Q. J. R. Meteorol. Soc. 2004, 130, 1407–1422. [Google Scholar] [CrossRef]
- Hansen, J.; Sato, M.; Ruedy, R. Radiative Forcing and Climate Response. J. Geophys. Res. Atmos. 1997, 102, 6831–6864. [Google Scholar] [CrossRef]
- Ackerman, A.S.; Toon, O.B.; Stevens, D.E.; Heymsfield, A.J.; Ramanathan, V.; Welton, E.J. Reduction of Tropical Cloudiness by Soot. Science 2000, 288, 1042–1047. [Google Scholar] [CrossRef] [PubMed]
- Ramanathan, V.; Crutzen, P.J.; Kiehl, J.T.; Rosenfeld, D. Aerosols, Climate, and the Hydrological Cycle. Science 2001, 294, 2119–2124. [Google Scholar] [CrossRef]
- DeMott, P.J.; Prenni, A.J.; Liu, X.; Kreidenweis, S.M.; Petters, M.D.; Twohy, C.H.; Richardson, M.S.; Eidhammer, T.; Rogers, D.C. Predicting Global Atmospheric Ice Nuclei Distributions and Their Impacts on Climate. Proc. Natl. Acad. Sci. USA 2010, 107, 11217–11222. [Google Scholar] [CrossRef] [PubMed]
- Chen, Q.; Yin, Y.; Jiang, H.; Chu, Z.; Xue, L.; Shi, R.; Zhang, X.; Chen, J. The Roles of Mineral Dust as Cloud Condensation Nuclei and Ice Nuclei During the Evolution of a Hail Storm. J. Geophys. Res. Atmos. 2019, 124, 14262–14284. [Google Scholar] [CrossRef]
- Khain, A.; Rosenfeld, D.; Pokrovsky, A. Aerosol Impact on the Dynamics and Microphysics of Deep Convective Clouds. Q. J. R. Meteorol. Soc. 2005, 131, 2639–2663. [Google Scholar] [CrossRef]
- Yun, Y.; Zhang, D.-L.; Gao, W.; Yin, J.; Zhao, C.; Li, J.; Guo, J.; Liu, H. Spatiotemporal Variations of the Effects of Aerosols on Clouds and Precipitation in an Extreme-Rain-Producing MCS in South China. J. Geophys. Res. Atmos. 2024, 129, e2023JD040014. [Google Scholar] [CrossRef]
- Intergovernmental Panel on Climate Change (IPCC). Climate Change 2021—The Physical Science Basis: Working Group I Contribution to the Sixth Assessment Report of the Intergovernmental Panel on Climate Change, 1st ed.; Cambridge University Press: Cambridge, UK; New York, NY, USA, 2023; ISBN 978-1-00-915789-6. [Google Scholar]
- Lee, H.; Yum, S.S.; Lee, S.-S. A Modeling Study of the Aerosol Effects on Ice Microphysics in Convective Cloud and Precipitation Development under Different Thermodynamic Conditions. Atmos. Res. 2014, 145–146, 112–129. [Google Scholar] [CrossRef]
- Altaratz, O.; Bar-Or, R.Z.; Wollner, U.; Koren, I. Relative Humidity and Its Effect on Aerosol Optical Depth in the Vicinity of Convective Clouds. Environ. Res. Lett. 2013, 8, 034025. [Google Scholar] [CrossRef]
- Cui, Z.; Carslaw, K.S.; Blyth, A.M. The Coupled Effect of Mid-Tropospheric Moisture and Aerosol Abundance on Deep Convective Cloud Dynamics and Microphysics. Atmosphere 2011, 2, 222–241. [Google Scholar] [CrossRef]
- Zhang, M.; Deng, X.; Zhu, R.; Ren, Y.; Xue, H. The Impact of Aerosol Vertical Distribution on a Deep Convective Cloud. Atmosphere 2021, 12, 675. [Google Scholar] [CrossRef]
- Guo, J.; Deng, M.; Fan, J.; Li, Z.; Chen, Q.; Zhai, P.; Dai, Z.; Li, X. Precipitation and Air Pollution at Mountain and Plain Stations in Northern China: Insights Gained from Observations and Modeling. J. Geophys. Res. Atmos. 2014, 119, 4793–4807. [Google Scholar] [CrossRef]
- American Meteorological Society, 2024: Bergeron–Findeisen Process. Glossary of Meteorology. Available online: https://glossary.ametsoc.org/wiki/Bergeron-findeisen_process (accessed on 15 February 2025).
- Bergeron, T. On the Physics of Clouds and Precipitation. In Proceedings of the 5th Assembly U.G.G.I., Lisbon, Portugal, 17–26 September 1933; pp. 156–180. [Google Scholar]
- Findeisen, W. Kolloid-Meteorologische Vorgänge Bei Niederschlagsbildung. Meteor. Z. 1938, 55, 121. [Google Scholar]
- Wegener, A. Thermodynamik Der Atmosphäre; JA Barth: Leipzig, Germany, 1911; p. 331. [Google Scholar]
- Lohmann, U. Possible Aerosol Effects on Ice Clouds via Contact Nucleation. J. Atmos. Sci. 2002, 59, 647–656. [Google Scholar] [CrossRef]
- Lynn, B.; Khain, A.; Rosenfeld, D.; Woodley, W.L. Effects of Aerosols on Precipitation from Orographic Clouds. J. Geophys. Res. Atmos. 2007, 112, D10225. [Google Scholar] [CrossRef]
- Altaratz, O.; Koren, I.; Reisin, T.; Kostinski, A.; Feingold, G.; Levin, Z.; Yin, Y. Aerosols’ Influence on the Interplay between Condensation, Evaporation and Rain in Warm Cumulus Cloud. Atmos. Chem. Phys. 2008, 8, 15–24. [Google Scholar] [CrossRef]
- Heiblum, R.H.; Pinto, L.; Altaratz, O.; Dagan, G.; Koren, I. Core and Margin in Warm Convective Clouds—Part 2: Aerosol Effects on Core Properties. Atmos. Chem. Phys. 2019, 19, 10739–10755. [Google Scholar] [CrossRef]
- Marquis, J.N.; Feng, Z.; Varble, A.; Nelson, T.C.; Houston, A.; Peters, J.M.; Mulholland, J.P.; Hardin, J. Near-Cloud Atmospheric Ingredients for Deep Convection Initiation. Mon. Weather Rev. 2023, 151, 1247–1267. [Google Scholar] [CrossRef]
- Morrison, H. An Analytic Description of the Structure and Evolution of Growing Deep Cumulus Updrafts. J. Atmos. Sci. 2017, 74, 809–834. [Google Scholar] [CrossRef]
- Dagan, G.; Koren, I.; Altaratz, O.; Feingold, G. Feedback Mechanisms of Shallow Convective Clouds in a Warmer Climate as Demonstrated by Changes in Buoyancy. Environ. Res. Lett. 2018, 13, 054033. [Google Scholar] [CrossRef]
- Lin, Y.; Kumjian, M.R. Influences of CAPE on Hail Production in Simulated Supercell Storms. J. Atmos. Sci. 2022, 79, 179–204. [Google Scholar] [CrossRef]
- Chen, G.; Morawska, L.; Zhang, W.; Li, S.; Cao, W.; Ren, H.; Wang, B.; Wang, H.; Knibbs, L.D.; Williams, G.; et al. Spatiotemporal Variation of PM1 Pollution in China. Atmos. Environ. 2018, 178, 198–205. [Google Scholar] [CrossRef]
- Guo, J.; Yan, Y.; Chen, D.; Lv, Y.; Han, Y.; Guo, X.; Liu, L.; Miao, Y.; Chen, T.; Nie, J.; et al. The Response of Warm-Season Precipitation Extremes in China to Global Warming: An Observational Perspective from Radiosonde Measurements. Clim. Dyn. 2020, 54, 3977–3989. [Google Scholar] [CrossRef]
- Guo, J.; Miao, Y.; Zhang, Y.; Liu, H.; Li, Z.; Zhang, W.; He, J.; Lou, M.; Yan, Y.; Bian, L.; et al. The Climatology of Planetary Boundary Layer Height in China Derived from Radiosonde and Reanalysis Data. Atmos. Chem. Phys. 2016, 16, 13309–13319. [Google Scholar] [CrossRef]
- Ishida, H.; Nakjima, T.Y.; Yokota, T.; Kikuchi, N.; Watanabe, H. Investigation of GOSAT TANSO-CAI Cloud Screening Ability through an Intersatellite Comparison. J. Appl. Meteorol. Climatol. 2011, 50, 1571–1586. [Google Scholar] [CrossRef]
- Ishida, H.; Nakajima, T.Y. Development of an Unbiased Cloud Detection Algorithm for a Spaceborne Multispectral Imager. J. Geophys. Res. Atmos. 2009, 114, D07206. [Google Scholar] [CrossRef]
- Letu, H.; Nagao, T.M.; Nakajima, T.Y.; Matsumae, Y. Method for Validating Cloud Mask Obtained from Satellite Measurements Using Ground-Based Sky Camera. Appl. Opt. 2014, 53, 7523–7533. [Google Scholar] [CrossRef]
- Nakajima, T.Y.; Tsuchiya, T.; Ishida, H.; Matsui, T.N.; Shimoda, H. Cloud Detection Performance of Spaceborne Visible-to-Infrared Multispectral Imagers. Appl. Opt. 2011, 50, 2601–2616. [Google Scholar] [CrossRef] [PubMed]
- Eyre, J. A Fast Radiative Transfer Model for Satellite Sounding Systems. Available online: https://www.ecmwf.int/en/elibrary/74431-fast-radiative-transfer-model-satellite-sounding-systems (accessed on 16 February 2025).
- Kouki, M.; Toshiharu, I.; Hiroshi, S.; Ryo, Y. Algorithm Theoretical Basis Document for Cloud Type/Phase Product. Meteorol. Satell. Cent. Tech. Note 2016, 61, 19–31. [Google Scholar]
- Nieman, S.J.; Schmetz, J.; Menzel, W.P. A Comparison of Several Techniques to Assign Heights to Cloud Tracers. J. Appl. Meteorol. Climatol. 1993, 32, 1559–1568. [Google Scholar] [CrossRef]
- Schmetz, J.; Holmlund, K.; Hoffman, J.; Strauss, B.; Mason, B.; Gaertner, V.; Koch, A.; Berg, L.V.D. Operational Cloud-Motion Winds from Meteosat Infrared Images. J. Appl. Meteorol. Climatol. 1993, 32, 1206–1225. [Google Scholar] [CrossRef]
- Rossow, W.B.; Walker, A.W.; Garder, L.C. Comparison of ISCCP and Other Cloud Amounts. J. Clim. 1993, 6, 2394–2418. [Google Scholar] [CrossRef]
- Rossow, W.B.; Mosher, F.; Kinsella, E.; Arking, A.; Desbois, M.; Harrison, E.; Minnis, P.; Ruprecht, E.; Seze, G.; Simmer, C.; et al. ISCCP Cloud Algorithm Intercomparison. J. Appl. Meteorol. Climatol. 1985, 24, 877–903. [Google Scholar] [CrossRef]
- Rossow, W.B.; Garder, L.C. Cloud Detection Using Satellite Measurements of Infrared and Visible Radiances for ISCCP. J. Clim. 1993, 6, 2341–2369. [Google Scholar] [CrossRef]
- Rossow, W.B.; Schiffer, R.A. Advances in Understanding Clouds from ISCCP. Bull. Am. Meteorol. Soc. 1999, 80, 2261–2288. [Google Scholar] [CrossRef]
- Huo, J.; Lu, D.; Duan, S.; Bi, Y.; Liu, B. Comparison of the Cloud Top Heights Retrieved from MODIS and AHI Satellite Data with Ground-Based Ka-Band Radar. Atmos. Meas. Tech. 2020, 13, 1–11. [Google Scholar] [CrossRef]
- Hsu, N.C.; Tsay, S.-C.; King, M.D.; Herman, J.R. Aerosol Properties over Bright-Reflecting Source Regions. IEEE Trans. Geosci. Remote Sens. 2004, 42, 557–569. [Google Scholar] [CrossRef]
- Zhang, T.; Zang, L.; Mao, F.; Wan, Y.; Zhu, Y. Evaluation of Himawari-8/AHI, MERRA-2, and CAMS Aerosol Products over China. Remote Sens. 2020, 12, 1684. [Google Scholar] [CrossRef]
- Fan, J.; Rosenfeld, D.; Zhang, Y.; Giangrande, S.E.; Li, Z.; Machado, L.A.T.; Martin, S.T.; Yang, Y.; Wang, J.; Artaxo, P.; et al. Substantial Convection and Precipitation Enhancements by Ultrafine Aerosol Particles. Science 2018, 359, 411–418. [Google Scholar] [CrossRef]
- Skamarock, W.C.; Klemp, J.B.; Dudhia, J.; Gill, D.O.; Liu, Z.; Berner, J.; Wang, W.; Powers, J.G.; Duda, M.G.; Barker, D.M.; et al. A Description of the Advanced Research WRF Version 4; National Center for Atmospheric Research (NCAR): Boulder, CO, USA, 2019; p. 145. [Google Scholar]
- Chandrakar, K.K.; Morrison, H.; Grabowski, W.W.; Bryan, G.H. Comparison of Lagrangian Superdroplet and Eulerian Double-Moment Spectral Microphysics Schemes in Large-Eddy Simulations of an Isolated Cumulus Congestus Cloud. J. Atmos. Sci. 2022, 79, 1887–1910. [Google Scholar] [CrossRef]
- Grabowski, W.W. Comparison of Eulerian Bin and Lagrangian Particle-Based Microphysics in Simulations of Nonprecipitating Cumulus. J. Atmos. Sci. 2020, 77, 3951–3970. [Google Scholar] [CrossRef]
- Grabowski, W.W. Separating Physical Impacts from Natural Variability Using Piggybacking Technique. Adv. Geosci. 2019, 49, 105–111. [Google Scholar] [CrossRef]
- Lasher-Trapp, S.G.; Cooper, W.A.; Blyth, A.M. Broadening of Droplet Size Distributions from Entrainment and Mixing in a Cumulus Cloud. Q. J. R. Meteorol. Soc. 2005, 131, 195–220. [Google Scholar] [CrossRef]
- Morrison, H.; Witte, M.; Bryan, G.H.; Harrington, J.Y.; Lebo, Z.J. Broadening of Modeled Cloud Droplet Spectra Using Bin Microphysics in an Eulerian Spatial Domain. J. Atmos. Sci. 2018, 75, 4005–4030. [Google Scholar] [CrossRef]
- Seidel, D.J.; Ao, C.O.; Li, K. Estimating Climatological Planetary Boundary Layer Heights from Radiosonde Observations: Comparison of Methods and Uncertainty Analysis. J. Geophys. Res. Atmos. 2010, 115, D16113. [Google Scholar] [CrossRef]
- Chandrakar, K.K.; Grabowski, W.W.; Morrison, H.; Bryan, G.H. Impact of Entrainment Mixing and Turbulent Fluctuations on Droplet Size Distributions in a Cumulus Cloud: An Investigation Using Lagrangian Microphysics with a Subgrid-Scale Model. J. Atmos. Sci. 2021, 78, 2983–3005. [Google Scholar] [CrossRef]
- Khain, A.P.; Leung, L.R.; Lynn, B.; Ghan, S. Effects of Aerosols on the Dynamics and Microphysics of Squall Lines Simulated by Spectral Bin and Bulk Parameterization Schemes. J. Geophys. Res. Atmos. 2009, 114, D22203. [Google Scholar] [CrossRef]
- Lynn, B.H.; Khain, A.P.; Dudhia, J.; Rosenfeld, D.; Pokrovsky, A.; Seifert, A. Spectral (Bin) Microphysics Coupled with a Mesoscale Model (MM5). Part II: Simulation of a CaPE Rain Event with a Squall Line. Mon. Weather Rev. 2005, 133, 59–71. [Google Scholar] [CrossRef]
- Shpund, J.; Khain, A.; Lynn, B.; Fan, J.; Han, B.; Ryzhkov, A.; Snyder, J.; Dudhia, J.; Gill, D. Simulating a Mesoscale Convective System Using WRF With a New Spectral Bin Microphysics: 1: Hail vs Graupel. J. Geophys. Res. Atmos. 2019, 124, 14072–14101. [Google Scholar] [CrossRef]
- Khain, A.P.; Beheng, K.D.; Heymsfield, A.; Korolev, A.; Krichak, S.O.; Levin, Z.; Pinsky, M.; Phillips, V.; Prabhakaran, T.; Teller, A.; et al. Representation of Microphysical Processes in Cloud-Resolving Models: Spectral (Bin) Microphysics versus Bulk Parameterization: BIN VS BULK. Rev. Geophys. 2015, 53, 247–322. [Google Scholar] [CrossRef]
- Milbrandt, J.A.; McTaggart-Cowan, R. Sedimentation-Induced Errors in Bulk Microphysics Schemes. J. Atmos. Sci. 2010, 67, 3931–3948. [Google Scholar] [CrossRef]
- Jaenicke, R. Aerosol Physics and Chemistry. In Physical and Chemical Properties of the Air; Fischer, G., Ed.; Landolt-Bornstein Numerical Data and Functional Relationships in Science and Technology New Series Group V; Springer: Berlin/Heidelberg, Germany, 1988; Volume 4B, pp. 391–457. [Google Scholar]
- Yin, Y.; Levin, Z.; Reisin, T.G.; Tzivion, S. The Effects of Giant Cloud Condensation Nuclei on the Development of Precipitation in Convective Clouds—A Numerical Study. Atmos. Res. 2000, 53, 91–116. [Google Scholar] [CrossRef]
- Liu, P.; Yin, Y.; Chen, Q.; Lou, X. Numerical Simulation of Hygroscopic Seeding Effects on Warm Convective Clouds and Rainfall Reduction. J. Appl. Meteorol. Sci. 2019, 30, 211–222. (In Chinese) [Google Scholar] [CrossRef]
- Fan, J.; Leung, L.R.; Rosenfeld, D.; Chen, Q.; Li, Z.; Zhang, J.; Yan, H. Microphysical Effects Determine Macrophysical Response for Aerosol Impacts on Deep Convective Clouds. Proc. Natl. Acad. Sci. USA 2013, 110, E4581–E4590. [Google Scholar] [CrossRef] [PubMed]
- Pruppacher, H.R.; Klett, J.D. Microphysics of Clouds and Precipitation, 2nd ed.; Atmospheric and Oceanographic Sciences Library; Springer: Dordrecht, The Netherlands, 2010. [Google Scholar]
- Wang, M.; Fu, Y.; Zhao, C.; Zhong, L.; Li, R.; Wang, D.; Qiu, X.; Zhou, S. Characteristics of Summer Cloud Precipitation along Latitude 30°N in East Asia Derived from Tropical Rainfall Measuring Mission Precipitation Radar and Visible and Infrared Scanner Measurements. Int. J. Climatol. 2022, 42, 5373–5392. [Google Scholar] [CrossRef]
- Houze, R.A. Orographic Effects on Precipitating Clouds. Rev. Geophys. 2012, 50, 2011RG000365. [Google Scholar] [CrossRef]
- Houze, R.A., Jr. Mesoscale Convective Systems. Rev. Geophys. 2004, 42. [Google Scholar] [CrossRef]
- Romatschke, U.; Houze, R.A. Characteristics of Precipitating Convective Systems in the Premonsoon Season of South Asia. J. Hydrometeorol. 2011, 12, 157–180. [Google Scholar] [CrossRef]
- Rossow, W.B.; Garder, L.C. Validation of ISCCP Cloud Detections. J. Clim. 1993, 6, 2370–2393. [Google Scholar] [CrossRef]
- Gayatri, K.; Patade, S.; Fan, J.; Prabhakaran, T. Pathways of Precipitation Formation in Different Thermodynamic and Aerosol Environments over the Indian Peninsula. Atmos. Res. 2022, 266, 105934. [Google Scholar] [CrossRef]
- Wang, C. A Modeling Study of the Response of Tropical Deep Convection to the Increase of Cloud Condensation Nuclei Concentration: 1. Dynamics and Microphysics. J. Geophys. Res. Atmos. 2005, 110, D21211. [Google Scholar] [CrossRef]
- Abbott, T.H.; Cronin, T.W. Aerosol Invigoration of Atmospheric Convection through Increases in Humidity. Science 2021, 371, 83–85. [Google Scholar] [CrossRef] [PubMed]
- Jo, E.; Lasher-Trapp, S. Entrainment in a Simulated Supercell Thunderstorm. Part III: The Influence of Decreased Environmental Humidity and General Effects upon Precipitation Efficiency. J. Atmos. Sci. 2023, 80, 1107–1122. [Google Scholar] [CrossRef]
- Zhao, C.; Tie, X.; Lin, Y. A Possible Positive Feedback of Reduction of Precipitation and Increase in Aerosols over Eastern Central China. Geophys. Res. Lett. 2006, 33, L11814. [Google Scholar] [CrossRef]
- Salby, M.L. Fundamentals of Atmospheric Physics; International Geophysics Series; Academic Press: San Diego, CA, USA, 1996; ISBN 978-0-12-615160-2. [Google Scholar]
- Wallace, J.M.; Hobbs, P.V. Atmospheric Thermodynamics. In Atmospheric Science: An Introductory Survey, 2nd ed.; Academic Press: San Diego, CA, USA, 2006; pp. 63–102. [Google Scholar]
- George, J.J. Forecasting the Movement, Deepening, and Filling of Cyclones. In Weather Forecasting for Aeronautics; Academic Press: New York, NY, USA; London, UK, 1961; Volume 65, p. 68. [Google Scholar]
- Cotton, W.R.; Bryan, G.H.; van Den Heever, S.C. Storm and Cloud Dynamics; Academic Press: San Diego, CA, USA, 2011; pp. 610–611. [Google Scholar]
Disclaimer/Publisher’s Note: The statements, opinions and data contained in all publications are solely those of the individual author(s) and contributor(s) and not of MDPI and/or the editor(s). MDPI and/or the editor(s) disclaim responsibility for any injury to people or property resulting from any ideas, methods, instructions or products referred to in the content. |
© 2025 by the authors. Licensee MDPI, Basel, Switzerland. This article is an open access article distributed under the terms and conditions of the Creative Commons Attribution (CC BY) license (https://creativecommons.org/licenses/by/4.0/).