2.2.1. Traditional Calculation Method Based on the Vertical Variations of Temperature Fluctuations
According to the linear theory of waves, atmospheric waves (e.g., planetary waves, tides, gravity waves, etc.) propagate vertically upward with an exponential increase in amplitude, as shown in Formula (1):
where
A is the amplitude,
z is the height,
is the reference height,
A0 is the amplitude at the reference height, and
H is the atmospheric scale height.
As shown by Offermann et al. [
9], the temperature standard deviation is indeed a useful metric for characterizing the total fluctuations associated with atmospheric wave activity. It typically exhibits two distinct sections in its profile, with respect to altitude. In the lower-altitude section, the temperature standard deviation tends to increase slowly with height, indicating that the propagation of atmospheric waves is suppressed due to factors such as increased atmospheric stability or damping effects. On the other hand, in the upper-altitude section, the temperature standard deviation exhibits a more rapid increase with height, suggesting that there is significantly less dissipation of energy as the atmospheric wave energy propagates. The altitude at which the two fitted lines from these distinct regions intersect is identified as the “wave turbopause”.
However, an important feature of the temperature standard deviation profile is the transitional height region that exists between these two slopes. In this transitional zone, the standard deviation increases with altitude, exhibiting inflection points that signify changes in wave activity behavior. This region is critical because it marks the onset of turbulence weakening, during which some atmospheric waves may break or attenuate while others may experience enhancement as they continue to propagate upward. The traditional method of identifying the wave turbopause primarily focuses on the altitude at which these two distinct steady-state behaviors intersect. While this provides a single height defining the turbopause, it does not adequately capture the dynamic characteristics and variations occurring within the three identified layers of the atmospheric structure. A more comprehensive approach that includes the analysis of the transitional height section, along with the distinct lower and upper sections, would improve our understanding of the complex interactions between different atmospheric waves and the conditions under which they propagate or dissipate.
In previous studies, two regions, 40–75 km and 95–110 km, were always artificially delineated, and the two fitting ranges were chosen because the profile of the temperature standard deviation varied linearly at these two altitudes ([
6,
9,
16]). However, the temperature standard deviation profiles were not always smooth in the designated regions, particularly in the 40–75 km range, as shown in
Figure 1. This inherent variability in the profiles suggests that the traditional fixed division can result in different degrees of error when analyzing the temperature standard deviation under different atmospheric conditions. Therefore, it is imperative to adapt the selection of regions based on the specific characteristics of the temperature standard deviation profile.
For instance,
Figure 1 illustrates the temperature standard deviation observed over Beijing on 15 September 2002. The figure features various colored straight lines representing different selections of altitude ranges. In the lower region, the temperature standard deviation profiles were analyzed using divisions of 30–65 km, 40–60 km, and 40–75 km. Notably, the profiles for the 30–65 km and 40–60 km ranges aligned more closely with a trend of linear increase with height compared to the broader 40–75 km division. At higher altitudes, the profiles were divided into 90–109 km, 95–109 km, and 100–109 km. Here, the temperature standard deviation gradient was smoother above 90 km compared to lower altitudes. This observation emphasizes the importance of carefully selecting the altitude zones according to the characteristics of the temperature standard deviation profile in each case. It is apparent that once the division ranges change, the height of the intersections of the two fitting lines that are taken as the height of the turbopause may change significantly.
As demonstrated in
Figure 1, if the temperature standard deviation of 30–65 km and 90–110 km was linearly fitted, the intersection of the two lines was 80.85 km. If the temperature standard deviation of 40–60 km and 100–110 km was fitted linearly, the intersection point of the two lines was 86.85 km. This resulted in a difference of roughly 6 km between the two derived heights, leaving ambiguity regarding which option provided a more accurate representation of the turbopause. This made it impossible to determine the true height of the turbopause for the same temperature standard deviation profile. Meanwhile, these two heights alone did not describe the difference between the height segments in which these two heights were calculated.
This observation highlights a limitation of the traditional method for the determination of the turbopause, where the determined position is significantly influenced by the specific height ranges selected for the linear fitting process. As these height ranges are not clearly defined, the resulting turbopause height can vary. Offermann also mentions this, and, overall, the different divisions result in a 3.3 km error in the position of the turbopause [
9].
Moreover, as shown in
Figure 1, there are some more complex vertical variations in the temperature standard deviation when analyzing a local grid. This suggests that how to divide the fitting height region will have a more obvious effect on the turbopause of the local grid. From
Figure 1, it is evident that the temperature rose to approximately 260 K at altitudes of 30–50 km, then exhibited a general downward trend between 50–100 km, before increasing again above 100 km. The turbopause is expected to be situated in the region where the temperature decreases with height. Given that the temperature gradient is positive in the lower thermosphere, this section of the atmosphere is characterized by stable convection. Additionally, the temperature standard deviation in regions where the temperature increases with height varies smoothly with altitude. Therefore, it is very important to determine the height range of different behaviors of atmospheric waves in the process of upward propagation.
John and Kishore Kumar [
7] observed that the slopes of the temperature standard deviation curves are not uniform above 95 km, indicating differing growth rates at these altitudes. Consequently, they proposed employing linear fits for two specific altitude ranges: 90–100 km and 105–115 km. By intersecting the fitted lines from these ranges with those from the 40–75 km region, they identified two intersection points. These heights were designated as the double wave turbopause, while the vertical range between these two points is referred to as the wave turbopause layer. The fluctuating wave turbopause here refers to the change in the vertical upward propagation of the wave after its suppression by turbulence has been weakened.
However, the selection of these areas still requires manual intervention, making it challenging to develop universally applicable criteria. To address this, we propose a new approach. This methodology aims to provide a more standardized and readily applicable means of identifying turbopause characteristics without the individualized handling that complicates traditional methods.
2.2.2. New Method Based on the Vertical Propagation of Wave Energy
Exploiting the variations in energy loss of atmospheric waves as they propagate vertically across different altitude ranges, we utilize the temperature standard deviation (
) as a proxy for the amplitude of these waves, and the square of the amplitude (
) serves as the representation of the potential energy associated with the wave. In accordance with linear theory, atmospheric waves exhibit a proportional relationship between potential energy and kinetic energy. Thus, the atmospheric potential energy can be used to fully characterize the energy of atmospheric waves. Then, in the process of non-dissipative propagation of atmospheric waves, the energy of the wave should be conserved, as shown in Formula (2):
where
C is defined as the energy index, which represents the wave energy,
is the temperature standard deviation, and
is the atmospheric density. However, it is important to note that while SABER does not provide direct measurements of atmospheric density, it does offer data on atmospheric number density. In the altitude range of 50 to 110 km, the variation of atmospheric density with height closely mirrors that of atmospheric number density. This characteristic allowed us to substitute the number density for the density in our analyses without significantly compromising the accuracy of our results:
where
C is defined as the energy index, which represents the wave energy, and
n is the atmospheric number density.
Ideally, atmospheric waves do not dissipate during propagation, and the energy index should remain constant. However, this assumption does not hold true in reality. Below the turbopause, the presence of turbulence leads to significant energy dissipation, suppressing the growth of wave amplitude with increasing altitude. This effect is considerably more pronounced than the attenuation of atmospheric molecular number density with height, resulting in rapid decay of the energy index in this lower region. But above the turbopause, the dissipation of energy from atmospheric waves diminishes. As a result, the energy index stabilizes and approaches a constant value in this upper region. This apparent difference in energy index with height above and below the turbopause provides a key indicator to determine the location of the turbopause. By analyzing the variation of these energy indices with height, the height of the turbopause can be ascertained. However, it is also very difficult because this characterization is gradual.
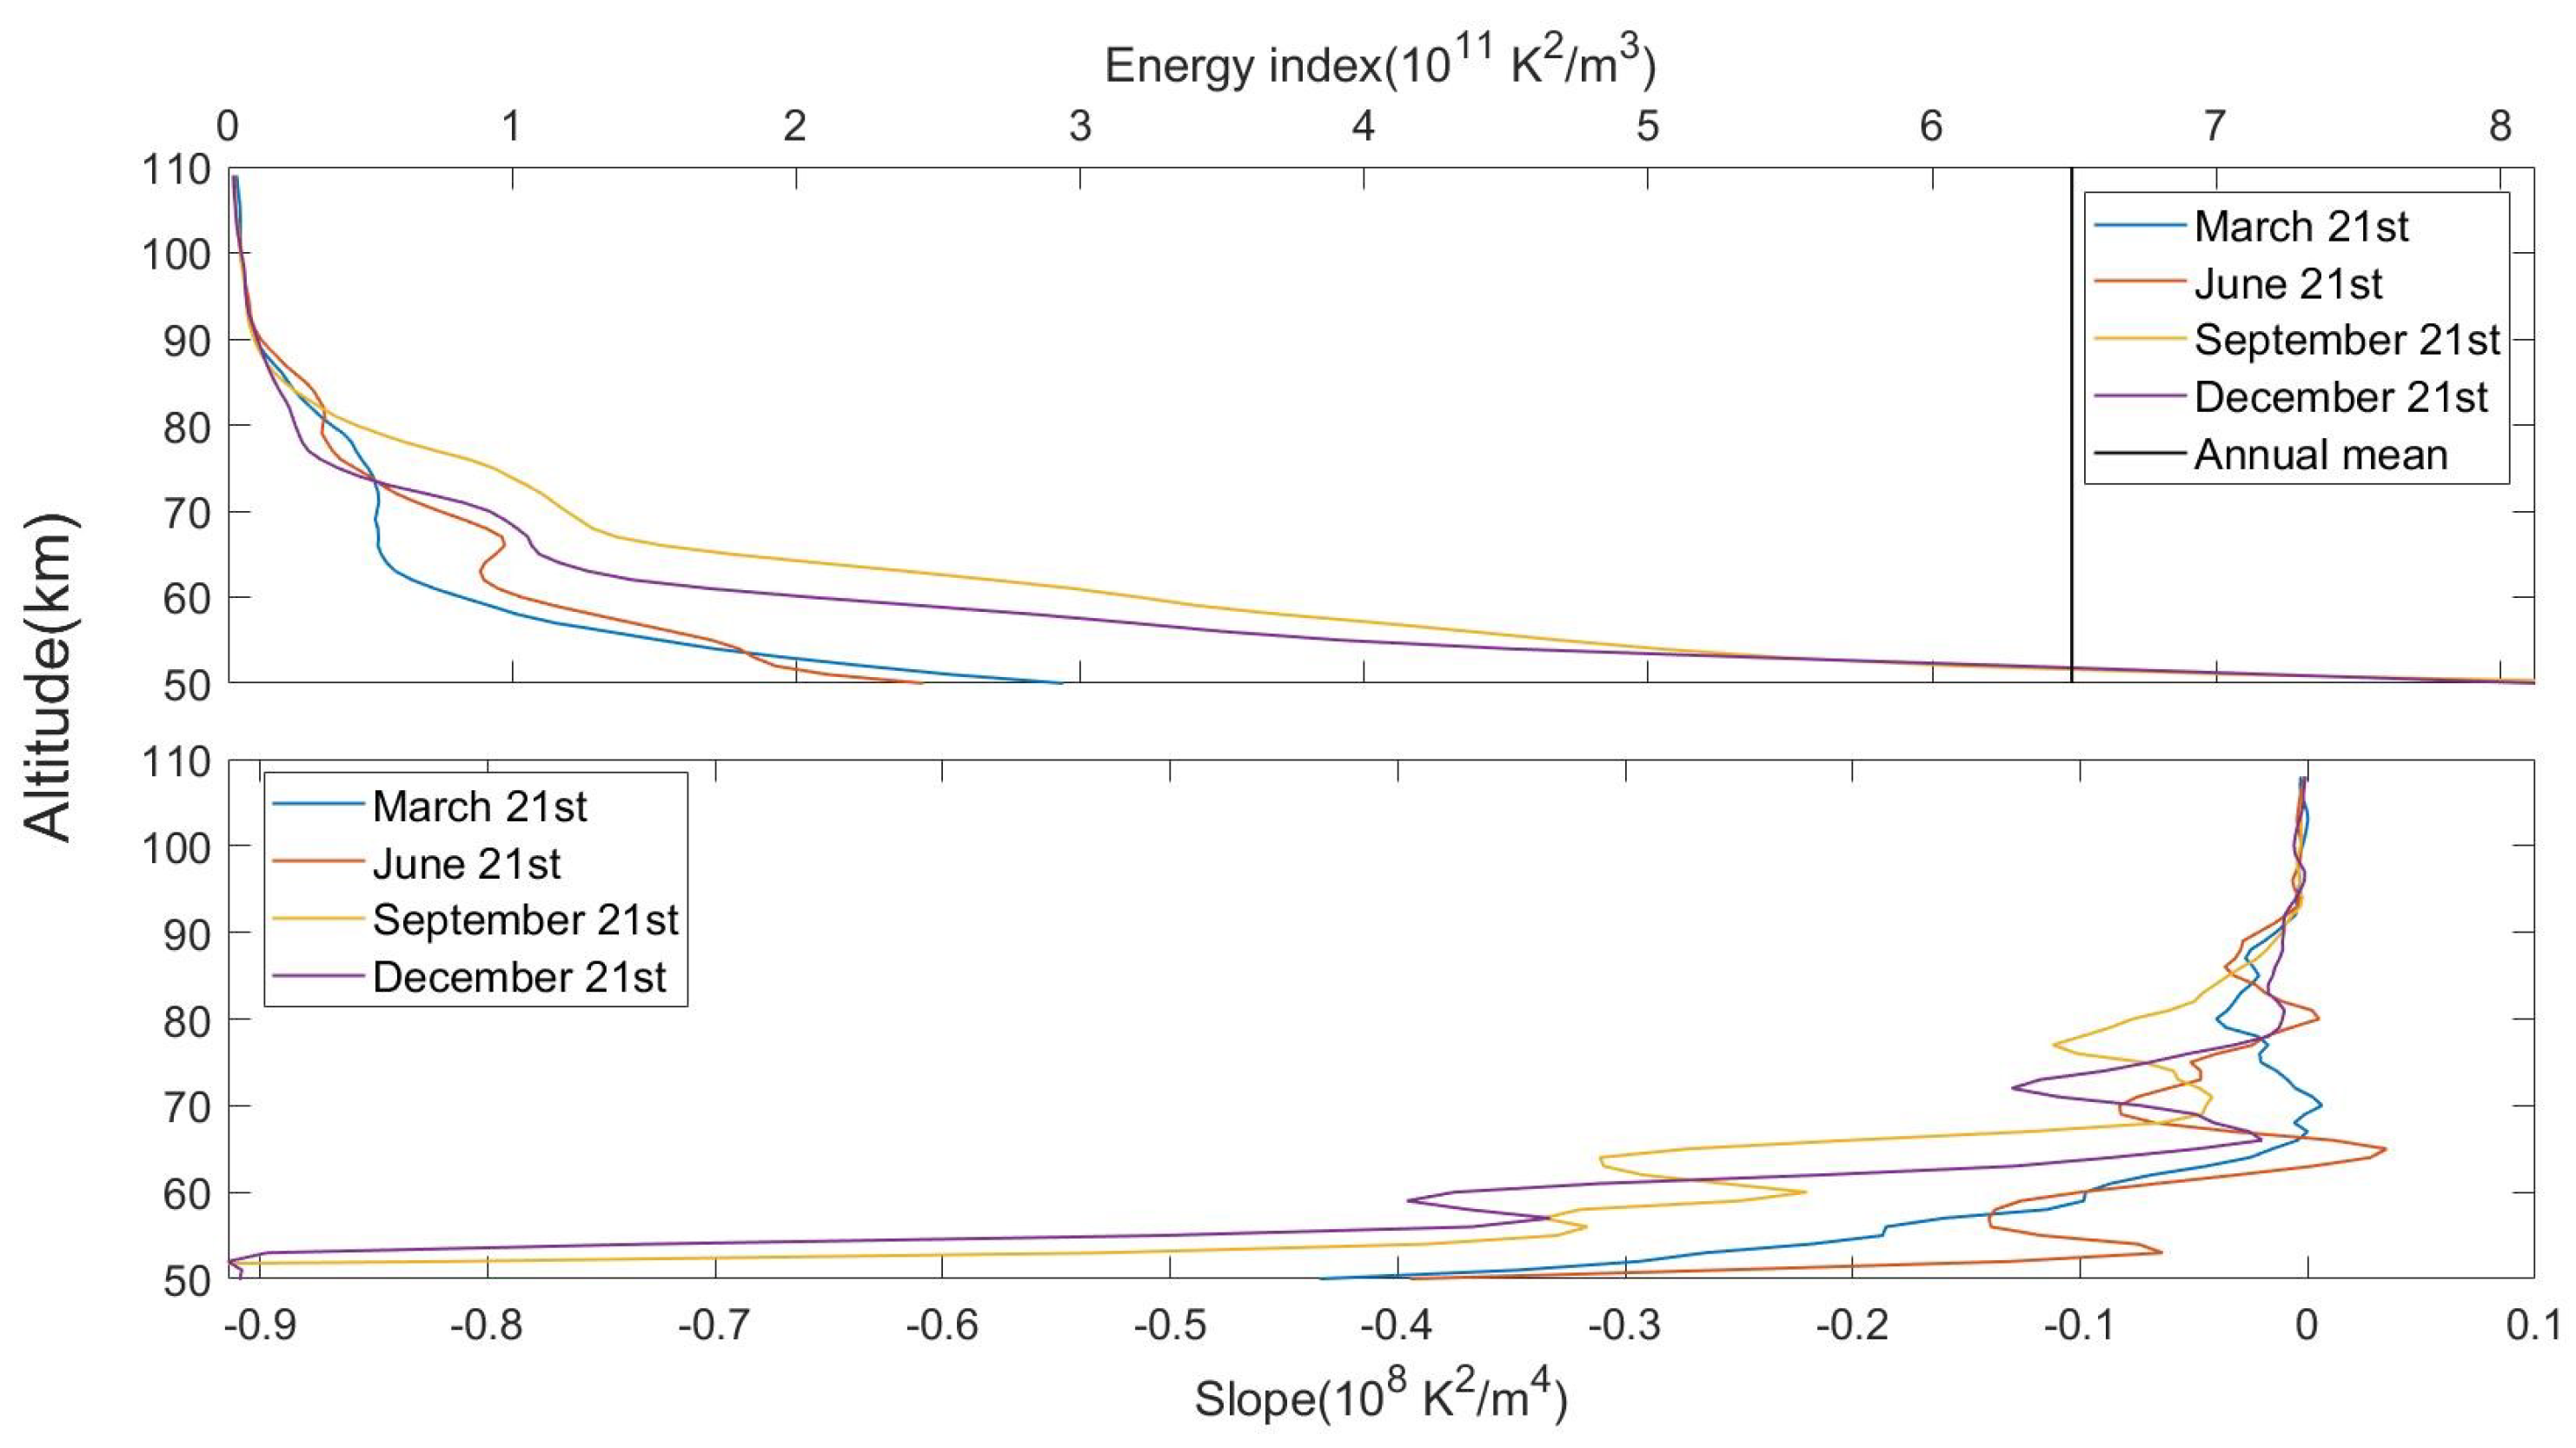
Figure 2 shows the energy index with height in the Beijing grid on 21 March, 21 June, 21 September, and 21 December 2006, respectively, as examples. First, we conducted a 5 km average on the original energy index data. This smoothing process served to filter out minor fluctuations that might have obscured significant trends in the energy index profile.
We mainly studied the change of energy index above the stratopause (50 km). As illustrated in
Figure 2, several different decay processes of the energy index could be observed with increasing height. Initially, the profiles exhibited a notably rapid decay phase where turbulent dissipation played a dominant role. Then, there was a transition to a slower decaying phase. Finally, the energy index entered a very gradual decay phase, in which molecular dissipation became the primary dissipation mechanism.
We focused our investigation on variations of the energy index above the stratopause (50 km). As illustrated in
Figure 2, the energy index exhibited several distinct decay processes with increasing altitude in this region. Each profile initially experienced a rapid decay phase characterized by the dominance of turbulent dissipation. Following this, there was a transition into a phase where the rate of decay began to slow down. Eventually, the profiles reached an extremely slow decay phase, in which molecular dissipation became the predominant factor. These three distinct sections of the energy index profile corresponded to three altitude bands, each exhibiting different patterns of temperature standard deviation with altitude.
According to the observations presented in
Figure 2, the upper boundary of the turbopause layer was defined at the altitude where molecular dissipation was fully dominant, marking the height where its influence became significantly pronounced. The lower boundary of the turbopause layer was set at the altitude where the inhibition of atmospheric wave activity by turbulence began to diminish. The turbopause was located in the turbopause layer, and its position was represented by the average of the upper and lower boundary positions. The thickness of the turbopause layer was the difference between the lower boundary and the upper boundary. Based on the vertical variation of the energy index C, the slope of which could be calculated, we differentiated the energy index by a central difference of 3 km to find the slope of the profile, as shown in
Figure 2. This calculation enabled a detailed inspection of how the energy index evolved with altitude.
Each slope profile had similar characteristics. Initially, there was a rapid decay in the slope value until it reached a minimum point. Following this sharp decline, the slope began to increase again with altitude. Eventually, the slope stabilized, approaching a value close to zero at higher altitudes. The height at which the slope value started to be relatively stable and small was the height of the upper boundary of the turbopause layer.
The variation of the energy index with height within the range of 50 to 80 km could be classified into two distinct categories. The first type of energy index profile was smaller at 50 km, and there was a clear inflection point in the change with height, which may have been caused by the filtering of fluctuations by the summer wind. The second type of energy index profile was larger at 50 km, and there was no obvious inflection point in the altitude change. The annual average value of the energy index at 50 km was utilized to differentiate between these two profiles quantitatively. As shown in
Figure 2, the average energy index at 50 km in 2009 was
. The energy index profile on 21 March and 21 June was the first type of profile, and the profile on September 21st and December 21st was the second type of profile. Due to the inherent differences in characteristics between these profile types, it followed that the methodologies employed to determine the height of the lower boundary of the turbopause layer also had to vary accordingly.
For the first type of energy index profile, the presence of an inflection point with the energy index slope greater than 0 in the 50–60 km altitude band was a sign of this type of profile. This inflection point was interpreted as the altitude where atmospheric waves began to break up in significant quantities, due to wind filtration, indicating the onset of turbulence and energy dissipation processes.
In the context of the second type of energy index profile, the energy index exhibited a rapid decay, indicating a significant reduction in the energy available for atmospheric wave activity. This phenomenon was mainly related to turbulent activity, and the weakening of the inhibition effect of turbulence on atmospheric wave activity was mainly caused by the weakening of turbulence activity. Below 70 km, the atmosphere is generally regarded as being uniformly mixed [
2]. This uniformity suggests higher levels of turbulent activity, as turbulent mixing tends to enhance the dispersal and dissipation of wave energy, so we needed to focus our analysis above 70 km. Since the characteristics are not obvious, we consider the lower boundary of the turbopause layer to be the location where the energy index began to be less than or equal to 1/e of the maximum energy index above 70 km.
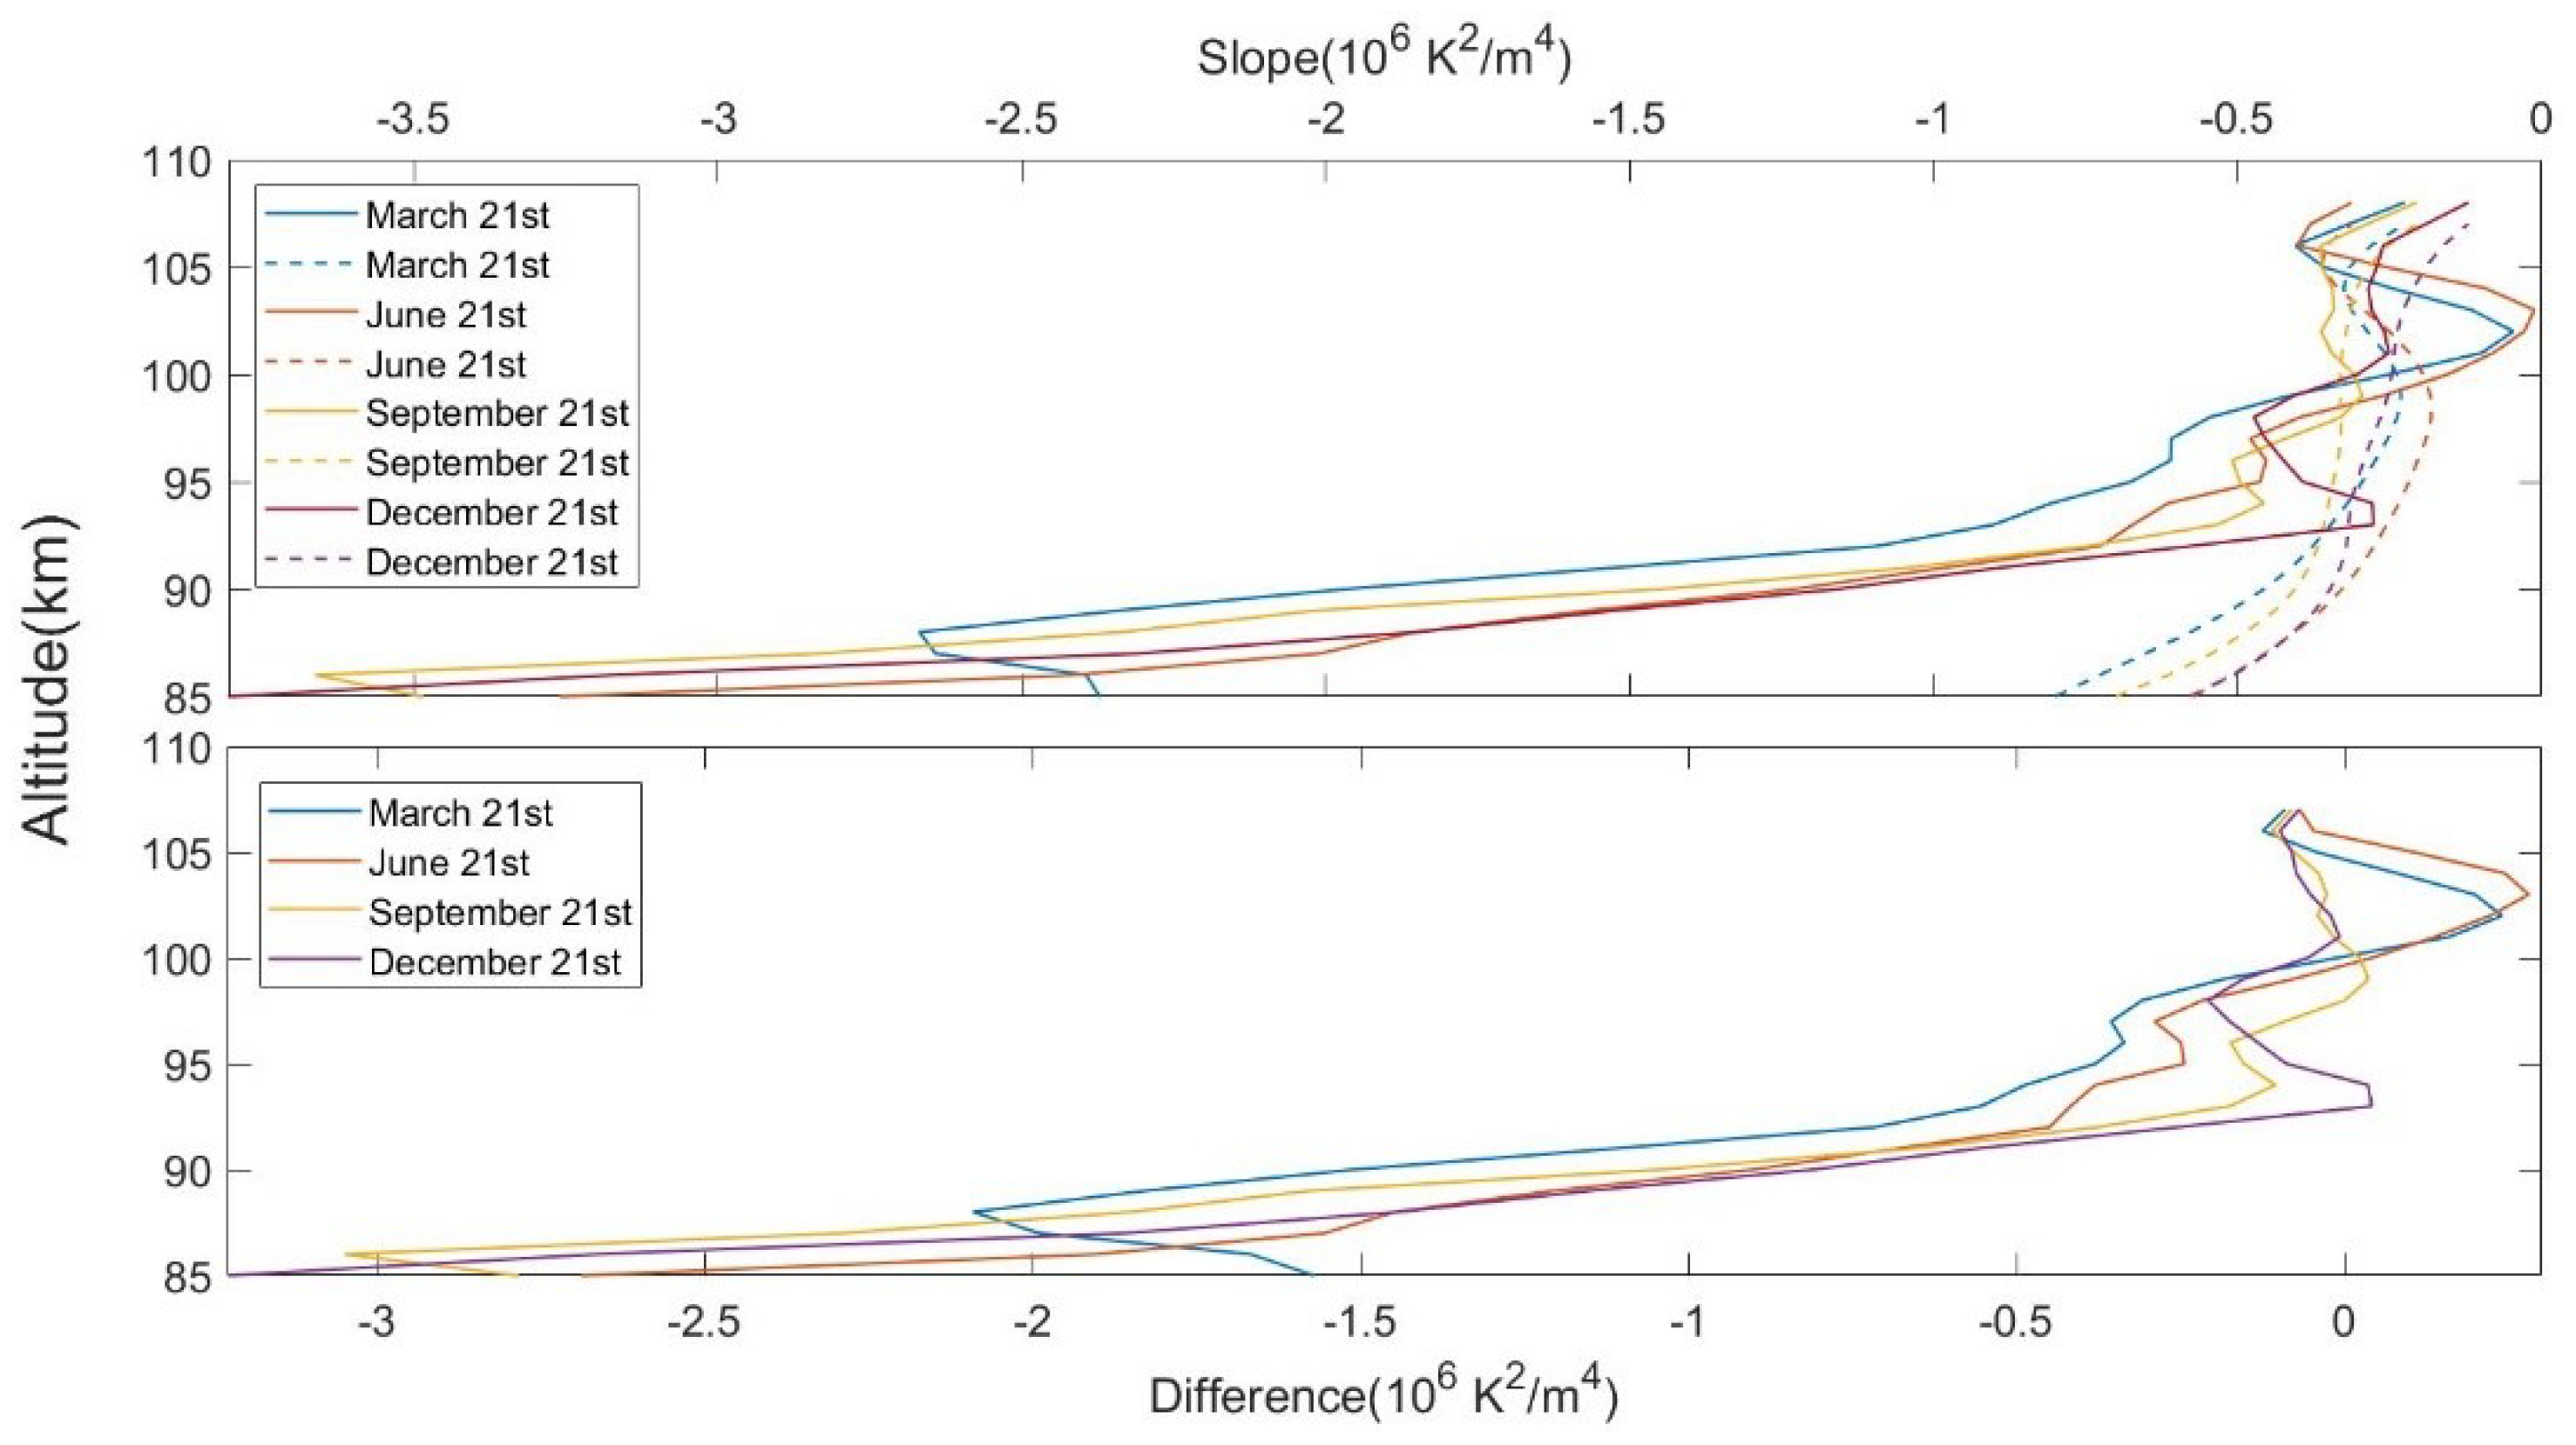
The upper boundary of the turbopause layer was the height at which the slope of the energy index began to maintain a small value. As illustrated in
Figure 2, there was only a minor difference between the values of various energy indices around 90 km, but the slope value showed a downward trend in general. After reaching a certain height, the slope began to exhibit oscillatory behavior with height. To pinpoint the altitude at which this oscillation initiated, a linearly fitted slope profile was constructed that extended from various heights to the highest point of the energy index profile. This fitted profile is depicted as a dashed line in
Figure 3. The following figure in
Figure 3 shows how the difference between the two slope profiles obtained by different methods changed with height. The analysis revealed that the difference between the two slope profiles initially decreased with increasing height. However, as height continued to increase, this difference began to oscillate, displaying fluctuations around 0. The height at which the difference began to change from negative to positive was the height of the upper boundary of the turbopause layer.
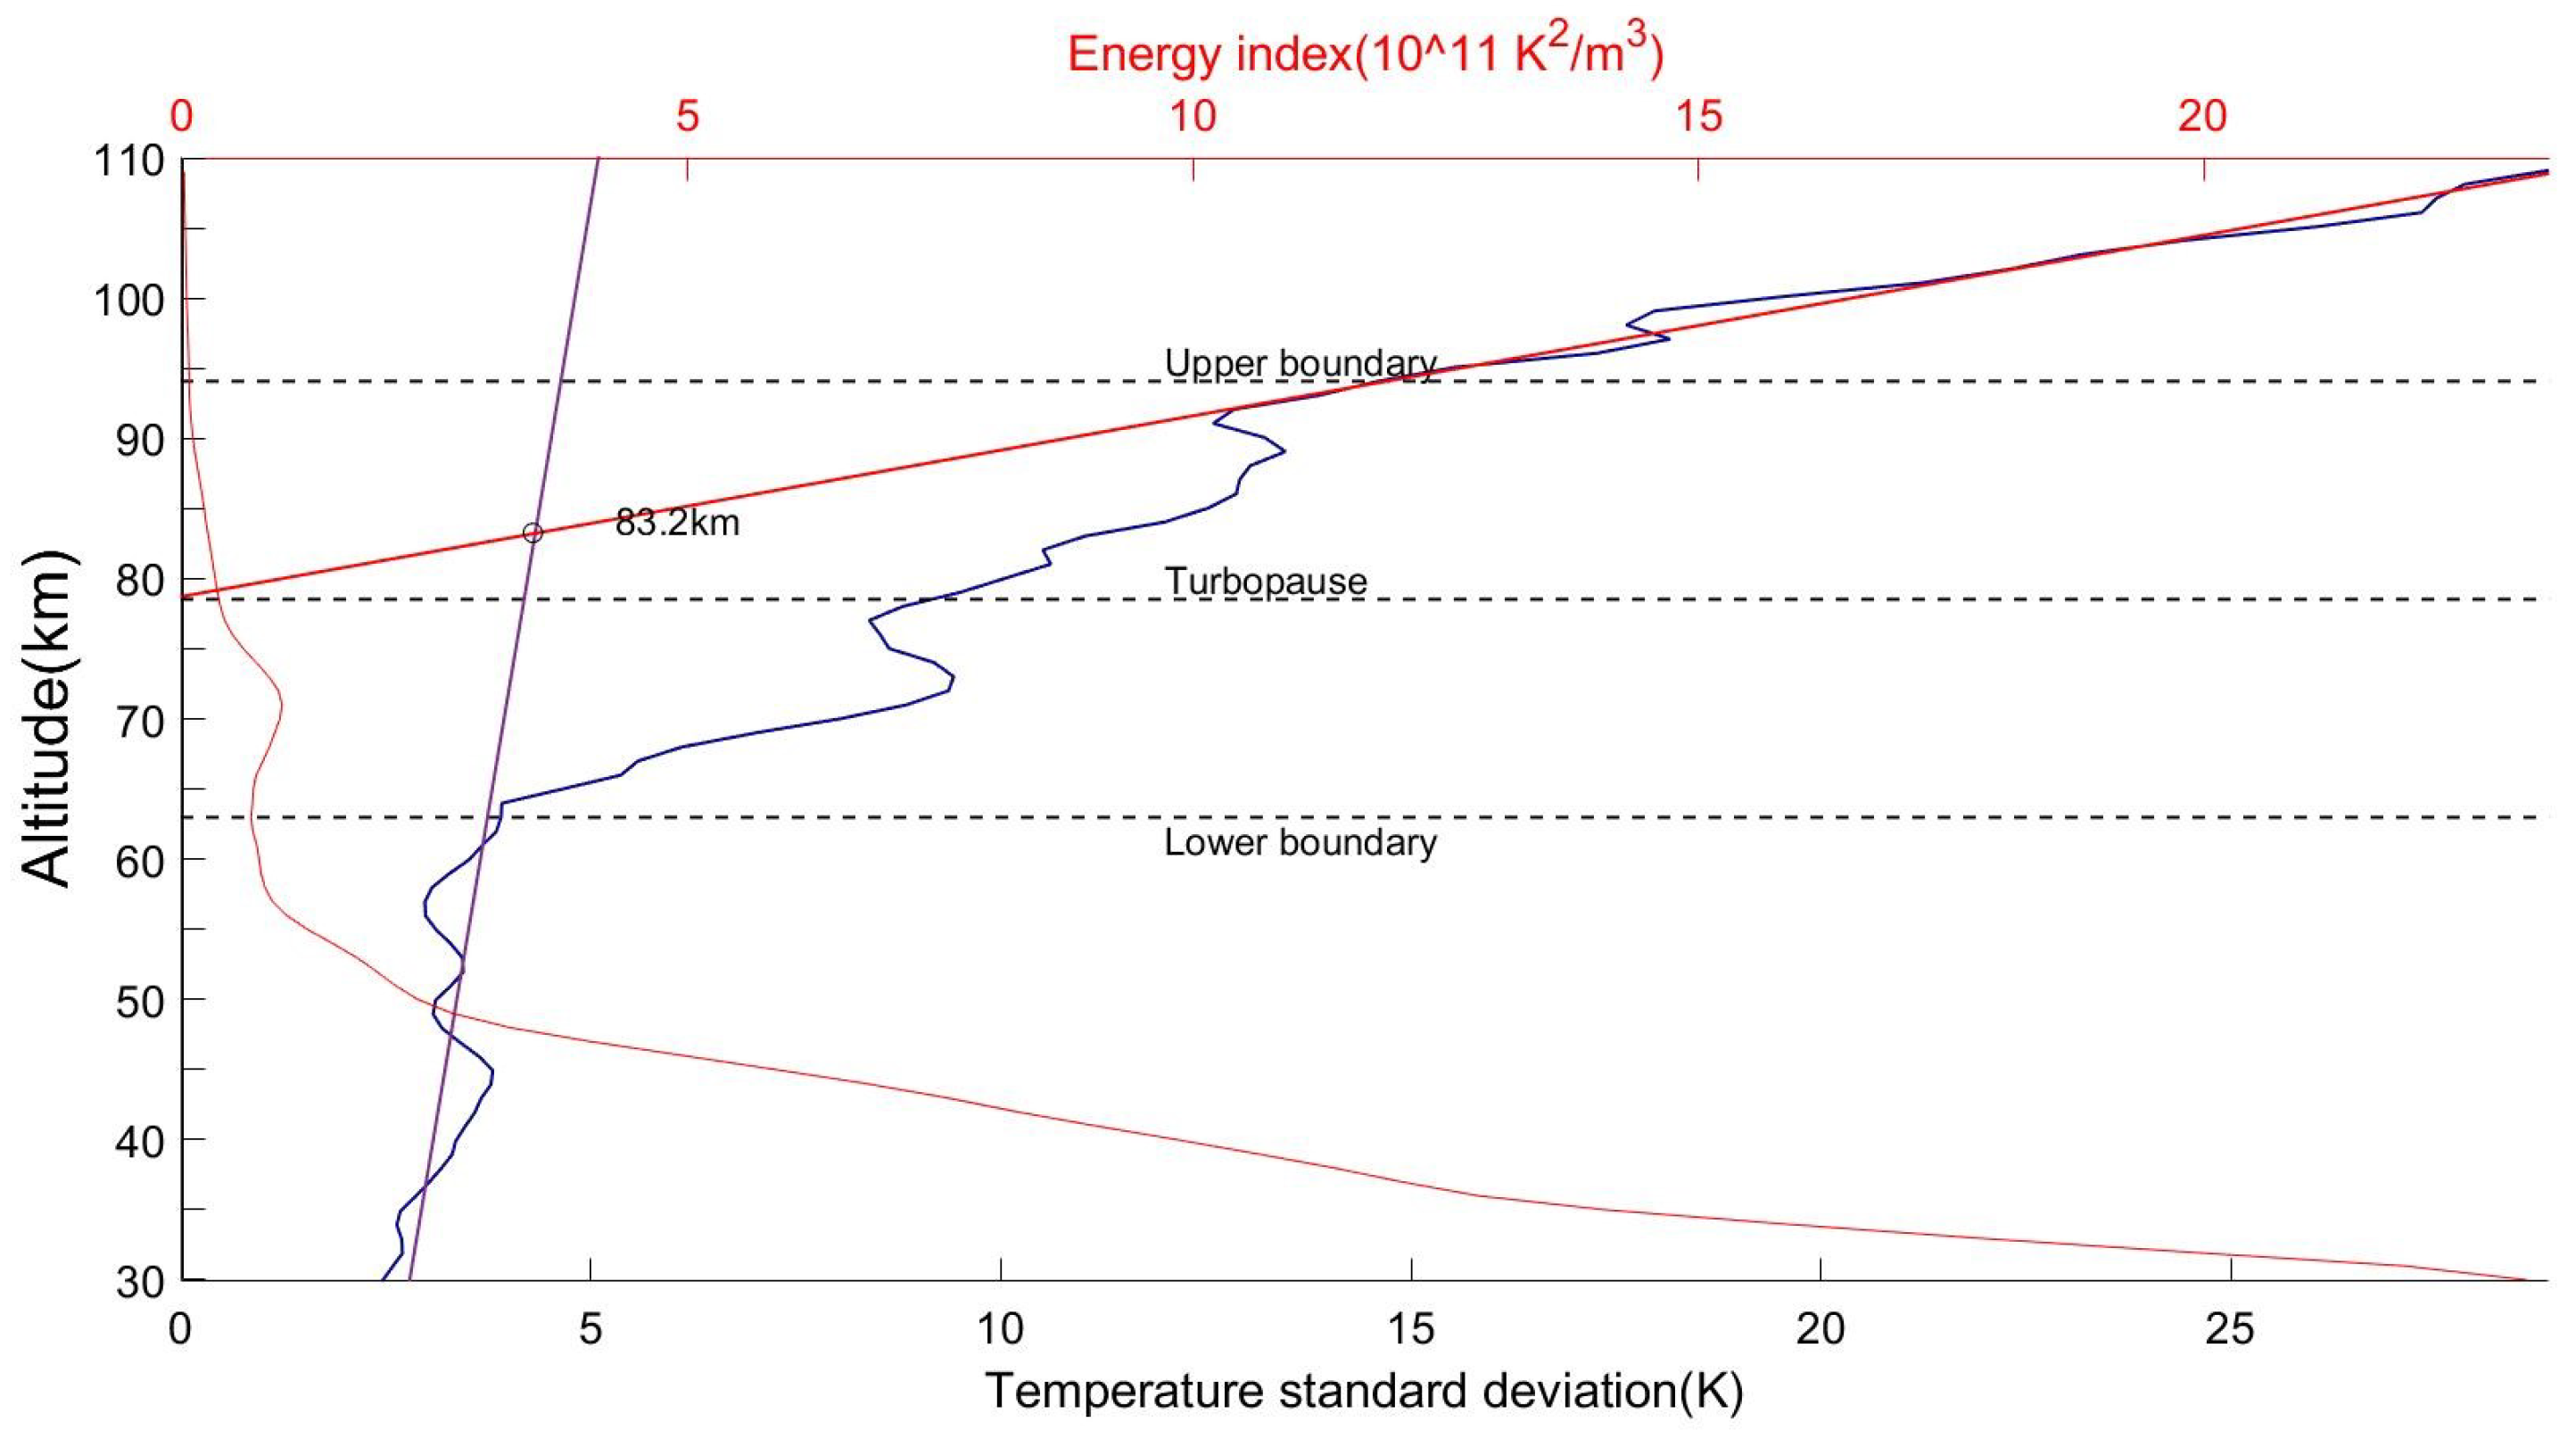
Figure 4 illustrates the variation of temperature standard deviation and the energy index with height, providing a comparative analysis of the two methods applied in our study. There is a very clear correspondence between the two profiles, suggesting the three different regions of variation of the energy index and the temperature standard deviation corresponded to each other. The region of the energy index profile that experienced a rapid decline corresponded to the lower portion of the temperature standard deviation profile, where the values increased linearly with height. The segment of the temperature standard deviation profile that marked the transition between the upper and lower boundaries of the turbopause was reflected in the energy index profile. The slow decreasing region of the energy index profile corresponded to the rapid increase observed at the upper portion of the temperature standard deviation profile.
A comparison between the traditional method and the new method for determining the turbopause reveals several key insights. Notably, the turbopause identified by the traditional method fell within the turbopause layer delineated by the new method. Above the upper boundary of this turbopause layer, the temperature standard deviation exhibited a relatively smooth variation with height, reflecting a more stable atmospheric profile. This observation emphasizes the significance of understanding the turbopause as a part of the transition zone. The traditional method primarily relies on linear wave theory, which provides valuable insight but may lack a description of the transition region. In contrast, the new method introduces a perspective based on energy conservation, which improves the traditional method by integrating variations in different profiles. Compared to traditional methods, the new method avoids relying on manual selection of segmentation regions for fitting.
By calculating a set of parameters, the new method expands the conventional view of the ‘turbopause’ to ‘turbopause layer’. This includes determining the upper and lower boundaries, the thickness of the turbopause layer, and the specific height of the turbopause itself. Importantly, this set of parameters aligns more closely with the intrinsic characteristics of the turbopause layer as a transitional region. It is also noteworthy that the turbopause height identified by the new method is computed as the average of the upper and lower boundaries. However, due to the exponential decrease in atmospheric density with height, the actual height of the turbopause is likely to be closer to the height of the upper boundary of the turbopause layer.

