Article

Correcting Atmospheric Temperature and Vapor Density Profiles of Ground-Based Microwave Radiometer in Diverse Skies by Regression Model and Artificial Neural Network Methods

by
Guirong Xu
1,2,*,
Yonglan Tang
1,
Aning Gou
3,4,
Yiqin Wang
4,
Weifa Yang
4 and
Jing Yan
5
1
China Meteorological Administration Basin Heavy Rainfall Key Laboratory & Hubei Key Laboratory for Heavy Rain Monitoring and Warning Research, Institute of Heavy Rain, China Meteorological Administration, Wuhan 430205, China
2
Key Laboratory of Urban Meteorology, China Meteorological Administration, Beijing 100089, China
3
Wuhan Central Meteorological Observatory, Wuhan 430074, China
4
Wuhan Meteorological Service, Wuhan 430040, China
5
Hubei Meteorological Information and Technology Support Center, Wuhan 430074, China
*
Author to whom correspondence should be addressed.
Remote Sens. 2025, 17(23), 3819; https://doi.org/10.3390/rs17233819
Submission received: 14 September 2025 / Revised: 7 November 2025 / Accepted: 21 November 2025 / Published: 25 November 2025
(This article belongs to the Special Issue Advances in Microwave Remote Sensing for Earth Observation (EO))

Highlights

What are the main findings?
  • Radiosonde temperature has a positive bias, while the humidity has a dry bias due to solar heating, and this leads to MWR temperature being colder and MWR vapor density being wetter than radiosondes in clear and cloudy skies. But, in rainy skies, the impact of raindrops results in a pseudo-high brightness temperature, which consequently leads to MWR temperature becoming warmer than radiosondes, while the wet MWR vapor density becomes more significant.
  • Both regression and ANN models can reduce the biases of MWR temperature and vapor density against radiosondes to around zero in diverse skies. Moreover, after correcting using a regression model, the RMSEs of MWR temperature (vapor density) in clear, cloudy, and rainy skies decline by 14% (7%), 7% (4%), and 12% (29%), respectively, and the correction effect of the ANN model is slightly better than the regression model, with corresponding decreases of 19% (8%), 10% (8%), and 12% (30%), respectively.
What is the implication of the main finding?
  • The deviation of MWR retrievals from radiosonde measurements is caused by various factors, many of which depend on atmospheric conditions, and this results in different characteristics of MWR retrieval deviation in diverse skies. Therefore, correcting MWR retrieval deviation may require different methods.
  • Regression and ANN models have a reasonable ability to correct MWR retrieval deviation in diverse skies. However, there is remaining room for further improvement in MWR retrieval accuracy, especially in rainy skies.

Abstract

A ground-based microwave radiometer (MWR) can retrieve temperature and vapor density profiles with a temporal resolution at the minute level, which is significant for studying atmospheric thermodynamic stratification and its evolution. Improving MWR retrieval accuracy is crucial for MWR application research. Based on 9-year observations of MWR and radiosonde in Wuhan, China, this study adopts regression model and artificial neural network (ANN) methods to correct MWR temperature and vapor density deviations against radiosondes in diverse skies. Due to the impacts of solar heating and raindrops, MWR temperature presents a cold bias from radiosondes in clear and cloudy skies, but a warm bias in rainy skies, while the MWR vapor density is generally wetter than radiosondes, especially in rainy skies. The validation results show that both regression and ANN models can reduce the biases of MWR temperature and vapor density against radiosondes to around zero in diverse skies, and the MWR vapor density RMSE in rainy skies shows a marked decrease. After correcting using the regression model, the RMSE of MWR temperature (vapor density) declines by 14% (7%), 7% (4%), and 12% (29%) in clear, cloudy, and rainy skies, respectively, and the correction effect of the ANN model is slightly better than the regression model, with corresponding decreases of 19% (8%), 10% (8%), and 12% (30%), respectively. However, the consistency of MWR retrievals with radiosondes is rarely improved after the corrections of regression and ANN models. These results indicate that the regression and ANN models have a reasonable ability to correct MWR retrieval deviation in diverse skies, and there is remaining room for further improvement in MWR retrieval accuracy.

1. Introduction

Atmospheric temperature and humidity profiles characterize the thermodynamic state of the atmosphere and are significant for meteorology and atmospheric studies [1,2,3,4]. Radiosondes have been the operational instruments for measuring atmospheric temperature and humidity profiles for more than six decades and play crucial role in climate research [5,6]. As a direct measurement in situ, radiosonde observations are also widely used as the reference for validating atmospheric profiles of remote sensing [7,8,9]. However, radiosondes are generally launched twice (00 and 12 UTC) per day during operation; even during intensive sounding observations, the temporal interval of radiosondes can only research 3 h [10], which still cannot satisfy the studies of mesoscale weather phenomena with life history within several hours.
A ground-based microwave radiometer (MWR) is a passive remote sensing instrument, which mostly receives atmospheric radiation originating from water vapor, oxygen, and cloud droplets in the frequency of 20–60 GHz. Because atmospheric radiation is closely related to atmospheric temperature, humidity, and hydrometeors, MWR can adopt pretrained neural networks to retrieve atmospheric profiles of temperature, humidity, and cloud liquid water content (LWC), as well as integrated water vapor (IWV) and liquid water paths (LWPs) [11,12]. These profiles have a compatible accuracy with most meteorological applications, especially in the atmospheric boundary layer [13,14]. Due to the advantages of all-weather observation and minute-level temporal resolution, MWR compensates for the insufficiency of the coarse temporal resolution of radiosondes, and it is useful for the detection of mesoscale phenomena that requires very high spatial and temporal scales [15,16,17,18], with stronger application demand in the plateau regions [19,20,21].
However, as a remote sensing instrument, MWR-derived atmospheric profiles differ from radiosonde observations, and the differences depend on sky conditions [22,23,24,25]. The MWR retrieval deviation against radiosondes in clear and cloudy skies is likely related to the impact of solar heating on the detection of temperature and humidity by radiosondes, and the radiosonde drift may also make a partial contribution [23]. The degraded accuracy of MWR retrievals during precipitation is due to the impact of raindrops, since the scattering and emission effects of raindrops currently are not included in the MWR retrieval method [26,27]. In addition, when a water film forms on the radome of an MWR, it can lead to a pseudo-high brightness temperature and a saturated signal-to-noise ratio, which are responsible for the large discrepancy between MWR retrievals and radiosonde observations [28]. To reduce the impact of precipitation on MWR retrieval accuracy, the off-zenith observation of MWR is adopted to retrieve atmospheric profiles. The experimental results indicate that, compared to zenith observation, off-zenith observation can improve MWR retrieval accuracy during precipitation, especially in the lower atmosphere [26,29]. This is because the pseudo-high brightness temperature that occurs in zenith observation is weakened in off-zenith observation, and the signal-to-noise ratio is not prone to saturation [28].
Although off-zenith observation can improve MWR retrieval accuracy in precipitation skies, most MWRs currently just operate in zenith observation. Therefore, how to improve the accuracy of MWR retrievals in zenith observations, especially in precipitation skies, is still a critical issue. A common way of solving this issue is to correct MWR brightness temperature or retrievals with radiosonde observations. Li et al. [30,31] suggest a way to correct MWR brightness temperature in clear and cloudy skies and then use the corrected brightness temperature to invert the MWR temperature and vapor density profiles, with a better accuracy than that before correction. Zhao et al. [32] divide the troposphere into bottom, middle, and upper layers based on the physical principle of cloud generation and then train the corresponding three networks using the same input and different output samples. With the layered method, the root mean square errors of MWR temperature and vapor density are reduced by 25.6% and 26.2% at the altitude above 6 km, respectively. In addition, Zhao et al. [33] propose a numerical correction algorithm based on the weighting functions of different frequencies to improve the MWR temperature profile in clear and cloudy skies, and the root mean square error and mean absolute error of MWR temperature are reduced by 12.5% and 17.9%, respectively. However, these researchers just focus on studies in clear and cloudy skies, and the studies in rainy skies are rarely reported. This is because, on the one hand, the impact of precipitation on MWR retrieval is complex, and on the other hand it is not easy to obtain available samples for the study of rainy skies, which needs a long collection time for MWR observations.
This paper uses 9-year observations to assess the accuracies of MWR retrievals corrected directly by radiosonde soundings with regression model and artificial neural network (ANN) methods, aiming to explore the correcting effects of the linear and nonlinear methods on MWR retrieval deviation in diverse skies, and especially in rainy skies, in order to obtain hints for improving MWR retrieval accuracy. Section 2 introduces the materials and methods used in this study. The deviation of MWR retrievals in diverse skies is analyzed in Section 3, and the improvement of MWR retrievals corrected directly by the regression model and ANN methods is also assessed in this section. A discussion follows in Section 4, and the conclusions are drawn in Section 5.

2. Materials and Methods

The data used in this study include the observations of an MWR, radiosonde, and automatic weather station in Wuhan (114.1°E, 30.6°N, 23 m ASL), China, from June 2010 to October 2019. The MWR is a MP-3000A unit manufactured by the American Radiometrics Corporation (Boulder, CO, USA) [17]. It receives atmospheric radiation at 21 K-band (22–30 GHz) and 14 V-band (51–59 GHz) microwave channels, observes atmospheric background temperature or cloud base temperature with a zenith-looking infrared thermometer (IRT, operating at 9.6–11.5 μm), and adopts temperature, humidity, and pressure sensors to measure surface meteorological parameters [11,14]. These observations are automatically input into pretrained neural networks to invert atmospheric temperature, vapor density, relative humidity, and LWC profiles; also, the IWV and LWP are inverted in the meantime. In total, 4 vector neural networks, including 26 inputs (8 K-band, 14 V-band microwave channels, an infrared channel, and 3 surface meteorological channels) and 49 hidden nodes, generate 58 output nodes (temperature, vapor density, relative humidity, and LWC retrieval heights). Scalar neural networks use the same input and hidden nodes to generate IWV and LWP outputs [14]. This iteration process will be stopped when the neural network training change is less than 0.1%. Five years of historical Wuhan radiosonde soundings are used to train the neural networks for characterizing states of the atmosphere in the region [23,26]. The atmospheric profiles are output at 58 height levels, with 50 m intervals from the surface to 500 m, 100 m intervals from 500 m to 2 km, and 250 m intervals from 2 km to 10 km, and the temporal resolution is ~3 min. The cloud base height (CBH) is set to the lowest height where the cloud base temperature from IRT is equal to the MWR-retrieved temperature profile [11]. A clear sky can be distinguished from a cloudy sky by the IRT because the atmospheric background temperature is lower than the cloud base temperature. A CBH value equal to −1 indicates no CBH (i.e., clear sky), a CBH equal to 0 means precipitation conditions, and a CBH greater than 0 denotes a cloudy sky. A rain sensor equipped with the MWR is used to provide a “Rain Flag”, which senses whether any liquid water covers the radome during heavy rain events. A Rain Flag of zero (Rain = 0) represents non-precipitating conditions, and a value of one (Rain = 1) represents precipitating conditions. Radiosondes launched twice daily (00 and 12 UTC) at Wuhan are L-band radio sounding systems, which can measure atmospheric pressure, temperature, relative humidity, and wind profiles at 1 s temporal resolution [23].
This study focuses on the accuracies of MWR temperature and vapor density. The radiosonde profiles are used for the evaluation and correction of MWR temperature and vapor density profiles. Since the radiosondes are launched twice, at 00 and 12 UTC each day, and the MWR profiles are retrieved at about 3 min intervals, only the MWR retrievals closest in time to 00 and 12 UTC are used for coupling with radiosonde profiles. Moreover, according to the Rain Flag values and CBHs of MWR, sky conditions are divided into clear (Rain = 0 and CBH = −1), cloudy (Rain = 0 and CBH > 0), and rainy (Rain = 1) skies. Through this classification method, all coupled profiles are categorized into three datasets, and finally there are 1070, 2930, and 416 coupled profiles available in clear, cloudy, and rainy skies, respectively. Additionally, the hourly precipitation data of the automatic weather station are used to assess the correlation of MWR retrieval deviation with the past 1 h precipitation.
The correlation coefficient (R), mean bias (Bias), and root mean square error (RMSE) between the coupled radiosonde and MWR profiles are adopted as metrics to evaluate MWR retrieval deviation in diverse skies, and the improvements of MWR retrieval corrected by the regression model and ANN methods are also conducted in the same way. In this study, MWR temperature and vapor density are corrected directly using the regression model and ANN methods with radiosonde observation at each MWR profile height, respectively, i.e., 58 height levels for the MP-3000A unit.
In the regression model method, MWR retrievals are used as input variables, while radiosonde soundings are used as output variables, and the correction regression model is built up as the following equation:
Y ( n ) i = a i + b i × X ( n ) i
where X is MWR retrieval (i.e., temperature or vapor density) and Y is the corresponding radiosonde observation, n is the coupled profile samples (i.e., 1070, 2930, and 416 for clear, cloudy, and rainy skies, respectively), a and b are constant coefficients, and i indicates the ith height level of the MWR profile, which varies from 1 to 58 in this study.
Studies show that a higher rainfall rate likely leads to a larger deviation of the MWR temperature profile from the numerical model output [29], and a larger LWP tends to cause a higher rainfall rate [17]. Therefore, to assess the impact of LWP on the correction of MWR retrievals using the regression model, a comparative regression model is built up as follows by adding the LWP observation of MWR into the input variables of Equation (1) in cloudy and rainy skies:
Y ( n ) i = a i + b i × X ( n ) i + c i × L W P ( n )
where c is a constant coefficient, like a and b.
In the ANN method, as in the study of Zhao et al. [32], a BP neural network is adopted to train the nonlinear correction model of MWR retrievals with radiosonde observations in clear, cloudy, and rainy skies, respectively. It is built up according to the following equation:
Y ( n ) i = F ( W i   ·   X ( n ) i + B i )
where X, Y, n, and i are the same as in Equation (1), while W is the weight matrix, B is the bias threshold, and F is the nonlinear transfer function (i.e., training function). In this study, the ANN model is implemented using MATLAB (Version 7.11.0.584 (R2010b)) software from MathWorks Inc. In the training setups, the Levenberg–Marquardt method is utilized as a training function, and the number of nodes and the max epoch are set to 3 and 100, respectively. This neural network is trained separately on each MWR profile height and is only used to correct the MWR retrievals of that height.
Also, to assess the impact of LWP on the correction of MWR retrievals using the ANN method, a comparative neural network is built up as follows by adding the LWP observation of MWR into the input variables of Equation (3) in cloudy and rainy skies:
Y ( n ) i = F ( W i   ·   [ X ( n ) i L W P ( n ) ] + B i )
All the training setups are the same as in Equation (3).
For each dataset in clear, cloudy, and rainy skies, the MWR temperature and vapor density profiles are evaluated and corrected separately. For the correction process using Equations (1)–(4), 80% of each dataset is used to build up the regression model and ANN model, and the remaining 20% of each dataset is used to validate the correction effects of the above models. Figure 1 shows the data regroup scheme; for each dataset, the data are firstly arranged in chronological order, and then every five data are grouped together, and the final data of less than five are also grouped. In each group data, the first four data are selected as training data, with the fifth data selected as testing data for validation. This processing can make the training data and testing data have similar temporal variation features, which can reasonably validate the performance of the training model. After this processing, the coupled profile samples for training in clear, cloudy, and rainy skies are 856, 2344, and 333, respectively, and those for testing are 214, 586, and 83.

3. Results

3.1. Deviations of MWR Temperature and Vapor Density in Diverse Skies

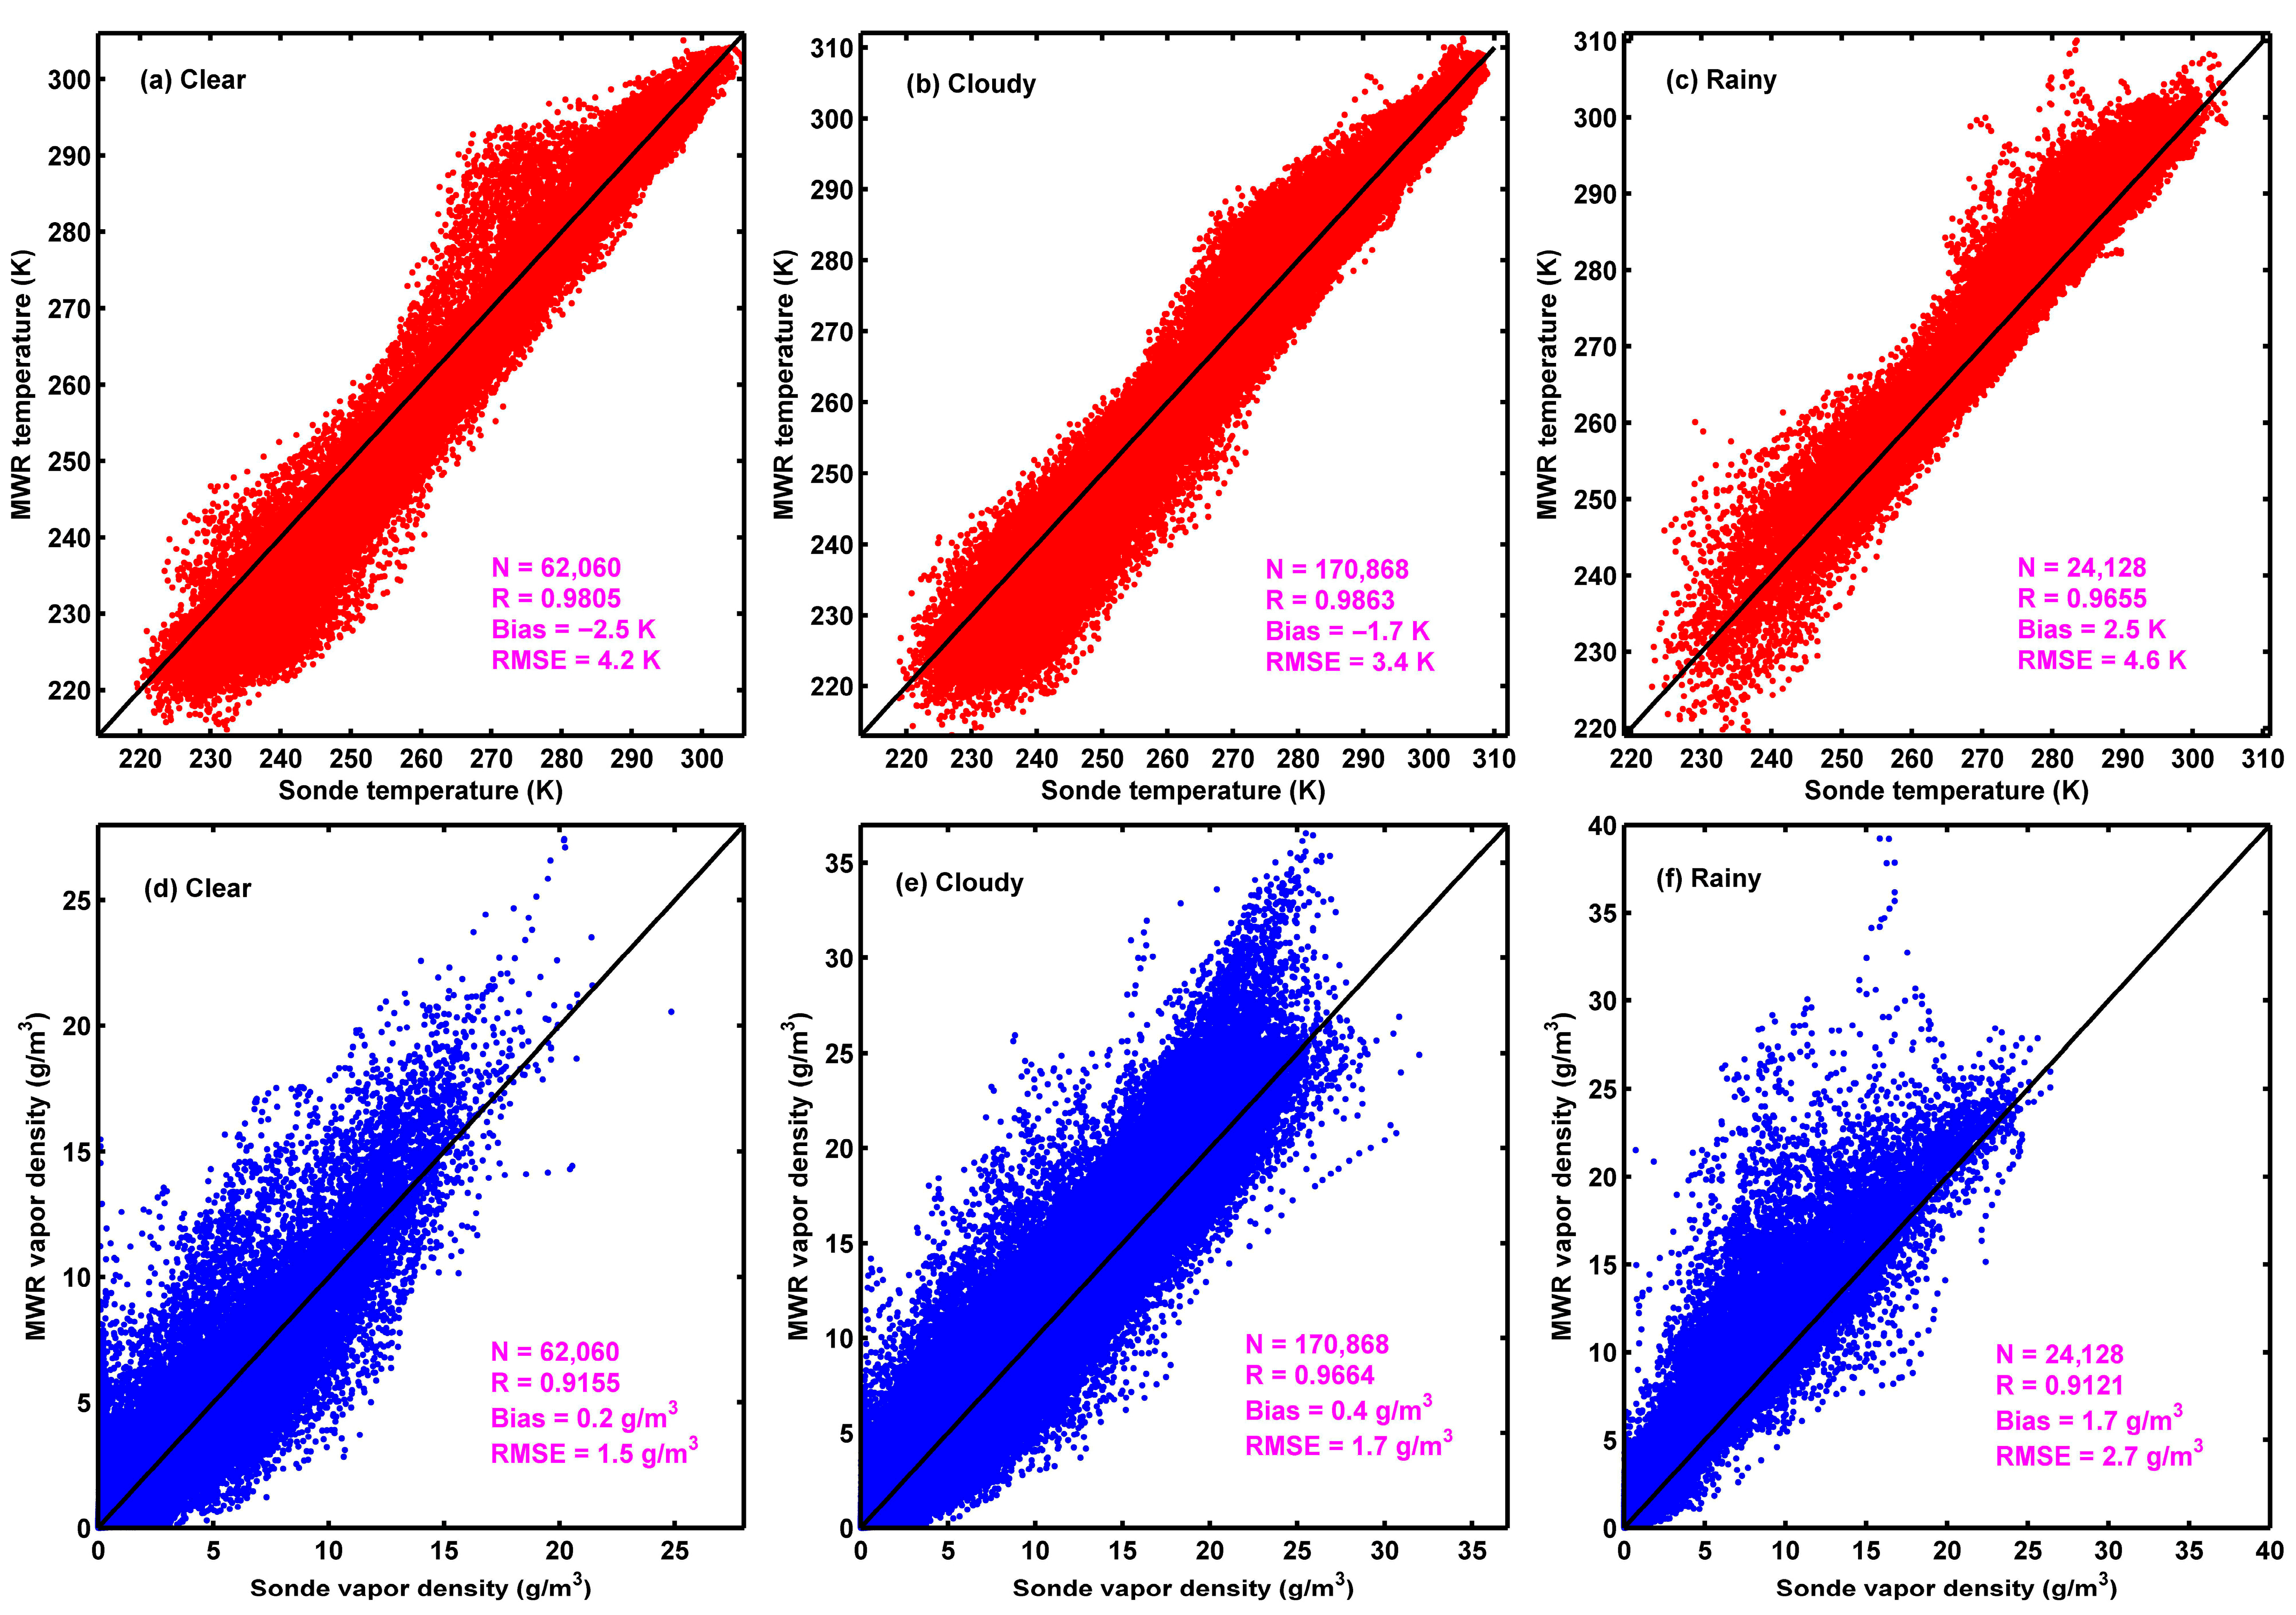
Taking radiosonde soundings as the standard values, the deviations of the MWR temperature and vapor density at 58 height levels are analyzed in diverse skies. On the whole, the MWR temperature presents a good consistency with radiosonde observation, with the correlation coefficient R > 0.96 in all sky conditions (Figure 2a–c). Against radiosonde observation, the MWR temperature has a cold bias of −2.5 K in clear skies, and in cloudy skies the cold bias is weakened to −1.7 K, while in rainy skies the MWR temperature has a warm bias of 2.5 K. For the MWR temperature RMSE, it is highest at 4.6 K in rainy skies, followed by 4.2 K in clear skies, and the smallest at 3.4 K in cloudy skies. The MWR vapor density also presents a good consistency with radiosonde observations, with R > 0.91 in all skies (Figure 2d–f). Compared to radiosonde observation, MWR vapor density has the smallest bias of 0.2 g/m3 in clear skies, which slightly increases to 0.4 g/m3 in cloudy skies and becomes the largest at 1.7 g/m3 in rainy skies. The MWR vapor density RMSE is in the same situation, with values of 1.5, 1.7, and 2.7 g/m3 in clear, cloudy, and rainy skies, respectively. Studies indicate that the radiosonde humidity has a dry bias relative to a Cryogenic Frostpoint Hygrometer, while the temperature has a positive bias due to solar heating [34,35,36]. This leads to a cold bias for MWR temperature and a wet bias for MWR vapor density compared with radiosonde observations in clear skies. In a cloudy sky, the existing clouds likely weaken solar heating, while the radiation of cloud droplets may bring a positive increase in MWR radiation observations; thus, the cold bias of the MWR temperature is decayed, but the wet bias of the MWR vapor density presents a slight increase. When precipitation happens, solar heating is significantly weakened and the impact of precipitation dominates; the radiation of raindrops and a water film on the radome of MWR can lead to pseudo-high values for the MWR brightness temperature [28], which consequently results in a warm bias for the MWR temperature and a larger wet bias for the MWR vapor density compared with radiosonde observation. To further check the impact of solar heating, a comparison between MWR retrieval and radiosonde observation is conducted again with datasets for the daytime (00 UTC) and nighttime (12 TUC), respectively. It is found that, in clear skies, the cold bias of the MWR temperature is weakened from −2.9 K at daytime to −2.1 K at nighttime, and in cloudy skies it is weakened from −1.9 K to −1.5 K; for the MWR vapor density, the wet bias in clear skies decreases from 0.4 g/m3 at daytime to 0.1 g/m3 at nighttime, while that of cloudy skies decreases from 0.4 g/m3 to 0.3 g/m3. These results indicate that the cold bias of the MWR temperature and the wet bias of the MWR vapor density are more significant at daytime than at nighttime, confirming the influence of solar heating on the comparison between MWR and radiosonde observations. Obviously, due to the impact of solar heating and precipitation, the deviations of the MWR temperature and vapor density compared with radiosondes present differences in diverse sky conditions.
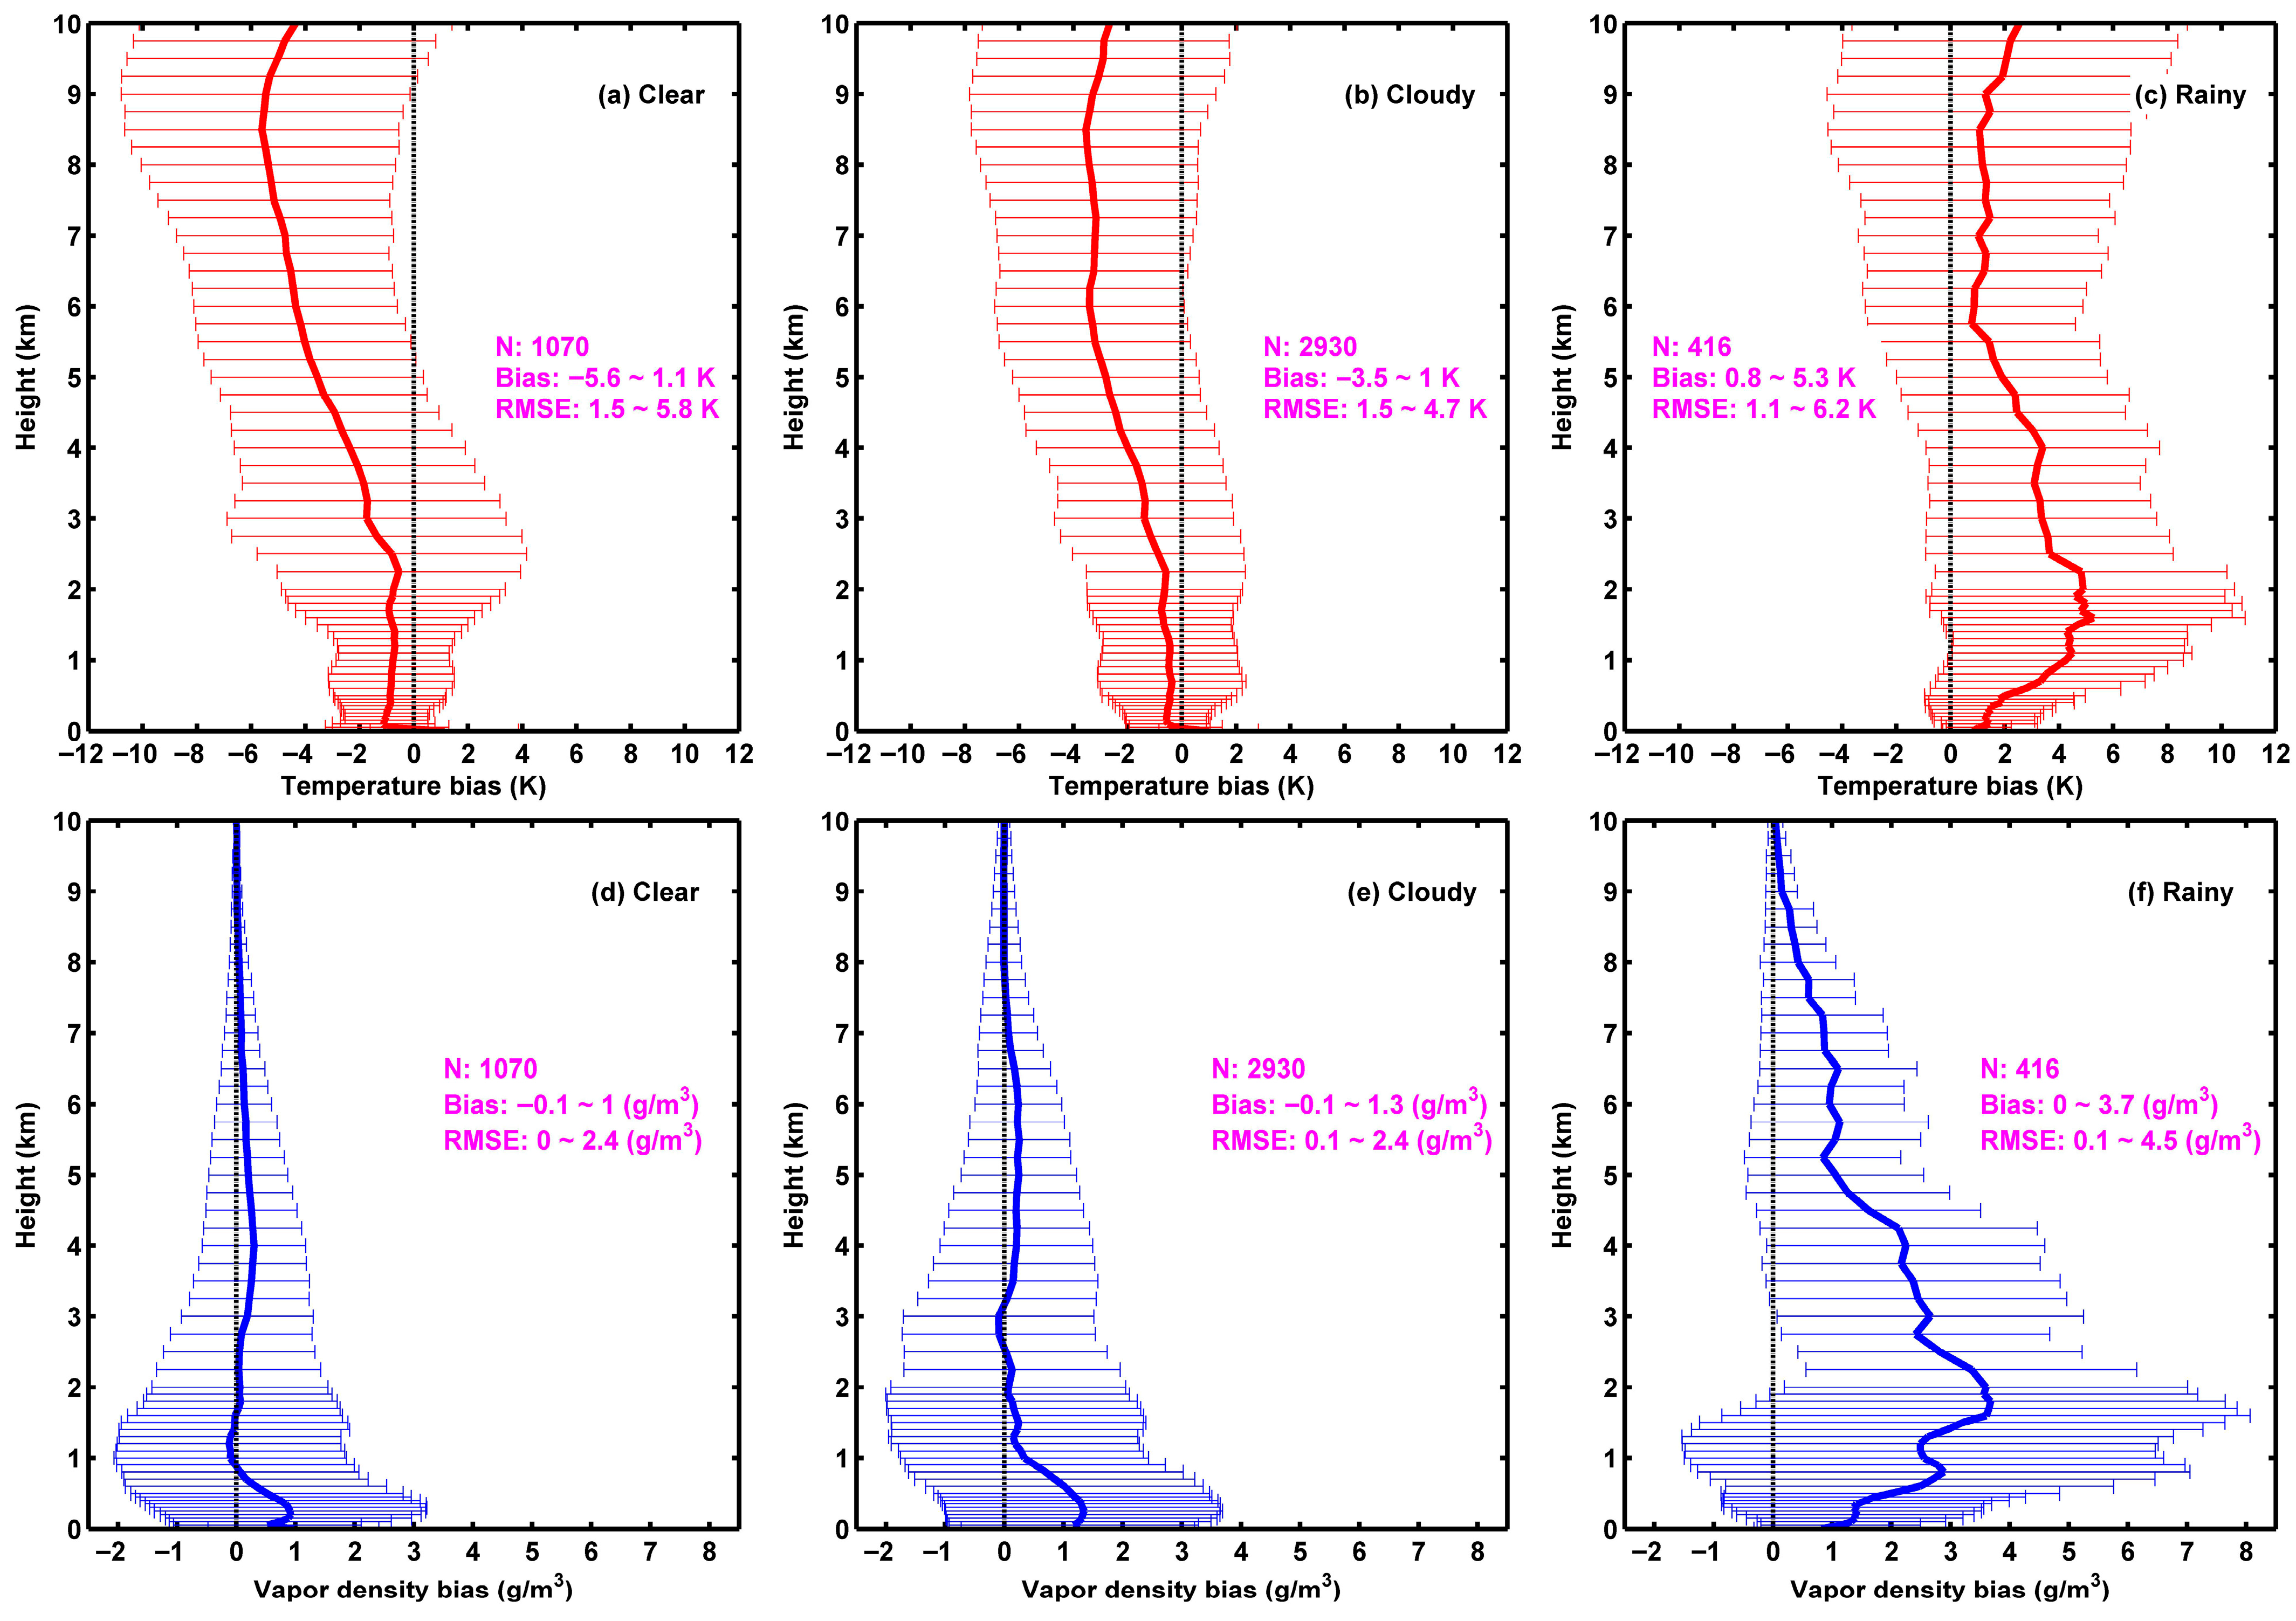
Figure 3 presents the deviations of the MWR temperature and vapor density from radiosonde observations at 58 profile heights in diverse skies. It can be seen that the MWR temperature has a cold bias at all height levels except the ground in clear skies, and the cold bias generally increases with height (Figure 3a). In addition, the MWR temperature bias becomes larger above 2 km; this is mainly because the 14 V-band (51–59 GHz) observations are input to the neural networks with more weighting functions at lower heights, which results in a finer vertical resolution of the MWR temperature at lower heights than at upper heights [23]. The situation in cloudy skies is the same, but the cold bias is relatively weakened (Figure 3b). However, in rainy skies, the MWR temperature presents a warm bias at all height levels, and the warm bias firstly increases with height and then decreases after reaching its maximum of 5.3 K at 1.6 km (Figure 3c). Additionally, the MWR temperature RMSE presents the largest range in rainy skies, followed by clear skies, and the smallest is in cloudy skies, indicating the impacts of precipitation and solar heating on MWR temperature accuracy. For the MWR vapor density, it presents a wet bias against radiosonde observations at most profile heights in clear skies. The wet bias first increases and then decreases with height in the boundary layer, and then, after decreasing to around 0 g/m3 at 1 km, it remains relatively stable with height (Figure 3d). It is the same situation in cloudy skies, but the wet bias below 1 km is slightly larger than that in clear skies (Figure 3e). In rainy skies, the MWR vapor density presents a wet bias at all profile heights, and the wet bias is larger than that in clear and cloudy skies (Figure 3f). Also, like the warm bias of the MWR temperature in rainy skies, the wet bias of the MWR vapor density firstly increases with height to its maximum of 3.7 g/m3 at 1.8 km, and then decreases with height to near 0 g/m3 at 10 km. Moreover, the variation range of the MWR vapor density RMSE is larger in rainy skies than that in clear and cloudy skies. These results indicate that the impact of solar heating and precipitation also cause differences in the vertical distribution of MWR temperature and vapor density deviations. Note that, at the ground level, the radiosonde temperature and humidity are calibrated using the observations inside the thermometer screen, which usually differ from the temperature and humidity observed using MWR, since the measurement environments of these two dataset are different, and this consequently results in the discrepancy between MWR and radiosonde observations at the ground level.
Foth et al. [29] indicated that a higher rainfall rate likely leads to larger deviations of MWR temperature from the numerical model output. Since the numerical model output is not the truth, this study analyzes the correlation between the past 1 h precipitation and MWR retrieval deviation from radiosonde observations. Considering that precipitation generates from clouds and a larger LWP tends to cause a higher rainfall rate [17], the correlation between LWP and MWR retrieval deviation from radiosonde observations is also assessed. As shown in Table 1, in rainy skies, the correlation coefficient (R) between the MWR temperature bias and the past 1 h precipitation (R1) is 0.2016, and that between the MWR vapor density bias and R1 is 0.3183, both the two Rs having confidence levels >99%. In particular, when R1 is replaced by LWP, the R between the MWR temperature (vapor density) bias and LWP increases to 0.4412 (0.4914), and their confidence levels are still significant. The MWR temperature RMSE does not present a correlation with R1, while the MWR vapor density has an R of 0.2910 with R1 at a significant confidence level. However, the RMSEs of MWR temperature and vapor density present a better correlation with LWP than R1; their Rs increase to 0.1910 and 0.3392, respectively, with both having confidence levels >99%. Even in cloudy skies, the MWR temperature (vapor density) bias still has an R of 0.2139 (0.2031) with LWP at a significant confidence level, which it does not have for MWR temperature and vapor density RMSEs. It can be concluded that the MWR temperature and vapor density biases have a correlation with rain rate, and the correlation with LWP is better. Therefore, the LWP is also taken as an input parameter of the correction model to assess its effect on improving MWR retrieval accuracy.

3.2. Correction of MWR Temperature and Vapor Density by Regression Model Method

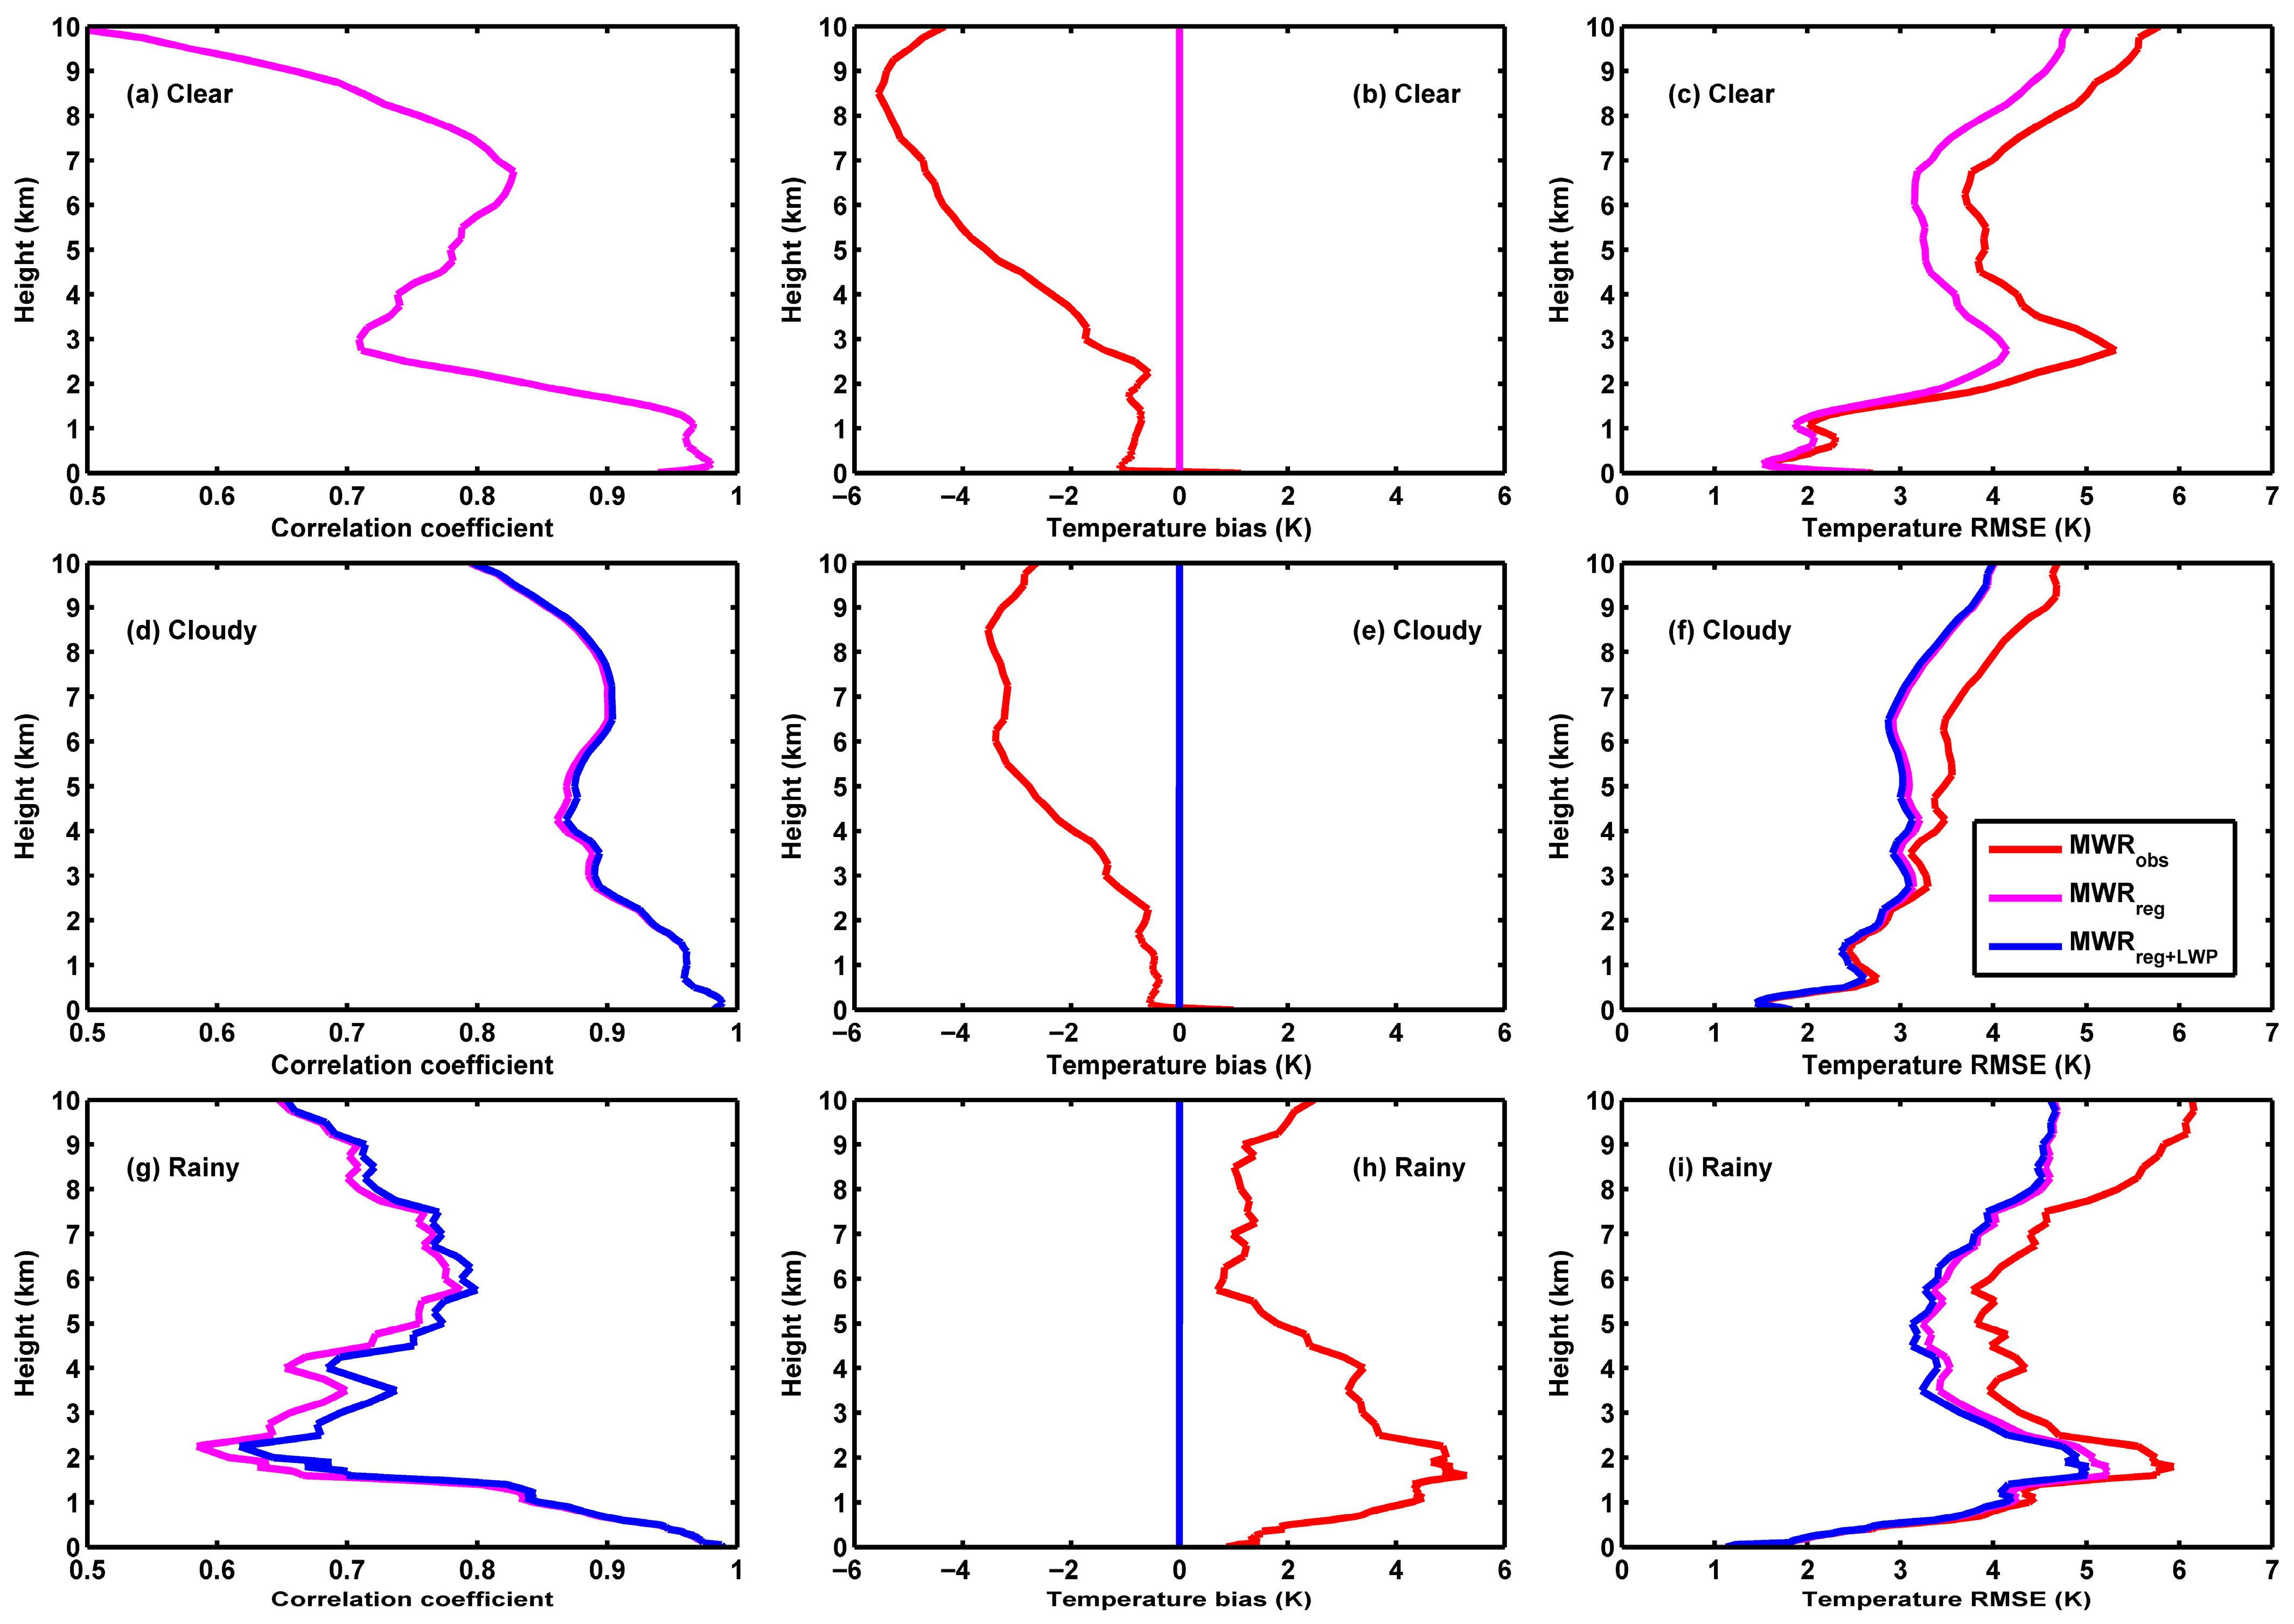
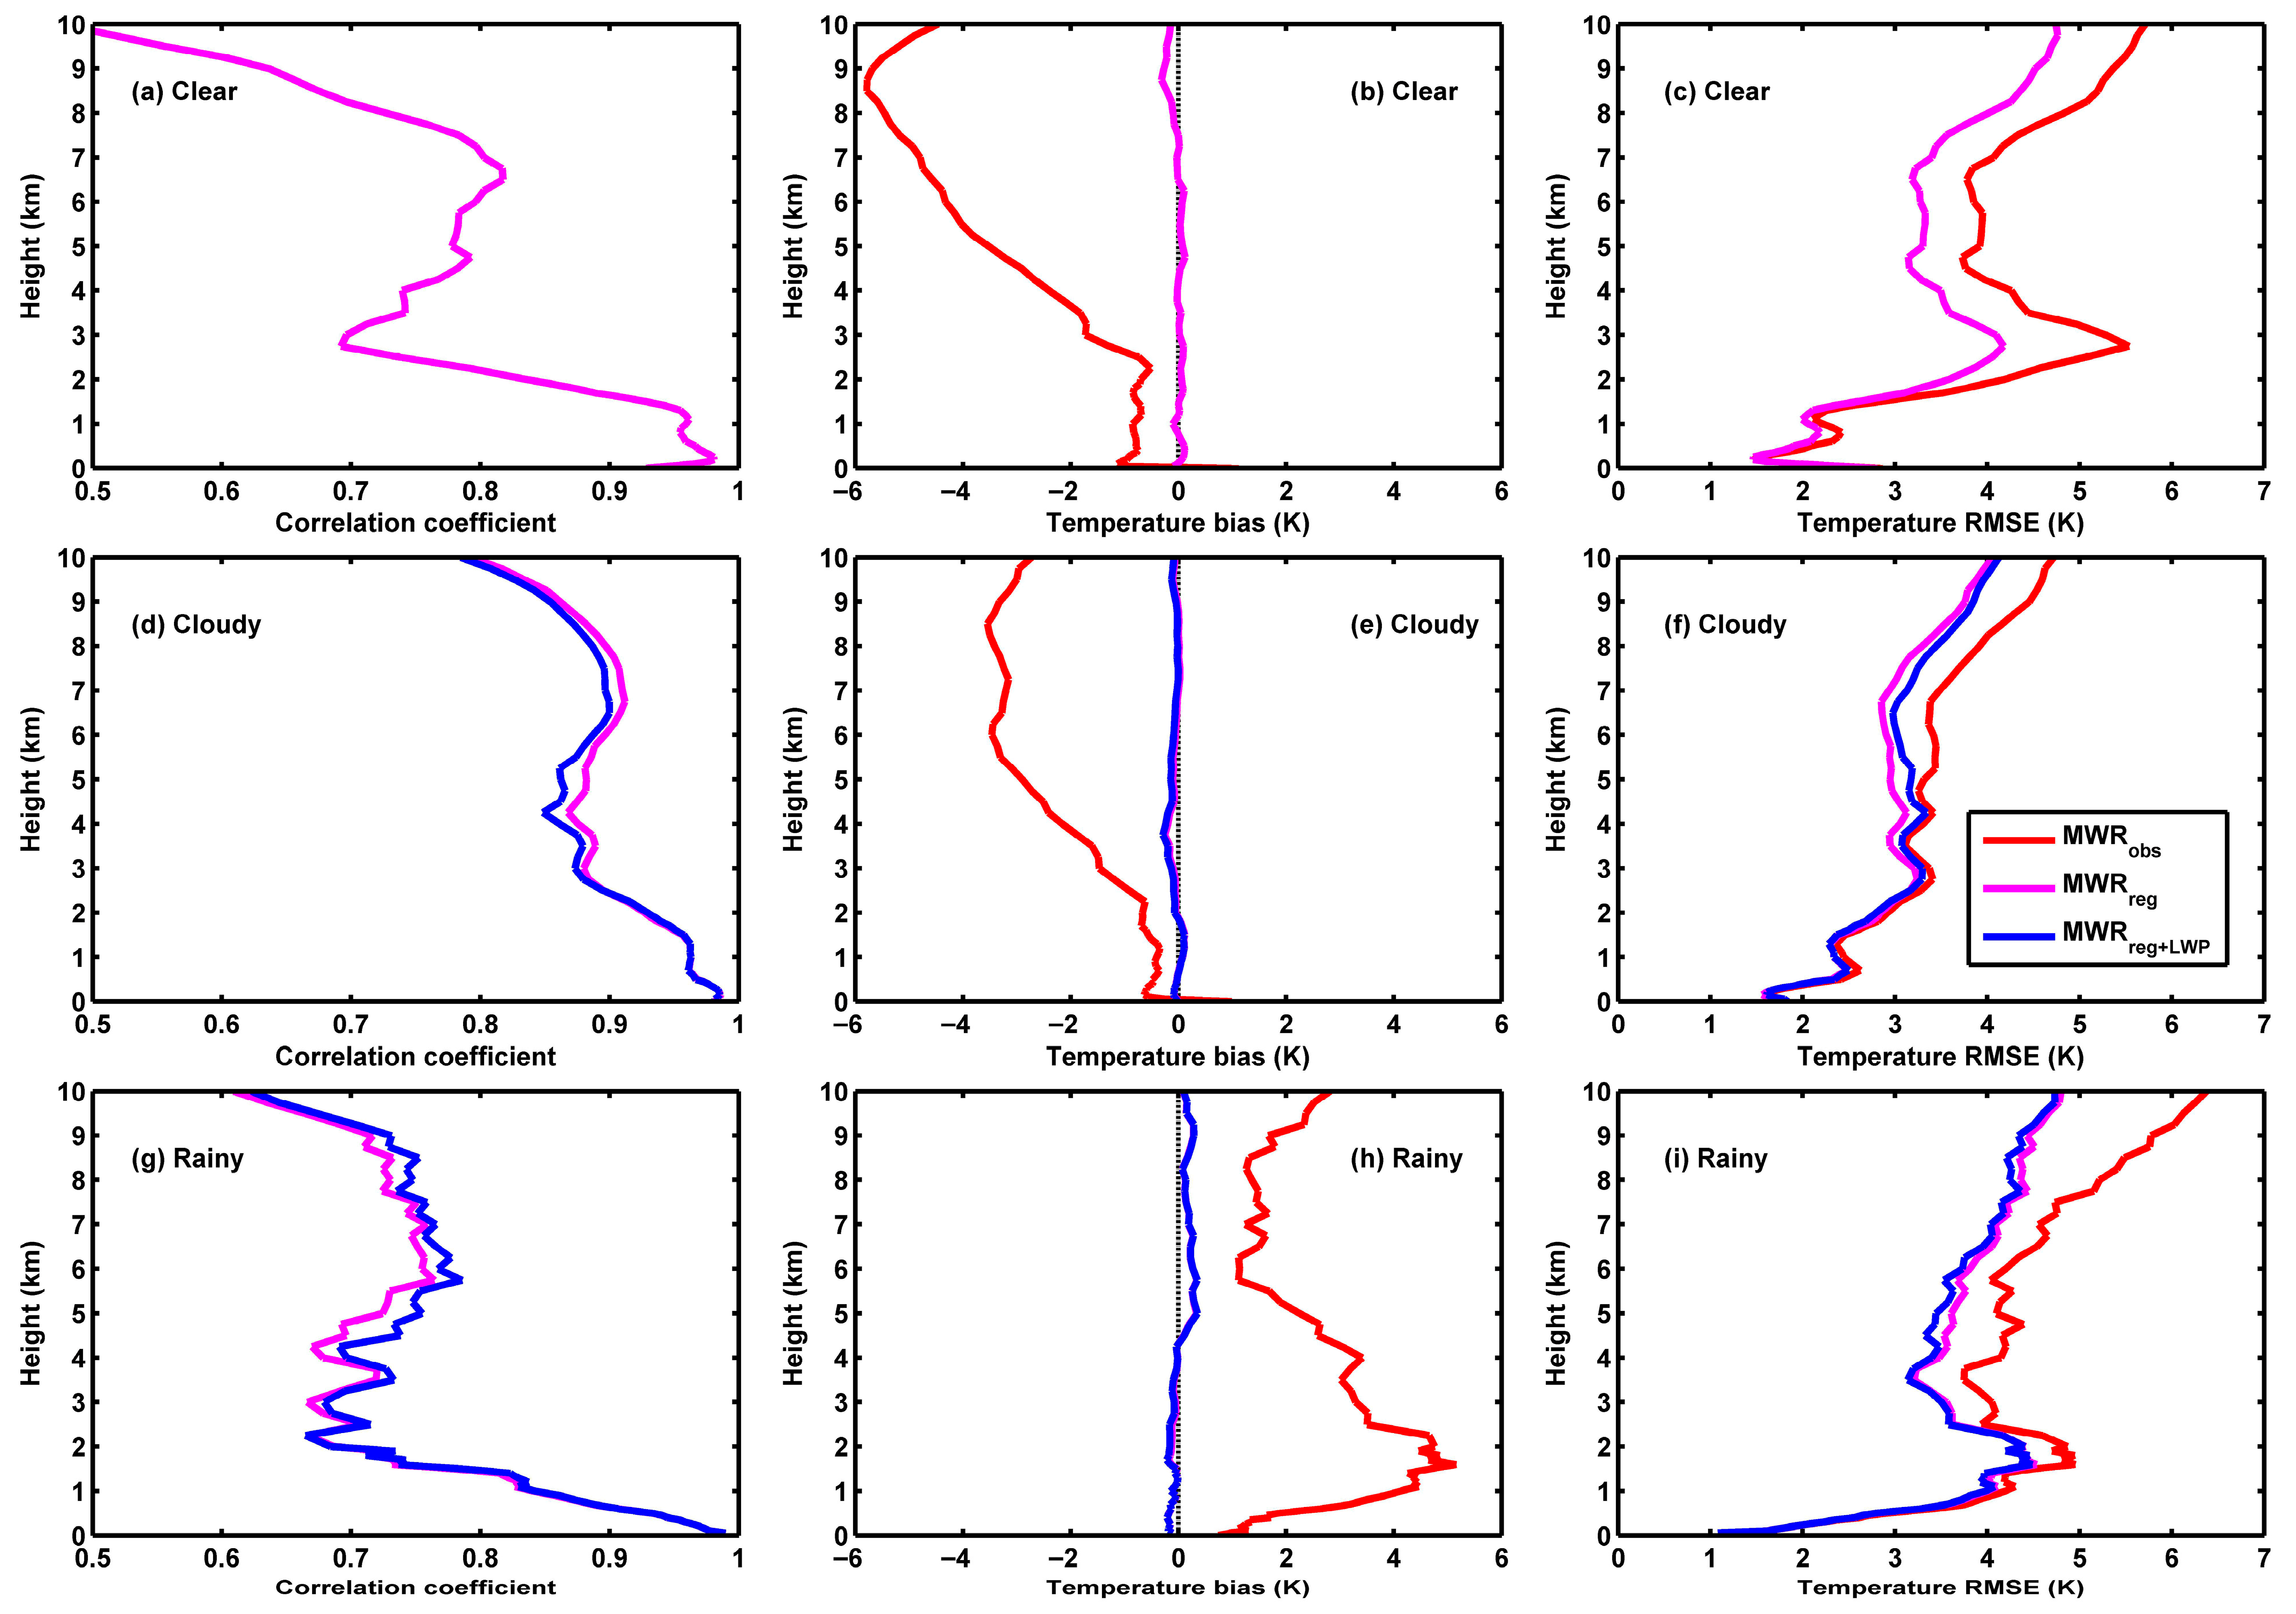
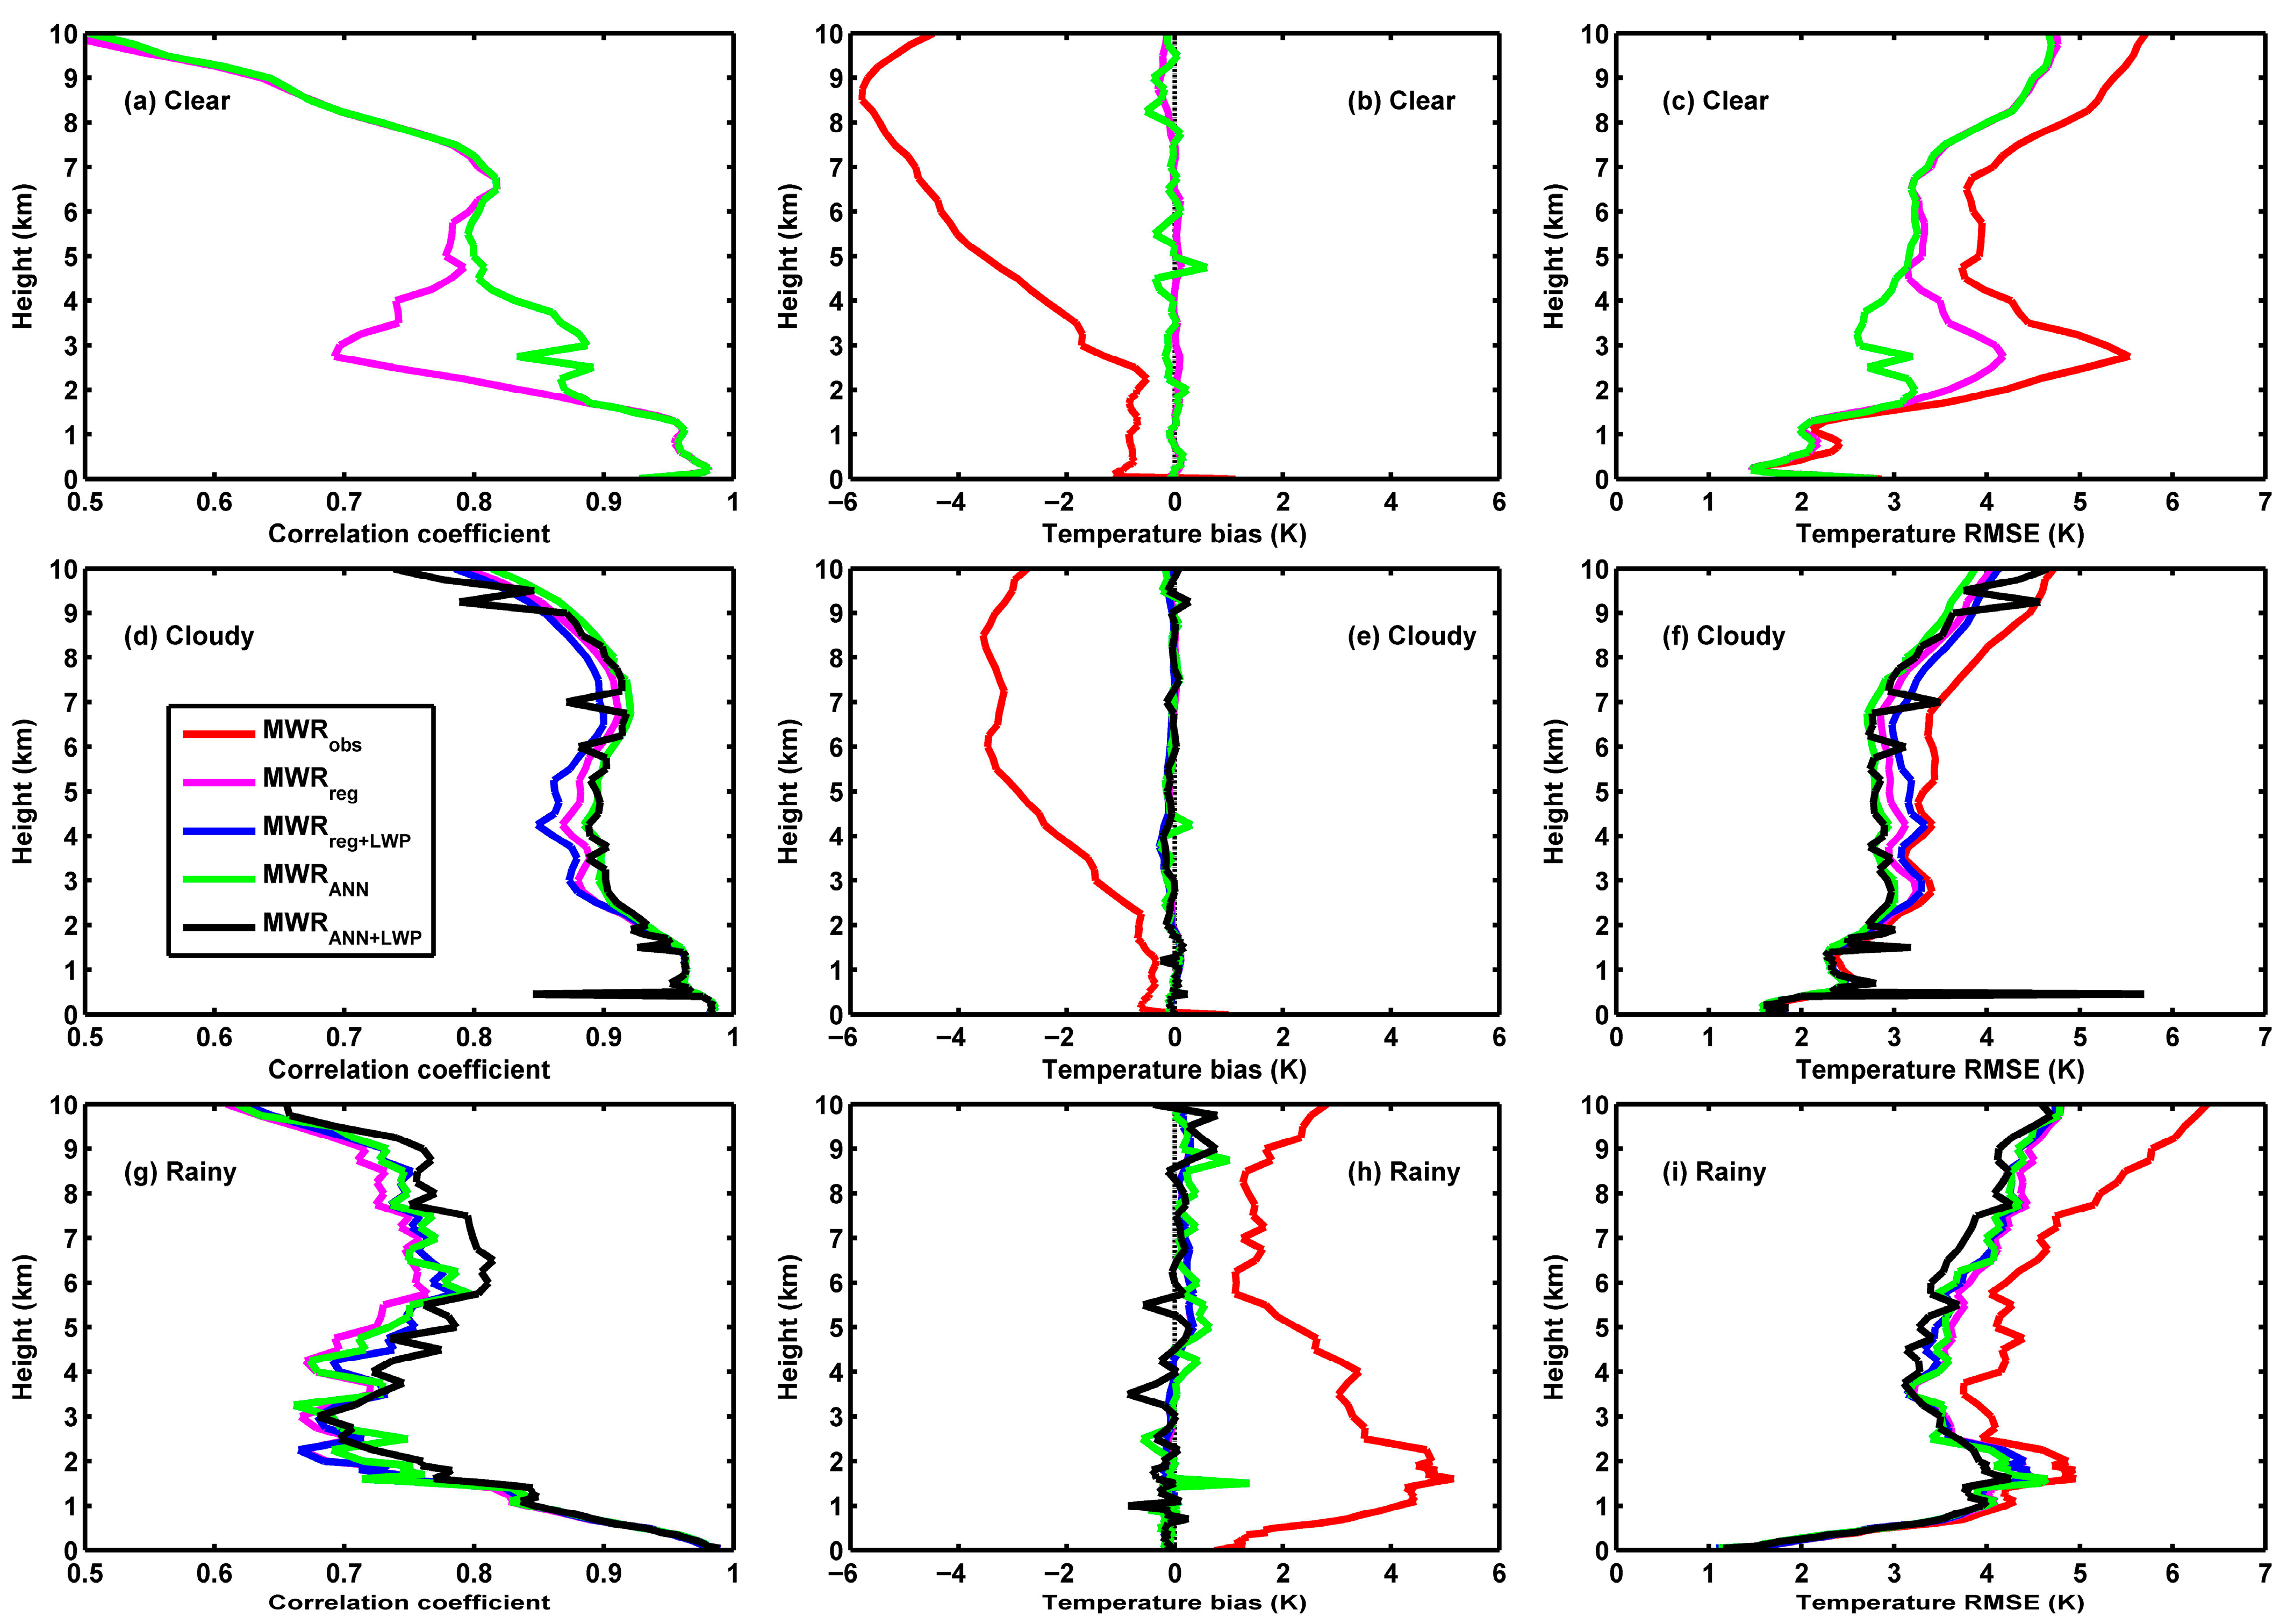
According to Equations (1) and (2), the regression models for correcting MWR temperature and vapor density deviations are built up. The performances of the regression models for MWR temperature are shown in Figure 4. In clear skies, the correlation coefficient of MWR temperature with radiosondes obtained using Equation (1) (hereafter MWRreg) is the same as that before correction (hereafter MWRobs), but the cold bias of the MWR temperature is reduced to 0 K at all profile heights, and, at the heights where the MWR temperature bias decreases markedly, i.e., above 2 km, the MWR temperature RMSE also declines (Figure 4a–c). The model performance of MWRreg is the same situation for cloudy skies; however, the results obtained using Equation (2) (hereafter MWRreg+LWP) make no difference from those of MWRreg (Figure 4d–f). In rainy skies, the consistency between MWR and radiosonde temperatures remains unchanged after correcting using MWRreg, but the warm bias of the MWR temperature is reduced to 0 K at all profile heights, and the MWR temperature RMSE is also improved above 1.5 km (Figure 4g–i); similarly to that in cloudy skies, the difference in the correction effects of MWRreg+LWP and MWRreg is very small. These results indicate that the regression model can reduce the system bias of the MWR temperature against radiosondes to 0 K in diverse skies, and also improve the MWR temperature RMSE above 2 km. Additionally, both the MWR temperature and LWP depend on the original brightness temperature but are not completely independent, so adding LWP into the regression model as an input makes almost no difference.
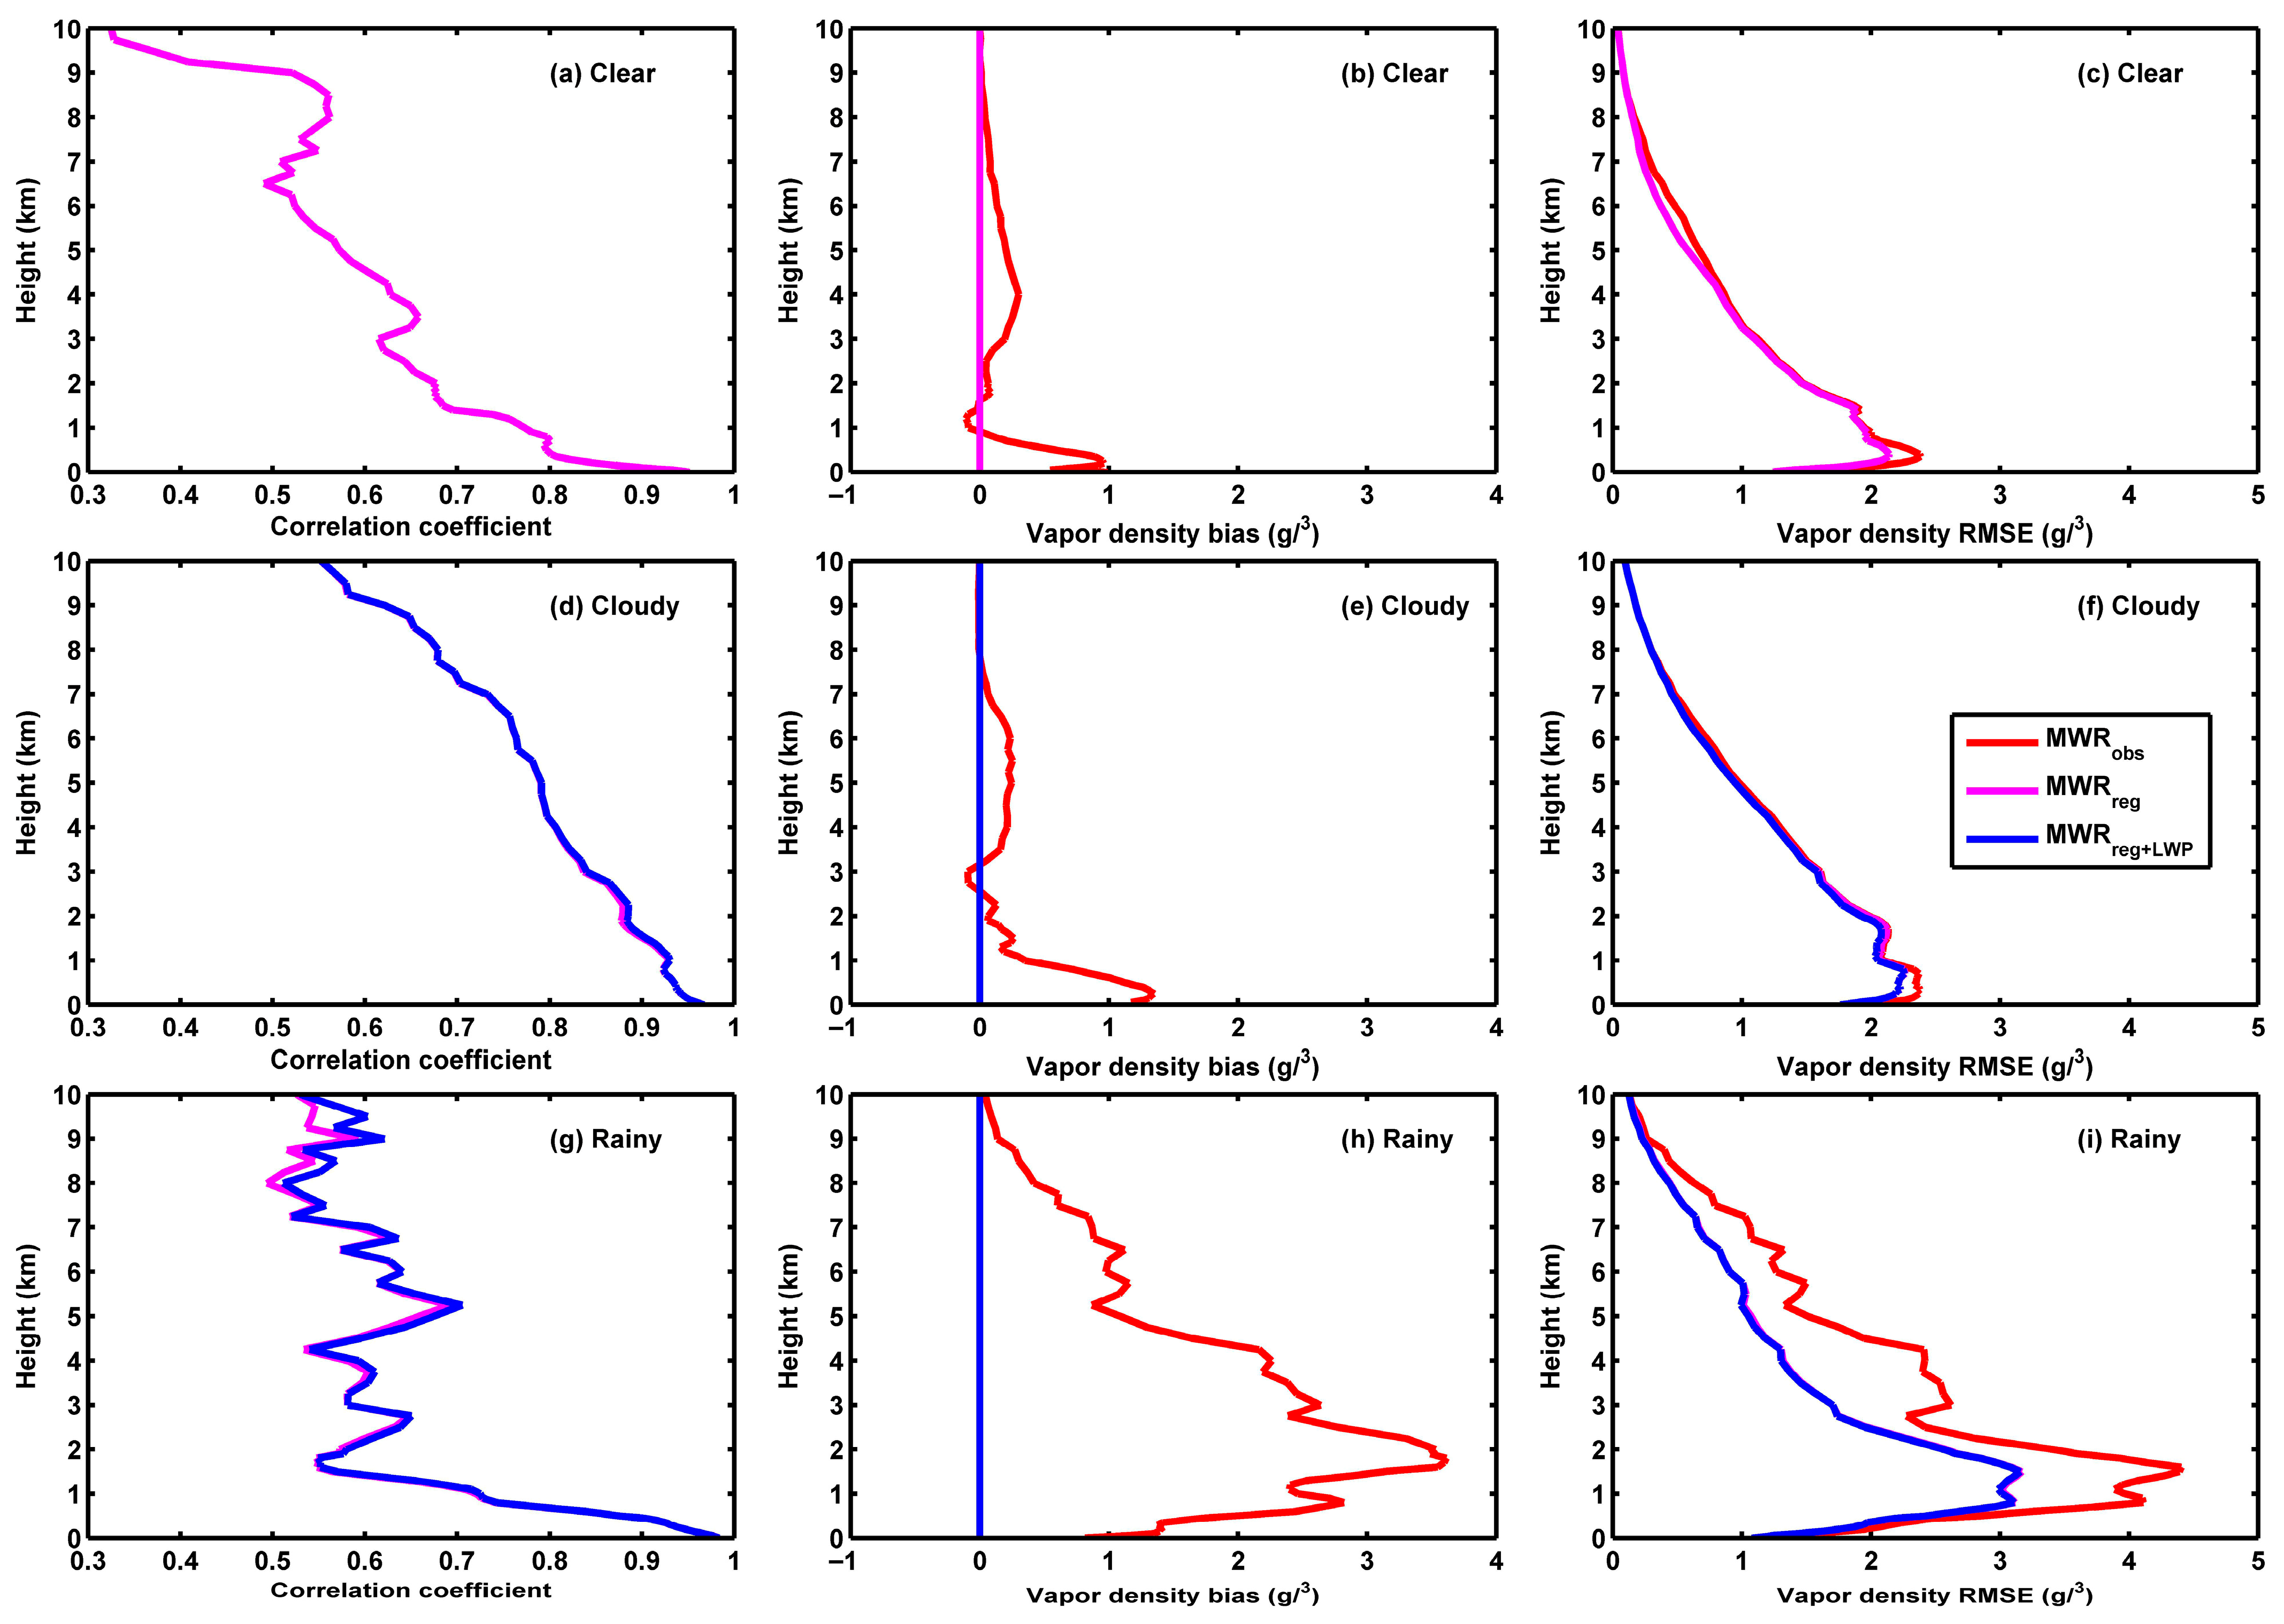
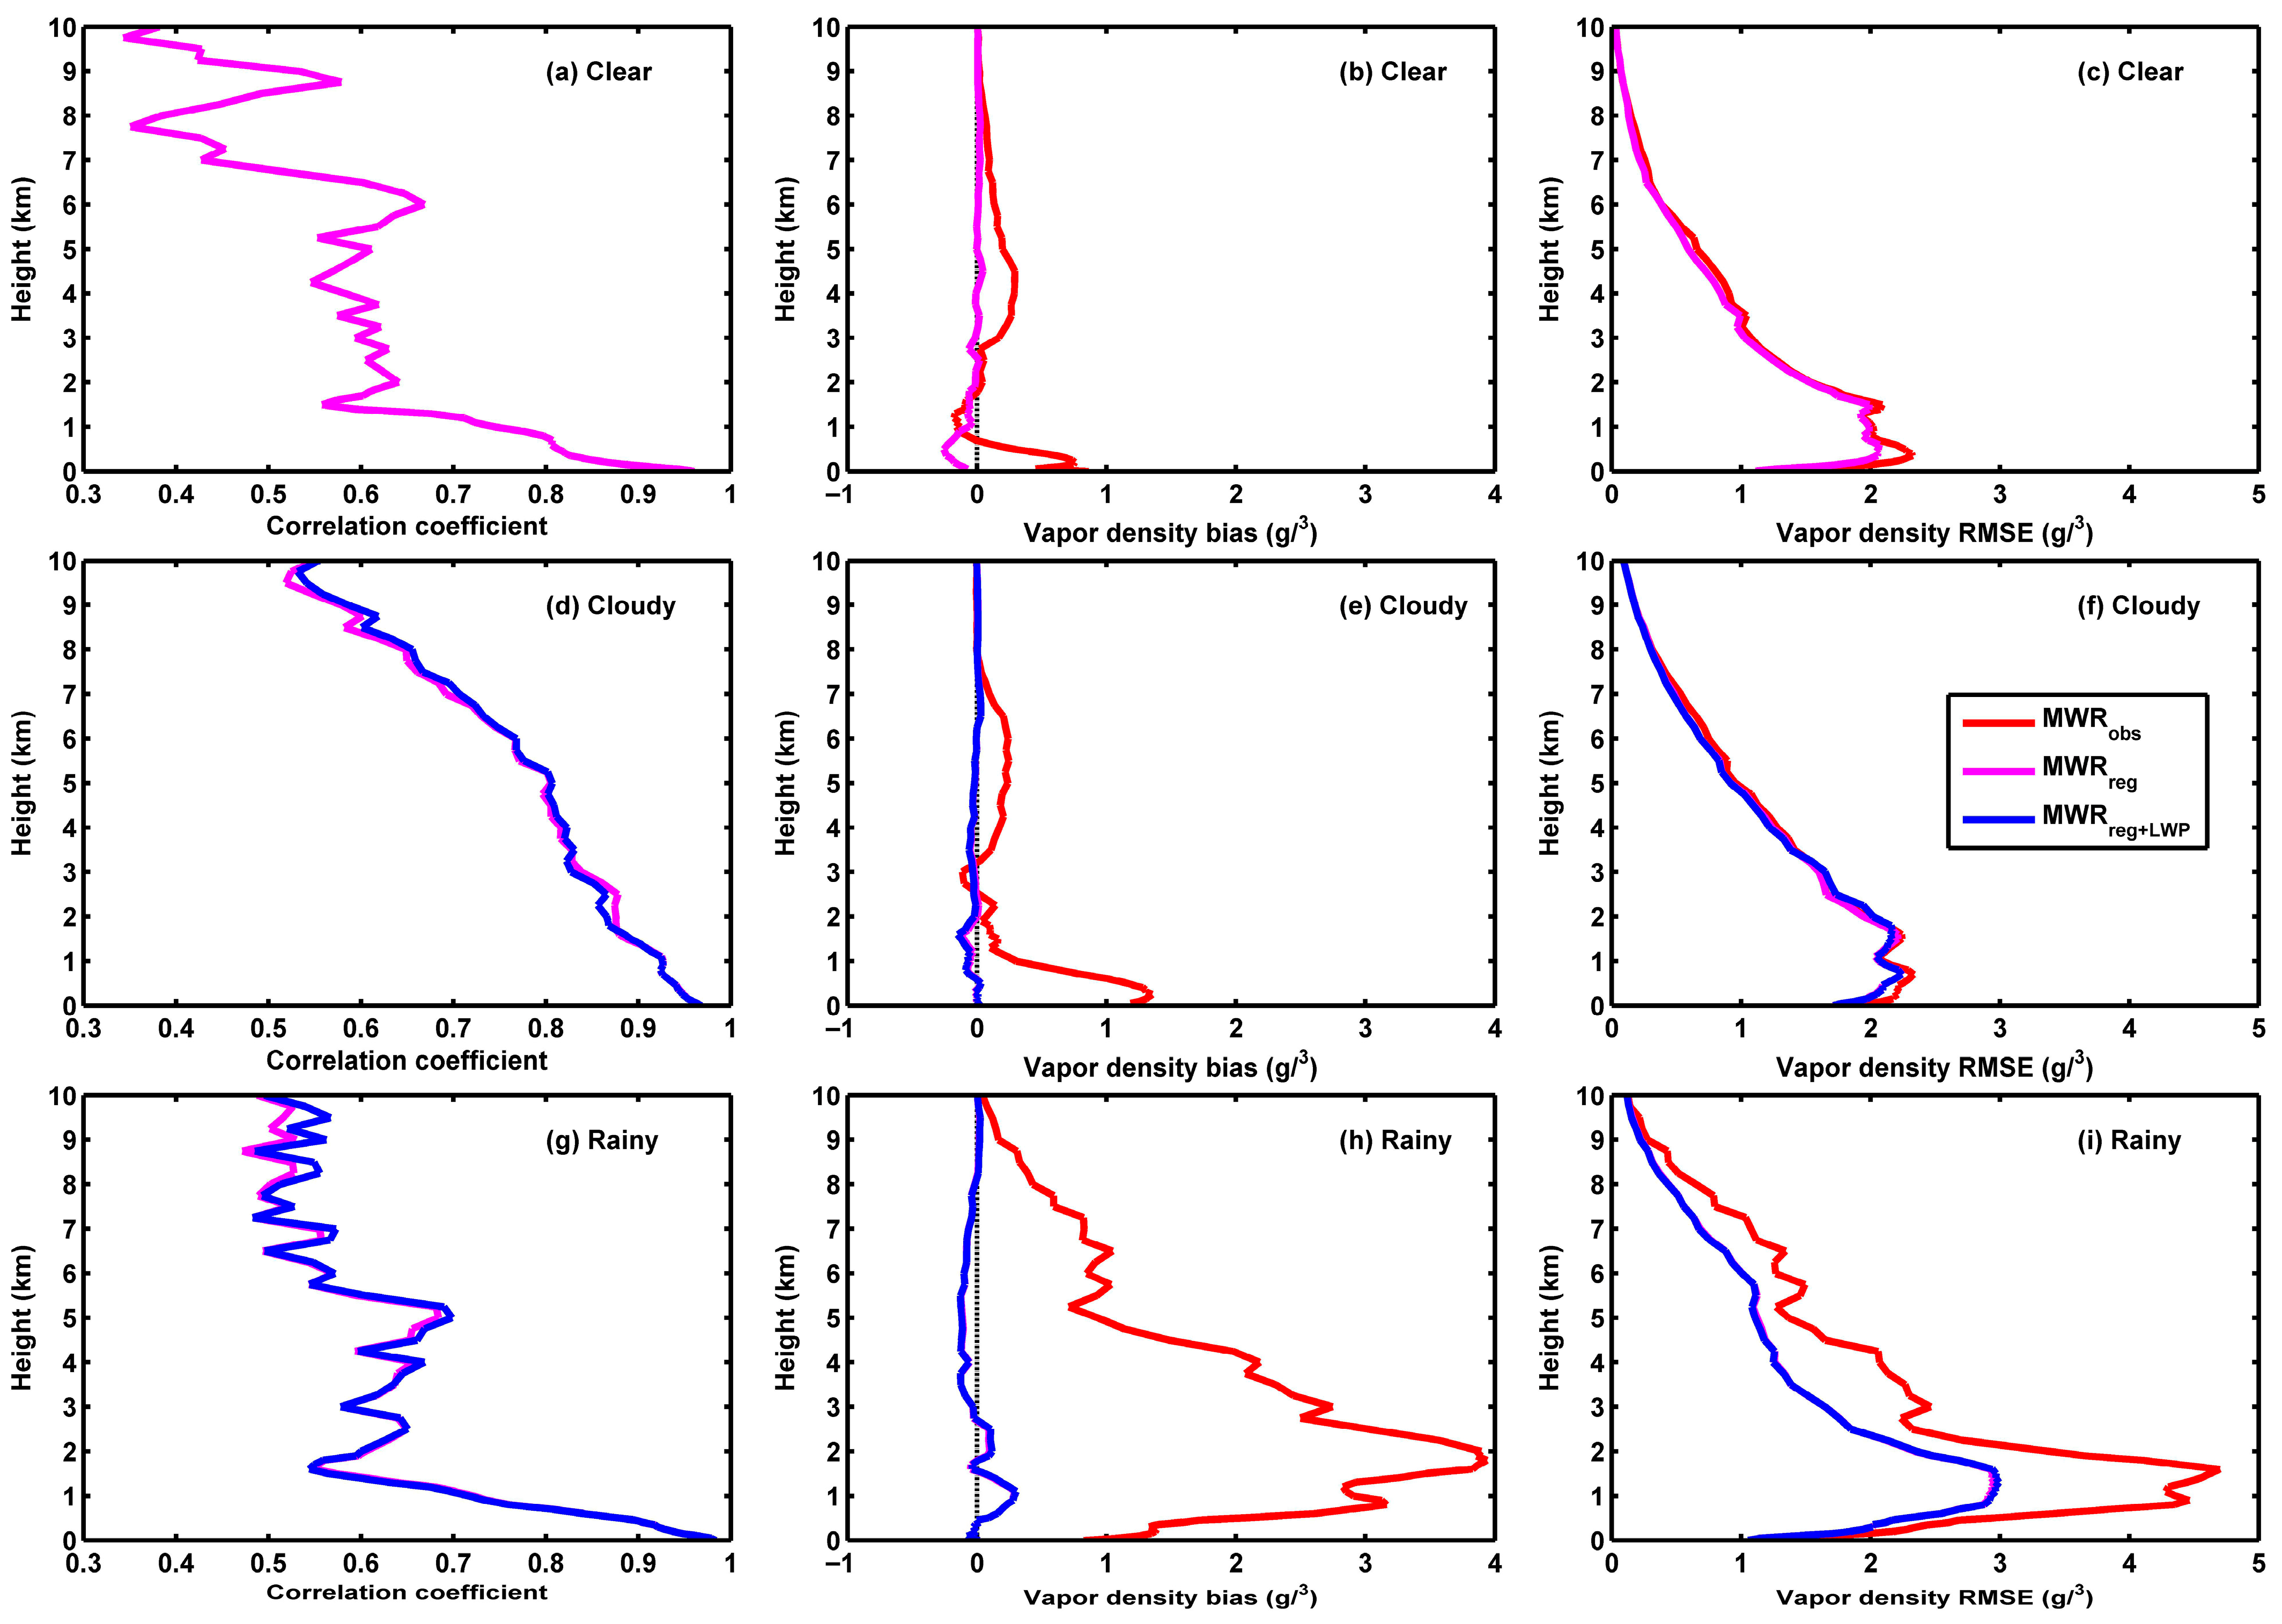
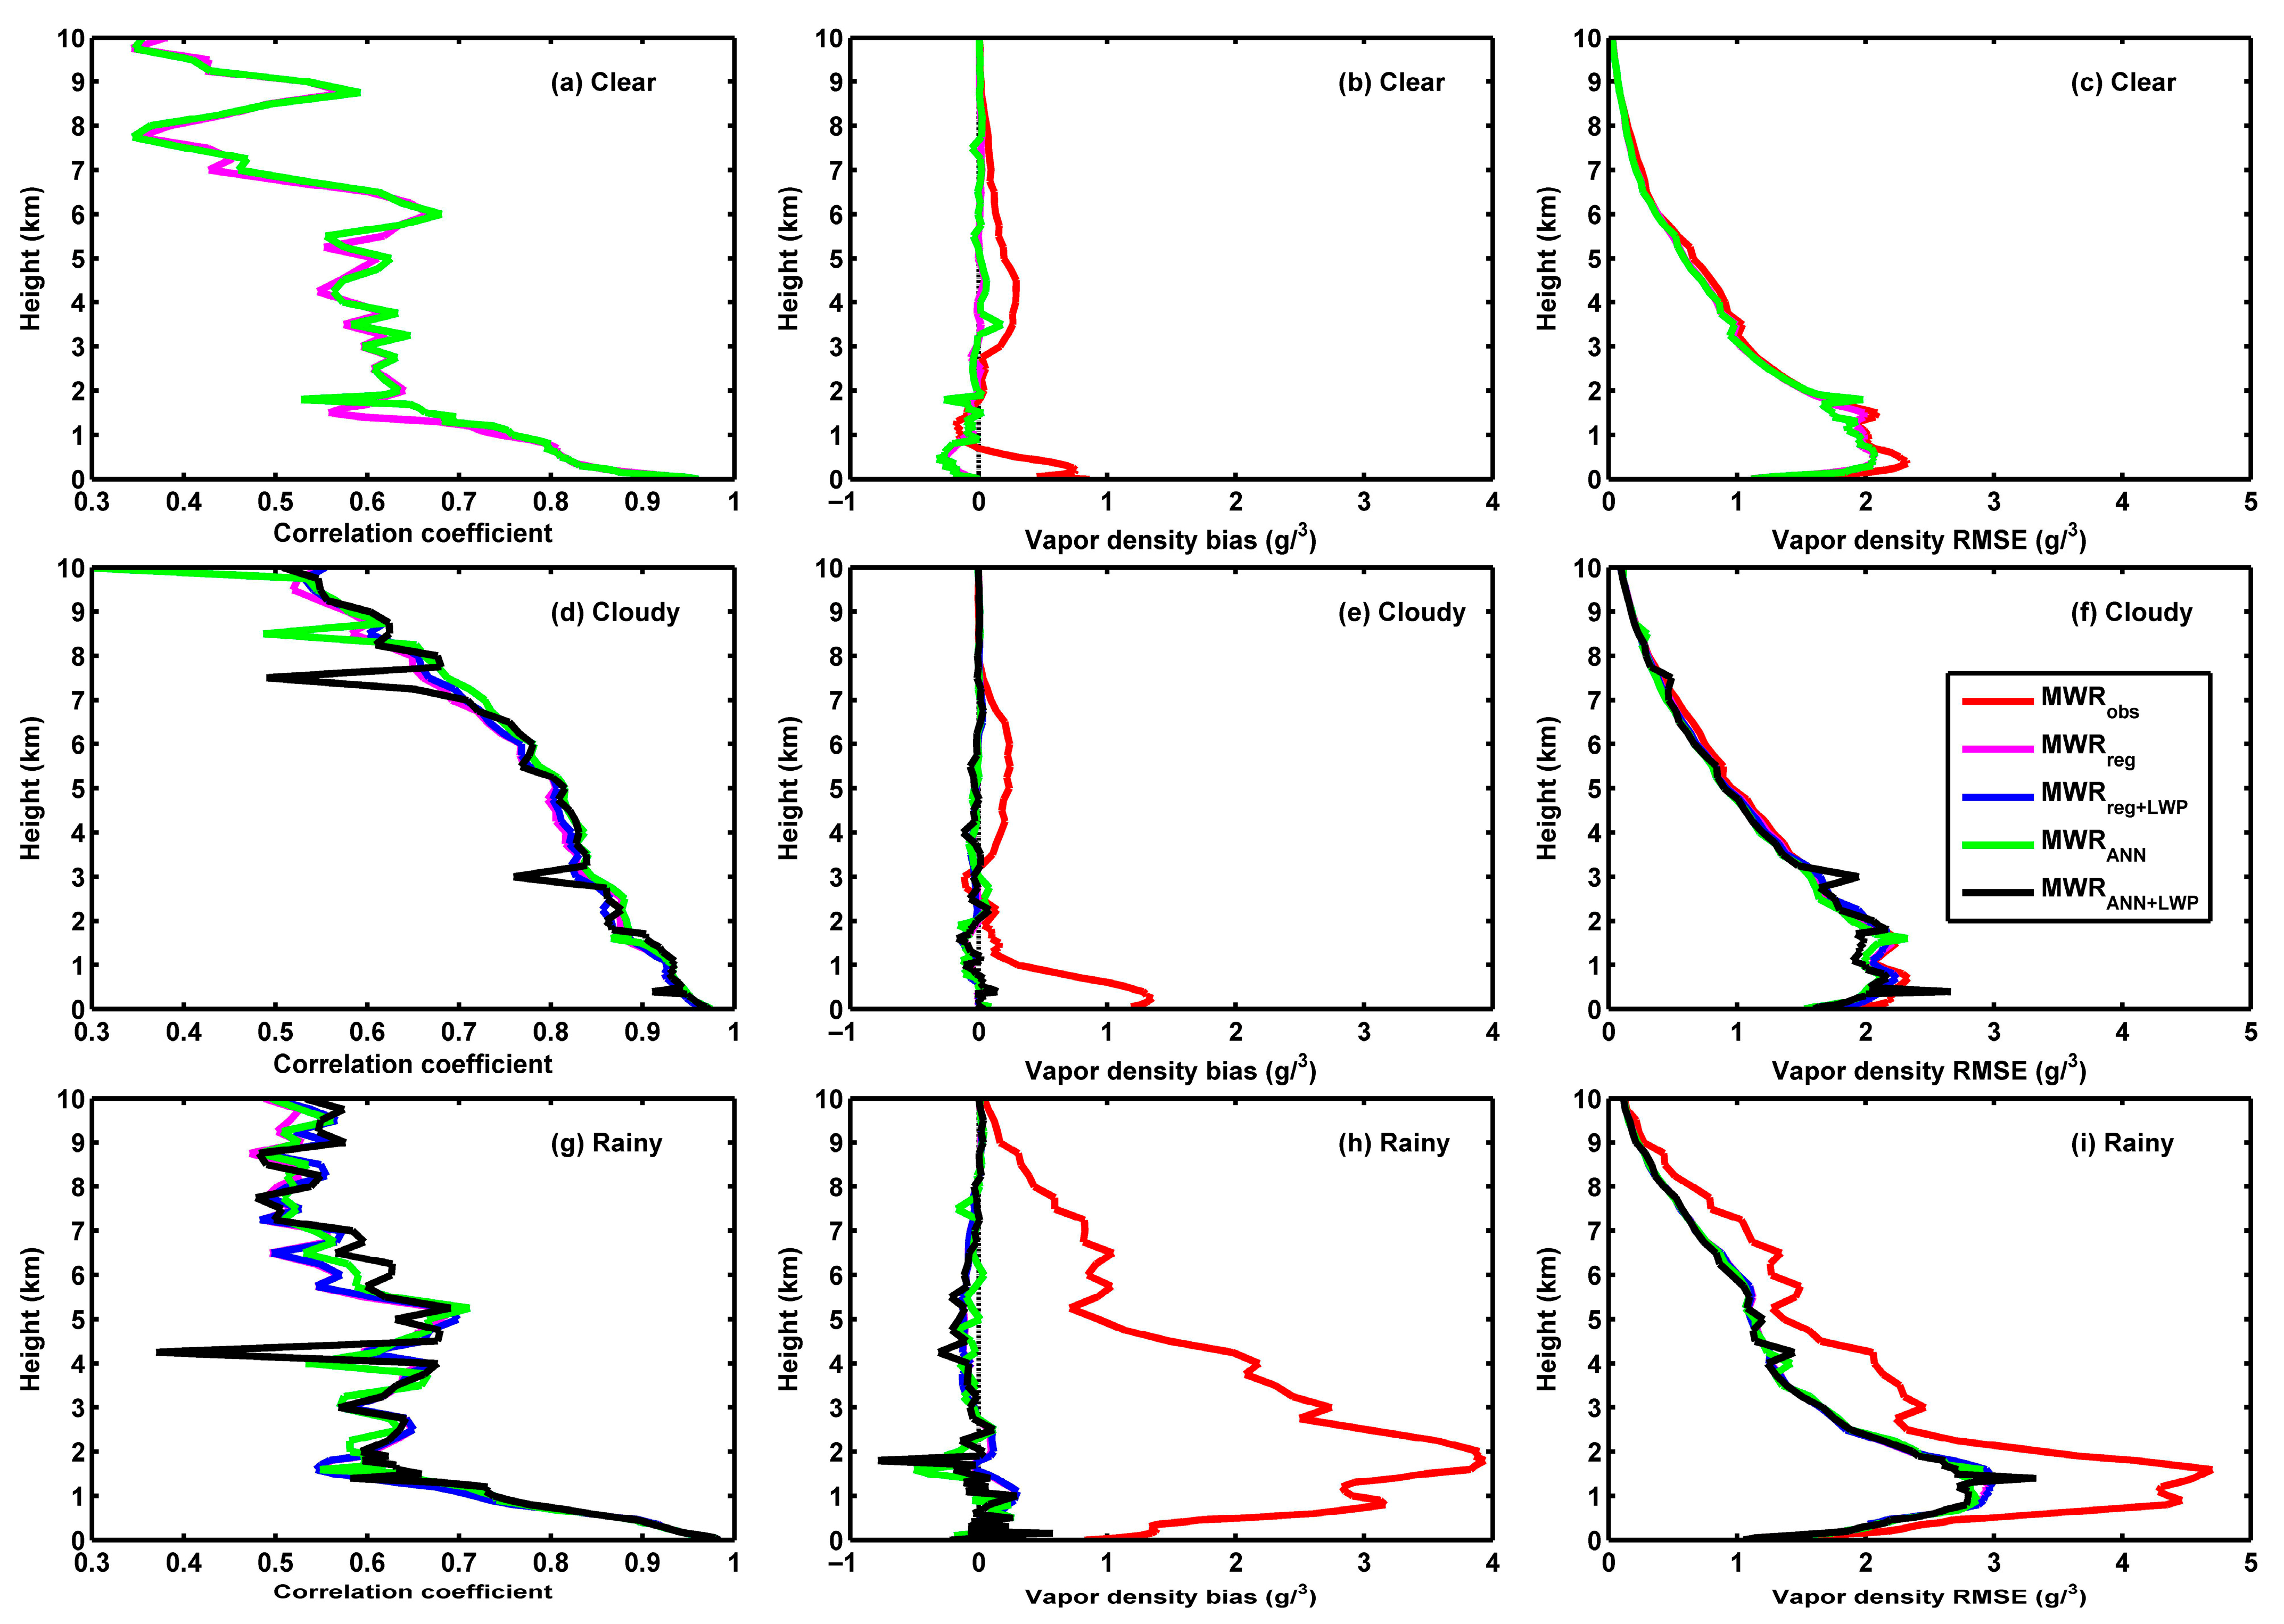
The performances of regression models for the MWR vapor density are shown in Figure 5. In clear skies, the correlation coefficient of MWR vapor density with radiosondes remains unchanged after correcting using MWRreg, but the MWR vapor density bias against radiosondes is reduced to 0 g/m3 at all heights, while the MWR vapor density RMSE is slightly improved only at near-surface heights (Figure 5a–c). In cloudy skies, the correction effect of MWRreg is the same situation as that of clear skies; moreover, similarly to the case of MWR temperature, there is no difference between the correction effects of MWRreg+LWP and MWRreg (Figure 5d–f). In rainy skies, although MWRreg makes no improvement on the consistency of the MWR vapor density with radiosondes, it can reduce the MWR vapor density bias against radiosondes to 0 g/m3 at all heights, and the MWR vapor density RMSE declines at most heights, which may be due to the marked decrease in the MWR vapor density bias; however, the difference in the correction effects of MWRreg+LWP and MWRreg is also very small (Figure 5g–i). It can be concluded that the regression model can reduce the system biases of MWR vapor density against radiosondes to 0 g/m3 in diverse skies, and improve the MWR vapor density RMSE at most heights in rainy skies but only at near-surface heights in clear and cloudy skies, while adding LWP into the regression model as an input brings almost no changes.
Using the remaining 20% of samples, the correction effects of the two regression models on MWR temperature are validated. Figure 6a–c show that, in clear skies, the correction effect of MWRreg obtained from the testing data is consistent with that obtained from the training data, in which the MWR temperature bias is reduced to around 0 K at all heights, and the MWR temperature RMSE declines above 2 km, while the correlation coefficient of the MWR temperature with radiosondes remains unchanged. The correction effects in cloudy and rainy skies validated with the testing data are also similar to those obtained from the training data, and there is very little difference in the correction effects of MWRreg and MWRreg+LWP (Figure 6d–i). As shown in Table 2, on the whole, after correcting with MWRreg, the cold bias of the MWR temperature in clear (cloudy) skies is corrected from −2.5 K (−1.7 K) to 0 K (0 K), and the warm bias in rainy skies is corrected from 2.6 K to 0 K, while the MWR temperature RMSEs in clear, cloudy, and rainy skies decline from 3.6, 3.0, and 4.1 K to 3.1, 2.8, and 3.6 K, respectively, with corresponding decreased percentages of 14%, 7%, and 12%. Moreover, MWRreg+LWP obtains almost the same result as that of MWRreg in cloudy and rainy skies, showing no advantages over MWRreg. These indicate that the correction effect of the regression model validated with the testing data is consistent with that obtained from the training data, demonstrating that the performance of the regression model is robust for correcting MWR temperature deviations.
Figure 7 shows the correction effects of the regression models on MWR vapor density validated with the testing data. In clear skies, MWRreg makes no changes in the correlation coefficient of MWR vapor density with radiosondes, but the MWR vapor density bias against radiosondes is reduced to around 0 g/m3, while the MWR vapor density RMSE is slightly improved only at some heights below 1 km (Figure 7a–c); this result is consistent with that obtained from the training data. In cloudy and rainy skies, MWRreg also achieves a similar correction effect to that obtained from the training data, in which the MWR vapor density bias is reduced to around 0 g/m3 at all heights and the MWR vapor density RMSE declines at most heights in rainy skies but not in cloudy skies, while the correlation coefficient of MWR vapor density with radiosondes remains unchanged (Figure 7d–f); moreover, MWRreg+LWP makes no difference from MWRreg. On the whole, after correcting with MWRreg, the MWR vapor density biases in clear, cloudy, and rainy skies are reduced from 0.17, 0.37, and 1.76 g/m3 to −0.05, −0.02, and 0.01 g/m3 respectively, and, correspondingly, the MWR vapor density RMSEs decline from 1.17, 1.41, and 2.20 g/m3 to 1.09, 1.35, and 1.56 g/m3, with decrease percentages of 7%, 4%, and 29%, respectively (Table 3). The results of MWRreg+LWP are almost the same as those of MWRreg in cloudy and rainy skies. Obviously, the correction effect of the regression model validated with the testing data is consistent with that obtained from the training data, indicating that the performance of the regression model is also robust for correcting MWR vapor density deviations.

3.3. Correction of MWR Temperature and Vapor Density Through ANN Method

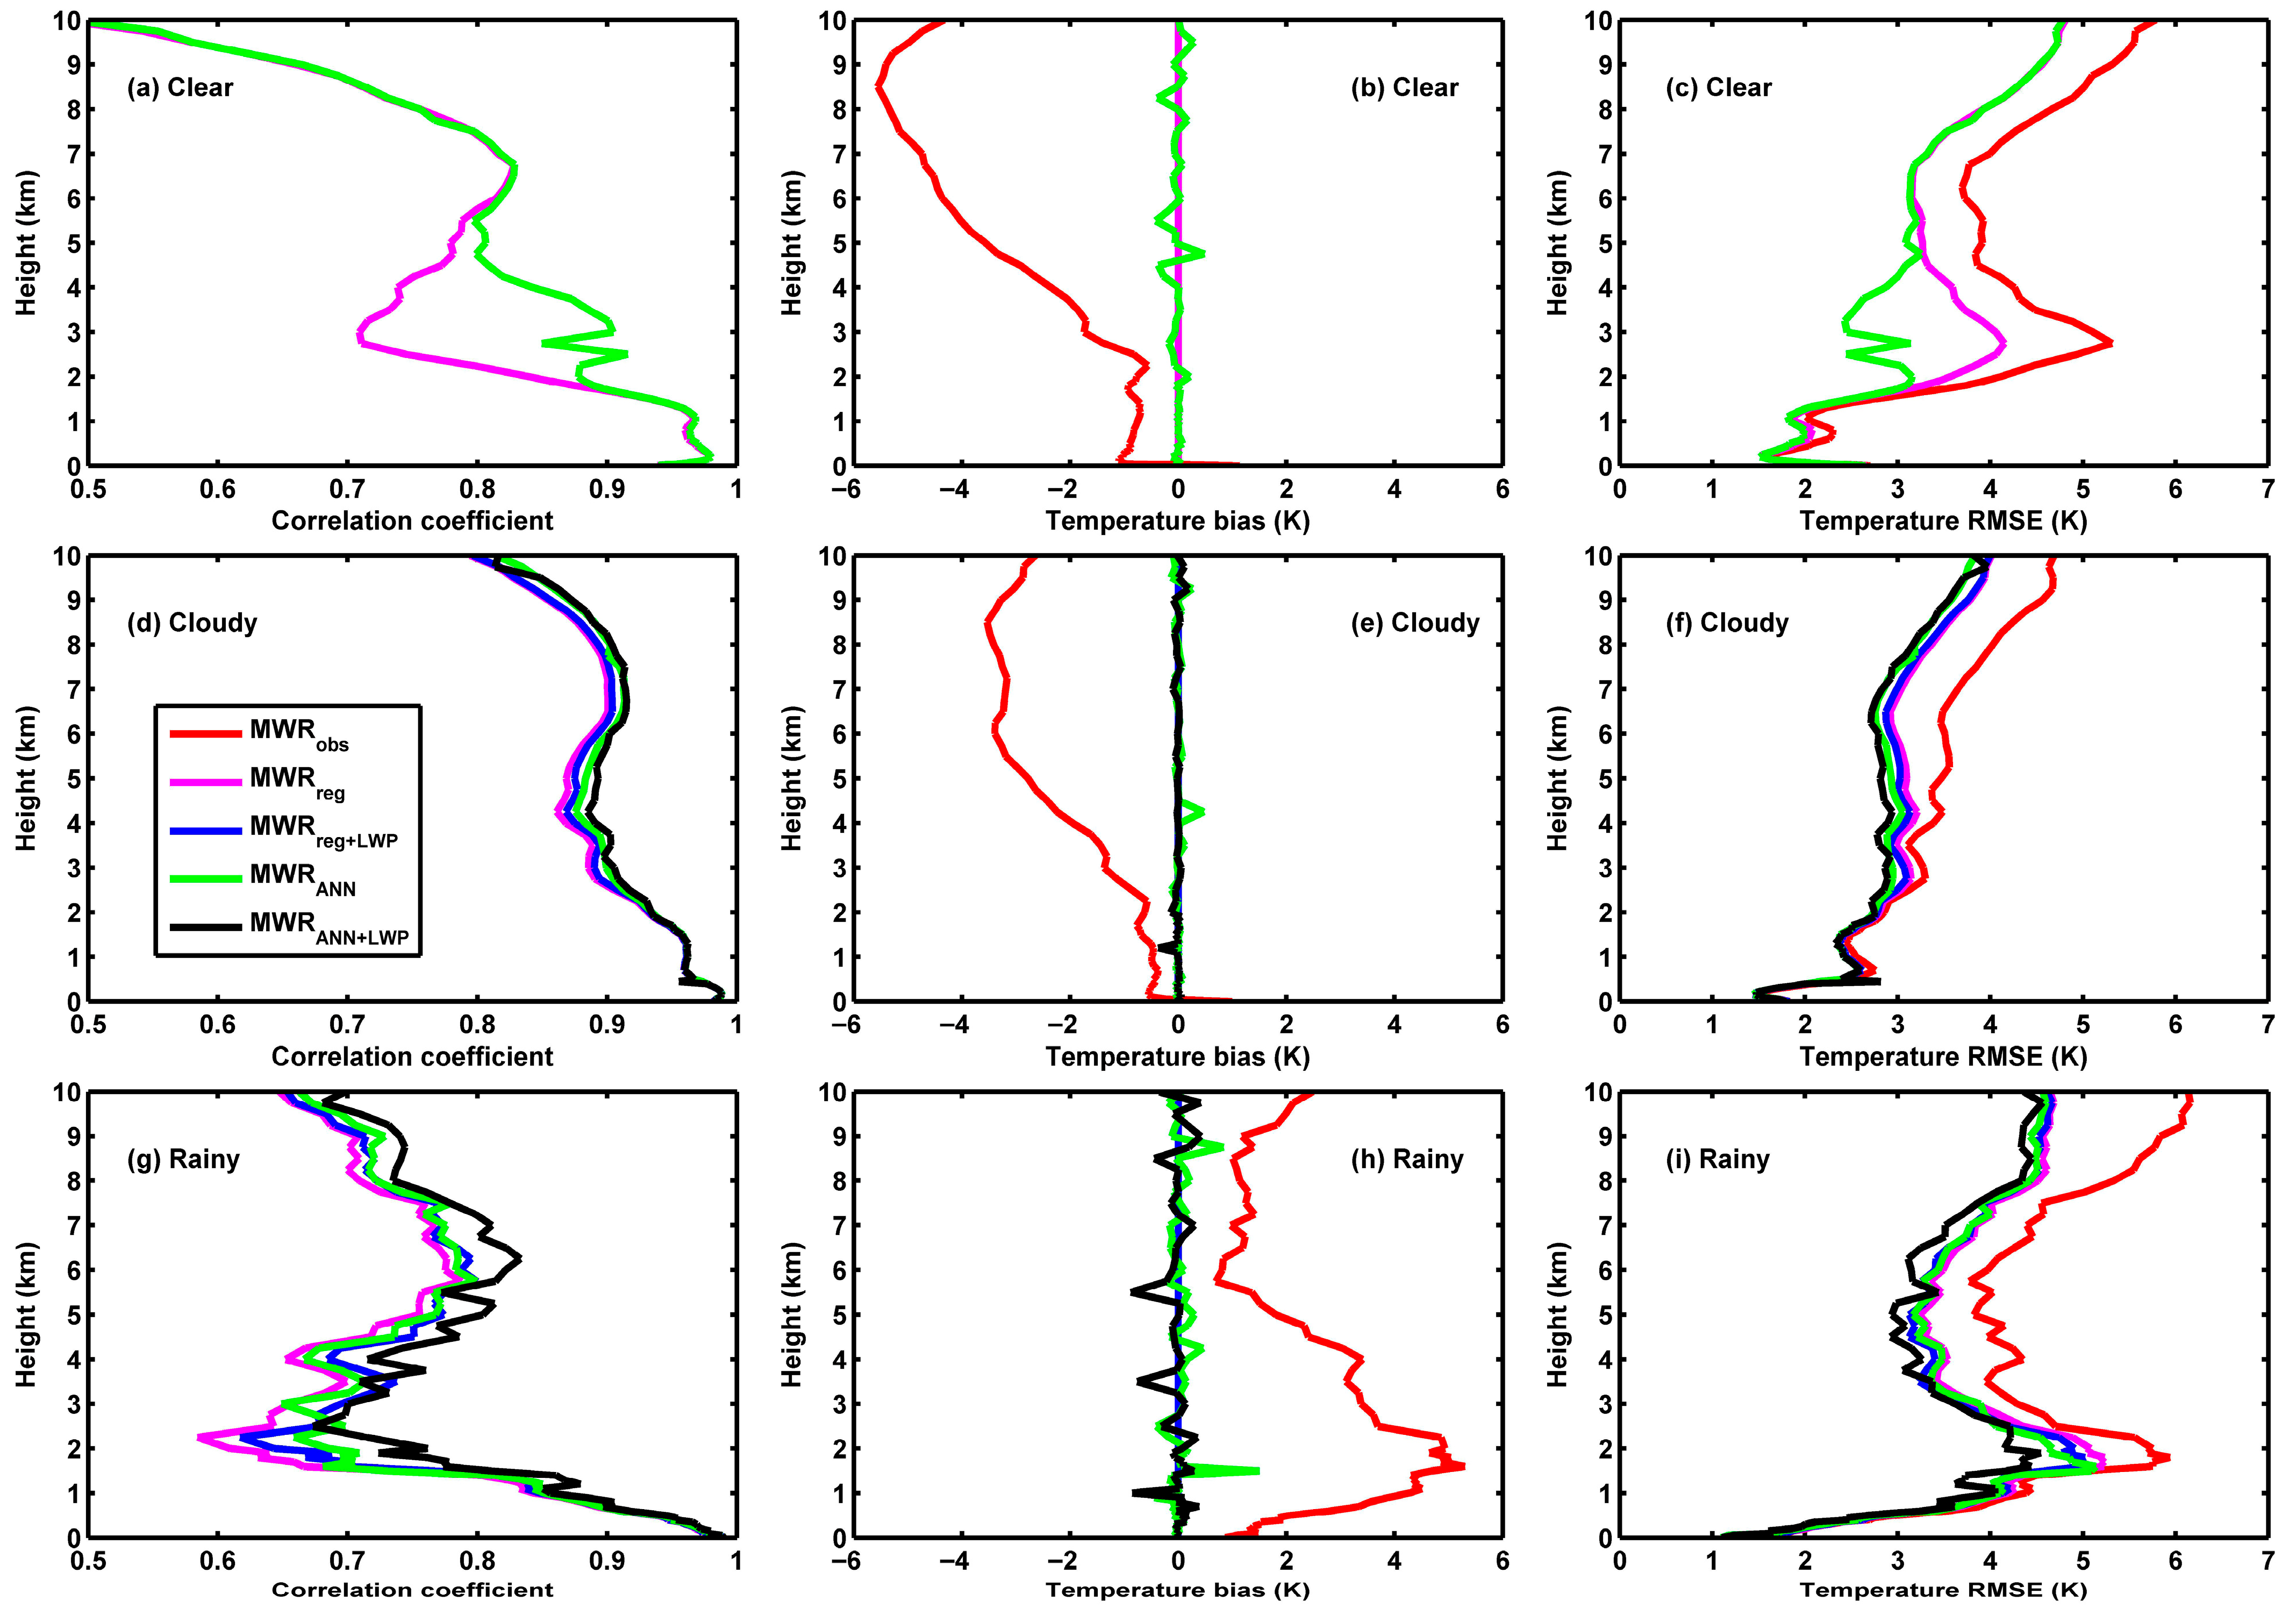
The ANN models for correcting MWR temperature and vapor density deviations are also built up according to Equations (3) and (4) (hereafter MWRANN and MWRANN+LWP, respectively). Figure 8 shows the performances of the two ANN models for MWR temperature compared with the two regression models (MWRreg and MWRreg+LWP). In clear skies, MWRANN can reduce the cold bias of MWR temperature against radiosondes to around 0 K, but the bias around 0 K fluctuates with height, indicating that the stability of MWRANN is slightly inferior to MWRreg; however, MWRANN achieves a better performance than MWRreg for the correlation coefficient of MWR temperature with radiosondes at 2–5 km, and correspondingly achieves a smaller RMSE of MWR temperature at these heights than MWRreg (Figure 8a–c). In cloudy skies, the correction effect of MWRANN is almost the same as that of MWRreg, in which the correlation coefficient of MWR temperature with radiosondes remains almost unchanged after correction, while the cold bias of MWR temperature against radiosondes is reduced to around 0 K at all heights, and the MWR temperature RMSE declines at above 2 km; in addition, MWRANN+LWP makes almost no difference compared with MWRANN (Figure 8d–f). In rainy skies, the correction effect of MWRANN is also similar to that of MWRreg, in which the warm bias of MWR temperature against radiosondes is reduced to around 0 K at all heights, and the MWR temperature RMSE declines at above 1.5 km, but the correlation coefficient of MWR temperature with radiosondes remains almost unchanged (Figure 8g–i); moreover, compared to MWRANN, MWRANN+LWP achieves a slightly better performance for the correlation coefficient of MWR temperature with radiosondes at some heights, and at these heights the MWR temperature RMSE is slightly smaller. These results suggest that the ANN model can reduce the system biases of MWR temperature against radiosondes to around 0 K in diverse skies, and the MWR temperature RMSE declines at above 2 km after correction, while adding LWP into the ANN model as an input makes a limited improvement in rainy skies. It is worth pointing out that, compared to the regression model, the ANN model achieves a greater correlation coefficient for the MWR temperature at some heights in clear skies, and correspondingly achieves a smaller MWR temperature RMSE at these heights.
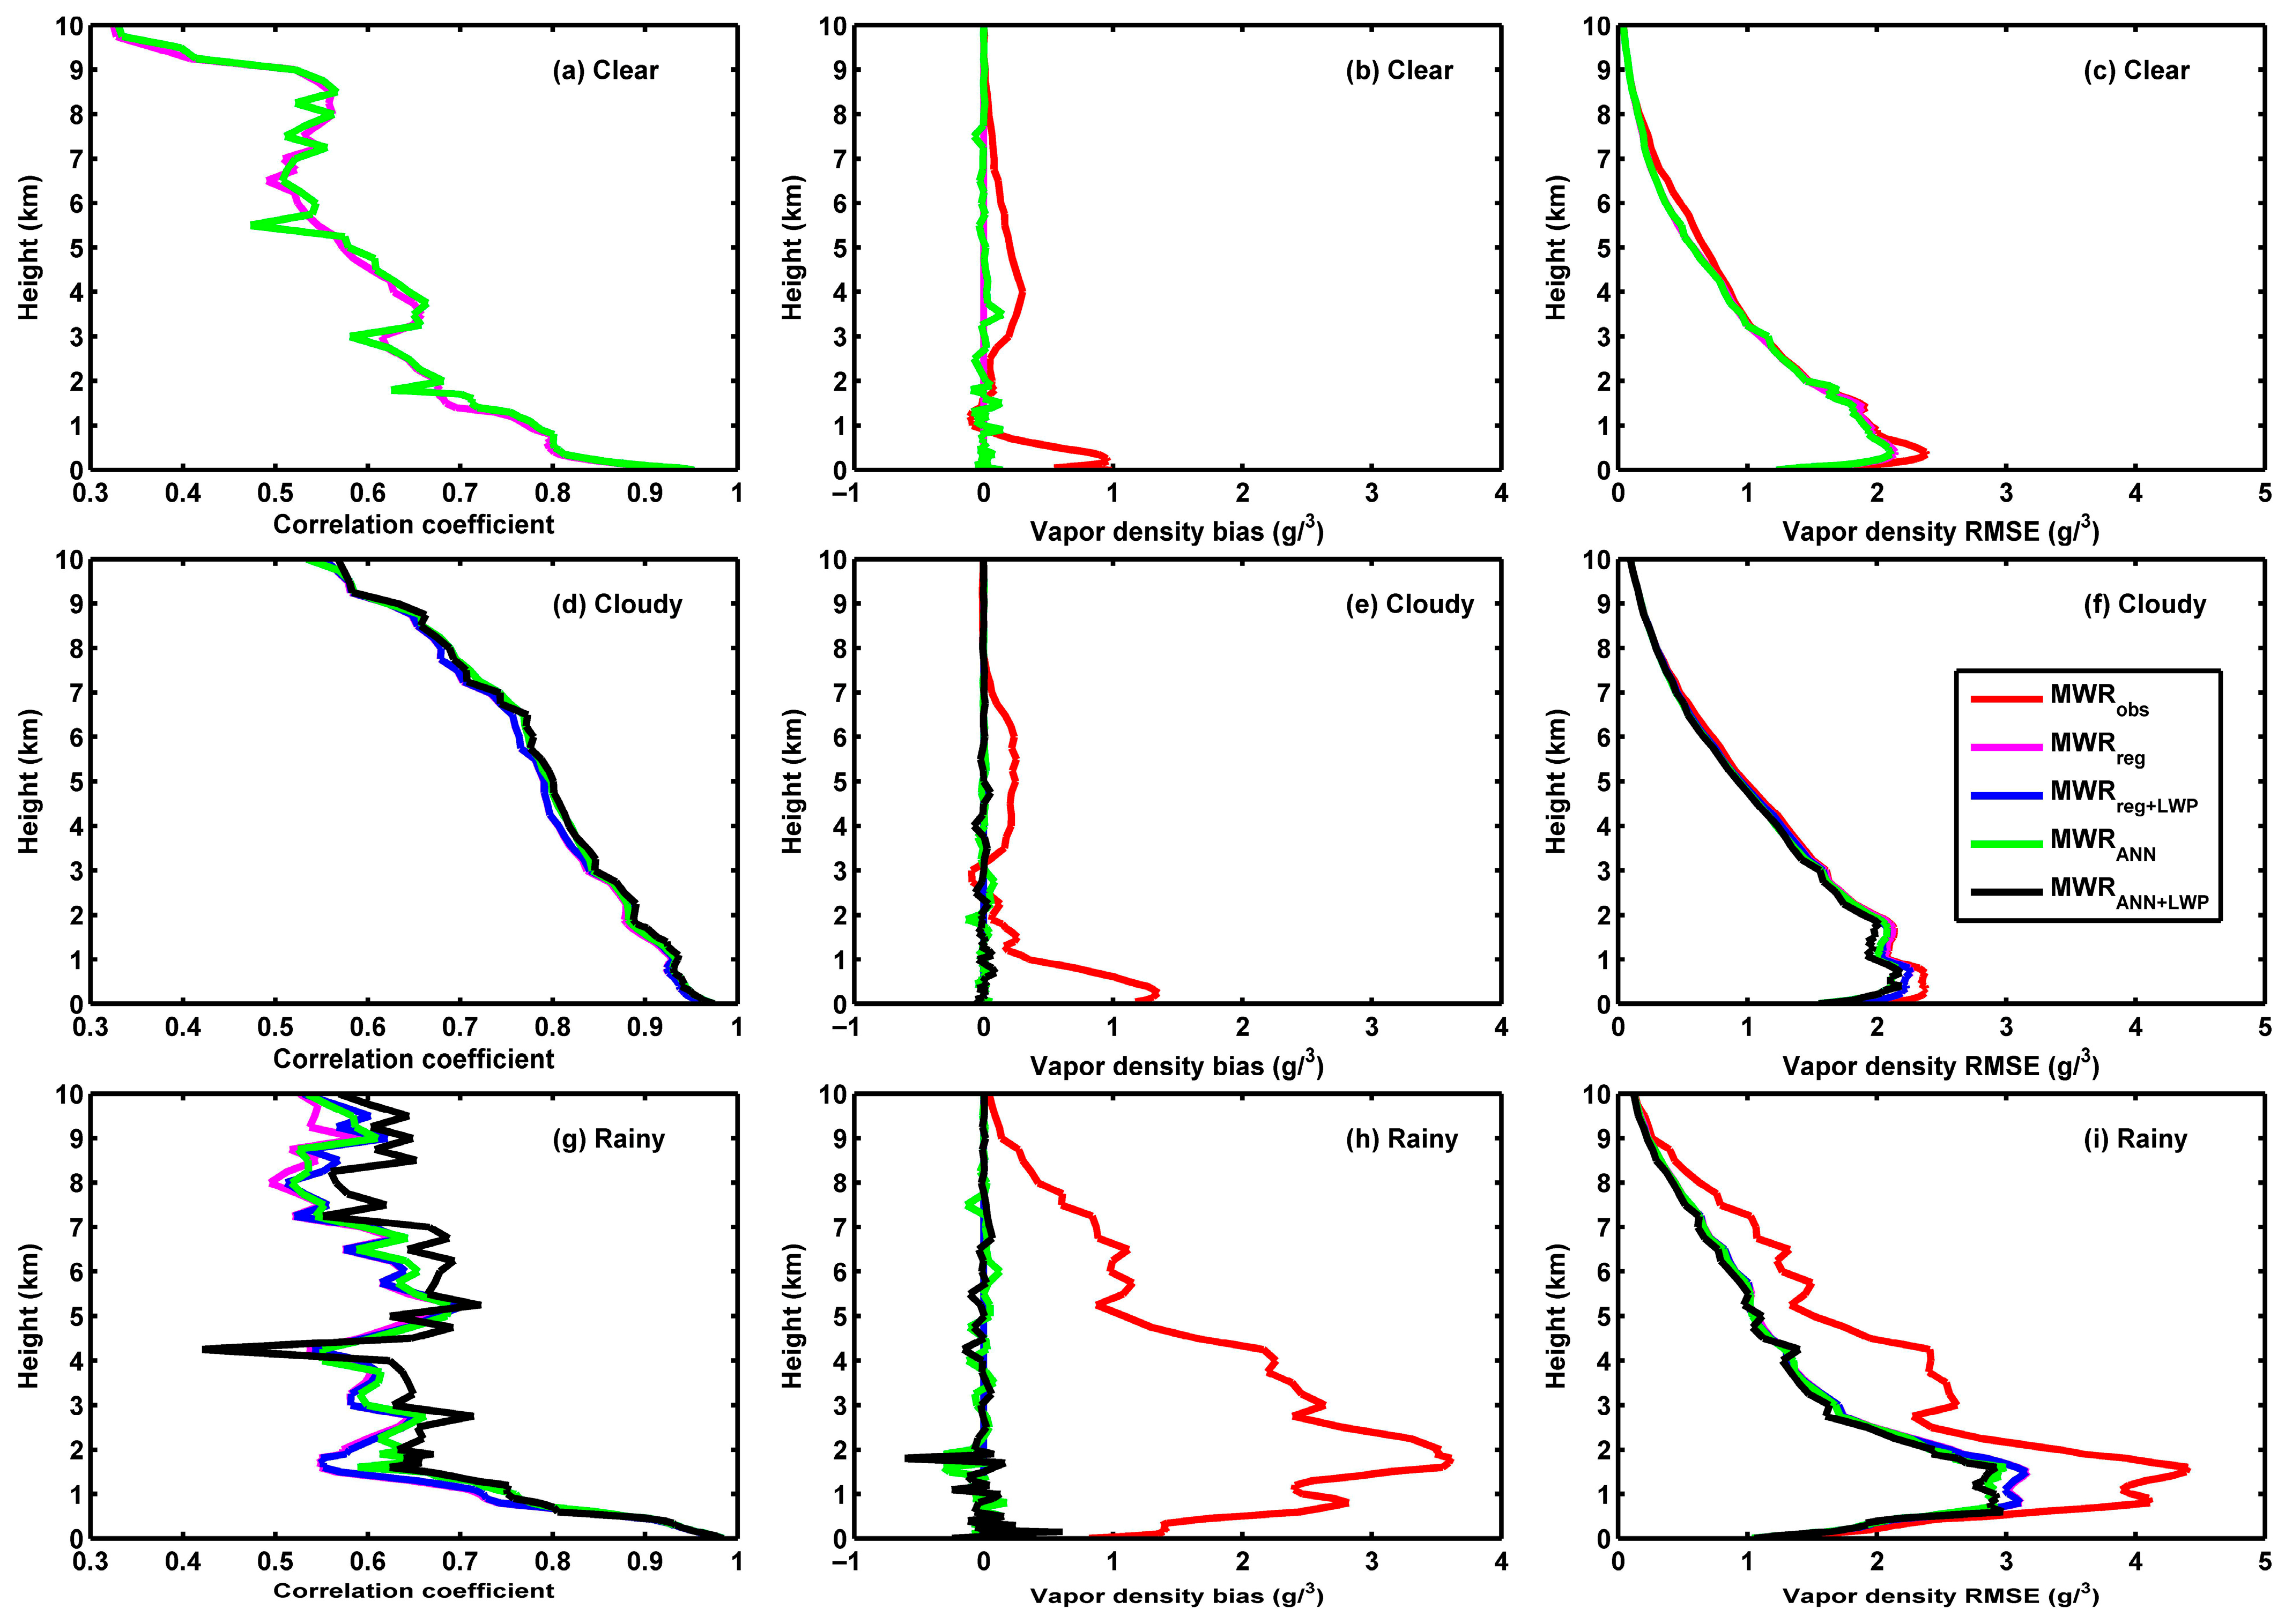
The performances of the ANN models for MWR vapor density are shown in Figure 9. In clear skies, the correction effect of MWRANN is almost the same as that of MWRreg, in which the correlation coefficient of MWR vapor density with radiosondes changes little after correction, but the MWR vapor density bias against radiosondes is reduced to around 0 g/m3 at all heights, and the MWR vapor density RMSE declines slightly at near-surface heights (Figure 9a–c); however, the stability of MWRANN is slightly inferior to that of MWRreg. In cloudy skies, MWRANN achieves the same correction effect as that in clear skies; in addition, there is no difference in the results of MWRANN and MWRANN+LWP (Figure 9d–f). In rainy skies, MWRANN can reduce the MWR vapor density bias to around 0 g/m3 at all heights, and improve the MWR vapor density RMSE at most heights, probably due to the marked decrease in the MWR vapor density bias at these heights, but makes little improvement in the correlation coefficient of MWR vapor density (Figure 9g–i); moreover, similarly to the case of MWR temperature, MWRANN+LWP achieves a slightly better performance than MWRANN in the correlation coefficient of MWR vapor density with radiosondes at some heights. Overall, the ANN model can reduce the system bias of MWR vapor density against radiosondes to around 0 g/m3 in diverse skies, and improve the MWR vapor density RMSE at most heights in rainy skies, but only at near-surface heights in clear and cloudy skies, while MWRANN+LWP makes few improvement compared to MWRANN.
Using the remaining 20% of samples, the correction effect of the two ANN models is validated and compared with the two regression models. As shown in Figure 10a–c, after correcting with MWRANN in clear skies, the MWR temperature bias against radiosondes is reduced to around 0 K at all heights, and the correlation coefficient of MWR temperature with radiosondes and the MWR temperature RMSE are better improved than MWRreg at 2–5 km, these results are consistent with those obtained from the training data. In cloudy and rainy skies, the correction effects of ANN models obtained from the testing data also are consistent with those obtained from the training data, although MWRANN+LWP achieves a relative poorer correlation coefficient and RMSE for MWR temperature at some heights in cloudy skies, indicating that the stability of the ANN model is slightly inferior to the regression model (Figure 10d–i). Table 4 shows that, on the whole, MWRANN can reduce the MWR temperature biases in clear, cloudy, and rainy skies from −2.5, −1.7, and 2.6 K to 0, 0, and 0.1 K, respectively, and, correspondingly, the MWR temperature RMSEs decline from 3.6, 3.0, and 4.1 K to 2.9, 2.7, and 3.6 K, with decrease percentages of 19%, 10%, and 12%, respectively. As MWRANN achieves a greater correlation coefficient for MWR temperature with radiosondes than MWRreg in clear skies (0.8474 vs. 0.8237), the decrease in the MWR temperature RMSE for MWRANN is also greater than that for MWRreg (19% vs. 14%). Additionally, the correction effect of MWRANN+LWP is similar to that of MWRANN in cloudy and rainy skies, and the MWR temperature RMSE in rainy skies declines from 4.1 K to 3.4 K, with a decrease greater than that of MWRANN (17% vs. 12%). These results indicate that the correction effect of the ANN model validated with the testing data is consistent with that obtained from the training data, demonstrating that the performance of the ANN model is robust for correcting MWR temperature deviations.
The correction effects of the two ANN models on MWR vapor density validated with the testing data are shown in Figure 11. It is found that MWRANN can reduce the MWR vapor density bias against radiosondes to around 0 g/m3 at all heights in diverse skies. After correcting with MWRANN, the MWR vapor density RMSE declines at most heights in rainy skies, but it declines slightly only at near-surface heights in clear and cloudy skies. However, MWRANN achieves a few improvements in the correlation coefficient of the MWR vapor density with radiosondes. Moreover, the difference in the correction effects of MWRANN+LWP and MWRANN is insignificant. As shown in Table 5, after correcting with MWRANN, the overall biases of the MWR vapor density in clear, cloudy, and rainy skies are reduced from 0.17, 0.37, and 1.76 g/m3 to −0.05, −0.02, and −0.03 g/m3, respectively, and, correspondingly, the MWR vapor density RMSEs decline from 1.17, 1.41, and 2.20 g/m3 to 1.08, 1.30, and 1.55 g/m3, with decrease percentages of 8%, 8%, and 30%, respectively; in addition, the result of MWRANN+LWP is almost the same as that of MWRANN in cloudy and rainy skies. Obviously, the correction effect of the ANN model validated with the testing data is consistent with that obtained from the training data, indicating that the performance of the ANN model is also robust for correcting MWR vapor density deviations.

4. Discussion

The MWR is a passive remote sensing instrument; its retrievals usually present deviations from radiosonde observations due to its hardware quality, retrieval method, and so on. Currently, the scattering and emission/absorption effects of raindrops are not included in the MWR retrieval method; hence, the deviation of MWR retrieval may exhibit different behaviors under different weather conditions [3,23,26,27]. According to the 9-year comparison between the MWR MP-3000A unit and radiosonde observations in this study, it is found that, due to solar heating, the MWR temperature is colder and the MWR vapor density is wetter than radiosondes in clear and cloudy skies; but, in rainy skies, due to the impact of raindrops, the MWR temperature becomes warmer than radiosondes, while the wet bias of the MWR vapor density becomes more significant. In India, using 7-month MWR observations from the same MP-3000A unit, Madhulatha et al. [15] found that the MWR temperature is warmer than radiosonde observations below 4 km but colder above 4 km, while the MWR vapor density is wetter than radiosonde observations below 2 km and close to the latter above 2 km. Since this comparison does not classify the samples into different sky conditions, in the study of Madhulatha et al. [15], the warm bias of the MWR temperature below 4 km is likely caused by the rainy samples, and the cold bias above 4 km is likely caused by the clear and cloudy samples, while the wet bias of the MWR vapor density is consistent with this study. In Beijing, China, based on a 12-month comparison between the MWR MP-3000A unit and radiosonde data, Wang et al. [24] indicated that the MWR temperature is colder than radiosonde observations at most profile heights in clear and cloudy skies, which is also consistent with this study. However, in the study by Wang et al. [24], the retrieval deviation for the MWR RPG-HATPRO unit differs partly from that of the MWR MP-3000A unit, and the comparison of brightness temperatures between these two MWR units also shows a difference [37]. This may be related to the difference in receiver technology systems. Although both the MWRs, MP-3000A and RPG-HATPRO, operate at 22–60 GHz, the MP-3000A MWR adopts superheterodyne local oscillator frequency modulation to obtain brightness temperatures on 22 channels in minutes, while the RPG-HATPRO MWR adopts multi-channel direct detection to obtain brightness temperatures on 14 channels in seconds, and this difference may cause the discrepancy in the observations of these two instruments [24,37]. Therefore, the deviation between MWR and radiosonde observations may also be related to different hardware and technical systems. In addition, the training model used local historical radiosonde data to characterize the climate of this region. Over time, the representativeness of historical radiosonde data, as well as the local climate, may change, which probably affects MWR retrieval deviations, and more studies are necessary to explore this issue.
Because of the existing difference between MWR and radiosonde observations, the correction of MWR retrieval deviation is critical for MWR applications, especially in rainy skies. As mentioned in the introduction, most researchers focus on correcting MWR retrievals in clear and cloudy skies more than in rainy skies; they firstly correct MWR brightness temperatures and then input the corrected brightness temperatures into an inversion model to recalculate MWR retrievals [30,31,32,33]. The results of this study show that both regression and ANN models can reduce the MWR temperature bias to around zero in diverse skies; meanwhile, the MWR temperature RMSE also decreases accordingly, and the correction effects of regression and ANN models on MWR vapor density is almost the same, except the decrease in MWR vapor density RMSE is insignificant in clear and cloudy skies. Using 6-month observations from an MWR (an Airda-HTG4 unit different from this study) and radiosonde in Beijing, China, Wu et al. [25] obtained a similar correction effect for a regression model on MWR temperature, but the correction effect on MWR vapor density is not reported. Li et al. [30,31] used the corrected brightness temperature to recalculate MWR retrievals, and the correction effects on MWR temperature and vapor density in clear and cloudy skies are close to this study, yet the results in rainy skies are not presented. In addition, based on the observations of a radiosonde and MWR (a MP-3000A unit, same as in this study) in Harbin, China, Zhao et al. [38] also firstly corrected the brightness temperature and then recalculated MWR retrievals; they found that the MWR temperature RMSE declines by 18.27% and 17.81% in clear and cloudy skies, respectively, and the MWR vapor density RMSE declines by 0.56% and 6.32%, accordingly. This study shows that the regression (ANN) model can reduce the MWR temperature RMSE by 14% (19%) and 7% (10%) in clear and cloudy skies, respectively, and, correspondingly, the decreases in MWR vapor density RMSE are 7% (8%) and 4% (8%). It can be seen that the different methods for correcting MWR retrievals have their own advantages.
Additionally, few studies focus on the correction of MWR retrievals in rainy skies. Foth et al. [29] suggested that the MWR measurements at elevation angles below 40° can be used to improve low-level temperature profiles during rain. Xu et al. [26] adopted an off-zenith method to reduce the impact of precipitation on MWR retrieval accuracy, and the MWR temperature bias (RMSE) in rainy skies declines by 64% (26%), while the MWR vapor density bias (RMSE) also declines by 75% (34%).This study shows that, in rainy skies, the regression and ANN models can reduce the MWR temperature bias (RMSE) by 100% (12%) and 96% (12%), respectively, while the MWR vapor density bias (RMSE) declines by 99% (29%) and 98% (30%), accordingly. Although the regression and ANN models are inferior to the off-zenith method in correcting the MWR retrieval RMSE, they are superior to the off-zenith method in correcting MWR retrieval bias, and this indicates the reasonable applicability of these two models in correcting MWR retrieval deviations in rainy skies. However, this study also shows that the correction effect on the correlation between MWR retrievals and radiosondes is limited. Therefore, there is remaining room for improvement in MWR retrieval accuracy; how to further reduce the deviation between MWR retrievals and radiosondes, especially in rainy skies, is still a topic worthy of research.

5. Conclusions

Based on the 9-year observations of a MWR and radiosonde in Wuhan, China, the deviations of MWR temperature and vapor density against radiosondes in diverse skies are evaluated. In clear and cloudy skies, due to the impact of solar heating on radiosonde sensors, the MWR temperature presents a cold bias against radiosondes and the cold bias generally increases with height, while the MWR vapor density presents a wet bias against radiosondes, and the wet bias is larger at lower heights but smaller at upper heights. In rainy skies, the impact of raindrops leads to the MWR temperature becoming warmer than radiosondes, and the wet bias of MWR vapor density becomes more significant, both of which increase first and then decrease with height. On the whole, the MWR temperature bias (RMSE) is −2.5 (4.2), −1.7 (3.4), and 2.5 (4.6) K in clear, cloudy, and rainy skies, respectively, and that for the MWR vapor density bias (RMSE) is 0.2 (1.5), 0.4 (1.7), and 1.7 (2.7) g/m3, respectively. Additionally, the biases of MWR temperature and vapor density have a better correlation with LWP than with rain rate.
Both the regression model and ANN methods are built up using MWR and radiosonde observations to assess the direct correcting effect on MWR retrievals with radiosondes. The results indicate that the regression model can reduce the system bias and RMSE between MWR temperature and radiosondes in diverse skies, but with little improvement on the correlation between MWR temperature and radiosondes. It is same for MWR vapor density, except that the improvement of the MWR vapor density RMSE is insignificant in clear and cloudy skies. After correcting using the regression model, the overall MWR temperature biases in clear, cloudy, and rainy skies are reduced from −2.5, −1.7, and 2.6 K to all 0 K, and the MWR temperature RMSEs decline by 14%, 7%, and 12%, respectively. Also, the overall MWR vapor density biases in clear, cloudy, and rainy skies are reduced from 0.17, 0.37, and 1.76 g/m3 to −0.05, −0.02, and 0.01 g/m3, respectively, and the MWR vapor density RMSEs correspondingly decline by 7%, 4%, and 29%. Note that adding LWP into the regression model as an input makes almost no difference, which may be because both MWR temperature and LWP depend on the original brightness temperature but are not completely independent.
The ANN model presents a similar performance to that of the regression model, with a stability slightly inferior to the latter. With correction of the ANN model, the overall MWR temperature biases in clear, cloudy, and rainy skies can be reduced from −2.5, −1.7, and 2.6 K to 0, 0, and 0.1 K, respectively, and the corresponding MWR temperature RMSEs decline by 19%, 10%, and 12%, accordingly. Moreover, the ANN model can reduce the overall biases of the MWR vapor density in clear, cloudy, and rainy skies from 0.17, 0.37, and 1.76 g/m3 to −0.05, −0.02, and −0.03 g/m3, respectively, and, correspondingly, the MWR vapor density RMSEs decline by 8%, 8%, and 30%. Similarly to the case of the regression model, adding LWP into the ANN model as an input achieves little improvement.
Since MWR retrievals are derived from brightness temperature observations in the training model, the deviation between MWR retrieval and radiosondes may be related to multiple influencing factors, such as the representativeness of historical radiosonde data, the retrieval method, and different hardware and technical systems. In addition, different methods for correcting MWR retrievals have their own advantages. However, few studies have reported on the correction of MWR retrieval deviations in rainy skies, and this study indicates that the regression model and ANN methods have a reasonable ability to correct MWR retrieval deviations in rainy skies. Even so, there is remaining room for improvement in MWR retrieval accuracy, especially in rainy skies; hence, how to further reduce the deviation between MWR and radiosonde observations is still a challenge.

Author Contributions

Conceptualization, G.X.; methodology, G.X.; software, G.X. and Y.T.; validation, G.X., Y.T. and J.Y.; formal analysis, G.X. and A.G.; investigation, G.X., Y.W. and W.Y.; resources, G.X. and J.Y.; data curation, G.X., Y.T. and J.Y.; writing—original draft preparation, G.X.; writing—review and editing, G.X.; visualization, G.X. and Y.T.; supervision, G.X., A.G., Y.W. and W.Y.; project administration, G.X., A.G., Y.W. and W.Y.; funding acquisition, G.X., A.G., Y.W. and W.Y. All authors have read and agreed to the published version of the manuscript.

Funding

This research was funded by the National Natural Science Foundation of China, grant number 42375139, the Open Foundation of the Key Laboratory of Urban Meteorology, China Meteorological Administration, Beijing, grant number LUM-2023-08, the Hubei Provincial Natural Science Foundation Meteorological Joint Fund Project, grant number 2024AFD205, and the Wuhan Meteorological Technology Joint Project, grant numbers 2024020901030453 and 2023020201010580.

Data Availability Statement

The data used in this study are available from the corresponding author upon reasonable request.

Acknowledgments

The authors are very grateful to the anonymous reviewers for their careful reading and comments that improved the flow and presentation of the manuscript.

Conflicts of Interest

The authors declare no conflicts of interest.

Abbreviations

The following abbreviations are used in this manuscript:
MWRMicrowave radiometer
LWCLiquid water content
IWVIntegrated water vapor
LWPLiquid water path
ANNArtificial neural network
IRTInfrared thermometer
CBHCloud base height
RMSERoot mean square error
MWRobsObserved MWR retrievals
MWRregMWR retrievals recalculated with regression model
MWRreg+LWPMWR retrievals recalculated with regression model, adding LWP as an input
MWRANNMWR retrievals recalculated with ANN model
MWRANN+LWPMWR retrievals recalculated with ANN model, adding LWP as an input

References

  1. Wang, J.; Rossow, W.B. Determination of cloud vertical structure from upper-air observations. J. Appl. Meteor. 1995, 34, 2243–2258. [Google Scholar] [CrossRef]
  2. Thorne, P.W.; Parker, D.E.; Christy, J.R.; Mears, C.A. Uncertainties in climate trends: Lessons from upper-air temperature records. Bull. Am. Meteor. Soc. 2005, 86, 1437–1442. [Google Scholar] [CrossRef]
  3. Illingworth, A.; Cimini, D.; Haefele, A.; Haeffelin, M.; Hervo, M.; Kotthaus, S.; Löhnert, U.; Martinet, P.; Mattis, I.; O’Connor, E.; et al. How can existing ground-based profiling instruments improve European weather forecast? Bull. Am. Meteor. Soc. 2019, 100, 605–619. [Google Scholar] [CrossRef]
  4. Tang, Y.; Xu, G.; Wan, R.; Wang, X.; Wang, J.; Li, P. Atmospheric thermal and dynamic vertical structures of summer hourly precipitation in Jiulong of the Tibetan Plateau. Atmosphere 2021, 12, 505. [Google Scholar] [CrossRef]
  5. Angell, J.K. Variations and trends in tropospheric and stratospheric global temperatures, 1958–1987. J. Clim. 1998, 1, 1296–1313. [Google Scholar] [CrossRef]
  6. Thompson, D.W.J.; Solomon, S. Recent stratospheric climate trends as evidenced in radiosonde data: Global structure and tropospheric linkages. J. Clim. 2005, 18, 4785–4794. [Google Scholar] [CrossRef]
  7. Kuo, Y.H.; Schreiner, W.S.; Wang, J.; Rossiter, D.L.; Zhang, Y. Comparison of GPS radio occultation soundings with radiosondes. Geophys. Res. Lett. 2005, 32, L05817. [Google Scholar] [CrossRef]
  8. Xu, G.; Yue, X.; Zhang, W.; Wan, X. Assessment of atmospheric wet profiles obtained from COSMIC radio occultation observations over China. Atmosphere 2017, 8, 208. [Google Scholar] [CrossRef]
  9. Xue, Q.; Guan, L.; Shi, X. One-dimensional variational retrieval of temperature and humidity profiles from the FY4A GIIRS. Adv. Atmos. Sci. 2022, 39, 471–486. [Google Scholar] [CrossRef]
  10. Cui, C.G.; Zhou, W.; Yang, H.; Wang, X.K.; Deng, Y.; Wang, X.F.; Xu, G.R.; Wang, J.Y. Analysis of the characteristics of the low-level jets in the middle reaches of the Yangtze River during the Mei-yu season. Adv. Atmos. Sci. 2023, 40, 711–724. [Google Scholar] [CrossRef]
  11. Ware, R.; Carpenter, R.; Güldner, J.; Liljegren, J.; Nehrkorn, T.; Solheim, F.; Vandenberghe, F. A multi-channel radiometric profiler of temperature, humidity and cloud liquid. Radio Sci. 2003, 38, 8079. [Google Scholar] [CrossRef]
  12. Westwater, E.R.; Crewell, S.; Mätzler, C. A review of surfaced-based microwave and millimeter-wave radiometric remote sensing of the Troposphere. Radio Sci. Bull. 2004, 310, 59–80. [Google Scholar] [CrossRef]
  13. Güldner, J.; Spänkuch, D. Remote sensing of the thermodynamic state of the atmospheric boundary layer by ground-based microwave radiometry. J. Atmos. Ocean. Technol. 2001, 18, 925–933. [Google Scholar] [CrossRef]
  14. Ware, R.; Cimini, D.; Campos, E.; Giuliani, G.; Albers, S.; Nelson, M.; Koch, S.E.; Joe, P.; Cober, S. Thermodynamic and liquid profiling during the 2010 Winter Olympics. Atmos. Res. 2013, 132–133, 278–290. [Google Scholar] [CrossRef]
  15. Madhulatha, A.; Rajeevan, M.; Ratnam, M.V.; Bhate, J.; Naidu, C.V. Nowcasting severe convective activity over southeast India using ground-based microwave radiometer observations. J. Geophys. Res. Atmos. 2013, 118, 1–13. [Google Scholar] [CrossRef]
  16. Cimini, D.; Nelson, M.; Güldner, J.; Ware, R. Forecast indices from a ground-based microwave radiometer for operational meteorology. Atmos. Meas. Technol. 2015, 8, 315–333. [Google Scholar] [CrossRef]
  17. Xu, G. A review of remote sensing of atmospheric profiles and cloud properties by ground-based microwave radiometers in central China. Remote Sens. 2024, 16, 966. [Google Scholar] [CrossRef]
  18. Zhou, X.; Zhang, C.; Li, Y.; Sun, J.; Chen, Z.; Li, L. Concurrence of temperature and humidity inversions in winter in Qingdao, China. Geophys. Res. Lett. 2024, 51, e2024GL108350. [Google Scholar] [CrossRef]
  19. Wei, J.; Shi, Y.; Ren, Y.; Li, Q.; Qiao, Z.; Cao, J.; Ayantobo, O.O.; Yin, J.; Wang, G. Application of ground-based microwave radiometer in retrieving meteorological characteristics of Tibet Plateau. Remote Sens. 2021, 13, 2527. [Google Scholar] [CrossRef]
  20. Wang, W.; Hocke, K. Atmospheric effects and precursors of rainfall over the Swiss Plateau. Remote Sens. 2022, 14, 2938. [Google Scholar] [CrossRef]
  21. Cheng, X.; Xu, X.; Bai, G.; Wang, R.; Ma, J.; Su, D.; Chen, B.; Ma, S.; Hu, C.; Zhang, S.; et al. Mobile observation field experiment of atmospheric vertical structure and its application in precipitation forecasts over the Tibetan Plateau. J. Geophys. Res. Atmos. 2024, 129, e2024JD042467. [Google Scholar] [CrossRef]
  22. Askne, J.I.H.; Westwater, E.R. A review of ground-based remote sensing of temperature and moisture by passive microwave radiometers. IEEE Trans. Geosci. Remote Sens. 1986, GE-24, 340–352. [Google Scholar] [CrossRef]
  23. Xu, G.; Xi, B.; Zhang, W.; Cui, C.; Dong, X.; Liu, Y.; Yan, G. Comparison of atmospheric profiles between microwave radiometer retrievals and radiosonde soundings. J. Geophys. Res. Atmos. 2015, 120, 10313–10323. [Google Scholar] [CrossRef]
  24. Wang, Z.; Zhang, X.; Mao, J.; Wang, Z. Comparison analysis on detection performance of ground-based microwave radiometers under different weather conditions. J. Appl. Meteorol. Sci. 2018, 29, 282–295. (In Chinese) [Google Scholar] [CrossRef]
  25. Wu, M.; Bao, Y.; Mao, J.; Zhang, H.; Li, W. Research on bias analysis and correction of temperature and humidity data with ground-based microwave radiometer. Torrential Rain Disasters 2023, 42, 467–478. (In Chinese) [Google Scholar] [CrossRef]
  26. Xu, G.; Ware, R.; Zhang, W.; Feng, G.; Liao, K.; Liu, Y. Effect of off-zenith observations on reducing the impact of precipitation on ground-based microwave radiometer measurement accuracy. Atmos. Res. 2014, 140–141, 85–94. [Google Scholar] [CrossRef]
  27. Chan, P.W. Performance and application of a multi-wavelength, ground-based microwave radiometer in intense convective weather. Meteorol. Z. 2009, 18, 253–265. [Google Scholar] [CrossRef]
  28. Chen, Y.; Yang, F.; Xu, G.; Li, D.; Yuan, Z.; Xiong, J. Comparative analysis of the zenith and off-zenith retrieved results from microwave radiometer in rain and snow weather conditions. Torrential Rain Disasters 2015, 34, 375–383. (In Chinese) [Google Scholar] [CrossRef]
  29. Foth, A.; Lochmann, M.; Garfias, P.S.; Kalesse-Los, H. Determination of low-level temperature profiles from microwave radiometer observations during rain. Atmos. Meas. Technol. 2024, 17, 7169–7181. [Google Scholar] [CrossRef]
  30. Li, Q.; Wei, M.; Wang, Z.; Chu, Y. Evaluation and improvement of the quality of ground-based microwave radiometer clear-sky data. Atmosphere 2021, 12, 435. [Google Scholar] [CrossRef]
  31. Li, Q.; Wei, M.; Wang, Z.; Jiang, S.; Chu, Y. Improving the retrieval of cloudy atmospheric profiles from brightness temperatures observed with a ground-based microwave radiometer. Atmosphere 2021, 12, 648. [Google Scholar] [CrossRef]
  32. Zhao, Y.; Zhou, D.; Yan, H. An improved retrieval method of atmospheric parameter profiles based on the BP neural network. Atmos. Res. 2018, 213, 389–397. [Google Scholar] [CrossRef]
  33. Zhao, Y.; Zhou, D.; Liu, C.; Wu, P.; Li, L.; Zhang, L.; Cheng, W. Numerical correction of atmospheric temperature profiles in clear and cloudy days. Atmos. Res. 2019, 217, 49–56. [Google Scholar] [CrossRef]
  34. Vömel, H.; Selkirk, H.; Miloshevich, L.; Valverde-Canossa, J.; Valdes, J.; Kyro, E.; Kivi, R.; Stolz, W.; Peng, G.; Diaz, J. Radiation dry bias of the Vaisala RS92 humidity sensor. J. Atmos. Ocean. Technol. 2007, 24, 953–963. [Google Scholar] [CrossRef]
  35. Yoneyama, K.; Fujita, M.; Sato, N.; Fujiwara, M.; Inai, Y.; Hasebe, F. Correction for radiation dry bias found in RS(@ radiosonde data during the MISMO field experiment. SOLA 2008, 4, 13–16. [Google Scholar] [CrossRef]
  36. Bian, J.; Chen, H.; Vömel, H.; Duan, Y.; Xuan, Y.; Lü, D. Intercomparison of humidity and temperature sensors: GTS1, Vaisala RS80, and CFH. Adv. Atmos. Sci. 2011, 28, 139–146. [Google Scholar] [CrossRef]
  37. Mao, J.; Zhang, X.; Wang, Z.; Yang, R.; Pan, X.; Ji, C.; Guo, R. Comparison of brightness temperature of multi-type ground-based microwave radiometers. J. Appl. Meteorol. Sci. 2018, 29, 724–736. (In Chinese) [Google Scholar] [CrossRef]
  38. Zhao, Y.; Yan, H.; Wu, P.; Zhou, D. Linear correction method for improved atmospheric vertical profile retrieval based on ground-based microwave radiometer. Atmos. Res. 2020, 232, 104678. [Google Scholar] [CrossRef]
Figure 1. Data regroup scheme for selecting training data of model and testing data of validation.
Remotesensing 17 03819 g001
Figure 2. Scatter plots of temperature (top) and vapor density (bottom) between MWR and radiosonde in clear (left), cloudy (middle), and rainy (right) sky conditions.
Remotesensing 17 03819 g002
Figure 3. The deviations of MWR temperature (top) and vapor density (bottom) from radiosonde observations at 58 profile heights of MWR in clear (left), cloudy (middle), and rainy (right) sky conditions.
Remotesensing 17 03819 g003
Figure 4. The correlation coefficient (left), bias (middle), and RMSE (left) between MWR temperature and radiosonde observations in clear (top), cloudy (middle), and rainy (bottom) skies, based on the samples for building up the regression models. MWRobs represents the MWR observation, while MWRreg and MWRreg+LWP represent the MWR retrieval obtained using the regression models of Equations (1) and (2), respectively. The modeling sample sizes in clear, cloudy, and rainy skies are 856, 2344, and 333, respectively.
Remotesensing 17 03819 g004
Figure 5. Same as Figure 4, but for vapor density.
Remotesensing 17 03819 g005
Figure 6. The correlation coefficient (left), bias (middle), and RMSE (left) between MWR temperature and radiosonde observation in clear (top), cloudy (middle), and rainy (bottom) skies, based on the samples for validating the regression models. MWRobs, MWRreg, and MWRreg+LWP are the same as in Figure 4. The validation sample sizes in clear, cloudy, and rainy skies are 214, 586, and 83, respectively.
Remotesensing 17 03819 g006
Figure 7. Same as Figure 6, but for vapor density.
Remotesensing 17 03819 g007
Figure 8. The correlation coefficient (left), bias (middle), and RMSE (left) between MWR temperature and radiosonde observation in clear (top), cloudy (middle), and rainy (bottom) skies, based on the samples used for building up the ANN models. MWRobs, MWRreg, and MWRreg+LWP are the same as Figure 4, while MWRANN and MWRANN+LWP represent the MWR retrieval obtained by the ANN models of Equations (3) and (4), respectively. The sample sizes in clear, cloudy, and rainy skies are 856, 2344, and 333, respectively.
Remotesensing 17 03819 g008
Figure 9. Same as Figure 8, but for vapor density.
Remotesensing 17 03819 g009
Figure 10. The correlation coefficient (left), bias (middle), and RMSE (left) between MWR temperature and radiosonde observations in clear (top), cloudy (middle), and rainy (bottom) skies based on the samples for validating the ANN models. MWRobs, MWRreg, and MWRreg+LWP, as well as MWRANN and MWRANN+LWP, are the same as in Figure 8. The validation sample sizes in clear, cloudy, and rainy skies are 214, 586, and 83, respectively.
Remotesensing 17 03819 g010
Figure 11. Same as Figure 10, but for vapor density.
Remotesensing 17 03819 g011
Table 1. The correlation coefficient and its confidence level between MWR retrieval deviation from radiosonde observation and the past 1 h precipitation, as well as LWP.
Analysis Parameters 1Sky ConditionsSample NumberCorrelation CoefficientConfidence Level
Tbias vs. R1rainy4160.2016>99%
TRMSE vs. R1rainy4160.021734%
VDbias vs. R1rainy4160.3183>99%
VDRMSE vs. R1rainy4160.2910>99%
Tbias vs. LWPrainy4160.4412>99%
TRMSE vs. LWPrainy4160.1910>99%
VDbias vs. LWPrainy4160.4914>99%
VDRMSE vs. LWPrainy4160.3392>99%
Tbias vs. LWPcloudy29300.2139>99%
TRMSE vs. LWPcloudy2930−0.012349%
VDbias vs. LWPcloudy29300.2031>99%
VDRMSE vs. LWPcloudy29300.0548>99%
1 In the analysis parameters, the Tbias and TRMSE represent the bias and RMSE of MWR temperature from radiosonde observations, respectively, while the VDbias and VDRMSE represent the bias and RMSE of MWR vapor density from radiosonde observations, respectively; R1 represents the precipitation in the past 1 h and LWP represents the cloud liquid water path.
Table 2. The mean correlation coefficient (R), bias, and RMSE between MWR temperature and radiosonde observations obtained from Figure 6.
Sky ConditionsTemperature DatasetSample SizeRBias (K)RMSE (K)
ClearMWRobs2140.8237−2.53.6
ClearMWRreg2140.823703.1
CloudyMWRobs5860.9192−1.73.0
CloudyMWRreg5860.919202.8
CloudyMWRreg+LWP5860.9136−0.12.8
RainyMWRobs830.78222.64.1
RainyMWRreg830.782203.6
RainyMWRreg+LWP830.791503.6
Table 3. The mean correlation coefficient (R), bias, and RMSE between MWR vapor density and radiosonde observations obtained from Figure 7.
Sky ConditionsVapor Density DatasetSample SizeRBias (g/m3)RMSE (g/m3)
ClearMWRobs2140.63550.171.17
ClearMWRreg2140.6355−0.051.09
CloudyMWRobs5860.81250.371.41
CloudyMWRreg5860.8125−0.021.35
CloudyMWRreg+LWP5860.8146−0.021.36
RainyMWRobs830.66311.762.20
RainyMWRreg830.66310.011.56
RainyMWRreg+LWP830.66730.011.57
Table 4. The mean correlation coefficient (R), bias, and RMSE between MWR temperature and radiosonde observation obtained from Figure 10.
Sky ConditionsTemperature DatasetSample SizeRBias (K)RMSE (K)
ClearMWRobs2140.8237−2.53.6
ClearMWRreg2140.823703.1
ClearMWRANN2140.847402.9
CloudyMWRobs5860.9192−1.73.0
CloudyMWRreg5860.919202.8
CloudyMWRreg+LWP5860.9136−0.12.8
CloudyMWRANN5860.926702.7
CloudyMWRANN+LWP5860.917502.8
RainyMWRobs830.78222.64.1
RainyMWRreg830.782203.6
RainyMWRreg+LWP830.791503.6
RainyMWRANN830.79310.13.6
RainyMWRANN+LWP830.8111−0.13.4
Table 5. The mean correlation coefficient (R), bias, and RMSE between MWR vapor density and radiosonde observations obtained from Figure 11.
Sky ConditionsVapor Density DatasetSample SizeRBias (g/m3)RMSE (g/m3)
ClearMWRobs2140.63550.171.17
ClearMWRreg2140.6355−0.051.09
ClearMWRANN2140.6415−0.051.08
CloudyMWRobs5860.81250.371.41
CloudyMWRreg5860.8125−0.021.35
CloudyMWRreg+LWP5860.8146−0.021.36
CloudyMWRANN5860.8172−0.021.30
CloudyMWRANN+LWP5860.8155−0.011.33
RainyMWRobs830.66311.762.20
RainyMWRreg830.66310.011.56
RainyMWRreg+LWP830.66730.011.57
RainyMWRANN830.6701−0.031.55
RainyMWRANN+LWP830.6772−0.031.54
Disclaimer/Publisher’s Note: The statements, opinions and data contained in all publications are solely those of the individual author(s) and contributor(s) and not of MDPI and/or the editor(s). MDPI and/or the editor(s) disclaim responsibility for any injury to people or property resulting from any ideas, methods, instructions or products referred to in the content.