Article

Next-Generation C-Band SAR Mission: Design Concept for Earth Observation Service Continuity

1
C-CORE, Ottawa, ON K2K 2A4, Canada
2
C-CORE, St. John’s, NL A1B 3X5, Canada
3
Airbus Defence and Space GmbH, Claude-Dornier-Straße, 88090 Immenstaad am Bodensee, Germany
4
AstroCom Associates Inc., Ottawa, ON K2H 8C4, Canada
*
Author to whom correspondence should be addressed.
Remote Sens. 2025, 17(22), 3761; https://doi.org/10.3390/rs17223761
Submission received: 16 October 2025 / Revised: 14 November 2025 / Accepted: 17 November 2025 / Published: 19 November 2025
(This article belongs to the Section Environmental Remote Sensing)

Highlights

What are the main findings?
  • The study identified and evaluated two design configurations for a next-generation Canadian C-band SAR mission: (i) a three-medium-satellite constellation and (ii) a five-large-satellite system meeting user needs and demonstrating technical and programmatic feasibility, balancing performance based on innovative capabilities, cost, and minimizing risk.
  • Performance simulations confirmed that high-resolution, wide-swath imaging with full polarimetric capabilities can achieve revisit times below six hours over Canadian areas of interest, ensuring continuity of Canadian EO services for environmental monitoring, maritime surveillance, and national security applications.
What are the implications of the main findings?
  • The systematic analysis of harmonized user needs represents a methodological advance, highlighting the necessity of scalable architectures, cost modelling, and coordinated planning for long-term EO service delivery.
  • The proposed SAR mission architecture provides a strategic pathway for Canada’s EO continuity until 2050 and beyond, supporting adaptive mission scaling and facilitating integration of future satellite technologies.

Abstract

This paper presents the findings related to the design solution options for a next-generation C-band Synthetic Aperture Radar (SAR) mission, developed to address the Harmonized User Needs (HUN) in Earth observation (EO) data as defined by several departments of the Government of Canada. The work analyses various mission solution options, including multi-satellite constellations, and their performance to evaluate feasibility and assess their compliance with the HUN as well as minimize the associated lifecycle costs, technical risks, implementation schedule, and programmatic challenges. This mission concept contributes to the advancement of space-based surveillance solutions aligned with Canada’s long-term strategic objectives to ensure service continuity for Earth Observation and national security applications. Systematic user needs analysis helped to reveal the importance of high-resolution (1–5 m), enhanced interferometric, polarimetric SAR interferometry (PolInSAR) and other capabilities. Two satellite constellation configurations are proposed: (1) a three-medium-satellite setup with a tandem pair, and (2) a five-large-satellite system incorporating tandem and optimal orbits. Employing High-Resolution Wide Swath (HRWS) imaging modes and full polarimetric capability. Performance simulations indicate low Noise Equivalent Sigma Zero (NESZ) with wide swath width fully addresses driving needs for sea ice and ocean monitoring, covering most of the Canadian areas of interest, with the revisit time of less than 4–6 hours. Orbit optimization ensures high revisit rates, enabling novel interferometric SAR (InSAR) capabilities with observations separated by only a few hours. This mission concept, considering two options with three medium and with five large satellites, respectively, offers a flexible, scalable, and strategically impactful solution for Earth Observation (EO) service continuity and technological leadership for Canada until 2050 and beyond.

1. Introduction

1.1. SAR Satellite Missions

Synthetic Aperture Radar (SAR) satellite technology is currently established as a basic source of information for various Earth observation applications and scientific and applied research. The main objectives of early SAR satellite missions and experiments, such as SEASAT (1978) [1], Shuttle Imaging Radar (SIR)-A (1981) [2], SIR-B (1984) [3] were proof of concept and demonstrations of sensor monitoring capabilities, as well as to provide SAR imagery to the user community for further studies and evaluations.
Many historic SAR missions are listed in [4] with respect to SAR applications. A comprehensive list of SAR missions (launched before 2020), including satellite mass and SAR characteristics, is provided in [5]. In the 1990s, the development of the following SAR missions, starting from ERS-1 (European Remote-Sensing Satellite-1) (1991) and JERS-1 (Japan Earth Resources Satellite-1) (1992), continuously demonstrated new achievements in performance and operational capabilities for space and ground segments. Improvements in data quality and availability allowed regular monitoring of the land [6] and ocean [7,8,9,10] on a global scale. Numerous SAR applications reviewed in [4,11] for EO and object detection were initially demonstrated or developed with the ERS-1/2, JERS-1, and RADARSAT-1 (RADARSAT is an official trademark of the Canadian Space Agency (CSA)) missions. The RADARSAT-1 (1995) satellite provided high-resolution imagery and various beam modes, contributing to the development of important operational SAR applications for Canada [12]. Satellite repeat-pass interferometric SAR (InSAR) technology was demonstrated for topographic mapping [13] and various applications, including forest [14,15], flood [16] and farmland [17] monitoring. The simultaneous operation of ERS-1 and ERS-2 over a period of several months enabled tandem operation to reduce the time interval up to one day between InSAR pair acquisitions to improve InSAR coherence, which is important for different areas of the geosciences [6,18]. ERS-1/2, Envisat, and RADARSAT-1 provided Doppler centroid measurements from C-band SAR data, enabling ocean surface velocity retrieval [19,20,21].
Since 2000, several SAR satellite missions have demonstrated new technological advancements, including the following:
  • The Shuttle Radar Topography Mission (SRTM) [22] with a single-pass SAR interferometer employing two cross-track and one along-track antennas, enabled topographic maps of over 80% of Earth’s landmass and a demonstration of ocean current retrievals from satellite InSAR data [23];
  • Envisat satellite (2002) had 10 instruments together, including the ASAR (Advanced Synthetic Aperture Radar), which ensured long-term continuity of data after ERS-2 with enhanced capability in terms of coverage, range of incidence angles, polarization, and modes of operation [24];
  • RADARSAT-2 demonstrated the state-of-the-art capabilities in full polarimetric, stereo-radargrammetric [25], PolInSAR tomography, Ground Moving Target Indicator (GMTI) [26], and other science and operational applications.
  • TanDEM-X and TerraSAR-X satellite formation achieved their primary objectives in the generation of a global Digital Elevation Model (DEM) with high (2 m) accuracy and proved concepts [27] for a wide range of commercial and scientific applications with its unique capabilities, including along-track interferometry and new bistatic and multistatic SAR techniques [28].
  • COSMO-SkyMed and COSMO-SkyMed Seconda Generazione (CSG) satellites provide outstanding characteristics in terms of temporal, spatial, and radiometric resolution for both civilian and military applications [29]. For example, each CSG satellite is capable of simultaneously acquiring two images in DI2S Spotlight Multi-Swath (MS) mode [30] to serve two requests.
  • The Advanced Land Observing Satellites (ALOS) series evolved from ALOS-1 (Daichi), launched in 2006 with an L-band SAR sensor PALSAR, to ALOS-2, launched in 2014, with enhanced SAR capabilities, improved resolution, and a wider observation swath [31]. The ALOS-4, launched in 2024, advances these capabilities with a next-generation phased-array L-band SAR [32], enabling higher-resolution and more frequent Earth observations for applications such as disaster monitoring and environmental studies.
  • Sentinel-1: systematic global acquisition allowing the generation of different applications and value-added products from the same data take [33]. Its open data policy further promotes and supports both operational services and scientific research.
  • The RADARSAT Constellation Mission (RCM) is a Canadian three-C-band SAR satellite system that provides enhanced coverage, higher revisit rates for 4-day InSAR revisit, and compact polarimetric applications.
  • NovaSAR is a small SAR satellite operating in the S-band with optimized imaging modes for various environmental and security needs to support various applications such as maritime surveillance, flood monitoring, and disaster response.
  • HISEA-1 C-band SAR microsatellite [34] introduced innovation in ocean and coastal remote sensing with high-resolution and high-revisit imaging capabilities.
  • Gaofen-3 (GF-3) is a Chinese C-band SAR satellite, launched in 2016, that operates in multi-polarization modes and provides a high-resolution imaging capability supporting a large number of applications [35].
  • Argentinian SAOCOM mission with advanced L-band SAR capabilities demonstrated great achievements in improved agricultural monitoring, disaster management, and hydrological studies.
New Space SAR constellations, operated by private companies and startups, focus on cost-effective, high-revisit, and high-resolution imaging using small satellites and innovative technologies. Companies such as ICEYE, Capella Space, Umbra, and others are deploying constellations of SAR satellites, providing near-real-time Earth observation for applications such as disaster response, infrastructure monitoring, and environmental surveillance [36].
There were two advanced SAR mission launches in 2025: NISAR and BIOMASS. NISAR (NASA-ISRO Synthetic Aperture Radar) is a mission jointly developed by NASA and ISRO. It is designed to use dual-band L- and S-band SAR for monitoring of global environmental changes, supporting many applications [37], such as ice-sheet dynamics, forest biomass estimation, earthquake and landslide detection, and agricultural monitoring, and contributing to climate and disaster studies. BIOMASS is an ESA Earth Explorer mission that uses P-band SAR methods, including polarimetric interferometry (Pol-InSAR) and SAR tomography, to map global forest biomass with unprecedented accuracy, supporting climate change research and multiple secondary objectives [38].
It is also important to mention not yet approved SAR missions that underwent advanced concept studies. The TanDEM-L mission was a proposed German SAR satellite mission by the German Aerospace Center (DLR) based on the use of L-band interferometric SAR to generate high-resolution products with unprecedented high data quality [39,40,41]. Its potential applications include forest biomass estimation, surface deformation monitoring, and glacier dynamics, contributing to climate research and environmental monitoring. The results of the Phase A study for the high-resolution wide-swath (HRWS) mission with three MirrorSAR satellites [42] advanced the interferometric and multi-static SAR mission concept to generate a highly accurate global DEM and address various applications, including those that require very high resolution, 3D mapping, and wide area coverage.

1.2. Advances in SAR Satellite Technologies

Incorporating the latest SAR satellite technologies into mission concept design is basically to ensure that the mission provides advanced performance and remains relevant and competitive over its operation. Evaluating current missions and technologies helps identify gaps where existing systems fail to meet evolving user needs. These gaps may include limitations in spatial resolution, revisit frequency, or data quality.
An overview of the latest SAR satellite developments [43] highlighted new technologies and progress in digital beamforming in azimuth and elevation, bistatic and multi-static mission concepts. The trend for future (next-generation) SAR missions and user requirements shows [43] the need for improved resolution (1–5 m), while maintaining a large swath width and long duty cycle, as well as polarimetric SAR interferometry (PolInSAR) and tomographic SAR (TomoSAR). Advanced SAR mission concepts, such as HRWS with the MirrorSAR satellites [42,44] and TanDEM-L [39,41], highlighted significant advances to enhance the content of SAR information products for numerous existing and emerging applications. Several SAR mission design concepts were analyzed [45] to address defense needs in the shortest revisit, various coverage capabilities, resolution, and image quality, considering factors such as the number of satellites, varying orbital inclinations, antenna types, and other relevant aspects. The study concluded that the optimal solution in terms of mission performance lies in combining multiple technologies. Outputs of concept studies for SAR missions may include a description of mission objectives and science requirements [46], space segment (including simulations of SAR instrument performance [47]), mission concept [48], operational scenarios [49], coverage [50] and orbit performance analysis [51]. The above capabilities are becoming foundational to next-generation SAR architectures. Please refer also to a recent review of Hu et al. [52] on specific details of many emerging trends in spaceborne SAR systems and applications.

1.3. User Needs and Requirements

Designing SAR satellite missions requires balancing technical feasibility with user needs and requirements satisfaction, while ensuring efficiency in both cost and schedule of the mission development. Since the early days of SAR missions, starting with SEASAT [53], users have played an important role in the process of identification of needs and definition of requirements. Various user working groups, mission advisory panels, consortia, forums, and workshops of stakeholders, scientists, and subject matter experts typically contribute to this process [54]. In order to formalize the analysis of user expectations and to support consistency in mission design and development processes, we provide definitions of key terms, which may actually differ depending on the subject area (e.g., [55,56,57]), and moreover have methodological distinctions between requirements engineering and user needs analysis [58]. The following definitions are provided from a System Engineering prospective perspective [56,59] with examples that can be applied to the EO SAR mission/system case:
User—“individual or group that interacts with a system or benefits from a system during its utilization.” In our context, it can be formulated as: user is an individual, government organization, or other entity that obtains and applies SAR data, derived information products, or services. In the system life cycle processes standard [60], users are included in a broader term of stakeholders, defined as “users, operators, supporters, developers, producers, trainers, maintainers, disposers, acquirers and supplier organizations, parties responsible for external interfacing entities, regulatory bodies, and others who have a legitimate interest in the system solution.”
User need—“prerequisite identified as necessary for a user, or a set of users, to achieve an intended outcome, implied or stated within a specific context of use.” Stakeholder needs [61] are generally expressed as statements like “here is what I want done.”
User requirements are requirements (specifications) for use that provide the basis for design and evaluation of systems to meet identified user needs. A stakeholder requirement shall state the subject of the requirement (e.g., the system), and what shall be performed [61] or a constraint on the system [62], considering ‘what’ is needed, not ‘how’. This allows initial stakeholder needs and requirements to be flexible enough to accommodate trade studies, avoiding various constraints that may influence the iterative design and system requirements definition processes during the system development phases [61,62,63]. With respect to a satellite mission [64], requirement “specifies a critical condition, parameter, or capability that shall be fulfilled to achieve the mission aim and objectives.”
Observation requirement is a requirement related to an observable (the quantity targeted by the observing system, i.e., a biogeochemical or a geophysical parameter), an observation, which is the process of quantification of an observable through measurements by an observing system, or observation data (produced by the observing system). A user or observation requirement can be expressed by users in either a specific thematic domain or a cross-domain [65,66]. It can be highly technically detailed, corresponding to a specific observation need, product need, service need, or be generic. An observation (variable, parameter) corresponds mostly to Level 0 (L0), L1, and L2 products according to the Committee on Earth Observing Satellites (CEOS) hierarchy [67]. In the case of EO services (e.g., Copernicus of the European Union (EU)), a product may correspond to a higher level (L4 mostly, L3 in some cases, output of assimilation/modeling) of geophysical products. Product requirements often align with the outputs of Copernicus services, but are not limited to them. They may also include products from the downstream sector and other stakeholders.
Requirements from users are collected through regular user surveys and can be gathered in a user requirement database. Identifying technological opportunities for new missions and capabilities is important for addressing information gaps to meet new or evolving user needs [68]. International organizations, such as the World Meteorological Organization (WMO) and the European Commission (EC), have established extensive databases that catalog hundreds of user and observational requirements relevant to space-based monitoring [65,66,69,70,71], used for the development and exploitation of satellite systems.
An iterative development of SAR mission objectives typically includes gathering, defining, and analyzing stakeholder needs and observation requirements, priorities, current and future gaps, and trade-off analyses. For example, the process of collecting the observation requirements to derive the baseline observation scenarios for Sentinel-1 involved five main user groups [33,72], including Copernicus services and use (including EU Agencies), National services from EU Member States, scientists and existing projects, international initiatives (including request and cooperation), commercial (e.g., EARSC), and other uses. Copernicus itself is a user- and policy-driven program and involves various users, including European Union institutions and bodies, European, national, regional, or local authorities, research entities, the private sector, non-governmental, and international organizations, particularly regarding the definition and validation of Copernicus service requirements [73].

1.4. SAR Mission Conceptual Designs

The conceptual design of a SAR mission is guided by clearly defined mission objectives and user needs, which the mission must satisfy through the system integration of space, ground, and launch segments [74]. The conceptual design of a SAR mission represents and provides preliminary information on these segments and includes an initial definition of mission requirements, the concept of operations, a feasibility study, trade-off analyses, estimates of mission cost, schedule, and risks. Based on multiple inputs from stakeholders, the initial conceptual design, comprising a spectrum of mission ideas and options, is developed during Phase 0: Mission Definition (Canadian Space Agency (CSA)), also called Mission Analysis and Identification (ESA) or Pre-Phase A: Concept Studies (National Aeronautics and Space Administration (NASA) [75]). The developed mission concepts will support subsequent detailed design, mission development, and operations. This phase produces a range of mission ideas and solution options, which serve as a foundation for the subsequent stages of detailed design, development, and operational planning.
The goal of this paper is to present the conceptual design of a next-generation C-band SAR mission aimed at ensuring the continuity of EO services in support of Canadian government services.
The work is organized as follows: Section 2 presents the analysis methods relevant to user needs, along with key definitions, SAR performance assessment, and programmatic considerations. Section 3 provides the results of a comprehensive analysis of the Harmonized User Needs and the conceptual design of the SAR mission, including descriptions of the space and ground segments, SAR performance simulations for resolution, swath, and NESZ (Section 3.2.3), as well as coverage frequency and revisit time analysis (Section 3.2.6). Mission cost, risks, and schedule are analyzed in Section 3.3. Section 4 discusses the key findings and their implications for mission design, and Section 5 presents the main conclusions of the study.

2. Methods

2.1. User Needs Analysis

The Harmonized User Needs (HUN) [76,77] for Earth observation data, as defined by the Government of Canada (GC), represent a set of needs and requirements intended to guide the development of future space-based solutions and ensure C-band SAR data continuity for existing and emerging services. HUN analysis can be performed using a systems engineering approach consisting of defining SAR observation requirements corresponding to each user's needs. Then, subsequent statistical analysis can be quantitatively applied to the requirements to rank and cluster the required SAR capabilities by calculating relative frequency and percentage (number of times a SAR capability occurs). Qualitative analysis of user needs includes compliance evaluation and identification of relationships between different SAR capabilities with user satisfaction. It also includes reviewing relevant research publications and gathering user responses and insights to evaluate the state-of-the-art performance of a particular SAR technology. Identification of driving user needs can be performed by their impact, priority, or operational maturity. Natural Language Processing (NLP) offers powerful tools [78] for various applications, where large volumes of qualitative text-based data (such as documents, databases, feedback [79], reviews, and survey responses) can be interpreted, visualized, and transformed into quantitative information.
The information in the HUN includes user needs (on specific measurements as specified by GC departments to provide their services) and observation requirements, which provide details specific to sensors. The measurements represent physical quantities derived from geophysical, biological, or other phenomena or objects, and are obtained through the interaction and emission of electromagnetic (EM) waves with various media. While other types of satellite missions (e.g., based on gravity measurements) exist, they are not currently included within the scope of the HUN.

2.2. SAR Performance Analysis

The main limitation of a conventional SAR (e.g., ERS, Envisat) is to provide a wide swath at the expense of a degraded resolution. A high-resolution wide swath (HWRS) SAR system concept with high azimuth resolution, improved swath width, and continuous coverage in Stripmap mode was introduced by Suess, Grafmueller, and Zahn [80]. This SAR system was based on using multi-apertures for multiple beam forming and an adaptive time frequency variant processing to maximize the radar echo signal power. The digital beam forming (DBF) strategy for HRWS SAR was described in [81]. This publication also summarizes previous works on HRWS in chronological order and recalls the basic properties of Muli Aperture SAR (MA-SAR) signals regarding spatial sampling. The described DBF on receive technique employs advanced signal processing techniques, resulting in efficient suppression of ambiguous energies at low pulse repetition frequency (PRF) range (1100–1600 Hz). The simulation parameters, including antenna size, power, and other relevant specifications used for performance analysis, are provided in Section 3.2.3 and Section 3.2.5.
The performance of staggered SAR was discussed, and the impact of staggered SAR operation on image quality is, furthermore, assessed with experiments using real (F-SAR airborne and TerraSAR-X) data [82]. Measurements on these data show very good agreement with predictions from simulations. Staggered SAR was considered as the baseline acquisition mode for the Tandem-L mission with HRWS imaging capability (3–4 m [range] and 7 m [azimuth] resolution with a 350 km swath) [39].
A novel multimodal multiple-input multiple-output (MIMO) SAR concept was described in [83]. The proposed system uses orthogonal frequency division multiplexing (OFDM) chirp waveform and DBF on receive techniques. The multimodal MIMO SAR concept can employ a reconfigurable antenna constellation (multiple antennas) to achieve advanced capabilities (HRWS, PolSAR, InSAR, GMTI). The OFDM technique is widely used in digital communication and was introduced into SAR [84] with some validation and simulations. Younis et al. [85] also analyzed an advanced concept of DBF using a reflector antenna, which can be an alternative implementation to potentially reduce the antenna weight and consequently the cost of MA-SAR. The scan-on-receive technique with a reflector antenna, called SweepSAR, is employed by the NASA-ISRO Synthetic Aperture Radar (NISAR) mission [86,87]. The DBF enables HRWS imaging capabilities (25 m resolution at 700 km swath (https://global.jaxa.jp/projects/sat/alos4/ (accessed on 15 November 2025)) for the ALOS-4 mission, which carries the PALSAR-3 instrument [88].
The feasibility of a SAR mission is typically evaluated using a combination of system performance modeling, end-to-end simulations, trade-off analyses, risk and technology readiness assessments, cost estimation, and alignment with user needs and mission objectives. These evaluations consider various mission elements, capabilities, novel concepts, and application requirements. A wide range of simulation approaches, models, and tools (e.g., [89,90,91,92,93,94,95,96,97,98,99]) are used to support this process. Simulation software can be involved in the preliminary design and analysis of SAR missions to provide system performance and imaging capabilities for trade-off studies and mission planning.

2.3. Programmatic Analysis

2.3.1. Schedule Development Methodology

The SAR mission phases represented in the schedule can be defined based on the methodology used by the CSA, which shares certain similarities with NASA and ESA [75,100,101]. While the definitions and key milestones of the space project life cycle vary slightly across different space agencies, they follow a broadly comparable structure. In addition to mission phases, the typical mission life cycle also includes reviews, specific to each mission phase: Mission Requirements Review (MRR), Operations Requirements Review (OpRR), System Requirements Review (SRR), Preliminary Design Review (PDR), Critical Design Review (CDR), Commissioning Review (CR), and De-commissioning Review (DR). Based on open literature sources, the duration of mission phases for several missions (ALOS (https://www.eorc.jaxa.jp/ALOS/en/doc/fdata/ALOS_HB_RevC_EN.pdf (accessed on 15 November 2025)), Sentinel-1A/B, CSG (https://cimr.eu/files/documents/CIMR%20Science%20Workshop%20Final%20Report.pdf (accessed on 15 November 2025), https://www.eoportal.org/satellite-missions/cosmo-skymed-second-generation (accessed on 15 November 2025), https://www.asi.it/en/earth-science/cosmo-skymed/ (accessed on 15 November 2025)), RADARSAT-2 [102], RCM (https://www.eoportal.org/satellite-missions/rcm#development-status (accessed on 15 November 2025)), NISAR [103,104], and ROSE-L [69]) were identified. The average values for each phase (in months) are Phase A (25), B (21), C (38), D (55), E1 (9 months).
The average development time (Phases A-D) is 12.4 years. It can be noted that the development duration for RADARSAT-2 (14 years) and RCM (13 years) is the longest in comparison to other missions. Development of the ALOS spacecraft also took a long period of time (13 years), but this satellite included three different instruments (Stereo Mapping (PRISM), the Advanced Visible and Near-Infrared Radiometer type 2 (AVNIR-2), and the Phased Array type L-band Synthetic Aperture Radar (PALSAR).
At the same time, MDA has announced that the expected launch of the two CHORUS satellites is 2026 (https://mda.space/chorus (accessed on 15 November 2025)). Since the development of CHORUS was initiated in December 2021 (https://mda.space/en/article/mda-announces-chorus-name-of-its-commercial-earth-observation-mission/ (accessed on 15 November 2025)) and assuming involvement of significant heritage, the entire development process for an advanced SAR mission (based on a large spacecraft) could potentially span about 4 to 7 years. The average durations of mission phases, derived from historical analogs, are considered realistic and are used to establish the SAR mission schedule. However, the design and production of multiple (3–4) large satellites may extend these timelines, with Phase C lasting up to 48 months and Phase D up to 72 months.
It can be noted that NewSpace companies (e.g., ICEYE, Capella, Umbra) have significantly accelerated the development timelines for small-sized SAR satellite, due to innovations like miniaturized technology, commercial off-the-shelf (COTS) components, reusable launch vehicles, and advanced manufacturing [105,106] and mission design approaches [107]. These companies typically achieve development cycles of around 2–4 years.

2.3.2. Cost Estimation

The cost of spacecraft has become one of the design criteria, and cost estimating is essential for the success of any space program. Various cost estimating methods and tools [108,109,110] are used for satellite system design and operation. A review of hardware cost estimation methods, models, and tools applied to early phases of space mission planning was conducted [111,112] after analyzing more than 200 references. Cost estimating methodology can be based on the basic methods used during a NASA project’s life cycle: analogy, parametric, engineering build-up (or “bottom-up”), and extrapolation from actuals using the Earned Value Management (EVM) system [110]. ESA has developed a procedure and its associated tool (the ESA Costing Software (ECOS), recent version is ECOS 6) for calculating and aggregating in a reliable manner the price elements of the financial proposals through the whole contractual chain. In addition to the above-described estimation methods, other techniques and tools can be used to develop an approximation of the monetary resources for the project completion [111,113]. These include expert judgment, three-point estimates, reserve analysis (determination of contingency reserves to account for cost uncertainty), project management software, vendor bid analysis, and rough order of magnitude (ROM) estimation. The widely used cost estimating methods and commercial tools were analyzed by NASA [110] for weaknesses, strengths, and applications. The review highlighted that it is common for estimators to combine multiple cost estimation methods and tools to obtain a hybrid cost estimate for an overall system. Most of the definitions relevant to cost estimation can be found in the literature [110,114,115].
The life cycle cost for a SAR mission in our work is estimated using a software tool [116], called the Multi-Aperture SAR satellite Cost and schedule estimation Tool (MASCOT v. 2.0), developed by C-CORE [116]. MASCOT’s cost model combines the analog and parametric cost estimation methods, which are commonly used at the early mission development phases [110,115]. The analog technique helps establish Ground Rules and Assumptions (GR&A) and establishes costs to relevant satellite parameters (mass, size, performance index, etc.). The bottom-up approach is also used in this paper to estimate the cost of every activity in a work breakdown structure (WBS) relevant to the SAR payload and to compare the results achieved with the parametric method. The MASCOTs cost estimating approach was established using statistical relationships between historical costs of 15 SAR satellite missions (TerraSAR-X, RADARSAT-1, RADARSAT-2, Sentinel-1, ALOS, etc.), considering historic inflation and exchange rates. Statistical variations in SAR mission costs were analyzed to identify the cost-driving elements (e.g., antenna size). One important parameter of the space segment is the Research, Development, Test, and Evaluation (RDT&E) (non-recurring) costs. Based on an analysis of mission costs (MC) for historic missions, such as TanDEM-X (TDM), RADARSAT-2, and Sentinel-1, the cost distribution for a SAR mission over space segment (SS), launch, and operation [115] can be estimated as follows:
M C S A R = S S 60 % + L a u n c h 17 % + O p e r a t i o n 23 % .
When the mission consists of two or more satellites, the production cost (PC) can be estimated with the following relationship [114]:
P C = T F U × L ,
where TFU is the theoretical first unit of N units in total,
L = N B is the learning curve factor, where
B = 1 ln 100 % S / ln 2 ,
and S represents the percentage reduction in cumulative average cost, and it depends on the number of units:
-
90% for less than 10 units;
-
80% for more than 10 units.
The most important parameter is the non-recurring satellite development cost associated with the research, development, test, and evaluation (RDT&E). RDT&E cost can be two to three times the unit cost and up to six times the cost for high-tech programs. At the beginning of a program, the estimated cost may differ from the final cost by as much as 30–50% [114]. This variation depends on factors such as the number of risks (e.g., low Technology Readiness Level (TRL)) and the degree of development heritage. To account for these risks and cost uncertainties, a management reserve parameter is introduced. In this analysis, a value of 23% is applied to address uncertainty and achieve a confidence level of 80% or higher. The 23% corresponds to the standard deviation of the cost model, derived from statistical analysis of 15 SAR missions, and represents the inherent variability observed across comparable projects. Effective risk mitigation, such as advancing technology readiness, leveraging heritage designs, and strengthening project management practices, can reduce this uncertainty, allowing part of the management reserve to be conserved or reallocated in later project phases. The learning curve percentage values are derived from established relationships [114], as expressed by Equation (2). For constellations with fewer than 10 satellites, a learning curve slope of 90% corresponds to the learning curve factor L of 2.688 for three satellites and 4.257 for five satellites. The profit of 10% was used; however, most satellite manufacturers are private companies, and this value can vary. The development heritage varies for different missions [114] according to the definitions in Table 1.
Input from design experts may be required to assign proper heritage value. Heritage factors are considered multiplicative factors when used in the cost of RDT&E (Table 1). The low heritage value also increases the cost estimation uncertainty, inherent in parametric models, which includes uncertainty associated with hardware design, inflation, labor rates, contractor accounting practices, and overhead rates [117]. The application of the developed MASCOTs cost model [116] to known missions demonstrated very high accuracy (within STD 12.6%) in estimating the cost of TFU.
The mission cost is characterized by two costs: time-dependent and time-independent costs [110]. Time-dependent costs are tied to the duration of a task, and they increase as duration increases. For example, the longer a spacecraft is under test, the more the cost increases. Other examples of time-dependent costs include project management, electricity, storage facilities, and equipment rental. Schedule delays do not necessarily lead to cost overruns, as in certain examples, delays can be a result of other factors. However, the numerous studies [118] reported that schedule creep has a significant influence on cost growth and vice versa. Analysis of 40 NASA missions shows a correlation between cost and schedule, and for every 10% of schedule growth, there is 12% cost growth (https://ntrs.nasa.gov/api/citations/20110014405/downloads/20110014405.pdf (accessed on 15 November 2025)).

2.3.3. Risk Management

Risk management for space missions involves the identification, analysis, and mitigation of potential risks and uncertainties to ensure mission success. The risk management solutions help evaluate and address possibilities of technical failures or performance shortfalls, human errors, environmental hazards, regulatory issues, and funding limitations. Risks associated with space missions, including technical, human, launch, space environment, mission design, budgetary, and political risks, were reviewed and analyzed in [119]. The systems engineering methods and practices [75,101,120,121] are effectively employed at the leading space agencies to manage risks and uncertainties at all phases of the mission life cycle. The risk assessment in our work follows standard space practices. Each risk element defined has undergone a risk assessment, including an analysis of the likelihood and the consequences of the risk if it does occur. A risk mitigation strategy is defined to influence its probability of occurring, and a contingency plan can be put in place if it does occur.

3. Results

3.1. HUN Analysis

Compliance with the HUN was the major criterion for developing a successful EO solution. In addition to SAR needs, the HUN also expresses user interest in optical, GNSS-RO, and other data. The results of the HUN analysis with the Natural Language Processing program can be visualized with a Word Cloud (Figure 1), which is a graphical representation of text where the size and color of each word reflect its importance based on frequency of appearance in the document. The Word Cloud for the HUN document shows that the most frequently mentioned terms are “SAR” and “data.” It also emphasizes that the Solution should be operational and consider factors such as spatial resolution, coverage frequency, area of interest (AOI), data latency, and others.
The initial activity was to translate the HUN into the relevant Observation Requirements of the space-based Solution. The user needs analysis was conducted to define a quantifiable set of performance requirements that can be later translated into design requirements that meet the operational and scientific needs of the users. The HUN document was used to create requirements matrices, which track the details of each user need, objective, and associated requirement for the development of the Solution. This matrix helps perform a detailed analysis of all user needs and takes into consideration their specific technical requirements on measurements, stage of maturity, area of interest and information product. The statistical analysis of this matrix provides a high-level overview of all requirements for developing Solution options, and it also allows a detailed account of the assignment of each individual need. The high-level overview is also required to select the driving needs based on HUN subsets of different levels of maturity to identify potential Solutions, including those options that will cover, to the maximum extent possible, all the HUN.
The Solution is required to deliver the data/information products representing measurements acquired by SAR, electro-optical and infrared (EO/IR), radar altimetry, and other sensors to satisfy user needs. All user needs were divided into three segments: SAR, EO/IR, and other sensors. Other sensors include altimeters, microwave radiometers, LiDAR, Global Navigation Satellite System (GNSS) Radio Occultation (RO) GNSS-RO, and Automatic Identification System (AIS). Every user need can be completely satisfied using either a single or a combination of these segments of the Solution. In addition, the HUN Document clearly provides needs related to data availability and continuity, data access and use, and security. Although the HUN covered multiple instrument types, its primary focus was on SAR, and the needs related to other instruments were included only partially in the document. In our paper, we only cover a part of the Solution represented by the SAR mission.
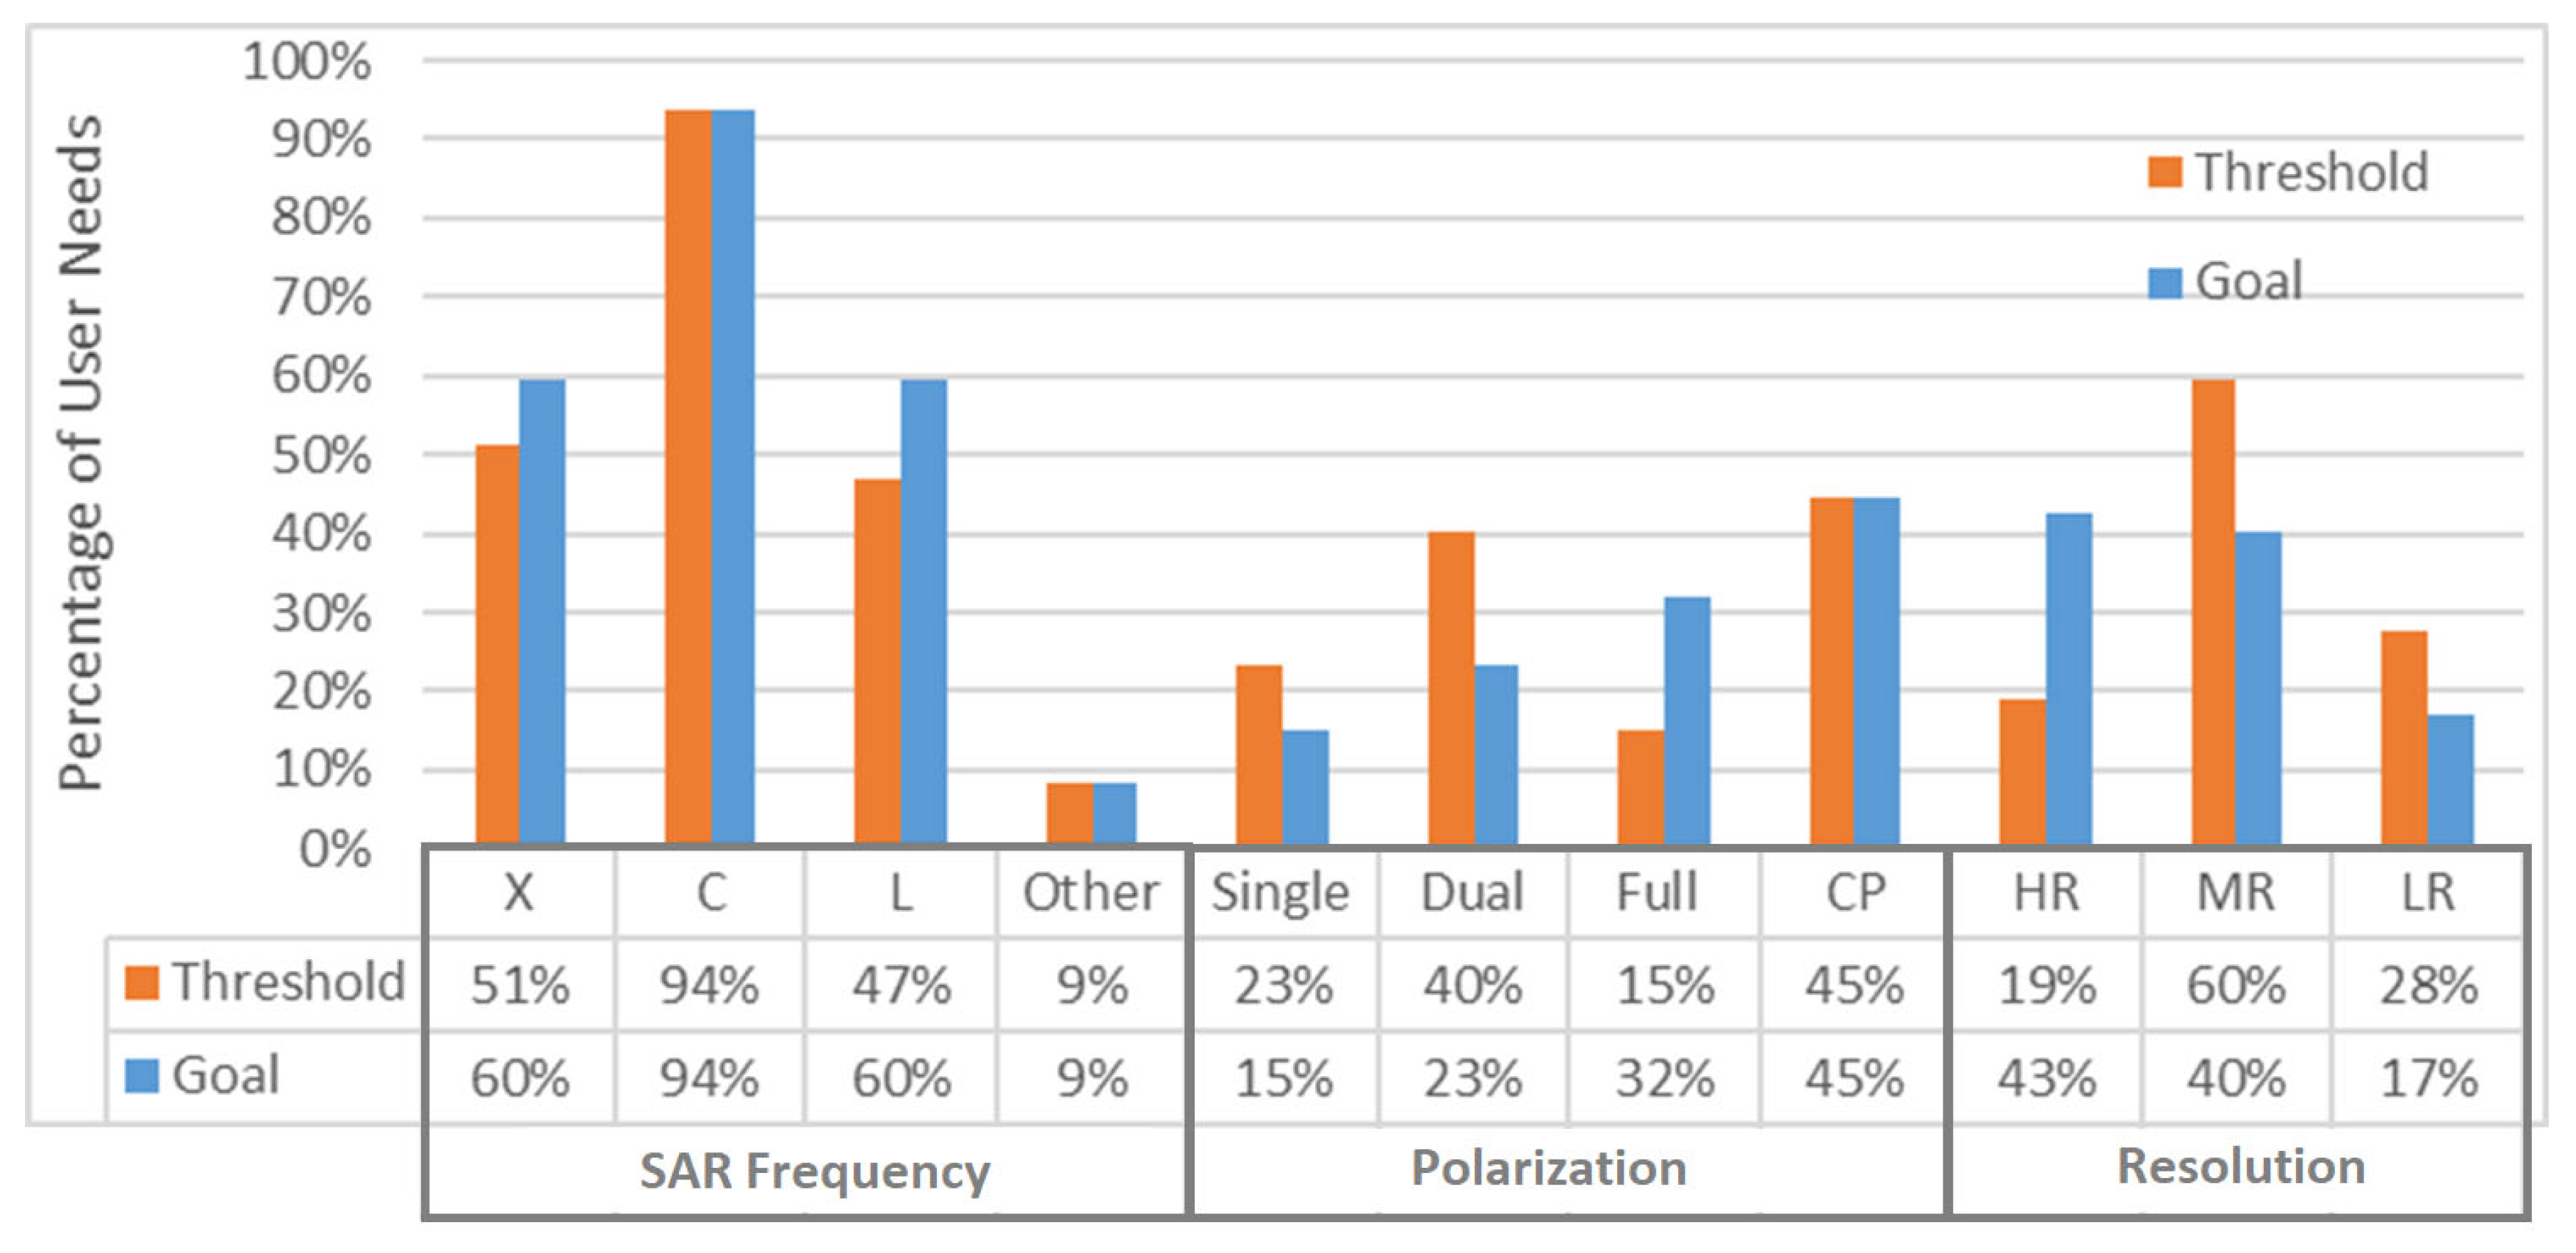
In total, our team identified 47 user needs that explicitly indicated the requirement for SAR technology. Figure 2 represents a portion of the summary of the HUN statistical analysis for the SAR segment. It indicates the total number (frequency) of each count of measurement performance parameters indicated by the HUN and its percentage from 47 user needs. Two levels of measurement performance (threshold and goal) are considered, as it is specified in the HUN document. The majority of the user needs (94% of 47) indicated their preference in terms of SAR frequency band. In the cases where a SAR band was not specified, the band was assigned based on state-of-the-art technology for the given purpose and user rationale. For example, 44 (94%) user needs can be satisfied with C-band SAR for both threshold and goal objectives, but as a goal, 60% (28 user needs) require X and L bands to meet their needs. Four needs indicated the requirement of other bands (Ku, S, and P) for the goal objective, and one need (Ku) for the threshold. Fifteen user needs (32%) intend to use a dual-frequency Solution as a goal.
Figure 2 represents categories of spatial resolutions that can be used for a measurement (information) product. As a goal, 43% of users indicated the need for high-resolution (HR) ranging from 1 to 5 m, 40% of medium resolution (MR) of 5 to 50 m, and 17% of low resolution (LR) (greater than 50 m). Very high resolution (VHR) (less than 1 m) is not required, according to the analysis. At the threshold level, 23% of users can use single polarization (e.g., HH), 40% dual (HH-HV or VV-VH), 15% full (Quad-Polarization), and 45% CP (Compact-Polarization).
The stage of maturity included 18 Operational, 13 Pre-operational, and 22 Emerging needs. Two users indicated the need for on-board processing. The maximum frequency of acquisitions was three times per day for the threshold and four times per day for the goal objective (level). Data latency varied from several days to 15 min at the threshold and five minutes at the goal level.
Considering the SAR noise floor, it should be recognized that this value is somewhat meaningless unless a band is specified. Nonetheless, considering the maturity of the associated services and frequent use within Canada, for the most part, quoted noise floors are referencing C-Band. The most frequently mentioned (seven users) noise floor was −28 dB for the threshold and −30 dB for the goal objective. The minimum value of the noise floor was −34 dB for the threshold and −35 dB for the goal objective.
The need for interferometric capabilities that require highly accurate satellite orbital vectors was indicated by eight (28%) users. Corresponding measurement needs include, for example, coherent change detection (CCD) and ground deformation monitoring. Tandem capability with supporting bistatic and monostatic modes was requested by two user needs at the threshold level and by six (13%) at the goal level. A PolInSAR capability was indicated by two user needs.
Different orbit parameters will be considered in this options analysis. The areas of interest (AOIs) included Polar Regions, which require a polar orbit. Non-near polar orbits were also indicated as being required. Local acquisition time other than dawn/dusk was also indicated as desirable.
Although only a few users specified the required SAR beam mode, it is possible to assign beam mode requirements indirectly by relying on specified resolution, polarization options, and swath width. The definitions of different beam modes can be found in publications (e.g., [122]). For example, multiple users specified a very large AOI with frequent coverage or the need for a wide swath (200–500 km). This can be achieved with ScanSAR beam modes for LR and with HRWS for HR, because HRWS has the possibility to achieve 3 m azimuth resolution with 350 km swath [39]. All user needs of the SAR Segment can be satisfied by ScanSAR, HRWS, Fine, and Wide beam modes with polarization options.
A small number of users conveyed their image quality requirements in terms of the block adaptive quantization (BAQ). Specifically, seven users requested an image quality equivalent to 3-bit as the threshold objective, and eight users requested 4-bit for the goal objective.

3.2. Conceptual Design of SAR Mission

3.2.1. Space and Ground Segments

A Product Breakdown Structure (PBS) for the Space Segment (Figure 3) and the Ground Segment (Figure 4) was developed for the SAR mission. The assessment of each PBS element was performed to identify the level of the associated technology risks.
The proposed SAR mission (space and ground segments) was designed to completely satisfy (100%) HUNs in C-band data. The key assets and systems are considered for two options of the SAR mission: with three and five satellites, respectively.
  • Option 1: Three moderate (medium sized spacecraft ≥ 1400 kg) R4G (R4G stands for RADARSAT 4th Generation. RADARSAT is an official trademark of the Canadian Space Agency (CSA). The reference to "R4G" as the name of a potential future mission is used informally for discussion purposes and does not imply official endorsement or adoption by the CSA or the Government of Canada.) satellites with two of them operating in tandem, i.e., R4G (A+B+Tandem).
  • Option 2: Five large (~2000 kg) R4G satellites with two operating in tandem and two others operating on optimal orbits, i.e., R4G (A+B+Tandem+2xOO (Optimal Orbit)).
For each option, the ground segment requirements will be similar, though an increase in throughput (for reception) and storage will be required due to potentially higher data volumes because of the increase in the number of satellites.

3.2.2. SAR Payload and Bus Concept

The technical feasibility study helped determine key technologies enabling HRWS mode. The HRWS is a mode capable of coping with the well-known SAR antenna constraints and effectively improving either swath width or azimuth resolution via digital beamforming (DBF) techniques. There are two core DBF techniques employed to realize the HRWS mode:
  • MAPS (Multiple Azimuth Phase Centers) technique;
  • SCORE (Scan-on-Receive) technique.
The MAPS technique [123,124] is the digital signal processing is implemented for Doppler spectral filtering in the ground SAR processor, and the SCORE technique is real-time processing on board. Both these techniques can be applied to conventional SAR imaging modes, e.g., Stripmap, Spotlight, ScanSAR, Terrain Observation by Progressive Scans (TOPS) modes. These key technologies (DBF, MAPS, and SCORE) have been extensively documented in the literature [43,80,81,82,123], which provides comprehensive explanations of their principles, implementations, and applications. An intuitive explanation of these technologies can also be found in [125] for phased array antenna and in [126,127] for a reflector antenna.
In order to deploy the HRWS modes, the SAR instrument must be equipped with a digital beamforming antenna and a corresponding multiple receive instrument architecture.
A dual phase center has been implemented in the past in the RADARSAT-2 mission. The implementation was in azimuth for Along Track Interferometry (ATI) and Ground Moving Target Indication (GMTI) mode operations. A system employing the HRWS modes shall consider additional technological and operational conditions to further its feasibility and fully exploit its capability:
  • Capability of handling high data rate and data volume;
  • Data rate proportional to swath width and bandwidth;
  • Impact on on-board storage and downlink system;
  • Overall mission architecture with respect to data latency to be considered;
  • Multi-channel calibration (channel balancing) on-board for SCORE and on ground for MAPS.

3.2.3. SAR Imaging Performance

The feasibility of the SAR imaging performance can be conducted with scaling of spacecraft design and deriving associated risks, relying on a preliminary approach of antenna aperture resizing:
  • The starting point is the Sentinel-1 first generation (S1FG) instrument performance parameter set (https://sentiwiki.copernicus.eu/web/s1-mission (accessed on 15 November 2025)), described by aperture size, RF transmit power capabilities (peak power 4.1–4.4 kW) and RF losses (Receiver noise figure 3.2 dB).
  • Back-end and signal networks need to be upgraded to a digital beamforming architecture, which is assumed to remain in a lower order of magnitude on mass, volume, and DC power demand compared to the front end. However, this part is the most demanding evolution from Sentinel-1 first generation to the digital beamforming architecture.
  • To rescale the satellite mass from the 2300 kg of S1FG, it is assumed that the scaling is dominated by the aperture size, which in turn determines the instrument mass and DC power requirements, assuming the same radiator size and transmit/receive module (TRM) capabilities. Reducing the antenna length (along flight direction) is one straightforward way for rescaling, as it limits technical and integration risks by minimizing the changes necessary for individual antenna tiles.
For all swaths, the spatial resolution and Noise Equivalent Sigma Zero (NESZ) values are derived by adapting across-track resolution for meeting 2-D resolution cell size: NESZ increases linearly with RF bandwidth. For example, the resolution of 20 m means that the area of one resolution cell is 400 m2. Swaths of 200 km, 350 km and 500 km are built by multiple ScanSAR subswaths. Stripmap modes of 100 km perform better than previous forecast. They are modeled (Table 2) with the following configurations:
  • Large satellite (2300 kg) with antenna 4.0 m along × 6.25 m across using 6 MAPS channels (one per two tiles);
  • Moderate satellite (1600 kg) with antenna 2.5 m along × 10 m across using 8 MAPS channels (one per tile).
SAR Performance forecast software (maintained within Airbus) was used to estimate the performance of SAR modes. The large satellite copes better with shallow incidence of the 500 km mode and needs fewer sub-swaths due to the longer antenna (Figure 5). For a ScanSAR 20 m/500 km mode, the moderate-size satellite already shows (Figure 6) performance degradation at shallow angles of incidence where there is severe loss due to range ambiguity suppression needed. Multiple curves can be observed for a few along track positions (Doppler frequencies) within a ScanSAR burst NESZ curves as they show the scalloping of the pattern in the azimuth direction. An important point is that NESZ values represent maximums of the modeled performance, which is different from the definitions used by JAXA (uses minimum) and MDA (uses mean) for their product description.
The degree of freedom for the resolution cell aspect ratio is used for improving sensitivity. In case of applications that require good single look spatial resolution, it might show some drawbacks. The impact is positive as this assumption allows for optimization towards better NESZ. This leads to better within-cell performance. The large swath-to-swath variation in Sentinel-1 EW NESZ performance is equalized to improve performance consistency within the resolution cell [128]. The performance values reported are based on a performance model using a real-mode design including DBF.
Feasibility studies for Tandem-L and Sentinel-1 NG, conducted with airborne and simulation experiments, helped estimate the possible resolution and swath achievable with HRWS [39,40,82,129,130]. It was demonstrated [131] that Sentinel-1 NG can provide a 400 km swath with single-look ground resolution 25 m2 (i.e., ~5 m × 5 m) and a swath width of at least 600 km, single-look ground resolution of 150 m2 (i.e., ~12.5 m × 12.5 m) with NESZ −25 dB or better. Instrument concepts considered three options with antennas (https://elib.dlr.de/130220/1/ARSI_v3.pdf (accessed on 15 November 2025)): two multi-channel planar antennas, 12.5 × 3 m (compliant with Ariane launcher) and 12.2 × 1.3 (compliant with Vega launcher), as well as a 9 m reflector and hybrid antennas.

3.2.4. Tandem Capability

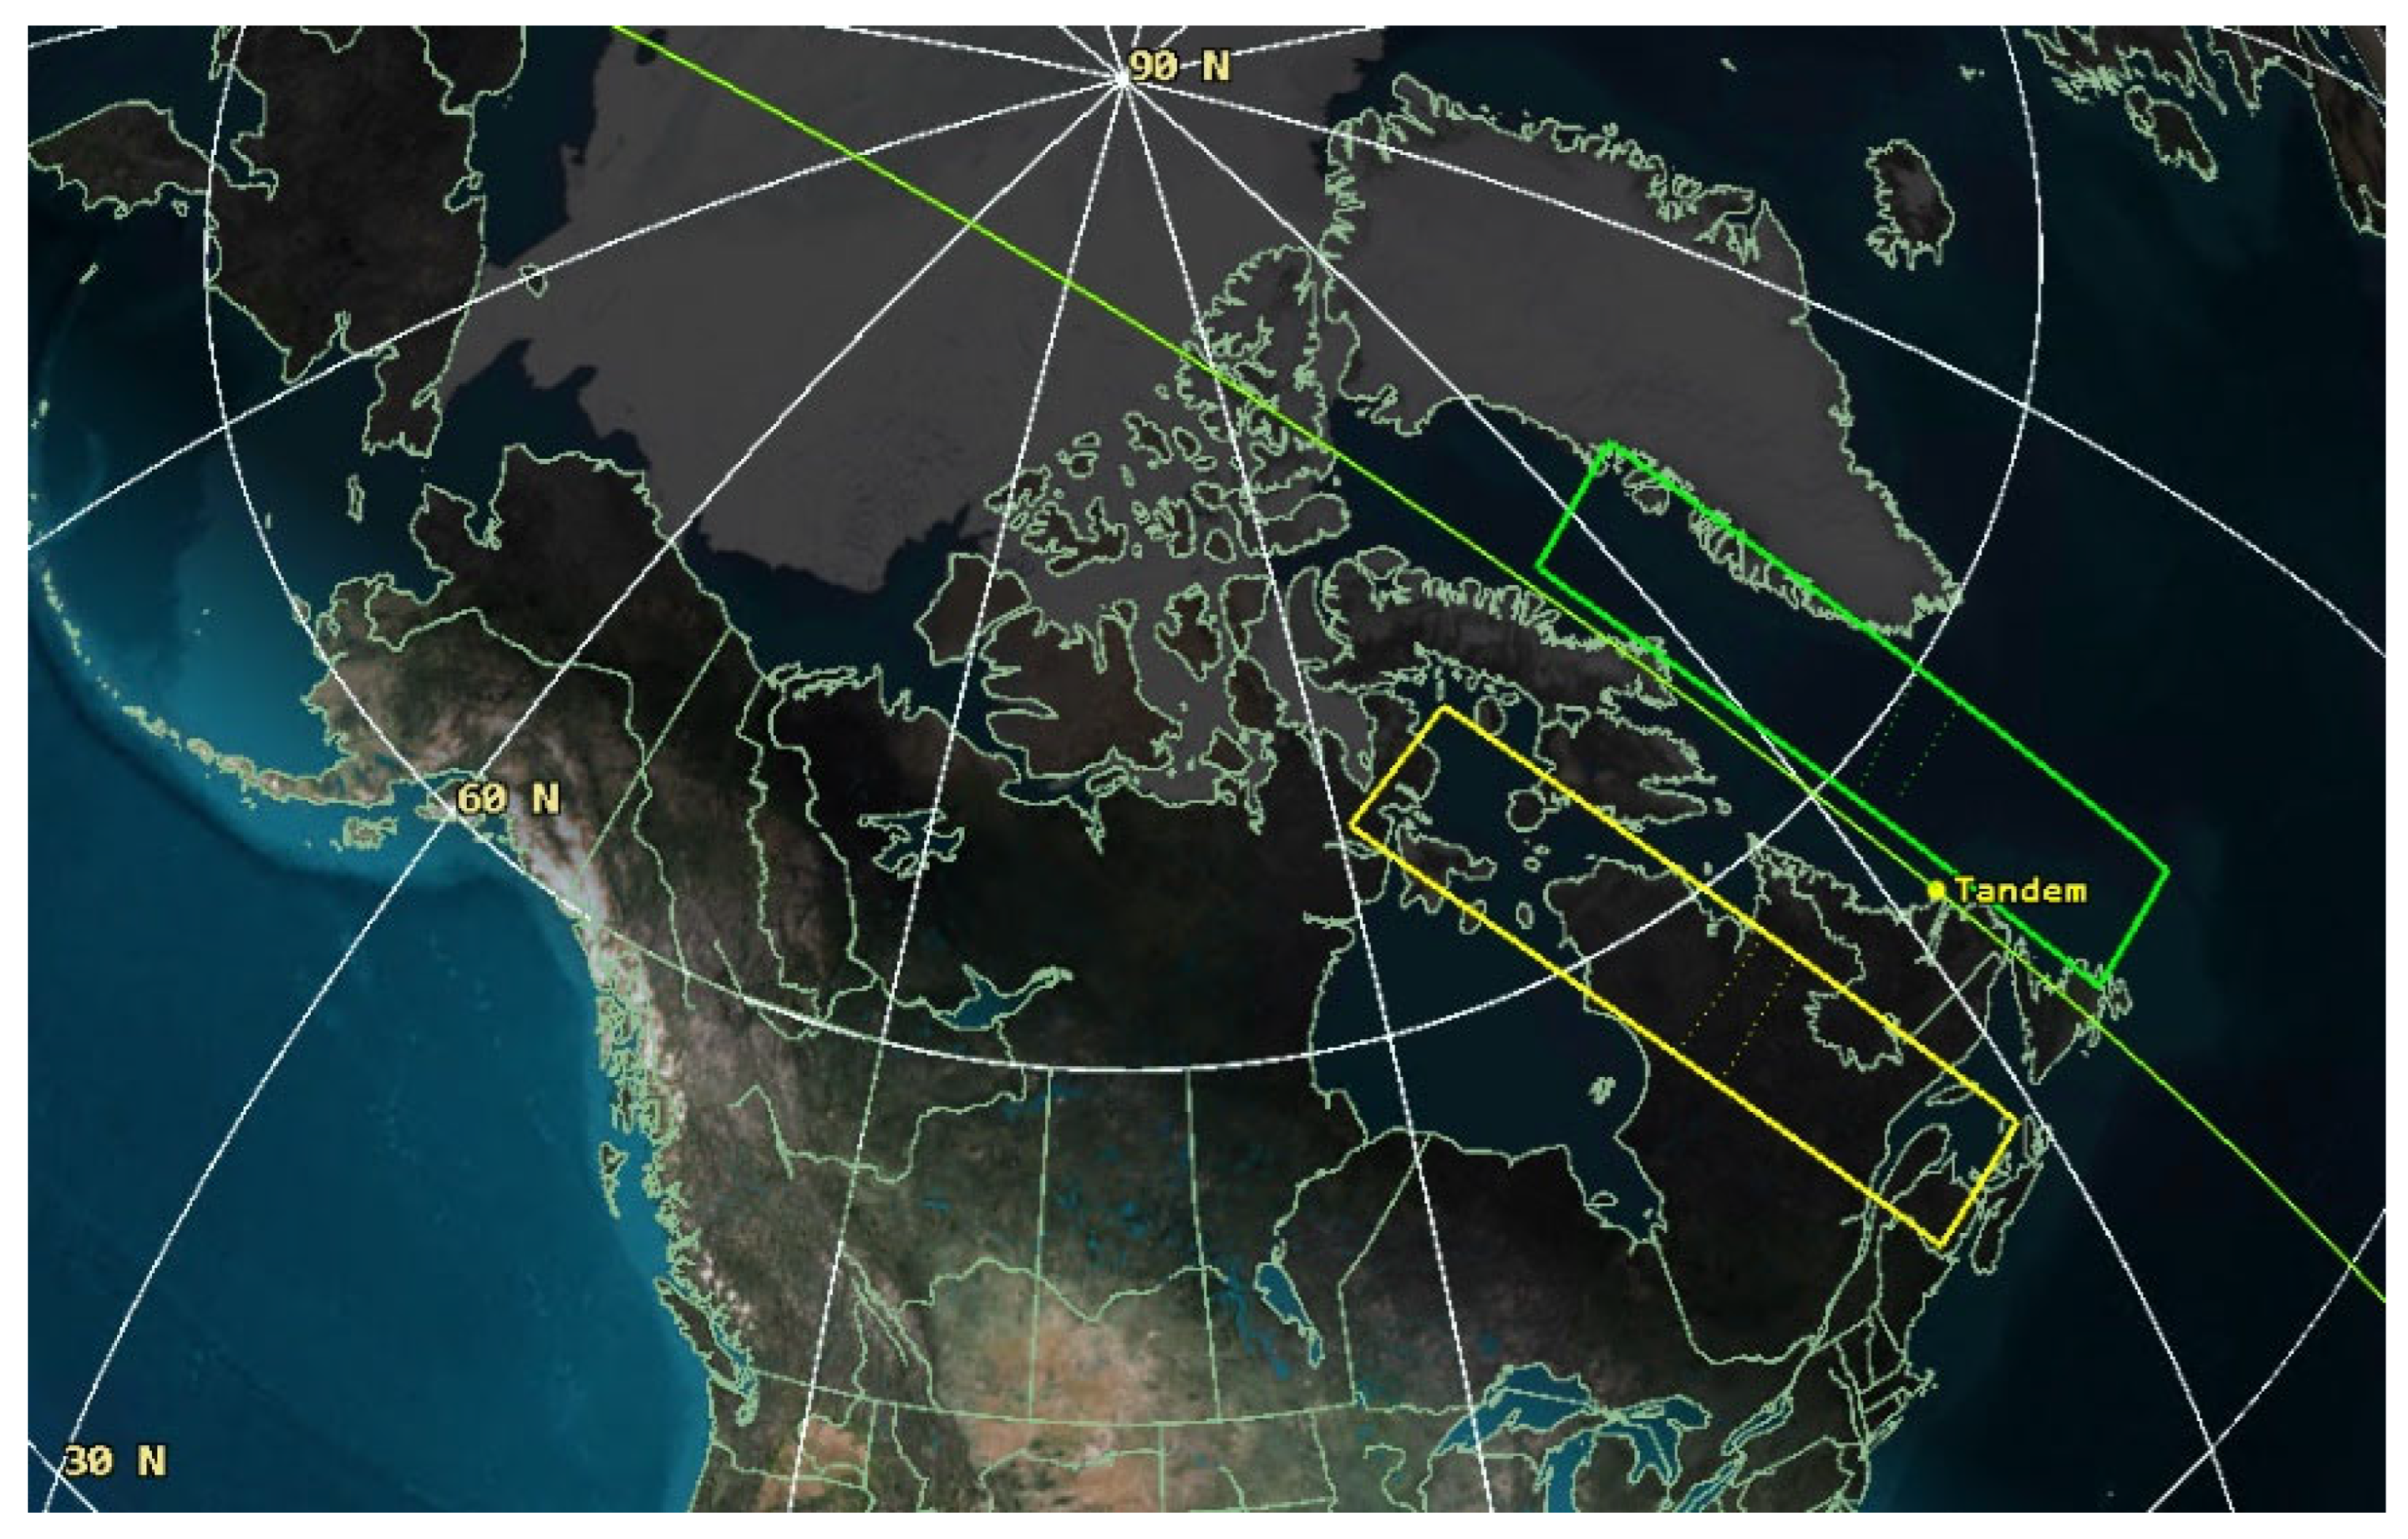
The need for tandem capability, which allows PolInSAR, bistatic, and monostatic single-pass InSAR with a very short time difference, was indicated by multiple users. The operation of two R4G satellites in tandem formation is also important to demonstrate the novel R&D results with bistatic and PolInSAR techniques for C-band. This will also allow higher flexibility and control for Canadian operational and scientific needs. The tandem formation of two R4G satellites can be temporal (e.g., period of 1–2 years) to accomplish R&D and demonstration activities, and afterwards the two satellites can be separated to increase the frequency of spatial coverage. The additional benefit of using two R4G satellites in tandem is the possibility to combine both swaths (Figure 7) to provide advanced coverage up to 1000 km width, although the swaths are not joined due to the side-looking SAR geometry.
The pursuit monostatic InSAR mode with tandem can help solve the problem of open water and sea ice discrimination [132]. Sea ice applications with tandem also include instantaneous ice velocity measurements and mapping of landfast ice edge, and estimation of its deformation [133]. Tandem also solves an important industrial problem on iceberg topography extraction and detection of icebergs in sea ice with very high performance (up to 100% of detection probability at 10−7 probability of false alarms) [134].
Tandem’s bistatic along-track interferometry (ATI) and PolInSAR will help to address forest height canopy estimation [135] and forest characterization [136]. ATI also has great potential for oceanographic applications [137] such as the following [133,137,138]:
  • Measurement of tidal currents and ocean circulations with very high sensitivity;
  • Thermohaline circulations with high spatial resolution, including coastal regions;
  • Detection of alga blooms and estimation of their drift velocity;
  • Measurement of sea surface film drifts relying on 2-D motion velocity vectors.

3.2.5. Orbit Selection

An essential component of the SAR mission design is orbit selection to maximize HUN compliance. For the coverage and revisit simulations, the Sentinel-1 orbit was selected for two reasons:
  • It may be used for Copernicus missions: Sentinel-1 NG and ROSE-L. In this case, R4G can take certain advantages of data acquisition from the same orbit;
  • Another reason is that this orbit allows good SAR performance for numerous applications.
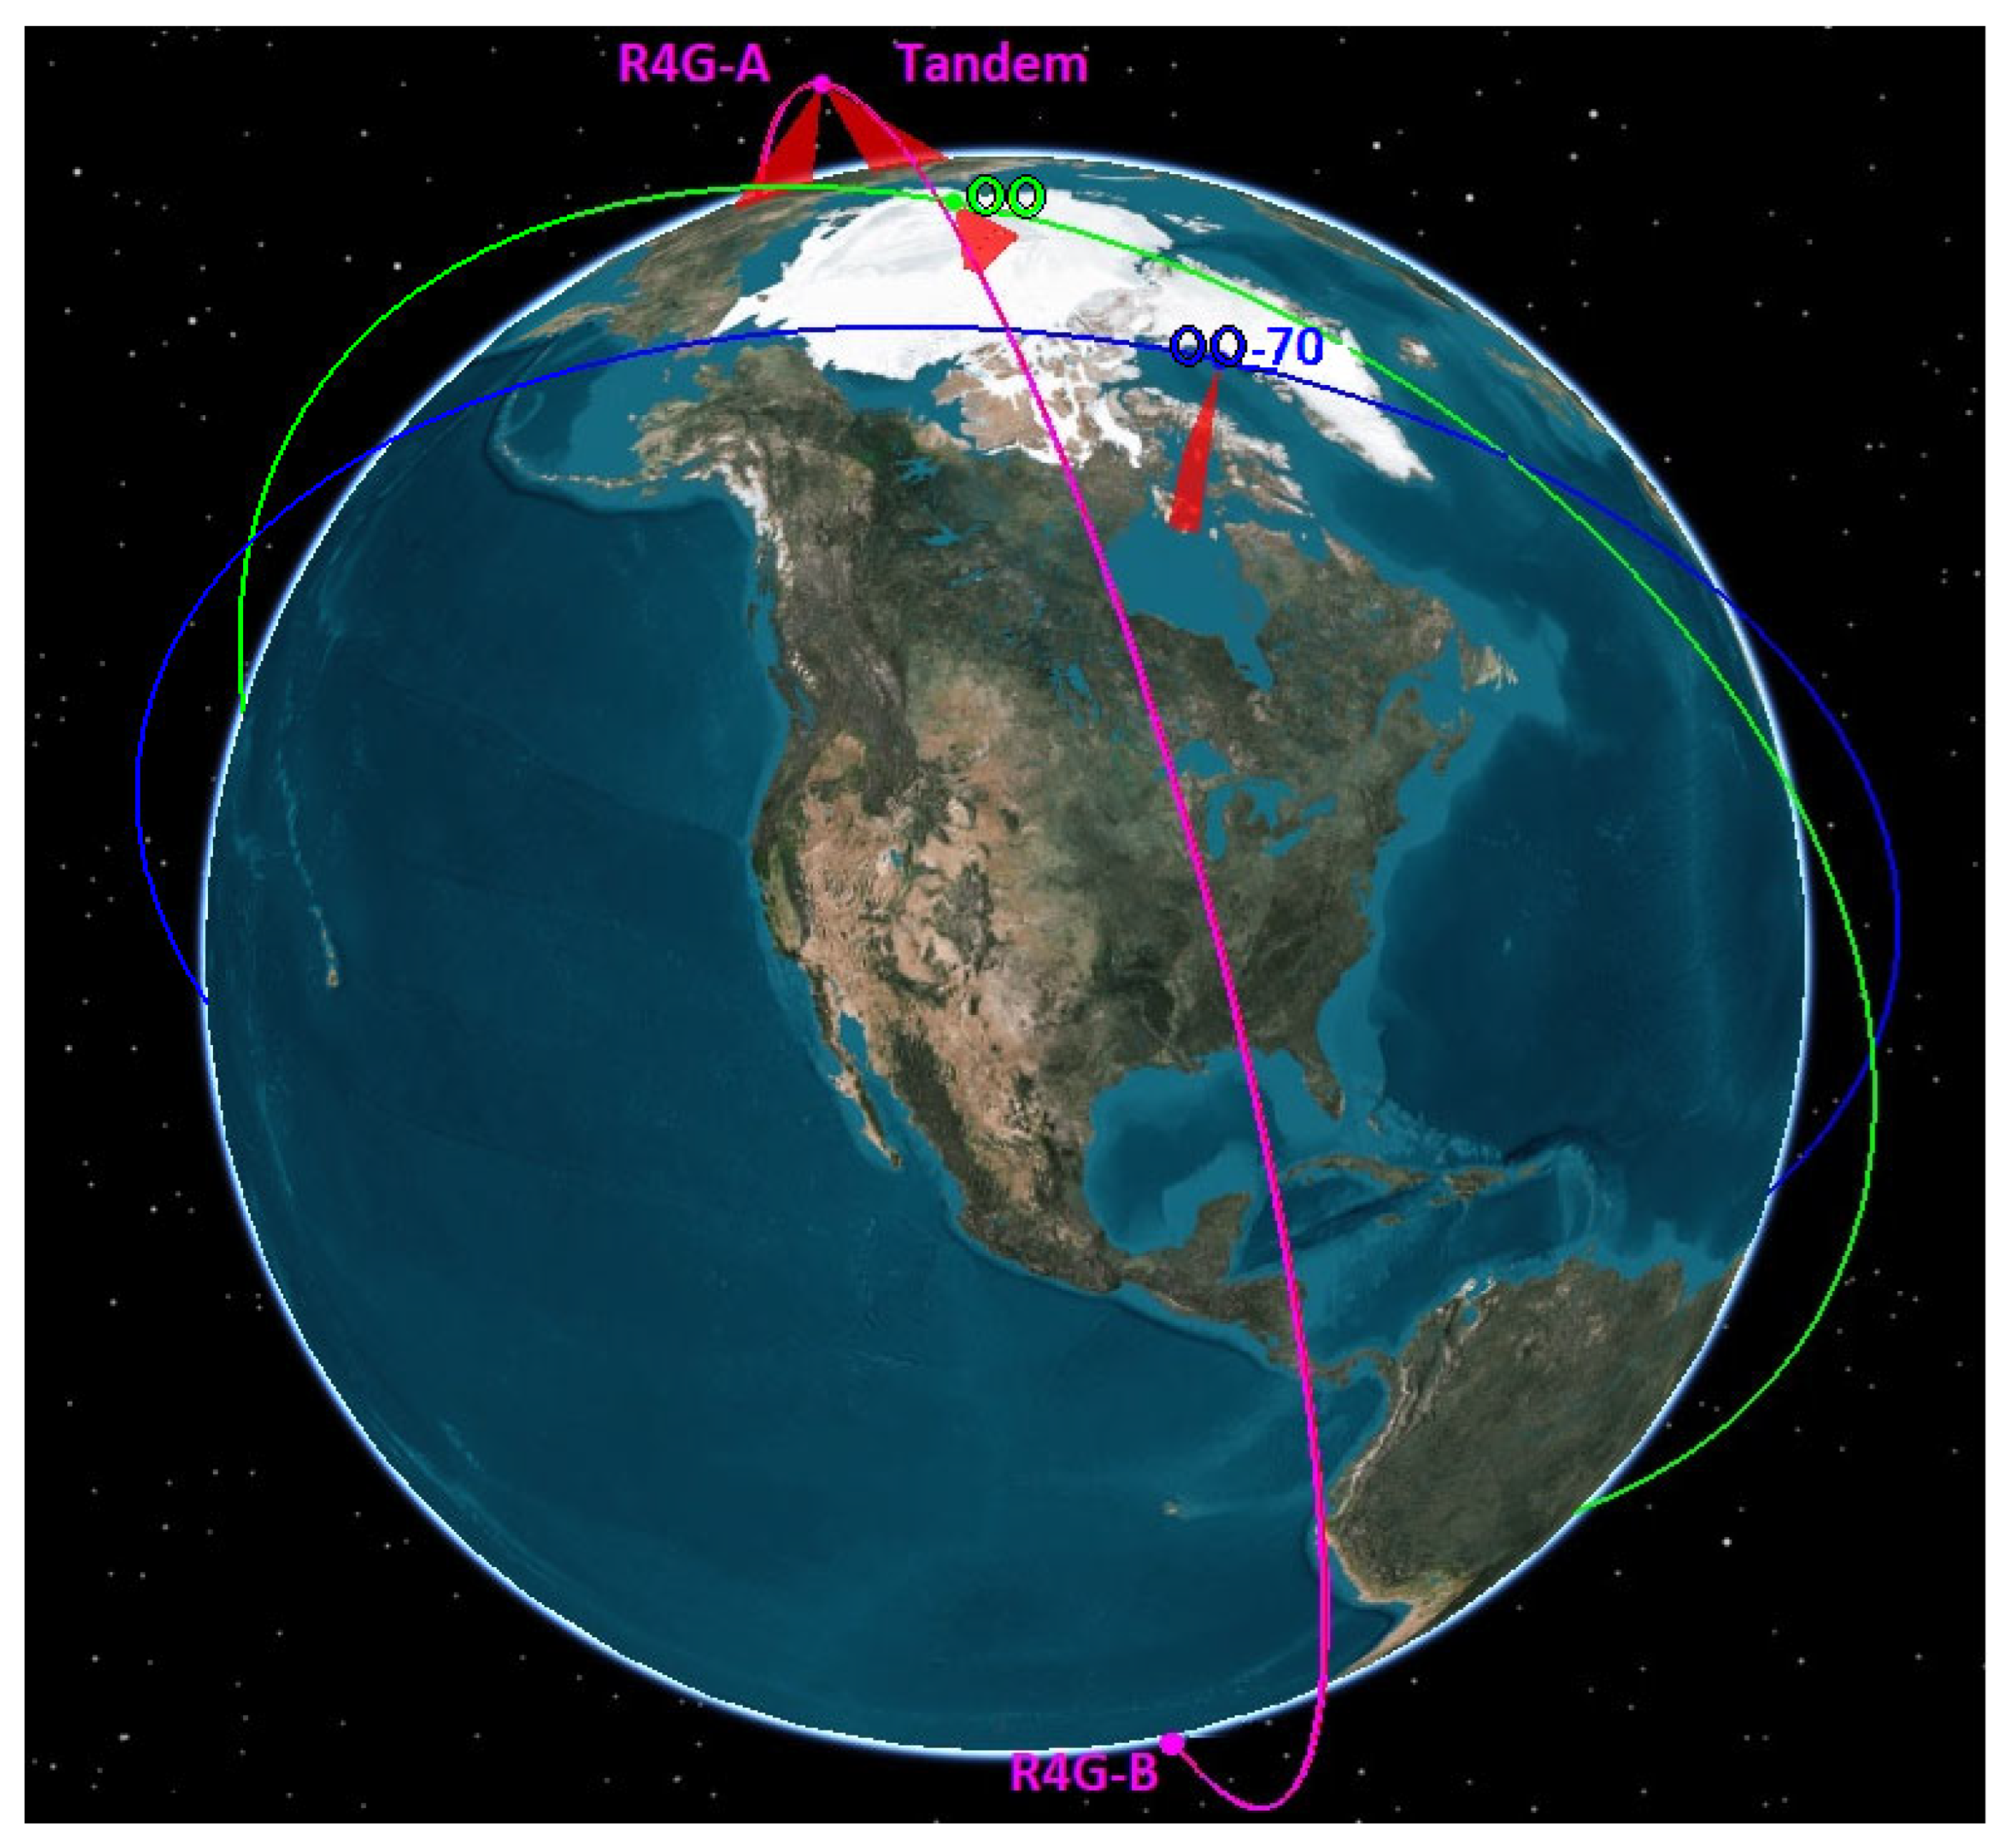
Sentinel-1 has (https://www.d-copernicus.de/fileadmin/Content/pdf/Sentinels_update_170510_final_printed.pdf, https://sentiwiki.copernicus.eu/web/sentinel-1 (accessed on 15 November 2025)) a near-circular dawn-dusk sun-synchronous orbit (SSO) with an altitude of 693 km, an inclination of 98.18º, an orbital period of 98.6 min, and a ground track repeat cycle of 12 days. As one of the mission scenarios consisting of three satellites, two satellites (R4G-A and Tandem) were considered operating at the same time, whereas the third satellite (R4G-B) is spaced 180° apart on the same orbital plane, separated around the globe by 49.3 min (the orbit is shown as a magenta-colored line in Figure 8).
Several users specified their demand in SAR operating on non-near polar orbits or acquisition times other than those provided at dawn/dusk orbits. The option with five satellites includes the operation of two satellites on an optimal orbit. Optimal means that the orbit is optimized for Canadian needs. Figure 8 shows all five satellites operating in three different orbits, modified from the Sentinel-1 two-line element set (TLE). The first orbit, shown as a line of magenta color, is used by three satellites. The optimal orbit (OO) with 70º inclination (shown as a blue line in Figure 8) is used by the satellite on a non-near polar orbit, which helps to improve coverage on lower latitudes and enables multiple viewing geometries to support 3-D analysis, which was indicated by two land monitoring user needs. A satellite operating on an orbit with a 70° inclination angle can provide better coverage of the Northwest Passage, shipping routes to the northern communities, marine and Oil Pollution AOI. This will also allow access to different AOIs in other than dawn/dusk times and reduce revisit time in emergency situations. The operation at non-near polar orbits is feasible for SAR satellites (e.g., Indian RISAT-2), and this can provide spatial coverage with a higher frequency for multiple users. The SAR mission on OO (non-SSO) will require larger solar panels and a battery.
The second optimal orbit (shown as a green line in Figure 8) is polar but different from SSO to allow access to AOI at other than dawn/dusk time. The specific time difference on how many hours of difference (i.e., acquisition time different from dawn/dusk) can be selected depending on user requirements. The Right Ascension of the Ascending Node (RAAN), which is the longitude of the point where the spacecraft crosses the equatorial plane moving from south to north, controls the time difference.
The breakthrough contribution of introducing one satellite on other than dawn/dusk orbit, will be a novel technology to be demonstrated for space-based applications. The RAAN can be selected in such a way that it will be possible to acquire coherent data within a specified time interval (e.g., several hours). It means that the SSO (shown with magenta color line in Figure 8 and OO (shown as a green line on this plot) must have time difference equal to the integer number of the satellite revolution time. For example, if the satellite on SSO has a revolution time of 98.6 min, then the OO must be selected with a time difference of ±98.6, ±197.2, ±295.8, etc., minutes to enable acquisition of coherent data. Acquisition of coherent data by two satellites is feasible since it was already demonstrated with TerraSAR-X/TanDEM-X and Sentinel-1A/Sentinel-1B.
The capability of coherent data acquisition within several hours will be very useful for numerous civil and military interferometric and coherent change detection (CCD) applications, making such SAR missions a valuable instrument for many government and commercial users. The CCD technique is very sensitive to any decorrelation factors: changes in dielectric properties of the surface (e.g., due to precipitation or evapotranspiration/evaporation), motion (e.g., due to deformation or object movement/displacement), and surface roughness change (due to anthropogenic activities or natural events). Examples of environmental applications can include monitoring ice (river, lake and sea) breakup and velocity, landfast ice delineation, deformation and topography, tide monitoring, coastlines delineation and permafrost analysis. Hours’ time interval (HTI) CCD may also potentially find usage for agriculture to estimate vegetation conditions and structure, soil tillage and moisture change rate.
The measurements of deformation that occurred in a few hours can be important for earthquake and infrastructure monitoring. Flood monitoring in emergency situations will be very accurate with HTI CCD compared to non-coherent SAR techniques.
Airborne proof of concept campaigns with repeat-pass HTI InSAR demonstrated the requirement of aircraft flight-line offsets of less than tens of meters to achieve good coherence [139], which is difficult to maintain [140]. In addition, the high cost of aircraft operation (which requires two flights for HTI) makes the airborne platform limited usage for operational applications. In any case, the numerous demonstrations with airborne campaigns/platforms relevant to HTI InSAR, PolInSAR, and CCD [141,142,143] can also potentially find operational space-based applications by adding one SAR satellite on OO.
Satellites on both OO and OO-70 will enable accurate measurements at different times than dawn/dusk. Soil moisture is usually affected by dew for measurements acquired by SAR on SSO, but with both OO satellites, it can be monitored at different times. The orbit analysis and selection will be finalized during Phase A of the mission.

3.2.6. Coverage Frequency and Revisit Time

Coverage frequency refers to complete coverage of the AOI at the required frequency. The revisit time is the ability to see the same target within a given period. The distinction is that coverage frequency describes how often the entire area of interest is fully imaged, whereas revisit time refers to the interval at which the same target or location can be potentially observed, which does not necessarily mean that the whole area is covered. The R4G satellites will potentially have “Discrete Stepped Strip (DI2S) (https://www.thalesaleniaspace.com/en/news/second-generation-maximizes-cosmo-skymed-system-capabilities (accessed on 15 November 2025))” agility similar to COSMO-SkyMed Second Generation. DI2S makes it possible to partially overcome some of the traditional restrictions of SAR satellites and improve their quality and serviceability, for example, by addressing user access requests for geographically separate areas with a single satellite.
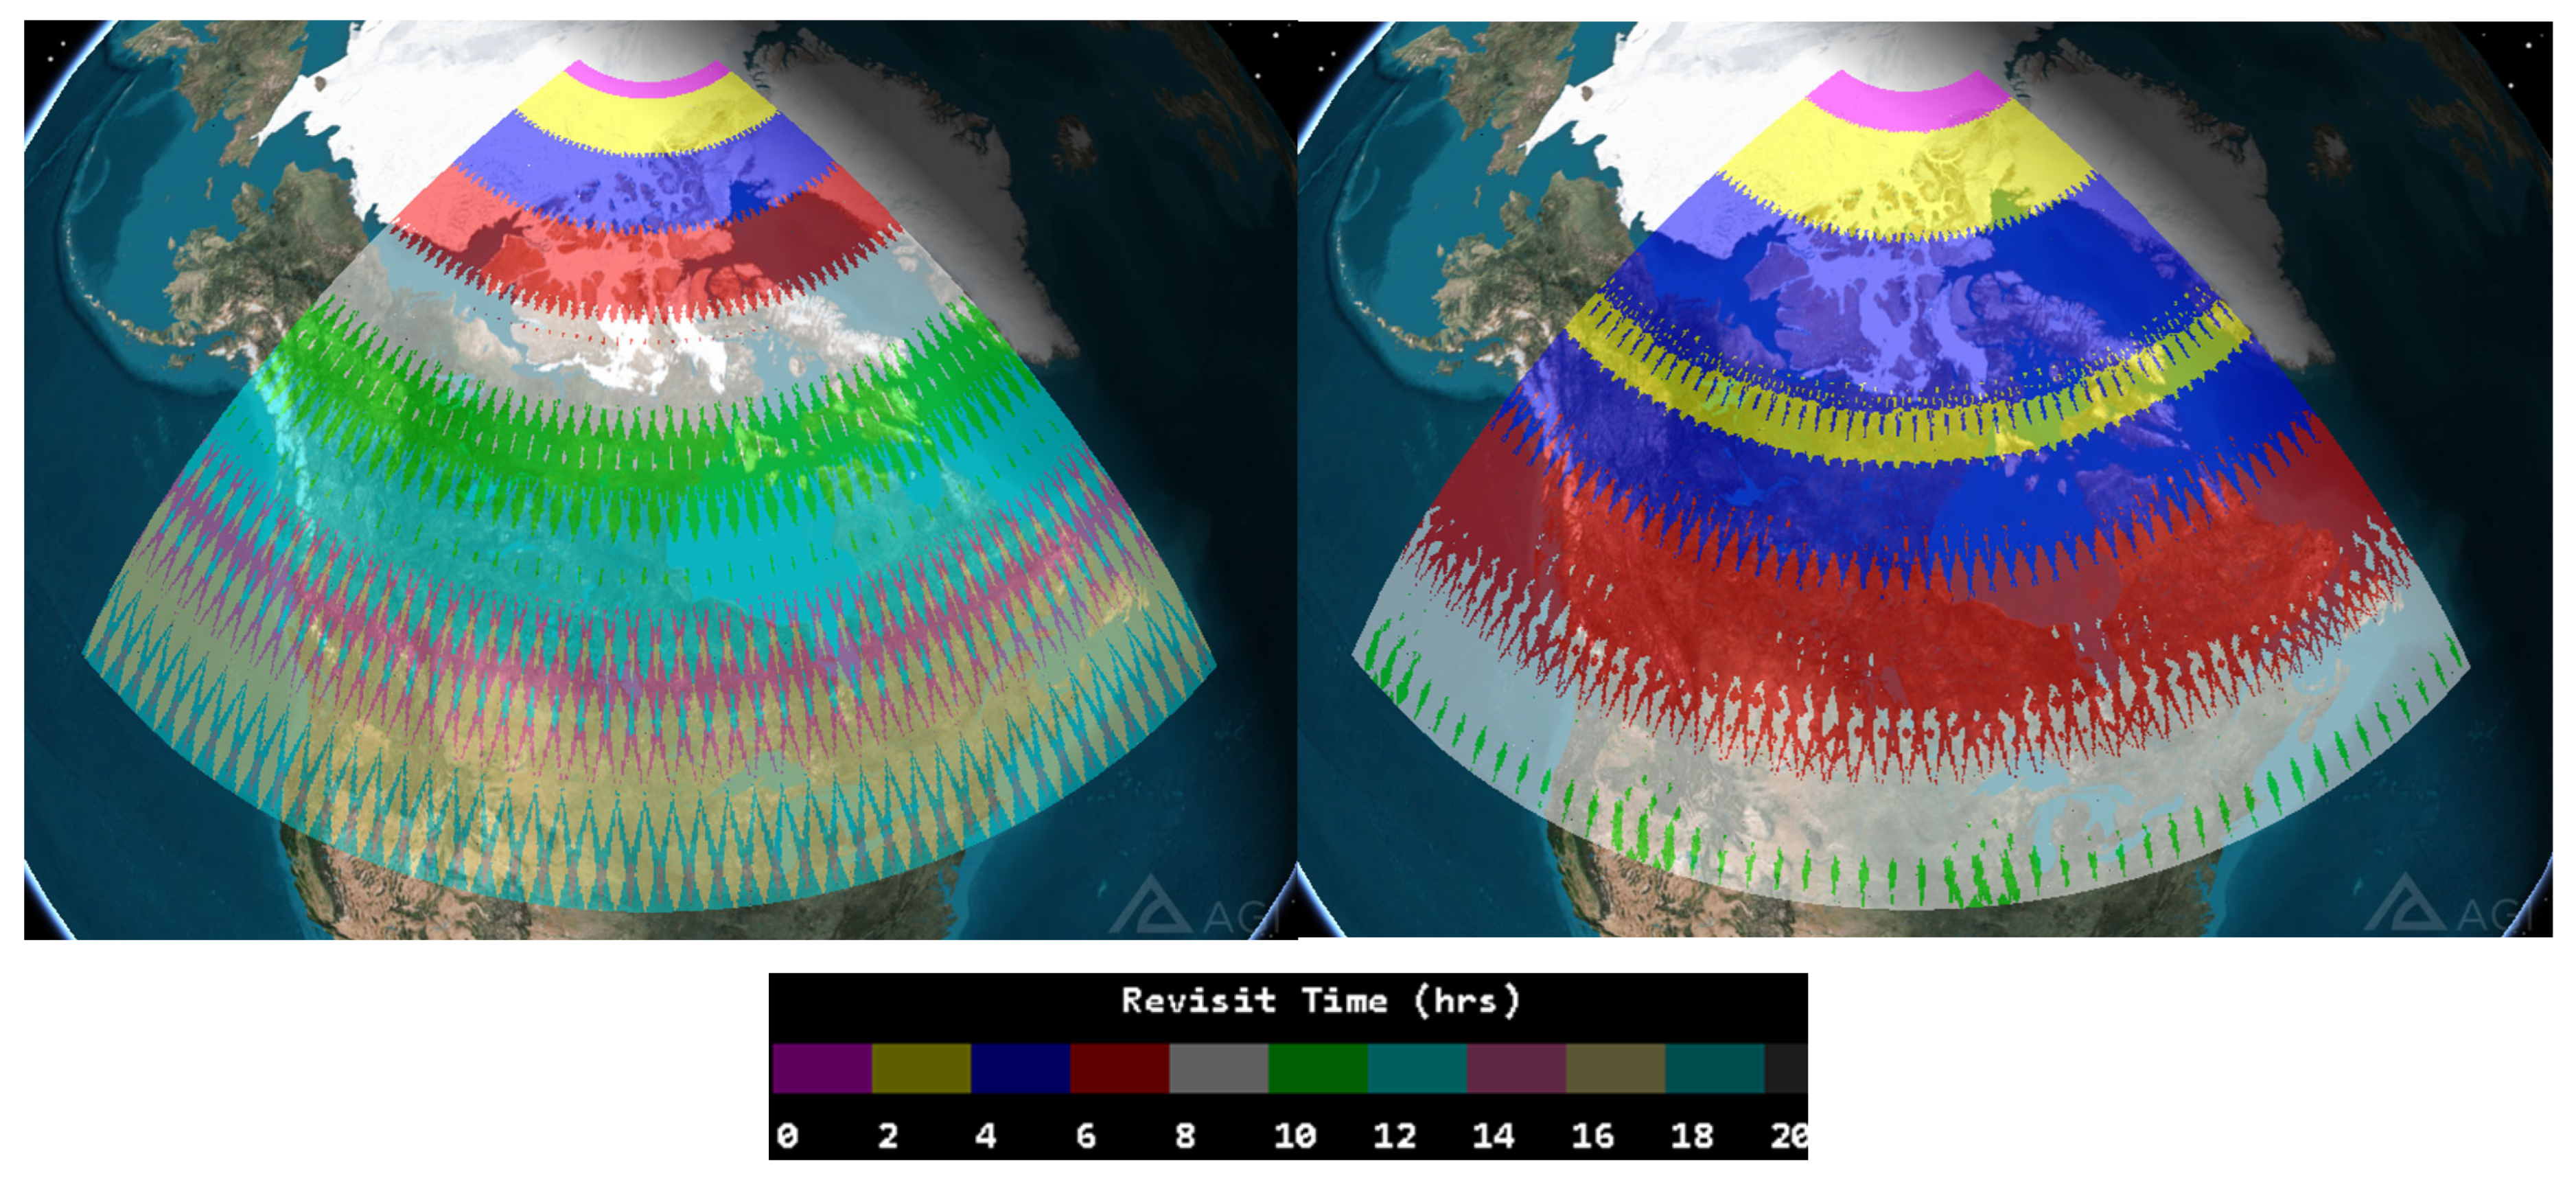
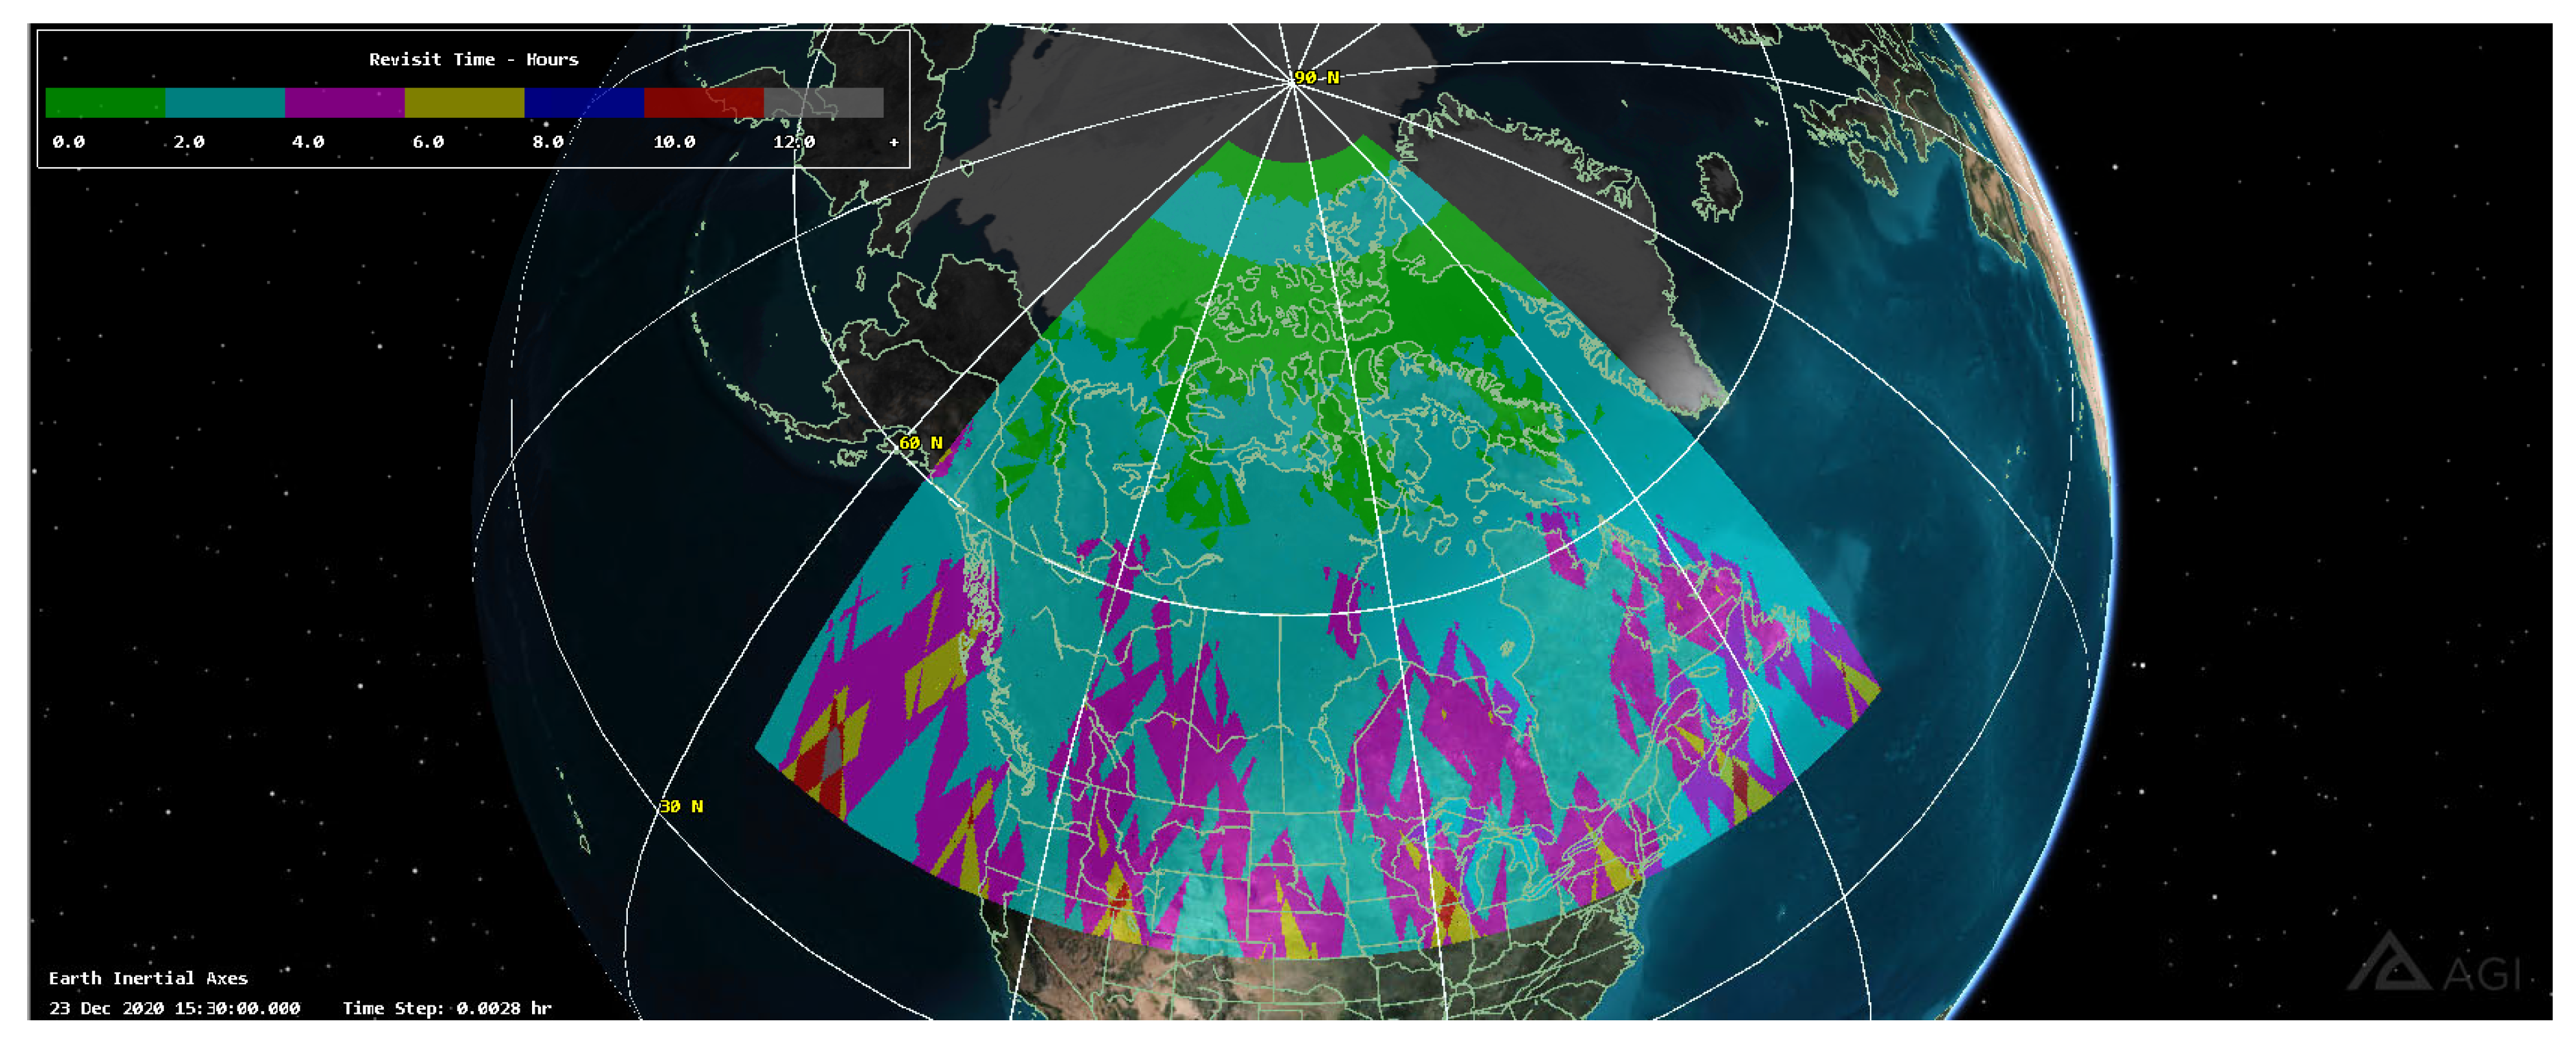
The revisit time achieved with the solution options will depend on latitude. HRWS modes will potentially be supported on the accessible swath with a width of 600 km. The simulation results with average revisit time for two options, with three satellites and five satellites, are shown in Figure 9.
The average revisit time will be from 1 to 20 h for three satellites and from 1 to 10 h depending on latitude over Canada AOIs. This time can be reduced for a specific AOI relying on left-right looking capability. The satellite orbit (except OO cases) with an altitude of 693 km and inclination angle of 98.18 degrees was considered. These orbit parameters were used for a preliminary analysis, and they can be optimized during Phase A of the mission to decrease revisit time in addition to left-right looking capabilities. In addition to the average revisit time, the maximum revisit time and coverage frequency were also calculated for driving user needs.
The revisit time achieved with four SAR satellites (two on SSO and two on OO) is shown in Figure 10, indicating that the system can potentially observe the surface of most of Canada with the revisit time less than 4–6 h. The performance of the four-satellite configuration illustrates the case in which two of the five satellites operate in bistatic or monostatic pursuit InSAR mode, simultaneously imaging the same area.
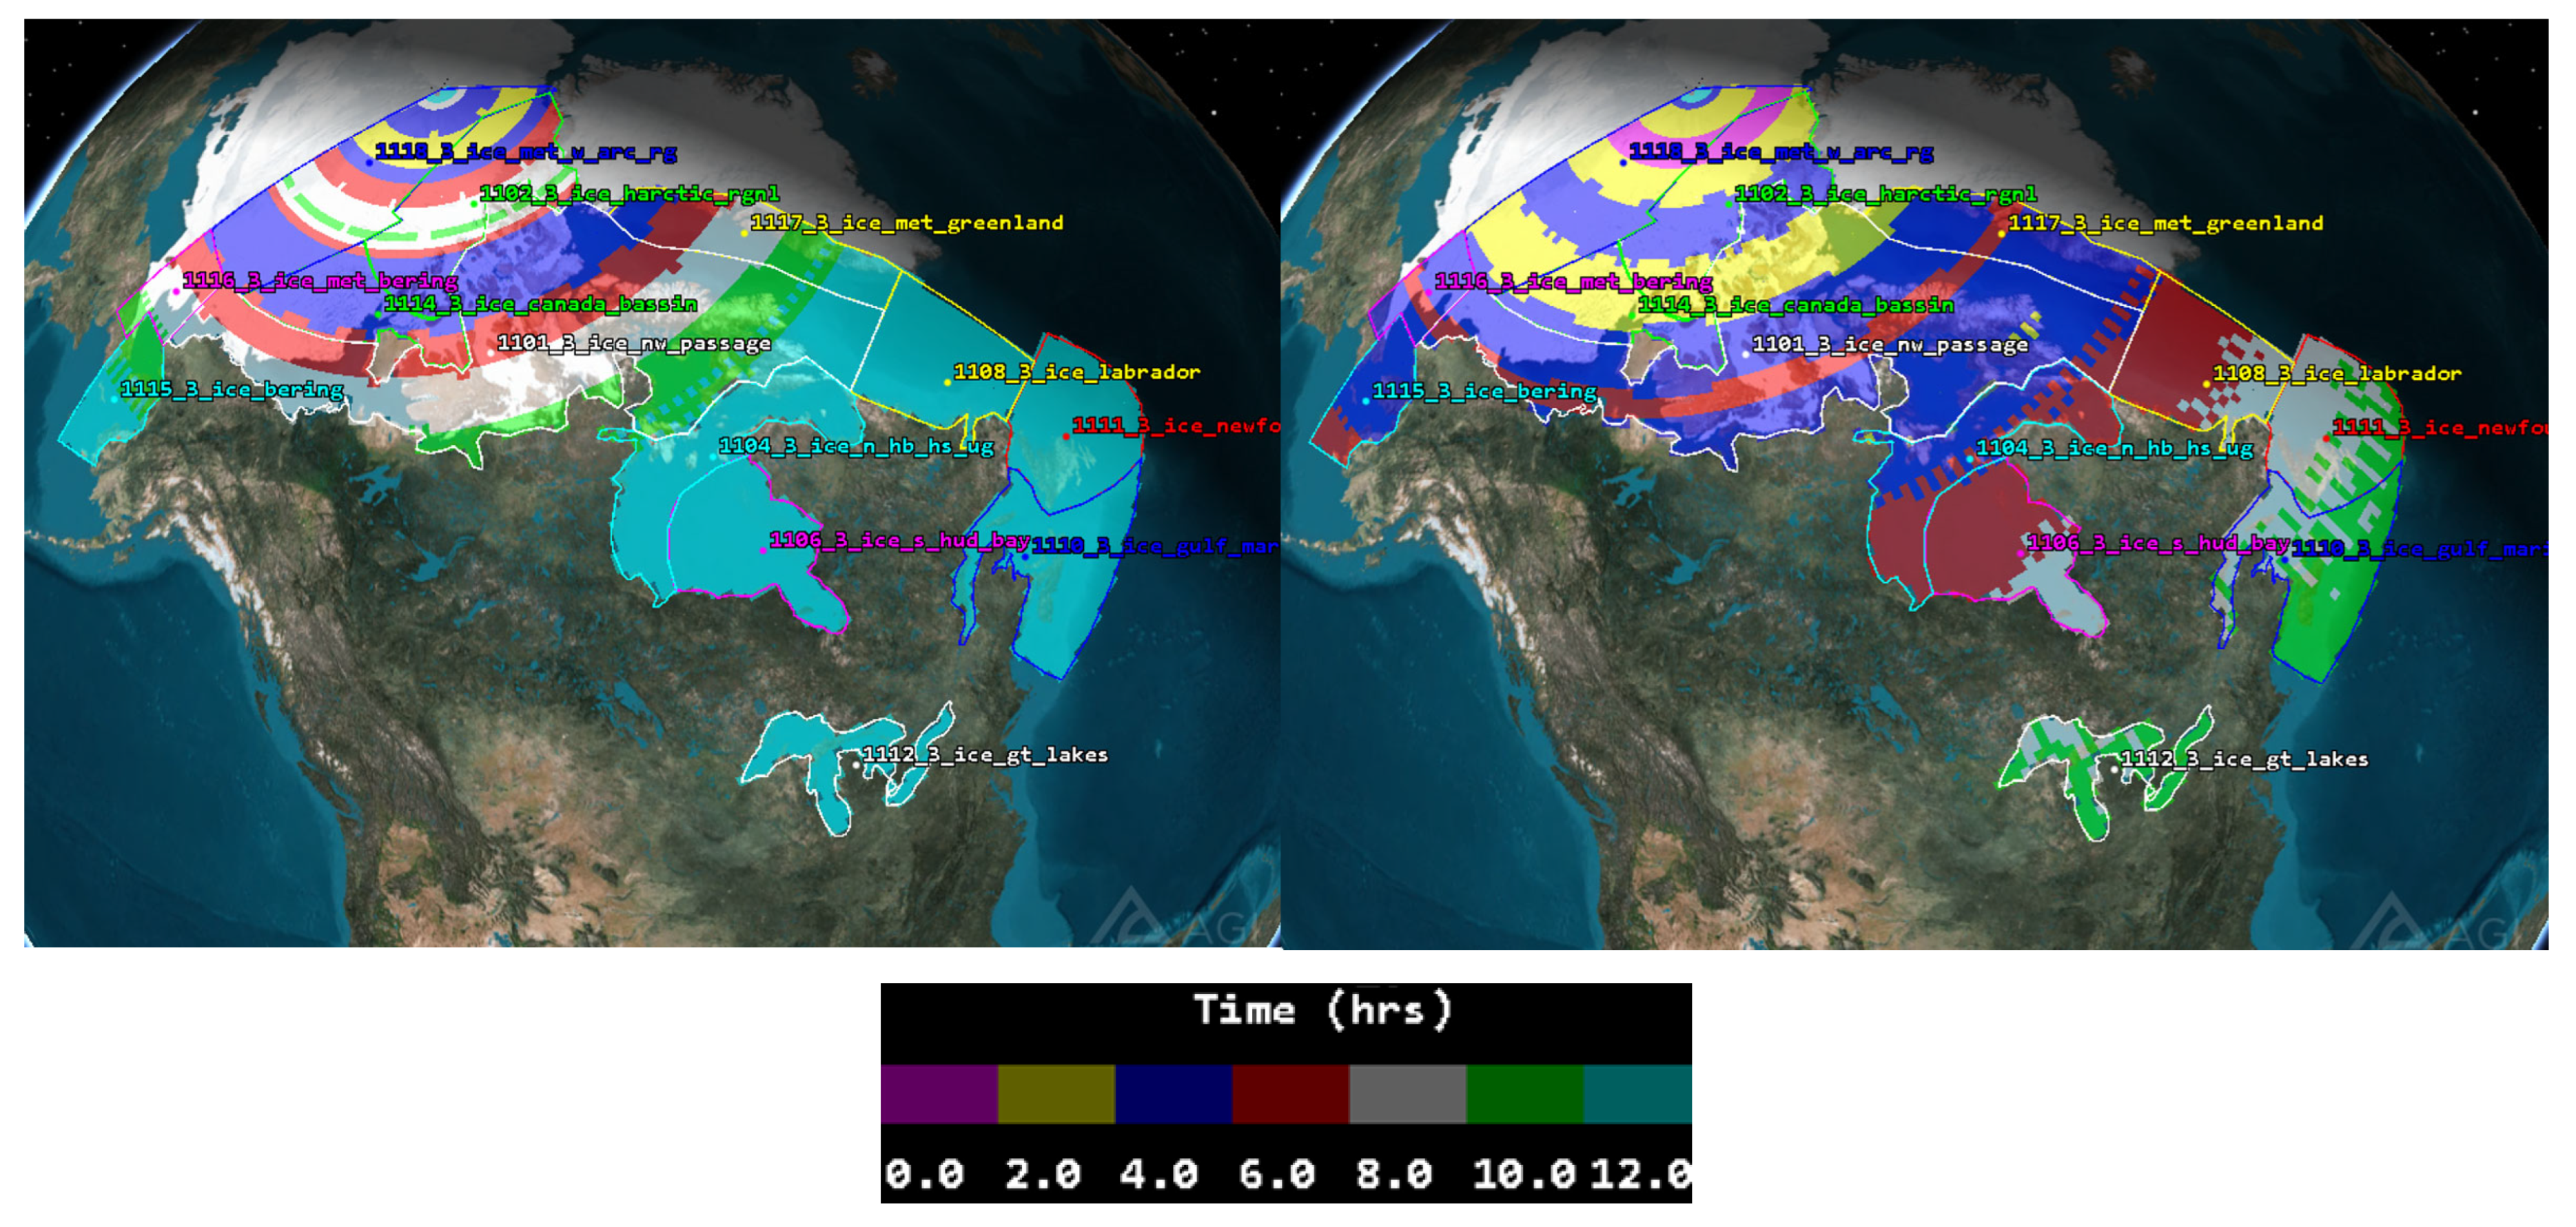
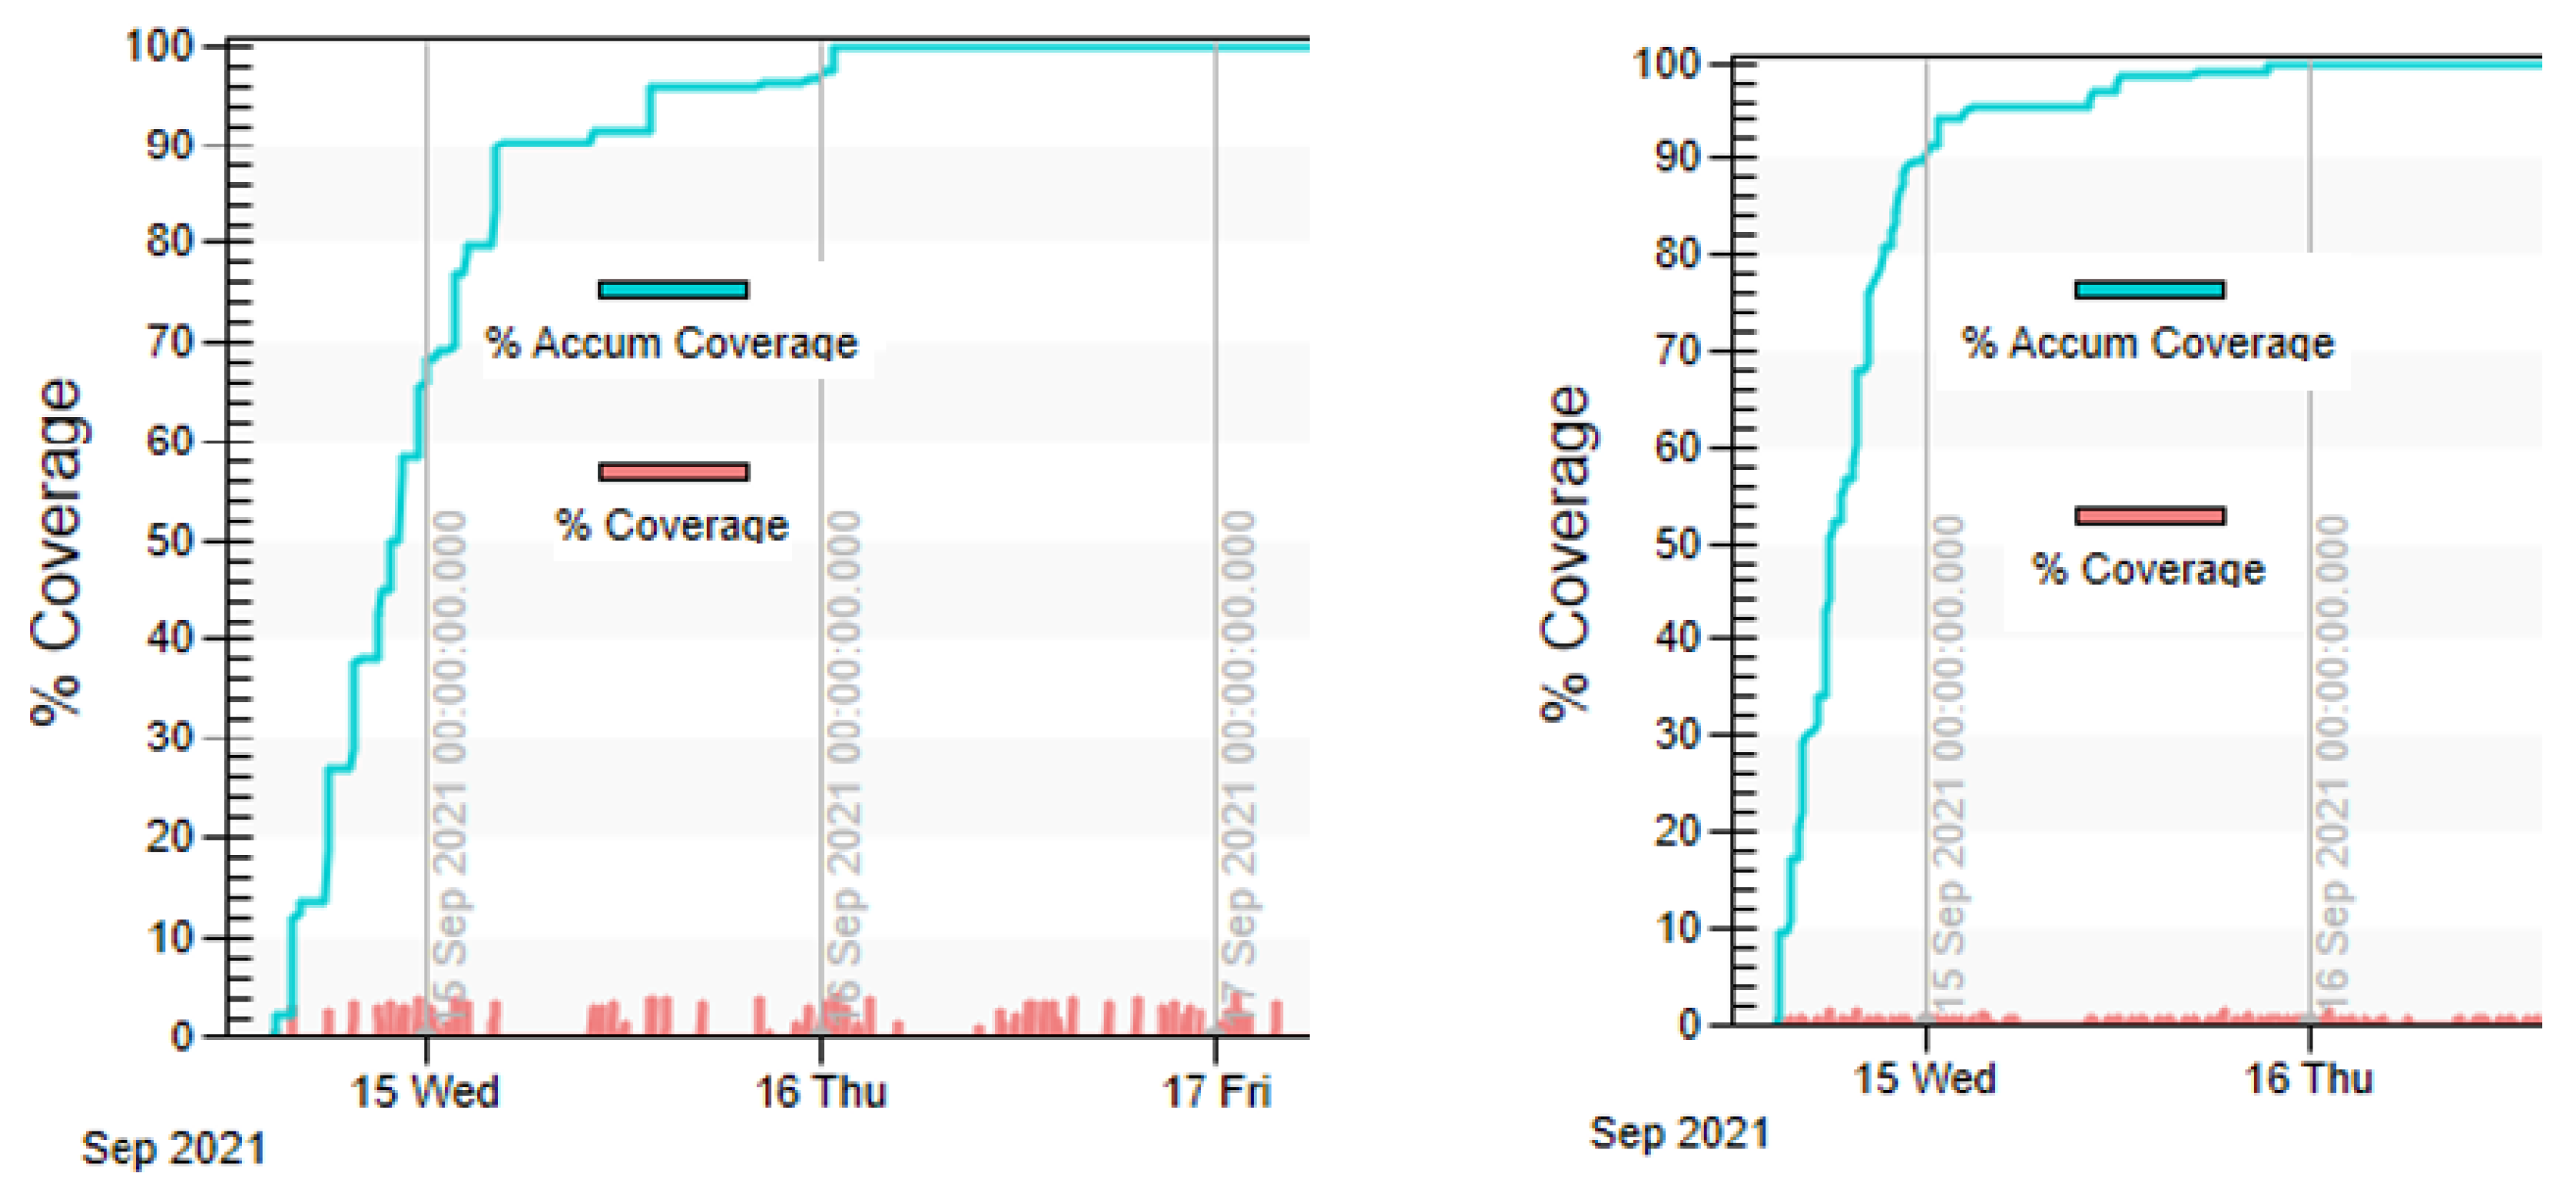
Revisit time and coverage frequency analysis for different AOIs was performed using software for digital mission engineering and systems analysis—Systems Tool Kit (STK) version STK 12 (https://www.ansys.com/products/missions/ansys-stk (accessed on 15 November 2025)). It considered specific beam modes with resolution, polarization, and NESZ (Table 2) required by the driving needs, corresponding to each AOI and required frequency (e.g., two times per day for Ice Monitoring). The calculated coverage frequency is the minimum value, which can be further improved/optimized with enhanced R4G capabilities (i.e., left-right looking, DI2S, and 600 km accessible swath). An example of coverage frequency over Ice Monitoring AOI with the HWRS beam mode (20 m resolution, 500 km swath, dual/CP) is shown in Figure 11 for three and five satellites. The color bar is in hours (i.e., 12 h corresponds to twice daily frequency). Figure 9 and Figure 11 illustrate different aspects of mission performance: Figure 9 shows the revisit time over the Canadian area of interest, while Figure 11 presents the average coverage frequency over the Ice Monitoring area.
The average value of the AOI coverage percentage to meet the requirements of the HUN need was also calculated with STK. Figure 11 and Figure 12 show the average coverage frequency (in hours) and the cumulative average coverage frequency (in %) over the Ice Monitoring AOI with the HWRS beam mode for both options as a function of time. Three satellites will cover this AOI at least 60% and five satellites will cover 100% for 12 h (twice daily).

3.2.7. Fast Tasking

The ability to shorten the duration between defining a data requirement and the analysis is essential for specific imagery requirements, for example, for disaster response. For this, the R4G satellites will have to be designed with a dedicated fast tasking mechanism. In terms of acquisitions planning, the specialists in charge of planning for acquisitions can prepare instructions for the satellite for the tasks to be performed. The possible delay for fast-tasking is the ability to upload satellite task commands. The tasking at ~6 h is currently considered as the reasonable time, while adopting new approaches, e.g., snap tasking [144] would aim to reach up to ~1.5 h. A near-real-time tasking capability (data acquisition within 25 min) has been recently demonstrated using the inter-satellite links [145]. The utilization of the data relay option will enable possibilities of satellite control in real time, thus potentially reducing the fast and/or emergency tasking time.

3.2.8. Orbit Duty Cycle

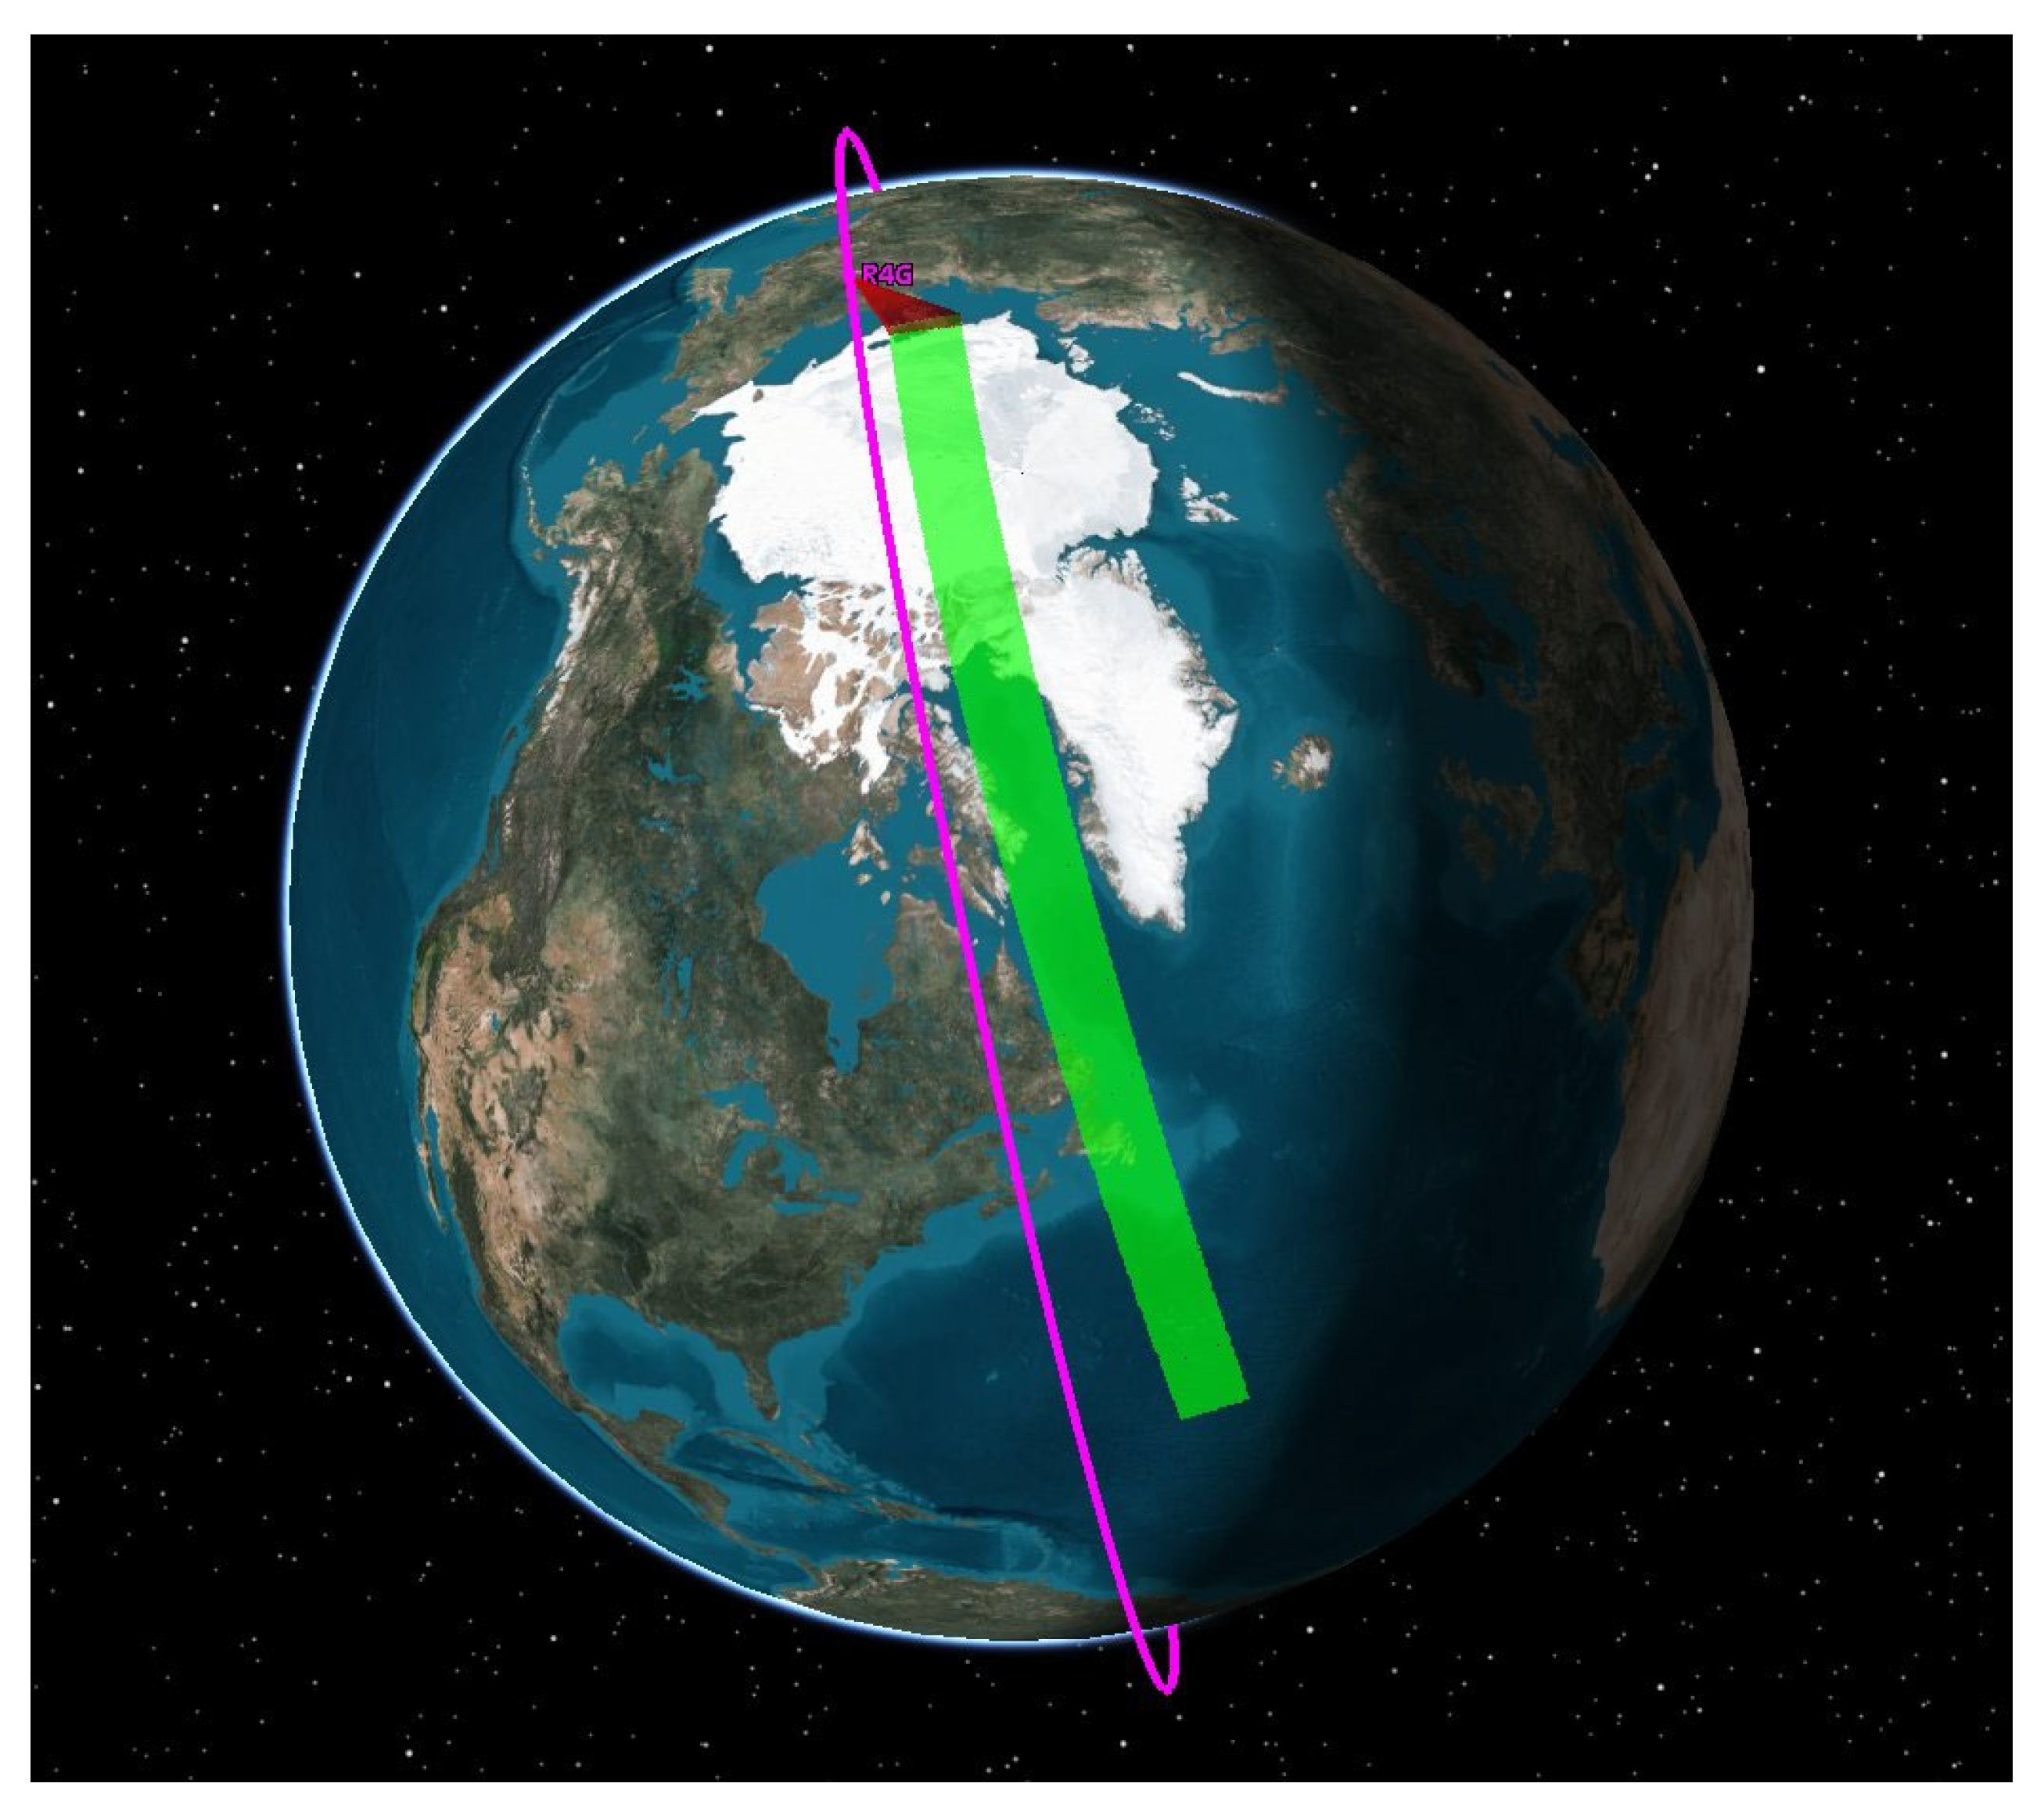
Certain user needs require coverage over large AOIs, ranging from 1 to 15 million km2 within 1–3 days, and may include terrestrial or maritime areas outside Canadian AOIs (e.g., capability to cover the entire Arctic). Coverage of such AOI could require continuous swaths exceeding 8400 km in length, which corresponds to a duty cycle of 20 min. Figure 13 illustrates an example of such a 20 min swath to capture winds to improve hurricane trajectory prediction over the Atlantic Ocean, as well as monitoring icebergs and sea ice along Canada’s East Coast and throughout the Arctic.
Power system (solar array and the battery) weight as a function of the duty cycle was calculated using established methodology [115] for typical, best, and worst case specific weights for parameters, including battery capacity and array power. The battery efficiency was assumed to be 90% and the depth of discharge was limited to 20% to preserve the battery capacity. Figure 14 shows the combined battery and solar panel mass as a function of duty cycle (13–30 min) for the sun-synchronous large-size satellite and for the large-size satellite on optimal orbit (70° inclination), respectively.

3.2.9. Spacecraft Mass Budget Estimate

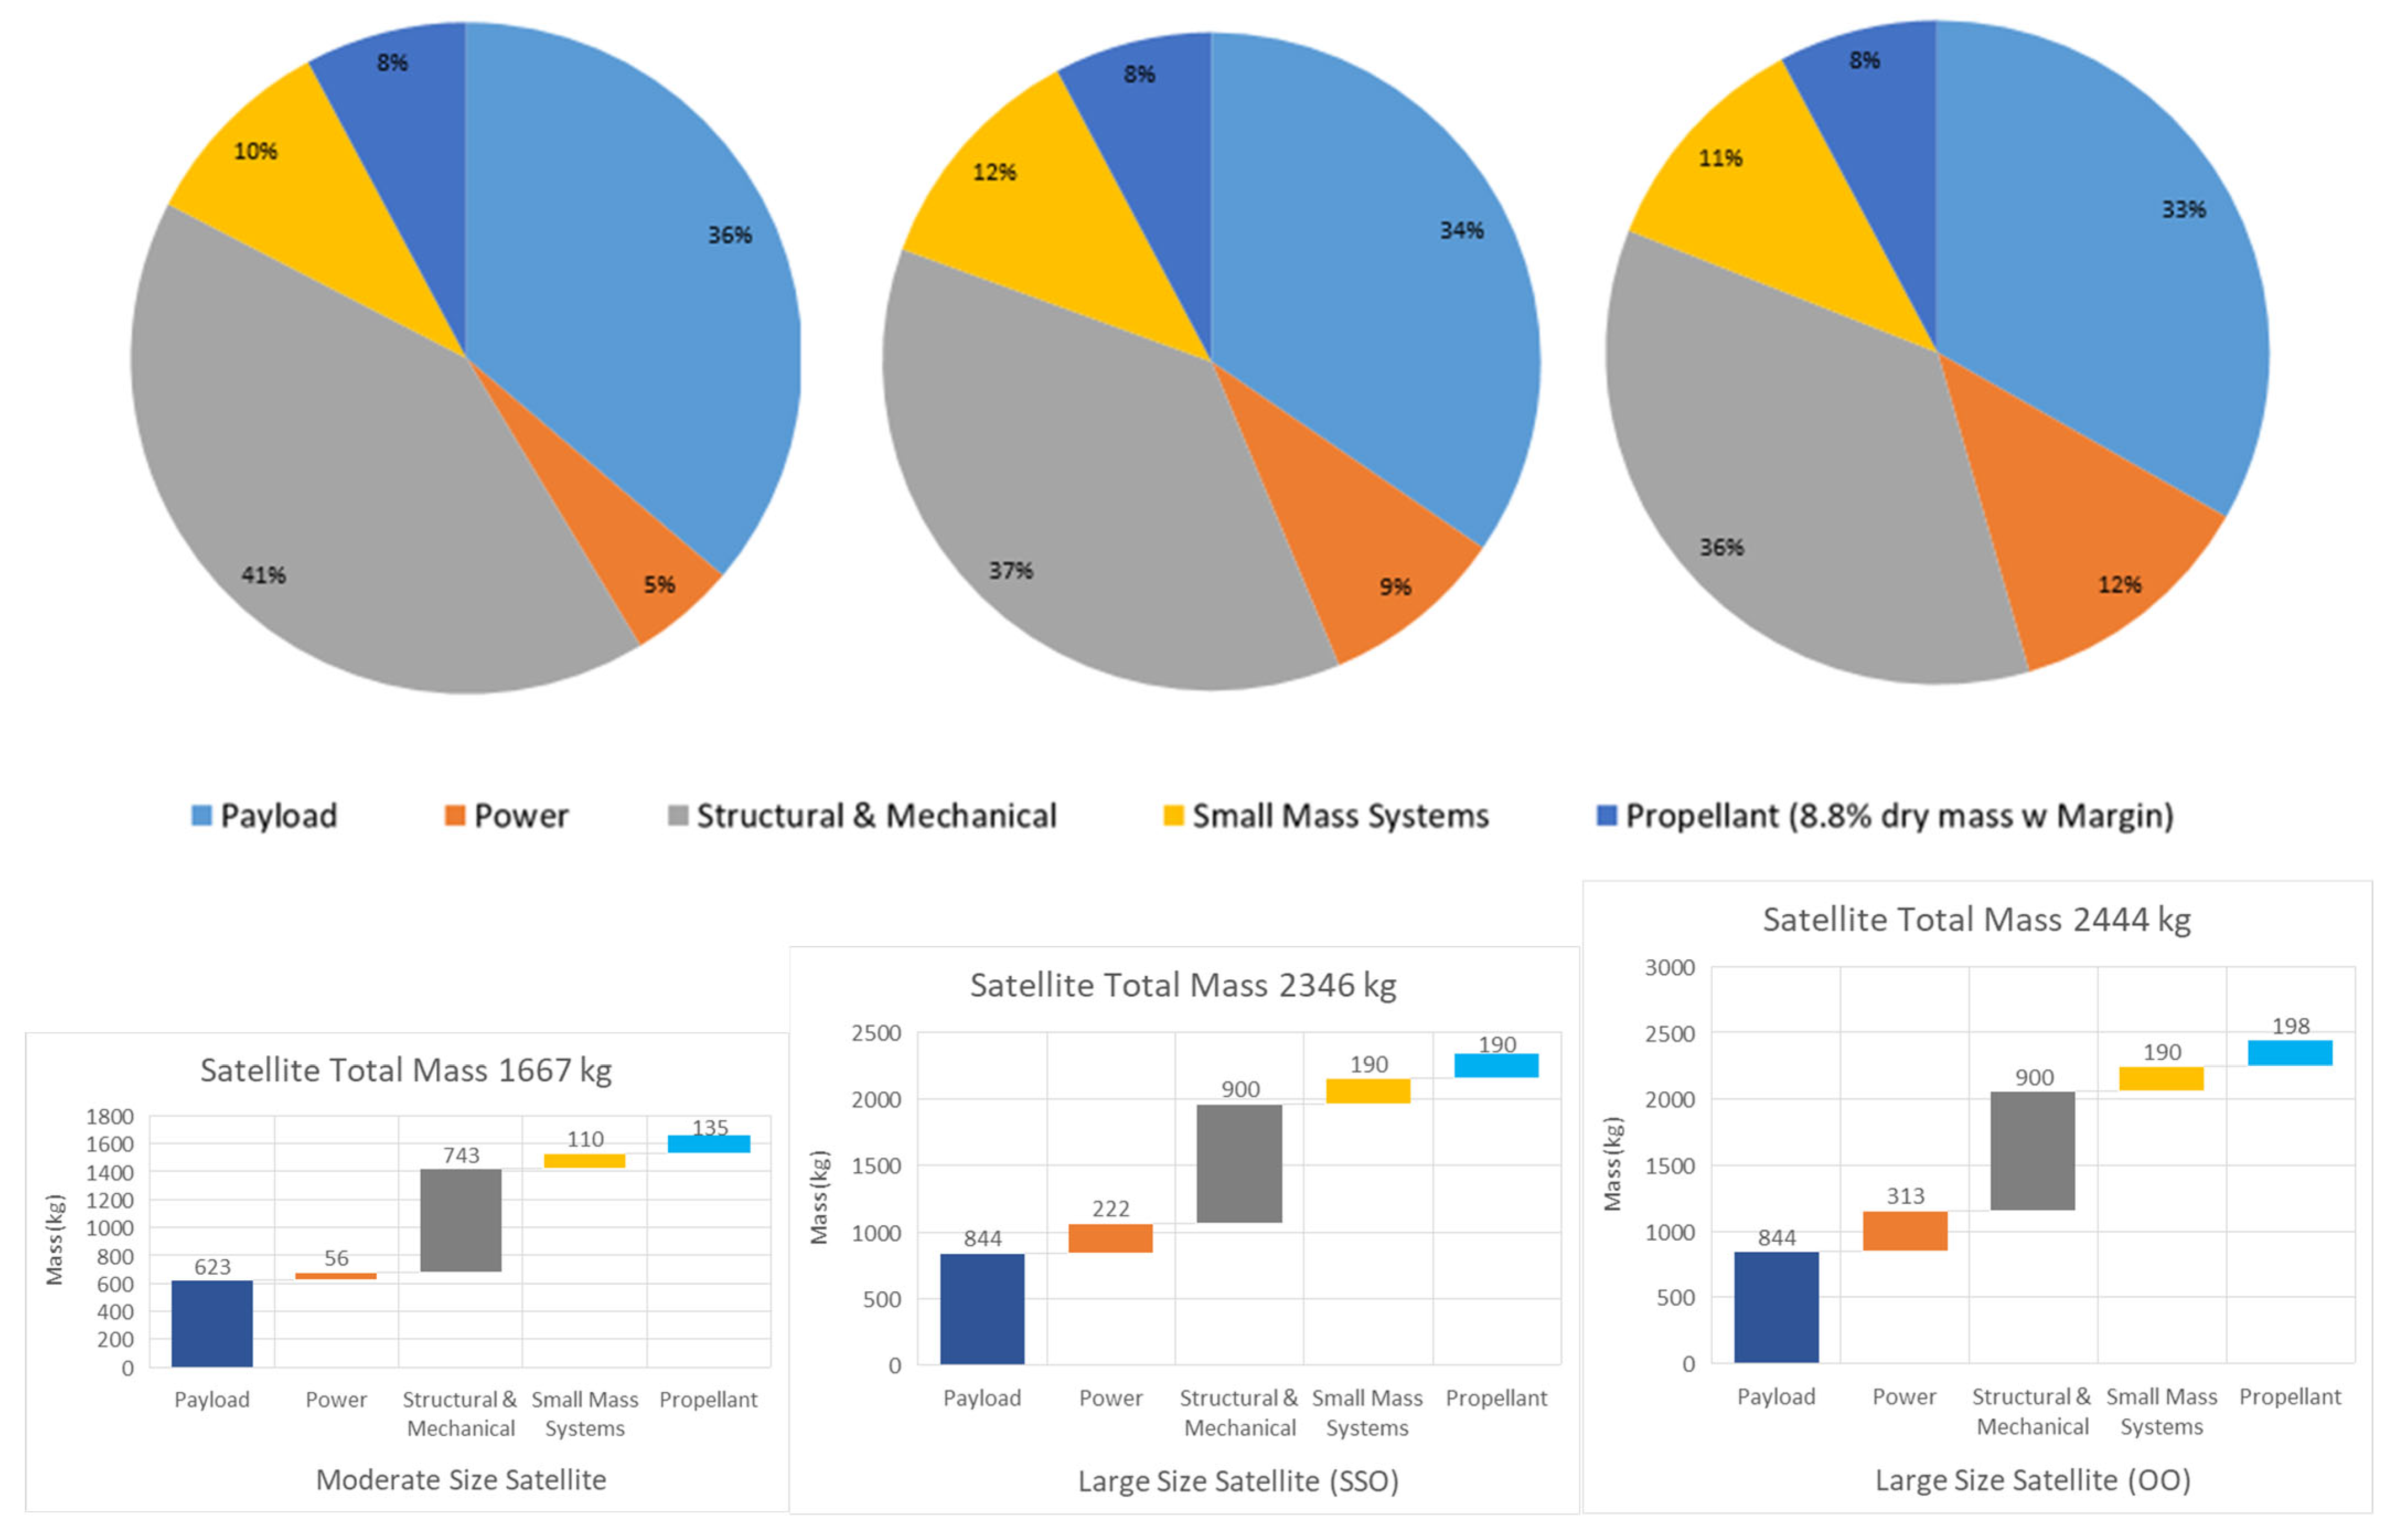
Preliminary estimates of the satellite's mass budget are an important input for calculating the satellite cost. To estimate the mass values without a detailed system design, the historical SAR missions (RCM, TerraSAR-X, Sentinel-1, and others) with known subsystem mass values were used. The major subsystems in the context of the mass budget are payload, power, structural and mechanical subsystems, as well as propellant. The other subsystems, with a small contribution to the mass budget, are Communications, Command and Data Handling (CDH), Attitude Determination and Control System (ADCS), as well as the thermal system. The estimation of the amount of propellant required for the satellites was taken as a percentage of the overall dry mass of the satellite. The percentage was calculated by using Sentinel-1’s propellant weight compared with its dry mass and scaling it for 15+ years of operation instead of Sentinel-1’s 12 years. The wet mass breakdown as a percentage of overall mass is shown in Figure 15 for the moderate and large-sized satellites. The total wet mass of the moderate satellite was estimated to be 1667 kg. The mass budget for the large-size satellites included two options: sun synchronous (2346 kg) and optimal orbit (2444 kg).

3.2.10. Data Latency

Latency is defined as the time between the acquisition of data, processing to the required level, and the transfer of the data to the end user. The consolidated HUN requires a minimum data latency of 15 min for several needs at the threshold level and a minimum of 5 min as the goal.
Data latency is governed by the location of the ground stations or data relay services selected for the mission, which are composed of the following:
  • Existing NRCan ground stations;
  • New additional Canadian ground station(s);
  • Commercial ground stations (Canadian and international);
  • Data relay satellites.
The duration of the process from acquisition to delivery of data using the existing ground station network is possible between 10 and 30 min, as it is already demonstrated with RCM (RCM technical characteristics. Timeliness and data latency at https://www.asc-csa.gc.ca/eng/satellites/radarsat/technical-features/characteristics.asp (accessed on 7 November 2025)) for near-real-time tasks. The latency analysis for different AOIs was performed using OrbitPro, a tool developed at AIRBUS to quantify latency for different locations.
The latency map (worst case only), including NRCan and additional stations, is shown in Figure 16. All sites are assumed to be equipped with compatible Ka-band antennas.
Having all six stations may look redundant, but in the case of multiple satellites (including tandem formation), it will be beneficial. An efficient solution to resolve this latency problem would be to consider a data relay system to downlink the data. A data relay solution will guarantee extremely low latency (<10 min) globally, which is very important to monitor the areas of the world where the placement of an antenna and its operability are not feasible. This would be applicable for the global detection and identification of fishing vessels in remote areas or timely data take and downlink in case of natural disasters.
A potential component of the space segment for EO service continuity is the use of a data relay as a space–ground interface. There are many relays available, including the European Data Relay Satellite System (EDRS) and the Japanese Data Relay Satellite (JDRS). A possibility of using Telesat’s Lightspeed system, a Canadian Solution in low Earth orbit (LEO), is currently under investigation. The satellite data relay solution will allow high efficiency to satisfy the requirements of low data latency. In this case, the satellites will be equipped with additional communication payloads. Geostationary position enables the communication satellite to maintain an almost constant connection with EO satellites flying in low Earth orbit. Two satellites, ERDS-A and ERDS-C, provide encrypted data downlink with very high data rates up to 1.8 Gbps. It can also be considered for the optical communication payload to fly on a communication satellite in geostationary orbit, already scheduled to take its place in an orbital position over the Americas. EDRS does not currently cover the Americas, nor is it planned, and a Canadian-built node to EDRS would fulfill such coverage while at the same time obtaining worldwide access (optical inter-satellite link between EDRS).

3.2.11. Ground Segment and Data Handling

The ground segment will require reception antennas, reception stations, a data center enabling archive storage and cloud computing capabilities. The Ka-band antennas will provide increased downlink capacity but will require future upgrades of existing ground stations. Transmitters and receivers operating in Ka-Band can support downlink data rates up to 2.2 Gbps [146]. The Ka-band frequency is more susceptible to radio signal attenuation in high moisture conditions than lower frequency bands (e.g., X). In this case, a secondary frequency band (X-band) is considered for data transmission as a backup, as it is less affected by heavy precipitation and can ensure more reliable communication under adverse weather conditions. For such days, the downlink data rates can be about 500 Mbps per channel. Isoflux antennas operating in Ka-band suffer a performance penalty versus X-band, and, therefore, steerable antennas in Ka-band are required to maintain the same link margins as X-band.
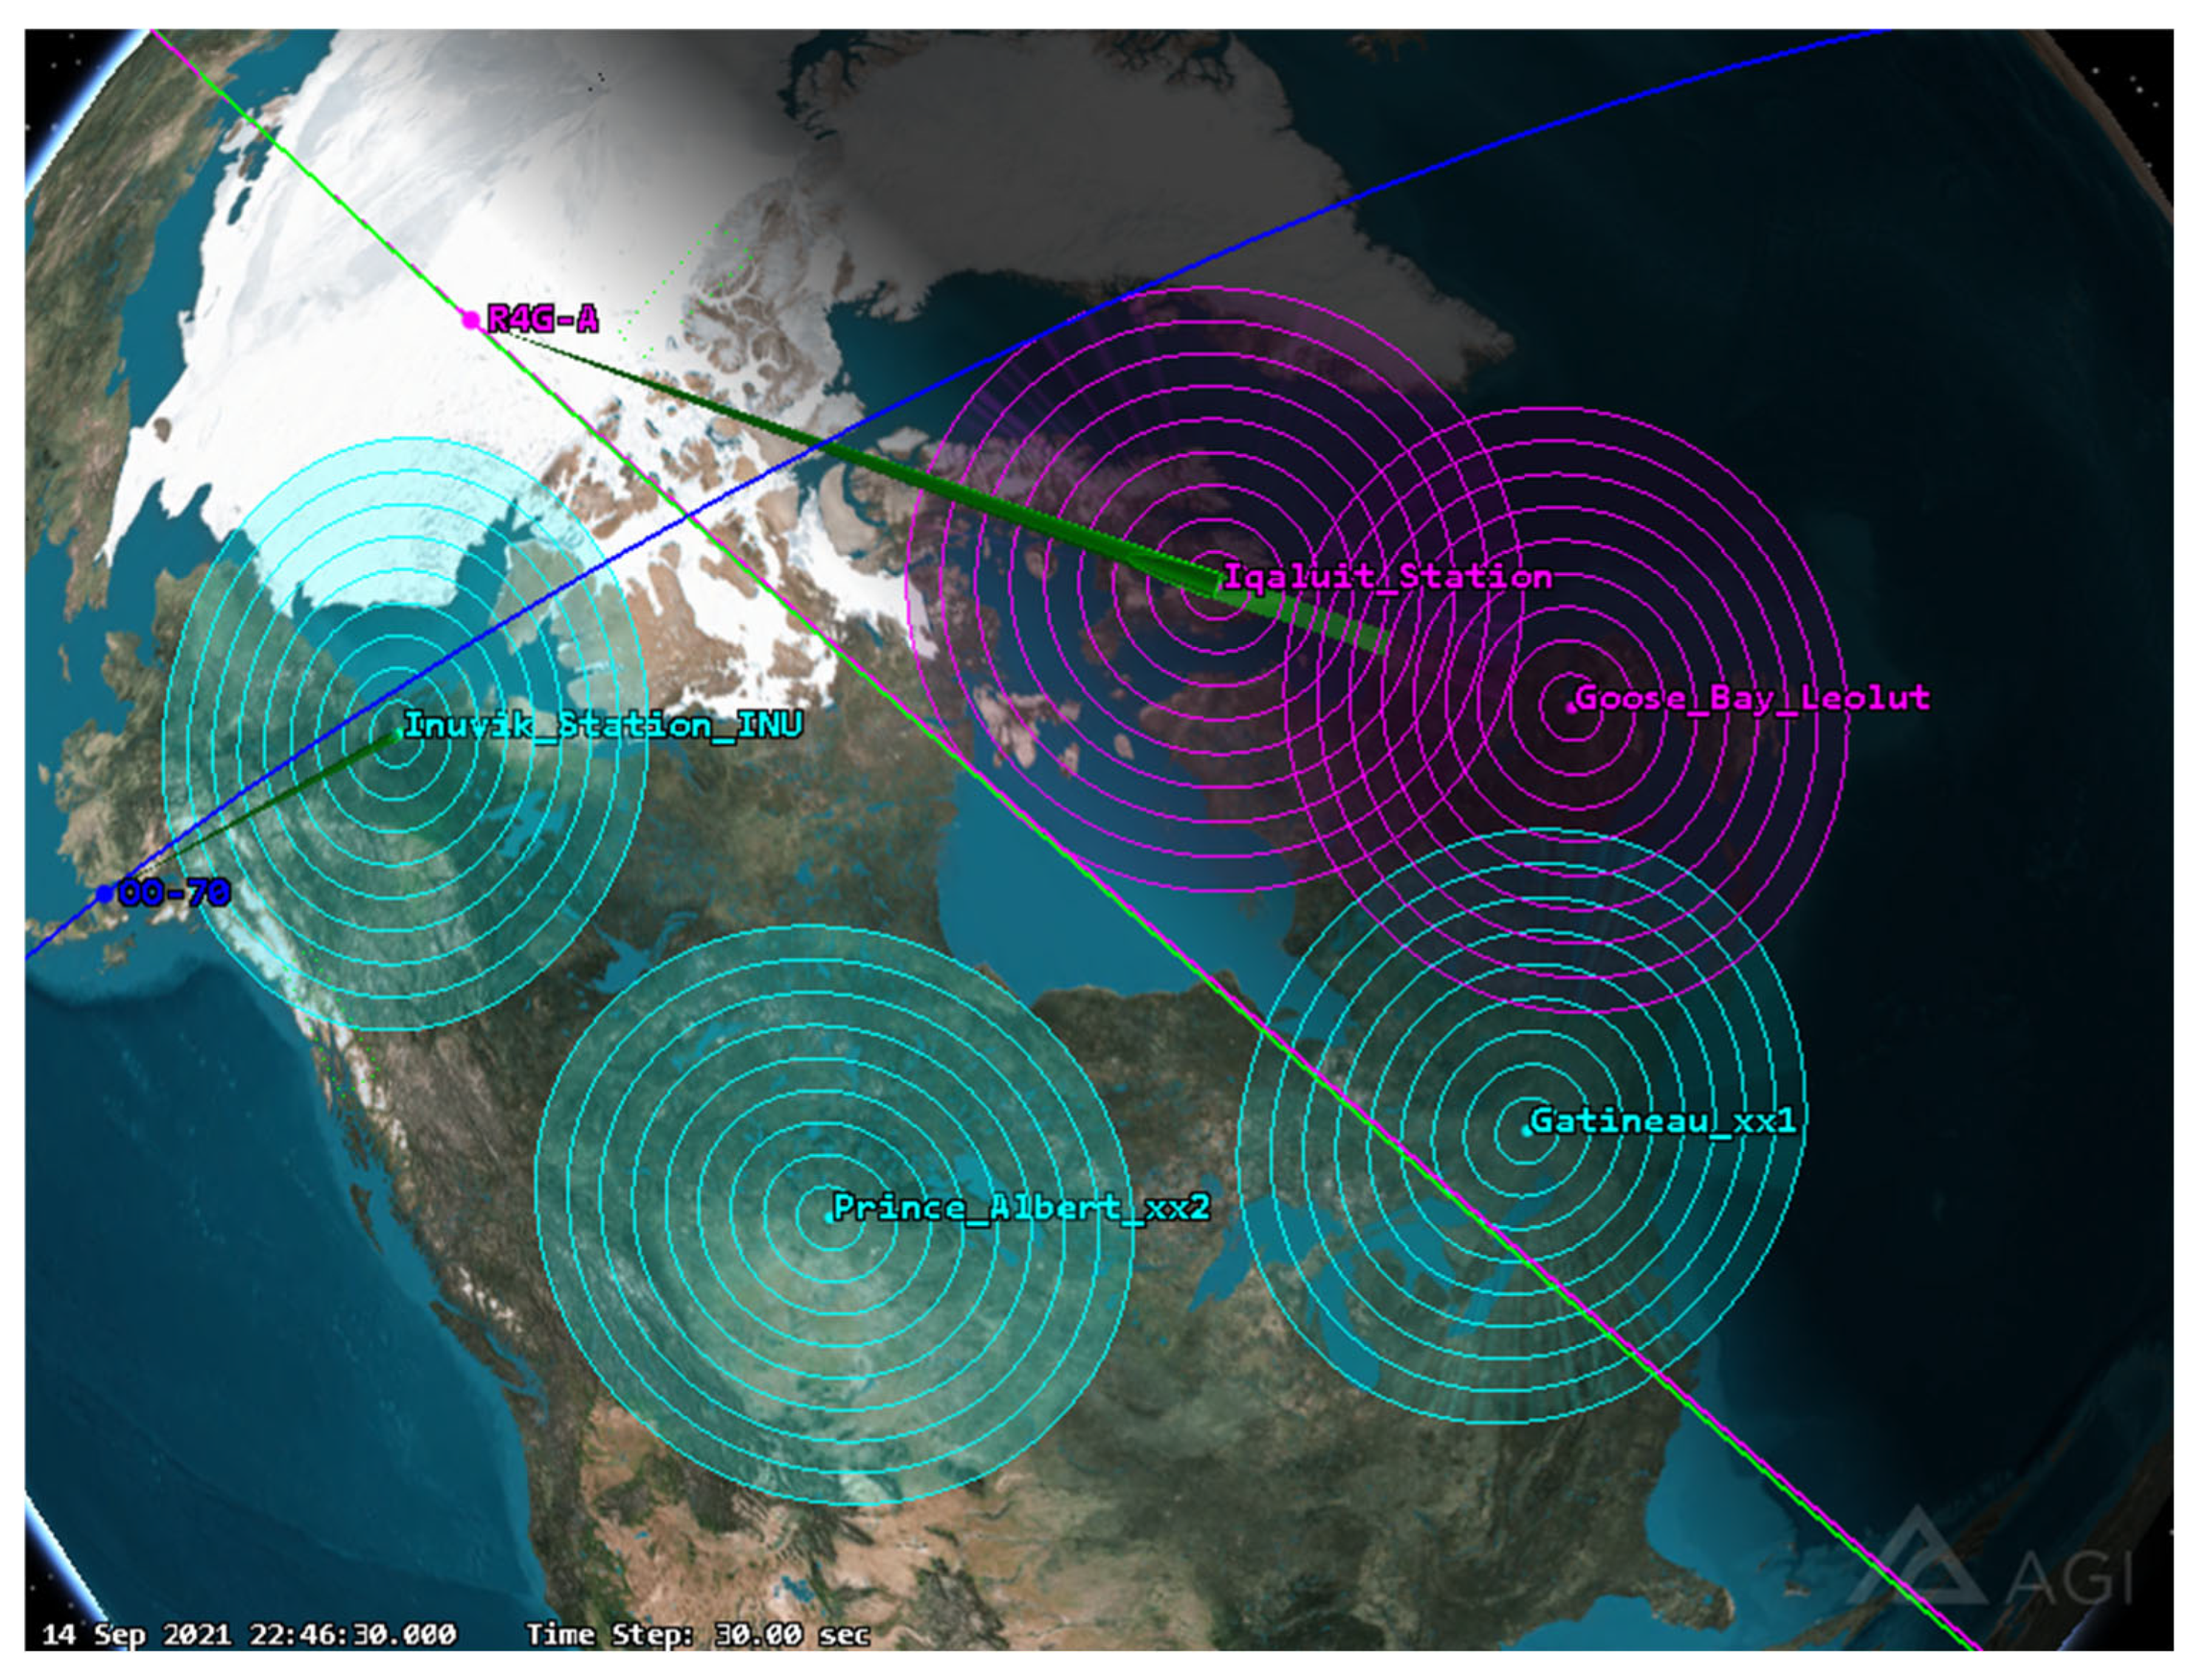
The GC could consider accessing C-CORE’s ground station capacity in Happy Valley Goose Bay, Labrador, and/or building a new ground station with Ka-band and X-band capabilities in Iqaluit, Nunavut, which would help decrease data latency. Figure 17 shows areas accessible by satellites with existing (green circles) and proposed new (magenta circles) ground stations, which were calculated considering a minimum elevation angle of five degrees. The statistics calculated for each ground station show that the average access time pass varies from 323 to 410 s.

3.2.12. SAR Data Handling

Future SAR missions will potentially acquire data at an enhanced orbit duty cycle, at higher resolution, in multiple polarizations, and eventually larger swath widths. Combined with the increasing need for low-latency products, there is a clear demand for more efficient and flexible onboard data handling than is available with current satellites. The requirements collection for on-board processing for SAR and EO/IR payloads was developed and analyzed by Scheiber et al. [147] to bring the required downlink rate to a feasible level.
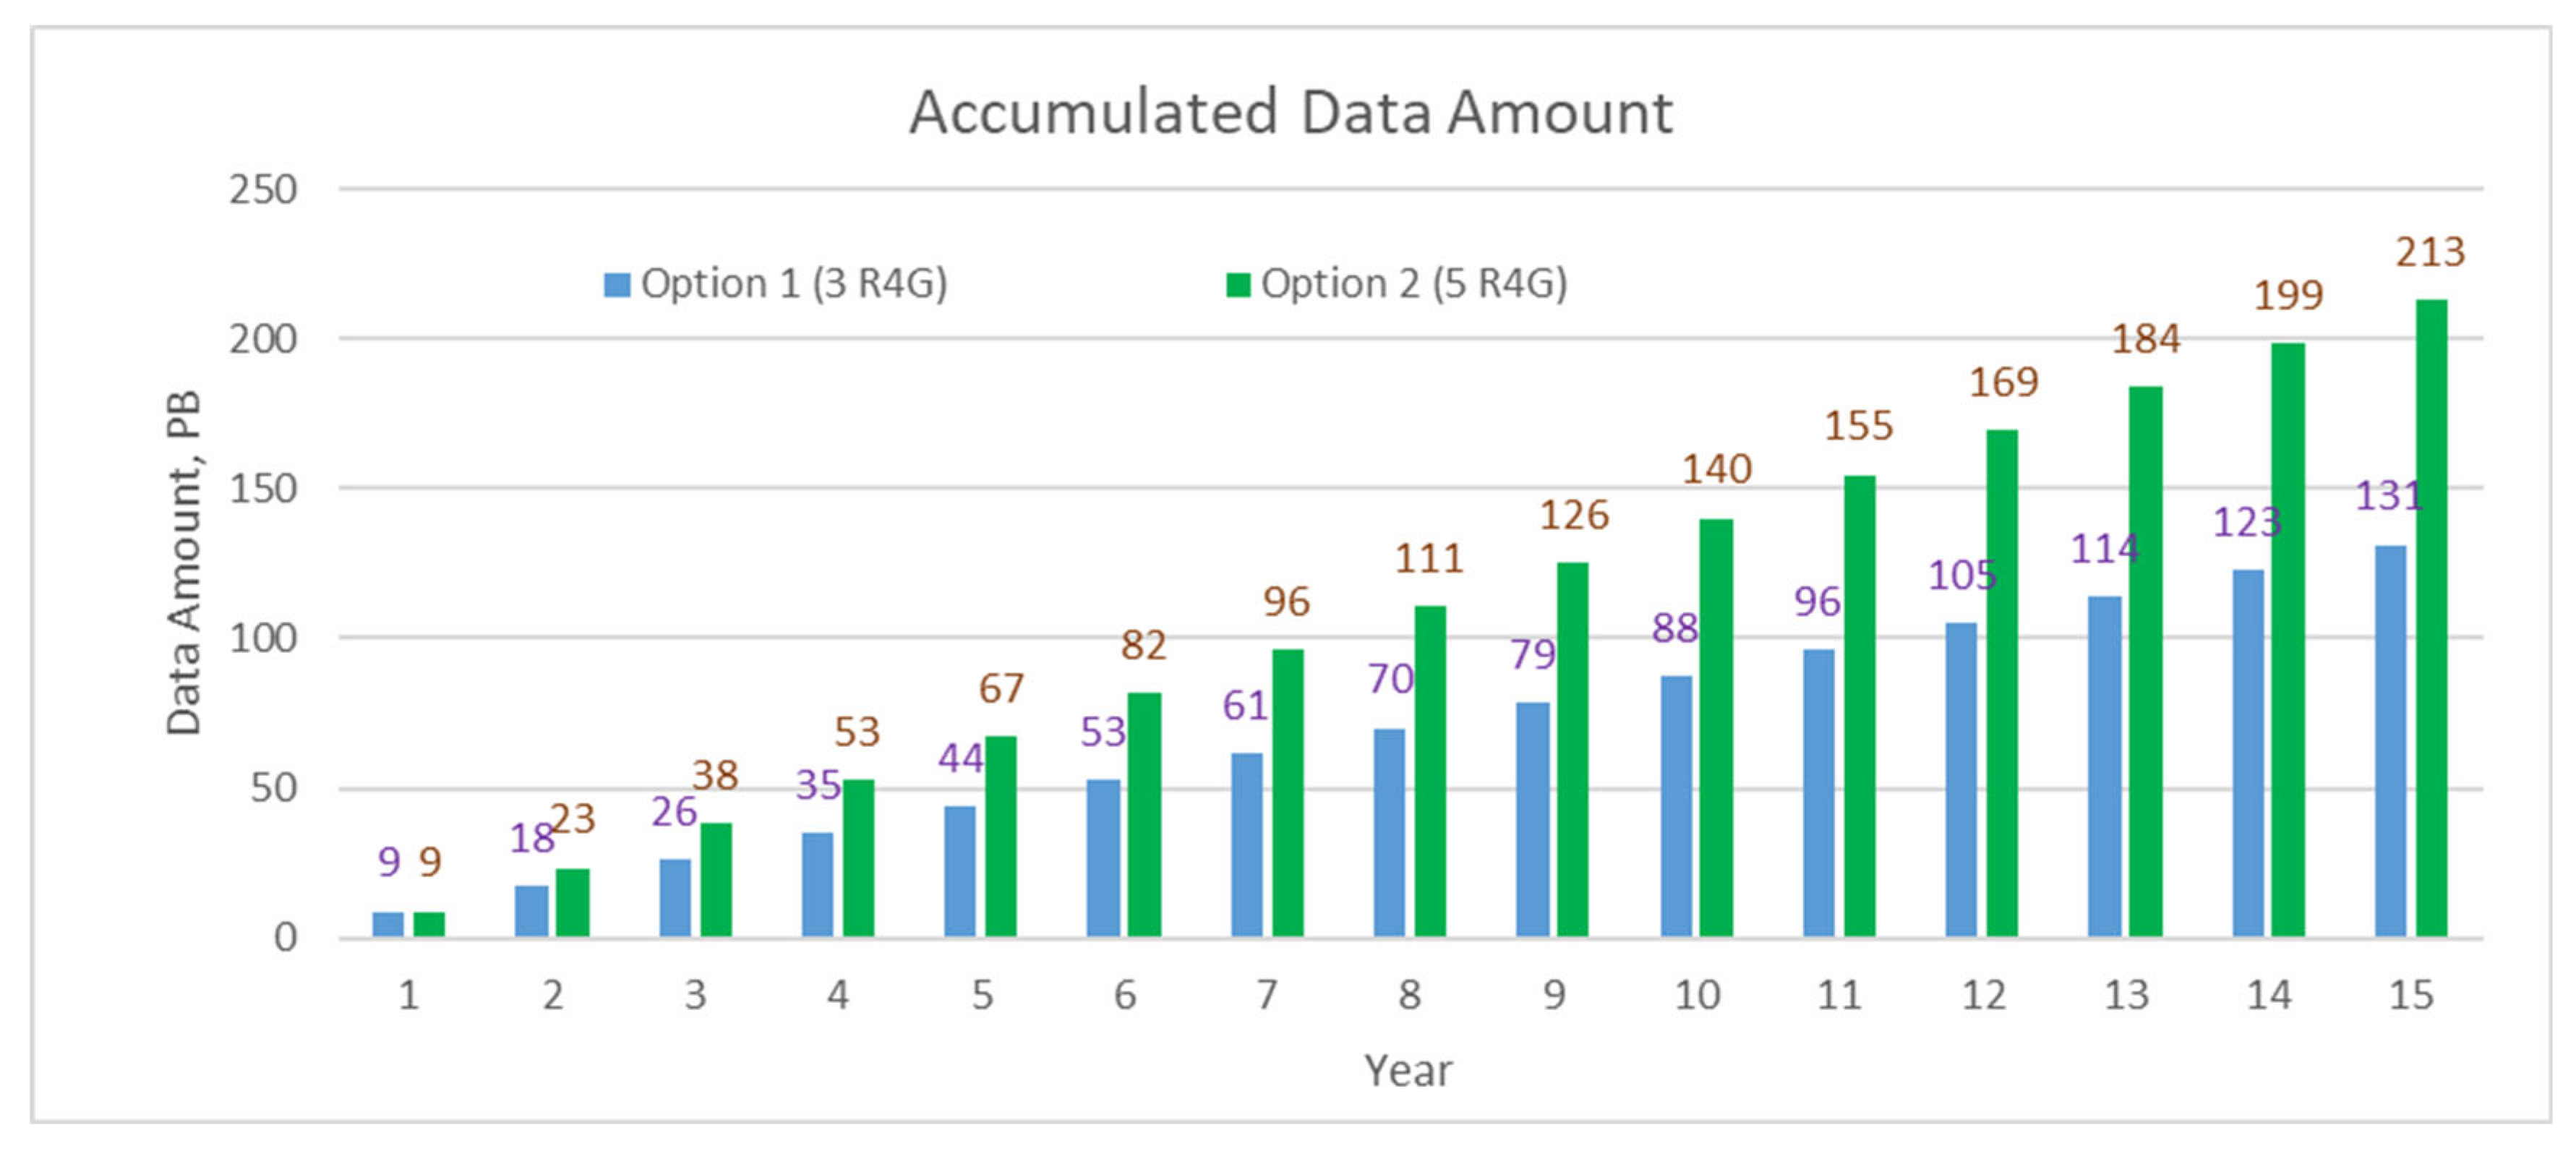
It is expected that the proposed satellites will generate significant amounts of data. For example, a single SAR satellite will be capable of generating up to 4 terabytes (TB) of data per day. For operational applications, it is important to have predictable and reliable access to near-real-time data. Having three SAR satellites will result in up to 12 TB of data per day and about 8.8 Petabytes (PB) per year (14 PB for five SAR satellites). These data must be stored at different processing levels (raw instrument data, imagery, and value-added products). An archive for the data as well as derived information products, which can be easily and efficiently exploited, will be required. A feasibility study is required to determine the required data processing levels for storage and archive, because SAR data can have several processing levels or formats. The preliminary estimation (Figure 18) shows that raw data and information products will be accumulated in amounts of 131 PB for Option 1 and 213 PB for Option 2 during 15 years of data continuity. If data volumes are higher, then large amounts of data can be efficiently stored on hard drives or tape libraries without a significant cost increase (within a small fraction of satellite operation cost).
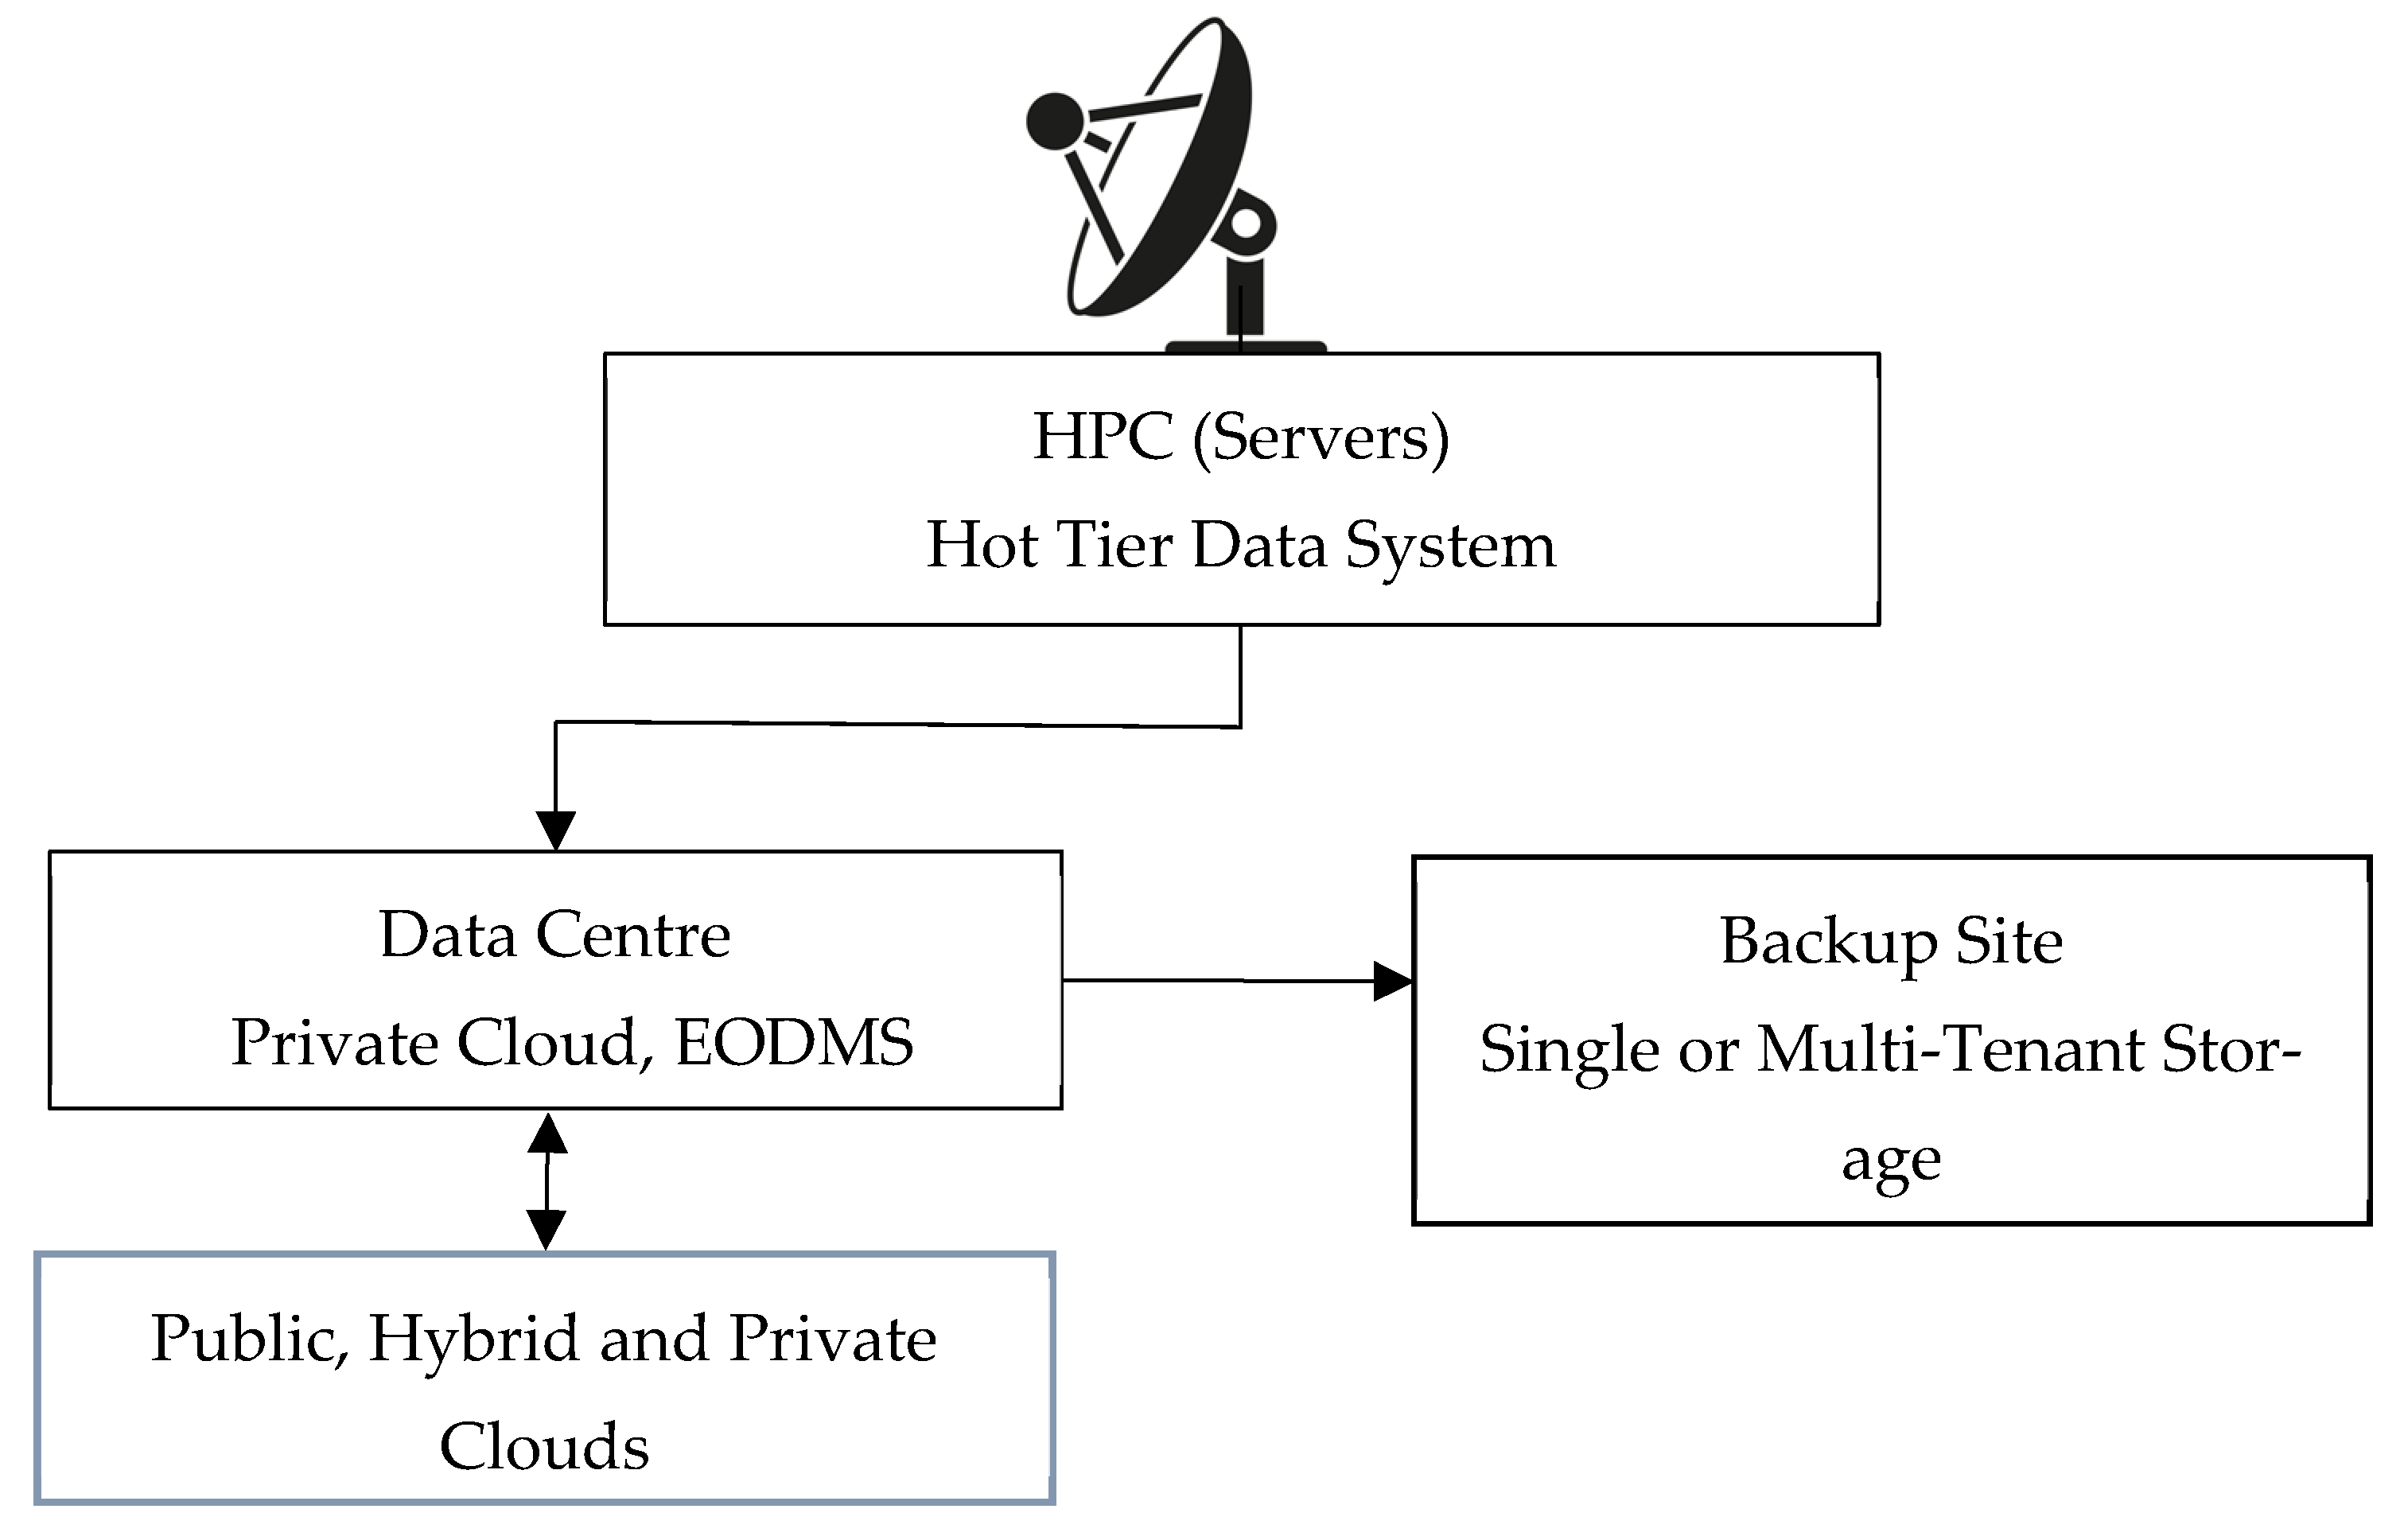
Data processing, exploitation, and dissemination (PED) can be delivered by deploying one or several data centers, which can be distributed over different locations in Canada. The storage of backup at different geographic locations would secure data in the case of natural disasters. The data center can be a new unit extending the capabilities of the Earth Observation Data Management System (EODMS) to cloud processing, big data analytics, etc. For compliance, the data center will need to be protected with security controls. Physical security measures shall include monitoring, fire prevention, and suppression systems, and access controls to protect the assets from potential hostile events or accidents. A high-level architecture of the data center concept is shown in Figure 19. The data center would potentially be integrated with the existing ground system infrastructure currently used for RCM [148] enabling efficient satellite operation and PED. The data center would support cloud capabilities should it be required by GC. The detailed requirements for the data center must be developed based on needs in data processing, analytics, cloud workloads, and satellite mission feasibility studies, considering the required resolution, coverage frequency, and processing level of satellite products.

3.3. Programmatic Considerations

3.3.1. Cost

The numerical values and cost estimates presented in this section are exclusively associated with the conceptual design alternatives developed by our team. They should not be interpreted as detailed design results or definitive cost estimates, nor are they to be regarded as any commitments. The mission cost was estimated with the Multi-Aperture SAR Cost and Schedule estimation tool (MASCOT) [116]. MASCOT is based on analogy and parametric methods. It can provide estimates on the initial phases of a SAR mission and evaluate the cost structure of the current and future missions. The percentage distribution of cost allocation for mission phases can be estimated using the approach described by Van Pelt [149].
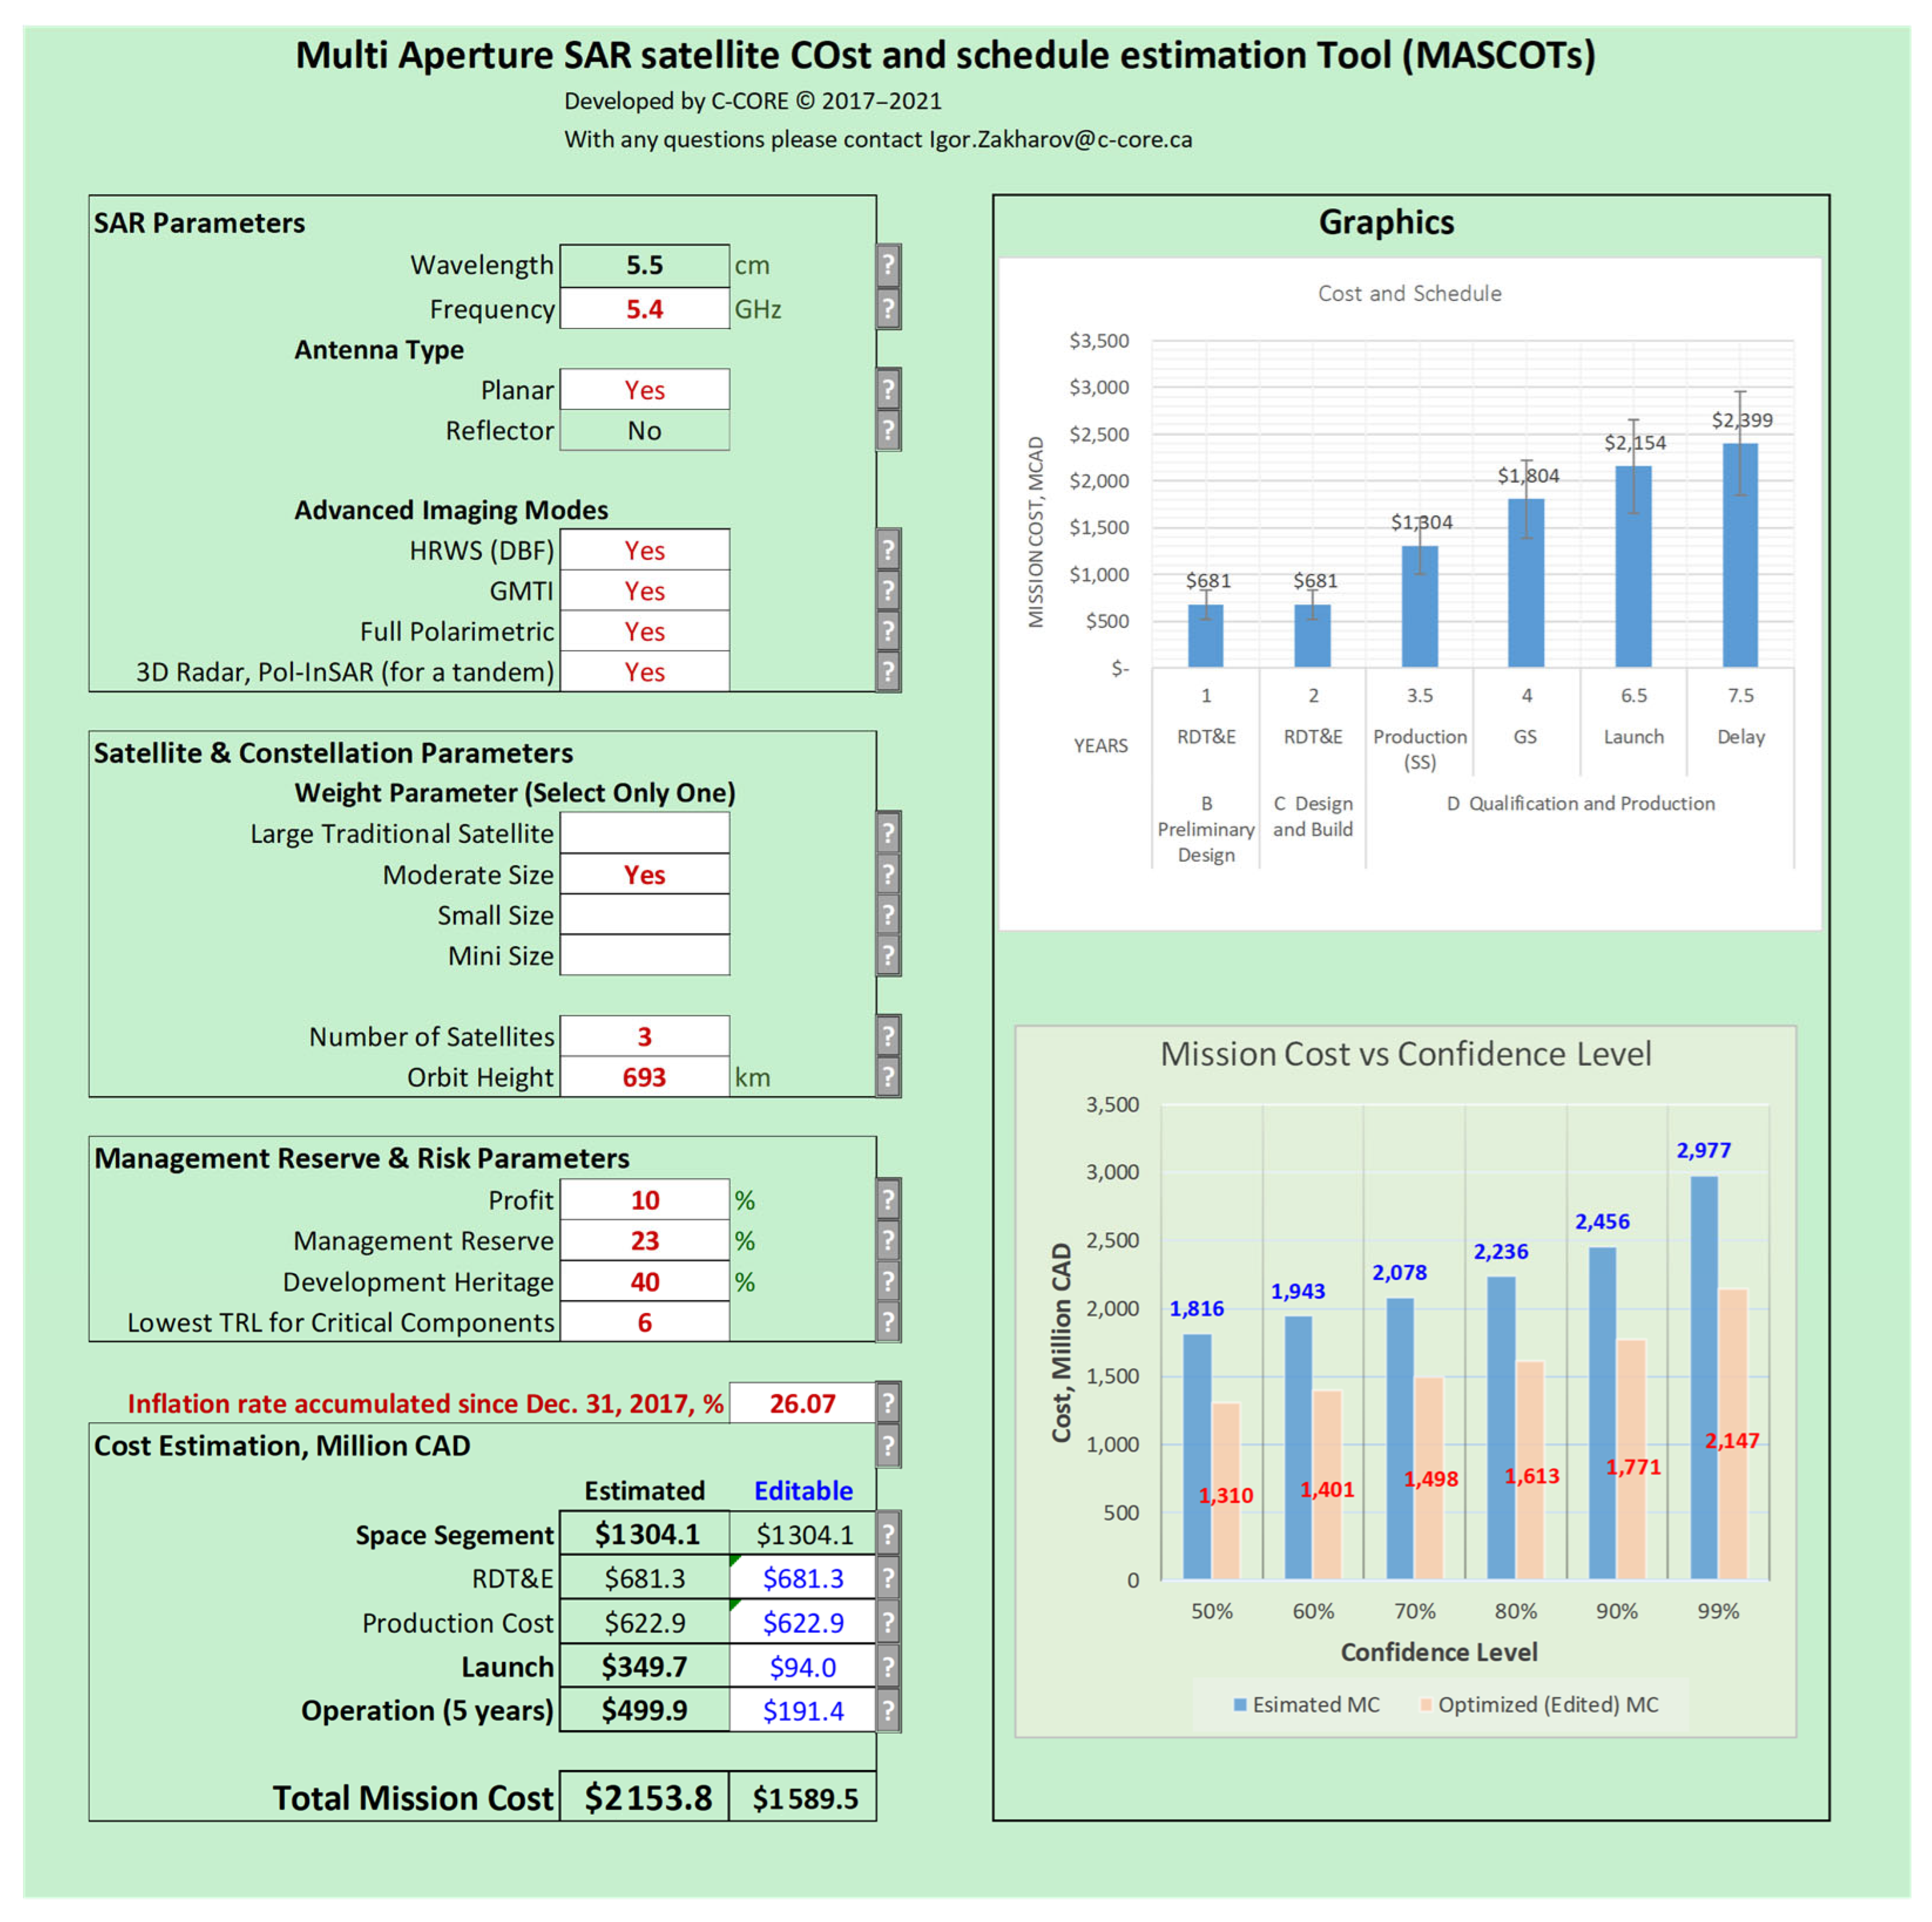
Figure 20 demonstrates MASCOT's graphic user interface with parameters of cost estimation for three moderate SAR satellites (including tandem). The operation cost also includes the cost of the ground segment (ground stations and control and communication). The operation cost was estimated using a bottom-up method, assuming that multiple identical satellites will utilize the same ground segment (GS), requiring a lower cost than operating each satellite separately.
The total mass of the moderate R4G satellite, with 1667 kg, is considered. A profit of 10% and a management reserve of 23% were included in the cost estimation (Section 3.2.2). Along with the cost estimation, there is also a chart demonstrating mission cost vs. confidence level. In the early phases of the mission confidence level of 70–80% is usually considered. The development heritage of 40% (representing a new design with some heritage) was used for R4G. The launch cost is less than automatically estimated because it assumes the simultaneous launch of three satellites on the same launcher. Figure 20 shows the optimized cost in the Editable section of the cost estimation, considering the launch on Falcon 9. The total cost of the moderate satellites is Canadian dollars (CAD) in 2025 prices, 1.59 billion (Figure 20, Editable Section in bottom left). This cost includes operation and control but excludes PED.
The replacement of SAR satellites will ensure data continuity in the case of the failure of a satellite. The development heritage of 100% was used for the replacement of all R4G satellites because it is assumed that basically existing design will be replicated, considering only minor changes in electronic components. This replacement strategy, along with the assumption of 15 years of operation, potentially significantly reduces the cost of RDT&E and consequently all mission costs. The replacement cost of one satellite is 395.2 million, including its launch cost with a reused Falcon 9 launcher. Historic inflation rate was estimated using Bank of Canada Inflation Calculator (https://www.bankofcanada.ca/rates/related/inflation-calculator/ (accessed on 15 November 2025)).
The total cost of five large SAR satellites may reach CAD 2.84 billion (Y2025), considering two launches according to schedule (Section 3.3.3). The replacement cost of one large satellite is CAD 518 million, including its launch cost with a reused Falcon 9 launcher. The mission cost can potentially be optimized by employing various launching, maintenance, operation, and replacement strategies and methods. Table 3 provides lifecycle costs for three moderate and five large satellites.

3.3.2. Risks

Risk analysis and mitigation included several steps to identify risks and develop a mitigation strategy. Pre-launch risks for a SAR satellite mission development, manufacturing, and testing involve various challenges, including the following:
  • Technical risks with the development of new systems with low technology readiness level (TRL) components may require more time and resources than expected, leading to potential delays;
  • Programmatic risks due to changes in scope and schedule delivery due to supply chain issues and long lead times, and key personnel loss;
  • Budget risks relevant to cost overruns and the financial stability of key contractors;
  • Regulatory risks relevant to frequency licensing and compliance with government policies.
A shift in government priorities could significantly impact the project. The financial stability of prime contractors is another major concern, with a medium likelihood of bankruptcy potentially causing significant project delays. The significant risk of key personnel loss is reduced through the assignment of backups and robust retention policies. Additionally, low TRL items may require more time and funds than expected, leading to potential delays. It is recommended that contingency development projects be funded, and minimum TRLs will be set early in the design phase.
Lastly, mishandling accidents during subsystem testing or assembly present a lower risk but potentially disruptive scenario. Careful planning and rehearsals are recommended, along with having spare spacecraft to mitigate any damage that may occur during the process.

3.3.3. Schedule

Without the replacement of spacecraft, the large satellites can potentially operate 12–15 years or even more, but with the risk that some of them may terminate operations before the expected end of life. To mitigate this risk and ensure SAR observation service continuity, one of two replacement strategies can be implemented with the following scenarios:
  • Scenario 1. Pre-build one or more R4G satellites for conservation to store them until the health of the operating R4Gs shows significant degradation. This is the cost-efficient solution, which will maximize the operation time of each satellite.
  • Scenario 2. Replace all satellites with newly designed (i.e., R5G) spacecraft 10 years after R4G was launched. This scenario will have additional costs associated with R&D and design of the new R5G. The launch of R5G can be delayed if it is necessary to avoid a potential situation when both R4G and R5G are in operation (similar to RADARSAT-1 and RADARSAT-2).
Schedule in Figure 21 shows that both scenarios of replacement strategy for space assets will ensure reliable satellite operation for at least 15 and possibly more years, providing C-band SAR data continuity beyond 2050. The ground segment (i.e., antennas, mission centers, data centers, and storage solutions), although not subjected to the harsh scheduling conditions of the space segment, must be maintained continuously to avoid contact gaps that could preclude important data from being downloaded with the requested latency.

4. Discussion

Our study presents a preliminary investigation of the possible conceptual design of a next-generation C-band SAR mission, focusing on system architecture and implementation considerations. Similar to other studies on mission planning and feasibility assessments, our analysis incorporates performance modeling, cost, schedule, and risk estimation, and simulation-based trade-off analysis to determine the optimal number of satellites required to fulfill user demands for C-band SAR data continuity with improved spatial resolution and temporal coverage. These findings support the working hypothesis that a constellation of three to five satellites may be necessary to ensure both global coverage and temporal revisit for operational government services in environmental monitoring, maritime surveillance, and emergency response.
A qualitative assessment of the two solution options’ compliance with all C-band SAR user needs is presented in Figure 22. The results clearly show that Option 2 (five large R4Gs) demonstrates stronger performance, achieving full compliance at the threshold level and 93% compliance at the goal level defined by user needs. In contrast, Option 1 (three moderate R4Gs) meets only 72% of user needs at the threshold level and 54% at the goal level. Most partially compliant needs for Option 1 remain below 50% at the goal level in terms of spatial coverage, whereas Option 2 achieves higher coverage (ranging from 50% to 80%) for the remaining 7% of partially compliant needs, making it nearly compliant at the goal level overall. These results demonstrate that Option 2 provides a more robust and balanced response to user requirements, offering superior performance and mission capability. Although the cost of a five-satellite system is higher than that of a three-satellite configuration, the increased user satisfaction and enhanced mission effectiveness ultimately can justify the investment.
A key contribution of this study is the systematic analysis of observation requirements derived from HUN, as provided by the Government of Canada. The feasibility of satisfying these diverse and evolving needs also requires both technical feasibility and cost-effectiveness. In this context, it becomes important to demonstrate that the socio-economic benefits gained from implementing advanced SAR capabilities, such as improved disaster preparedness, environmental stewardship, and national security, outweigh the required significant investments. The cost estimation approach for large SAR missions has been largely underexplored in publicly available literature and represents a novel contribution to the field.
The authors identified several gaps that may influence future R&D directions:
  • An exploration into scalable satellite configurations, including small satellite options, could offer cost and schedule advantages;
  • A growing tendency to overstate the advantages of compact polarimetric (CP) SAR data could be balanced with critical assessments of their actual performance in operational contexts, considering several years of RCM operation;
  • A structured justifying SAR investment can help early quantify the socio-economic benefits to prioritize mission funding;
  • Despite growing demand for timely and accurate EO data, governmental departments often face challenges in rapidly adopting and implementing advanced EO services. Such a delay can result in missed opportunities for enhanced public service delivery. Addressing these limitations requires greater interdepartmental coordination and stronger partnerships with industry;
  • HUN document, developed by GC departments, was used as the basis for defining the mission design options; however, direct inputs from Canadian industry were not incorporated in our design. In contrast, the Europeans emphasize the integration of commercial services [150] in the process of formulating a comprehensive set of user needs and observation requirements [65,66].

5. Conclusions

Our study outlines potential configurations for the next-generation Canadian C-band SAR mission. By addressing user needs and observation requirements with modern SAR capabilities and programmatic planning, the mission promises robust Earth observation services continuing through 2050.
The findings show the importance of scalable mission architectures, systematic user needs analysis, and cost modeling for long-term EO service continuity planning. The study developed and evaluated design configurations for a next-generation Canadian C-band SAR mission, focusing on two constellation options: a three-medium (moderate) satellite constellation and a five-large satellite system. Both configurations were demonstrated to meet Harmonized User Needs at different levels but allowing an effective balance between performance, cost, and risk.
SAR performance simulations demonstrated that HRWS imaging modes can be achieved with the proposed R4G system. Three different orbits were analyzed for R4G operations. One orbit (693 km altitude) is shared by three satellites, with two satellites (R4G-A and Tandem) operating simultaneously and the third (R4G-B) positioned 180° apart. One optimal orbit has a 70° inclination, and another optimal orbit, offset by several hours from dawn/dusk, was also considered to enable original innovative Hours-Time-Interval InSAR technology, boosting a number of new CCD and InSAR applications. In these configurations, the constellation demonstrates effective continuous observation and optimized revisit times up to six hours over all of Canada. Thus, ensuring continuity of EO services for environmental monitoring, maritime surveillance, and national security. The analysis of the ground segment solutions suggested incorporating Ka-band downlink capabilities and developing new ground stations to reduce data latency.
Accurate cost estimation is essential for the success of any space program, and spacecraft cost has become a key design criterion. The SAR mission life cycle cost was estimated using the Multi-Aperture SAR satellite Cost and Schedule Estimation Tool (MASCOTs), which integrates analog and parametric methods based on historical SAR missions to identify cost-driving elements and support reliable mission planning.
Further design refinement in Phase A can confirm technology readiness, cost feasibility, and implementation strategy.

Author Contributions

Conceptualization and methodology, I.Z., D.P., M.V., P.M., J.-H.K., M.E., J.J., A.K., J.C. and M.S.; software and simulations, M.V., I.Z., P.M., J.-H.K., J.C., M.S. and Y.M.; writing—I.Z., J.-H.K., D.P., J.C., S.W. and P.M.; writing—review and editing, all Authors; supervision, D.P., J.J. and A.K.; project administration, S.W., M.E. and J.C.; funding acquisition, D.P., J.C., I.Z., J.J., A.K., J.-H.K., M.D.H. and M.S. All authors have read and agreed to the published version of the manuscript.

Funding

This project was undertaken with the financial support of the Canadian Space Agency (CSA) under the Earth Observation Service Continuity (EOSC) project.

Data Availability Statement

The original contributions presented in this study are included in the article. Further inquiries can be directed to the corresponding author.

Conflicts of Interest

Authors Michael Völker, Jung-Hyo Kim, Matteo Emanuelli, Juergen Janoth and Alexander Kaptein were employed by the company Airbus Defence and Space GmbH. Authors Joseph Chamberland and Mike Stott were employed by the company AstroCom Associates Inc. The remaining authors declare that the research was conducted in the absence of any commercial or financial relationships that could be construed as a potential conflict of interest.

References

  1. Born, G.H.; Dunne, J.A.; Lame, D.B. Seasat Mission Overview. Science 1979, 204, 1405–1406. [Google Scholar] [CrossRef]
  2. Elachi, C.; Brown, W.E.; Cimino, J.B.; Dixon, T.; Evans, D.L.; Ford, J.P.; Saunders, R.S.; Breed, C.; Masursky, H.; McCauley, J.F.; et al. Shuttle Imaging Radar Experiment. Science 1982, 218, 996–1003. [Google Scholar] [CrossRef] [PubMed]
  3. Cimino, J.; Elachi, C.; Settle, M. SIR-B-The Second Shuttle Imaging Radar Experiment. IEEE Trans. Geosci. Remote Sens. 1986, GE-24, 445–452. [Google Scholar] [CrossRef]
  4. Tsokas, A.; Rysz, M.; Pardalos, P.M.; Dipple, K. SAR Data Applications in Earth Observation: An Overview. Expert Syst. Appl. 2022, 205, 117342. [Google Scholar] [CrossRef]
  5. Paek, S.W.; Balasubramanian, S.; Kim, S.; De Weck, O. Small-Satellite Synthetic Aperture Radar for Continuous Global Biospheric Monitoring: A Review. Remote Sens. 2020, 12, 2546. [Google Scholar] [CrossRef]
  6. Attema, E.P.W.; Duchossois, G.; Kohlhammer, G. ERS-1/2 SAR Land Applications: Overview and Main Results. In Proceedings of the IGARSS ’98. Sensing and Managing the Environment. 1998 IEEE International Geoscience and Remote Sensing. Symposium Proceedings. (Cat. No. 98CH36174), Seattle, WA, USA, 6–10 July 1998; Volume 4, pp. 1796–1798. [Google Scholar]
  7. Schwartz, K.; Jeffries, M.O.; Li, S. Using ERS-1 SAR Data to Monitor the State of the Arctic Ocean Sea Ice Surface between Spring and Autumn, 1992. In Proceedings of the IGARSS ’94—1994 IEEE International Geoscience and Remote Sensing Symposium, Pasadena, CA, USA, 8–12 August 1994; Volume 3, pp. 1759–1762. [Google Scholar]
  8. Korsbakken, E.; Johannessen, J.A.; Johannessen, O.M. Coastal Wind Field Retrievals from ERS Synthetic Aperture Radar Images. J. Geophys. Res. 1998, 103, 7857–7874. [Google Scholar] [CrossRef]
  9. Lehner, S.; Schulz-Stellenfleth, J.; Schattler, B.; Breit, H.; Horstmann, J. Wind and Wave Measurements Using Complex ERS-2 SAR Wave Mode Data. IEEE Trans. Geosci. Remote Sens. 2000, 38, 2246–2257. [Google Scholar] [CrossRef]
  10. Shimada, T.; Kawamura, H.; Shimada, M.; Watabe, I.; Iwasaki, S.-I. Evaluation of JERS-1 SAR Images from a Coastal Wind Retrieval Point of View. IEEE Trans. Geosci. Remote Sens. 2004, 42, 491–500. [Google Scholar] [CrossRef]
  11. Asiyabi, R.M.; Ghorbanian, A.; Tameh, S.N.; Amani, M.; Jin, S.; Mohammadzadeh, A. Synthetic Aperture Radar (SAR) for Ocean: A Review. IEEE J. Sel. Top. Appl. Earth Obs. Remote Sens. 2023, 16, 9106–9138. [Google Scholar] [CrossRef]
  12. Canadian Space Agency. RADARSAT Annual Review; Canadian Space Agency: Saint-Hubert, QC, Canada, 2000; ISBN 978-0-662-65492-6. [Google Scholar]
  13. Zebker, H.A.; Werner, C.L.; Rosen, P.A.; Hensley, S. Accuracy of Topographic Maps Derived from ERS-1 Interferometric Radar. IEEE Trans. Geosci. Remote Sens. 1994, 32, 823–836. [Google Scholar] [CrossRef]
  14. Wegmuller, U.; Werner, C.L. SAR Interferometric Signatures of Forest. IEEE Trans. Geosci. Remote Sens. 1995, 33, 1153–1161. [Google Scholar] [CrossRef]
  15. Wegmuller, U.; Strozzi, T.; Werner, C. Forest Applications of ERS, JERS, and SIR-C SAR Interferometry. In Proceedings of the IGARSS’97. 1997 IEEE International Geoscience and Remote Sensing Symposium Proceedings. Remote Sensing—A Scientific Vision for Sustainable Development, Singapore, 3–8 August 1997; Volume 2, pp. 790–792. [Google Scholar]
  16. Geudtner, D.; Winter, R.; Vachon, P.W. Flood Monitoring Using ERS-1 SAR Interferometry Coherence Maps. In Proceedings of the IGARSS ’96. 1996 International Geoscience and Remote Sensing Symposium, Lincoln, NE, USA, 31 May 1996; Volume 2, pp. 966–968. [Google Scholar]
  17. Wegmuller, U.; Werner, C.L. Farmland Monitoring with SAR Interferometry. In Proceedings of the 1995 International Geoscience and Remote Sensing Symposium, IGARSS ’95. Quantitative Remote Sensing for Science and Applications, Firenze, Italy, 10–14 July 1995; Volume 1, pp. 544–546. [Google Scholar]
  18. Mattar, K.E.; Vachon, P.W.; Geudtner, D.; Gray, A.L.; Cumming, I.G.; Brugman, M. Validation of Alpine Glacier Velocity Measurements Using ERS Tandem-Mission SAR Data. IEEE Trans. Geosci. Remote Sens. 1998, 36, 974–984. [Google Scholar] [CrossRef]
  19. Chapron, B.; Collard, F.; Ardhuin, F. Direct Measurements of Ocean Surface Velocity from Space: Interpretation and Validation. J. Geophys. Res. 2005, 110, 2004JC002809. [Google Scholar] [CrossRef]
  20. Marghany, M. Finite Difference Model for Modeling Sea Surface Current from RADARSAT-1 SAR Data. In Proceedings of the 2009 IEEE International Geoscience and Remote Sensing Symposium, Cape Town, South Africa, 12–17 July 2009; pp. II-487–II-490. [Google Scholar]
  21. Johannessen, J.A.; Chapron, B.; Alpers, W.; Collard, F.; Cipollini, P.; Liu, A.; Horstmann, J.; da Silva, J.; Portabella, M.; Robinson, I.S.; et al. Satellite Oceanography from the ERS Synthetic Aperture Radar and Radar Altimeter: A Brief Review. In ERS Missions: 20 Years of Observing Earth; European Space Agency: Noordwijk, The Netherlands, 2013; pp. 199–224. ISBN 978-92-9221-424-1. [Google Scholar]
  22. Werner, M. Shuttle Radar Topography Mission (SRTM) Mission Overview. Frequenz 2001, 55, 75–79. [Google Scholar] [CrossRef]
  23. Romeiser, R.; Breit, H.; Eineder, M.; Runge, H.; Flament, P.; De Jong, K.; Vogelzang, J. Current Measurements by SAR Along-Track Interferometry from a Space Shuttle. IEEE Trans. Geosci. Remote Sens. 2005, 43, 2315–2324. [Google Scholar] [CrossRef]
  24. Miranda, N.; Rosich, B.; Meadows, P.J.; Haria, K.; Small, D.; Schubert, A.; Lavalle, M.; Collard, F.; Johnsen, H.; Monti-Guarnieri, A.; et al. The Envisat ASAR Mission: A Look Back at 10 Years of Operation. ESA-SP 2013, 772, 1–17. [Google Scholar] [CrossRef]
  25. Toutin, T.; Chenier, R. 3-D Radargrammetric Modeling of RADARSAT-2 Ultrafine Mode: Preliminary Results of the Geometric Calibration. IEEE Geosci. Remote Sens. Lett. 2009, 6, 611–615. [Google Scholar] [CrossRef]
  26. Rousseau, L.-P.; Gierull, C.; Chouinard, J.-Y. First Results from an Experimental ScanSAR-GMTI Mode on RADARSAT-2. IEEE J. Sel. Top. Appl. Earth Obs. Remote Sens. 2015, 8, 5068–5080. [Google Scholar] [CrossRef]
  27. Zink, M.; Krieger, G.; Fiedler, H.; Hajnsek, I.; Moreira, A. The TanDEM-X Mission Concept. In Proceedings of the 7th European Conference on Synthetic Aperture Radar, Friedrichshafen, Germany, 2–5 June 2008; pp. 1–4. [Google Scholar]
  28. Zink, M.; Moreira, A.; Hajnsek, I.; Rizzoli, P.; Bachmann, M.; Kahle, R.; Fritz, T.; Huber, M.; Krieger, G.; Lachaise, M.; et al. TanDEM-X: 10 Years of Formation Flying Bistatic SAR Interferometry. IEEE J. Sel. Top. Appl. Earth Obs. Remote Sens. 2021, 14, 3546–3565. [Google Scholar] [CrossRef]
  29. Caltagirone, F.; De Luca, G.; Covello, F.; Marano, G.; Angino, G.; Piemontese, M. Status, Results, Potentiality and Evolution of COSMO-SkyMed, the Italian Earth Observation Constellation for Risk Management and Security. In Proceedings of the 2010 IEEE International Geoscience and Remote Sensing Symposium, Honolulu, HI, USA, 25–30 July 2010; pp. 4393–4396. [Google Scholar]
  30. ASI COSMO-SkyMed Seconda Generazione: System and Products Description; European Space Agency: Paris, France, 2021.
  31. Kankaku, Y.; Osawa, Y.; Suzuki, S.; Watanabe, T. The Overview of the L-Band SAR Onboard ALOS-2. In Proceedings of the PIERS 2009 in Moscow Proceedings; PIERS: Moscow, Russia, 2009; pp. 735–738. [Google Scholar]
  32. Kankaku, Y.; Arikawa, Y.; Miura, S.; Motohka, T.; Kojima, Y. ALOS-4 System Design and PFM Current Status. In Proceedings of the IGARSS 2023—2023 IEEE International Geoscience and Remote Sensing Symposium, Pasadena, CA, USA, 16–21 July 2023; pp. 1998–2001. [Google Scholar]
  33. Potin, P.; Rosich, B.; Roeder, J.; Bargellini, P. Sentinel-1 Mission Operations Concept. In Proceedings of the 2014 IEEE Geoscience and Remote Sensing Symposium, Quebec City, QC, Canada, 13–18 July 2014. [Google Scholar]
  34. Xue, S.; Geng, X.; Meng, L.; Xie, T.; Huang, L.; Yan, X.-H. HISEA-1: The First C-Band SAR Miniaturized Satellite for Ocean and Coastal Observation. Remote Sens. 2021, 13, 2076. [Google Scholar] [CrossRef]
  35. Li, X.-M.; Zhang, T.; Huang, B.; Jia, T. Capabilities of Chinese Gaofen-3 Synthetic Aperture Radar in Selected Topics for Coastal and Ocean Observations. Remote Sens. 2018, 10, 1929. [Google Scholar] [CrossRef]
  36. Villano, M.; Ustalli, N.; Dell’Amore, L.; Jeon, S.-Y.; Krieger, G.; Moreira, A.; Peixoto, M.N.; Krecke, J. NewSpace SAR: Disruptive Concepts for Cost-Effective Earth Observation Missions. In Proceedings of the 2020 IEEE Radar Conference (RadarConf20), Florence, Italy, 21–25 September 2020; pp. 1–5. [Google Scholar]
  37. NISAR. NASA-ISRO SAR (NISAR) Mission Science Users’ Handbook; NISAR: Pasadena, CA, USA, 2021. [Google Scholar]
  38. Toan, T.L.; Chave, J.; Dall, J.; Papathanassiou, K.; Paillou, P.; Rechstein, M.; Quegan, S.; Saatchi, S.; Seipel, K.; Shugart, H.; et al. The Biomass Mission: Objectives and Requirements. In Proceedings of the IGARSS 2018—2018 IEEE International Geoscience and Remote Sensing Symposium, Valencia, Spain, 22–27 July 2018; pp. 8563–8566. [Google Scholar]
  39. Huber, S.; de Almeida, F.Q.; Villano, M.; Younis, M.; Krieger, G.; Moreira, A. Tandem-L: A Technical Perspective on Future Spaceborne SAR Sensors for Earth Observation. IEEE Trans. Geosci. Remote Sens. 2018, 56, 4792–4807. [Google Scholar] [CrossRef]
  40. Krieger, G.; Pardini, M.; Schulze, D.; Bachmann, M.; Borla Tridon, D.; Reimann, J.; Brautigam, B.; Steinbrecher, U.; Tienda, C.; Sanjuan Ferrer, M.; et al. Tandem-L: Main Results of the Phase A Feasibility Study. In Proceedings of the 2016 IEEE International Geoscience and Remote Sensing Symposium (IGARSS), Beijing, China, 10–15 July 2016; pp. 2116–2119. [Google Scholar]
  41. Younis, M.; Shimada, M.; Huber, S.; Herrero, C.T.; Krieger, G.; Moreira, A.; Uematsu, A.; Sudo, Y.; Nakamura, R.; Chishiki, Y. Tandem-L Instrument Design and SAR Performance Overview. In Proceedings of the 2014 IEEE Geoscience and Remote Sensing Symposium, Quebec City, QC, Canada, 13–18 July 2014; pp. 88–91. [Google Scholar]
  42. Mittermayer, J.; Krieger, G.; Bojarski, A.; Zonno, M.; Villano, M.; Pinheiro, M.; Bachmann, M.; Buckreuss, S.; Moreira, A. MirrorSAR: An HRWS Add-On for Single-Pass Multi-Baseline SAR Interferometry. IEEE Trans. Geosci. Remote Sens. 2022, 60, 5224018. [Google Scholar] [CrossRef]
  43. Moreira, A.; Krieger, G.; Younis, M.; Zink, M. Future Spaceborne SAR Technologies and Mission Concepts. In Proceedings of the IGARSS 2023—2023 IEEE International Geoscience and Remote Sensing Symposium, Pasadena, CA, USA, 16–21 July 2023; pp. 576–578. [Google Scholar]
  44. Mittermayer, J.; Krieger, G.; Moreira, A. Concepts and Applications of Multi-Static MirrorSAR Systems. In Proceedings of the 2020 IEEE Radar Conference (RadarConf20), Florence, Italy, 21–25 September 2020; pp. 1–6. [Google Scholar]
  45. Francioni, A.; Piemontese, M. Mission Design Concepts for next Generation Defence Space Observation Systems. In Proceedings of the 2008 IEEE Radar Conference, Rome, Italy, 26–30 May 2008; pp. 1–6. [Google Scholar]
  46. Rosen, P.; Kim, Y.; Eisen, H.; Shaffer, S.; Veilleux, L.; Hensley, S.; Chakraborty, M.; Misra, T.; Satish, R.; Putrevu, D.; et al. A Dual-Frequency Spaceborne SAR Mission Concept. In Proceedings of the 2013 IEEE International Geoscience and Remote Sensing Symposium—IGARSS, Melbourne, Australia, 21–26 July 2013; Volume 114, pp. 2293–2296. [Google Scholar]
  47. Suess, M.; De Witte, E.; Rommen, B. Earth Explorer 10 Candidate Mission Harmony. In Proceedings of the EUSAR 2022; 14th European Conference on Synthetic Aperture Radar, Leipzig, Germany, 25–27 July 2022; pp. 1–4. [Google Scholar]
  48. Lopez-Dekker, P.; Rott, H.; Prats-Iraola, P.; Chapron, B.; Scipal, K.; Witte, E.D. Harmony: An Earth Explorer 10 Mission Candidate to Observe Land, Ice, and Ocean Surface Dynamics. In Proceedings of the IGARSS 2019—2019 IEEE International Geoscience and Remote Sensing Symposium, Yokohama, Japan, 28 July–2 August 2019; pp. 8381–8384. [Google Scholar]
  49. Queiroz De Almeida, V.; Matar, J.; Rodriouez-Cassola, M.; Moreira, A.; Haagmans, R.; Bensi, P.; Petrolati, D. Orbit. Performance and Observation Scenarios for Esa’s Earth Explorer Mission Proposal Hydroterra. In Proceedings of the 2021 IEEE International Geoscience and Remote Sensing Symposium IGARSS, Brussels, Belgium, 11–16 July 2021; Volume 10, pp. 7740–7743. [Google Scholar]
  50. Phippen, D.; Burbidge, G.; Mak, K.; del Castillo Mena, J.; Garcia Garcia, Q.; Marquez, J.; Aleman Roda, F.; de la Fuente Arranz, C.; Stasi, M.; Troendle, S.; et al. Airbus Phase 0 Study for Earth Explorer 11: SEASTAR. In Proceedings of the EUSAR 2024—15th European Conference on Synthetic Aperture Radar, Munich, Germany, 23–26 April 2024; pp. 1012–1016. [Google Scholar]
  51. Jonas, C.; Velarde, C.; Gabrielli, S.; Imre, E.; Schulz, A.-T. GEO-SAR Orbit Characteristics Derived from the Hydroterra Mission Performance Model. In Proceedings of the EUSAR 2021; 13th European Conference on Synthetic Aperture Radar, Online, 29 March–1 April 2021; pp. 1–6. [Google Scholar]
  52. Hu, C.; Li, Y.; Chen, Z.; Liu, F.; Zhang, Q.; Monti-Guarnieri, A.V.; Hobbs, S.; Anghel, A.; Datcu, M. Distributed Spaceborne SAR: A Review of Systems, Applications, and the Road Ahead. IEEE Geosci. Remote Sens. Mag. 2025, 13, 329–361. [Google Scholar] [CrossRef]
  53. McCandles, S.W. The Origin, Evolution and Legacy of SEASAT. In Proceedings of the IGARSS 2003. 2003 IEEE International Geoscience and Remote Sensing Symposium. Proceedings (IEEE Cat. No. 03CH37477), Toulouse, France, 21–25 July 2003; Volume 1, pp. 32–34. [Google Scholar]
  54. EO4AGRI. WP2—User Requirements & GAP Analysis D2.4 Final Workshop—User Requirements and Gap Analysis in Different Sectors Report; Earth Observation for Agricultural (EO4AGR) Project Consortium, European Union: Madrid, Spain, 2021; p. 108. [Google Scholar]
  55. NWS. NDS 10-1 NWS Requirements, Operations and Services Improvements; National Weather Service, NOAA: Silver Spring, MD, USA, 2024. [Google Scholar]
  56. 24765-2017; ISO/IEC/IEEE International Standard—Systems and Software Engineering—Vocabulary. ISO: Geneva, Switzerland; IEC: Geneva, Switzerland; IEEE: Piscataway, NJ, USA, 2017. [CrossRef]
  57. Wu, Z.; Snyder, G.; Vadnais, C.; Arora, R.; Babcock, M.; Stensaas, G.; Doucette, P.; Newman, T. User Needs for Future Landsat Missions. Remote Sens. Environ. 2019, 231, 111214. [Google Scholar] [CrossRef]
  58. Lindgaard, G.; Dillon, R.; Trbovich, P.; White, R.; Fernandes, G.; Lundahl, S.; Pinnamaneni, A. User Needs Analysis and Requirements Engineering: Theory and Practice. Interact. Comput. 2006, 18, 47–70. [Google Scholar] [CrossRef]
  59. SEBoK Editorial Board. Guide to the Systems Engineering Body of Knowledge (SEBoK); Version 2.2; The Stevens Institute of Technology Systems Engineering Research Center; The International Council on Systems Engineering; The Institute of Electrical and Electronics Engineers (IEEE) Computer Society. 2020. Available online: https://sebokwiki.org/wiki/Development_of_SEBoK_v._2.2 (accessed on 15 November 2025).
  60. ISO/IEC/IEEE 15288:2023(E); ISO/IEC/IEEE International Standard—Systems and Software Engineering—System Life Cycle Processes. ISO: Geneva, Switzerland; IEC: Geneva, Switzerland; IEEE: Piscataway, NJ, USA, 2023. [CrossRef]
  61. 24748-2-2024; ISO/IEC/IEEE International Standard—Systems and Software Engineering—Life Cycle Management—Part 2: Guidelines for the Application of ISO/IEC/IEEE 15288 (System Life Cycle Processes). IEEE: Piscataway, NJ, USA, 2024. [CrossRef]
  62. 29148-2018; ISO/IEC/IEEE International Standard—Systems and Software Engineering—Life Cycle Processes—Requirements Engineering—Redline. IEEE: New York City, NY, USA, 2018; ISBN 978-1-5044-5302-8. [CrossRef]
  63. NASA. Systems Engineering Handbook, Rev. 1st ed.; National Aeronautics and Space Administration: Washington, DC, USA, 2007; ISBN 978-0-16-079747-7. [Google Scholar]
  64. ESA. Scientific Readiness Levels (SRL) Handbook; ESA-EOPSM-SRL-MA-4267. Issue 2.; European Space Agency, Earth and Mission Science Division: Noordwijk, The Netherlands, 2023. [Google Scholar]
  65. EC. Work Performed by the Nextspace Consortium—Full User Requirements; European Commission (Copernicus): Brussels, Belgium, 2018. [Google Scholar]
  66. EC. Work Performed by the Nextspace Consortium—Observation Requirements; European Commission (Copernicus): Brussels, Belgium, 2018. [Google Scholar]
  67. Gutman, G.; Ignatov, A. Towards a Common Language in Satellite Data Management: A New Processing Level Nomenclature. In Proceedings of the IGARSS’97. 1997 IEEE International Geoscience and Remote Sensing Symposium Proceedings. Remote Sensing—A Scientific Vision for Sustainable Development, Singapore, 3–8 August 1997; Volume 3, pp. 1252–1254. [Google Scholar]
  68. Lancheros, E.; Camps, A.; Park, H.; Sicard, P.; Mangin, A.; Matevosyan, H.; Lluch, I. Gaps Analysis and Requirements Specification for the Evolution of Copernicus System for Polar Regions Monitoring: Addressing the Challenges in the Horizon 2020–2030. Remote Sens. 2018, 10, 1098. [Google Scholar] [CrossRef]
  69. EC. User Requirements for a Copernicus Polar Observing System: Phase 3 Report: Towards Operational Products and Services; European Commission, Directorate General for Defence Industry and Space. Publications Office, European Union: Brussels, Belgium, 2021. [Google Scholar]
  70. WMO. WMO Observing Systems Capability Analysis and Review Tool (OSCAR)—User Manual; World Meteorological Organization: Geneva, Switzerland, 2024. [Google Scholar]
  71. WMO. User Manual for OSCAR/Space and OSCAR/Requirements; World Meteorological Organization: Geneva, Switzerland, 2023. [Google Scholar]
  72. Potin, P.; Bargellini, P.; Laur, H.; Rosich, B.; Schmuck, S. Sentinel-1 Mission Operations Concept. In Proceedings of the 2012 IEEE International Geoscience and Remote Sensing Symposium, Munich, Germany, 22–27 July 2012. [Google Scholar]
  73. EC. Commission Staff Working Document—Expression of User Needs for the Copernicus Programme; European Commission: Brussels, Belgium, 2019. [Google Scholar]
  74. ECSS. European Cooperation for Space Standardization (ECSS). In Glossary of Terms; ECSS-S-ST-00-01C; ESA-ESTEC: Noordwijk, The Netherlands, 2023. [Google Scholar]
  75. NASA. NASA Systems Engineering Handbook; SP-2016-6105 Rev2; National Aeronautics and Space Administration (NASA): Washington, DC, USA, 2017. [Google Scholar]
  76. CSA. Earth Observation Service Continuity Harmonized User Needs Document; Canadian Space Agency: St-Hubert. QC, Canada, 2020; Revision E. [Google Scholar]
  77. CSA. Earth Observation Service Continuity Harmonized User Needs Document; Canadian Space Agency: St-Hubert. QC, Canada, 2021; Revision F. [Google Scholar]
  78. Patwardhan, N.; Marrone, S.; Sansone, C. Transformers in the Real World: A Survey on NLP Applications. Information 2023, 14, 242. [Google Scholar] [CrossRef]
  79. Alibasic, A.; Popovic, T. Applying Natural Language Processing to Analyze Customer Satisfaction. In Proceedings of the 2021 25th International Conference on Information Technology (IT), Zabljak, Montenegro, 16–20 February 2021; pp. 1–4. [Google Scholar]
  80. Suess, M.; Grafmueller, B.; Zahn, R. A Novel High Resolution, Wide Swath SAR System. In Proceedings of the IGARSS 2001. Scanning the Present and Resolving the Future. Proceedings. IEEE 2001 International Geoscience and Remote Sensing Symposium (Cat. No. 01CH37217), Sydney, NSW, Australia, 9–13 July 2001; Volume 3, pp. 1013–1015. [Google Scholar]
  81. Gebert, N.; Krieger, G.; Moreira, A. Digital Beamforming on Receive: Techniques and Optimization Strategies for High-Resolution Wide-Swath SAR Imaging. IEEE Trans. Aerosp. Electron. Syst. 2009, 45, 564–592. [Google Scholar] [CrossRef]
  82. Villano, M.; Krieger, G.; Jäger, M.; Moreira, A. Staggered SAR: Performance Analysis and Experiments with Real Data. IEEE Trans. Geosci. Remote Sens. 2017, 55, 6617–6638. [Google Scholar] [CrossRef]
  83. Kim, J.H.; Younis, M.; Moreira, A.; Wiesbeck, W. Spaceborne MIMO Synthetic Aperture Radar for Multimodal Operation. IEEE Trans. Geosci. Remote Sens. 2015, 53, 2453–2466. [Google Scholar] [CrossRef]
  84. Wang, W.-Q. Multi-Antenna Synthetic Aperture Radar; CRC Press: Boca Raton, FL, USA, 2013. [Google Scholar]
  85. Younis, M.; Huber, S.; Patyuchenko, A.; Bordoni, F.; Krieger, G. Performance Comparison of Reflector-and Planar-Antenna Based Digital Beam-Forming SAR. Int. J. Antennas Propag. 2009, 2009, 614931. [Google Scholar] [CrossRef]
  86. Chuang, C.-L.; Shaffer, S.; Niamsuwan, N.; Li, S.; Liao, E.; Lim, C.; Duong, V.; Volain, B.; Vines, K.; Yang, M.-W.; et al. NISAR L-Band Digital Electronics Subsystem: A Multichannel System with Distributed Processors for Digital Beam Forming and Mode Dependent Filtering. In Proceedings of the 2016 IEEE Radar Conference (RadarConf), Philadelphia, PA, USA, 2–6 May 2016; pp. 1–5. [Google Scholar]
  87. Ghaemi, H.; Fattahi, H.; Hawkins, B.; Jung, J.; Huang, B.; Brancato, V.; Shimada, J.; Gunter, G.; Shiroma, G.H.X.; Burns, R.; et al. NISAR SweepSAR Echo Simulation: Summary and Results. In Proceedings of the IGARSS 2023—2023 IEEE International Geoscience and Remote Sensing Symposium, Pasadena, CA, USA, 16–21 July 2023; pp. 876–879. [Google Scholar]
  88. Shibata, M.; Kuriyama, T.; Hoshino, T.; Nakamura, S.; Kankaku, Y.; Motohka, T.; Suzuki, S. SAR Techniques and SAR Processing Algorithm for ALOS-4. In Proceedings of the IGARSS 2022—2022 IEEE International Geoscience and Remote Sensing Symposium, Kuala Lumpur, Malaysia, 17–22 July 2022; pp. 7449–7451. [Google Scholar]
  89. Krieger, G.; Moreira, A. Multistatic SAR Satellite Formations: Potentials and Challenges. In Proceedings of the IEEE Geoscience and Remote Sensing Symposium, Seoul, Republic of Korea, 29 July 2005; Volume 4, pp. 2680–2684. [Google Scholar]
  90. Jung, C.H.; Choi, M.S.; Kwag, Y.K. Parameter Based SAR Simulator for Image Quality Evaluation. In Proceedings of the 2007 IEEE International Geoscience and Remote Sensing Symposium, Barcelona, Spain, 23–28 July 2007; pp. 1599–1602. [Google Scholar]
  91. Urhan, H.; Sutcuoglu, O. Combined Engineering and Mission Simulator for a Satellite SAR System. In Proceedings of the 5th International Conference on Recent Advances in Space Technologies—RAST2011, Istanbul, Turkey, 9–11 June 2011; pp. 354–359. [Google Scholar]
  92. Auer, S.; Bamler, R.; Reinartz, P. RaySAR—3D SAR Simulator: Now Open Source. In Proceedings of the 2016 IEEE International Geoscience and Remote Sensing Symposium (IGARSS), Beijing, China, 10–15 July 2016; pp. 6730–6733. [Google Scholar]
  93. Mancon, S.; Giudici, D.; Mapelli, D.; Valentino, A.; Rommen, B.; Dominguez, B.C. Performance Simulator for Bistatic SAR Missions. In Proceedings of the IGARSS 2018—2018 IEEE International Geoscience and Remote Sensing Symposium, Valencia, Spain, 22–27 July 2018; pp. 5655–5658. [Google Scholar]
  94. Giudici, D.; Leanza, A.; Guarnieri, A.M.; Recchia, A. End-to-End Simulator of Geosynchronous SAR Data for System Performance Assessment. In Proceedings of the IGARSS 2018—2018 IEEE International Geoscience and Remote Sensing Symposium, Valencia, Spain, 22–27 July 2018; pp. 5659–5662. [Google Scholar]
  95. Pyne, B.; Saito, H.; Akbar, P.R.; Hirokawa, J.; Tomura, T.; Tanaka, K. Development and Performance Evaluation of Small SAR System for 100-Kg Class Satellite. IEEE J. Sel. Top. Appl. Earth Obs. Remote Sens. 2020, 13, 3879–3891. [Google Scholar] [CrossRef]
  96. Sun, J.; Yu, W.; Deng, Y. The SAR Payload Design and Performance for the GF-3 Mission. Sensors 2017, 17, 2419. [Google Scholar] [CrossRef]
  97. Golkar, A.; Cataldo, G.; Osipova, K. Small Satellite Synthetic Aperture Radar (SAR) Design: A Trade Space Exploration Model. Acta Astronaut. 2021, 187, 458–474. [Google Scholar] [CrossRef]
  98. Woollard, M.; Blacknell, D.; Griffiths, H.; Ritchie, M.A. SARCASTIC v2.0—High-Performance SAR Simulation for Next-Generation ATR Systems. Remote Sens. 2022, 14, 2561. [Google Scholar] [CrossRef]
  99. Hsu, Y.-W. A Preliminary SAR Simulator on Matlab for System Design. In Proceedings of the IGARSS 2023—2023 IEEE International Geoscience and Remote Sensing Symposium, Pasadena, CA, USA, 16–21 July 2023; pp. 7711–7714. [Google Scholar]
  100. ESA-ESTEC. Space Project Management-Project Planning and Implementation; European Space Agency (ESA)-European Space Research and Technology Centre (ESTEC). ECSS Secretariat. Requirements & Standards Division: Noordwijk, The Netherlands, 2009. [Google Scholar]
  101. CSA. Systems Engineering Methods and Practices; CSA-SE-PR-0001. Rev C; Canadian Space Agency (CSA): Saint-Hubert, QC, Canada, 2020. [Google Scholar]
  102. Government Consulting Services Evaluation of the RADARSAT-2 Major Crown Project; The Canadian Space Agency: Saint-Hubert, QC, Canada, 2009.
  103. GAO. Assessments of Major NASA Projects; United States Government Accountability Office: Washington, DC, USA, 2022. [Google Scholar]
  104. Sharma, P. Updates in Commissioning Timeline for NASA-ISRO Synthetic Aperture Radar (NISAR). In Proceedings of the 2019 IEEE Aerospace Conference, Big Sky, MT, USA, 2–9 March 2019; pp. 1–12. [Google Scholar]
  105. Norman, A.; Das, S.; Rohr, T.; Ghidini, T. Advanced Manufacturing for Space Applications. CEAS Space J. 2023, 15, 1–6. [Google Scholar] [CrossRef]
  106. Ghidini, T.; Grasso, M.; Gumpinger, J.; Makaya, A.; Colosimo, B.M. Additive Manufacturing in the New Space Economy: Current Achievements and Future Perspectives. Prog. Aerosp. Sci. 2023, 142, 100959. [Google Scholar] [CrossRef]
  107. Minacapilli, P.; Zurita, F.; Campo Perez, S.; Rodríguez Pérez-Silva, A.; Escudero, D. Small Satellites Mission Design Enhancement through MBSE and DDSE Toolchain. In Proceedings of the Model Based Space Systems and Software Engineering (MBSE2022), Toulouse, France, 22–24 November 2022. [Google Scholar]
  108. Hunt, C.D.; van Pelt, M.O. Comparing NASA and ESA Cost Estimating Methods for Human Missions to Mars. In Proceedings of the International Society of Parametric Analysts 26th Internatuonal Conference, Frascati, Italy, 10–12 May 2004. [Google Scholar]
  109. Chang, Y.-K.; Hwang, K.-L.; Kang, S.-J. SEDT (System Engineering Design Tool) Development and Its Application to Small Satellite Conceptual Design. Acta Astronaut. 2007, 61, 676–690. [Google Scholar] [CrossRef]
  110. NASA. Cost Estimating Handbook (CEH); Version 4.0; NASA: Washington, DC, USA, 2015. [Google Scholar]
  111. Trivailo, O.; Sippel, M.; Şekercioğlu, Y.A. Review of Hardware Cost Estimation Methods, Models and Tools Applied to Early Phases of Space Mission Planning. Prog. Aerosp. Sci. 2012, 53, 1–17. [Google Scholar] [CrossRef]
  112. Trivailo, O. Innovative Cost Engineering Approaches, Analyses and Methods Applied to SpaceLiner—An Advanced, Hypersonic, Suborbital Spaceplane Case-Study; Monash University: Melbourne, Australia, 2015. [Google Scholar]
  113. Larson, E.W.; Gray, C.F. A Guide to the Project Management Body of Knowledge: PMBOK (®) Guide, 6th ed.; Project Management Institute: Newtown Square, PA, USA, 2017. [Google Scholar]
  114. Larson, W.J.; Wertz, J.R. Space Mission Analysis and Design, 3rd ed.; Space Technology Library; Microcosm Press and Kluwer Academic Publishers: El Segundo, CA, USA, 2005. [Google Scholar]
  115. Fortescue, P.; Swinerd, G.; Stark, J. Spacecraft Systems Engineering; John Wiley & Sons: Hoboken, NJ, USA, 2011. [Google Scholar]
  116. Zakharov, I.; Chamberland, J.; Puestow, T. Cost Estimation of Future SAR Satellites. In Proceedings of the 2019 ESA Living Planet Symposium; ESA: Milan, Italy, 2019. [Google Scholar]
  117. Mahr, E.; Tu, A.; Gupta, A. Development of the Small Satellite Cost Model 2019 (SSCM19). In Proceedings of the 2020 IEEE Aerospace Conference, Big Sky, MT, USA, 7–14 March 2020; pp. 1–12. [Google Scholar]
  118. Majerowicz, W.; Shinn, S.A. Schedule Matters: Understanding the Relationship between Schedule Delays and Costs on Overruns. In Proceedings of the 2016 IEEE Aerospace Conference, Big Sky, MT, USA, 5–12 March 2016; pp. 1–8. [Google Scholar]
  119. Sawik, B. Space Mission Risk, Sustainability and Supply Chain: Review, Multi-Objective Optimization Model and Practical Approach. Sustainability 2023, 15, 11002. [Google Scholar] [CrossRef]
  120. Kossiakoff, A. Systems Engineering Principles and Practice, 2nd ed.; Wiley Series in Systems Engineering and Management; Wiley: Hoboken, NJ, USA, 2011; ISBN 978-0-470-40548-2. [Google Scholar]
  121. ESA-ESTEC. Requirements & Standards Division. In Space Project Management-Risk Management; ECSS-M-ST-80C; European Space Agency (ESA) European Space Research and Technology Centre (ESTEC): Noordwijk, The Netherlands, 2008. [Google Scholar]
  122. MDA. RADARSAT-2 Product Format Definition; MacDonald, Dettwiler and Associates Ltd.: Richmond, BC, Canada, 2018. [Google Scholar]
  123. Villano, M.; Krieger, G.; Moreira, A. Advanced Spaceborne SAR Systems with Planar Antenna. In Proceedings of the 2017 IEEE Radar Conference (RadarConf), Seattle, WA, USA, 8–12 May 2017; pp. 152–156. [Google Scholar]
  124. Villano, M.; Peixoto, M.N. Characterization of Nadir Echoes in Multiple-Elevation-Beam SAR With Constant and Variable Pulse Repetition Interval. IEEE Trans. Geosci. Remote Sens. 2022, 60, 1–9. [Google Scholar] [CrossRef]
  125. Heer, C.; Schaefer, C. Digital Beam Forming Technology for Phased Array Antennas. In Proceedings of the 2011 2nd International Conference on Space Technology, Athens, Greece, 15–17 September 2011; pp. 1–4. [Google Scholar]
  126. Younis, M.; De Almeida, F.Q.; Villano, M.; Huber, S.; Krieger, G.; Moreira, A. Digital Beamforming for Spaceborne Reflector-Based Synthetic Aperture Radar, Part 1: Basic Imaging Modes. IEEE Geosci. Remote Sens. Mag. 2021, 9, 8–25. [Google Scholar] [CrossRef]
  127. Younis, M.; Almeida, F.Q.D.; Villano, M.; Huber, S.; Krieger, G.; Moreira, A. Digital Beamforming for Spaceborne Reflector-Based Synthetic Aperture Radar, Part 2: Ultrawide-Swath Imaging Mode. IEEE Geosci. Remote Sens. Mag. 2022, 10, 10–31. [Google Scholar] [CrossRef]
  128. CLS. Sentinel-1A & Sentinel-1B Annual Performance Report for 2017; CLS: Ramonville-Saint-Agne, France, 2018. [Google Scholar]
  129. Villano, M.; Krieger, G.; Steinbrecher, U.; Moreira, A. Simultaneous Single-/Dual- and Quad-Pol SAR Imaging Over Swaths of Different Widths. IEEE Trans. Geosci. Remote Sens. 2020, 58, 2096–2103. [Google Scholar] [CrossRef]
  130. Reigber, A.; Schreiber, E.; Trappschuh, K.; Pasch, S.; Müller, G.; Kirchner, D.; Geßwein, D.; Schewe, S.; Nottensteiner, A.; Limbach, M.; et al. The High-Resolution Digital-Beamforming Airborne SAR System DBFSAR. Remote Sens. 2020, 12, 1710. [Google Scholar] [CrossRef]
  131. Geudtner, D.; Tossaint, M.; Davidson, M.; Torres, R. Copernicus Sentinel-1 Next Generation Mission. In Proceedings of the 2021 IEEE International Geoscience and Remote Sensing Symposium IGARSS, Brussels, Belgium, 11–16 July 2021; pp. 874–876. [Google Scholar]
  132. Zakharov, I.; Power, D.; Bobby, P.; Randell, C. Multi-Resolution SAR Data Analysis for Automated Retrieval of Sea Ice and Iceberg Parameters. In Proceedings of the ESA Living Planet Symposium, Edinburgh, UK, 9 September 2013. [Google Scholar]
  133. Dammann, D.O.; Eriksson, L.E.B.; Jones, J.M.; Mahoney, A.R.; Romeiser, R.; Meyer, F.J.; Eicken, H.; Fukamachi, Y. Instantaneous Sea Ice Drift Speed from TanDEM-X Interferometry. Cryosphere 2019, 13, 1395–1408. [Google Scholar] [CrossRef]
  134. Zakharov, I.; Puestow, T.; Power, D.; Howell, M. Icebergs in Sea Ice with TanDEM-X Interferometry. IEEE Geosci. Remote Sens. Lett. 2019, 16, 1070–1074. [Google Scholar] [CrossRef]
  135. Kugler, F.; Schulze, D.; Hajnsek, I.; Pretzsch, H.; Papathanassiou, K.P. TanDEM-X Pol-InSAR Performance for Forest Height Estimation. IEEE Trans. Geosci. Remote Sens. 2014, 52, 6404–6422. [Google Scholar] [CrossRef]
  136. Olesk, A.; Praks, J.; Antropov, O.; Zalite, K.; Arumäe, T.; Voormansik, K. Interferometric SAR Coherence Models for Characterization of Hemiboreal Forests Using TanDEM-X Data. Remote Sens. 2016, 8, 700. [Google Scholar] [CrossRef]
  137. Suchandt, S.; Runge, H. Ocean Surface Observations Using the TanDEM-X Satellite Formation. IEEE J. Sel. Top. Appl. Earth Obs. Remote Sens. 2015, 8, 5096–5105. [Google Scholar] [CrossRef]
  138. Rashid, M.; Gierull, C.H. Retrieval of Ocean Surface Radial Velocities With RADARSAT-2 Along-Track Interferometry. IEEE J. Sel. Top. Appl. Earth Obs. Remote Sens. 2021, 14, 9597–9608. [Google Scholar] [CrossRef]
  139. Gray, A.L.; Farris-Manning, P.J. Repeat-Pass Interferometry with Airborne Synthetic Aperture Radar. IEEE Trans. Geosci. Remote Sens. 1993, 31, 180–191. [Google Scholar] [CrossRef]
  140. Rosen, P.A.; Hensley, S.; Wheeler, K.; Sadowy, G.; Miller, T.; Shaffer, S.; Muellerschoen, R.; Jones, C.; Zebker, H.; Madsen, S. UAVSAR: A New NASA Airborne SAR System for Science and Technology Research. In Proceedings of the 2006 IEEE Conference on Radar, Syracuse, NY, USA, 24–27 April 2006; pp. 22–29. [Google Scholar]
  141. Oriot, H. Activity Monitoring with Airborne SAR Imagery. In Nato Sto Set Panel; STO: Palaiseau, France, 2014; Volume 191. [Google Scholar]
  142. Wang, Z.; Wang, Y.; Wang, B.; Hu, X.; Song, C.; Xiang, M. Human Activity Detection Based on Multipass Airborne InSAR Coherence Matrix. IEEE Geosci. Remote Sens. Lett. 2021, 19, 4013905. [Google Scholar] [CrossRef]
  143. Pottier, E.; Ferro-Famil, L. PolSARPro V5.0: An ESA Educational Toolbox Used for Self-Education in the Field of POLSAR and POL-INSAR Data Analysis. In Proceedings of the 2012 IEEE International Geoscience and Remote Sensing Symposium, Munich, Germany, 22–27 July 2012; pp. 7377–7380. [Google Scholar]
  144. Tali, R. SNAP TASKING “Snap Tasking” Is the Ability to Upload an Ad Hoc Requirement for Immediate Imaging by a Satellite. In Proceedings of the 2018 SpaceOps Conference; American Institute of Aeronautics and Astronautics: Marseille, France, 2018. [Google Scholar]
  145. Zhang, P.; Qin, Q.; Zhang, S.; Zhao, X.; Yan, X.; Wang, W.; Zhang, H. Near Real-Time Remote Sensing Based on Satellite Internet: Architectures, Key Techniques, and Experimental Progress. Aerospace 2024, 11, 167. [Google Scholar] [CrossRef]
  146. KSAT. Astro Digital Ka-Band and the Future of Big Data from Space; Kongsberg Satellite Services AS (KSAT): Tromsø, Norway, 2019. [Google Scholar]
  147. Scheiber, R.; Queiroz de Almeida, F.; Martone, M.; Villano, M.; Freddi, R. On-Board Payload Processing Requirements; S4Pro Consortium: Madrid, Spain, 2019. [Google Scholar]
  148. Doyon, M.; Smyth, J.; Kroupnik, G.; Carrie, C.; Sauvageau, M.; Levesque, J.-F.; Babiker, F.; Abbasi, V.; Giguere, C.; Côté, S.; et al. RADARSAT CONSTELLATION MISSION: Toward Launch and Operations. In Proceedings of the 2018 SpaceOps Conference, Marseille, France, 28 May–1 June 2018. [Google Scholar]
  149. Van Pelt, M. Phase 0 Space Mission Estimates. In Proceedings of the 2019 ICEAA Professional Development & Training Workshop, Tampa, FL, USA, 14–17 May 2019. [Google Scholar]
  150. EARSC. A Taxonomy for the EO Services Market: Enhancing the Perception and Performance of the EO Service Industry; European Association of Remote Sensing Companies: Brussels, Belgium, 2015. [Google Scholar]
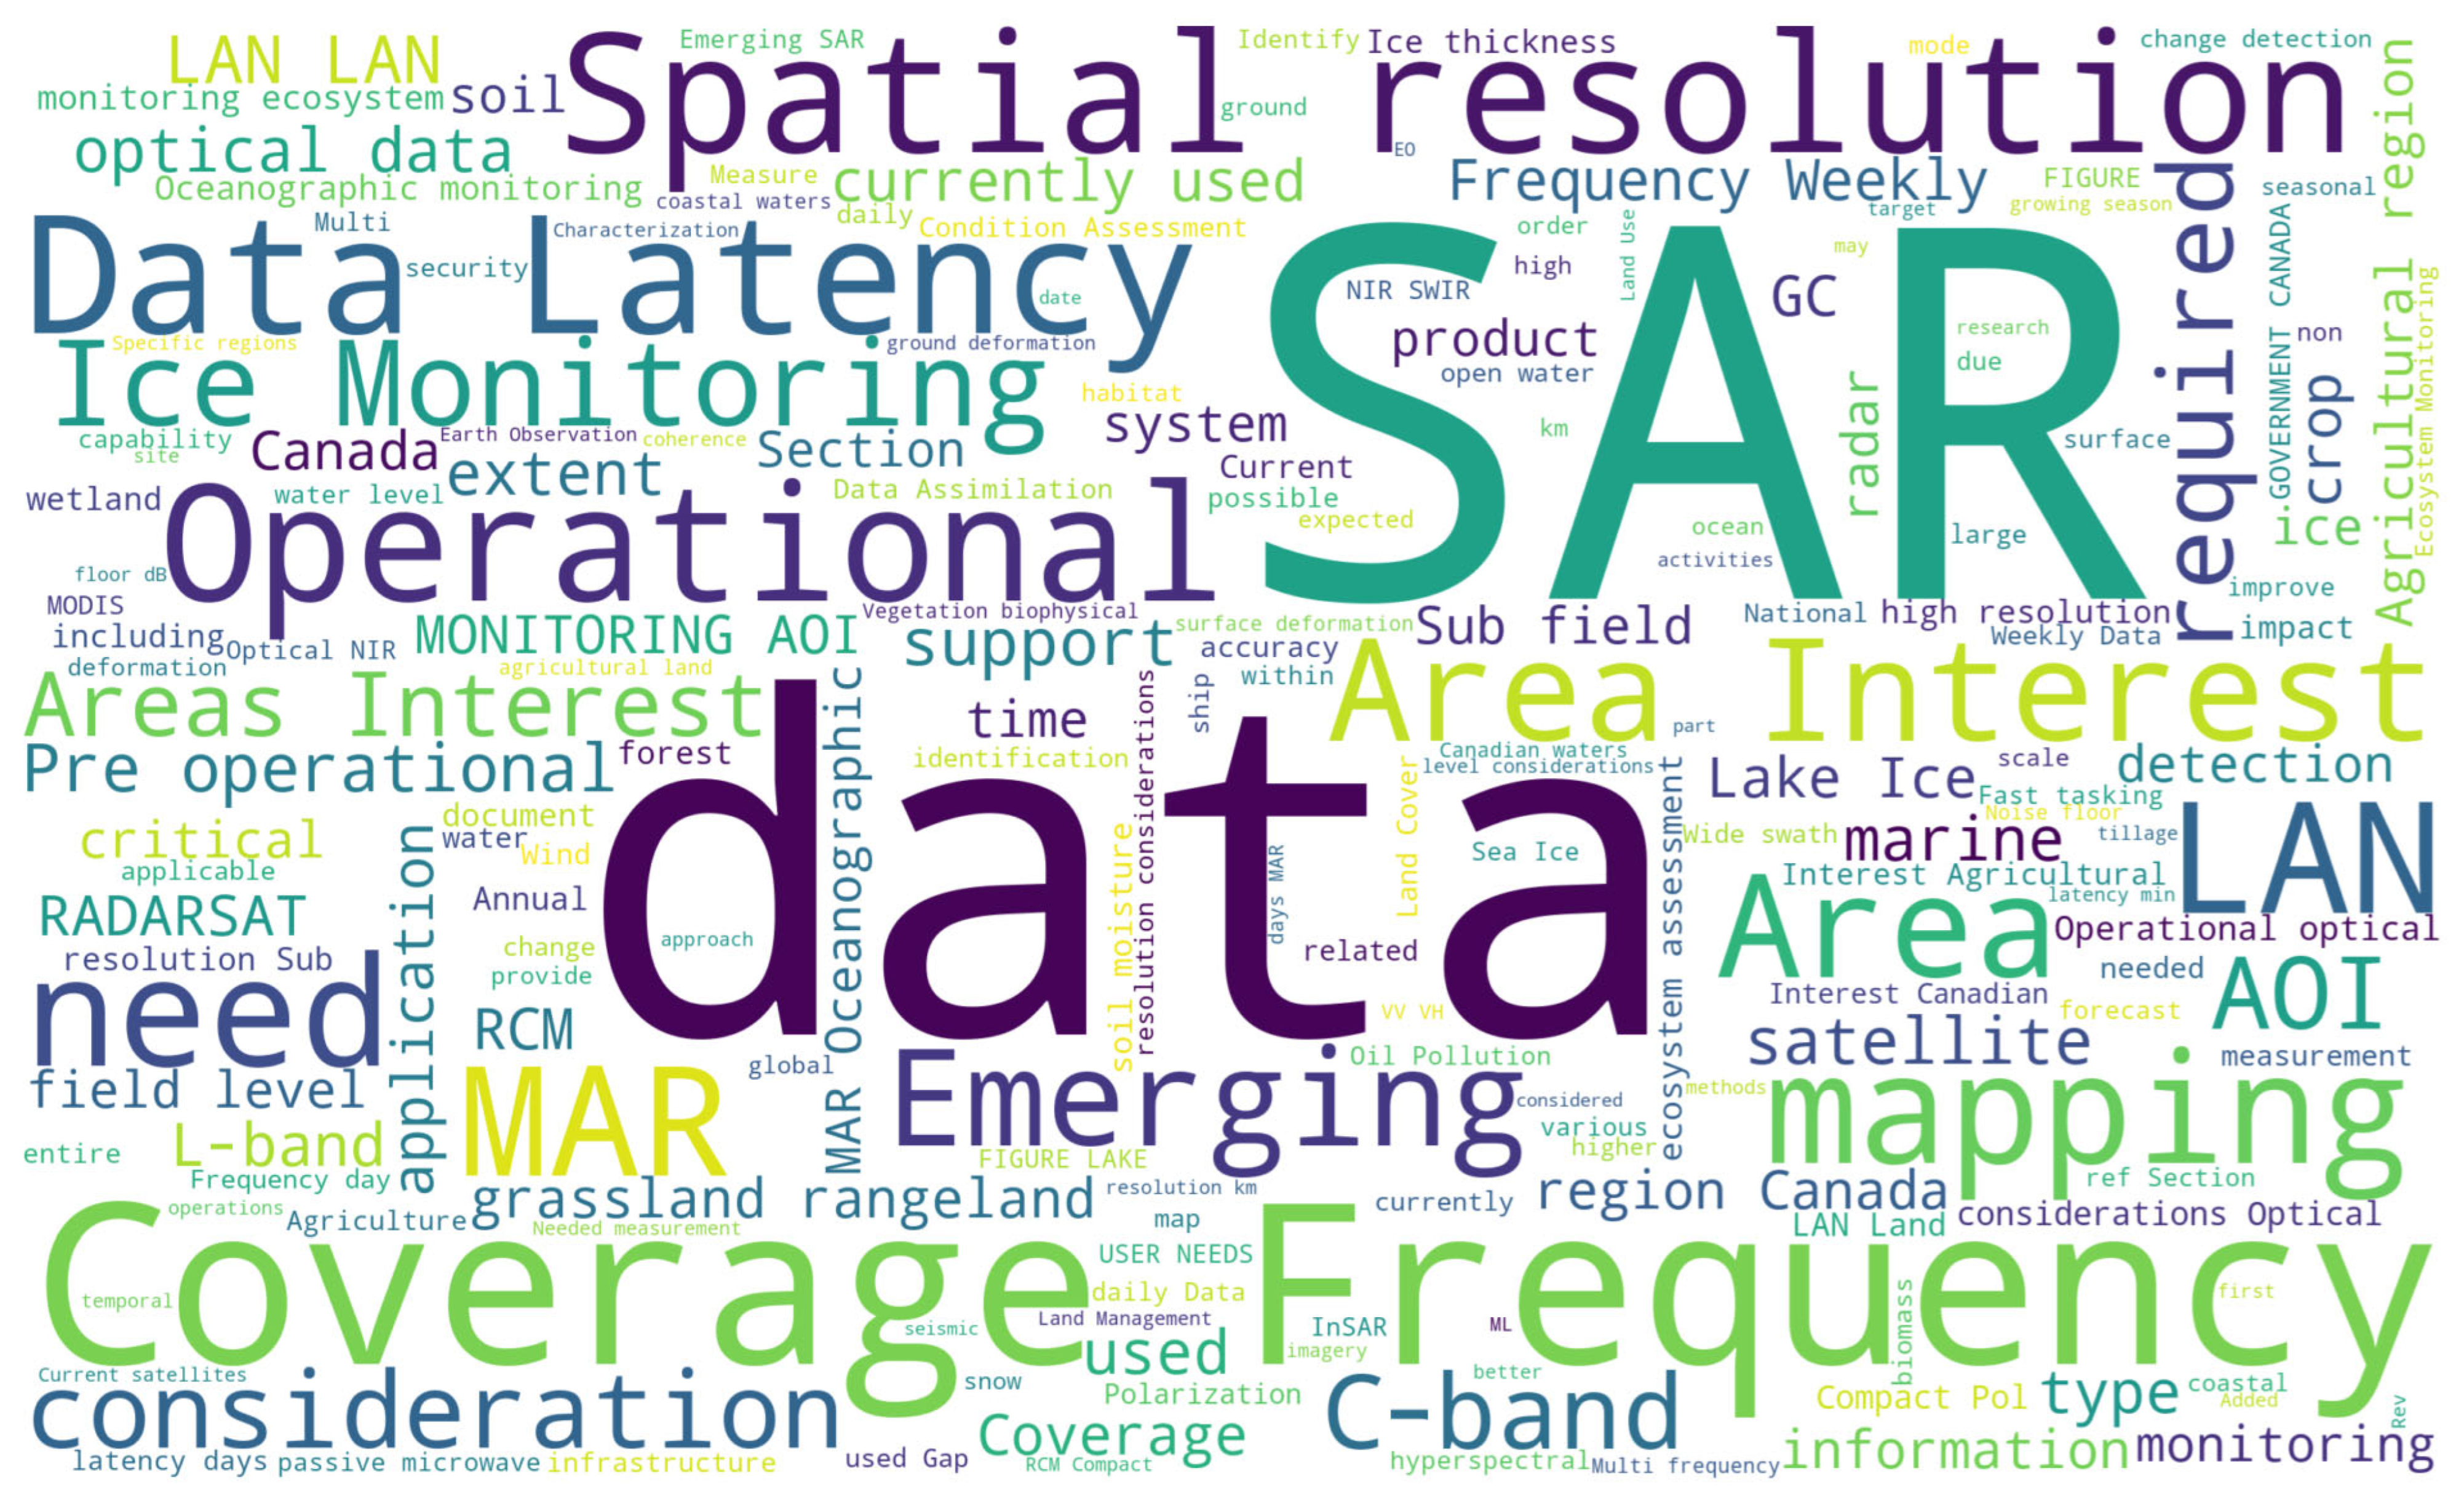
Figure 1. Word Cloud representing the HUN document.
Remotesensing 17 03761 g001
Figure 2. The percentage of user needs for different frequency bands (X, C, L, other), polarization options (Single, Dual, Full, Compact) and resolutions (HR, MR, LR) in HUN analysis for SAR segment.
Remotesensing 17 03761 g002
Figure 3. The Space Segment PBS.
Remotesensing 17 03761 g003
Figure 4. The Ground Segment PBS.
Remotesensing 17 03761 g004
Figure 5. The NESZ modeled for the ScanSAR mode of large-sized spacecraft.
Remotesensing 17 03761 g005
Figure 6. The NESZ modeled for the ScanSAR mode of moderate-sized spacecraft.
Remotesensing 17 03761 g006
Figure 7. The combined swaths (yellow and green) for two R4G satellites operated in tandem.
Remotesensing 17 03761 g007
Figure 8. Three different orbits for R4G operation. Orbit shown as a magenta-colored line is used by three satellites: two satellites (R4G-A and Tandem) operating at the same time, and the third satellite (R4G-B) is spaced 180° apart. The optimal orbit (OO-70) with 70° inclination is shown as a blue line, and OO other than dawn/dusk (~5 h later) is shown as a green line. The SAR beams are shown as red triangles.
Remotesensing 17 03761 g008
Figure 9. The revisit time over Canada AOI: on the left—for three satellites; on the right—for five satellites with an accessible swath of 600 km.
Remotesensing 17 03761 g009
Figure 10. Simulated revisit time achieved by four SAR satellites with 500 km swath.
Remotesensing 17 03761 g010
Figure 11. Example of the average coverage frequency over Ice Monitoring AOI with the HWRS beam mode (20 m resolution, 500 km swath, dual/CP): on the left—for Option 1 (three satellites); on the right—for Option 2 (five satellites).
Remotesensing 17 03761 g011
Figure 12. The cumulative average coverage frequency over the Ice Monitoring AOI with the HWRS beam mode: on the left—for three satellites; on the right—for five satellites.
Remotesensing 17 03761 g012
Figure 13. Example of R4G swath along the Arctic, the east coast, and the Atlantic Ocean corresponding to 20 min of duty cycle.
Remotesensing 17 03761 g013
Figure 14. Power system mass as a function of duty cycle for a large-sized satellite in sun-synchronous orbit (left) and optimal orbit (right).
Remotesensing 17 03761 g014
Figure 15. Allocation of subsystems’ percentage in spacecraft mass (top row) and mass of each subsystem (bottom row) for satellites of moderate size (left), large size on sun-synchronous orbit (middle), and large size on optimal orbit (right).
Remotesensing 17 03761 g015
Figure 16. Latency achieved with three NRCan and additional ground stations for worst-case orbit scenario: three additional stations in Happy Valley Goose Bay, Fairbanks, and Iqaluit (left) and one additional station in Iqaluit (right).
Remotesensing 17 03761 g016
Figure 17. Areas accessible by satellites with existing (green circles) and proposed new (magenta circles) ground stations.
Remotesensing 17 03761 g017
Figure 18. Accumulated data amount (PB) for storage over 15 years of data continuity.
Remotesensing 17 03761 g018
Figure 19. Architecture of the data center concept.
Remotesensing 17 03761 g019
Figure 20. MASCOT's graphic user interface with cost estimations for three moderate (1667 kg) SAR satellites.
Remotesensing 17 03761 g020
Figure 21. Schedule for proposed assets of the Solution.
Remotesensing 17 03761 g021
Figure 22. Compliance of two Solution options (with 3 and 5 satellites) to C-band SAR user needs.
Remotesensing 17 03761 g022
Table 1. Heritage cost factors.
Development Heritage Definitions
(Applied Only to RDT&E Costs)
MASCOTs Entry, %Multiplicative Factor
New design with advanced development0–20>1.1–0.9
Nominal new design—some heritage21–400.9–0.7
Major modification to existing design41–600.5–0.7
Moderate modifications61–800.3–0.5
Basically existing design81–1000.1–0.3
Table 2. Modeled SAR Performance.
Satellite SizeResolutionSwath WidthModeled
NESZ
Comments
Large3 m100 km−24 dBNESZ derived *
5 m100 km−28.1 dB25 m2 resolution cell size, steep incidence, Stripmap
10 m500 km−23 dBNESZ derived
10 m350 km−24.9 dB100 m2 resolution cell size
10 m200 km−27.3 dB100 m2 resolution cell size
20 m500 km−28.7 dB400 m2 resolution cell size
20 m350 km−31 dBNESZ derived
Moderate3 m100 km−20 dBNESZ derived
5 m100 km−24.3 dB25 m2 resolution cell size, steep incidence, Stripmap
10 m200 km−25.1 dB100 m2 resolution cell size
10 m100 km−30 dBNESZ derived
20 m500 km−25.2 dB400 m2 resolution cell size
20 m350 km−27 dBNESZ derived
20 m200 km−31 dBNESZ derived
* “NESZ derived” means that the NESZ value is calculated by the forecast software and adjusted (add or subtract in dB) according to the 2-D resolution ratio (which can be set by commanding different RF bandwidths): NESZ~(RF bandwidth)~(1/across resolution)~(1/resolution area cell size) assuming along resolution unchanged.
Table 3. Lifecycle costs (in millions of Canadian dollars, Y2025) for three moderate and five large satellites.
Mission OptionDesign
(Phases B–C)
Production
(Phase D)
LaunchOperation
(Phase E)
Total
Option 1: 3 moderate satellites681.3622.994191.41589.5
Option 2: 5 large satellites841.51462.0188.0319.02843.7
Disclaimer/Publisher’s Note: The statements, opinions and data contained in all publications are solely those of the individual author(s) and contributor(s) and not of MDPI and/or the editor(s). MDPI and/or the editor(s) disclaim responsibility for any injury to people or property resulting from any ideas, methods, instructions or products referred to in the content.