Article

Locate then Calibrate: A Synergistic Framework for Small Object Detection from Aerial Imagery to Ground-Level Views

Aulin College, Northeast Forestry University, Harbin 150040, China
*
Author to whom correspondence should be addressed.
Remote Sens. 2025, 17(22), 3750; https://doi.org/10.3390/rs17223750
Submission received: 16 October 2025 / Revised: 14 November 2025 / Accepted: 17 November 2025 / Published: 18 November 2025
(This article belongs to the Section Remote Sensing Image Processing)

Highlights

What are the main findings?
  • A synergistic “Locate then Calibrate” (LTC) framework is proposed, which combines spatial attention (to locate targets) with a novel adaptive multi-scale module (to calibrate features).
  • The proposed LTC framework achieves a remarkable 11.7% increase in mAP50 over the YOLOv8 baseline on the challenging VisDrone dataset and demonstrates strong cross-domain generalization, significantly outperforming the baseline on ground-level datasets (e.g., KITTI and TT100K_mini).
What is the implication of the main finding?
  • The LTC framework provides a more robust and reliable perception solution for safety-critical applications such as UAV-based aerial surveillance and autonomous driving.
  • The “Locate then Calibrate” strategy offers a new and effective design principle for object detectors, demonstrating that decoupling spatial localization from scale adaptation is highly beneficial for small object detection.

Abstract

Detection of small objects in aerial images captured by Unmanned Aerial Vehicles (UAVs) is a critical task in remote sensing. It is vital for applications like urban monitoring and disaster assessment. This task, however, is challenged by unique viewpoints, diminutive target sizes, and dense scenes. To surmount these challenges, this paper introduces the Locate then Calibrate (LTC) framework. It is a deep learning architecture designed to enhance visual perception systems, specifically for the accurate and robust detection of small objects. Our model builds upon the YOLOv8 architecture and incorporates three synergistic innovations. (1) An Efficient Multi-Scale Attention (EMA) mechanism is employed to ‘Locate’ salient targets by capturing critical cross-dimensional dependencies. (2) We propose a novel Adaptive Multi-Scale (AMS) convolution module to ‘Calibrate’ features, using dynamically learned weights to optimally fuse multi-scale information. (3) An additional high-resolution P2 detection head preserves the fine-grained details essential for localizing diminutive targets. Extensive experimental evaluations demonstrate that the proposed model substantially outperforms the YOLOv8n baseline. Notably, it achieves significant performance gains on the challenging VisDrone aerial dataset. On this dataset, the model achieves a remarkable 11.7% relative increase in mean Average Precision (mAP50). The framework also shows strong generalization. Considerable improvements are recorded on ground-level autonomous driving benchmarks such as KITTI and TT100K_mini. This validated effectiveness proves that LTC is a robust solution for high-accuracy detection: it achieves significant accuracy gains at the cost of a deliberate increase in computational GFLOPs, while maintaining a lightweight parameter count. This design choice positions LTC as a solution for edge applications where accuracy is prioritized over minimal computational cost.

1. Introduction

Low-altitude remote sensing via Unmanned Aerial Vehicles (UAVs) plays a vital role in urban planning, disaster response, and precision agriculture [1]. The ability to accurately detect small objects from these images is critical. Aerial imagery, however, presents a formidable challenge due to diminutive target sizes, extreme object density, and complex backgrounds. This challenge is not unique to aerial platforms; it represents a core bottleneck in other critical domains. One notable example is ground-level autonomous driving, where perception systems must reliably detect distant pedestrians or traffic signs [2]. Therefore, efficient and robust small object detection remains a fundamental and cross-domain problem for resource-constrained intelligent systems.
Regardless of the viewpoint, lightweight models face three fundamental technical challenges when processing small objects:
1.
Feature Erosion: The fine-grained spatial details representing diminutive targets often span just a few pixels. These details are progressively diluted or entirely lost during the aggressive downsampling in the network’s backbone.
2.
Scale Mismatch and Feature Contamination: The large receptive fields of deep convolutional layers often engulf small targets. This causes their features to be overwhelmed and contaminated by dominant background textures.
3.
Label Assignment Instability: Metrics such as Intersection over Union (IoU) are notoriously volatile for small objects. Minor pixel-level perturbations in a predicted box can induce drastic IoU fluctuations, destabilizing the dynamic label assignment process (like the Task-Aligned Assigner) used by modern detectors and hindering robust model convergence.
Existing detectors struggle to resolve these challenges simultaneously. On one hand, lightweight one-stage detectors, such as YOLOv8 [3], provide a strong foundation for real-time analysis. But their standard architecture is inherently vulnerable to feature erosion, and their static feature fusion mechanisms are also insufficient to handle severe scale mismatch. In contrast, heavyweight State-of-the-Art (SOTA) models, such as Transformer-based architectures (e.g., DINO-DETR [4]) and emerging Mamba-style models (e.g., Vision Mamba [5], VMamba [6], etc.), have demonstrated exceptional performance in modeling global dependencies. Such models often rely on complex attention mechanisms to capture long-range feature interactions, for example, Multi-Head Self-Attention or its more efficient variants (e.g., Efficient Multi-Scale Attention [7]). They achieve significant performance gains in object detection and visual understanding tasks.
However, these heavyweight models universally possess massive parameter scales and extremely high computational complexity. This imposes stringent demands on memory, computing power, and bandwidth. Although Mamba-style architectures theoretically feature linear time complexity, their current implementations still rely on deep network structures and large-scale state-space modeling. This makes real-time inference in resource-constrained environments challenging. Consequently, such models are often difficult to deploy directly on edge computing platforms (e.g., UAV on-board processors or in-vehicle computers), limiting their practicality in applications with low-power and high-real-time requirements, such as aerial remote sensing and intelligent driving. Based on this, this paper focuses on designing an architecture that achieves high computational efficiency and lightweight feature expression while ensuring detection accuracy, aiming to realize a high-performance edge visual perception system.
To directly address the three aforementioned technical challenges without significantly impacting computational efficiency, we propose the Locate then Calibrate (LTC) framework. The LTC framework is a synergistic enhancement of the YOLOv8n baseline. It is engineered with three key components mapped directly to these challenges:
1.
To combat feature erosion and assignment instability, we augment the framework with a high-resolution P2 detection head. This preserves the fine-grained details necessary for localization and provides a more stable feature foundation for the label assigner.
2.
To mitigate feature contamination, we introduce the Efficient Multi-Scale Attention (EMA) mechanism to perform the “Locate” step. It captures global context to help the model focus on salient target regions and suppress background noise.
3.
To resolve the scale mismatch, we propose a novel Adaptive Multi-Scale (AMS) convolution module as the “Calibrate” step. This module dynamically re-calibrates multi-scale features, learning to optimally fuse target information based on the input content.
In order to validate the LTC framework’s accuracy and robustness, we conducted extensive experiments on multiple public datasets. The results show that LTC not only outperforms its YOLOv8n baseline and other competitive lightweight methods in the remote sensing domain but also shows excellent generalization across different domains.
Section 2 reviews related work in object detection and attention mechanisms, and details the LTC framework, elaborating on the architecture of the AMS module and its synergy with EMA and the P2 head. Section 3 mainly presents a comprehensive analysis of the model’s performance. Section 4 interprets the experimental findings, analyzing the framework’s limitations. And Section 5 concludes the paper with a summary of our findings and discusses potential directions for future research.

2. Materials and Methods

2.1. Related Work

2.1.1. The Computational Dilemma of Transformer and Mamba

Compared to lightweight models, heavyweight models often yield better performance on small object detection. But, in terms of parameters and GFLOPs, their values are typically much higher than those of lightweight models, which makes them difficult to deploy on edge devices. This section will discuss Transformer and its variants and Mamba-style architectures.
In order to overcome the locality constraints of traditional CNNs in capturing long-range dependencies, the Vision Transformer (ViT) [8] introduced the self-attention mechanism. This mechanism allows every image patch to interact directly with all other patches, achieving a truly global receptive field and enabling breakthroughs in numerous visual tasks.
However, ViT’s global modeling capability comes at a high computational cost. The complexity of its self-attention mechanism is quadratic to the number of input patches (N), i.e., O ( N 2 ) [9]. As the spatial resolution of remote sensing or autonomous driving imagery increases, N grows rapidly, causing an explosive increase in ViT’s computational and memory demands, creating a severe “scalability crisis” [10]. This theoretical quadratic complexity translates to immense practical overhead. For instance, models like DETR [11] and its SOTA variant DINO-DETR, while achieving impressive performance using global attention, are computationally exorbitant.
To address ViT’s complexity, the Mamba architecture [12], based on Structured State Space Models (SSMs), emerged. Through an innovative selective scan mechanism (SSM), Mamba theoretically reduces the computational complexity to linear time, O ( N ) , while still modeling global context.
However, theoretical linear complexity does not equate to practical lightweight performance. The SOTA race, whether Transformer or Mamba-based, aims to maximize performance, not minimize cost. Consequently, emerging Mamba-style detectors (e.g., PanMamba [13] or MambaVision [14]) and optimized Transformers (e.g., RT-DETR [15]) still rely on massive parameter scales and high computational loads to achieve top performance on standard benchmarks, despite their efficiency improvements.
Therefore, these SOTA paradigms (both Transformer and Mamba) operate in a completely different computational class from lightweight models. This high performance is achieved at the cost of immense computational complexity, making them computationally infeasible for the real-time, on-board processing needs we focus on. As we summarize in Table 1, the parameters and GFLOPs of these models are often an order of magnitude larger than our lightweight baseline (YOLOv8n). For instance, numerous recent SOTA models, whether they are general-purpose Transformer variants (e.g., DINO-4scale, RT-DETR (R50)) or specialized Mamba-style architectures for remote sensing (e.g., RSM-CD, M-CD [16], MambaBCD-Tiny [17], UAV-DETR-EV2 [18]), all fall into this heavyweight category.
Given this, our comparisons in the Results section (Section 3) will primarily focus on SOTA lightweight models published in the last year that are also based on the YOLO framework and specialize in small object detection.

2.1.2. Object Detection Paradigms and Baseline Choice

Our work is positioned in the critical domain of lightweight object detection, specifically targeting deployment on resource-constrained edge platforms like UAVs and in-vehicle systems. In this track, the primary challenge is maximizing detection accuracy under a strict computational budget. One-stage detectors, particularly the YOLO series [19,20,21], have become the de facto standard due to their exceptional balance of speed and accuracy.
YOLOv8, an influential version from Ultralytics, achieves a representative balance between detection speed and accuracy. Its architecture comprises an input pipeline, backbone, neck, and head. Compared to its predecessor YOLOv5, YOLOv8 introduces a more efficient C2f-based backbone and a Decoupled Head [22], which improves training stability and final accuracy by separating classification and regression tasks. In the neck, YOLOv8 retains the PAN topology [23] while enhancing feature fusion efficiency by simplifying upsampling stages and upgrading the SPP module [24] to the more efficient SPPF. Notably, YOLOv8 employs an anchor-free design and is available in multiple scales, from n (nano) to x (xlarge).
Although newer models like YOLOv11 [25] and YOLOv12 [26] have shown superior performance on standard benchmarks, this work intentionally selects YOLOv8n as the baseline. This decision is based not only on its core design, which provides an excellent and representative balance of accuracy and efficiency for resource-constrained hardware, but also on its mature ecosystem and broad community support, which are crucial for ensuring experimental reproducibility. Our research objective is therefore to develop and validate innovative perception algorithms for multi-scenario small object detection on this proven platform.
Given this fundamental difference in application tracks, our primary comparisons (in Section 3) focus on other SOTA lightweight models that share a similar computational budget. This section’s discussion aims to clearly position our work among all paradigms, clarifying that our contribution is an optimized solution for resource-constrained edge platforms that balances efficiency and accuracy.

2.1.3. Related Strategies for Small Object Detection

To address the three challenges mentioned in the Introduction (feature erosion, feature contamination, and assignment instability), various strategies have been proposed in the literature.
To combat feature erosion, enhancing multi-scale feature fusion is a primary approach. Since FPN [27] and PANet became standard, research has focused on optimizing the feature pyramid. A direct strategy involves incorporating feature maps from shallower, higher-resolution layers, such as the P2 layer, to preserve the fine-grained spatial details of minute targets. The efficacy of shallow features in boosting small object detection has been validated in works like YOLOv7 variants [28].
To address feature contamination and background noise, attention mechanisms are widely employed. Lightweight channel attention (e.g., SE-Net [29]) or spatial-temporal attention (e.g., CBAM [30] and our adopted EMA) have been shown to effectively help models “locate” salient feature regions and suppress irrelevant background noise, thereby improving the signal-to-noise ratio.
To handle label assignment instability, especially the volatility of IoU for small objects, research has shifted from traditional anchor-based static assignment to anchor-free dynamic assignment strategies. Dynamic assigners can adaptively assign positive and negative samples based on the quality and distribution of predictions. However, as noted in our Introduction, the stability of these strategies remains challenged when facing extremely diminutive targets. Our work builds upon these existing strategies, synergistically combining them to systematically address the aforementioned challenges.

2.2. Methodology

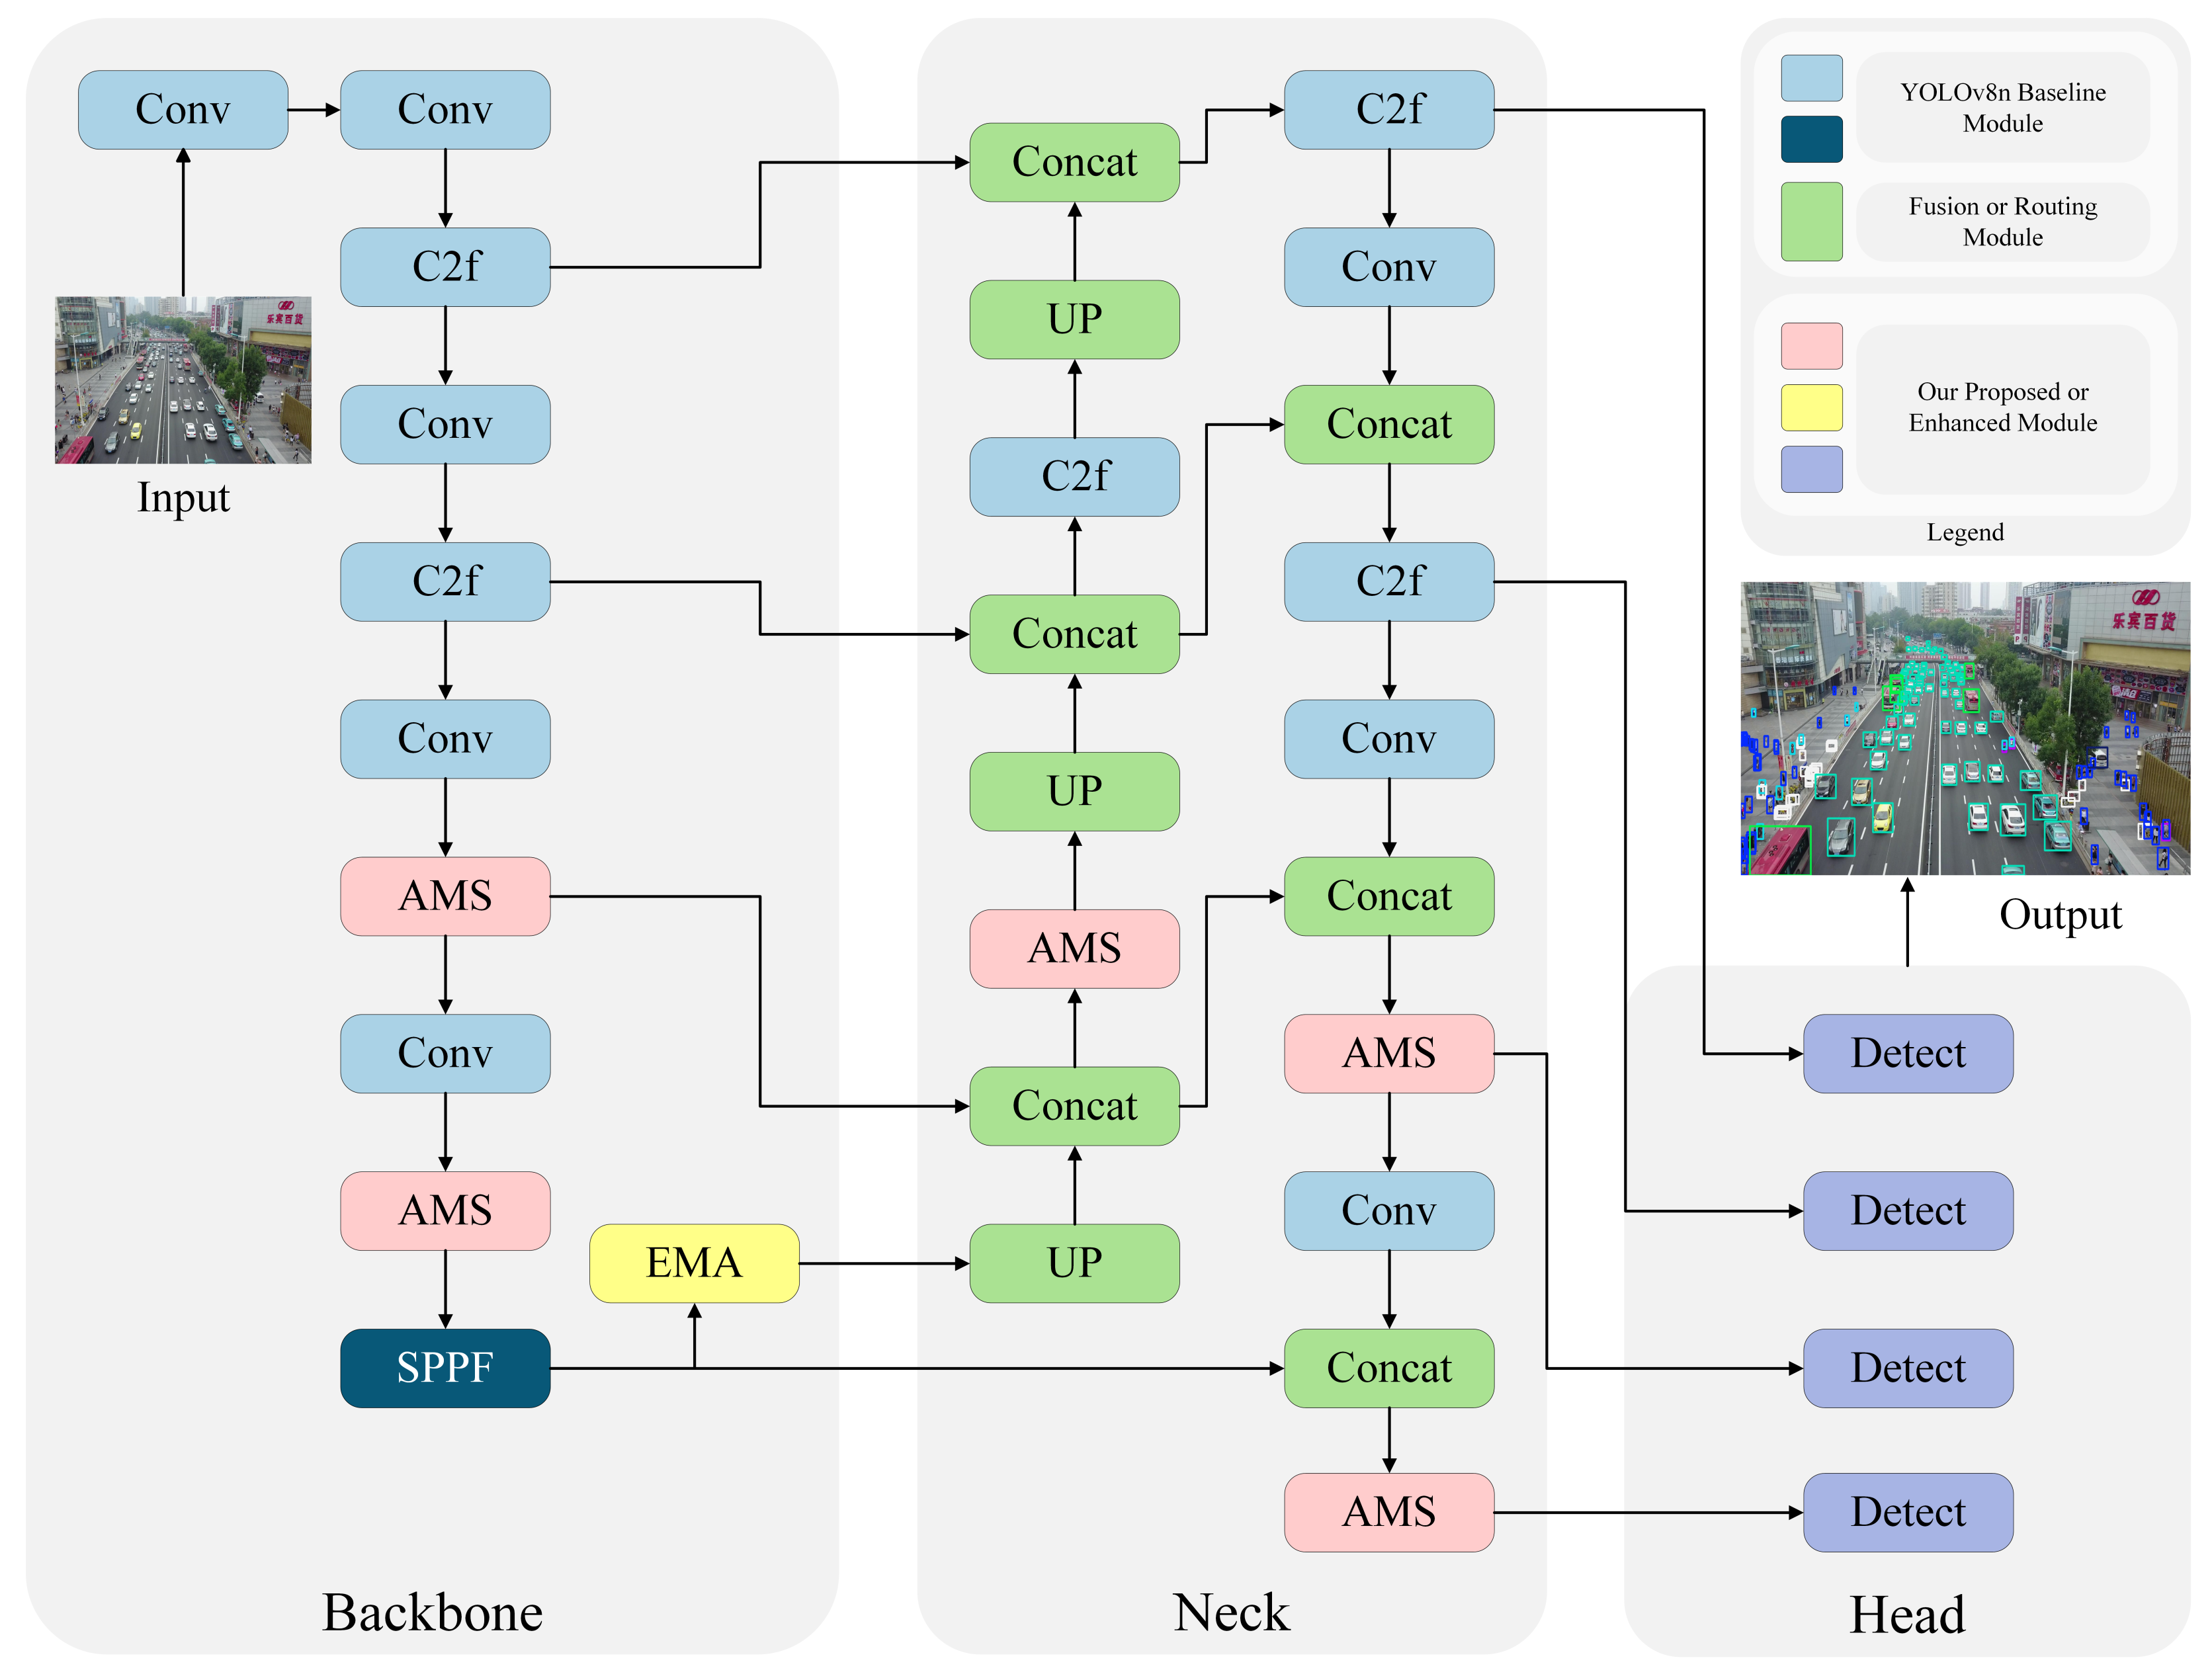
As illustrated in Figure 1, the proposed LTC architecture extends the foundational YOLOv8n framework—comprising a backbone, neck, and head—with three synergistic enhancements specifically engineered for small object detection. Specifically, we (1) substitute key C2f blocks with C2f-AMS modules for adaptive feature fusion; (2) incorporate the Efficient Multi-Scale Attention (EMA) mechanism into the backbone to refine feature salience; and (3) augment the neck with a high-resolution P2 detection head to preserve fine-grained details. The design principles and technical details of these components are elaborated upon in the subsequent sections.

2.2.1. The AMS Module

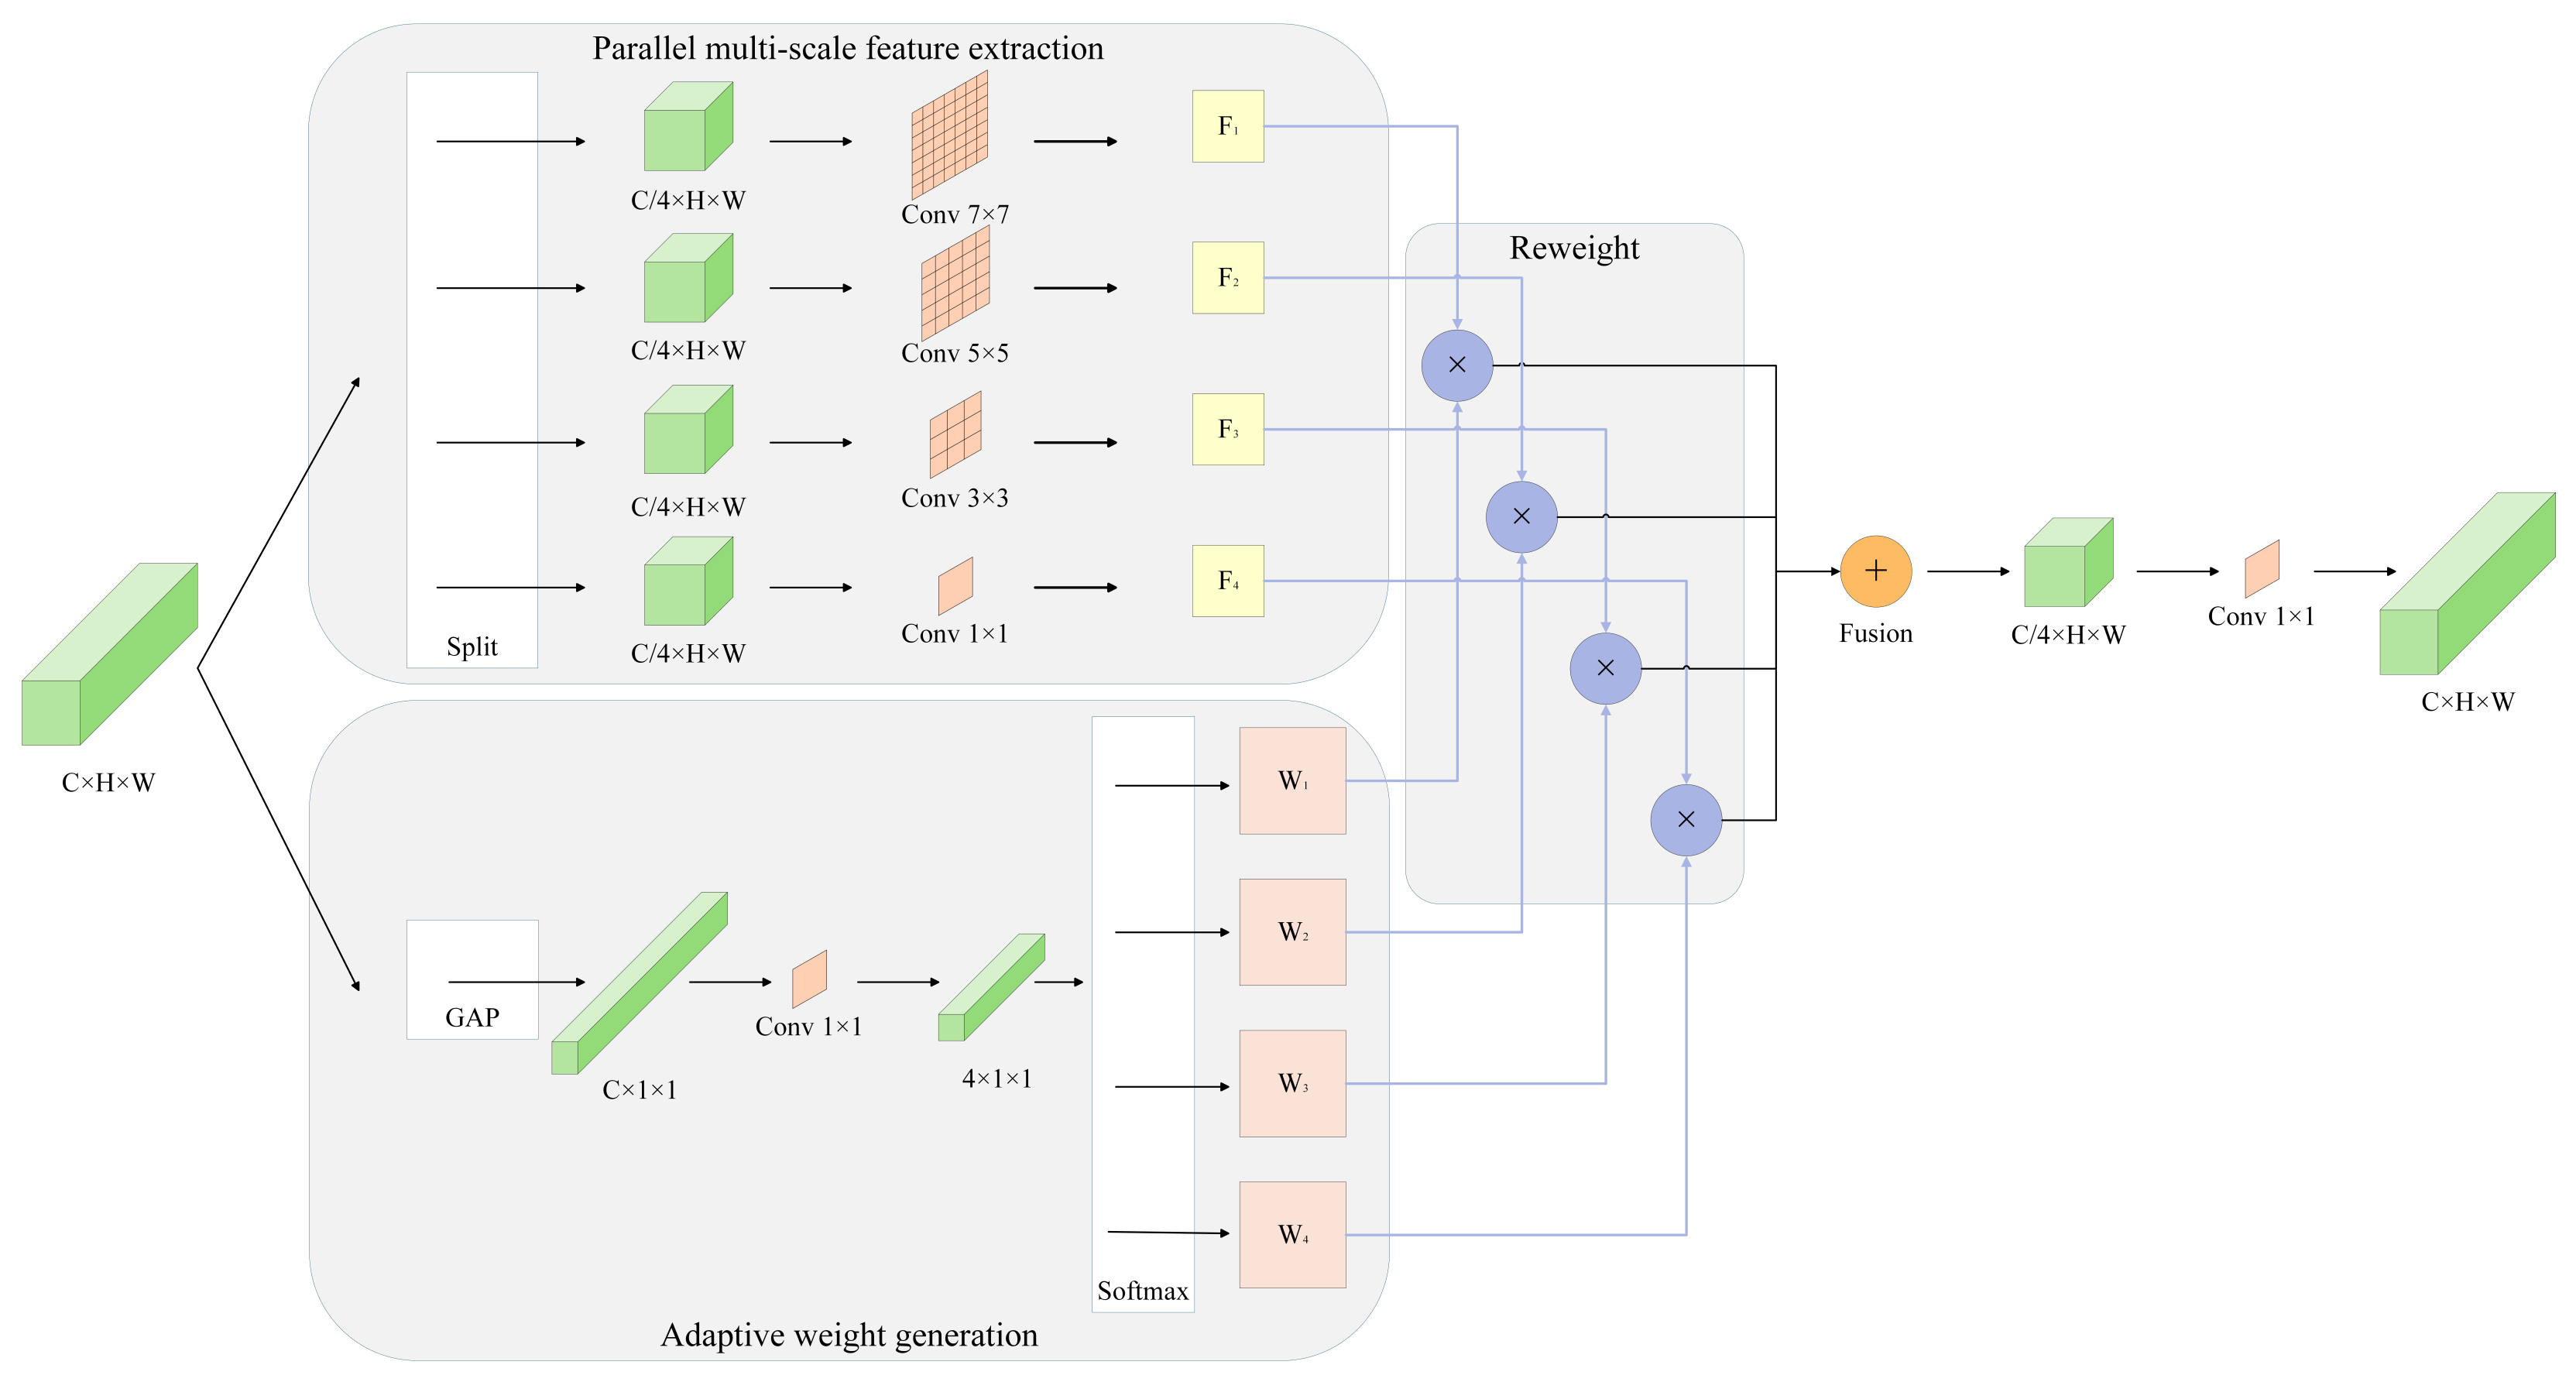
This section details the design of the proposed Adaptive Multi-Scale (AMS) convolution module, a novel component engineered for efficient and adaptive feature fusion. The detailed architecture of the AMS module is illustrated in Figure 2. The design is conceptually motivated by the principle of feature redundancy, as effectively exploited by the lightweight network GhostNet [31]. The central tenet of GhostNet is to approximate the output of a standard convolution through a more computationally parsimonious, two-stage process. It first employs a primary convolution to generate a set of “intrinsic” feature maps, which capture the core characteristics of the input. Subsequently, it applies a series of lightweight linear operations to these intrinsic maps to produce supplementary “ghost” features. By concatenating these two feature sets, GhostNet significantly reduces parametric and computational costs while maintaining a comparable feature representation capacity. Building upon this principle of computational efficiency, Li Jin et al. introduced the Efficient Multi-Scale Convolution Pyramid (EMSCP) module [32].
The EMSCP module is designed to efficiently fuse multi-scale feature information. Its core mechanism involves splitting the input feature map into four parallel branches along the channel dimension. Each branch is then processed by a convolutional kernel of a different size (1 × 1, 3 × 3, 5 × 5, and 7 × 7, respectively). This design aims to simultaneously capture diverse levels of information, from fine-grained local details to broad contextual information. Subsequently, the output feature maps from all branches are concatenated and passed through a final 1 × 1 convolution for information integration and channel dimension restoration. Compared to using a single large-kernel convolution, this architecture acquires rich multi-scale features at a lower computational cost.
However, the analysis reveals a fundamental limitation of the EMSCP module: its input-agnostic static feature fusion strategy. The simple concatenation operation is tantamount to assigning a fixed and uniform weight to each scale branch. In practice, the importance of different scales is highly dynamic and content-dependent; scenes with small objects demand greater attention to fine-grained features (captured by small kernels), whereas those with large objects rely more on global context (captured by large kernels). EMSCP’s static fusion mechanism cannot adapt to these variations in input, leading to a sub-optimal representation where critical scale-specific information is diluted by redundant features, thereby limiting its performance in complex scenarios.
To overcome this limitation, we propose the Adaptive Multi-Scale (AMS) module, which introduces a novel Adaptive Scale Attention mechanism. This mechanism transforms the feature fusion from a passive, static aggregation into an active, content-dependent selection process. Specifically, a lightweight weight-learning network first leverages Global Average Pooling (GAP) [33] to generate a global context descriptor. Based on this descriptor, the network dynamically generates a unique attention weight for each parallel scale branch. In this manner, the AMS module selectively enhances the most informative scale-specific features while suppressing the others. This ensures the fused representation is optimally tailored to the input content, significantly improving the model’s adaptability and accuracy.
While this mechanism is inspired by channel attention networks such as SENet, the Adaptive Scale Attention operates on a fundamentally different dimension. SENet recalibrates the importance of features along the channel dimension. In contrast, the AMS module operates on the scale dimension, addressing the distinct challenge of dynamically allocating weights among parallel multi-scale branches. This approach elevates the concept of attention from the channel level to a structural, scale-wise level, offering a new perspective on multi-scale representation learning.
The process begins by splitting the input feature map X R C × H × W evenly into N sub-feature maps X i R ( C / N ) × H × W along the channel dimension. Each sub-feature map is then fed into a separate branch with a specific kernel size for feature extraction, yielding a corresponding output feature map F i This operation is formulated as:
F i = Conv i ( X i ) , i = 1 , 2 , 3 , 4
Here, Conv 1 , Conv 2 , Conv 3 , and Conv 4 represent convolution operations with kernel sizes of 1 × 1, 3 × 3, 5 × 5, and 7 × 7 respectively.
The core innovation of the AMS module is its adaptive weight-learning network, which dynamically generates a set of weights W = [ W 1 , W 2 , W 3 , W 4 ] , based on the input feature map X. This process consists of two primary stages: adaptive weight generation and weighted feature fusion.
Adaptive Weight Generation
The generation of adaptive weights is a three-step process designed to convert the input feature map into a compact and informative set of weights for each scale branch:
  • Global Information Squeeze: The process begins by capturing a global context descriptor from the input feature map. We hypothesize that the spatial distribution of features correlates with object size; small objects produce localized, sharp activations, while large objects produce more dispersed activations. To capture this, we use Global Average Pooling (GAP) to squeeze the entire feature map X into a single channel-wise descriptor vector z:
    z = GAP ( X )
    This vector z encapsulates the global response intensity for each channel, serving as an effective summary of the scene’s characteristics.
  • Weight Excitation: The global descriptor z is then fed into a lightweight network to learn the mapping from global information to branch importance. This is implemented using a simple 1 × 1 convolution, which acts as an efficient channel-wise fully connected layer, to produce a raw weight vector (logits) w :
    w = Conv 1 × 1 ( z )
    The parameters of this convolutional layer are learned end-to-end with the rest of the network.
  • Weight Normalization: To ensure the weights represent a probability distribution and to encourage competition among the branches, the Softmax function is applied to the raw weight vector w . This normalizes the weights so that they sum to 1 and amplifies the importance of the most relevant scale(s):
    W = Softmax ( w )
Weighted Feature Fusion
After obtaining the adaptive weights W and the output features F i from each of the four scale branches, the AMS module performs a dynamic weighted fusion. Each feature map F i is scaled by its corresponding learned weight w i . These weighted feature maps are then fused via summation to produce the final aggregated feature map, F A M S :
F A M S = i = 1 4 w i · F i
Finally, a 1 × 1 convolution is applied to the fused features to enable cross-channel information interaction and produce the final output Y of the AMS module:
Y = Conv 1 × 1 ( F A M S )
This process allows the AMS module to dynamically re-calibrate the contribution of each scale branch based on the input features, shifting from a static aggregation to an active, content-aware selection of information.

2.2.2. The EMA Mechanism

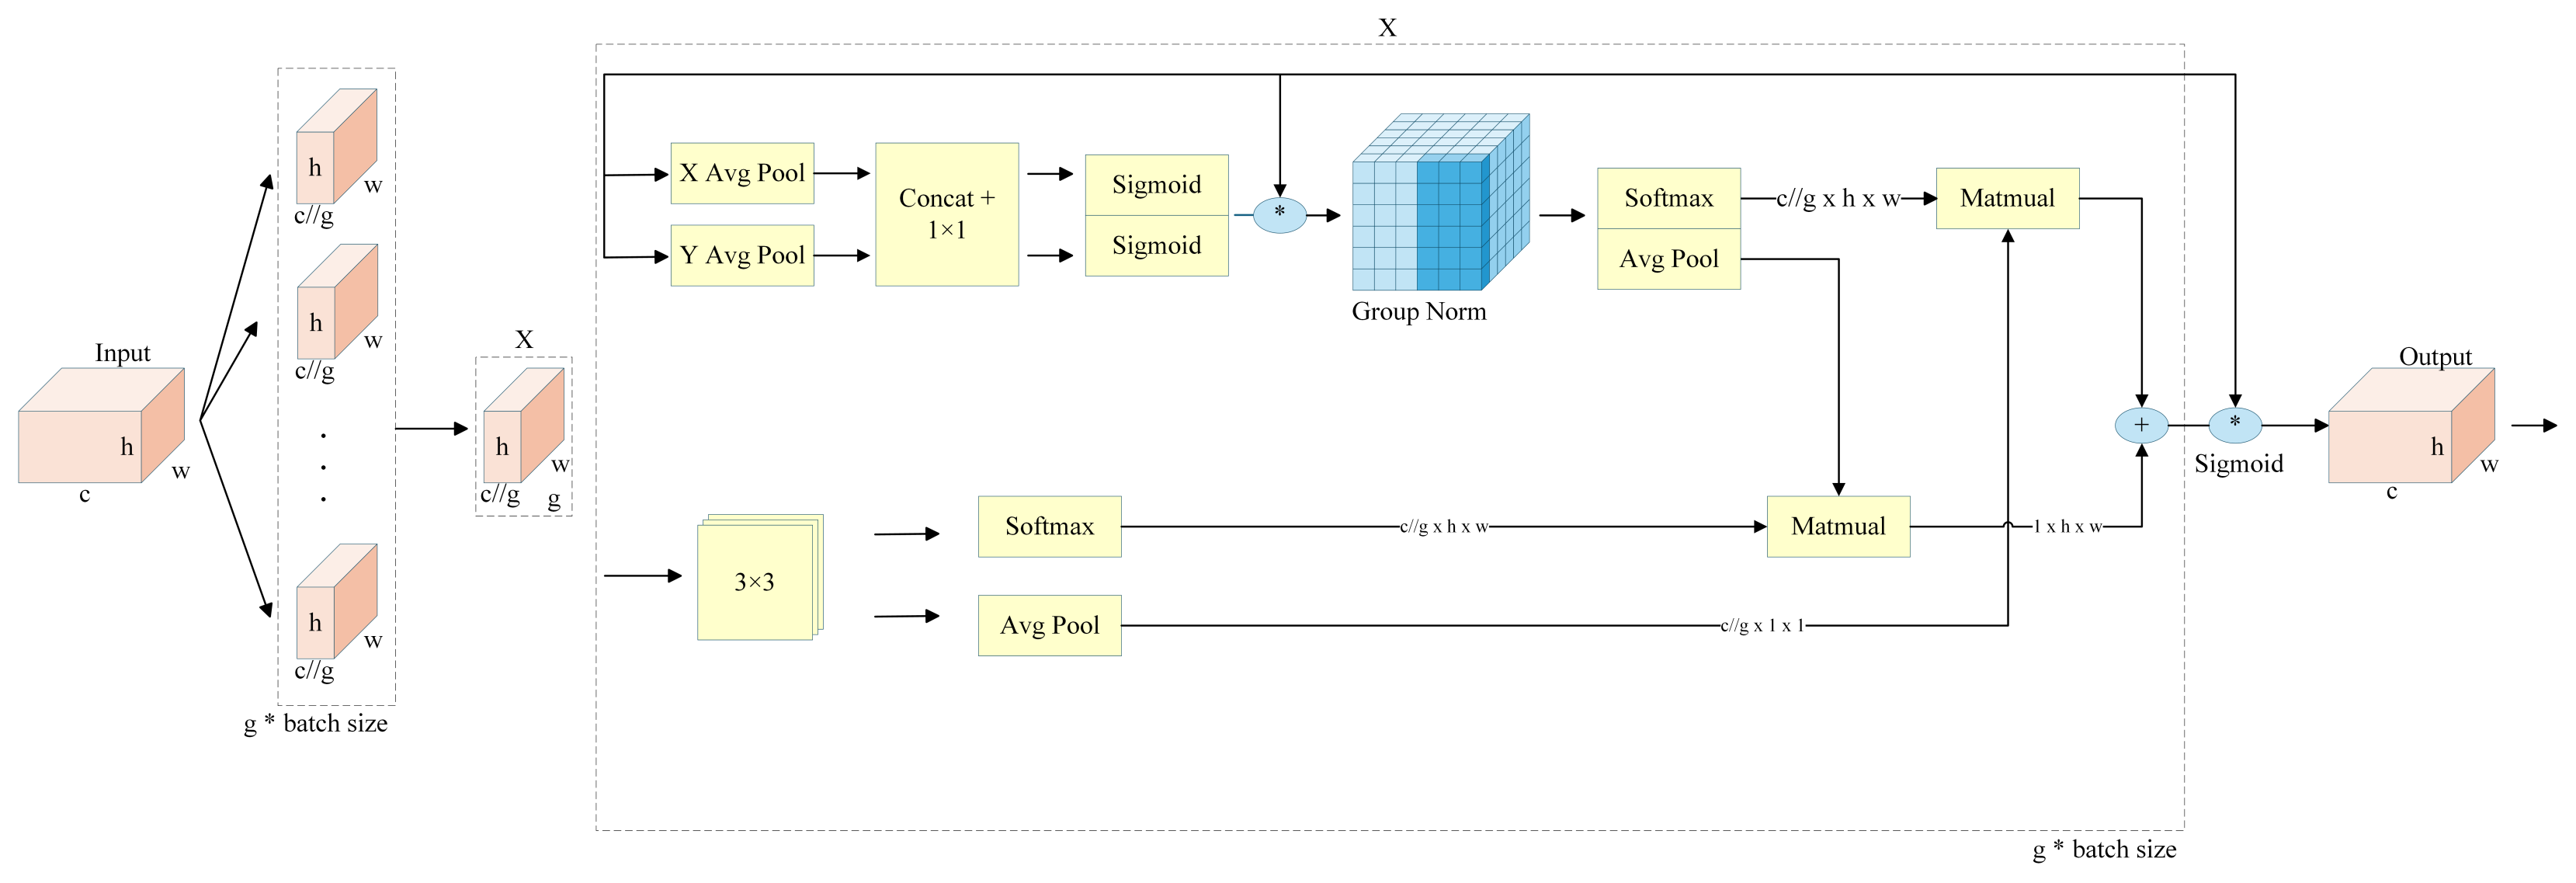
In complex visual perception tasks, the random movement of vehicles and pedestrians, frequent object occlusions, and backgrounds with features similar to targets all pose significant challenges. These multi-scale interfering factors can degrade a model’s recognition accuracy, leading to missed or false detections and compromising the safety of critical applications. To address these issues, we introduce the Efficient Multi-Scale Attention (EMA) mechanism. Figure 3 shows the overall structure of the EMA mechanism.
Attention mechanisms were proposed to overcome the limitations of traditional Convolutional Neural Networks (CNNs) in complex scenarios. By learning to weigh feature maps, attention modules enable a model to focus on salient target regions while suppressing irrelevant background information, thereby enhancing its feature discrimination capabilities in a plug-and-play manner. Current mainstream attention mechanisms can be broadly categorized. The Squeeze-and-Excitation (SE) module, for instance, models channel inter-dependencies but can suffer from information loss due to its dimensionality-reduction step. The CBAM module integrates both channel and spatial attention, showcasing the potential of cross-dimensional information interaction. More recently, the Coordinate Attention (CA) module [34] embedded positional information into channel attention by capturing long-range spatial dependencies through two 1D global pooling operations. However, these methods still have shortcomings in multi-scale feature fusion; for example, the limited receptive field of CA’s 1 × 1 convolutions can hinder detailed global and cross-channel modeling.
To overcome these limitations, the Efficient Multi-Scale Attention (EMA) module was introduced. Its architecture is designed to capture rich multi-scale spatial dependencies while preserving channel information integrity. The core of EMA can be deconstructed into three main stages: (1) Channel Splitting and Reshaping for efficient feature representation, (2) a parallel multi-scale network to extract short- and long-range dependencies, and (3) a Cross-Spatial Learning mechanism to fuse these dependencies adaptively.
Channel Splitting and Reshaping
Unlike the SE module, which uses a dimensionality-reduction bottleneck that can lead to information loss, EMA avoids this by retaining complete channel information. Given an input feature map X R C × H × W , the channel dimension C is first split into G groups. This operation is formulated as a tensor reshape:
X X R ( C / G ) × H × W × G × B
To enable parallel processing and reduce computational overhead, the group dimension G is then merged into the batch dimension B. This yields a reshaped tensor X g r o u p R ( C / G ) × H × W × ( G × B ) , which serves as the input to the subsequent parallel branches.
Parallel Multi-Scale Feature Extraction
The reshaped tensor X g r o u p is fed into a dual-branch parallel sub-network. One branch employs a 3 × 3 convolution to capture local spatial context and short-range dependencies. The other branch uses two sequential 1 × 1 convolutions to model cross-channel correlations and long-range dependencies efficiently. This parallel design allows EMA to simultaneously perceive features at different scales and levels of abstraction.
Cross-Spatial Learning and Fusion
To adaptively fuse the information from the parallel branches, EMA employs a cross-spatial learning mechanism based on dot-product attention. This stage explicitly models pixel-level pairwise relationships to highlight global contextual information. Specifically, a Query (Q) is generated from the output of the 1 × 1 convolution branch (long-range context), while a Key (K) and Value (V) are generated from the output of the 3 × 3 convolution branch (local context).
After flattening the spatial dimensions, such that Q , K , V R ( C / G ) × ( H × W ) × ( G × B ) , an attention map A is computed by measuring the similarity between the query and the key:
A = softmax Q T K d k
where d k is the dimension of the key vectors. The resulting attention map A R ( B × G ) × ( H × W ) × ( H × W ) encodes the pairwise importance between every pixel in the long-range feature map and every pixel in the local feature map. This map then weights the values V to produce an attended feature map:
F o u t = A · V T
Then, the output tensor F out is reshaped back to the original dimensions R B × C × H × W .
While EMA’s fusion mechanism uses a dot-product attention similar to standard Self-Attention (SA), it implements a form of Cross-Attention. In SA, the query, key, and value are derived from the same input tensor. In EMA, the query is derived from one branch (global context) and the key/value pair from another (local context). This design enables the module to explicitly model the relationships between long-range and short-range dependencies.
In our architecture, the EMA and AMS modules are highly complementary, addressing spatial and scale attention, respectively. EMA functions as a global spatial attention mechanism, modeling long-range dependencies to identify salient target regions. Subsequently, AMS performs fine-grained scale fusion, dynamically weighting parallel convolutional branches to select the optimal feature scale for the target. EMA first determines where to focus, and AMS then decides what scale to use, significantly enhancing the model’s detection performance in complex scenarios.

2.2.3. P2 Small Object Detection Head

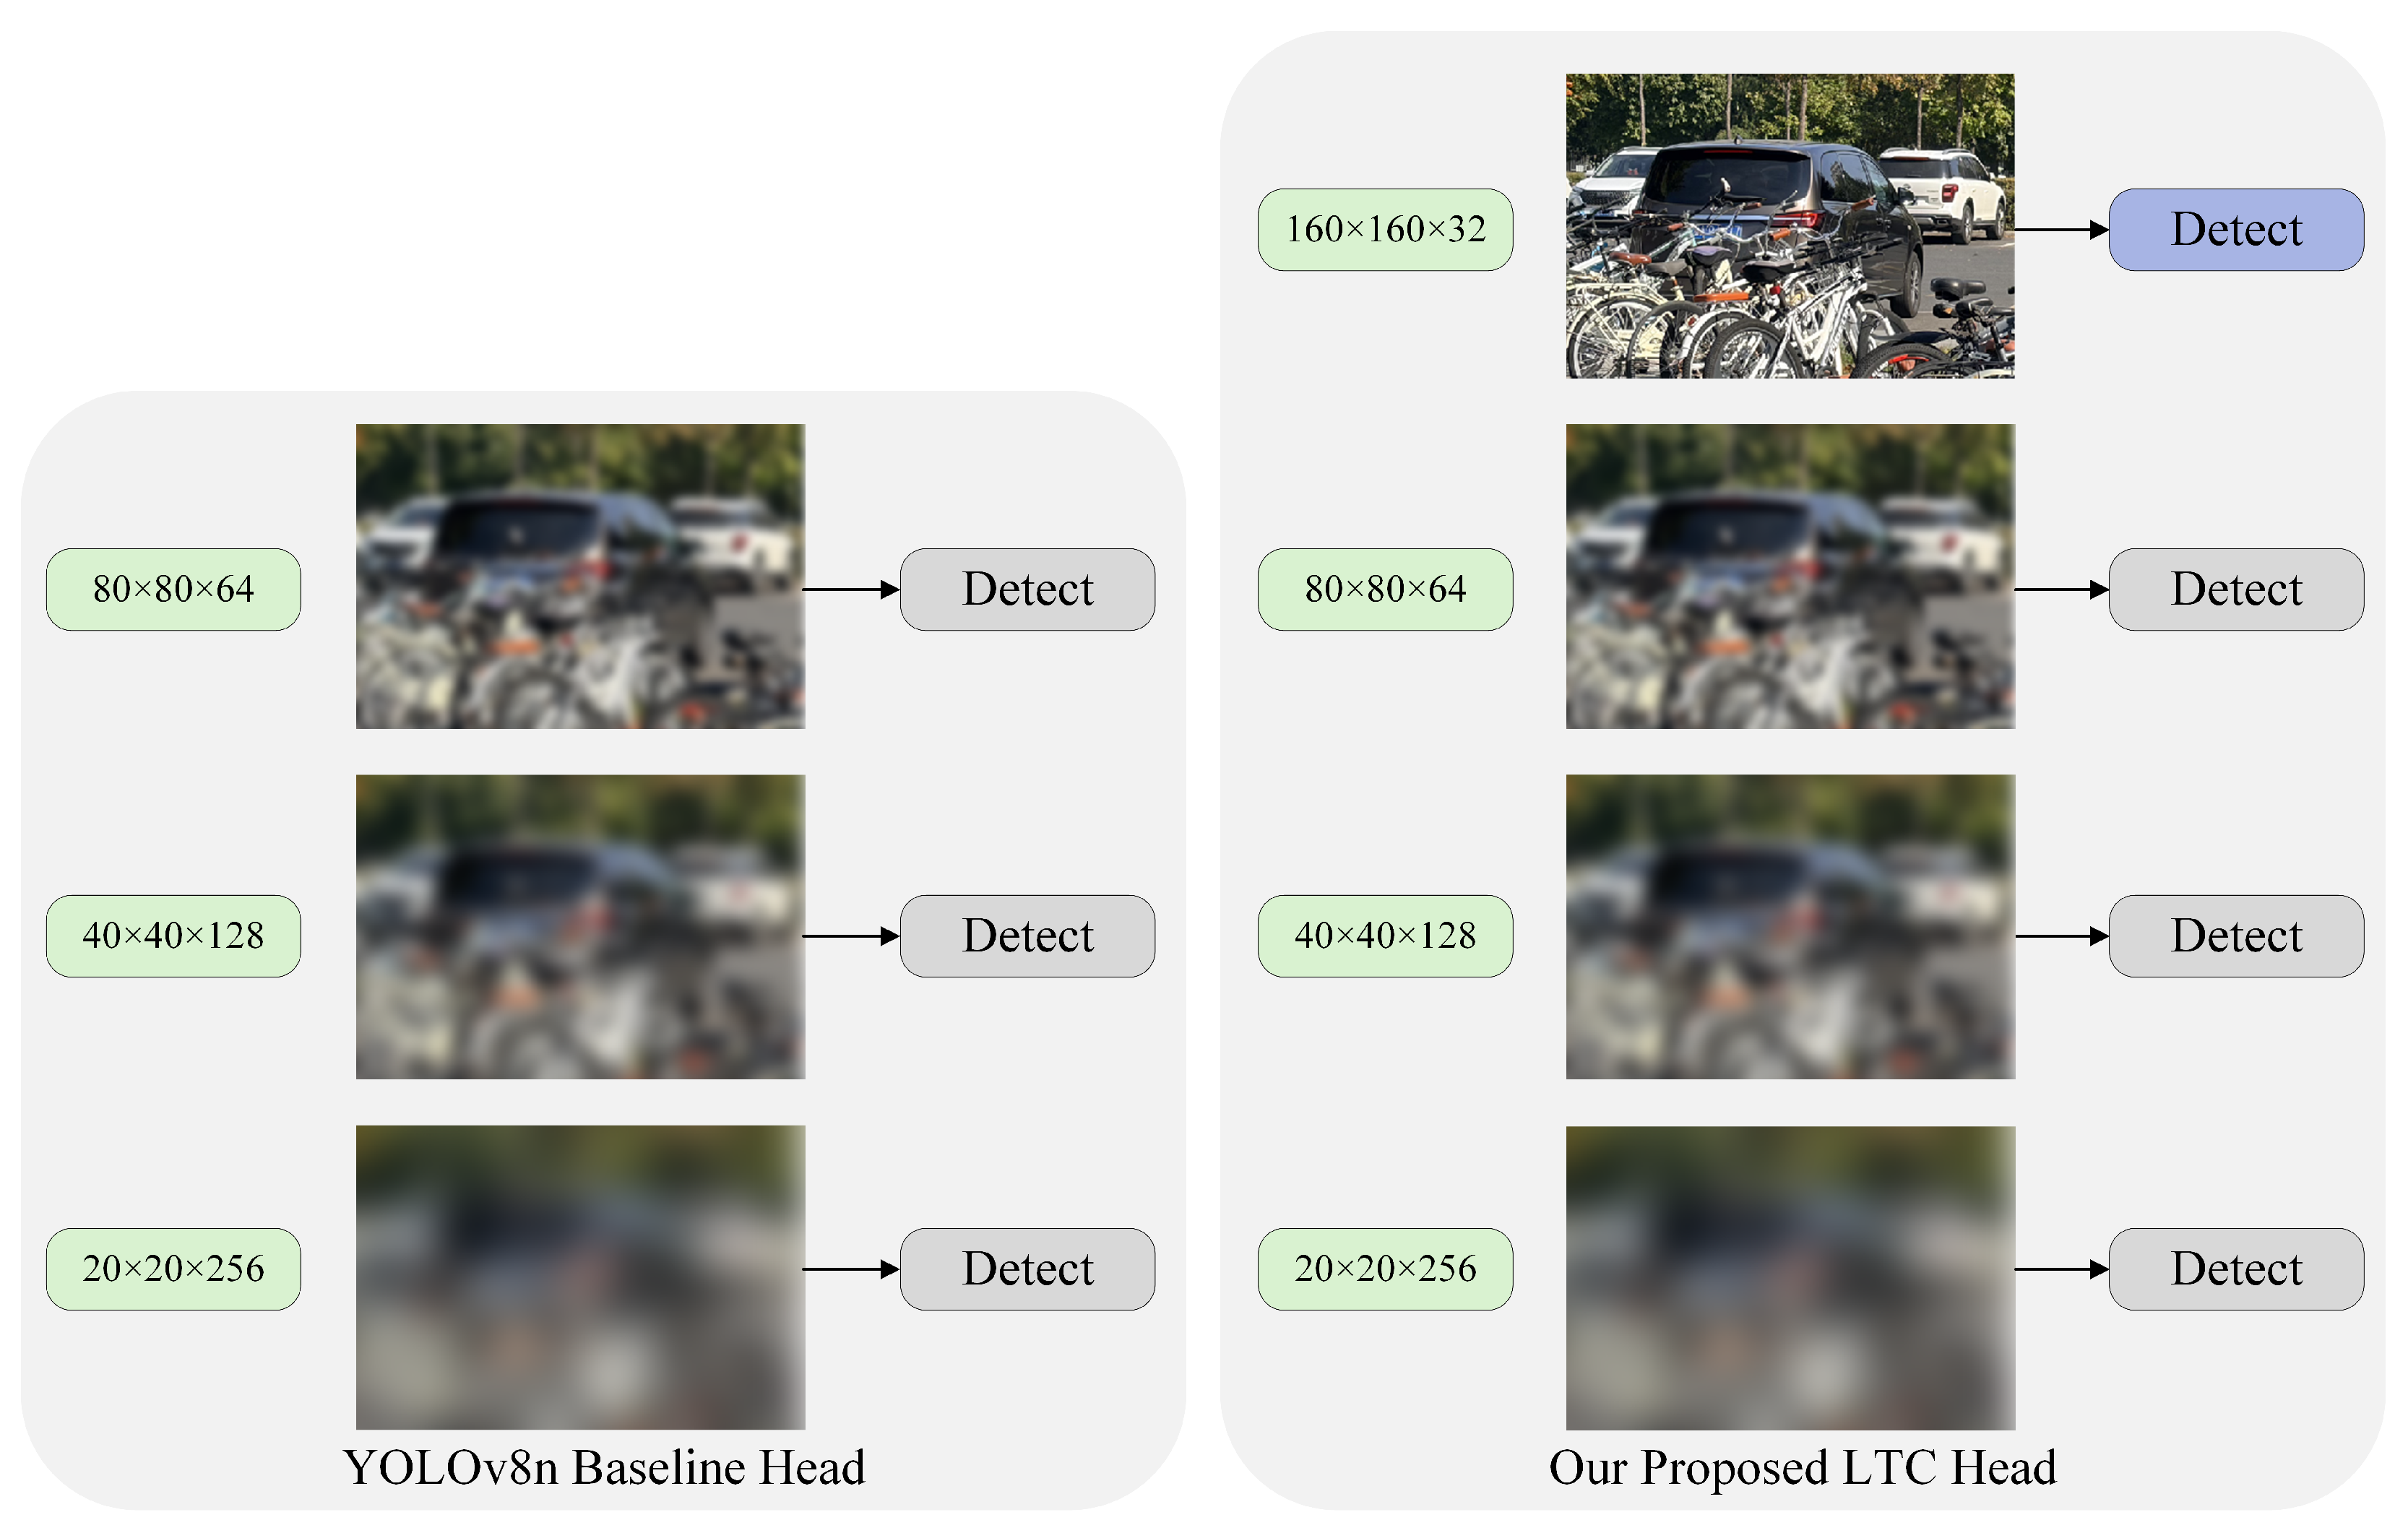
Reliable detection of small objects is critical across multiple domains. Examples include tiny targets in remote sensing images, as well as distant vehicles and traffic lights in ground-level views. These objects are susceptible to feature degradation during the successive downsampling operations within the network backbone. To fully leverage the fine-grained features enhanced by EMA and AMS modules and to counteract this information loss, we adapt the network’s detection neck by incorporating a higher-resolution P2 feature layer (160 × 160). Figure 4 provides a visual comparison of the detection heads between the YOLOv8n baseline and the LTC framework. This approach follows the proven practices in established detectors such as FPN and YOLOv5.
While this higher-resolution layer inherently aids in localizing small objects by utilizing shallow features with smaller receptive fields, our primary motivation stems from addressing a critical training instability in modern dynamic label assignment strategies. Dynamic assigners, such as the Task-Aligned Assigner used in YOLOv8, face “cold-start” and “high IoU sensitivity” challenges, particularly with small objects. In the initial training stages, when the model’s predictions are still inaccurate, even a minor offset in a predicted bounding box for a small target can cause its Intersection over Union (IoU) to drop precipitously below the matching threshold. Consequently, the assigner fails to find sufficient positive samples, leading to unstable gradients and inefficient convergence.
The introduction of the P2 detection head directly mitigates this issue. The denser anchor points and finer-grained features on the 160 × 160 map provide a more robust basis for matching. Even with slight prediction inaccuracies, there is a higher probability that a prediction will achieve sufficient IoU with a ground-truth object. This ensures a stable and high-quality stream of positive samples for the label assigner, especially in the crucial early phases of training. This stabilization accelerates model convergence and leads to superior final detection performance for small targets.
As specified in our network architecture, the P2 feature map is generated by first upsampling the P3 feature layer (80 × 80) from the neck. This upsampled map is then fused via concatenation with the shallow C2 feature layer (160 × 160) from the backbone. The resulting feature map is processed by a final C2f block before being fed into the detection head.
2.3. Experiments

2.3.1. Datasets

In this work, we utilize seven datasets to comprehensively evaluate our model: VisDrone [35], RSOD [36,37], KITTI [38], TT100K_mini [39], SDC_L_mini [40], UA-DETRAC [41], and BDD100K_mini [42]. The key statistics and characteristics of these datasets are summarized in Table 2.
The selection of datasets covers a wide range of challenging real-world conditions. VisDrone offers a unique challenge with its drone-captured aerial imagery, which includes dense scenes and significant object occlusions. We also include the RSOD dataset, a common benchmark for remote sensing object detection, to further evaluate aerial performance. The KITTI dataset provides a standard benchmark for autonomous driving tasks, featuring 8 classes such as ‘Car’ and ‘Pedestrian’. To evaluate performance on traffic sign detection, we use a subset of the TT100K dataset. We also incorporate the SDC_L_mini dataset, a custom subset derived from the Udacity Self Driving Car project and provided via the Roboflow platform. This dataset features real-world driving scenes with annotations for common road objects. In addition, we incorporate the UA-DETRAC dataset for its focus on difficult vehicle detection scenarios and a subset of the large-scale BDD100K dataset, which is renowned for its diversity in weather, time of day, and driving environments. For all large-scale datasets, we created smaller subsets (denoted by “_mini”) to ensure a manageable and balanced experimental setup.
For all experiments, models were trained on the respective train splits. We used the validation splits for hyperparameter tuning and to select the best model checkpoint. The final performance metrics are reported on the official test splits for the VisDrone and TT100K datasets. For all other datasets where a test split was not available or used, we report the performance of the best model on the validation split.

2.3.2. Experimental Setup

To comprehensively evaluate the performance of the LTC framework and the AMS module, we conducted experiments on the seven datasets described previously. We chose the lightweight YOLOv8n as baseline architecture, given the resource constraints of edge devices. The proposed model, LTC, is built upon this baseline by replacing some C2f modules with C2f-AMS blocks, integrating the EMA attention mechanism, and adding a P2 small object detection head.
All experiments were conducted on a workstation with an Intel i9-12900HX CPU, 32GB of RAM, and an NVIDIA GeForce RTX 4080 GPU. The software environment consisted of Python 3.10, PyTorch 2.1.2, and CUDA 12.1.
To ensure a consistent and accurate experimental process, set the training parameters outlined in Table 3.
To validate the effectiveness of our approach, we compare LTC framework with the baseline YOLOv8n and five other state-of-the-art methods for small object detection: YOLOv8-QSD [43], PV-YOLO [44], YOLO-AL [45], YOLOv8-EMSCP, and MobileNetv3_CA-YOLOv8 [46]. For a rigorous evaluation, we designed a tiered comparison strategy. The primary comparison is conducted between the proposed LTC framework and the YOLOv8n baseline. To ensure methodological purity, both of these models were trained from scratch on the target datasets without using any pre-trained weights. This provides a direct, apples-to-apples comparison of the architectural contributions.
Additionally, to showcase the maximum potential of the LTC framework and to facilitate a fair comparison with other state-of-the-art methods that also leverage pre-training, we provide a version of LTC initialized with COCO pre-trained weights, denoted as LTC (pretrain). For the other competing methods, we strictly followed the training protocols from their original publications, faithfully reproducing their respective initialization strategies (i.e., some were trained from scratch, while others used pre-trained weights).
Apart from the initialization method, all models were subsequently trained on the target datasets under identical hyperparameters and experimental settings.

2.3.3. Evaluation Metrics

To prove the effectiveness of LTC framework, we evaluated it on the test sets (or validation sets where test sets were not available) of the seven aforementioned datasets. We use the following standard metrics:
(1) Accuracy Metrics: The primary metric for detection accuracy is the mean Average Precision (mAP), specifically the COCO-style mAP calculated over IoU thresholds from 0.5 to 0.95 (mAP@0.5:0.95). We also report Precision (P) and Recall (R).
Precision (P) is the ratio of true positives ( T P ) to the total number of predicted positives ( T P + F P (false positive)).
P = T P T P + F P
Recall (R) is the ratio of true positives ( T P ) to the total number of actual ground-truth positives ( T P + F N (false negative)).
R = T P T P + F N
(2) Complexity Metrics: To evaluate model efficiency, we measure the total number of learnable Parameters and the computational complexity in terms of F L O P s .
F L O P s (Floating Point Operations) quantify the amount of computation required for a forward pass. For a standard convolutional layer, the F L O P s are approximately twice the number of Multiply-Accumulate operations (MACs). The formula is:
F L O P s = 2 × H o u t × W o u t × C i n × K 2 × C o u t
Here, H o u t and W o u t are the spatial dimensions of the output feature map, C i n and C o u t are the number of input and output channels, and K is the kernel size.

3. Results

3.1. Main Results

To ensure a fair and rigorous comparison, all computational costs (Parameters and GFLOPs) presented in Table 4 were benchmarked using a unified script with a consistent input resolution (640 × 640). For baseline methods lacking official code, we meticulously re-implemented their architectures as described in their respective papers. This standardized evaluation ensures that all comparisons of efficiency and accuracy are conducted on an equal basis.
On the exceptionally challenging VisDrone dataset, characterized by extreme object density and occlusion, our LTC framework (0.363 mAP50) significantly outperforms the YOLOv8n baseline (0.325 mAP50), achieving a relative improvement of 11.7%. While the absolute performance metrics on VisDrone are modest across all methods. This is because the VisDrone dataset not only includes occlusion but also has a vast number of diminutive targets far smaller than typical benchmarks. Still, the substantial relative improvement highlights the effectiveness of our architecture in dense aerial scenarios. This strong performance is mirrored on the RSOD dataset, where the LTC (pretrain) model (0.944 mAP50) also achieves the top performance, closely followed by the from-scratch LTC model (0.926 mAP50, 0.65 mAP50-95). This validates its effectiveness for remote sensing tasks with significant scale and orientation variations.
The framework’s robust generalization to ground-level scenarios is most evident on the TT100K_mini dataset, which is rich in small traffic signs. The LTC (pretrain) model achieves 0.780 mAP50, a remarkable relative improvement of 19.3% over the YOLOv8n baseline (0.654 mAP50). Similarly, LTC achieves the highest mAP50 scores on the KITTI (0.924) and SDC_L_mini (0.816) datasets, confirming its effectiveness on general driving scenes.
To provide a transparent analysis of the framework’s boundaries, we highlight the results on the UA-DETRAC and BDD100K_mini datasets. On the highly diverse BDD100K_mini, the LTC (pretrain) model (0.363 mAP50) still shows a large gain over the baseline (0.288 mAP50), though all models perform poorly, likely due to the mini-subset’s limited sample size. More notably, on the UA-DETRAC dataset, our LTC and LTC (pretrain) models (0.581 and 0.583 mAP50) underperform the YOLOv8-QSD baseline (0.613 mAP50). We attribute this limitation to the nature of UA-DETRAC, which contains low-resolution, compressed video frames with high vehicle density and severe occlusion. Furthermore, the dataset includes images from multiple, distinct viewpoints, and the limited sample size for each view likely impacts model training. We hypothesize that our AMS module’s dynamic calibration mechanism may struggle with the prevalent motion blur and compression artifacts, while the insufficient data from each viewpoint prevents our model from learning adequate features. This limitation warrants future investigation and will be elaborated upon in the Discussion section.
In terms of efficiency, LTC maintains a lightweight parameter count (2.8M) comparable to the YOLOv8n baseline (3.0M). However, the inclusion of the high-resolution P2 head and attention modules results in an increased computational load (12.3 GFLOPs) compared to the baseline (8.1 GFLOPs). We argue this is a necessary trade-off: the framework prioritizes significant accuracy gains, especially for small objects, at the cost of higher computational demand. This design choice makes LTC suitable for applications requiring higher accuracy, and a cost of 12.3 GFLOPs remains a viable range for many edge devices. Nonetheless, this does indicate a limitation for deployment on extremely resource-constrained devices. Potential optimizations for this computational cost will be further explored in the Section 4.
The evaluation results on the standard autonomous driving benchmark, the KITTI dataset, are presented in Table 5. The LTC framework again demonstrates its superior performance, with the LTC version leading the rankings with an mAP50 of 0.924, significantly outperforming the YOLOv8 baseline (0.900) and all other competing methods. This performance advantage is comprehensive across most individual classes. It is particularly noteworthy that the LTC models exhibit the strongest detection capabilities on pedestrian and cyclist, two of the more challenging categories that are of critical importance to autonomous driving safety. This highlights the robustness and reliability of our framework for standard multi-class detection tasks, especially in identifying vulnerable road users with varied shapes.
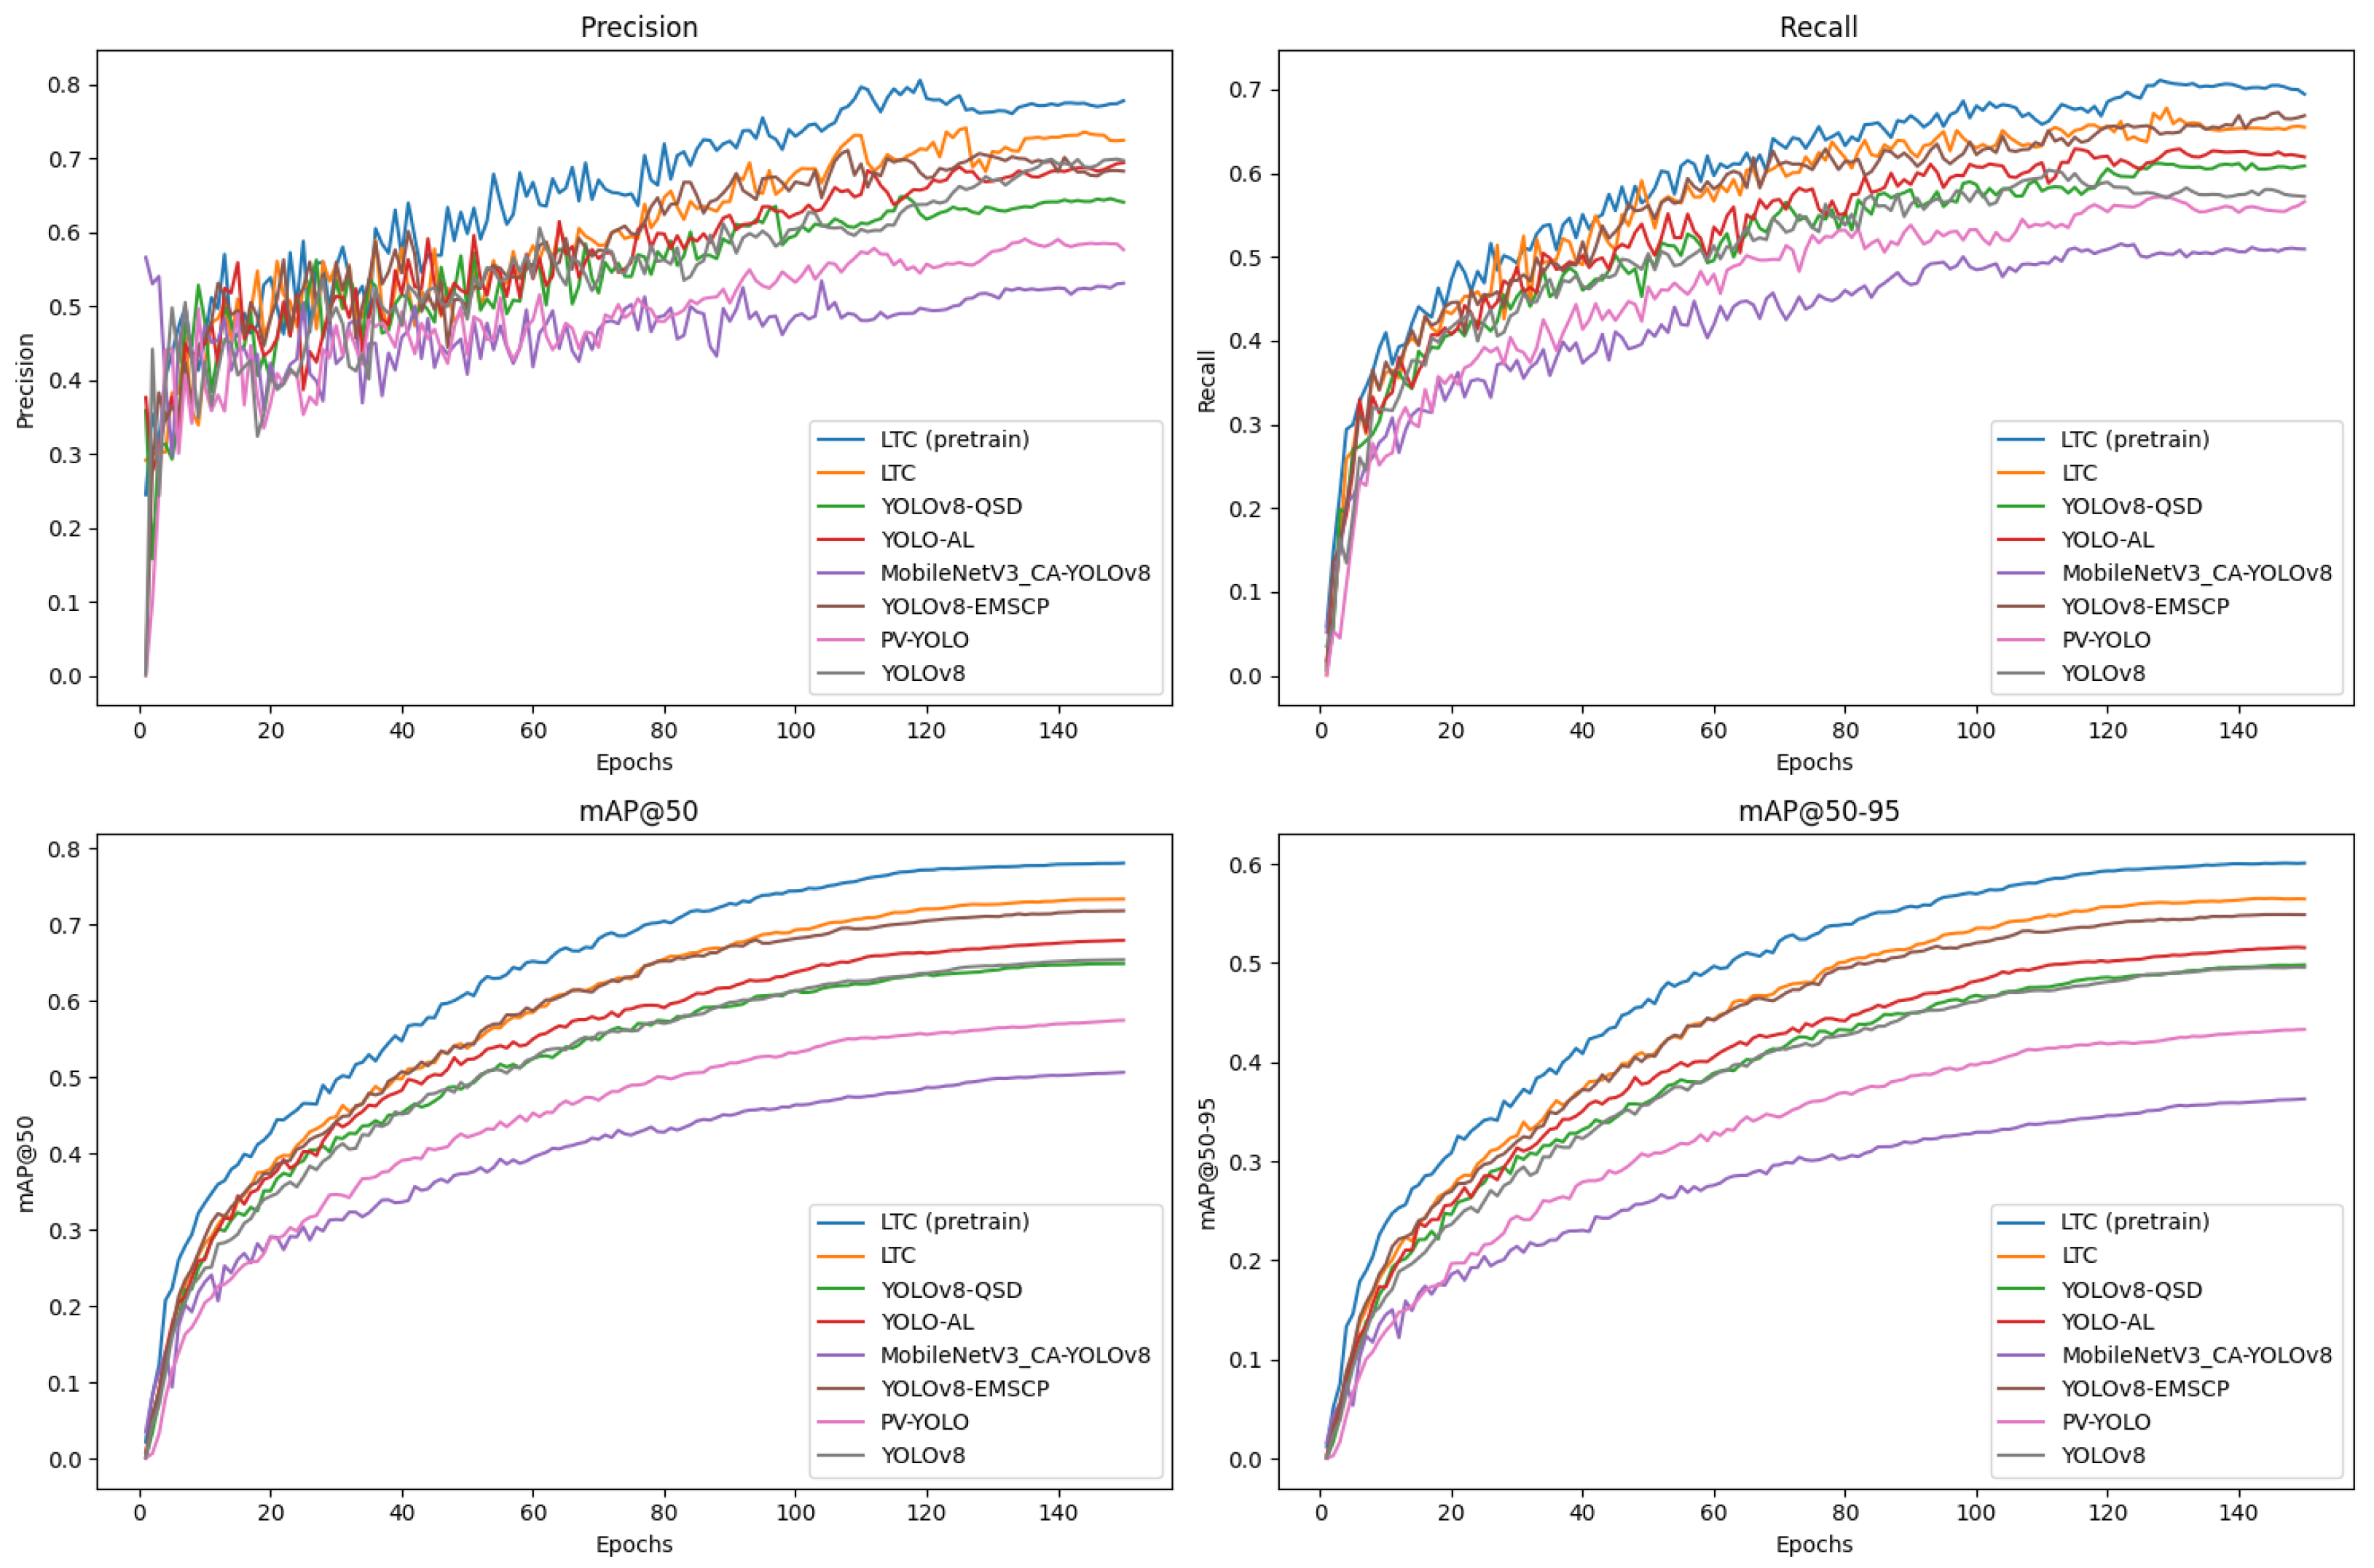
To dynamically illustrate model performance, we plotted the validation convergence curves on the TT100K_mini dataset in Figure 5. The chart clearly visualizes the Precision, Recall, mAP@50 and mAP@50-95 metrics for all models throughout the training process. It is evident that the curves for the LTC and LTC (pretrain) models consistently remain above all baselines, indicating that our approach maintains a performance advantage at all training stages. Furthermore, the LTC models’ convergence curves demonstrate a stable upward trend, ultimately achieving the highest performance level. This confirms that the LTC framework not only achieves superior final accuracy but also possesses efficient and stable training convergence properties.

3.2. Ablation Study

We conducted detailed ablation studies to verify the synergistic effects of our proposed LTC framework in the context of small object detection. Our primary analysis was performed on the challenging VisDrone remote sensing dataset, with further studies on the TT100K_mini and KITTI datasets to validate the generalization of our method. This section aims to systematically evaluate the baseline model, the contributions of each independent component, and their synergistic effects within the LTC framework.
We first trained the baseline model on all three datasets and then added each of the three modules separately to observe their individual performance. The results confirmed the independent effectiveness of all components. The detailed results on VisDrone are presented in Table 6. Compared to the baseline (0.325 mAP50), adding our innovative AMS module (0.344 mAP50), the established EMA module (0.343 mAP50), or the P2 detection head (0.359 mAP50) individually all yielded significant performance improvements.
However, during the validation of the synergistic framework, we discovered that the AMS and EMA modules exhibit functional redundancy on the VisDrone dataset when the P2 detection head is absent. As the data shows, both modules individually achieved 0.344 and 0.343 mAP50, respectively, but when combined, the performance remained at 0.344 mAP50, indicating their gains did not stack. We hypothesize that for the unique scenario of VisDrone with its extremely small and dense targets, the benefits of EMA’s spatial attention were largely “absorbed” by the powerful feature fusion of AMS, causing them to compete for the same optimization space on low-resolution features. Nevertheless, a minor increase in Recall was observed, suggesting a positive effect on identifying a few hard-to-detect targets. Finally, the introduction of the P2 detection head delivers the second significant performance leap, increasing the mAP50 by 5.5% to the final score of 0.363. This result strongly validates the decisive role of preserving high-resolution features in dense, small-object remote sensing scenarios.
Furthermore, to validate the cross-domain generality of our components, we conducted the same ablation studies on two ground-level autonomous driving datasets: TT100K_mini and KITTI. As detailed in Table 7 and Table 8, the results on these datasets exhibit an even more ideal trend. In contrast to the “functional redundancy” observed on VisDrone, no such redundancy was present in these datasets; the ablation studies on these datasets show a clear, steady, and incremental improvement in the mAP50 metric with the addition of each successive component—from AMS, to EMA, and finally to the P2 head. This not only reaffirms the individual effectiveness of each module but also explicitly demonstrates that the EMA module provides a distinct and complementary performance gain in these scenarios, further proving the robustness and general applicability of our LTC framework design.

3.3. Qualitative Results

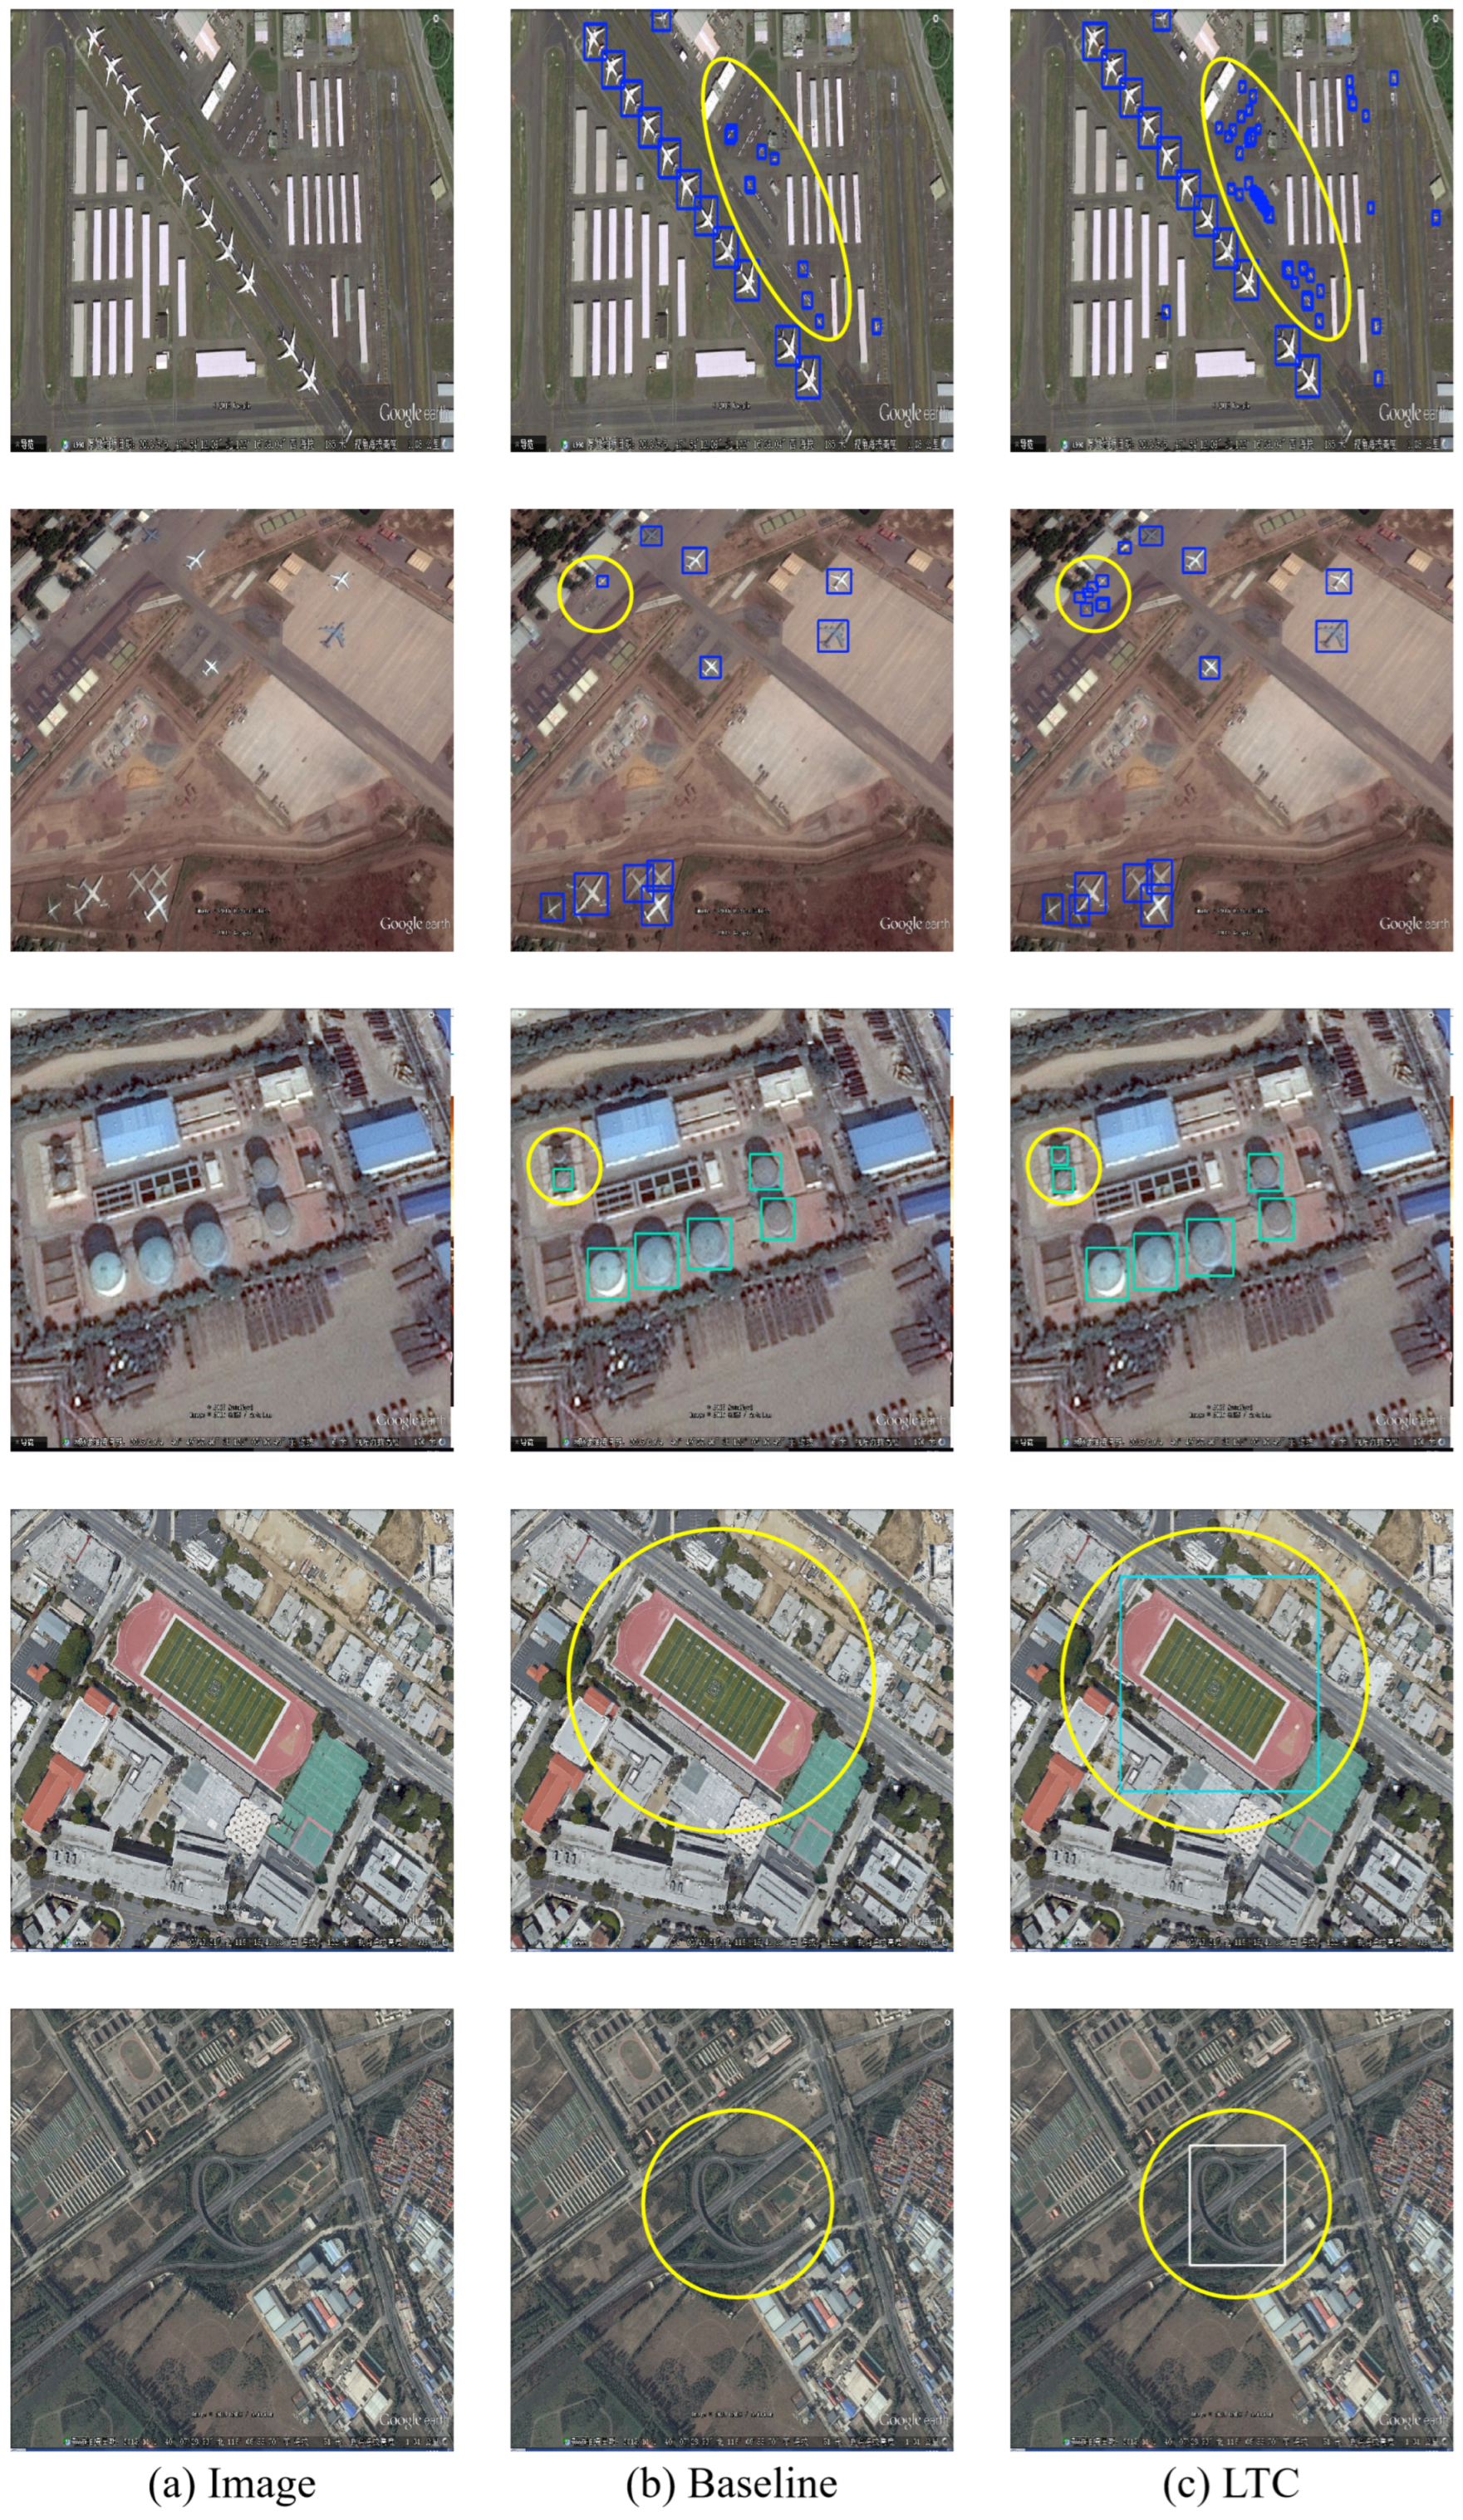
To intuitively visualize our model’s detection efficacy, we first conducted a qualitative comparison on the RSOD remote sensing dataset, as shown in Figure 6. The figure displays (a) the original images, (b) the detection results from the baseline, and (c) the results from our LTC model. It is evident that the baseline struggles with objects from a remote sensing perspective, exhibiting significant false positives (incorrect detections) and false negatives (missed detections) for targets like airplanes. Furthermore, the baseline fails to detect other objects, such as overpasses and playgrounds. In contrast, our LTC model demonstrates superior robustness, accurately detecting and localizing these challenging targets.
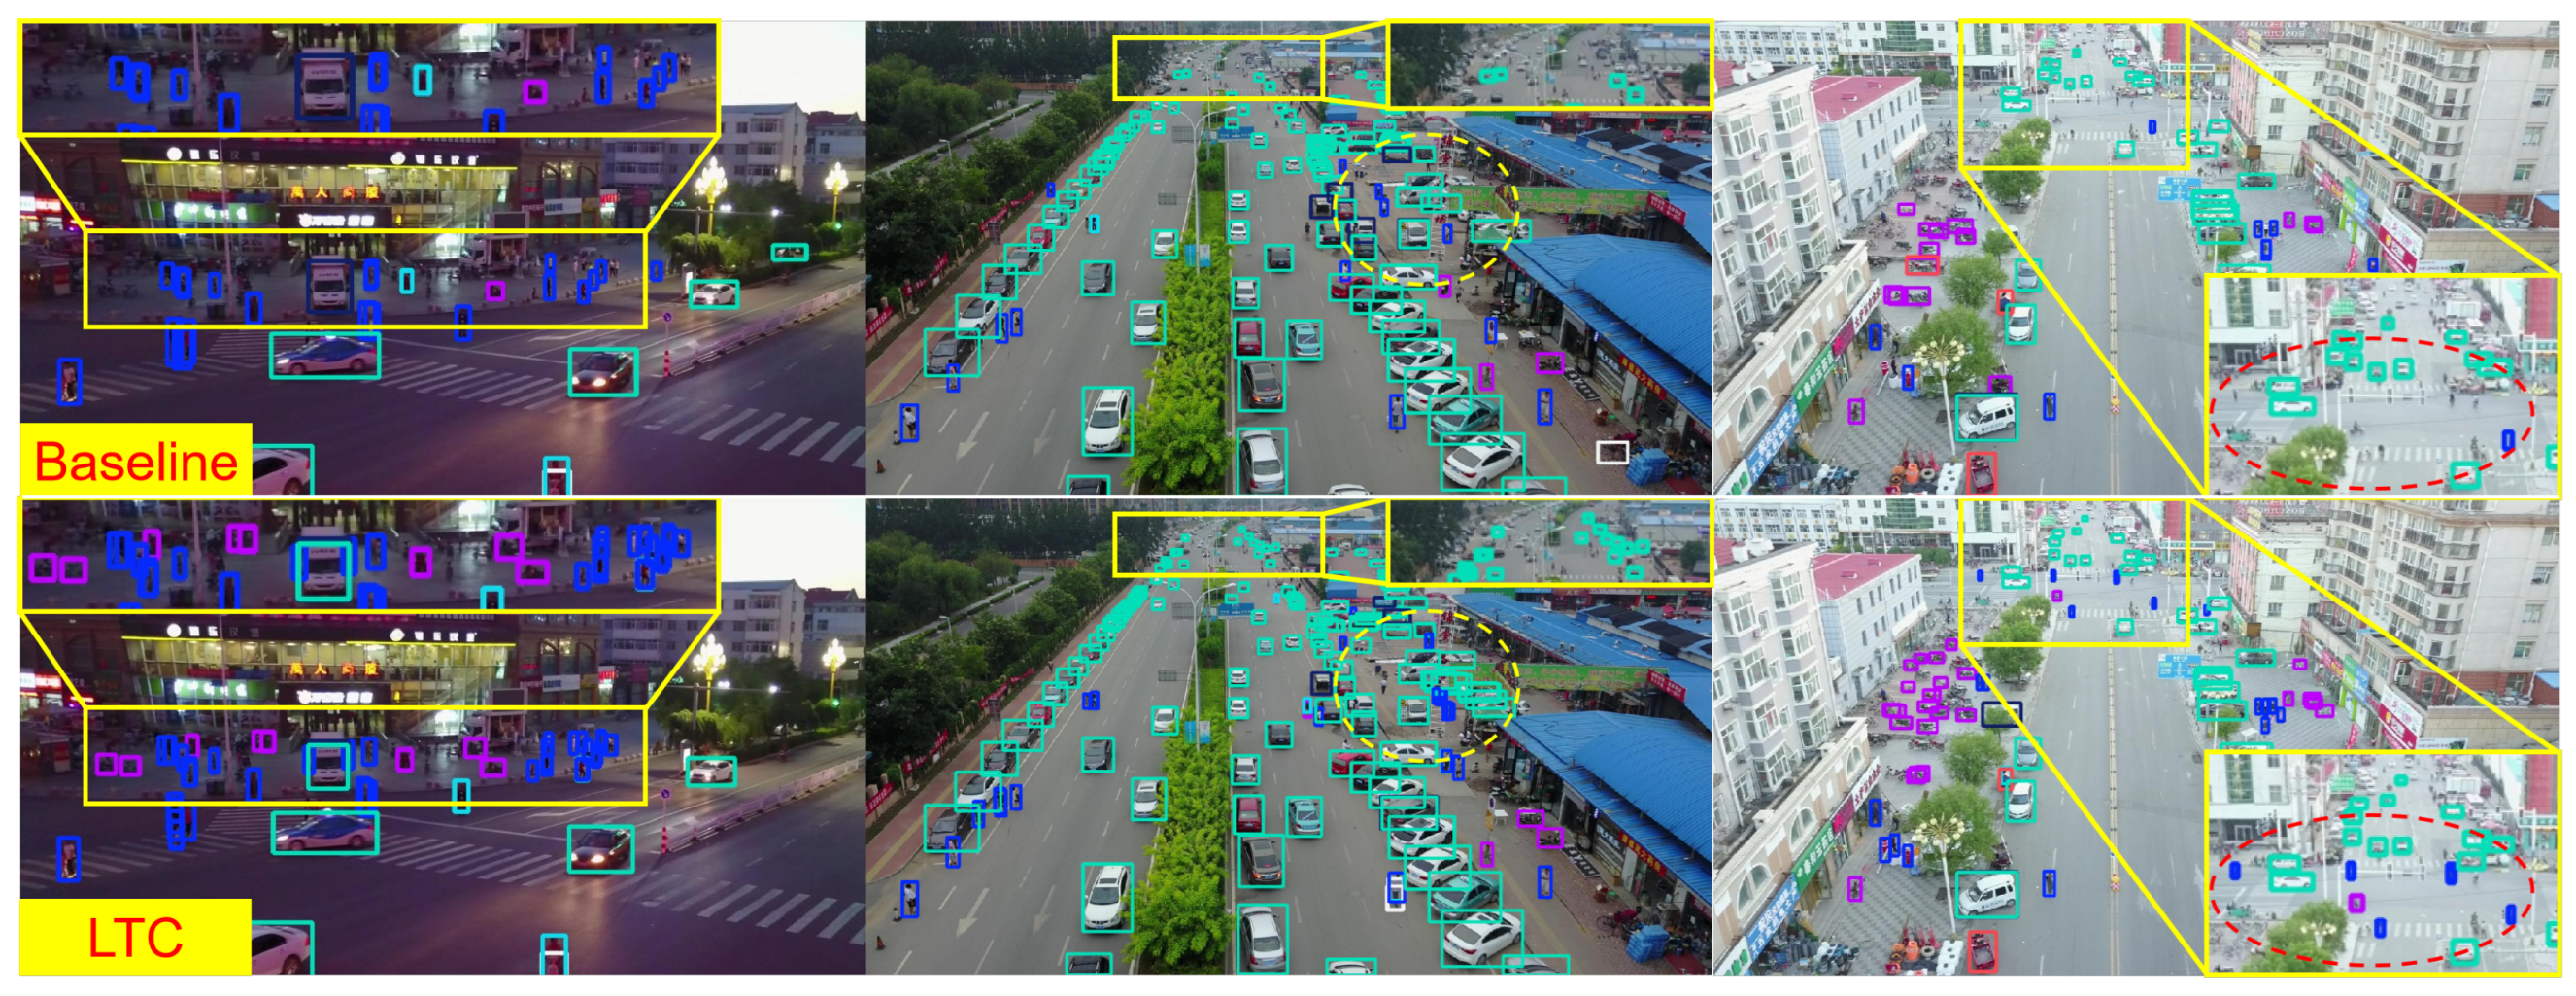
Furthermore, to validate the robustness of the LTC framework in more diverse aerial scenarios, we present an additional qualitative comparison on the VisDrone dataset in Figure 7, covering challenging conditions including nighttime and daytime scenes.
In the nighttime scene on the left, the low-light conditions result in extremely low contrast between targets and the background. The baseline model fails to detect small targets such as pedestrians and motorcycles in this low signal-to-noise environment, leading to missed detections. In contrast, the LTC framework successfully identifies these objects. This suggests that the feature enhancement modules in the model (EMA and AMS) work synergistically to refine the weak feature signals of targets, thereby improving the model’s robustness under adverse lighting conditions.
The daytime comparisons in the middle and right panels highlight LTC’s superior advantage in processing distant, small-scale targets. LTC clearly detects and provides more precise bounding boxes for diminutive objects in the far field that are entirely missed by the baseline. This is primarily attributed to the P2 detection head, which provides the necessary high-resolution feature foundation for the model to perceive and leverage fine-grained details that are otherwise lost in lower-resolution feature maps.
Beyond its strong performance on aerial imagery, we further evaluated the generalization capabilities of the LTC framework across different sensing modalities. To this end, we present additional qualitative comparisons on ground-level autonomous driving scenarios from the TT100K_mini and KITTI datasets in Figure 8 and Figure 9, respectively.
Figure 8 displays the comparison results on the TT100K_mini dataset. As can be observed, all models face challenges when dealing with densely arranged traffic signs. However, the LTC model (far left) successfully detects the highest number of signs, showcasing superior recall, despite also having one missed detection. In contrast, the baseline model and all other competing methods exhibit more significant instances of missed detections. This visually substantiates the advantage of LTC framework in identifying dense, small targets.
Figure 9 further illustrates the model’s performance in complex urban scenes from the KITTI dataset, validating LTC’s comprehensive capabilities in mitigating missed, false, and duplicate detections.
  • In the top-row scene, only LTC model successfully detects the farthest, partially occluded white vehicle at the end of the road. All other models failed to identify this diminutive target, which validates the effectiveness of incorporating the P2 detection head to preserve high-resolution features.
  • In the middle-row motorcycle detection scene, many competing models produce multiple, overlapping, and redundant bounding boxes for the closely parked targets. The LTC model, however, generates a single, precise bounding box for each target. This is credited to the synergistic effect of the AMS and EMA modules, which enhance feature discriminability, leading to cleaner and more reliable predictions after Non-Max Suppression (NMS).
  • In the bottom-row pedestrian detection scene, the situation is more nuanced. While most models identify the pedestrians, models such as the Baseline and QSD generate excessive redundant boxes. The LTC model effectively suppresses these duplicates for a cleaner result. It is noteworthy that the EMSCP model performs best in this specific scenario with the most accurate boxes, which may suggest its multi-scale structure is particularly well-suited for the feature scale of pedestrians at a medium distance. However, when all scenarios are considered, LTC strikes the best overall balance in suppressing missed detections (top row), duplicate detections (middle row), and false positives, demonstrating its comprehensiveness as a robust detector.

4. Discussion

The experimental results presented in this paper strongly validate the effectiveness of the proposed Locate then Calibrate (LTC) framework. Our core hypothesis—that a synergistic strategy of “Locate” (suppressing background noise) and “Calibrate” (re-weighting scale features) is essential for small object detection—was consistently supported. The ablation studies confirmed this synergy: the AMS (“Calibrate”) and P2 head components provided the largest performance gains on the challenging VisDrone dataset, while the EMA (“Locate”) module showed clear, incremental benefits on ground-level datasets like TT100K_mini and KITTI. This suggests that the framework successfully integrates specialized modules (AMS/P2 for dense aerial targets) with general-purpose enhancers (EMA for background suppression), forming a robust and adaptable architecture.
However, this work is not without its limitations, which must be discussed transparently. The first and most evident is the efficiency trade-off. As noted in our results, the LTC framework (12.3 GFLOPs) incurs a higher computational cost than the YOLOv8n baseline (8.1 GFLOPs). This increase is a deliberate and necessary consequence of incorporating the high-resolution P2 detection head, which is computationally expensive but methodologically critical for preserving the fine-grained features of small targets. While we argue that this trade-off is justified by the substantial accuracy gains (e.g., +11.7% on VisDrone and +19.3% on TT100K_mini), it does present a boundary condition: LTC, in its current form, is geared towards applications where accuracy is paramount, rather than those operating under extreme hardware constraints.
The second limitation, identified in our main results, is the framework’s performance on the UA-DETRAC dataset, where it did not surpass the YOLOv8-QSD model. We attribute this to the unique and challenging characteristics of that specific dataset: a combination of low-resolution compressed video, high object density, severe occlusion, and insufficient training samples for each distinct camera viewpoint. We hypothesize that our modules, particularly AMS, are sensitive to such severe compression artifacts and motion blur, failing to calibrate features effectively. This “failure case” is valuable, as it clearly defines the boundaries of our method’s applicability and suggests a sensitivity to extreme data degradation.
Last but not least, regarding the use of both aerial and ground-level datasets, we consider that while their applications differ, they share a common core challenge: the robust detection of small objects. Our primary focus was solving small object detection in remote sensing, and the strong performance on ground-level benchmarks was not the result of an intention to solve disparate fields (remote sensing, driving, traffic signs), but rather to demonstrate that the principles of locating and calibrating small, difficult-to-detect objects are general-purpose. The success in these diverse scenarios validates the robustness of the LTC framework’s core idea.

5. Conclusions

In this paper, we addressed the challenge of small object detection in aerial imagery for remote sensing by proposing a novel framework, termed Locate then Calibrate (LTC). Implemented upon the YOLOv8 baseline, the LTC framework synergistically integrates three key components: a novel C2f-AMS module that uses adaptive multi-scale convolution to dynamically learn feature weights, thereby suppressing background interference; an EMA attention mechanism to enhance the perception of critical features; and an additional high-resolution P2 detection head to preserve the details of diminutive targets.
Extensive experimental results on several public datasets demonstrate that the LTC framework significantly outperforms the baseline and other competing methods, especially on challenging VisDrone and RSOD data. Crucially, the framework achieves these substantial accuracy gains through a deliberate design trade-off: it moderately increases computational GFLOPs (a cost we argue is necessary for high-accuracy perception) while maintaining a lightweight parameter count comparable to the baseline.
Despite these promising results, our work highlights several limitations and suggests avenues for future research.
(1)
Addressing the efficiency trade-off identified in our Discussion, future work should explore model compression, pruning, or quantization to create a more edge-friendly version of LTC.
(2)
To address the identified failure case on UA-DETRAC, further research is needed to improve robustness against severe compression artifacts and motion blur.
(3)
While the P2 head alleviates some issues, it does not fundamentally solve the “IoU sensitivity” problem inherent to dynamic label assignment strategies. In the future, investigating or designing a novel loss function or label assigner that is more robust to the challenges of tiny objects would be a valuable endeavor.
Future work could explore more advanced data augmentation techniques or viewpoint-invariant feature learning—a particularly relevant challenge when bridging aerial and ground-level perspectives—to improve the model’s robustness and stability in varied scenarios.

Author Contributions

Conceptualization, K.L. and N.N.; Data curation, K.L.; Formal analysis, K.L.; Funding acquisition, N.N.; Investigation, K.L.; Methodology, K.L.; Project administration, N.N.; Resources, N.N.; Software, K.L.; Supervision, N.N.; Validation, K.L.; Visualization, K.L.; Writing—original draft, K.L.; Writing—review & editing, Z.Z. and N.N. All authors have read and agreed to the published version of the manuscript.

Funding

This research received no external funding.

Institutional Review Board Statement

Not applicable.

Informed Consent Statement

Not applicable.

Data Availability Statement

The data used in this study are publicly available datasets, namely VisDrone (https://github.com/VisDrone/VisDrone-Dataset (accessed on 18 May 2025)), RSOD (https://github.com/RSIA-LIESMARS-WHU/RSOD-Dataset- (accessed on 5 November 2025)), KITTI (https://www.cvlibs.net/datasets/kitti/ (accessed on 15 May 2025)), BDD100K (https://github.com/bdd100k/bdd100k (accessed on 18 May 2025)), TT100K (https://cg.cs.tsinghua.edu.cn/traffic-sign/ (accessed on 20 July 2025)), and Self Driving Car Dataset (https://public.roboflow.com/object-detection/self-driving-car/3 (accessed on 20 July 2025)).

Acknowledgments

The authors are sincerely grateful to Lin Q., and Zeng J. for the generous personal financial support which enabled the completion of the research presented in this manuscript.

Conflicts of Interest

The authors declare no conflicts of interest.

References

  1. Tang, G.; Ni, J.; Zhao, Y.; Gu, Y.; Cao, W. A survey of object detection for UAVs based on deep learning. Remote Sens. 2023, 16, 149. [Google Scholar] [CrossRef]
  2. Valverde, M.; Moutinho, A.; Zacchi, J.V. A Survey of Deep Learning-Based 3D Object Detection Methods for Autonomous Driving Across Different Sensor Modalities. Sensors 2025, 25, 5264. [Google Scholar] [CrossRef] [PubMed]
  3. Jocher, G.; Chaurasia, A.; Qiu, J. YOLOv8 by Ultralytics. GitHub. 2023. Available online: https://github.com/ultralytics/ultralytics (accessed on 1 May 2025).
  4. Zhang, H.; Li, F.; Liu, S.; Zhang, L.; Su, H.; Zhu, J.; Ni, L.M.; Shum, H.Y. Dino: Detr with improved denoising anchor boxes for end-to-end object detection. arXiv 2022, arXiv:2203.03605. [Google Scholar]
  5. Zhu, L.; Liao, B.; Zhang, Q.; Wang, X.; Liu, W.; Wang, X. Vision mamba: Efficient visual representation learning with bidirectional state space model. arXiv 2024, arXiv:2401.09417. [Google Scholar] [CrossRef]
  6. Liu, Y.; Tian, Y.; Zhao, Y.; Yu, H.; Xie, L.; Wang, Y.; Ye, Q.; Jiao, J.; Liu, Y. Vmamba: Visual state space model. Adv. Neural Inform. Process. Syst. 2024, 37, 103031–103063. [Google Scholar] [CrossRef]
  7. Ouyang, D.; He, S.; Zhang, G.; Luo, M.; Guo, H.; Zhan, J.; Huang, Z. Efficient multi-scale attention module with cross-spatial learning. In Proceedings of the ICASSP 2023—2023 IEEE International Conference on Acoustics, Speech and Signal Processing, Rhodes Island, Greece, 4–10 June 2023; pp. 1–5. [Google Scholar] [CrossRef]
  8. Dosovitskiy, A. An image is worth 16x16 words: Transformers for image recognition at scale. arXiv 2020, arXiv:2010.11929. [Google Scholar]
  9. Vaswani, A.; Shazeer, N.; Parmar, N.; Uszkoreit, J.; Jones, L.; Gomez, A.N.; Kaiser, L.; Polosukhin, I. Attention is all you need. Adv. Neural Inform. Process. Syst. 2017, 30, 1–11. [Google Scholar]
  10. Han, K.; Wang, Y.; Chen, H.; Chen, X.; Guo, J.; Liu, Z.; Tang, Y.; Xiao, A.; Xu, C.; Xu, Y.; et al. A survey on vision transformer. IEEE Trans. Pattern Anal. Mach. Intell. 2022, 45, 87–110. [Google Scholar] [CrossRef]
  11. Carion, N.; Massa, F.; Synnaeve, G.; Usunier, N.; Kirillov, A.; Zagoruyko, S. End-to-end object detection with transformers. In Proceedings of the European Conference on Computer Vision, Glasgow, UK, 23–28 August 2020; Springer: Glasgow, UK, 2020; pp. 213–229. [Google Scholar] [CrossRef]
  12. Gu, A.; Dao, T. Mamba: Linear-Time Sequence Modeling with Selective State Spaces. In Proceedings of the First Conference on Language Modeling, Philadelphia, PA, USA, 7–9 October 2024. [Google Scholar]
  13. He, X.; Cao, K.; Zhang, J.; Yan, K.; Wang, Y.; Li, R.; Xie, C.; Hong, D.; Zhou, M. Pan-mamba: Effective pan-sharpening with state space model. Inf. Fusion 2025, 115, 102779. [Google Scholar] [CrossRef]
  14. Hatamizadeh, A.; Kautz, J. Mambavision: A hybrid mamba-transformer vision backbone. In Proceedings of the 2025 IEEE/CVF Conference on Computer Vision and Pattern Recognition (CVPR), Nashville, TN, USA, 10–17 June 2025; pp. 25261–25270. [Google Scholar] [CrossRef]
  15. Zhao, Y.; Lv, W.; Xu, S.; Wei, J.; Wang, G.; Dang, Q.; Liu, Y.; Chen, J. Detrs beat yolos on real-time object detection. In Proceedings of the 2024 IEEE/CVF Conference on Computer Vision and Pattern Recognition (CVPR), Seattle, WA, USA, 16–22 June 2024; pp. 16965–16974. [Google Scholar] [CrossRef]
  16. Paranjape, J.N.; De Melo, C.; Patel, V.M. A mamba-based siamese network for remote sensing change detection. In Proceedings of the 2025 IEEE/CVF Winter Conference on Applications of Computer Vision (WACV), Tucson, AZ, USA, 26 February–6 March 2025; IEEE: Piscataway, NJ, USA, 2025; pp. 1186–1196. [Google Scholar] [CrossRef]
  17. Chen, H.; Song, J.; Han, C.; Xia, J.; Yokoya, N. ChangeMamba: Remote sensing change detection with spatiotemporal state space model. IEEE Trans. Geosci. Remote Sens. 2024, 62, 4409720. [Google Scholar] [CrossRef]
  18. Zhang, H.; Liu, K.; Gan, Z.; Zhu, G.N. UAV-DETR: Efficient end-to-end object detection for unmanned aerial vehicle imagery. arXiv 2025, arXiv:2501.01855. [Google Scholar]
  19. Redmon, J.; Divvala, S.; Girshick, R.; Farhadi, A. You only look once: Unified, real-time object detection. In Proceedings of the 2016 IEEE Conference on Computer Vision and Pattern Recognition (CVPR), Las Vegas, NV, USA, 27–30 June 2016; pp. 779–788. [Google Scholar] [CrossRef]
  20. Bochkovskiy, A.; Wang, C.Y.; Liao, H.Y.M. Yolov4: Optimal speed and accuracy of object detection. arXiv 2020, arXiv:2004.10934. [Google Scholar] [CrossRef]
  21. Jocher, G. YOLOv5 by Ultralytics. GitHub. 2021. Available online: https://github.com/ultralytics/yolov5 (accessed on 1 May 2025).
  22. Ge, Z.; Liu, S.; Wang, F.; Li, Z.; Sun, J. Yolox: Exceeding yolo series in 2021. arXiv 2021, arXiv:2107.08430. [Google Scholar] [CrossRef]
  23. Liu, S.; Qi, L.; Qin, H.; Shi, J.; Jia, J. Path aggregation network for instance segmentation. In Proceedings of the 2018 IEEE/CVF Conference on Computer Vision and Pattern Recognition, Salt Lake City, UT, USA, 18–23 June 2018; pp. 8759–8768. [Google Scholar] [CrossRef]
  24. He, K.; Zhang, X.; Ren, S.; Sun, J. Spatial pyramid pooling in deep convolutional networks for visual recognition. IEEE Trans. Pattern Anal. Mach. Intell. 2015, 37, 1904–1916. [Google Scholar] [CrossRef]
  25. Khanam, R.; Hussain, M. Yolov11: An overview of the key architectural enhancements. arXiv 2024, arXiv:2410.17725. [Google Scholar] [CrossRef]
  26. Tian, Y.; Ye, Q.; Doermann, D. Yolov12: Attention-centric real-time object detectors. arXiv 2025, arXiv:2502.12524. [Google Scholar]
  27. Lin, T.Y.; Dollár, P.; Girshick, R.; He, K.; Hariharan, B.; Belongie, S. Feature pyramid networks for object detection. In Proceedings of the 2017 IEEE Conference on Computer Vision and Pattern Recognition (CVPR), Honolulu, HI, USA, 21–26 July 2017; pp. 2117–2125. [Google Scholar]
  28. Wang, C.Y.; Bochkovskiy, A.; Liao, H.Y.M. YOLOv7: Trainable bag-of-freebies sets new state-of-the-art for real-time object detectors. In Proceedings of the 2023 IEEE/CVF Conference on Computer Vision and Pattern Recognition (CVPR), Vancouver, BC, Canada, 17–24 June 2023; pp. 7464–7475. [Google Scholar] [CrossRef]
  29. Hu, J.; Shen, L.; Sun, G. Squeeze-and-excitation networks. In Proceedings of the 2018 IEEE/CVF Conference on Computer Vision and Pattern Recognition, Salt Lake City, UT, USA, 18–23 June 2018; pp. 7132–7141. [Google Scholar] [CrossRef]
  30. Woo, S.; Park, J.; Lee, J.Y.; Kweon, I.S. Cbam: Convolutional block attention module. In Proceedings of the European Conference on Computer Vision 2018, Munich, Germany, 8–14 September 2018; pp. 3–19. [Google Scholar] [CrossRef]
  31. Han, K.; Wang, Y.; Tian, Q.; Guo, J.; Xu, C.; Xu, C. Ghostnet: More features from cheap operations. In Proceedings of the 2020 IEEE/CVF Conference on Computer Vision and Pattern Recognition (CVPR), Seattle, WA, USA, 13–19 June 2020; pp. 1580–1589. [Google Scholar] [CrossRef]
  32. Jin, L.; Jie, Z.; Yafei, L.; Zhenyue, Y. Study on traffic object detection based on enhanced YOLOv8s. Mod. Electron. Tech. 2025, 48, 181–186. [Google Scholar] [CrossRef]
  33. Lin, M.; Chen, Q.; Yan, S. Network in network. arXiv 2013, arXiv:1312.4400. [Google Scholar]
  34. Hou, Q.; Zhou, D.; Feng, J. Coordinate attention for efficient mobile network design. In Proceedings of the 2021 IEEE/CVF Conference on Computer Vision and Pattern Recognition (CVPR), Nashville, TN, USA, 20–25 June 2021; pp. 13713–13722. [Google Scholar] [CrossRef]
  35. Zhu, P.; Wen, L.; Bian, X.; Ling, H.; Hu, Q. Vision meets drones: A challenge. arXiv 2018, arXiv:1804.07437. [Google Scholar] [CrossRef]
  36. Long, Y.; Gong, Y.; Xiao, Z.; Liu, Q. Accurate object localization in remote sensing images based on convolutional neural networks. IEEE Trans. Geosci. Remote Sens. 2017, 55, 2486–2498. [Google Scholar] [CrossRef]
  37. Xiao, Z.; Liu, Q.; Tang, G.; Zhai, X. Elliptic Fourier transformation-based histograms of oriented gradients for rotationally invariant object detection in remote-sensing images. Int. J. Remote Sens. 2015, 36, 618–644. [Google Scholar] [CrossRef]
  38. Geiger, A.; Lenz, P.; Urtasun, R. Are we ready for autonomous driving? the kitti vision benchmark suite. In Proceedings of the 2012 IEEE Conference on Computer Vision and Pattern Recognition, Providence, RI, USA, 16–21 June 2012; IEEE: Piscataway, NJ, USA, 2012; pp. 3354–3361. [Google Scholar] [CrossRef]
  39. Zhu, Z.; Liang, D.; Zhang, S.; Huang, X.; Li, B.; Hu, S. Traffic-sign detection and classification in the wild. In Proceedings of the 2016 IEEE Conference on Computer Vision and Pattern Recognition (CVPR), Las Vegas, NV, USA, 27–30 June 2016; pp. 2110–2118. [Google Scholar] [CrossRef]
  40. Roboflow. Udacity Self Driving Car Object Detection Dataset-Fixed-Small. Roboflow. 2022. Available online: https://public.roboflow.com/object-detection/self-driving-car/3 (accessed on 20 July 2025).
  41. Wen, L.; Du, D.; Cai, Z.; Lei, Z.; Chang, M.C.; Qi, H.; Lim, J.; Yang, M.H.; Lyu, S. UA-DETRAC: A new benchmark and protocol for multi-object detection and tracking. Comput. Vis. Image Underst. 2020, 193, 102907. [Google Scholar] [CrossRef]
  42. Yu, F.; Chen, H.; Wang, X.; Xian, W.; Chen, Y.; Liu, F.; Madhavan, V.; Darrell, T. Bdd100k: A diverse driving dataset for heterogeneous multitask learning. In Proceedings of the 2020 IEEE/CVF Conference on Computer Vision and Pattern Recognition (CVPR), Seattle, WA, USA, 13–19 June 2020; pp. 2636–2645. [Google Scholar] [CrossRef]
  43. Wang, H.; Liu, C.; Cai, Y.; Chen, L.; Li, Y. YOLOv8-QSD: An improved small object detection algorithm for autonomous vehicles based on YOLOv8. IEEE Trans. Instrum. Meas. 2024, 73, 2513916. [Google Scholar] [CrossRef]
  44. Liu, Y.; Huang, Z.; Song, Q.; Bai, K. PV-YOLO: A lightweight pedestrian and vehicle detection model based on improved YOLOv8. Digit. Signal Prog. 2025, 156, 104857. [Google Scholar] [CrossRef]
  45. Zhang, M.; Zhang, Z. Research on Vehicle Target Detection Method Based on Improved YOLOv8. Appl. Sci. 2025, 15, 5546. [Google Scholar] [CrossRef]
  46. Li, C.; Zhu, Y.; Zheng, M. A multi-objective dynamic detection model in autonomous driving based on an improved YOLOv8. Alex. Eng. J. 2025, 122, 453–464. [Google Scholar] [CrossRef]
Figure 1. The Overall Architecture of Locate then Calibrate (LTC) framework. The framework is built upon a standard YOLOv8n backbone and neck, and introduces three synergistic enhancements as detailed in the legend. These include the EMA module for spatial localization, an novel AMS module for adaptive scale calibration, and a high-resolution P2 detection head for small object perception. And the colors of the bounding boxes are used to distinguish different object categories.
Remotesensing 17 03750 g001
Figure 2. The detailed architecture of Adaptive Multi-Scale (AMS) module. It consists of two parallel pathways: a parallel multi-scale feature extraction path (top) and an adaptive weight generation path based on global information (bottom). The outputs from these paths are fused via a learned reweighting mechanism to produce the final enhanced features.
Remotesensing 17 03750 g002
Figure 3. The Overall Structure of EMA Mechanism. And the asterisk (∗) symbol in the figure represents the multiplication operation.
Remotesensing 17 03750 g003
Figure 4. Comparison of the detection heads between the YOLOv8n baseline (left) and the LTC framework (right). The LTC framework incorporates an additional high-resolution 160 × 160 P2 detection head to better preserve and leverage the fine-grained features crucial for small object detection.
Remotesensing 17 03750 g004
Figure 5. Validation convergence curves on the TT100K_mini dataset.
Remotesensing 17 03750 g005
Figure 6. Visual Comparison of Detection Results on RSOD Dataset. The colored bounding boxes distinguish various object categories; the yellow circles highlight areas with model discrepancies for detailed analysis.
Remotesensing 17 03750 g006
Figure 7. Visual Comparison of Detection Results on VisDrone Dataset. The colored bounding boxes distinguish various object categories; the yellow boxes and circles highlight areas with model discrepancies for detailed analysis.
Remotesensing 17 03750 g007
Figure 8. Visual Comparison of Detection Results on TT100K_mini Dataset. The colored bounding boxes distinguish various object categories; the yellow boxes highlight areas with model discrepancies for detailed analysis.
Remotesensing 17 03750 g008
Figure 9. Visual Comparison of Detection Results on KITTI Dataset. The colored bounding boxes distinguish various object categories; the yellow boxes and circles highlight areas with model discrepancies for detailed analysis.
Remotesensing 17 03750 g009
Table 1. Computational Cost Comparison: Lightweight (Edge) vs. Heavyweight (SOTA) Models.
ModelParams (M)GFLOPs
RSM-CD27.9742.8
DINO-4scale47279
VMamba-T50271
RT-DETR [R50]42136
MambaBCD-Tiny17.1345.74
UAV-DETR-EV21343
M-CD69.829.58
YOLOv8n38.1
Note: Models are sorted primarily in descending order of GFLOPs, and secondarily by Params (M). And the bold numbers indicate the lowest resource consumption in each column.
Table 2. Dataset statistics.
DatasetTrainValTestTotalKey Characteristics
VisDrone647154816108629Drone-based aerial views; High density of small objects.
RSOD748148-936Remote Sensing; Significant scale and orientation variation.
KITTI60291452-7481Classic autonomous driving; Urban/highway scenes with occlusion.
TT100K_mini679319499969738Traffic sign detection; Targets are often small and low-resolution.
SDC_L_mini6400600-7000General road driving images; Complex urban and highway environments.
UA-DETRAC86392231-10,870Traffic surveillance; High vehicle density and severe occlusion.
BDD100K_mini33321258-4590Large-scale diverse driving; Wide range of weather and time-of-day.
Note: The hyphen (-) indicates that an official test split is unavailable or was not used for this dataset.
Table 3. Training parameters.
ParameterConfiguration
size640
epoch150
batch size8
optimizerSGD
learning rate0.01
mosaic0
Table 4. Comparison with State-of-the-Art Methods on Multiple Datasets.
ModelDatasetPRmAP50mAP50-95ParametersGFLOPs
MobileNetV3_CAVisDrone0.3490.2680.2480.1362.45.8
PV-YOLOVisDrone0.4040.3020.2960.1681.64.7
YOLOv8-QSDVisDrone0.4240.3090.3120.1813.19.3
YOLOv8VisDrone0.4350.3260.3250.18638.1
LTC (pretrain)VisDrone0.4590.3580.360.2112.812.3
LTCVisDrone0.4640.3570.3630.2152.812.3
YOLO-ALVisDrone------
YOLOv8-EMSCPVisDrone------
PV-YOLORSOD0.9040.8510.8870.5871.64.7
YOLOv8RSOD0.8920.8780.8960.63838.1
MobileNetV3_CARSOD0.8820.8490.9030.6262.45.8
YOLO-ALRSOD0.9230.8830.9220.6422.67.5
YOLOv8-QSDRSOD0.8990.9050.9260.6373.19.3
YOLOv8-EMSCPRSOD0.9090.9040.9260.642.812.3
LTCRSOD0.9270.8940.9260.652.812.3
LTC (pretrain)RSOD0.9310.9210.9440.6792.812.3
MobileNetV3_CATTK100K_mini0.5330.5080.5060.3632.45.8
PV-YOLOTTK100K_mini0.5810.5620.5740.4331.64.7
YOLOv8-QSDTTK100K_mini0.6410.6090.6490.4983.19.3
YOLOv8TTK100K_mini0.6990.5710.6540.49638.1
YOLO-ALTTK100K_mini0.6930.6210.6790.5162.67.5
YOLOv8-EMSCPTTK100K_mini0.6840.6640.7180.5492.812.3
LTCTTK100K_mini0.7330.6520.7330.5652.812.3
LTC (pretrain)TTK100K_mini0.7790.6940.780.6012.812.3
PV-YOLOSDC_L_mini0.6380.6720.6910.3951.64.7
MobileNetV3_CASDC_L_mini0.8050.5690.7040.392.45.8
YOLOv8-QSDSDC_L_mini0.6760.710.7330.4263.19.3
YOLOv8SDC_L_mini0.7970.660.7370.43738.1
YOLO-ALSDC_L_mini0.820.7060.7720.4692.67.5
YOLOv8-EMSCPSDC_L_mini0.8810.6470.8040.4872.812.3
LTCSDC_L_mini0.8040.730.8040.4882.812.3
LTC (pretrain)SDC_L_mini0.8140.720.8160.4992.812.3
MobileNetV3_CAKITTI0.8540.740.8380.582.45.8
PV-YOLOKITTI0.8790.7750.8670.6171.64.7
YOLOv8-QSDKITTI0.8920.780.8680.6263.19.3
YOLOv8KITTI0.920.8130.90.66238.1
YOLO-ALKITTI0.9030.8390.9030.6652.67.5
YOLOv8-EMSCPKITTI0.9110.8410.9180.6912.812.3
LTC (pretrain)KITTI0.8990.8530.920.6952.812.3
LTCKITTI0.9010.860.9240.6972.812.3
MobileNetV3_CAUA-DETRAC0.570.4830.50.3432.45.8
YOLO-ALUA-DETRAC0.5980.5380.5640.4072.67.5
YOLOv8-EMSCPUA-DETRAC0.5390.5880.5710.412.812.3
LTCUA-DETRAC0.7060.520.5810.4222.812.3
LTC (pretrain)UA-DETRAC0.620.5840.5830.4172.812.3
YOLOv8UA-DETRAC0.6060.5920.5950.42938.1
PV-YOLOUA-DETRAC0.6350.5870.5970.4181.64.7
YOLOv8-QSDUA-DETRAC0.6010.6160.6130.4463.19.3
MobileNetV3_CABDD100K_mini0.4170.2510.240.1232.45.8
PV-YOLOBDD100K_mini0.3810.2640.2460.1311.64.7
YOLOv8-QSDBDD100K_mini0.4280.2730.2630.1453.19.3
YOLOv8BDD100K_mini0.4860.2720.2880.15938.1
LTCBDD100K_mini0.4620.3290.3310.1772.812.3
YOLOv8-EMSCPBDD100K_mini0.520.3250.3440.1842.812.3
LTC (pretrain)BDD100K_mini0.5060.3480.3630.1982.812.3
YOLO-ALBDD100K_mini------
Note: A dash (-) in the table indicates that the experiment did not run successfully due to significant architectural incompatibilities or hardware limitations. For each dataset block, models are sorted primarily in ascending order of mAP50, and secondarily by mAP50-95. And the bold numbers indicate the best performance in each column.
Table 5. Comparison of Detection Results on the KITTI Dataset.
MethodCarVanTruckTramPedestrianCyclistMiscmAP50
MobileNetV3_CA0.9310.880.9420.9590.6770.7490.7830.846
YOLOv8-QSD0.9440.9040.9440.9640.7230.7950.8050.868
PV-YOLO0.9510.9090.9470.9550.7270.8040.7790.868
YOLOv80.9530.9420.9610.9730.7540.8450.8680.9
YOLO-AL0.9580.9360.9740.9690.7570.8480.8810.903
YOLOv8-EMSCP0.9690.9610.9720.960.7940.880.890.918
LTC (pretrain)0.9670.9550.9720.9570.8110.8730.9050.92
LTC0.970.9550.9750.9690.8070.8920.9010.924
Note: The bold numbers indicate the best performance in each column.
Table 6. Ablation study on the VisDrone dataset.
BaselineAMSEMAP2mAP50PR
0.3250.4350.326
0.3430.4500.342
0.3440.4520.34
0.3590.4620.354
0.3440.4480.341
0.3630.4640.357
Note: The check mark (✓) indicates that the corresponding module or component is included in the experiment of that row. And the bold numbers indicate the best performance in each column.
Table 7. Ablation study on the TT100K_mini dataset.
BaselineAMSEMAP2mAP50PR
0.6540.6990.571
0.6620.6510.613
0.6930.7140.624
0.6950.7090.632
0.7060.7390.628
0.7330.7330.652
Note: The check mark (✓) indicates that the corresponding module or component is included in the experiment of that row. And the bold numbers indicate the best performance in each column.
Table 8. Ablation study on the KITTI dataset.
BaselineAMSEMAP2mAP50PR
0.90.920.813
0.9080.9140.834
0.9080.920.829
0.9170.8970.85
0.9130.9240.839
0.9240.9010.86
Note: The check mark (✓) indicates that the corresponding module or component is included in the experiment of that row. And the bold numbers indicate the best performance in each column.
Disclaimer/Publisher’s Note: The statements, opinions and data contained in all publications are solely those of the individual author(s) and contributor(s) and not of MDPI and/or the editor(s). MDPI and/or the editor(s) disclaim responsibility for any injury to people or property resulting from any ideas, methods, instructions or products referred to in the content.