Article

Surface Velocity and Dynamics of the Southern Patagonian Icefield Using Feature and Speckle Tracking Methods on Sentinel-1 SAR Images During 2019–2020

by
Viviána Jó
1,2,
Tamás Telbisz
1,*,
Ádám Ignéczi
2,3,
Maximillian Van Wyk De Vries
4,5,
Sebastián Ruiz-Pereira
2,6,
László Mari
1,2 and
Balázs Nagy
1,2
1
Department of Physical Geography, Eötvös Loránd University, 1117 Budapest, Hungary
2
PermaChile Network, Globe Foundation, 1142 Budapest, Hungary
3
School of Geographical Sciences, University of Bristol, Bristol BS8 1SS, UK
4
Complex and Multihazard Research Group (CoMHaz), Department of Earth Sciences, University of Cambridge, Cambridge CB2 1BY, UK
5
Complex and Multihazard Research Group (CoMHaz), Department of Geography, University of Cambridge, Cambridge CB2 1BY, UK
6
DIHA, Pontificia Universidad Católica de Chile, Santiago 8320165, Chile
*
Author to whom correspondence should be addressed.
Remote Sens. 2025, 17(22), 3742; https://doi.org/10.3390/rs17223742
Submission received: 14 September 2025 / Revised: 27 October 2025 / Accepted: 7 November 2025 / Published: 18 November 2025
(This article belongs to the Section Environmental Remote Sensing)

Highlights

What are the main findings?
  • The velocity of Southern Patagonian Icefield (SPI) glaciers was examined using feature and speckle tracking methods based on Sentinel-1 SAR images, reveal an unstable and fast changing state of the SPI.
  • Observations support that calving has a massive effect on SPI glacier velocity. On the other hand, topographic parameters have a weaker effect on ice velocity.
What are the implication of the main findings?
  • SPI glaciers have a significant role in water supply, and glacier-related changes also represent a natural hazard. Accelerating changes mean that in the medium term, there will be problems with water supply, and risks will also increase.
  • Andean glaciers, including the SPI, could lose more than 36% of their current mass by 2100. Our study provides an opportunity to better understand the changes and the future of the SPI.

Abstract

With an area of 13,000 km2 and more than 60 outlet glaciers (tidewater or lake-terminating), the Southern Patagonian Icefield (SPI) stores a substantial volume of freshwater, and its accelerating melt contributes to global sea level rise. In addition to monitoring frontal retreat and ice thinning, tracking near-terminus glacier surface velocity can provide key insight into glacier dynamics. Here, we aimed to understand the current state of the SPI and to explore the dynamic restructuring of the glaciers in comparison with previous results. Considering that ice velocity acceleration near termini can be indicative of a drastic ice thinning and calving, during 2019–2020, we investigated the surface velocity of glaciers in the SPI using feature and speckle tracking. We calculated velocity maps (450 in total) from Sentinel-1 SAR images. Velocity ranged from 0 to 6571 myr−1 for the whole study period, taking into account the 846 one square kilometer subsamples. Mean values of the topographic parameters (elevation, slope, aspect) have variable correlation with the mean velocity values, while mean ice thickness does not have a strong correlation with velocity. Nevertheless, mean velocities show association between near-frontal motion acceleration and calving, as observed in tidewater glaciers and four lake-terminating glaciers. Considering along-length changes in the glaciers, it is found that there are glaciers with upward increasing velocities, downward increasing velocities, and with a single velocity peak and multiple velocity peaks. Comparing our measurements with previous studies, we found major dynamic changes in several glaciers. A massive calving event at Pío XI Glacier significantly affected its velocity for months. The slowdown observed at 13–14 km from the terminus of the Jorge Montt Glacier contrasts with all previous studies that showed an acceleration of the glacier in this area. Our observations indicate rapid changes in some of the SPI glaciers, which suggests their unstable state.

1. Introduction

Glaciers are among the best climate indicators on Earth, representing not only the current state but also decades of climate change [1,2]. Changes in glaciers’ presence, extent, volume and velocity reflect changes in the environmental conditions of an area [3]. The study of high mountain areas is extremely important today, as they provide a significant part of the world’s freshwater needs [4]. The freshwater in these areas stored in ice sheets and glaciers plays a significant role in the global freshwater resources of our planet, making the climate-induced decline in their current extent more important to monitor than ever [5]. In South America, knowing the amount of freshwater stored in ice in the Andes high mountain parts is important, as it is used for drinking and agriculture [6,7,8]. The Patagonian Ice Sheet is the largest reservoir of freshwater in South America; thus, monitoring and tracking its condition as closely as possible is essential [9].
The change in the condition of glaciers by the effect of climate change also can be monitored by examining their surface velocity and its pattern [10]. We know that glaciers flow due to the vertical force of gravity, and their motion varies depending on many other properties (related to external and/or internal forces) like meltwater or the sediment they carry [11]. These properties are influenced by environmental parameters such as air temperature, humidity and precipitation [12]. By knowing the velocity of the ice, we have the opportunity to identify rapid ice discharge areas [13]. By understanding the recent changes in the velocity of glaciers, we can also examine the change in the mass balance of an ice sheet, which is partly influenced by the flow velocity [14,15]. However, the movement of glaciers is highly variable in space and time, and sudden changes in movement, also known as surge processes, can cause further variations in their velocity. These variations are also responses of glaciers to climate change, and by monitoring them, we can detect major changes and threats in each region [10]. In addition, it is important to mention the seasonal variation in the velocity of glaciers, which in some cases is significant, while in others, it does not cause significant changes in their annual movement [13].
The surface velocity of glaciers can be studied using both field surveys and remote sensing methods. Although classical field measurements can also provide accurate information for measuring velocity, remote sensing has made it possible to study the movement of these forms over a large scale of space and time [16]. Tracking methods (feature or speckle tracking) can be used to detect the motion on the Earth’s surface, such as glacier surface movement [17]. The importance of tracking methods was discovered and applied by researchers decades ago to study the large-scale dynamic changes in surface velocity of glaciers (e.g., [14,16,18,19,20,21,22,23,24]), and it is still useful today (e.g., [25,26,27]). Our study question is how the surface velocity changes in the Southern Patagonian Icefield (SPI) are connected to the overall glacier dynamics and ice-loss processes in the study period 2019–2020.

2. Background

2.1. Study Area

The Northern and Southern Patagonian Icefields together are among the most significant glaciated areas on Earth. They cover a total area of 17,000 km2, making them the second largest glacierized area in the Southern Hemisphere after Antarctica, with a total of 118 glaciers [9]. The area is in the Patagonian Andes and is divided into two well-separated parts [28]. Our study area is the SPI (Figure 1), located between 48° and 52° latitude, with a north–south extent of about 350 km (Figure 1a). The SPI covers an area of 13,000 km2, making it the most significant part of the Patagonian Icefields with 75% of the total area [1,29]. As a result of increasing climate change in the second half of the 20th century, scientists began to investigate the retreat of glaciers in South America (e.g., [30]). Research on the former extent of glaciers in the Patagonian Icefields started even earlier, in the 1950s [31,32,33,34]. The change in the extent of the SPI during the Little Ice Age was studied by [1,35] using records from the area from the 16th century. The first military map, already suitable for calculations, is much later, from 1898 [9]. The first aerial photograph of the area was taken in the summer of 1944–1945, so this recording is the earliest aerial documentation of the area that could be used for calculations [1].

2.1.1. Ice Loss of the SPI

Warming of the troposphere and changes in precipitation are causing significant melting in the area, which is also a major contributor to global sea-level rise, following the Antarctic and Greenland ice sheets [37]. Ice loss in the area has a strong upward trend: while Glasser et al. [38] reported ice loss of −1.7 ± 0.4 km3/yr between the Little Ice Age (1750) and 2010, this value increased to −13.5 ± 0.8 km3/yr between 1975 and 2000 based on [39]. Interestingly, ice melt and climate models still show a positive mass balance for the SPI, with an upward trend between 1975 and 2011 [40]. An important factor in the state of SPI outlet glaciers is that they are almost all sea- (tidewater glaciers) or lake-terminating; thus, frontal retreat, area loss and ice thinning are all important processes, which are thought to be driving forces for ice loss [13,41].

2.1.2. Ice Velocities on the SPI

Several studies (Table 1) have presented the velocity of smaller groups or individual glaciers based on both SAR and optical imagery (e.g., [42,43,44]). Mouginot and Rignot [13] were the first to measure the ice movement of the entire area for a longer period (1994 to 2010) by using the speckle tracking method. This database was later supplemented by Landsat data; thus, the whole time period is from 1984 to 2014, and data are available for 87% (11,300 km2) of the SPI area. The SPI velocity can also be obtained from the global glacier velocity database of [45,46], which shows the situation for 2017–2018, based on feature tracking. This database provides a generalized view of the SPI glacier velocity for this period, but it is not suitable for tracking changes. Mouginot and Rignot [13] observed several systematic changes in velocities, and for some glaciers, even drastic acceleration and deceleration events were detected within their study period. They also recognized interannual variability and velocity doubling of the Pío XI and Jorge Montt glaciers and a significant slowing of O’Higgins. Seasonal fluctuations have been observed for some glaciers, causing, for instance, the Pío XI and Jorge Montt Glaciers to move 400 and 200 myr−1 faster during spring (the October–November proved to be the fastest months of the year). On the other hand, in the case of other large glaciers, such as O’Higgins or Upsala, no seasonal fluctuations have been observed. We also know from [45] that some of the fastest glaciers on Earth are found in the Patagonian Icefield, one of the fastest being the Penguin glacier with a velocity of 12,000 myr−1 near its terminus.
Table 1 contains previous studies that used a tracking method to study the velocity of SPI glaciers for different time periods. It is interesting that Viedma, Upsala, Moreno, and Jorge Montt Glaciers have received far more attention in recent years than any other SPI glacier. Possible reasons for their more thorough study may be that there are previous data available on these glaciers, they are relatively easy to access in the field, they cover a large area, and they are well known from a scientific point of view. We aimed to study the surface velocity of SPI glaciers over a recent time interval, using an established tracking method that has previously measured reliable values in other areas [47]. By applying this method, we aim to investigate the causes behind the dynamic changes in glaciers (if there were any compared to the results of previous research) and to better understand the effects of calving in the case of glaciers ending in fjords and proglacial lakes.
Table 1. Details of previous SPI velocity measurements using tracking methods (name of studied glacier(s), satellite and sensor used for the study, type of applied tracking method, period of the study, and time elapsed between images used in the study).
PublicationExamined Glacier(s)Satellite
and Sensor
MethodDateTime
Intervals
Bown et al., 2019
[40]
Jorge MonttNASA ASTER and Landsat TM, ETM+ and OLI; ESA Sentinel-2Feature
Tracking
1 May 2013–30 April 20177–384 days
Ciappa et al., 2010
[48]
Moreno (only 5 km away from the terminus)COSMO SkyMed X-band SAR Feature
Tracking
2 February–27 December 2009 (except June)8–16 days
Euillades et al., 2016
[49]
ViedmaCOSMO SkyMed STRIPMAPSpeckle
Tracking
12 April 2012–10 January 201316 days
Floricioiu et al., 2008 and 2009
[42,50]
Ameghino
Moreno
Upsala
TerraSAR-X Feature
Tracking
27 December 2007–31 January 2008
January 2008–May 2009
11 days
Lo Vecchio et al., 2018
[51]
ViedmaNASA Landsat 8Feature
Tracking
13 October 2015–3 March 201616–32 days
Moragues et al., 2018
[52]
UpsalaNASA ASTERFeature
Tracking
25 January 2013–4 February 201416–48 days
Mouginot and Rignot (2015)
[13]
SPI (87% of the Icefield)NASA SIR-C and Landsat; ESA ERS-1 and ERS-2; CSA RADARSAT-1; ALOS PALSARSpeckle
Tracking and Feature
Tracking (only for Landsat)
1984–20141–35 days
Muto and Furuya (2013)
[43]
Jorge Montt
Moreno
Occidental
O’Higgins
Pío XI
Upsala
Viedma
Envisat ASARSpeckle
Tracking
2003–201135 days
Rivera et al., 2012
[9]
Jorge MonttTerrestrial cameras (CANON EOS Rebel xti 400D 10.1; NASA ASTERFeature
Tracking
With cameras: 8 February 2010–15 January 2011; With satellite images: 16–25 February 20104 photos/day; 9 days (with satellite images)
Riveros et al., 2013
[53]
ViedmaCOSMO SkyMed X-band SARSpeckle
Tracking
28 April–18 June 20121–16 days
Rott et al., 1998
[54]
MorenoNASA SIR-CSpeckle
Tracking
7–10 October 19941–2 days
Sakakibara and Sugiyama (2014)
[44]
SPI (28 glaciers, 44% of the Icefield)NASA Landsat 4 and TM and Landsat 7 ETM+Feature
Tracking
1984–201116–192 days
Sakakibara et al., 2013
[55]
Upsala (only in 4 squares)Landsat 7 ETM+Feature
Tracking
7 May 2001–3 May 201197–272 days
Skvarca et al., 2003
[56]
UpsalaLandsat 7 ETM+Feature
Tracking
27 October 2000–14 October 200132–353 days

2.2. The Effect of Calving on Ice Velocity

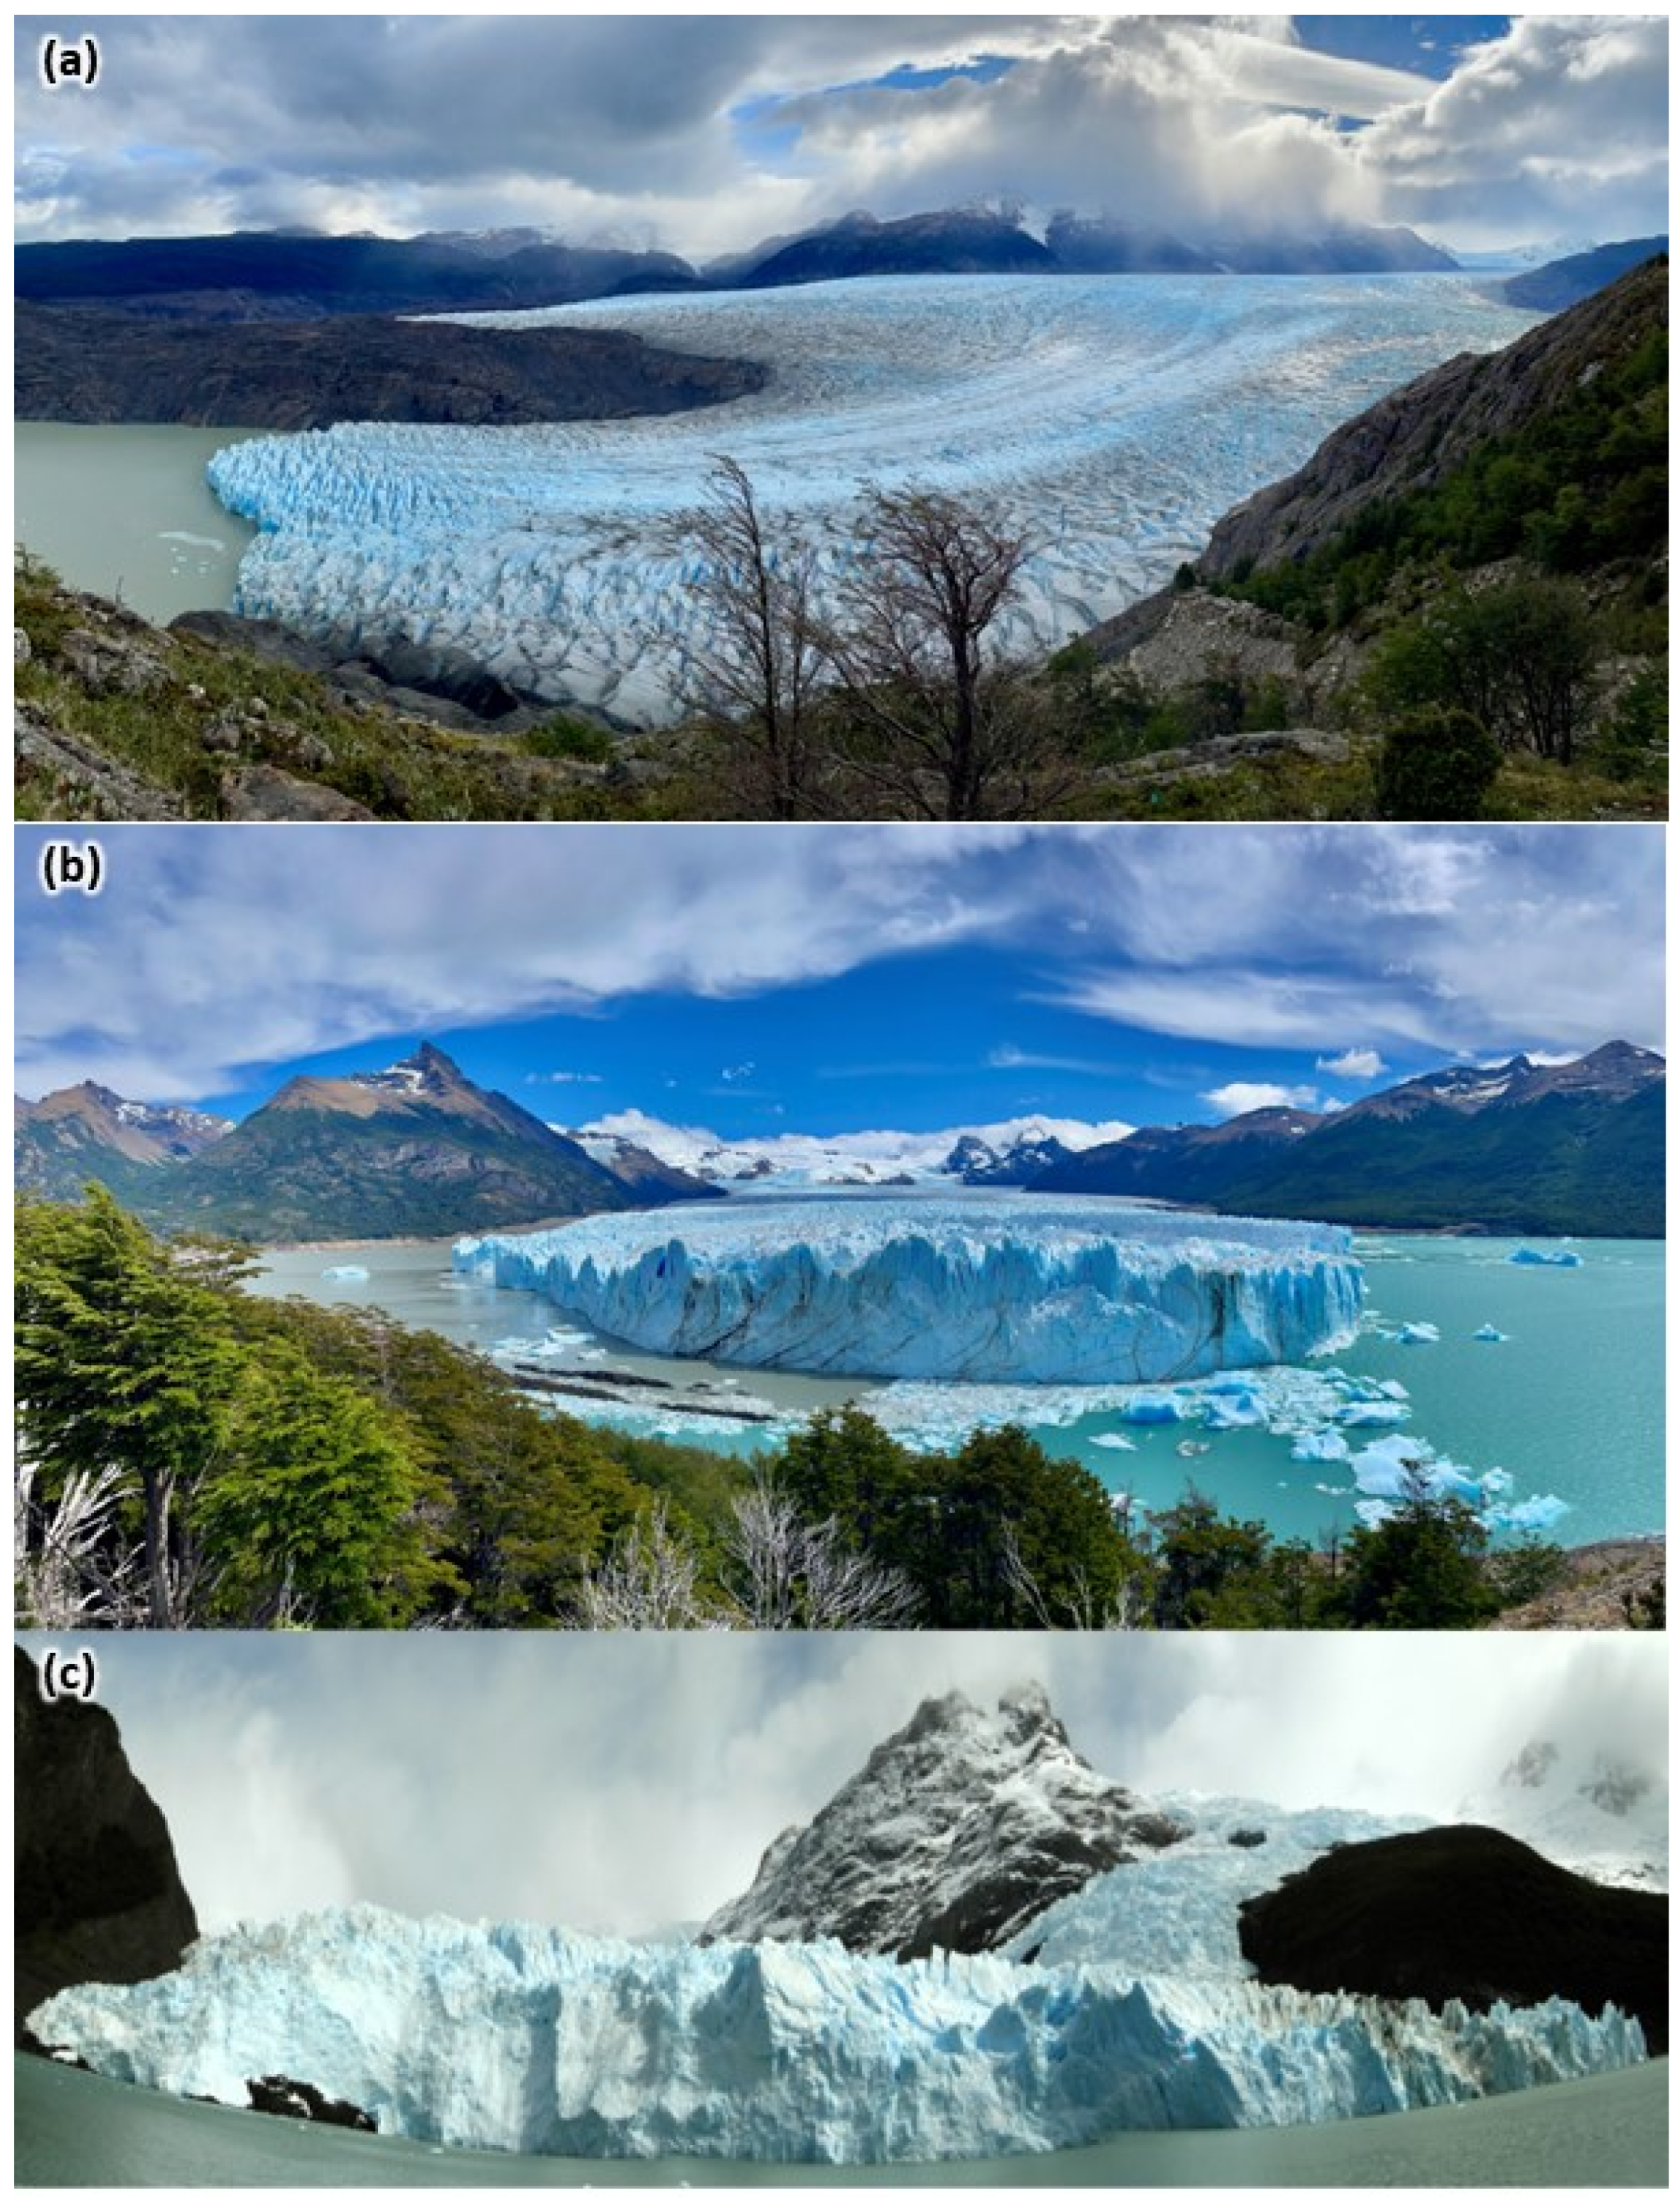
The glaciers of the SPI with significant ice mass end in proglacial lakes (Figure 2) or fjords, so in both cases, it is important to consider the presence and role of water in the movement of the glacier terminus. At the termini of glaciers, submarine melting and calving processes have an effect, during which the loss of resistive stress causes the ice to accelerate, leaving its stable state [57]. In the case of tidewater glaciers reaching the sea in fjords, however, the shape of the fjord also influences the velocity and stability, which, depending on its shape, can either accelerate or stabilize the retreat of the glacier [58]. Last but not least, we must also consider the Tidewater Glacier Cycle—TGC [59]. Some of the SPI glaciers are in different phases [60] of the TGC (advance or retreat), which are not affected by short-term climate parameters [61]. Based on all this, it is not surprising that the retreat of the SPI and the thinning of the ice vary in extent among the individual glaciers [62], and our studies also aim to understand these differences.

2.3. Future Use of Meltwater and Related Natural Hazards in the Patagonian Icefield

Future use of meltwater from the Patagonian Icefield represents both an opportunity and a risk within the context of accelerating glacier loss. Studies show that glaciers outside the major ice sheets lost mass at a rate of 267 ± 16 Gt yr−1 during 2000–2019, with an acceleration of 48 ± 16 Gt yr−1 per decade [63]. In Patagonia, glacier area losses have intensified since the Little Ice Age, with reductions of up to 15 km2 yr−1 on the eastern side of the Southern Patagonian Icefield and more than 4 km2 yr−1 on the west [64]. While this accelerated meltwater release can temporarily ease water scarcity and support hydropower and irrigation, model projections indicate this benefit will decline as glacier storage diminishes through the century [65]. Under high-emission scenarios (RCP8.5), Andean glaciers, including Patagonia, could lose more than 36% of their current mass by 2100, increasing risks of floods, landslides, and long-term water scarcity [65], hence demanding integrated governance of water resources. However, Chile faces major gaps in climate data infrastructure and institutional coordination, which limit the ability to anticipate supply–demand imbalances and design adaptive strategies [66]. For instance, creating a national inventory of high-value climate and hydrological data with standardized publication protocols and linking these datasets to planning instruments for water allocation and risk management should prevent maladaptation as temporary runoff abundance gives way to chronic scarcity [66]. Nevertheless, the southern Andes in Chile and Argentina represent only low to middle basin physical risks according to [67].

3. Materials and Methods

3.1. Feature and Speckle Tracking

In this study, we used the method and code developed by [47] to determine the surface velocity of glaciers in the Southern Patagonian Icefield. This algorithm estimates glacier velocities using feature and speckle tracking of Sentinel 1a and 1b Interferometric Wide Swath mode Single-Look Complex Synthetic Aperture Radar amplitude images. In order to ensure significant displacements while avoiding decorrelation, repeat image pairs 12 days apart were collected between 8 July 2019 and 10 November 2020. Images pairs were co-located and transformed into generic format in GMTSAR. Image brightness variations with wavelength greater than 1 km were removed by a Butterworth high-pass spatial-frequency filter. Images were split into many image patches. These patches between repeat-pass image pairs were cross-correlated in MATLAB PIVSuite to estimate the displacement of visible features, from which velocity can be calculated. A correlation signal-to-noise ratio threshold—set at 5.8—was used for filtering [68], along with a threshold strain filter, a kernel density filter, and a Visible Structured Noise Filter [47]. Filtered velocity was transformed from radar to map coordinates using the Advanced Spaceborne Thermal Emission and Reflection Radiometer Global Digital Elevation Model. We measured the velocities on stationary rock surfaces on the velocity maps obtained at several times and locations in order to verify our results.
Regarding the validity of the measurements, the study of [9] can be mentioned, which compared the velocity of the Jorge Montt glacier found within the region using both satellite-based and ground-based camera measurements. Their conclusion was that there is a generally good agreement between the results obtained with the different methods; thus, the satellite-based measurements are robust enough for mapping velocities with acceptable accuracy.
A total of 450 image pairs were processed for the study area. Several image pairs covered the same time but different parts of the SPI (due to different satellite images along different swaths), resulting in a total of 112 dates and times for the 418-day study period. The 112 dates are not equally spaced, sometimes shorter, sometimes longer, due to the overlapping orbits of the satellites. The intervals between the middle days of the image pairs vary between 2 and 10 days. Measurements were unsuccessful if the method failed to obtain velocity. There could be several reasons for this, e.g., the movement was too slow to detect (the method we used can detect velocity of at least 8 myr−1) or there were too many changes between the compared images, making it difficult to find trackable points in the two images.

3.2. Sample Velocity Maps

For each glacier, the velocity was measured along the flowline from the glacier terminus to the accumulation area. In total, 846 sample areas of 1 × 1 km2 were selected on 64 glaciers (Figure 1c). Glacier outlines and names were determined from the Randolph Glacier Inventory version 6.0 database [69]. If the name of the glacier was missing, the names in the “local_id” column were used. However, the outlines were not used in specific calculations, but only to help separate the glaciers from each other and to estimate their approximate area (Table 2). Sample areas were assigned an alphanumeric ID, consisting of the abbreviation of the glacier name and a serial number. In all cases, the numbers increase from the glacier front towards the accumulation area (so that as the number increases, the altitude and distance from the terminus increases) and start with 1 for each glacier. The number of sample areas on each glacier varies with its extent, mostly its length. More areas were sampled for larger and longer glaciers and fewer for smaller and shorter ones. The number of sample areas varies between 3 (e.g., Snowy Glacier) and 49 (Upsala Glacier). The 450 maps showing average velocity values for the sample areas were obtained using MATLAB R2023a.

3.3. SRTM Digital Terrain Model Analysis and Ice Thickness Data

We used the freely available 30 m resolution SRTM topography model [36] to analyse the topography of the area (Figure 1b). The slope and aspect for the 1 × 1 km2 sample areas were determined in ArcGIS 10 software with “Slope” and “Aspect” tools. Thereafter, we used the “Zonal Statistics” and “Raster Calculator” tools to calculate the mean elevation and mean slope values for the sample areas. Mean aspect was calculated using vector summation. We also used ice thickness data from [46,70], from which we calculated mean ice thickness for the sample areas. We compared the mean values of the topography parameters (elevation, slope, aspect) and ice thickness with the averaged velocity values for the whole study period for each sample area by calculating the correlation coefficients to see if there was a correlation between topography, ice thickness and velocity.

3.4. Heatmaps

To better interpret the velocity data obtained and to detect accelerating velocity at the termini (to reveal possible calving processes), heatmaps were generated for all glacier sample areas for the whole study period using MATLAB R2023a. The plots show the sample area IDs on the vertical axis and the study periods on the horizontal axis. The colour scale on the right of the plots ([71]; batlow colour scale) represents the velocity for each glacier, with a minimum to maximum value in myr−1. The 0 values represent No Data values.

4. Results

4.1. Coverage of Velocity Measurement

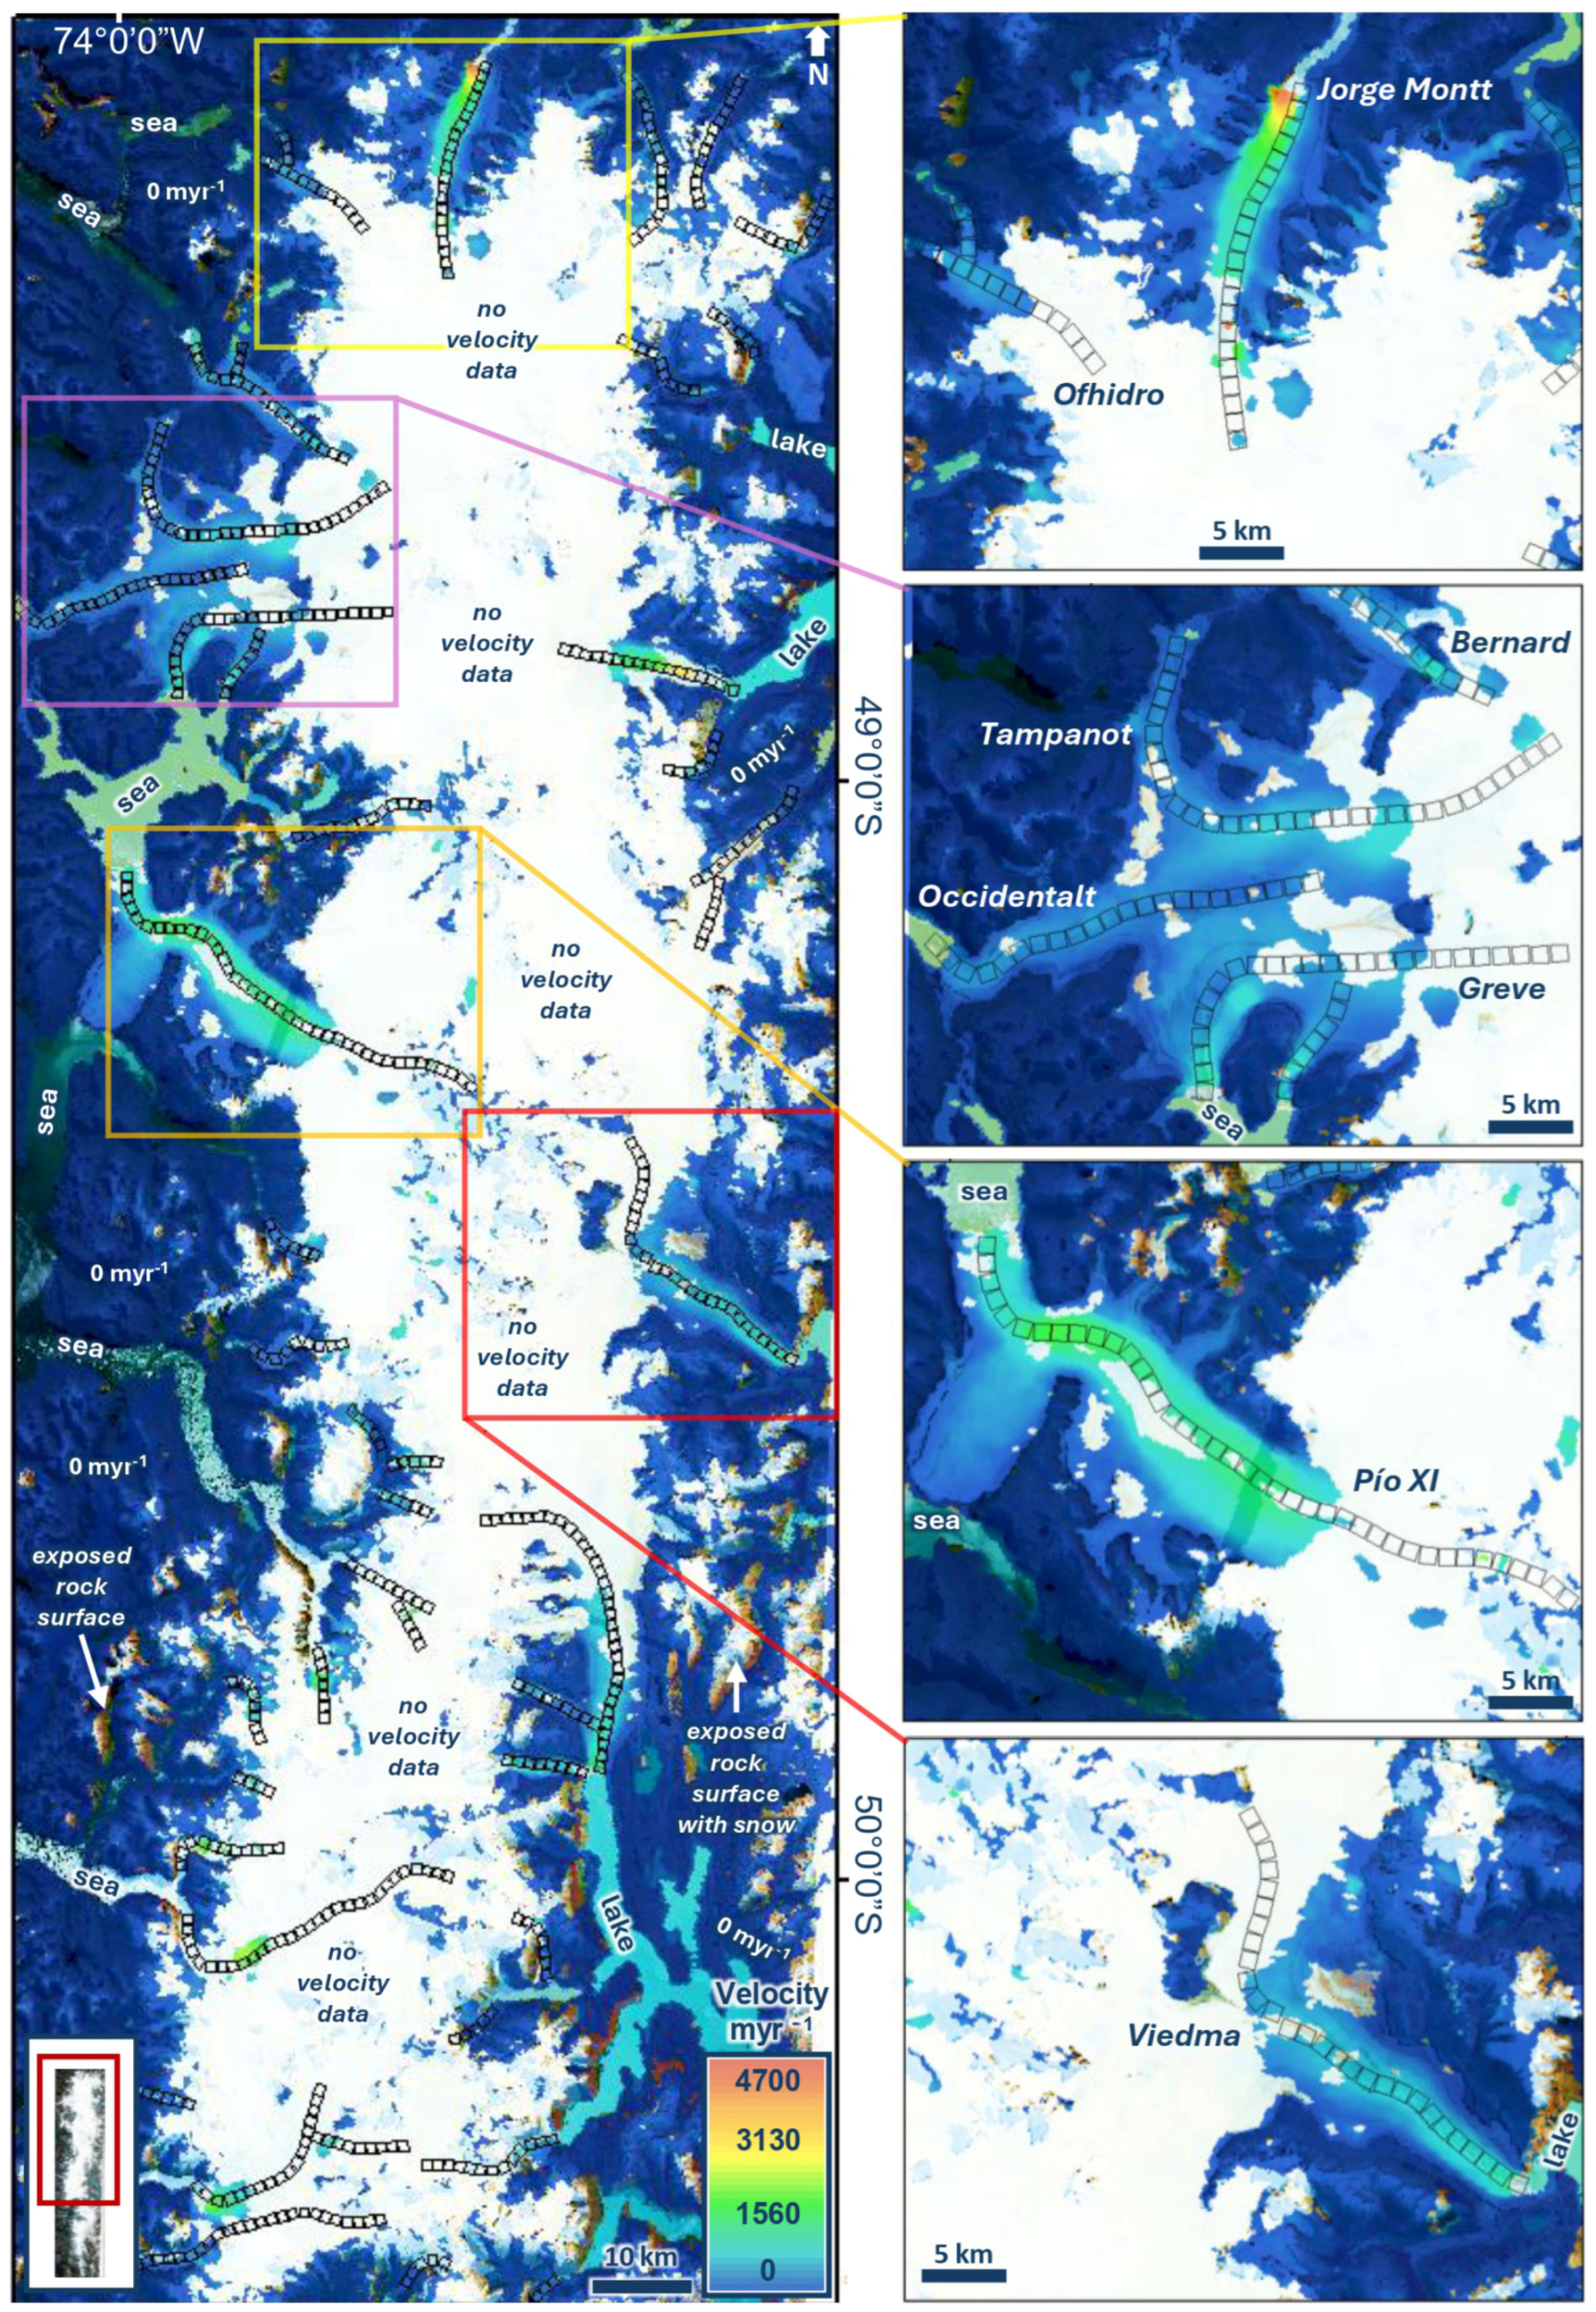
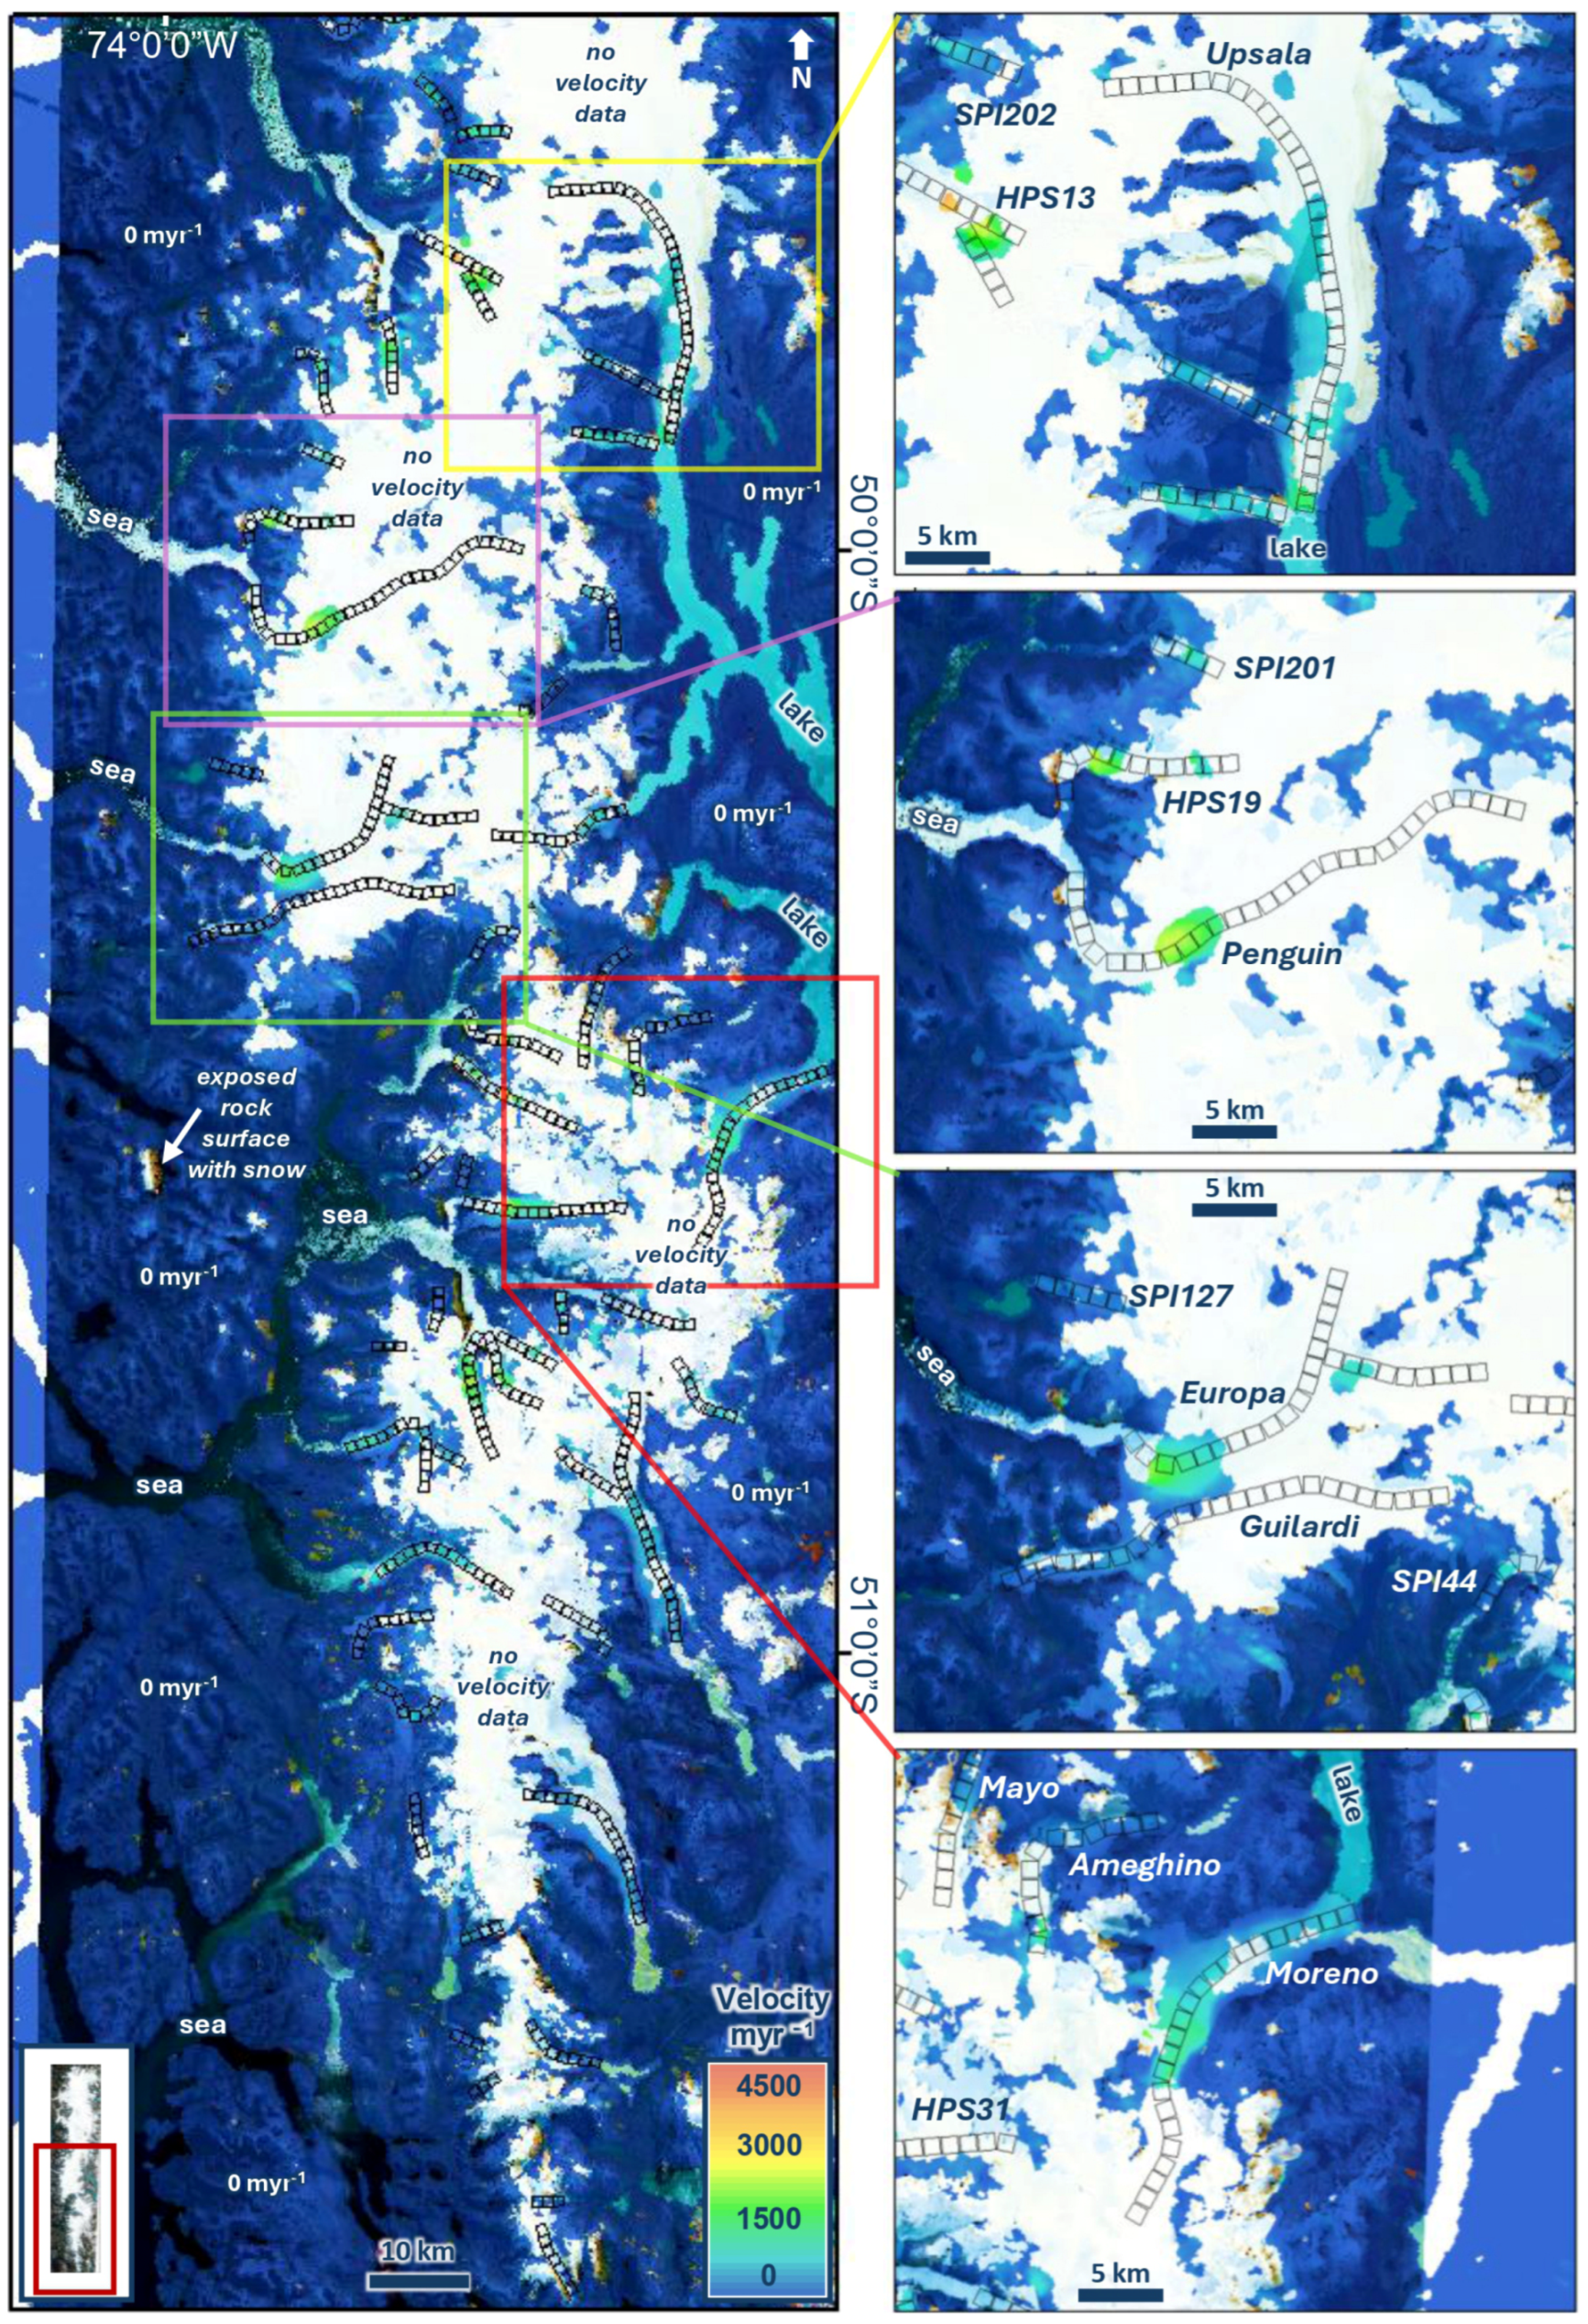
A total of 450 velocity maps were created for the whole study period (two of them can be seen in Figure 3 and Figure 4). For a total of 846 sample areas on the 64 glaciers, the velocity measurements were successful in 66% of cases. Unsuccessful cases are shown as No Data on the heatmaps. The success rates of velocity measurements were above 50% for 87.5% of glaciers, above 64% for 57.8% of glaciers, and above 81% for 32.8% of glaciers. The velocity ranged from 0 to 6571 myr−1 for the whole study period. As for immobile rock surfaces, we obtained 0 or only a few myr−1 velocity values, which, from a certain perspective, supports the reliability of our results. As ref. [43] stated: no-displacement signals outside the glaciated areas validate the surface velocity data detected along the glacier itself.

4.2. Topographic Parameters

The mean values of the topographic parameters (elevation, slope, aspect) showed variable correlation with the mean velocity values (Supplementary Data Table S1). In the case of elevation, the correlation coefficients ranged from 0.998 (SPI98 Glacier) to −0.964 (Viedma Glacier). Strong (>0.9: Agassiz Bolados, Snowy, SPI106, SPI116, SPI205, SPI81, SPI98; or <−0.9: SPI104, Viedma) correlation coefficients were observed for 10 glaciers. However, five out of these 10 glaciers have less than five sample areas, so in these cases, the correlation could be due to coincidence. However, the negative correlation coefficient of −0.964 for the Viedma Glacier with 28 sample areas shows that the velocity on this glacier decreases significantly with increasing elevation. In the case of slope, the correlation coefficients ranged from 0.846 (Snowy Glacier) to −0.697 (SPI81 Glacier), with average values around 0.14; thus, no correlation can be seen in most cases. The correlation coefficients for aspect ranged from 0.845 (SPI121 Glacier) to −0.999 (SPI98 Glacier). Significant (>0.9 or <−0.9) negative correlation coefficients were observed for two glaciers (SPI111 and SPI98). However, the number of sample areas was very low for both glaciers (four and three, respectively); therefore, we cannot assume a real correlation in these cases, either.
Generally, the mean ice thickness does not have a strong correlation with velocity, and it should be noted that ice thickness data were only available for 45% of the sample areas. A strong correlation coefficient (>0.9) was observed in the case of Amalia, but ice thickness data were only available for four of the 14 sample areas of the glacier. A strong negative correlation coefficient below −0.9 was observed for HPS15 (with data availability for five out of seven sample areas), SPI116 (data available for three out of nine sample areas), SPI135 (data available for three out of five sample areas) and HPS13 (data available for nine out of 14 sample areas, taking into account the one-year period) and Ofhidro (data available for nine out of 15 sample areas). However, based on the small number of comparison data, the high correlations may also be due to coincidence.
The above values represent the entire study period. We also determined the correlation coefficients for a one-year period (14 July 2019–18 July 2020) to avoid the overrepresentation of late-summer and spring seasons in the mean velocity values. Nevertheless, the correlation coefficients were only minimally different; thus, they are not analysed separately here, but they are available in Supplementary Data Table S1.

4.3. Surface Velocity Values of Glaciers

In general, the fastest movement in the area was observed on 16 November 2019, when the average velocity of the whole area exceeded 676 myr−1. We examined the measured velocity in the sample areas for the entire study period (from 8 July 2019 to 10 November 2020) and for a one-year period as well (14 July 2019–18 July 2020), to avoid overrepresentation of velocity values in the late-summer and spring months. However, in this case also, we found a minimal difference between the average velocity values calculated for the two periods (total study period and one-year study period); thus, we present here the values referring to the entire study period (Supplementary Data Table S1).
The minimum, maximum, and range of average velocities measured in the sample areas of each glacier showed significant differences (Table 3). The mean velocity in the 846 sample areas varied between 24 myr−1 (HPS12_1 sample area) and 6491 myr−1 (Penguin_5 sample area). The latter is not surprising, as the Penguin Glacier was also found to be the fastest in the region based on the database of [46]. The lowest minimum velocity was measured on the HPS12 Glacier, perhaps due to its small size (34 km2). HPS12 is one of the smallest glaciers in the SPI (for comparison, the average size of the 64 studied glaciers is 161 km2, while the largest, Pío XI, covers an area of 1244 km2). However, if maximum velocities are also considered, SPI119 (19 km2) is the slowest, with a maximum velocity of 83.6 myr−1, significantly behind HPS12, which reaches a maximum velocity of 715.26 myr−1 on its higher parts. Thus, SPI119 proved to be the slowest glacier in the region. Still, in terms of maximum velocity, it is important to mention that the HPS19 (12 km2) and HPS13 (14 km2) Glaciers, despite their small size, made extremely fast movements, with velocities of 1448.92 and 2793.92 myr−1 at 4–6 km from their termini. On the other hand, the Guilardi (165 km2, max. velocity 349 myr−1), Occidental (203 km2, max. velocity 350 myr−1) and Chico (305 km2, max. velocity 259 myr−1) Glaciers are interesting because of their slowness, as their maximum velocity is well below what we would expect based on their size. While the fastest moving areas of the latter two are located close to their fronts, Guilardi reaches its fastest velocity at 6–8 km from its front.
The range of velocities clearly shows the variability in the movement of individual glaciers (Table 3). In some cases, the differences between the measured minimum and maximum velocities were only a few 10 myr−1 at the glacier front and also several kilometers away (towards the accumulation area). This was typical of small glaciers in most cases (SPI98, SPI111, SPI200, SPI115, SPI127, SPI106 Glaciers). In the case of certain glaciers, the velocity range was several hundred or, in some cases, several thousand myr−1 (HPS19, HPS13, SPI121, HPS29, Calvo, HPS31, Europa, Greve, Penguin, Jorge Montt, O’Higgins, Upsala, Viedma, PíoXI Glaciers). Based on this, it can be said that the most complex forms of movement in the region are performed by these glaciers, which, except for the first three, are also the largest glaciers in the region. Based on all this, it is not surprising that if we examine the size of glaciers in relation to velocity maximum and range values, the linear trend line shows a weak but statistically significant correlation. So, it can be said that as glaciers grow, their velocities and velocity ranges also increase.
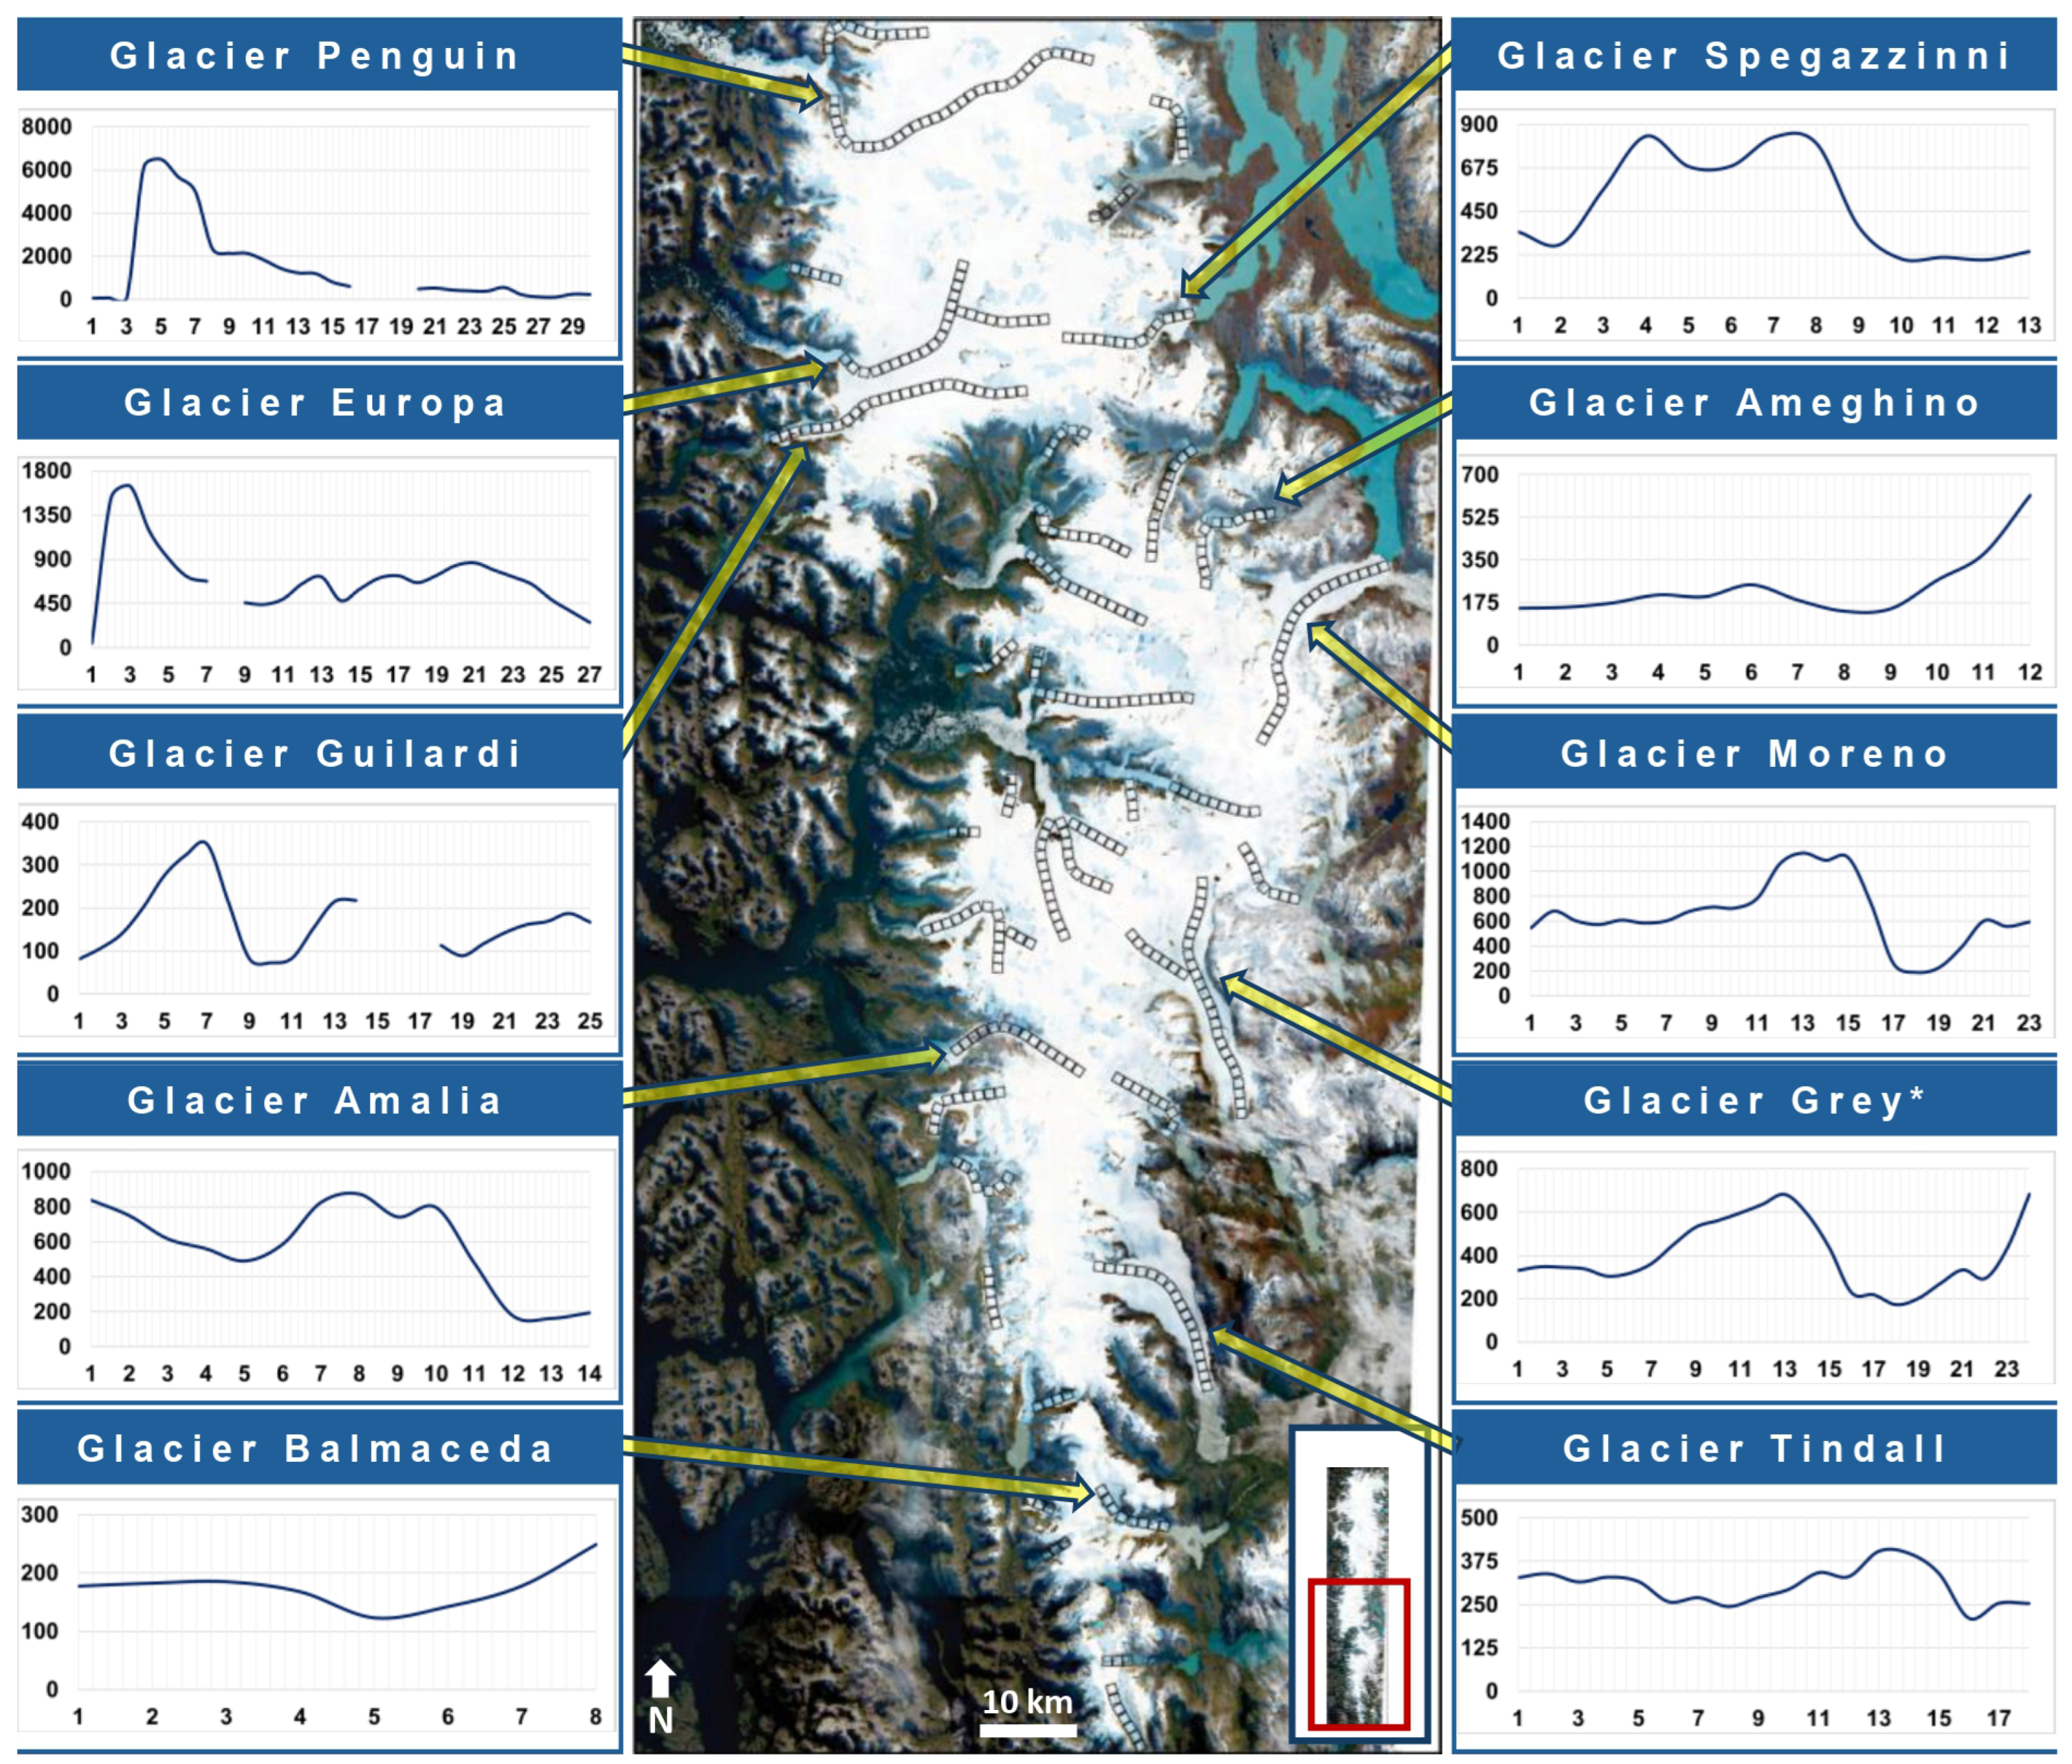
The velocity profiles proved to be highly variable from the ablation zone (close to the terminus) of each glacier towards the accumulation zone. By examining the characteristics of the velocity profiles (Figure 5 and Figure 6, and Supplementary Data Table S1), we could classify the studied glaciers into four groups (in one category, two subtypes). In the case of some glaciers, areas were also sampled on their side branches in addition to the main branch. These glaciers were classified based on their main branch velocity profile (Asia, Bernard, Calvo, Europa, Grey, Greve, Ofhidro, Upsala Glaciers). Velocity profiles are curves with a horizontal axis starting from the terminus towards the accumulation area:
  • Increasing velocity profile: Starting from the terminus, there is an increase in velocity.
    (a)
    Constant or slightly increasing velocity zone at the lower part of the glacier and a higher rate of increase at the upper part of the glacier, with a small decrease in velocity between these parts.
    Glaciers: Agassiz Bolados, Ameghino, Balmaceda, HPS10, Pascua, SPI116, SPI198, SPI84.
    (b)
    Starting from the terminus, a continuous increase in velocity can be observed towards the accumulation area. The number of sample areas is low in this subtype.
    Glaciers: Snowy, SPI106, SPI205, SPI81, SPI98.
  • Decreasing velocity profile: Starting from the terminus, there is a more or less continuous decrease in velocity towards the accumulation area, with short segments where the velocity increases going upwards.
    Glaciers: Asia, O’Nelli, SPI104, Viedma.
  • Single-peak velocity profile: There is a single peak of velocity values below which and above which the velocity is smaller. This velocity peak can be either at the lower part or at the middle part of the glacier.
    Glaciers: Bravo, Calvo, Europa, HPS12, HPS15, HPS31, O’Higgins, Oriental, Penguin, Pingo, SPI107, SPI111, SPI115, SPI119, SPI121, SPI127, SPI135, SPI15, SPI200, SPI201, SPI202, SPI203, SPI44, SPI5.
  • Multiple-peak velocity profile: There are several peaks in the velocity profile, i.e., the glacier has several segments of high velocity and several segments of low velocity.
    Glaciers: Amalia, Bernard, Chico, Greve, Grey, Guilardi, HPS13, HPS19, HPS29, HPS9, Jorge Montt, Lucia, Mayo, Moreno, Occidentalt, Ofhidro, Pío XI, Spegazzini, SPI131, SPI204, Tampanot, Tindall, Upsala.
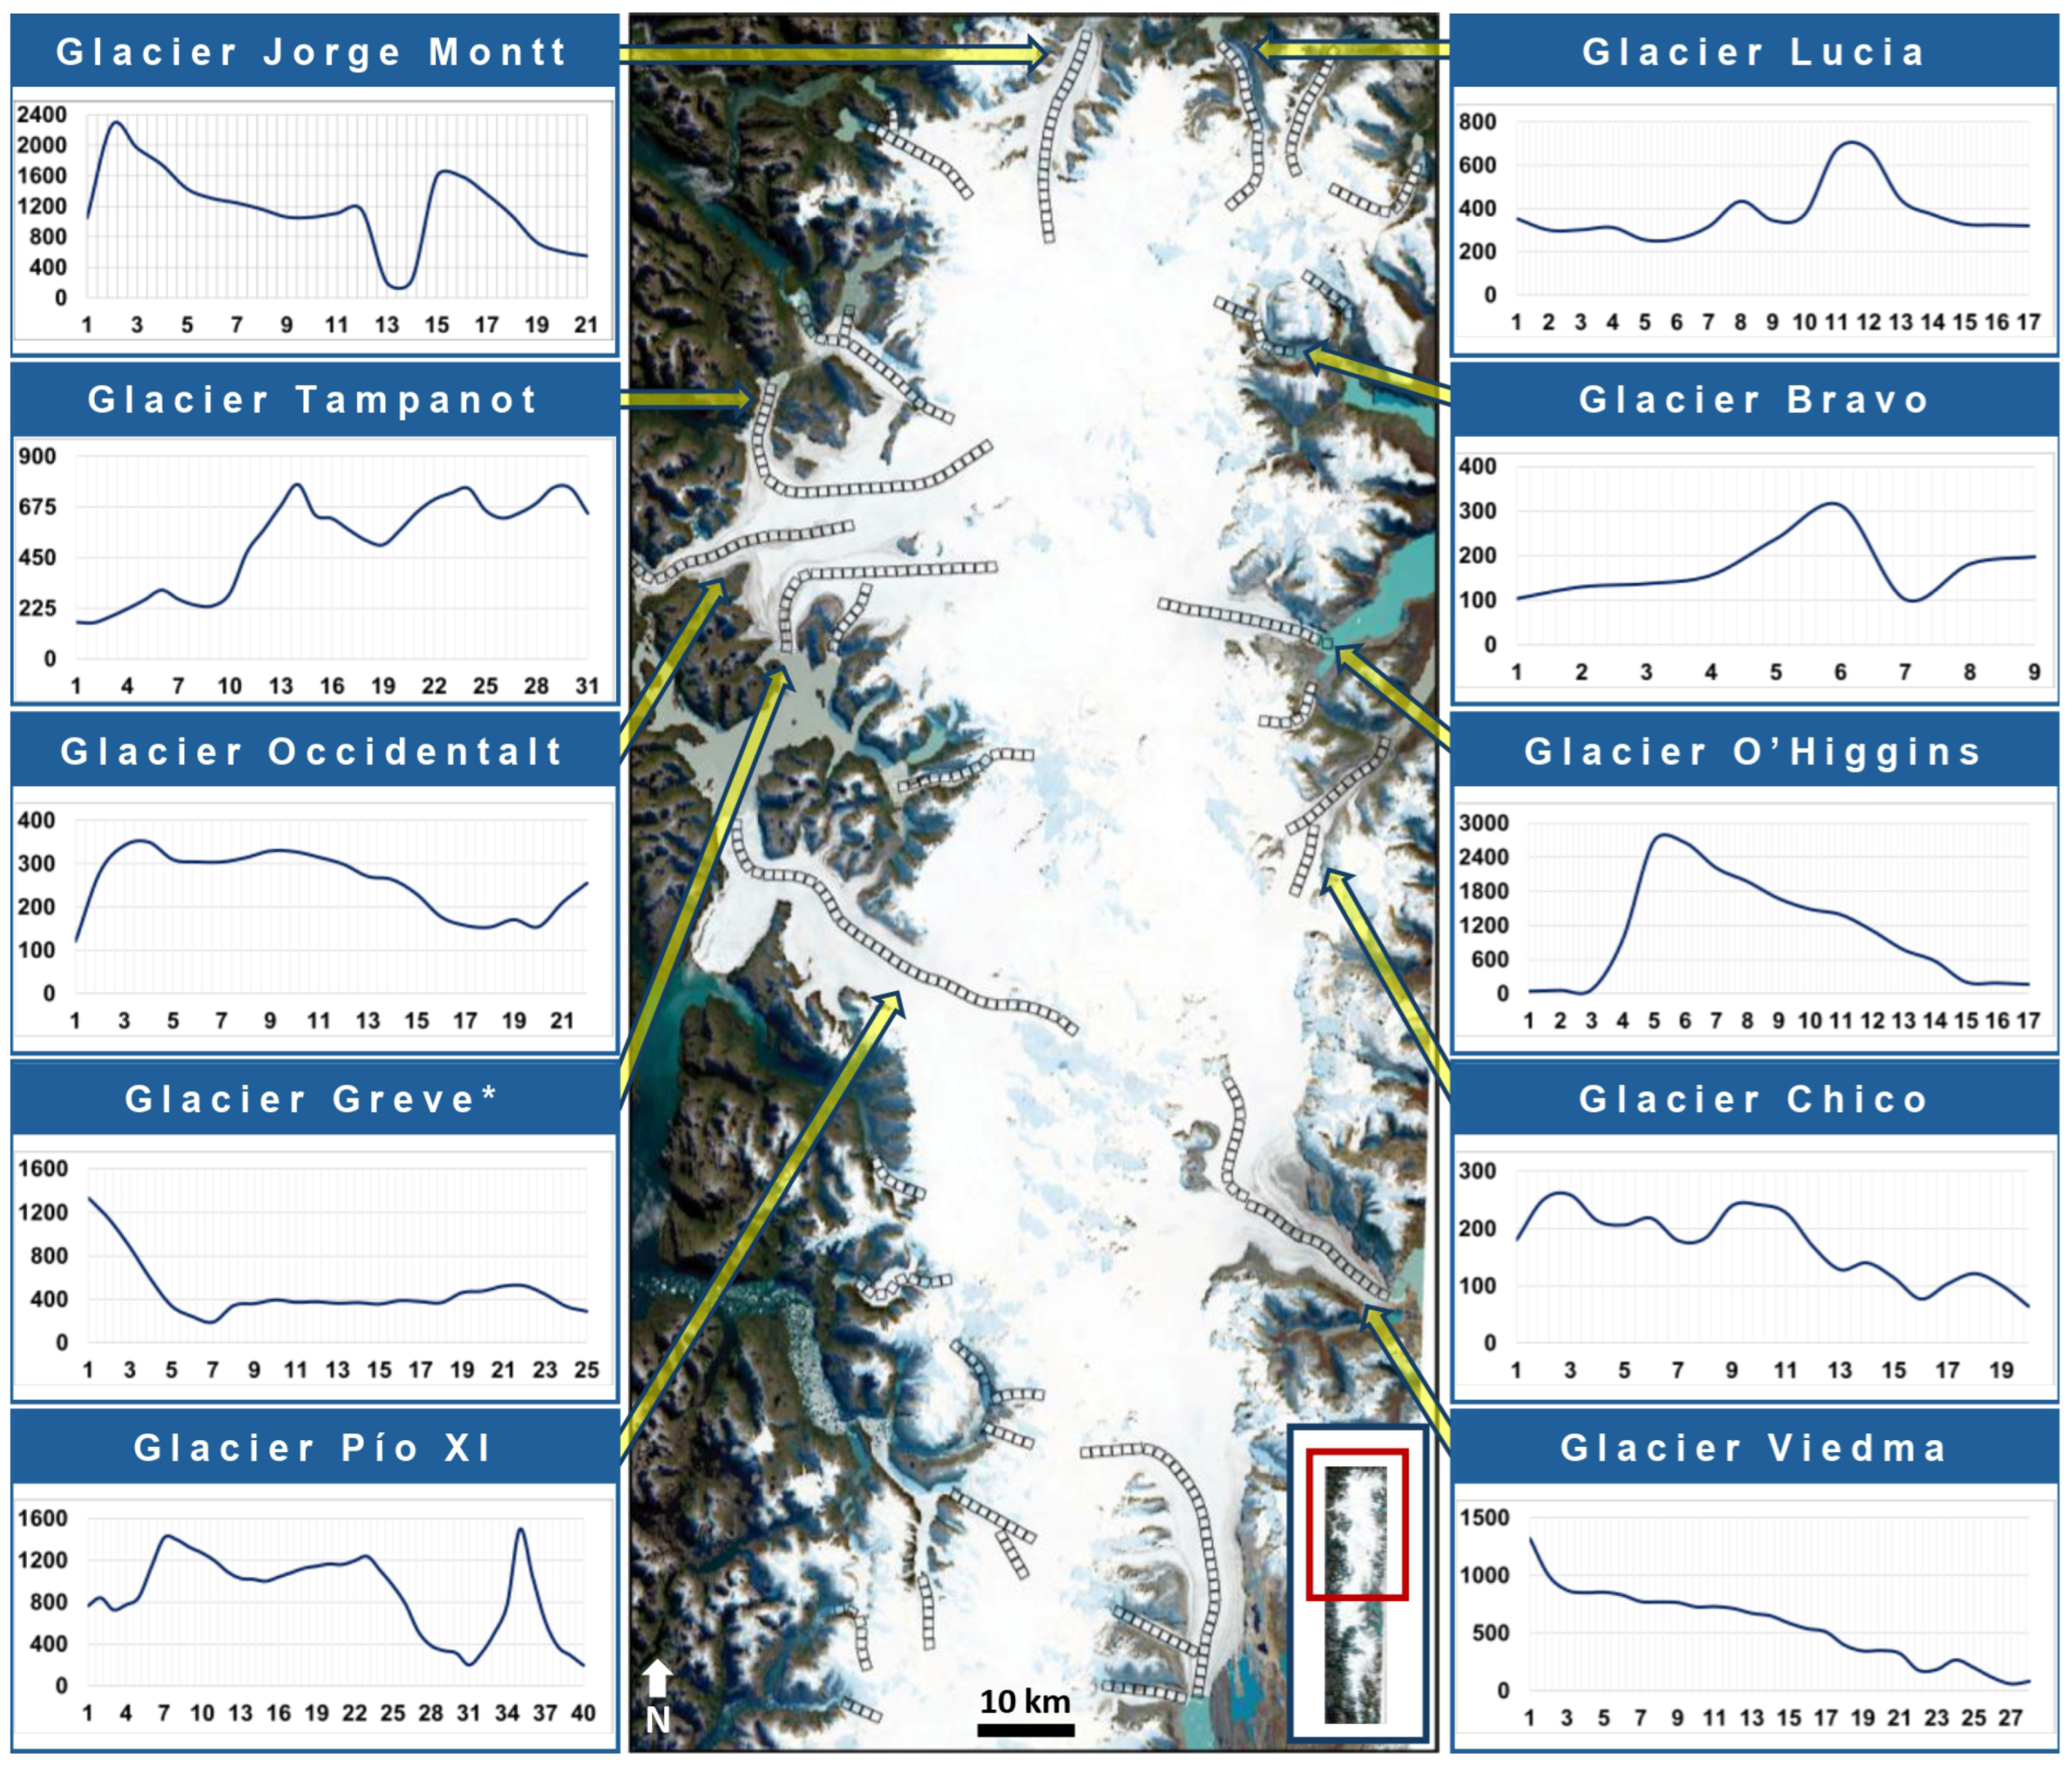
In fact, 36% (23) of the 64 examined glaciers show multiple-peak velocity profiles. These glaciers exhibit several sections with either very high or very low velocities, with definite increases or decreases only occurring over short sections of a few kilometers, meaning that their movement is highly variable and difficult to categorize. The most common type comprised the single-peak velocity profiles, accounting for 37.5% (24) of the glaciers. This was followed by multiple-peak velocity profile, then increasing velocity profiles with 20% (13 glaciers) and finally decreasing velocity profiles with only 6% (4 glaciers).
If we examine the movement of individual glaciers according to their size (Table 4), the following can be said: in the case of glaciers larger than 100 km2, more than 64% show a multiple-peak velocity profile, while 36% show a single-peak or decreasing velocity profile. There is no increasing velocity profile at this size. In contrast, only 21% of glaciers smaller than 100 km2 show a multiple-peak velocity profile, while 48% of the glaciers show a single-peak or decreasing velocity profile. An increasing velocity profile is very common at this size; 31% of the glaciers are in this category.
Based on all this, it can be said that as the size increases, the velocity profile of glaciers becomes more complex, and no simple linear increase with distance can be observed. Thus, we must look for complex causes behind the factors influencing velocity in these cases.
Figure 5. Location of the sample areas in the northern part (marked with red rectangle) of the SPI and velocity profiles of some larger glaciers. The x-axis of the diagrams shows the IDs of sample areas (#1 = near the termini; increasing towards the accumulation areas), while the y-axis shows the average velocity (myr−1) for the study period. Background: Sentinel-2A (from Copernicus, date: 5 May 2020). * In the case of the Greve Glacier, the profile only shows the velocity of the main/northern branch (sample areas #1 to #25).
Remotesensing 17 03742 g005
Figure 6. Location of the sample areas in the southern part (marked with red rectangle) of the SPI and velocity profiles of some larger glaciers. The x-axis of the diagrams shows the IDs of sample areas (1 = near the termini; increasing towards the accumulation areas), while the y-axis shows the average velocity (myr−1) for the study period. Background: Sentinel-2A (from Copernicus, date: 5 May 2020). * In the case of the Grey Glacier, the profile only shows the velocity of the main (eastern) branch (sample areas #1 to #24).
Remotesensing 17 03742 g006

4.4. Interpretation of the Heatmaps

4.4.1. Fastest-Moving Areas (FMAs)

The heatmaps (Supplementary Data Figure S1) clearly show the fastest-moving areas (FMAs) and the fastest periods of each glacier. There are glaciers where the FMA can be traced as a distinct area through one or sometimes two sample areas located next to each other (Glaciers: Asia, Bernard, Europa, Greve, HPS29, Lucia, Ofhidro, O’Higgins, SPI15, Tampanot, Upsala and Viedma). In the case of Moreno Glacier, a distinct section also indicates the FMA of the glacier, but this includes four sample areas, a section of the glacier more than 4 km long, which is moving with the fastest velocity. There are glaciers where the FMAs occur only intermittently or as occasional outliers, but this can be observed at roughly the same section of the glacier (Glaciers: Amalia, Balmaceda, Bravo, Calvo, Guilardi, HPS13, HPS15, HPS19, HPS31, Jorge Montt, Mayo, O’nelli, Oriental, Snowy, SPI115, SPI121, SPI198, SPI201, SPI202, SPI203 and Tindall). In the case of some other glaciers, a larger section (up to 10–12 km) can be identified where the FMA is observed, not as a uniform, distinct line but fluctuating within the given section (Glaciers: Agassiz Bolados, Ameghino, Chico, HPS9, HPS10, Penguin, Pingo, Pío XI, Spegazzini, SPI15, SPI104, SPI106, SPI107, SPI135, SPI204 and SPI205). In the case of some glaciers, we do not see a clearly defined FMA, and outliers occur at several sections of the glacier (Glaciers: Grey, Occidentalt, Pascua, SPI5, SPI44, SPI81, SPI84, SPI98, SPI111, SPI116, SPI119, SPI127, SPI131 and SPI200).
A total of 19 glaciers show continuous FMAs at the glacier front, with occasionally significant acceleration in one or two sample areas. All these glaciers are tidewater glaciers (Glaciers: Amalia, Asia, Europa, Greve, HPS15, HPS29, HPS31, Jorge Montt, Occidentalt, O’Higgins, O’Nelli, Pío XI, SPI115, SPI201, SPI202, SPI204, Upsala and Viedma), except one, the SPI104 Glacier, which ends in a proglacial lake. The rapid and intermittently accelerating movement of the termini of these glaciers may be due to calving, which increases the velocity near the glacier terminus.

4.4.2. Seasonal Fluctuations

Heatmaps have also proven to be useful for detecting seasonal fluctuations. A clear seasonal acceleration, which we would expect during the October–November (Spring) period based on [13], was observed in eight glaciers at their different parts (close to the termini: Greve, Jorge Montt, Upsala, Viedma; middle part: Jorge Montt (here as well), Lucia, Moreno, Oriental; upper part: Bernard). A weaker spring acceleration was observed also on eight glaciers at different parts (close to the termini: O’Higgins, SPI135, SPI202; middle part: Occidental, HPS9, HPS29; upper part: Bravo, Mayo). Comparing our observations with [13] results, it is interesting to note that we also observed strong seasonal acceleration in the case of Jorge Montt and weak seasonal acceleration in the case of O’Higgins. However, in the case of the Pío XI Glacier, which they characterized as having the largest seasonal acceleration, we could not observe unambiguous seasonal acceleration. The outstanding velocity of Pío XI at the terminus in spring of 2019 was not repeated in the spring of 2020. All these seasonal fluctuations can be strongly influenced by calving events. It should be noted that this phenomenon can be observed both for tidewater and lake-terminating glaciers.

4.4.3. Pío XI Glacier Acceleration

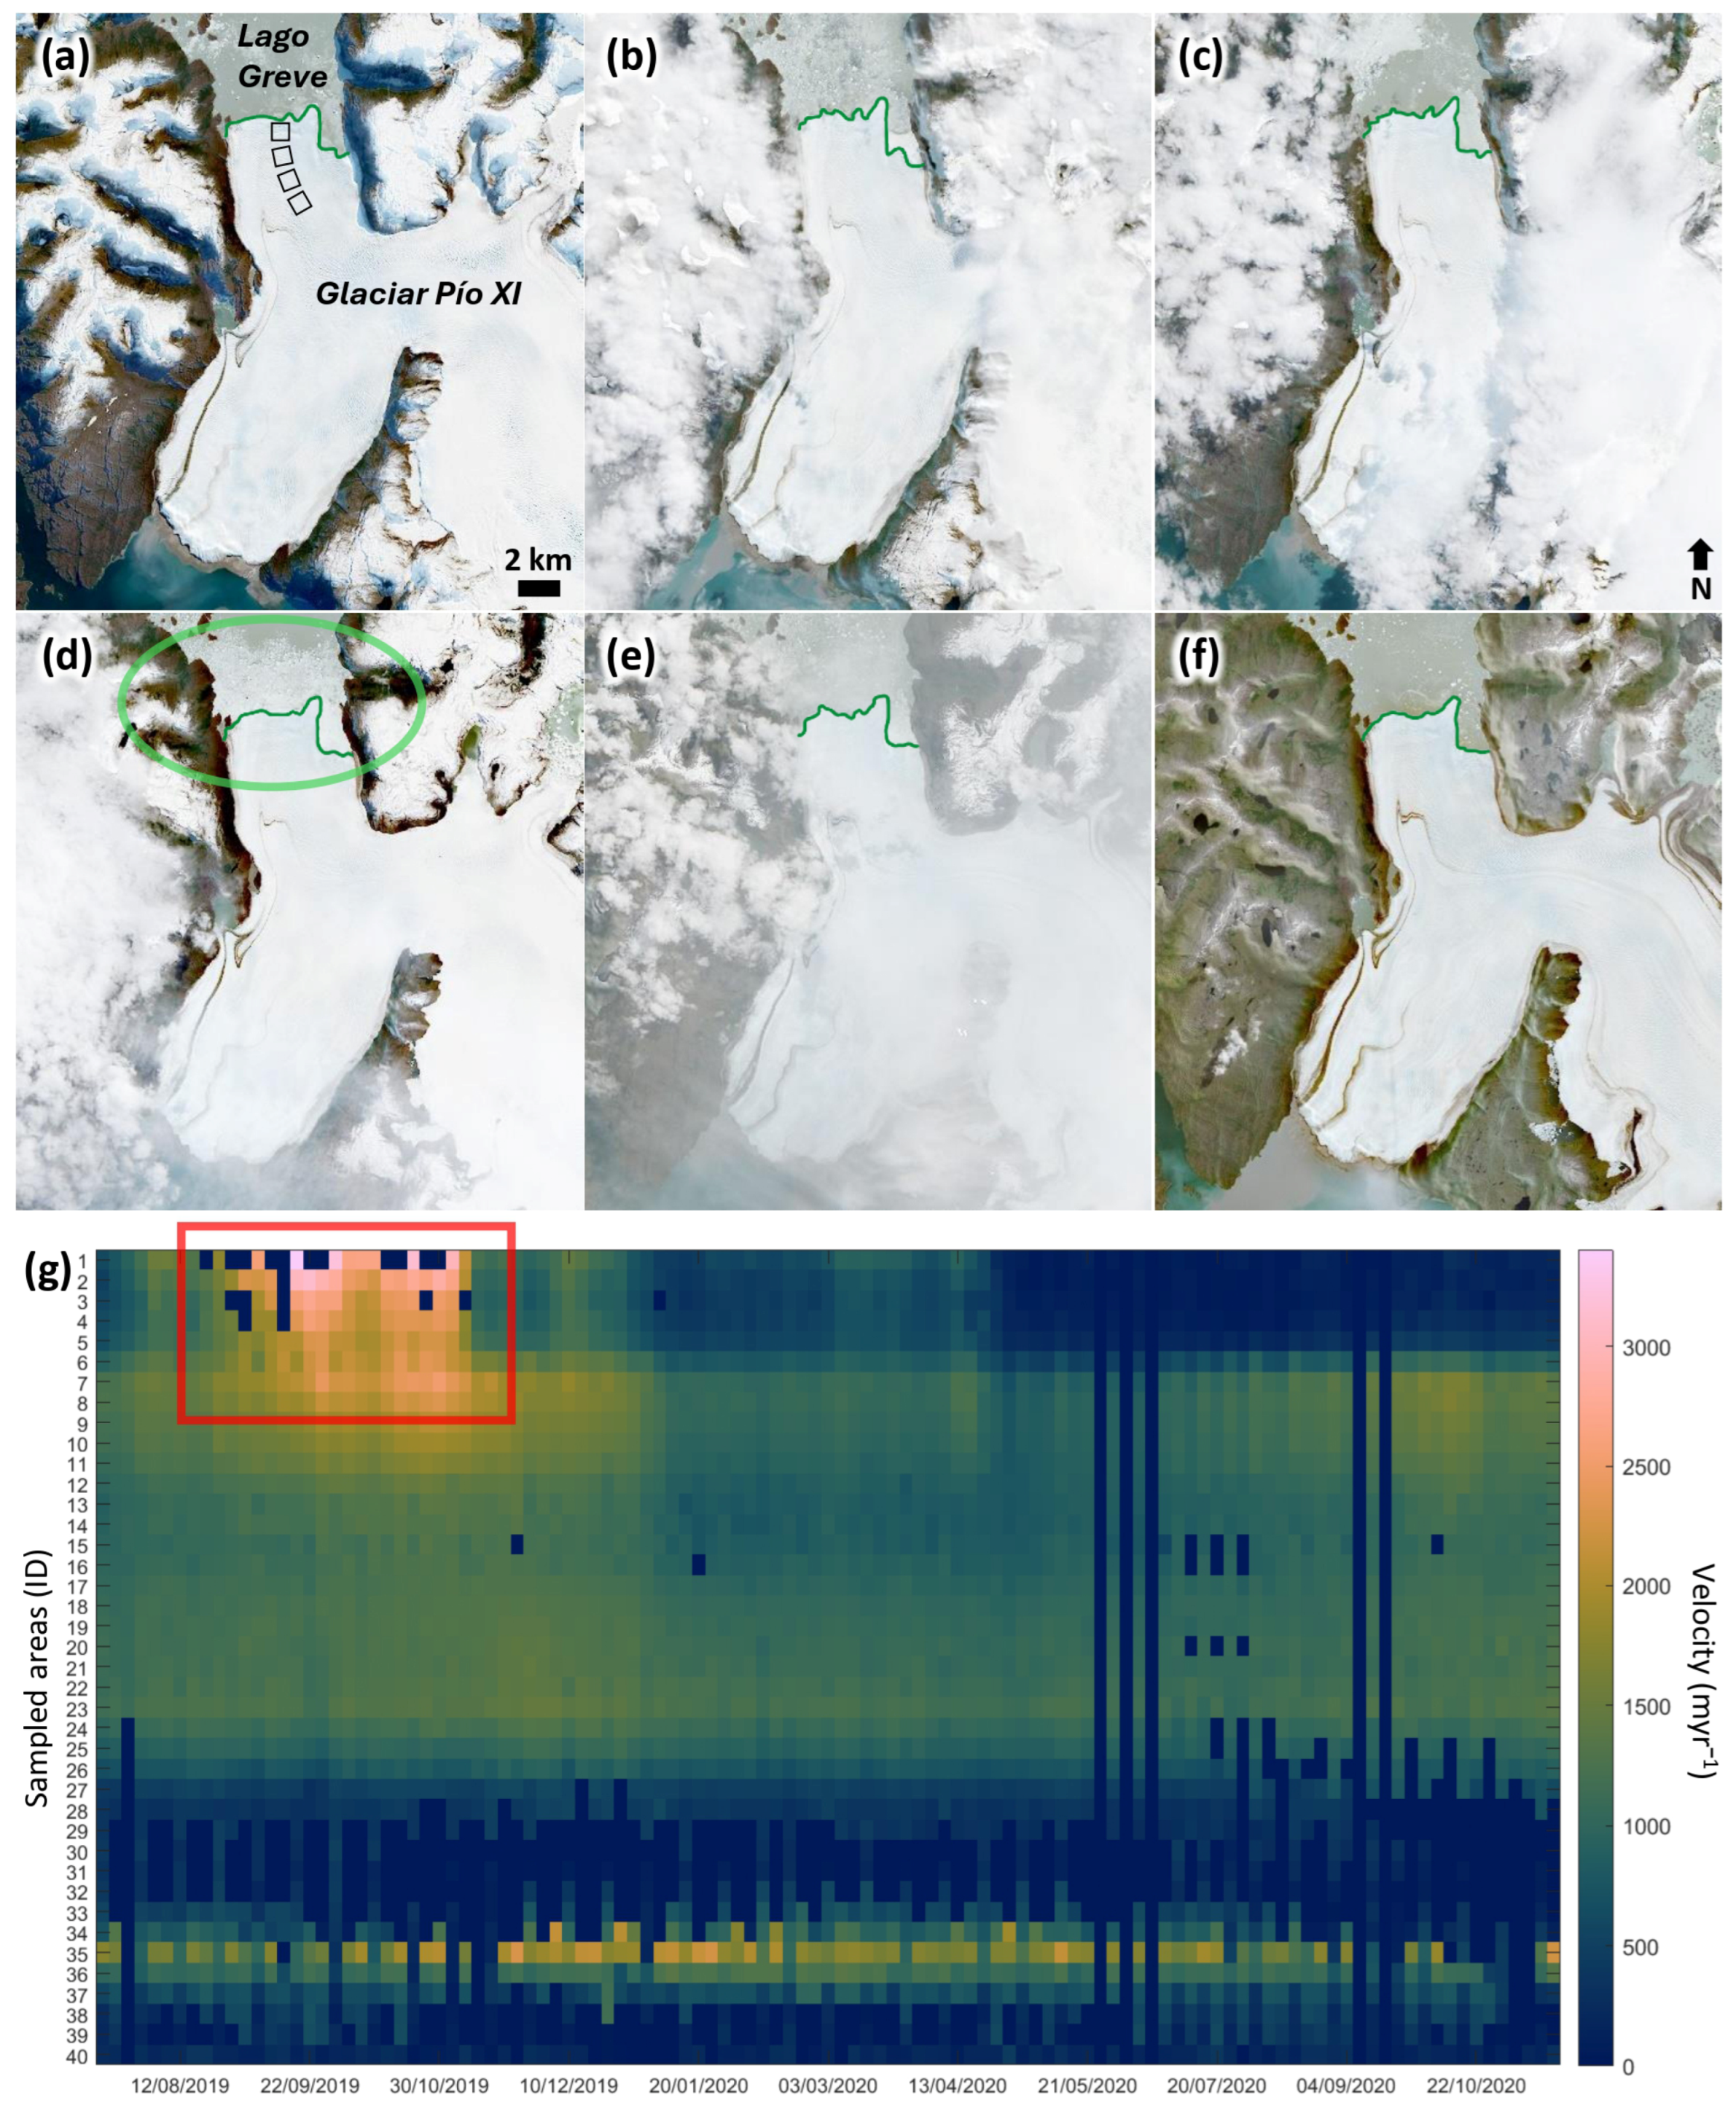
One of the most conspicuous phenomena is related to the Pío XI Glacier (also known as the Brüggen Glacier). We detected a strong acceleration at the glacier terminus, lasting from early August to early November 2019 (Figure 7). The area, which normally moves at an average velocity of a few hundred myr−1, exceeded 3000 myr−1 during this period. The acceleration primarily affected the sample areas #1 to #4, but to a lesser extent, it was also recognizable at sample areas #5 to #10, with a time lag. Sentinel-2 true colour images of the area show that by the end of October 2019, numerous small and large icebergs appeared on the surface of Greve Lake (Lago Greve; where Pío XI Glacier ends), indicating significant calving of the glacier, as well as the transformation of the glacier terminus (Figure 7d). Based on all this, the exceptional velocity at the front was presumably the result of calving.

4.4.4. Tidewater Glaciers with Continuous Rapid Movement

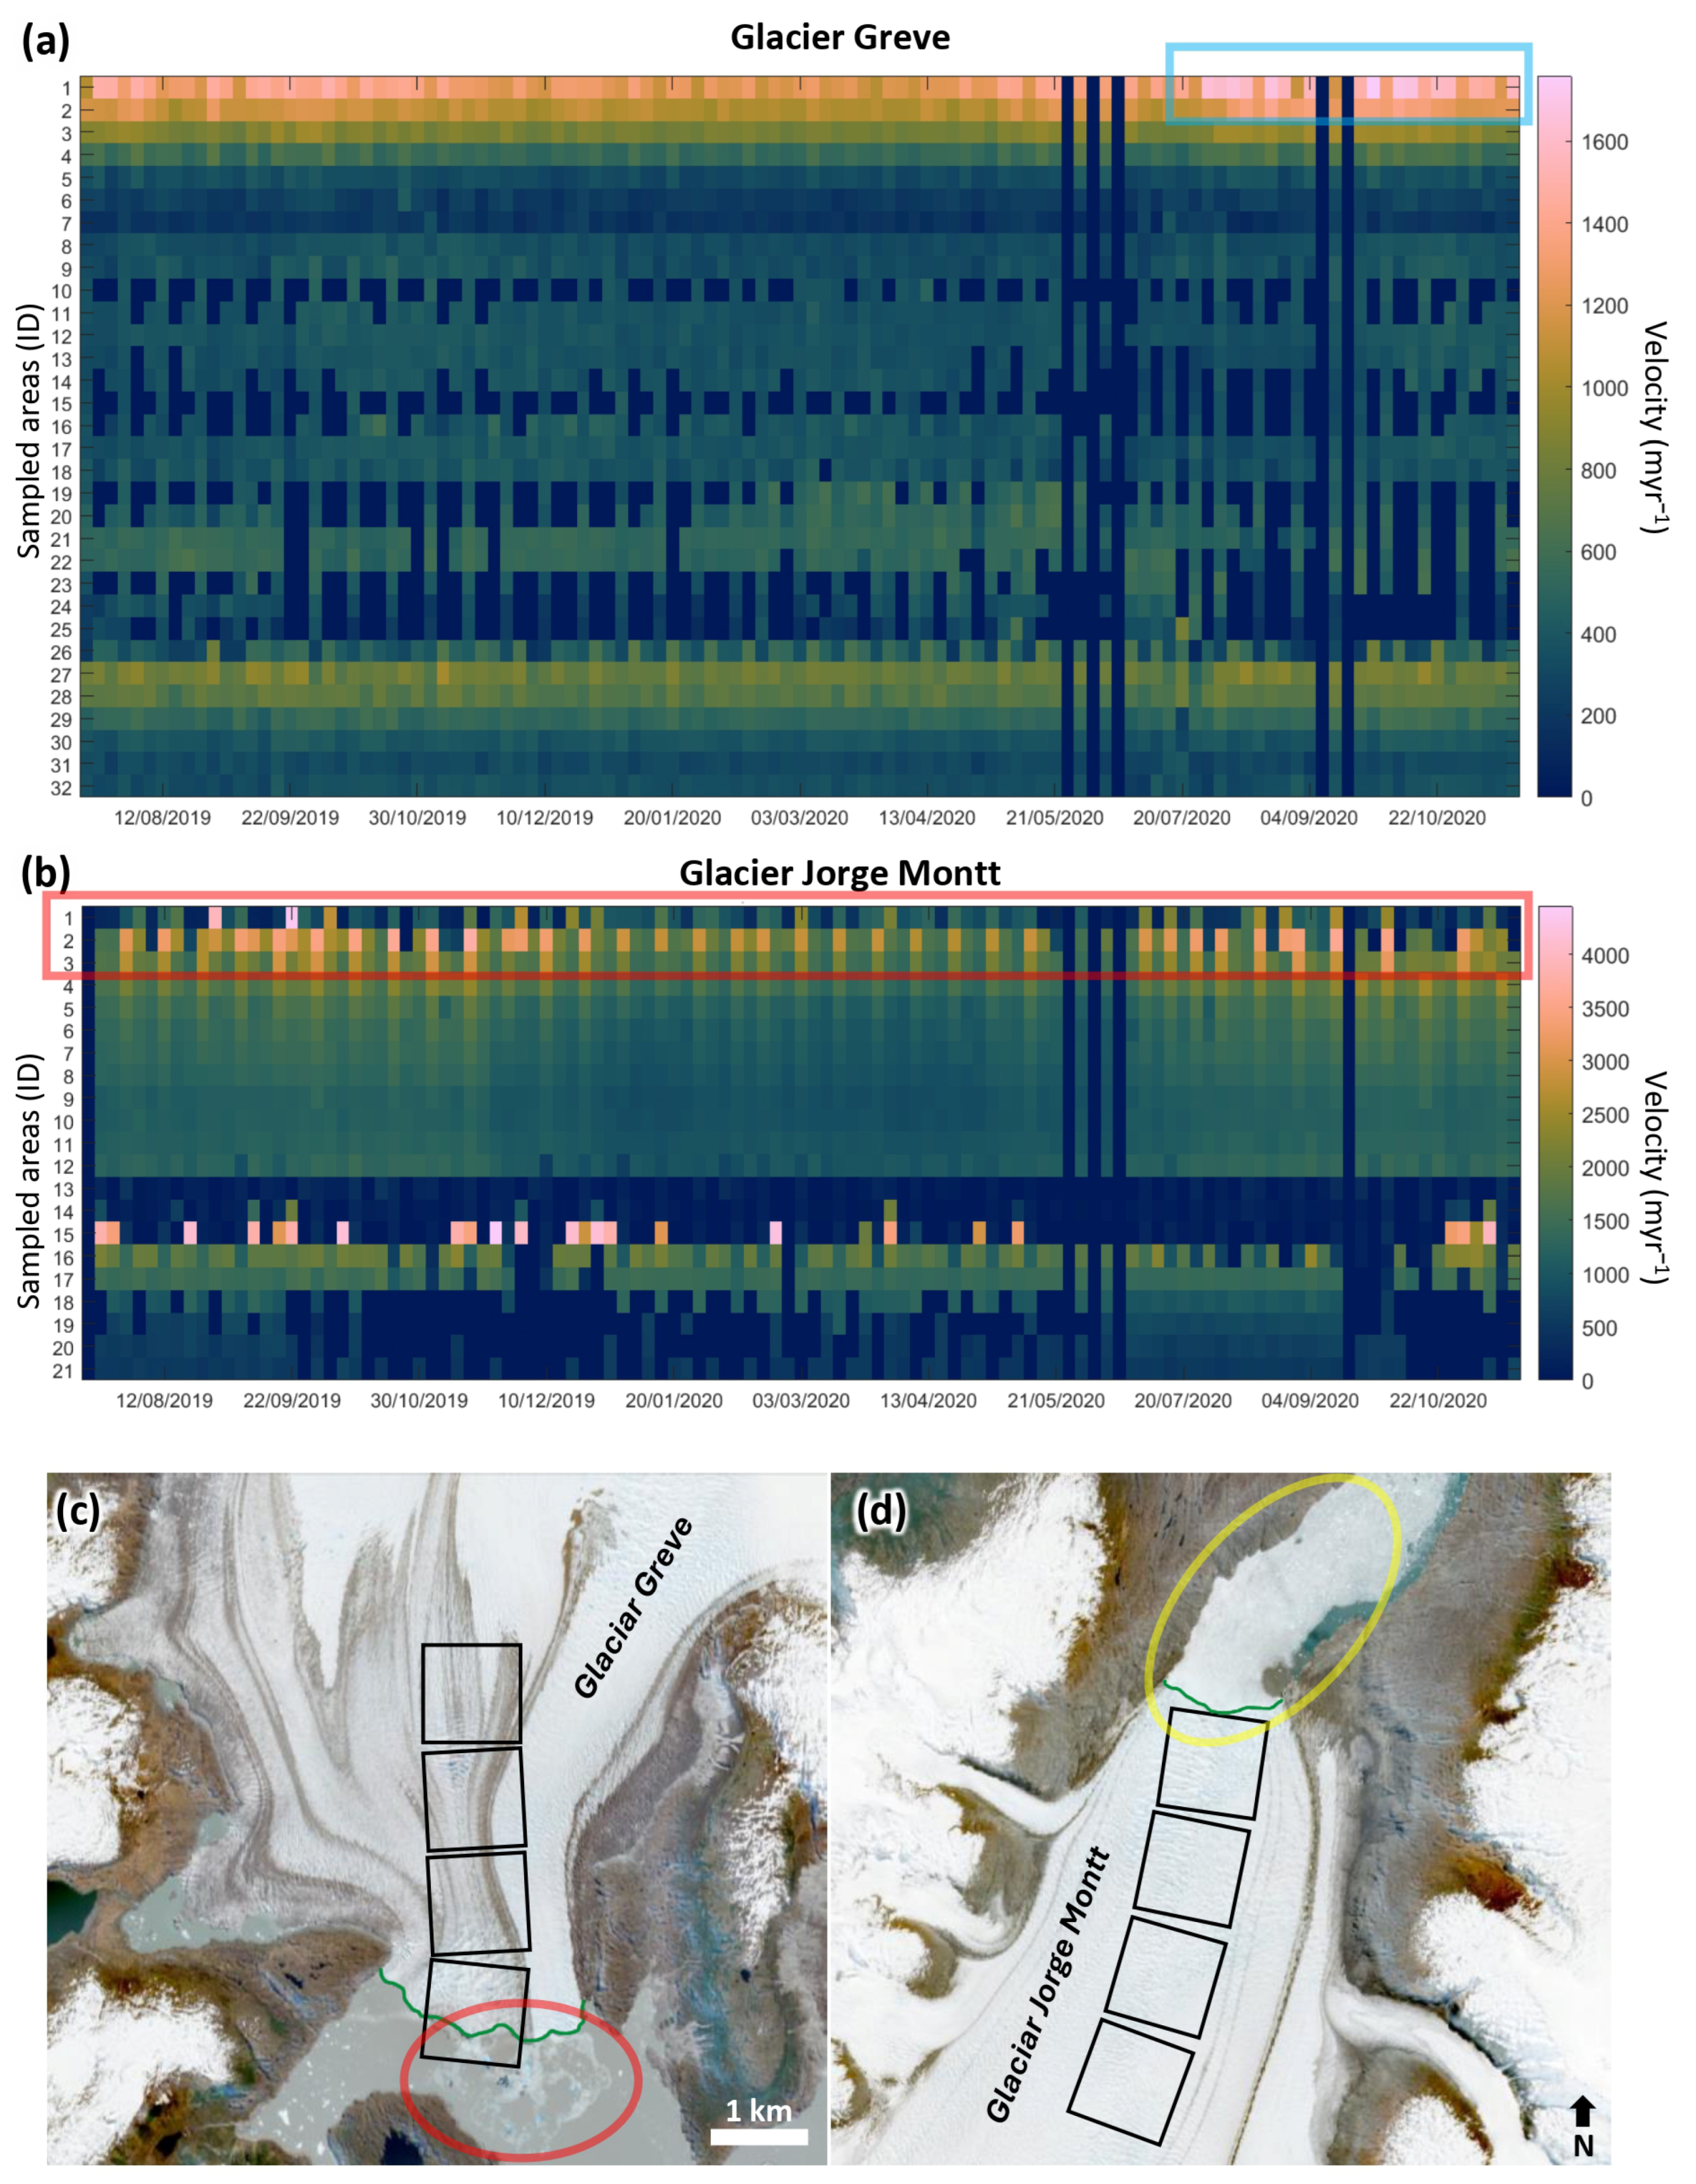
Another well traceable phenomenon that can be observed in several glaciers and is clearly illustrated by heatmaps is the continuous rapid movement of the glacier terminus. This can be observed in the following tidewater glaciers, which are also outstanding in terms of size in the area: Asia, Europa, Greve (Figure 8a–c), Jorge Montt (Figure 8b–d), O’Higgins, Upsala, and Viedma Glaciers. It is also visible that even within these constant FMAs, there are periods when the glaciers move even faster, like in the case of the Greve, Upsala, and Viedma Glaciers. These accelerations are similar to the acceleration of the Pío XI Glacier, but less spectacular, as they affect smaller areas in terms of distance from the terminus, and the movement is already fast in the glacier terminus area, in contrast to the slow movement of the terminus of the Pío XI. Calving and tidal fluctuations may also play an important role in the acceleration.

5. Discussion

5.1. The Variability of the Measured Velocity

Velocity measurements using the method developed by [47] proved to be successful on the SPI, and the analysis of the velocity maps provided a wealth of new information about the specific dynamics of the SPI glaciers. If we examine the specific topographical parameters (altitude, slope, aspect) of the glaciers, we see that there is correlation only between the altitude of the glaciers above sea level and the acceleration/deceleration of their movement. The strongest correlation was the negative correlation observed in the case of the Viedma Glacier, i.e., the velocity of the glacier decreased with increasing altitude. It is not surprising that mid-November proved to be the fastest period during the measurement, as it corresponds to the end of spring and beginning of summer, i.e., the melting season. Previous research has shown that the subglacial water network plays a significant role in glacier dynamics [72], but the exact details of its functioning vary from region to region, and its long-term effects are still not fully understood, forming the basis for many research studies (e.g., [73,74,75,76,77,78]). However, thanks to [78], it is known that in the early stages of the melting season, drainage is not yet working efficiently on the substrate, breaking down into several unrelated water branches. Due to high water pressure in the system and the complete wetting of the bed, the glacier moves most rapidly at this time, so we can assume that the fastest movement in the SPI also occurs during this period. Based on the work of [77], it is also recognized that the subglacial water network affects the calving process, so it is expected that significant calving events occur in the SPI during this period.
Based on our velocity calculations, tidewater glaciers proved to be the fastest on the SPI, while lake-terminating glaciers produced slower overall movement during our study period, like the results of [44]. Examining the velocity profiles of glaciers, we were able to classify the 64 studied glaciers into four (in one category, two subtypes) different groups, which clearly shows the diversity and variability of SPI glacier dynamics. Furthermore, it is also demonstrated that as the size of a glacier increases, the probability of having a multiple-peak velocity profile also increases (Table 4).

5.2. Glacier-by-Glacier Discussion of Velocity Changes

We compared the velocity profiles with the results of previous studies, which showed that similar velocity profiles were observed in most glaciers (even if the exact velocity values varied in range). However, in the case of some glaciers, we observed significant dynamic changes; detailed information about these is provided below (except for Moreno Glacier, which is interesting because of its long-term stability).

5.2.1. Moreno Glacier

Rott et al. [54] provide insight into the movement of Moreno Glacier in 1994. Although their results only show a short (3-day) period of the glacier’s dynamic, it is in the fast-moving period of Moreno, in October. They found rapid movement near the terminus (912–730 myr−1), followed by a slight slowdown 4 km higher up (547 myr−1) and another acceleration 6 km higher up (730 myr−1). The velocities measured by [42,48] show similar values with each other, which is not surprising since their study periods overlap. They measured velocities between 365 and 730 myr−1, with somewhat faster values in October–December. These values are almost the same as our values. In our sample areas within 5 km of the terminus of Moreno (ref. [48] studied only this part of the glacier), the velocity ranged from 354 to 832 myr−1 during 2019–2020, and a slight increase in velocity was also observed during the months of October to December. Only the results of [54] show a somewhat faster movement than ours, which is presumably related to the limited length of their study period, which fell in the fastest season (if seasonality also plays a role in Moreno Glacier’s velocity) [13]. Another interesting fact is that the velocity of the Moreno was also observed using GPS-based velocity measurements for short periods between 2008 and 2010 [79]. Sugiyama et al. [79] measured velocities near the glacier terminus similar to those of other studies using tracking methods. Sugiyama et al. [79] also pointed out that changes in the velocity of the glacier are closely related to changes in air temperature. All these facts point to the relative stability of the Moreno’s dynamics, which, even after 10 years, looks similar as before.

5.2.2. Upsala and O’Higgins Glaciers

Upsala has undergone a drastic retreat over the past two decades. The FMA at the earlier terminus (referred to as the western terminus in the previous publications) measured by [42,56] has almost completely disappeared today. Compared to the 1600 myr−1 velocity measured by [56] in 2000–2001, an acceleration can be observed 6 years later, as ref. [42] measured a velocity of around 2000 myr−1 in the area in 2007–2008. A velocity similar to that measured by [56] can still be measured near the terminus, but it is today located higher up. The velocity decreases to around 1000 myr−1 as we move a few kilometers from the terminus. The velocity in this area also has values similar to those measured by [42] for 2007–2008. Muto and Furuya [43] were unable to measure velocity near the terminus of the Upsala Glacier due to the long time interval, which led to a lack of trackable points (they used speckle tracking). However, at approximately 6 km from the terminus, they measured a velocity of 1200 myr−1 in 2011, which is somewhat higher than our measurements. Compared to the velocity of approximately 700 myr−1 measured by them in the southernmost side branch of Upsala, our measurements are also somewhat slower. Sakakibara et al. [55] also studied the velocity of the area near the terminus of the Upsala Glacier, but only in four sample squares located close to the terminus (the furthest being 7.7 km away), and their measurement areas roughly overlap with our first four sample areas. Their measurements also show that as the terminus of the Upsala Glacier moves higher, the high velocity values near the terminus also move higher. The velocity closest to the terminus measured by them reached 1500 myr−1, which is similar to our measurements. The same process and similar velocity distribution are also presented by [52]. Interestingly, ref. [44] reported that the terminus of Upsala reached a velocity of 3000 myr−1, but the velocity we measured was far below this, reaching an average of 1000–1300 myr−1. They reported similar velocity values at the terminus of the O’Higgins Glacier. In this case, the difference was even more drastic, as our measurements showed a velocity of only a few 10 myr−1 at the O’Higgins. In the case of Upsala, we can therefore observe a kind of dynamic rearrangement over 20 years (from the first to our last measurement), in which the glacier’s significant retreat may play a major role (between 2003 and 2011, the retreat was approximately 3.5 km, according to [43]). Furthermore, it can also be said that the velocity values we measured suggest a slowdown, which breaks the continuous increase observed by previous studies.

5.2.3. Viedma Glacier

In the case of Viedma, a significant retreat can also be observed [49,51,53,80]. Compared to all previous studies dealing with velocity measurements, the FMAs were at the terminus, where there is no ice left today. The fastest movement in this area was measured by [53] (approximately 1500 myr−1), and a similarly fast velocity was measured by [80] (approximately 1300 myr−1). We also measured a similar velocity near the current terminus found at higher elevation, but over a longer period. Since the period we studied also includes the summer–spring melting (and thus fastest) season (unlike the work of [53], which covers the slower autumn–winter months), we can assume that the velocity of Viedma has generally slowed down by now compared to 2012. This is also supported by the measurements of [51], who detected the fastest movement near the terminus as only around 900 myr−1. Surprisingly, although the measurements of [49] overlap with those of [53], their results indicate much slower velocities of around 1100 myr−1 near the terminus. The continuous decrease in velocity observed on the glacier away from the terminus can also be seen on the maps of [51,53], whereas maps of [49] show that the glacier velocity is not continuous but interrupted by sections of acceleration as one moves towards the accumulation area. All these differences in the case of Viedma may stem from the different data and methodologies, as ref. [80] suggested, but they may also be caused by the relatively rapid change in the glacier dynamics.

5.2.4. Ameghino Glacier

Floricioiu et al. [42] observed similar velocities of around/below 200 myr−1 for our first seven sample areas of Ameghino Glacier for the period 2007–2008 to what we measured for 2019–2020. However, this was followed by a drastic acceleration according to the research of [42], to 1500 myr−1 velocity, which roughly corresponds to that of the #8 sample area we examined. However, during the 2019–2020 study period, we only measured such high velocities much further away, in the #11 and #12 sample areas, meaning that this FMA shifted backward from the terminus by 3–4 km. Furthermore, such exceptional values occurred not only during the summer months, but throughout almost the entire measurement period, indicating a change in the glacier dynamics.

5.2.5. Jorge Montt Glacier

The velocity near the terminus of Jorge Montt Glacier for the period 2010–2011 was 4745 ± 1460 myr−1 based on terrestrial cameras and ASTER satellite images [9]. Like in the case of Upsala, ref. [43] were unable to measure velocity near the terminus due to the long time interval on the Jorge Montt Glacier as well. But their measurements complement the results of [9] well in terms of time and space, since they cover the same period but show velocity for the upper part of the glacier. We detected fast movement at the terminus of the Jorge Montt Glacier, like [9], with velocities above 3000–4000 myr−1 in several periods. However, due to the constantly fluctuating velocity, the average velocity of the #1 and the #2 sample areas we recorded at the terminus (1000–2300 myr−1) is lower than the average velocity of [9]. Muto and Furuya [43] examined the velocity of Jorge Montt in detail using a profile and a sample area that corresponded to the #5 and #8 sample areas recorded by us. Comparing our measurements, we observed an acceleration with respect to their sample area, and we measured a similar velocity at their profile location. Mouginot and Rignot [13] measured 87% of the SPI velocity and published detailed velocity profiles for four large outlet glaciers. Three of these glaciers (Pío XI, O’Higgins, and Upsala) show a profile similar to ours, with minimal differences in the specific velocity values. In the case of Jorge Montt, however, two significant differences can be observed when comparing their velocity profiles to ours. At the terminus of the glacier, we can see a decrease in velocity compared to the profile of [13], like [9]. But ref. [13] detected a slightly slower velocity than [9], with 3000 myr−1 (sometimes reaching 4000 myr−1) maximum velocity in every year from 1984 till 2014. What is even more striking is that at 13–14 km from the current terminus, ref. [13] measured a drastic acceleration (even exceeding the velocity measured at the terminus in 2014) for every year of their 30-year study period for this glacier. However, our measurements show a drastic slowdown in the velocity profile just in this area. At present, the two sample areas, which are in this part of the glacier, are moving at a velocity of only 200 myr−1. Comparing these sample areas to the previous sample area, the velocity declines by 1000 myr−1. On the other hand, comparing it to the next sample area, beyond these two slow-moving ones, the velocity rebounds by more than 1300 myr−1. We see the same difference if we compare our results to [40,44] works, except that in these two studies, the velocity profiles show that the velocities measured close to the terminus proved to be the fastest in all cases. Based on [13,40,44], we see a significant overall decrease in velocity across the entire velocity profile of the Jorge Montt Glacier, which may indicate a change in the TWC phase and a complete restructuring of the glacier dynamics.

5.3. The Effect of Calving on Velocity

In addition to the velocity profiles, the heatmaps also revealed further interesting information, mainly about the effect of calving on glacier termini. In several glaciers, a one-time or periodic acceleration was observed in areas close to the terminus, a phenomenon presumably caused by the calving process. The sudden acceleration event observed at the terminus of the Pío XI Glacier in the spring–summer period of 2019 is noteworthy (Figure 7) and has had a long-term effect in areas both near and far from the terminus. A total of 19 glaciers (nearly 30% of the glaciers studied) showed acceleration near the terminus, presumably due to the varying intensity of calving. Interestingly, of the 19 glaciers, only four are lake-terminating, while all the others are tidewater glaciers. Seven of these glaciers are characterized by continuous rapid movement at the terminus (Asia, Europa, Greve (Figure 8a–c), Jorge Montt (Figure 8b–d), O’Higgins, Upsala, and Viedma), occasionally interspersed with short periods of even faster movement.
It is interesting to examine the range of measured velocities, i.e., the difference between the fastest and slowest velocities of the sample areas of the aforementioned glaciers affected by FMAs at the glacier termini (Table 5). Range shows outstanding values in the case of Jorge Montt. The velocity heatmap also clearly shows the periodic velocity changes in the #1 to #4 sample areas of Jorge Montt. During the study period, we detected a velocity difference of 4230 myr−1 in sample area #1 and 3404 myr−1 in sample areas #2. The fastest measured velocity was 3322 myr−1 and 1505 myr−1 faster than the average velocity of the two sample areas during the whole study period. These facts point to the significant influence of the calving process on the velocity of Jorge Montt near the terminus, which has an effect on the glacier at almost regular intervals.

6. Conclusions

Our research demonstrated that glacier velocity across the Southern Patagonian Icefield (SPI) is highly variable, both spatially and temporally. We identified four different velocity profile types for these glaciers. Based on the velocity heatmaps (Supplementary Data Figure S1), a striking feature can be observed: the fluctuating rapid movement of glaciers near the terminus, which indicates the impact of calving on glacier movement. Tidewater glaciers are especially likely to speed up near their terminus, where the ice meets sea water and faces less resistance. This is essential for the largest glaciers, like Greve, Jorge Montt and Pío XI where bursts of velocity coincide with the release of icebergs. Glaciers that end on land or in lakes show fewer speed-ups, although four glaciers (SPI104, SPI204, Upsala and Viedma) proved to be an exception, as they sped up even though they end in a lake.
Topographic features like slope and aspect may also influence glacier velocity in general, but for SPI, these factors seemed to be much less important than calving. The only strong relationship we found was at Viedma Glacier, where faster movements were clearly linked with lower elevations. Some glaciers behaved very differently from the rest: for example, Pío XI Glacier suddenly sped up by over 3000 myr−1 in late 2019, which matched up with the breaking off of large chunks of ice into Greve Lake. Jorge Montt Glacier also sped up several times, even exceeding 4000 myr−1 simultaneously with regular calving events. These dramatic changes show how calving might destabilize glaciers.
Comparing our results to those of earlier studies covering longer periods, we found that velocity bursts became more frequent, suggesting that SPI is becoming less stable. Significant changes in velocity were also observed in some glaciers. One of the best examples is the drastic decrease in velocity at the Jorge Montt Glacier, where rapid acceleration was observed in previous studies (13–14 km from the terminus).
Nevertheless, our timescale was limited to 16 months, while some other studies covered decades. It is, therefore, an open question whether these changes are signs of a long-term shift in glacier operation or just parts of a short-lived phase. Our study demonstrated that high-resolution Sentinel-based observations can reveal detailed velocity patterns, such as spatially heterogeneous acceleration and the dominant role of calving.

Supplementary Materials

The following supporting information can be downloaded at: https://www.mdpi.com/article/10.3390/rs17223742/s1. Explanation of the supplementary data: Data Figure S1: Raw velocity maps; Heatmaps for all studied glaciers. Dataset Table S1: Raw velocity data in csv format from MATLAB R2023; Final table with the analyses and data for examined glaciers.

Author Contributions

V.J.: methodology, analyses, writing the manuscript, review and editing. T.T.: analyses, review and editing. Á.I.: research idea, methodology (velocity maps), review and editing. M.V.W.D.V.: analyses, review and editing. S.R.-P.: writing the manuscript, review and editing. L.M.: review and editing. B.N.: research idea, review and editing. All authors have read and agreed to the published version of the manuscript.

Funding

Research was supported by the National Research, Development and Innovation Office, Hungary (Grants NKFIH OTKA K147424). Fieldwork was supported by Tempus Public Foundation, Erasmus+ grant 2022-1-HU01-KA131-HED-000054740 (V.J.) and 22-1-KA131-000054740-STT605 (B.N.).

Data Availability Statement

The original data presented in the study are openly available in Zenodo repository (see Supplementary Materials).

Acknowledgments

The authors would like to thank the PermaChile Network and the Globe Foundation for making this international project possible. We are grateful to the Tempus Public Foundation for supporting two authors’ trips to Chile with an Erasmus+ grant. Author Viviána Jó would also like to thank Attila Ősi, Alexander Ősi and Ildikó Jó for their support in carrying out this research.

Conflicts of Interest

The authors declare no conflicts of interest.

Abbreviations

The following abbreviations are used in this manuscript:
SPISouthern Patagonian Icefield
FMAFast-moving area

References

  1. Aniya, M.; Shizukuishi, M.; Skvarca, P.; Casassa, G. Monitoring Recent Glacier Variations in the Southern Patagonia Icefield, Utilizing Remote Sensing Data. Int. Arch. Photogramm. Remote Sens. Spat. Inf. Sci. 1992, 29, 87–94. [Google Scholar]
  2. Barry, R.G. The Status of Research on Glaciers and Global Glacier Recession: A Review. Prog. Phys. Geogr. Earth Environ. 2006, 30, 285–306. [Google Scholar] [CrossRef]
  3. Vincent, C.; Soruco, A.; Six, D.; Meur, E.L. Glacier Thickening and Decay Analysis from 50 Years of Glaciological Observations Performed on Glacier d’Argentière, Mont Blanc Area, France. Ann. Glaciol. 2009, 50, 73–79. [Google Scholar] [CrossRef]
  4. Immerzeel, W.W.; Lutz, A.F.; Andrade, M.; Bahl, A.; Biemans, H.; Bolch, T.; Hyde, S.; Brumby, S.; Davies, B.J.; Elmore, A.C.; et al. Importance and Vulnerability of the World’s Water Towers. Nature 2020, 577, 364–369. [Google Scholar] [CrossRef] [PubMed]
  5. Mark, B.G.; Baraer, M.; Fernandez, A.; Immerzeel, W.; Moore, R.D.; Weingartner, R. Glaciers as Water Resources. In The High-Mountain Cryosphere: Environmental Changes and Human Risks; Kääb, A., Huggel, C., Clague, J.J., Carey, M., Eds.; Cambridge University Press: Cambridge, UK, 2015; pp. 184–203. ISBN 978-1-107-06584-0. [Google Scholar]
  6. Viviroli, D.; Dürr, H.H.; Messerli, B.; Meybeck, M.; Weingartner, R. Mountains of the World, Water Towers for Humanity: Typology, Mapping, and Global Significance. Water Resour. Res. 2007, 43. [Google Scholar] [CrossRef]
  7. Kinnard, C.; MacDonell, S.; Petlicki, M.; Martinez, C.M.; Abermann, J.; Urrutia, R. Mass Balance and Meteorological Conditions at Universidad Glacier, Central Chile. In Andean Hydrology; CRC Press: Boca Raton, FL, USA, 2018; pp. 102–126. [Google Scholar]
  8. Jó, V.; Van Wyk de Vries, M.; Ignéczi, Á.; Mari, L.; Nagy, B. Glacier Slowdown and Rapid Ice Loss in the Tinguiririca and Cachapoal Basin, Central Andes of Chile. Glob. Planet. Change 2023, 231, 104287. [Google Scholar] [CrossRef]
  9. Rivera, A.; Koppes, M.; Bravo, C.; Aravena, J.C. Little Ice Age Advance and Retreat of Glaciar Jorge Montt, Chilean Patagonia. Clim. Past 2012, 8, 403–414. [Google Scholar] [CrossRef]
  10. Watson, C.S.; Quincey, D. Glacier Movement. In Geomorphological Techniques (Online Edition); Clarke, L.E., Nield, J.M., Eds.; British Society for Geomorphology: London, UK, 2015. [Google Scholar]
  11. Cuffey, K.M.; Paterson, W.S.B. The Physics of Glaciers, 4th, ed.; Butterwoth-Heinemann and Elsevier: Oxford, UK, 2010; ISBN 978-0-12-369461-4. [Google Scholar]
  12. Jiskoot, H. Dynamics of Glaciers. In Encyclopedia of Snow, Ice and Glaciers; Springer: Dordrecht, The Netherlands, 2011; pp. 245–256. ISBN 978-90-481-2642-2. [Google Scholar]
  13. Mouginot, J.; Rignot, E. Ice Motion of the Patagonian Icefields of South America: 1984–2014. Geophys. Res. Lett. 2015, 42, 1441–1449. [Google Scholar] [CrossRef]
  14. Joughin, I.; Abdalati, W.; Fahnestock, M. Large Fluctuations in Speed on Greenland’s Jakobshavn Isbræ Glacier. Nature 2004, 432, 608–610. [Google Scholar] [CrossRef]
  15. Schaefer, M.; Machguth, H.; Falvey, M.; Casassa, G.; Rignot, E. Quantifying Mass Balance Processes on the Southern Patagonia Icefield. Cryosphere 2015, 9, 25–35. [Google Scholar] [CrossRef]
  16. Frezzotti, M.; Capra, A.; Vittuari, L. Comparison between Glacier Ice Velocities Inferred from GPS and Sequential Satellite Images. Ann. Glaciol. 1998, 27, 54–60. [Google Scholar] [CrossRef]
  17. Ahn, Y.; Howat, I.M. Efficient Automated Glacier Surface Velocity Measurement From Repeat Images Using Multi-Image/Multichip and Null Exclusion Feature Tracking. IEEE Trans. Geosci. Remote Sens. 2011, 49, 2838–2846. [Google Scholar] [CrossRef]
  18. Rolstad, C.; Amlien, J.; Hagen, J.-O.; Lundén, B. Visible and Near-Infrared Digital Images for Determination of Ice Velocities and Surface Elevation during a Surge on Osbornebreen, a Tidewater Glacier in Svalbard. Ann. Glaciol. 1997, 24, 255–261. [Google Scholar] [CrossRef]
  19. Mohr, J.J.; Reeh, N.; Madsen, S.N. Three-Dimensional Glacial Flow and Surface Elevation Measured with Radar Interferometry. Nature 1998, 391, 273–276. [Google Scholar] [CrossRef]
  20. Csathó, B.M.; Bolzan, J.F.; van der Veen, C.J.; Schenk, A.F.; Lee, D. Surface Velocities of a Greenland Outlet Glacier from High-resolution Visible Satellite Imagery 1. Polar Geogr. 1999, 23, 71–82. [Google Scholar] [CrossRef]
  21. Bamber, J.L.; Vaughan, D.G.; Joughin, I. Widespread Complex Flow in the Interior of the Antarctic Ice Sheet. Science 2000, 287, 1248–1250. [Google Scholar] [CrossRef]
  22. Luckman, A.; Murray, T.; Jiskoot, H.; Pritchard, H.; Strozzi, T. ERS SAR Feature-Tracking Measurement of Outlet Glacier Velocities on a Regional Scale in East Greenland. Ann. Glaciol. 2003, 36, 129–134. [Google Scholar] [CrossRef]
  23. Short, N.H.; Gray, A.L. Potential for RADARSAT-2 Interferometry: Glacier Monitoring Using Speckle Tracking. Can. J. Remote Sens. 2004, 30, 504–509. [Google Scholar] [CrossRef]
  24. Liu, H.; Zhao, Z.; Jezek, K.C. Synergistic Fusion of Interferometric and Speckle-Tracking Methods for Deriving Surface Velocity From Interferometric SAR Data. IEEE Geosci. Remote Sens. Lett. 2007, 4, 102–106. [Google Scholar] [CrossRef]
  25. Wang, Z.; Gao, T.; Kang, Y.; Guo, W.; Jiang, Z. Glacier Surface Velocity Variations in the West Kunlun Mts. with Sentinel-1A Image Feature-Tracking (2014–2023). Remote Sens. 2024, 16, 63. [Google Scholar] [CrossRef]
  26. Li, G.; Mao, Y.; Feng, X.; Chen, Z.; Yang, Z.; Cheng, X. Monitoring Ice Flow Velocity of Petermann Glacier Combined with Sentinel-1 and -2 Imagery. Int. J. Appl. Earth Obs. Geoinf. 2023, 121, 103374. [Google Scholar] [CrossRef]
  27. Wilson, R.; Mernild, S.H.; Malmros, J.K.; Bravo, C.; Carrión, D. Surface Velocity Fluctuations for Glaciar Universidad, Central Chile, between 1967 and 2015. J. Glaciol. 2016, 62, 847–860. [Google Scholar] [CrossRef]
  28. Aniya, M.; Sato, H.; Naruse, R.; Skvarca, P.; Casassa, G. Recent Glacier Variations in the Southern Patagonia Icefield, South America. Arct. Alp. Res. 1997, 29, 1–12. [Google Scholar] [CrossRef]
  29. Aniya, M.; Dhakal, A.S.; Park, S.; Naruse, R. Variations of Patagonian Glaciers, South America, Using RADARSAT and Landsat Images. Can. J. Remote Sens. 2000, 26, 501–511. [Google Scholar] [CrossRef]
  30. Clapperton, C.M. The Glaciation of the Andes. Quat. Sci. Rev. 1983, 2, 83–155. [Google Scholar] [CrossRef]
  31. Nichols, R.L.; Miller, M.M. The Moreno Glacier, Lago Argentino, Patagonia: Advancing Glaciers and Nearby Simultaneously Retreating Glaciers. J. Glaciol. 1952, 2, 41–52. [Google Scholar] [CrossRef]
  32. Mercer, J.H. Advance of a Patagonian Glacier. J. Glaciol. 1964, 5, 267–268. [Google Scholar] [CrossRef]
  33. Mercer, J.H. Glacier Variations in Southern Patagonia. Geogr. Rev. 1965, 55, 390–413. [Google Scholar] [CrossRef]
  34. Mercer, J.H. Variations of Some Patagonian Glaciers since the Late-Glacial. Am. J. Sci. 1968, 266, 91–109. [Google Scholar] [CrossRef]
  35. Rivera, A.; Corripio, J.; Bravo, C.; Cisternas, S. Glaciar Jorge Montt (Chilean Patagonia) Dynamics Derived from Photos Obtained by Fixed Cameras and Satellite Image Feature Tracking. Ann. Glaciol. 2012, 53, 147–155. [Google Scholar] [CrossRef]
  36. Farr, T.G.; Kobrick, M. Shuttle Radar Topography Mission Produces a Wealth of Data. Eos Trans. Am. Geophys. Union 2000, 81, 583–585. [Google Scholar] [CrossRef]
  37. Braun, M.H.; Malz, P.; Sommer, C.; Farías-Barahona, D.; Sauter, T.; Casassa, G.; Soruco, A.; Skvarca, P.; Seehaus, T.C. Constraining Glacier Elevation and Mass Changes in South America. Nat. Clim. Change 2019, 9, 130–136. [Google Scholar] [CrossRef]
  38. Glasser, N.F.; Harrison, S.; Jansson, K.N.; Anderson, K.; Cowley, A. Global Sea-Level Contribution from the Patagonian Icefields since the Little Ice Age Maximum. Nat. Geosci. 2011, 4, 303–307. [Google Scholar] [CrossRef]
  39. Rignot, E.; Rivera, A.; Casassa, G. Contribution of the Patagonia Icefields of South America to Sea Level Rise. Science 2003, 302, 434–437. [Google Scholar] [CrossRef] [PubMed]
  40. Bown, F.; Rivera, A.; Pętlicki, M.; Bravo, C.; Oberreuter, J.; Moffat, C. Recent Ice Dynamics and Mass Balance of Jorge Montt Glacier, Southern Patagonia Icefield. J. Glaciol. 2019, 65, 732–744. [Google Scholar] [CrossRef]
  41. Minowa, M.; Schaefer, M.; Skvarca, P. Effects of Topography on Dynamics and Mass Loss of Lake-Terminating Glaciers in Southern Patagonia. J. Glaciol. 2023, 69, 1580–1597. [Google Scholar] [CrossRef]
  42. Floricioiu, D.; Eineder, M.; Rott, H.; Nagler, T. Velocities of Major Outlet Glaciers of the Patagonia Icefield Observed by TerraSAR-X. In Proceedings of the IGARSS 2008—2008 IEEE International Geoscience and Remote Sensing Symposium, Boston, MA, USA, 6 July 2008; Volume 4, pp. IV-347–IV-350. [Google Scholar]
  43. Muto, M.; Furuya, M. Surface Velocities and Ice-Front Positions of Eight Major Glaciers in the Southern Patagonian Ice Field, South America, from 2002 to 2011. Remote Sens. Environ. 2013, 139, 50–59. [Google Scholar] [CrossRef]
  44. Sakakibara, D.; Sugiyama, S. Ice-Front Variations and Speed Changes of Calving Glaciers in the Southern Patagonia Icefield from 1984 to 2011. J. Geophys. Res. Earth Surf. 2014, 119, 2541–2554. [Google Scholar] [CrossRef]
  45. Millan, R.; Mouginot, J.; Rabatel, A.; Morlighem, M. Ice Velocity and Thickness of the World’s Glaciers. Nat. Geosci. 2022, 15, 124–129. [Google Scholar] [CrossRef]
  46. Millan, R.; Mouginot, J.; Rabatel, A. Ice Velocity and Thickness of the World’s Glaciers [Dataset]. Available online: https://www.sedoo.fr/theia-publication-products/?uuid=55acbdd5-3982-4eac-89b2-46703557938c (accessed on 6 November 2025).
  47. Tuckett, P.A.; Ely, J.C.; Sole, A.J.; Livingstone, S.J.; Davison, B.J.; Melchior van Wessem, J.; Howard, J. Rapid Accelerations of Antarctic Peninsula Outlet Glaciers Driven by Surface Melt. Nat. Commun. 2019, 10, 4311. [Google Scholar] [CrossRef]
  48. Ciappa, A.; Pietranera, L.; Battazza, F. Perito Moreno Glacier (Argentina) Flow Estimation by COSMO SkyMed Sequence of High-Resolution SAR-X Imagery. Remote Sens. Environ. 2010, 114, 2088–2096. [Google Scholar] [CrossRef]
  49. Euillades, L.D.; Euillades, P.A.; Riveros, N.C.; Masiokas, M.H.; Ruiz, L.; Pitte, P.; Elefante, S.; Casu, F.; Balbarani, S. Detection of Glaciers Displacement Time-Series Using SAR. Remote Sens. Environ. 2016, 184, 188–198. [Google Scholar] [CrossRef]
  50. Floricioiu, D.; Eineder, M.; Rott, H.; Yagüe-Martinez, N.; Nagler, T. Surface Velocity and Variations of Outlet Glaciers of the Patagonia Icefields by Means of TerraSAR-X. In Proceedings of the 2009 IEEE International Geoscience and Remote Sensing Symposium, Cape Town, South Africa, 12 July 2009; Volume 2, pp. II-1028–II-1031. [Google Scholar]
  51. Lo Vecchio, A.; Lenzano, M.G.; Durand, M.; Lannutti, E.; Bruce, R.; Lenzano, L. Estimation of Surface Flow Speed and Ice Surface Temperature from Optical Satellite Imagery at Viedma Glacier, Argentina. Glob. Planet. Change 2018, 169, 202–213. [Google Scholar] [CrossRef]
  52. Moragues, S.; Gabriela Lenzano, M.; Moreiras, S.; Vecchio, A.L.; Lannutti, E.; Lenzano, L. Slope Instability Analysis in South Patagonia Applying Multivariate and Bivariate Techniques on Landsat Images during 2001–2015 Period. CATENA 2019, 174, 339–352. [Google Scholar] [CrossRef]
  53. Riveros, N.; Euillades, L.; Euillades, P.; Moreiras, S.; Balbarani, S. Offset Tracking Procedure Applied to High Resolution SAR Data on Viedma Glacier, Patagonian Andes, Argentina. Adv. Geosci. 2013, 35, 7–13. [Google Scholar] [CrossRef]
  54. Rott, H.; Stuefer, M.; Siegel, A.; Skvarca, P.; Eckstaller, A. Mass Fluxes and Dynamics of Moreno Glacier, Southern Patagonia Icefield. Geophys. Res. Lett. 1998, 25, 1407–1410. [Google Scholar] [CrossRef]
  55. Sakakibara, D.; Sugiyama, S.; Sawagaki, T.; Marinsek, S.; Skvarca, P. Rapid Retreat, Acceleration and Thinning of Glaciar Upsala, Southern Patagonia Icefield, Initiated in 2008. Ann. Glaciol. 2013, 54, 131–138. [Google Scholar] [CrossRef]
  56. Skvarca, P.; Raup, B.; Angelis, H. de Recent Behaviour of Glaciar Upsala, a Fast-Flowing Calving Glacier in Lago Argentino, Southern Patagonia. Ann. Glaciol. 2003, 36, 184–188. [Google Scholar] [CrossRef]
  57. Amundson, J.M.; Truffer, M.; Zwinger, T. Tidewater Glacier Response to Individual Calving Events. J. Glaciol. 2022, 68, 1117–1126. [Google Scholar] [CrossRef]
  58. Frank, T.; Åkesson, H.; de Fleurian, B.; Morlighem, M.; Nisancioglu, K.H. Geometric Controls of Tidewater Glacier Dynamics. Cryosphere 2022, 16, 581–601. [Google Scholar] [CrossRef]
  59. Post, A. Preliminary Hydrography and Historic Terminal Changes of Columbia Glacier, Alaska; U.S. Geological Survey: Reston, VA, USA, 1975.
  60. Masiokas, M.H.; Rabatel, A.; Rivera, A.; Ruiz, L.; Pitte, P.; Ceballos, J.L.; Barcaza, G.; Soruco, A.; Bown, F.; Berthier, E.; et al. A Review of the Current State and Recent Changes of the Andean Cryosphere. Front. Earth Sci. 2020, 8, 99. [Google Scholar] [CrossRef]
  61. Post, A.; O’Neel, S.; Motyka, R.J.; Streveler, G. A Complex Relationship between Calving Glaciers and Climate. Eos Trans. Am. Geophys. Union 2011, 92, 305–306. [Google Scholar] [CrossRef]
  62. Lannutti, E.; Lenzano, M.G.; Vacaflor, P.; Rivera, A.; Moragues, S.; Gentile, M.; Lenzano, L. Ice Thickness Distribution and Stability of Three Large Freshwater Calving Glaciers on the Eastern Side of the Southern Patagonian Icefield. Cold Reg. Sci. Technol. 2024, 221, 104158. [Google Scholar] [CrossRef]
  63. Hugonnet, R.; McNabb, R.; Berthier, E.; Menounos, B.; Nuth, C.; Girod, L.; Farinotti, D.; Huss, M.; Dussaillant, I.; Brun, F.; et al. Accelerated Global Glacier Mass Loss in the Early Twenty-First Century. Nature 2021, 592, 726–731. [Google Scholar] [CrossRef] [PubMed]
  64. Carrivick, J.L.; Davies, M.; Wilson, R.; Davies, B.J.; Gribbin, T.; King, O.; Rabatel, A.; García, J.-L.; Ely, J.C. Accelerating Glacier Area Loss Across the Andes Since the Little Ice Age. Geophys. Res. Lett. 2024, 51, e2024GL109154. [Google Scholar] [CrossRef]
  65. Hock, R.; Bliss, A.; Marzeion, B.; Giesen, R.H.; Hirabayashi, Y.; Huss, M.; Radić, V.; Slangen, A.B.A. GlacierMIP—A Model Intercomparison of Global-Scale Glacier Mass-Balance Models and Projections. J. Glaciol. 2019, 65, 453–467. [Google Scholar] [CrossRef]
  66. Muñoz, F. Policy Brief CR2|Gobernanza de datos climáticos: Conectando datos para la acción climática; Centro de Ciencia del Clima y la Resiliencia—CR2: Santiago, Chile, 2025. [Google Scholar]
  67. Laporte-Bisquit, A. WWF Water Risk Filter: Assess, Respond & Value Water Risks. In Sustainable Industrial Water Use: Perspectives, Incentives, and Tools; IWA Publishing: London, UK, 2021; pp. 321–331. [Google Scholar]
  68. Sandwell, D.; Mellors, R.; Tong, X.; Wei, M.; Wessel, P. GMTSAR: An InSAR Processing System Based on Generic Mapping Tools; Scripps Institution of Oceanography Technical Report; UC: San Diego, CA, USA, 2011. [Google Scholar]
  69. RGI Consortium Randolph Glacier Inventory—A Dataset of Global Glacier Outlines, Version 6. 2017. Available online: https://www.glims.org/RGI/randolph60.html (accessed on 6 November 2025).
  70. Davis, J.C. Statistics and Data Analysis in Geology, 3rd, ed.; Wiley: New York, NY, USA, 2002. [Google Scholar]
  71. Crameri, F. Scientific Colour Maps. Available online: https://zenodo.org/records/5501399 (accessed on 14 September 2025).
  72. Hubbard, B.; Nienow, P. Alpine Subglacial Hydrology. Quat. Sci. Rev. 1997, 16, 939–955. [Google Scholar] [CrossRef]
  73. Copland, L.; Sharp, M.J.; Nienow, P.W. Links between Short-Term Velocity Variations and the Subglacial Hydrology of a Predominantly Cold Polythermal Glacier. J. Glaciol. 2003, 49, 337–348. [Google Scholar] [CrossRef]
  74. Hoffman, M.; Price, S. Feedbacks between Coupled Subglacial Hydrology and Glacier Dynamics. J. Geophys. Res. Earth Surf. 2014, 119, 414–436. [Google Scholar] [CrossRef]
  75. Kyrke-Smith, T.M.; Katz, R.F.; Fowler, A.C. Subglacial Hydrology and the Formation of Ice Streams. Proc. R. Soc. Math. Phys. Eng. Sci. 2014, 470, 20130494. [Google Scholar] [CrossRef]
  76. Slater, D.A.; Nienow, P.W.; Cowton, T.R.; Goldberg, D.N.; Sole, A.J. Effect of Near-Terminus Subglacial Hydrology on Tidewater Glacier Submarine Melt Rates. Geophys. Res. Lett. 2015, 42, 2861–2868. [Google Scholar] [CrossRef]
  77. Sole, A.J.; Mair, D.W.F.; Nienow, P.W.; Bartholomew, I.D.; King, M.A.; Burke, M.J.; Joughin, I. Seasonal Speedup of a Greenland Marine-Terminating Outlet Glacier Forced by Surface Melt–Induced Changes in Subglacial Hydrology. J. Geophys. Res. Earth Surf. 2011, 116. [Google Scholar] [CrossRef]
  78. Davison, B.J.; Sole, A.J.; Livingstone, S.J.; Cowton, T.R.; Nienow, P.W. The Influence of Hydrology on the Dynamics of Land-Terminating Sectors of the Greenland Ice Sheet. Front. Earth Sci. 2019, 7, 10. [Google Scholar] [CrossRef]
  79. Sugiyama, S.; Skvarca, P.; Naito, N.; Enomoto, H.; Tsutaki, S.; Tone, K.; Marinsek, S.; Aniya, M. Ice Speed of a Calving Glacier Modulated by Small Fluctuations in Basal Water Pressure. Nat. Geosci. 2011, 4, 597–600. [Google Scholar] [CrossRef]
  80. Lenzano, M.G.; Lannutti, E.; Toth, C.; Rivera, A.; Lenzano, L. Detecting Glacier Surface Motion by Optical Flow. Photogramm. Eng. Remote Sens. 2018, 84, 33–42. [Google Scholar] [CrossRef]
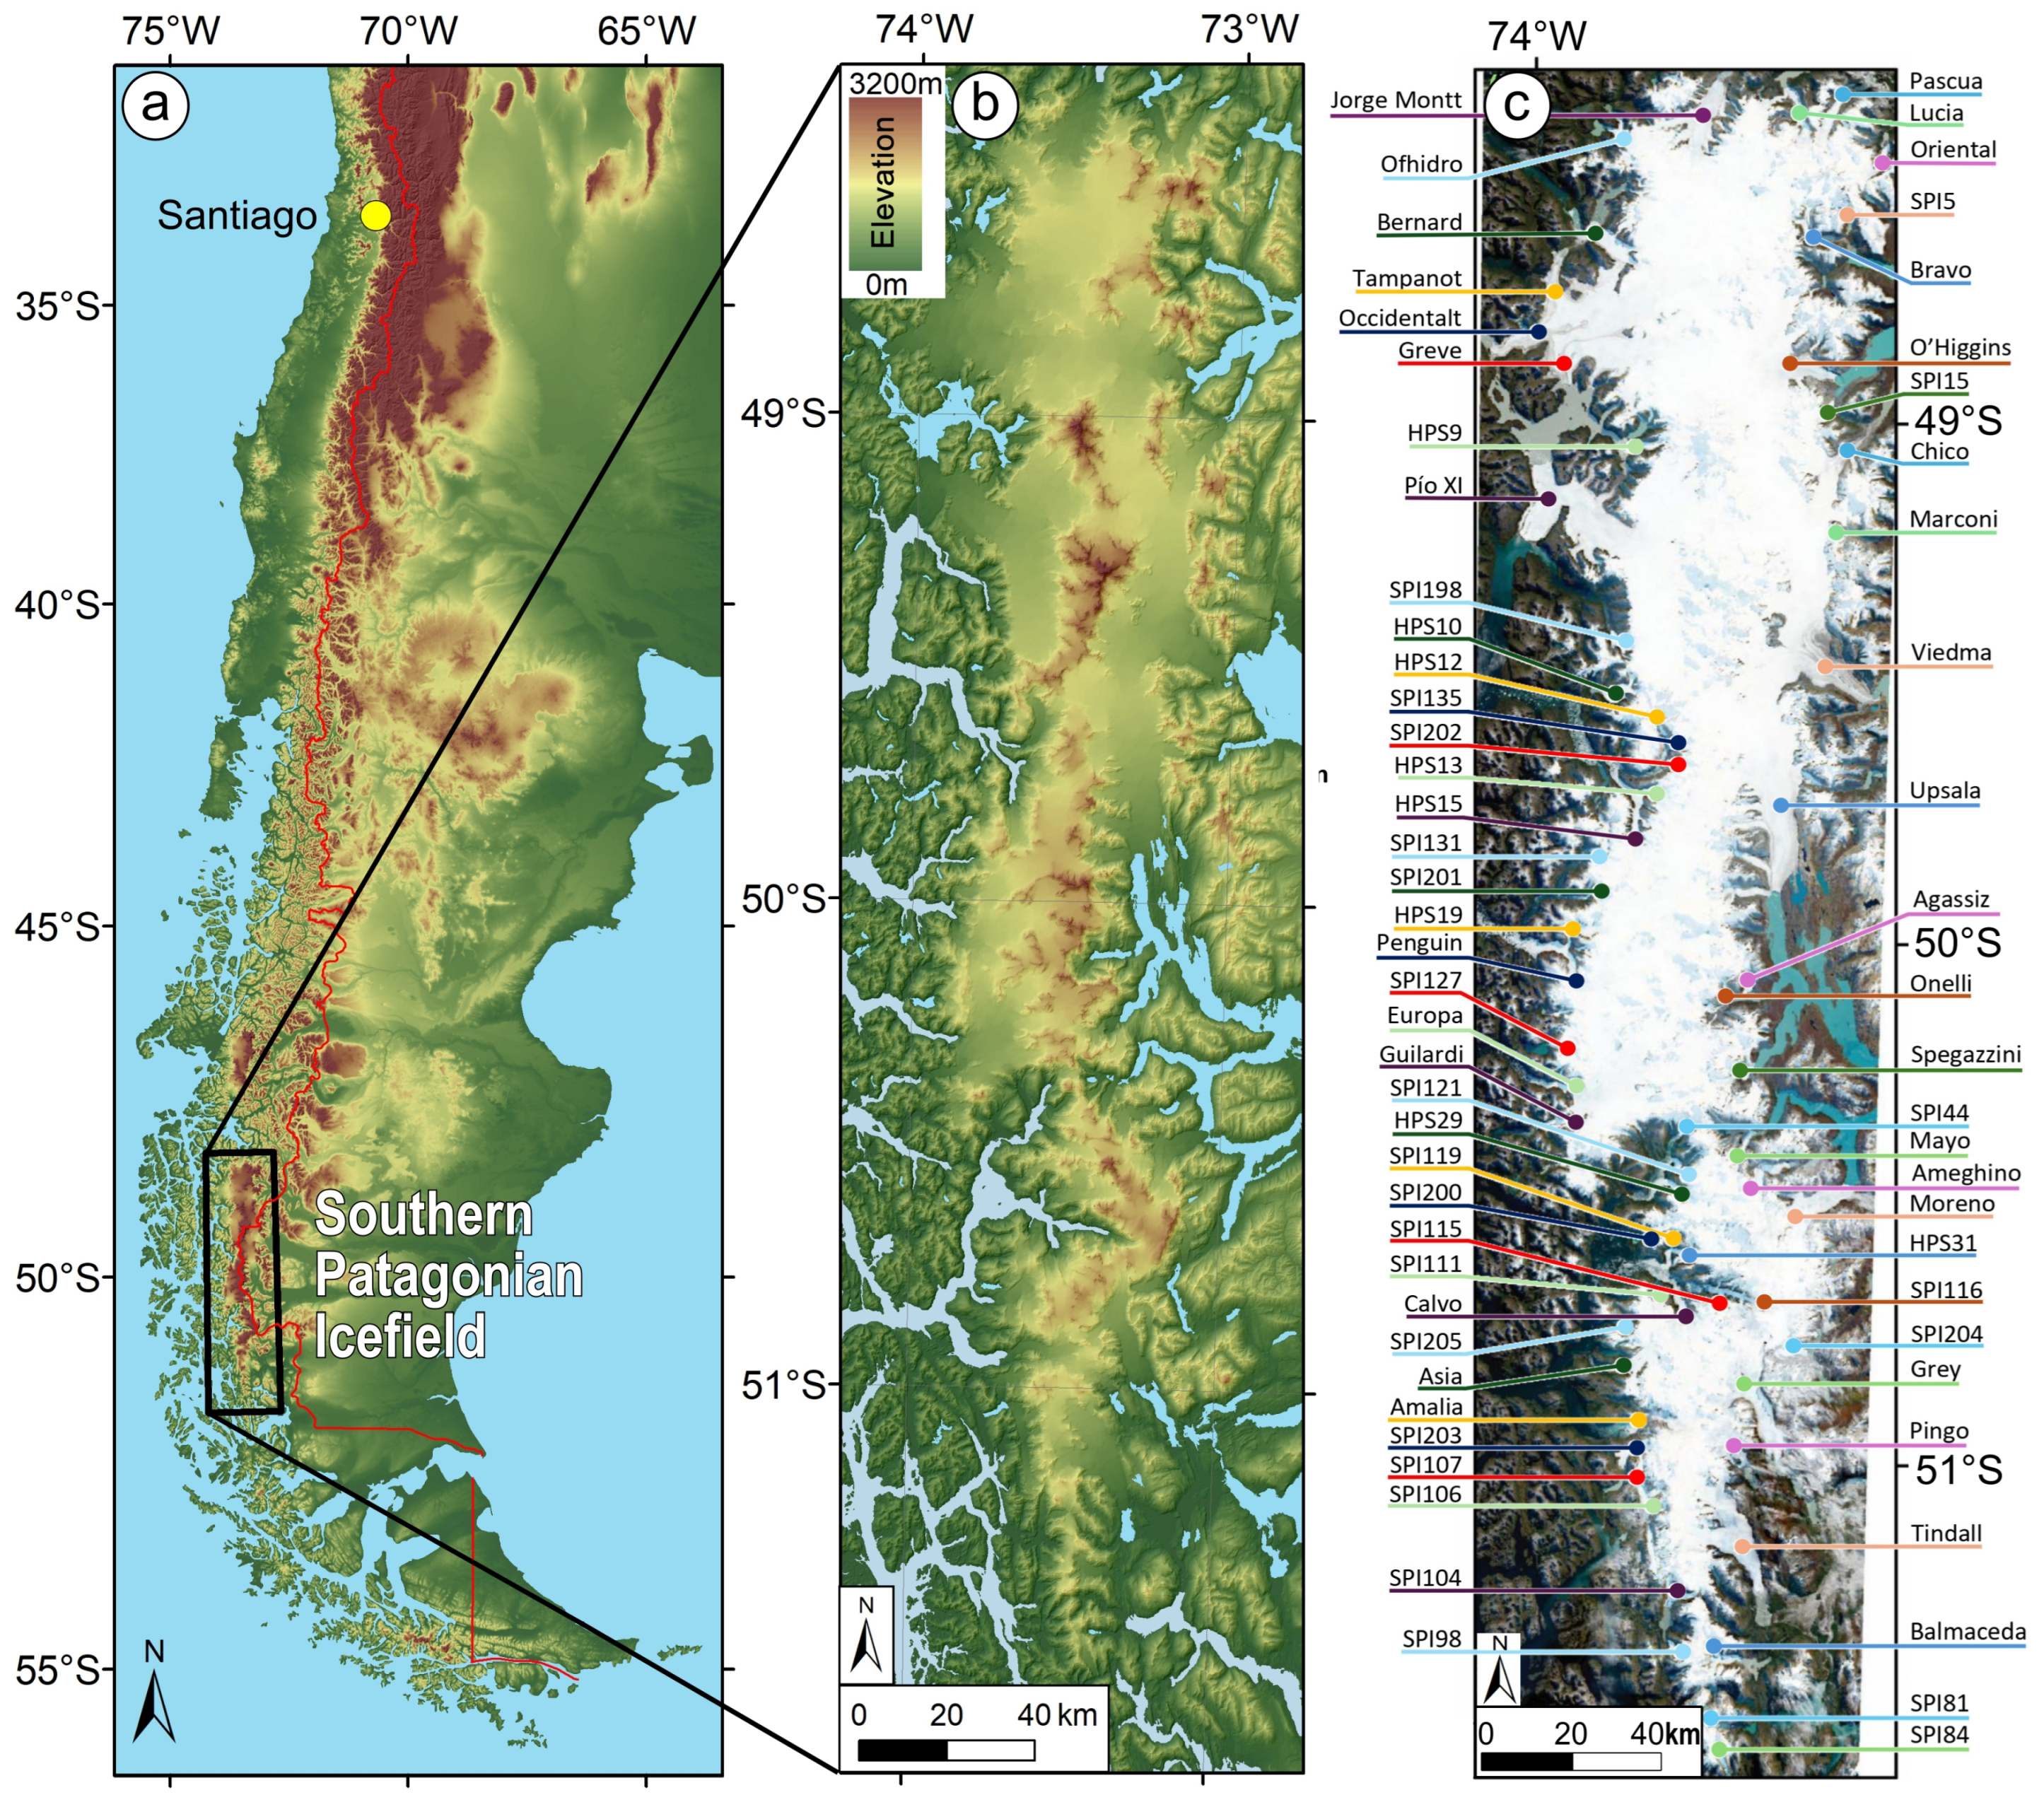
Figure 1. (a) Location of the study area in the Southern Andes, red line indicates the national border between Chile and Argentina. (b) Topography of the SPI; data: SRTM 30 m resolution topography model [36]. (c) The Southern Patagonian Icefield study area, with all 64 glaciers studied; background: Sentinel-2A (from Copernicus, date: 5 May 2020).
Remotesensing 17 03742 g001
Figure 2. (a) Termini of the glaciers of the SPI: Grey Glacier and Grey Lake (Lago Grey)—shooting time: 5 March 2024. (b) Moreno Glacier—shooting time: 6 January 2025. (c) Spegazzini Glacier and Argentino Lake (Lago Argentino)—shooting time: 21 October 2008. Photos: Balázs Nagy.
Remotesensing 17 03742 g002
Figure 3. Velocity map (displayed in a transparent colour scale ranging from blue to red) of the northern part of the SPI for dates 15–27 November 2019. The maximum velocity during this period for this area was 4700 myr−1. Black squares indicate sample area locations. There are no velocity data available for white areas (higher areas covered with snow) and areas covered with water (sea or lake). Dark blue areas indicate 0 myr−1 velocity (mostly snow-covered areas or uncovered rock surfaces). Background: Sentinel-2A (from Copernicus, date: 5 May 2020).
Remotesensing 17 03742 g003
Figure 4. Velocity map (displayed on a transparent colour scale ranging from blue to red) of the southern part of the SPI for 17–29 October 2019. The maximum velocity during this period for this area was 4500 myr−1. Black squares indicate sample area locations. There are no velocity data available for white areas (higher areas covered with snow) and areas covered with water (sea or lake). Dark blue areas indicate 0 myr−1 velocity (mostly snow-covered areas or uncovered rock surfaces). Background: Sentinel-2A (from Copernicus, date: 5 May 2020).
Remotesensing 17 03742 g004
Figure 7. Velocity acceleration of the Pío XI Glacier. (af) show Sentinel-2 true colour images of the glacier terminus before, during, and after the velocity acceleration (green line marks the terminus of the glacier). Dates: (a) 19 August 2019; (b) 3 October 2019; (c) 13 October 2019; (d) 28 October 2019; (e) 12 November 2019; (f) 10 February 2020. The black squares in (a) show the first four sample areas of the Pío XI Glacier, most affected by the velocity ac-celeration. The oval green circle in (d) shows the icebergs appearing in Greve Lake. (g) shows the heatmap of the glacier velocity. Red rectangle indicates the area and period of velocity acceleration. Source of the Sentinel-2 satellite images: Copernicus, https://browser.dataspace.copernicus.eu/ (accessed on 15 July 2025).
Remotesensing 17 03742 g007
Figure 8. Heatmaps of the Greve (a) and Jorge Montt (b) glaciers. Sentinel-2 true colour images of the Greve (c) and Jorge Montt (d) glaciers after an acceleration period (green line marks the termini of the glaciers). Blue rectangle indicates the zone and period affected by acceleration (like the Pío XI Glacier) observed on the Greve Glacier, satellite picture date: 1 November 2020. Red square indicates the zone of periodic acceleration and deceleration on the Jorge Montt, satellite picture date: 13 October 2019. Red and yellow circles show the large number of icebergs in the fjords after the acceleration periods. Source of the Sentinel-2 satellite images: Copernicus, https://browser.dataspace.copernicus.eu/ (accessed on 15 July 2025).
Remotesensing 17 03742 g008
Table 2. List of the 64 studied glaciers, their area (km2) and the number of sample areas.
Glacier Name or ID *Number of Sample AreasGlacier Area (km2) ** Glacier Name or ID *Number of Sample AreasGlacier Area (km2) **
1.Agassiz Bolados777.7033.Pingo853.31
2.Amalia14154.9634.Pío XI401244.77
3.Ameghino1262.2735.Snowy318.22
4.Asia16114.5536.Spegazzini1316.33
5.Balmaceda850.4037.SPI5631.68
6.Bernard21509.7338.SPI15726.55
7.Bravo989.7039.SPI44534.90
8.Calvo27149.0140.SPI81310.71
9.Chico20305.1641.SPI84718.04
10.Europa27409.4742.SPI98312.82
11.Greve32434.3043.SPI104454.81
12.Grey31232.1444.SPI106649.85
13.Guilardi25165.5845.SPI107764.51
14.HPS91348.6046.SPI111417.74
15.HPS10967.6147.SPI115419.03
16.HPS12534.1348.SPI11696.08
17.HPS131414.0749.SPI119319.31
18.HPS157103.0950.SPI1211053.31
19.HPS191111.9451.SPI127522.79
20.HPS291381.5852.SPI131753.11
21.HPS3115160.0153.SPI135557.89
22.Jorge Montt21495.5754.SPI198631.50
23.Lucia17146.4355.SPI200418.82
24.Mayo1239.9056.SPI201440.97
25.Moreno23256.1357.SPI202521.37
26.Occidentalt22203.0558.SPI203947.17
27.Ofhidro1572.7459.SPI204857.24
28.Ohiggins17762.3260.SPI205331.69
29.Onelli543.8861.Tampanot31315.34
30.Oriental1146.7062.Tindall18302.87
31.Pascua1372.0463.Upsala49792.95
32.Penguin30460.8164.Viedma28884.32
* From Randolph Glacier Inventory version 6.0 [69]; ** From Randolph Glacier Inventory version 6.0 [69] using the latest area estimation.
Table 3. Minimum, maximum and range of velocity measured on each glacier, with possible calving effect on velocity.
GlacierMinimum
Velocity
(myr−1)
Maximum
Velocity
(myr−1)
Range of
Velocity
(myr−1)
Terminus Ends InCalving
Effect
Agassiz Bolados84.96436.39351.43proglacial lake
Amalia161.50871.60710.10tidewaterX
Ameghino139.42616.54477.12proglacial lake
Asia237.55868.69631.14tidewaterX
Balmaceda122.72248.70125.98proglacial lake
Bernard45.24792.54747.30tidewater
Bravo101.98313.05211.08proglacial lake
Calvo45.112092.982047.87tidewater
Chico64.20259.25195.05tidewater
Europa44.911642.431597.52tidewaterX
Greve191.091334.821143.72tidewaterX
Grey171.52686.11514.59proglacial lake
Guilardi72.73348.91276.19proglacial lake
HPS10117.49746.67629.18proglacial lake
HPS1224.14715.26691.11tidewater
HPS1339.592793.922754.33tidewater
HPS15119.131655.921536.79tidewaterX
HPS1977.321448.921371.60tidewater
HPS29152.722518.542365.82tidewaterX
HPS31113.711759.891646.18tidewaterX
HPS9179.47780.18600.71tidewater
Jorge Montt202.302263.992061.70tidewaterX
Lucia254.51673.17418.66proglacial lake
Mayo105.14355.86250.72proglacial lake
Moreno190.551147.74957.19proglacial lake
Occidentalt120.69350.56229.88tidewaterX
Ofhidro83.43474.99391.56proglacial lake
OHiggins44.732685.562640.84tidewaterX
Onelli66.47182.21115.74tidewaterX
Oriental68.46756.80688.34proglacial lake
Pascua27.98173.93145.95proglacial lake
Penguin52.546491.056438.51tidewater
Pingo42.50601.71559.21proglacial lake
Pío XI198.081499.231301.15tidewaterX
Snowy42.44226.86184.43proglacial lake
Spegazzini199.69839.27639.59proglacial lake
SPI104229.62545.00315.39proglacial lakeX
SPI10643.9485.9542.01proglacial lake
SPI107138.71622.56483.85proglacial lake
SPI11166.9695.4928.53tidewater
SPI115266.84582.50315.66tidewaterX
SPI11664.22687.16622.94tidewater
SPI11955.0983.5928.50tidewater
SPI12149.841858.631808.79tidewater
SPI127119.89184.7264.83proglacial lake
SPI13173.20827.65754.45tidewater
SPI135184.51833.01648.50tidewater
SPI1546.72766.46719.75proglacial lake
SPI19889.91366.02276.11proglacial lake
SPI20077.01124.1147.10tidewater
SPI20183.95738.10654.14tidewaterX
SPI202192.83502.38309.54tidewaterX
SPI20349.05365.04315.98proglacial lake
SPI204187.40707.83520.43proglacial lakeX
SPI20576.54183.59107.05proglacial lake
SPI4465.06408.94343.87tidewater
SPI551.83200.16148.33proglacial lake
SPI8150.99190.55139.57proglacial lake
SPI8430.21164.27134.06proglacial lake
SPI9866.32118.1851.86proglacial lake
Tampanot160.09774.94614.84tidewater
Tindall210.12404.37194.25proglacial lake
Upsala106.151331.901225.75proglacial lakeX
Viedma59.601320.951261.35proglacial lakeX
Table 4. Distribution of glacier types according to their velocity profile and extent (the numbers in the table indicate the number of glaciers in each category).
Increasing Velocity ProfileDecreasing
Velocity
Profile
Single-Peak Velocity
Profile
Multiple-Peak Velocity
Profile
ab
Glaciers > 100 km2852189
Glaciers < 100 km2002614
Table 5. The maximum, minimum, range, mean and maximum-mean of velocity of Asia, Europa, Greve, Jorge Montt, O’Higgins, Upsala and Viedma glaciers for sample areas affected by calving.
Sample AreasVelocity (myr−1)
MaximumMinimumRangeMeanMax-Mean
Asia_11108.83438.47670.36868.69240.14
Asia_2721.94527.63194.31626.5495.40
Asia_3895.28619.68275.60798.0297.26
Europa_1109.618.93100.6844.9164.70
Europa_21832.24917.53914.721523.17309.07
Europa_31797.391404.00393.381642.43154.96
Europa_41303.181007.06296.131185.63117.55
Greve_11759.041059.98699.061334.82424.22
Greve_21415.06980.49434.581138.63276.43
Greve_31026.35771.37254.98880.88145.46
Greve_4762.29477.65284.65585.50176.80
JorgeMontt_14369.47139.944229.531047.713321.76
JorgeMontt_23768.96364.783404.182263.991504.97
JorgeMontt_33176.241304.991871.261963.991212.26
JorgeMontt_42512.151216.091296.061743.35768.79
OHiggins_43153.7373.143080.58951.252202.48
OHiggins_53007.501142.221865.272685.56321.93
OHiggins_62959.151372.701586.452659.32299.83
OHiggins_72584.552027.06557.492214.23370.32
Upsala_11674.50783.31891.191331.90342.60
Upsala_21473.38951.50521.871161.13312.25
Upsala_31170.05561.94608.11922.38247.67
Viedma_11819.161007.03812.121320.95498.20
Viedma_21114.44878.96235.481003.64110.81
Disclaimer/Publisher’s Note: The statements, opinions and data contained in all publications are solely those of the individual author(s) and contributor(s) and not of MDPI and/or the editor(s). MDPI and/or the editor(s) disclaim responsibility for any injury to people or property resulting from any ideas, methods, instructions or products referred to in the content.