Article

Evaluation of the flagGraupelHail Product from Dual-Frequency Precipitation Radar Onboard the Global Precipitation Measurement Core Observatory Using Multi-Parameter Phased Array Weather Radar

by
Nobuhiro Takahashi
1,* and
Tomoki Kosaka
2
1
Institute for Space–Earth Environmental Research, Nagoya University, Nagoya 464-8601, Japan
2
Graduate School of Environmental Studies, Nagoya University, Nagoya 464-8601, Japan
*
Author to whom correspondence should be addressed.
Remote Sens. 2025, 17(22), 3741; https://doi.org/10.3390/rs17223741
Submission received: 31 August 2025 / Revised: 10 November 2025 / Accepted: 14 November 2025 / Published: 17 November 2025

Highlights

What are the main findings?
  • The flagGraupelHail product of the GPM/DPR can be improved by incorporating storm-top height information based on an evaluation using Multi-Parameter Phased Array Weather Radar (MP-PAWR) for convective precipitation over a high-humidity region (Japan).
  • The new volume-matching method using MP-PAWR showed good performance, and it is suitable for hydrometeor type comparison.
What are the implications of the main findings?
  • This evaluation suggests a potential improvement in global graupel/hail distribution estimates derived from spaceborne radar.
  • Phased Array Weather Radar data combined with the new volume-matching method enables evaluation of precipitation properties within the observation volume of spaceborne radar.

Abstract

A major scientific challenge is understanding how precipitation systems will change under global warming. In particular, extreme precipitation events associated with hail and graupel are of significant concern. In this study, we evaluated the performance of the flagGraupelHail product from the Dual-Frequency Precipitation Radar (DPR) aboard the GPM Core Observatory using high-resolution dual-polarization observations from Multi-Parameter Phased Array Weather Radar (MP-PAWR). The analysis focused on a convective system that developed in a humid environment over the Tokyo region of Japan, providing a valuable assessment within a climatic regime that has been underrepresented in previous studies. A bias correction for MP-PAWR reflectivity, derived from XRAIN network comparisons, yielded good agreement with KuPR observations from the DPR. A new grid-matching method, suitable for comparing vertically varying hydrometeor particle types and available only for MP-PAWR, was also introduced. The comparison revealed that DPR flagGraupelHail detections generally corresponded to regions of graupel occurrence identified by the MP-PAWR GHratio, defined as the number of graupel/hail grids within a DPR observation volume, although DPR tended to detect fewer events. To improve detection performance, we introduced a new indicator, STH35-FH—the height difference between the 35 dBZ echo top and the 0 °C level—as a complementary parameter to the PTI value used to determine flagGraupelHail. Incorporating STH35-FH improved the consistency between DPR and MP-PAWR detections, reducing false positives and enhancing overall detection accuracy. These results demonstrate the value of combining ground-based and spaceborne radar observations to improve global precipitation retrievals, particularly in humid environments. This approach will contribute to more accurate global graupel/hail estimation by spaceborne precipitation radar and a better understanding of how global warming affects precipitation systems.

1. Introduction

Understanding global precipitation systems is essential for improving weather forecasting, climate modeling, and disaster mitigation. Solid precipitation, such as hail, graupel, and large snowflakes, plays a particularly important role in severe convective storms, yet it remains one of the most challenging forms of precipitation to observe accurately because of its localized, transient, and hazardous nature [1,2,3]. The Global Precipitation Measurement (GPM; [4]) mission, led by National Aeronautics and Space Administration (NASA) and Japan Aerospace Exploration Agency (JAXA), aims to advance global precipitation observation capabilities. The GPM Core Observatory is equipped with a Dual-Frequency Precipitation Radar (DPR), which consists of Ku-band and Ka-band radars, referred to as KuPR and KaPR, respectively. DPR provides three-dimensional precipitation structures by retrieving vertical reflectivity profiles, and it includes algorithms dedicated to detecting and classifying large solid hydrometeors, such as hail and graupel [5].
Recent updates to the DPR product (Version 07; [6]) include flags, such as flagHail, flagGraupelHail [7,8], and flagHeavyIcePrecip [9], which represent hail, graupel–hail mixtures, and large solid hydrometeors, respectively. These products have the potential to greatly enhance our understanding of solid precipitation processes on a global scale. However, validating these products remains challenging. Takahashi and Kurosawa [5] compared these products in terms of the vertical profile of the radar reflectivity factor (Z), the measured dual-frequency ratio (DFRm), the mass weighted mean diameter (D0), and the normalized intercept parameter (Nw) derived from DPR data. They found that the occurrence of these parameters showed limited overlap, indicating the need for further subdivision. Ideally, in situ observations would allow for better evaluation, but they are extremely dangerous within hail-producing convective clouds. Aircraft-based measurements are hazardous, and balloon observations have difficulty accurately targeting the region where graupel and/or hail form, necessitating the use of remote sensing approaches [10].
Ground-based dual-polarization weather radar provides additional microphysical information and has been widely used to classify hydrometeor types more accurately than satellite-based radar. Nevertheless, operational scanning weather radar typically requires 5–10 min to complete a full three-dimensional volume scan, and its elevation coverage is limited. These constraints hinder direct comparison with fast-moving satellite observations and rapidly evolving severe convective clouds [11].
Phased Array Weather Radar (PAWR), such as that described by Takahashi et al. [12,13], overcomes many of these limitations. The Multi-Parameter Phased Array Weather Radar (MP-PAWR) acquires three-dimensional dual-polarization observations every 30 s within a 60 km radius using 115 elevation angles ranging from 0° to 90°, making it highly suitable for satellite product validation [12].
In this study, we evaluated the solid precipitation products of the GPM DPR using high-temporal-resolution data from the MP-PAWR located near Tokyo, Japan. The objectives of this study are the following: (1) to evaluate the DPR flagGraupelHail product in a humid convective environment, (2) to develop an improved volume-matching approach between DPR and MP-PAWR, and (3) to propose an additional index to enhance graupel and hail detection performance by DPR. We focus on flagGraupelHail and compare its classification with that derived from dual-polarization PAWR data. In addition to flagGraupelHail, other potentially relevant indicators include flagHail, flagHeavyIcePrecip, and the multiple scattering index (MSindex), which may indicate the presence of hail [14]. This comparative analysis aims to assess the accuracy of DPR solid precipitation retrievals and provide insights for future algorithm improvements.
Previous validation studies have mainly focused on continental or semi-arid regions. For example, comparisons using the operational S-band dual-polarization radar network over the United States demonstrated reasonable correspondence with ground-based radar, and a case study of a large hail event over Italy compared hydrometeor types derived from both DPR and ground-based radar [7,8]. Therefore, the performance of DPR solid precipitation algorithms in humid subtropical environments remains poorly understood. This study addresses this gap using Japan’s MP-PAWR system, which provides high-temporal-resolution 3D dual-polarization data.
We analyzed a case from 12 July 2022, when the GPM Core Observatory passed over the MP-PAWR observation domain at 21:49 JST (Japan Standard Time). On that day, convective precipitation developed between 16:00 and 22:00 JST, and heavy rainfall—110 mm from 19:00 to 20:00 JST and 263.5 mm from 17:00 to 20:00 JST—was reported by the Japan Meteorological Agency’s AMeDAS (Automatic Meteorological Data Acquisition System) in the northwestern part of MP-PAWR’s observation domain. In this case, deep convection likely occurred, capable of producing hail and graupel. However, no hail was reported by ground-based observations. When the satellite passed over the MP-PAWR’s observation range, 4.5 mm of precipitation was recorded in 10 min at the AMeDAS Saitama station (near the MP-PAWR site), 10 mm of precipitation 10 min before the overpass, 7 mm at the AMeDAS Tokorozawa station (about 15 km west–southwest of the MP-PAWR site), and 15 mm of precipitation 10 min after the overpass. Figure 1 shows the region of heavy precipitation located within the MP-PAWR range and XRAIN [15] radars (KANTOU, FUNABASHI, SHINYOKO and YATTAJIMA) ranges based on the surface precipitation rate estimated by DPR. This region was classified as convective precipitation according to the DPR product (typePrecip). These results indicate that the precipitation system observed during the GPM overpass can be characterized as convective precipitation.

2. Data Collection and Analysis

The MP-PAWR used in this study operates in the X-band and is located in Saitama City, approximately 30 km north of central Tokyo (Figure 1). MP-PAWR employs a fan beam for transmission and a pencil beam for reception, utilizing digital beamforming technology to perform rapid Range–Height Indicator (RHI) scans from 0° to 90° elevation in approximately 0.1 s. By rotating the antenna in azimuth, it acquires complete three-dimensional volumetric data. In practice, the radar observes altitudes up to 15 km within a 60 km radius, using 115 elevation angles. Its sensitivity is sufficient to detect precipitation signals down to 10 dBZ [12,13]. MP-PAWR simultaneously transmits horizontal and vertical polarized waves and receives both components. It outputs the received power, Z, and Doppler velocity of both polarization and differential reflectivity (ZDR), the phase difference due to propagation between horizontal and vertical polarization (ΦDP), and the correlation coefficient between horizontal and vertical polarization (ρHV).
Given the hybrid fan–pencil beam design of the phased array system, elevation-dependent bias corrections of Z and differential reflectivity (ZDR) are necessary. In this study, we applied the method proposed by Gourley et al. [16], which exploits the relative independence of the KDP/Z–ZDR relationship from the drop size distribution, to correct biases in Z and ZDR. However, at higher elevation angles, the variability of ZDR and KDP relative to Z decreases, making this method less reliable. Therefore, we first applied the method of [16] to XRAIN—a dual-polarization X-band radar network employing conventional parabolic antennas [11] with a maximum elevation angle of 20°—and generated grid-based match-up datasets between XRAIN and MP-PAWR by selecting less attenuated regions where the time difference between observations was less than 1 min. It should be noted that the XRAIN radars are corrected independently and confirmed the consistency of the corrected bias by comparing relative bias between two radars. These datasets were then used to derive elevation-specific bias corrections for MP-PAWR. In this study, we used four XRAIN radars—KANTOU, SHINYOKO, FUNABASHI, and YATTAJIMA—surrounding MP-PAWR (see Figure 1 for their locations). Absolute bias correction for XRAIN was implemented using the method in [16]. First, XRAIN radar data were converted from polar to Cartesian coordinates with horizontal and vertical resolutions of 0.25 km and 0.5 km, respectively, and match-up datasets were created for Z and ZDR. Second, an average ZDR-KDP/Z dataset was created for each radar, and the Z and ZDR biases were estimated by fitting the observed data to the theoretical ZDR-KDP/Z curve while adjusting the bias values of Z and ZDR in 1.0 dB and 0.5 dB intervals. The estimated biases were evaluated using match-up data from less-attenuated regions. By taking the difference in absolute biases between two radars, the relative bias could then be estimated and compared with that derived from the match-up data.
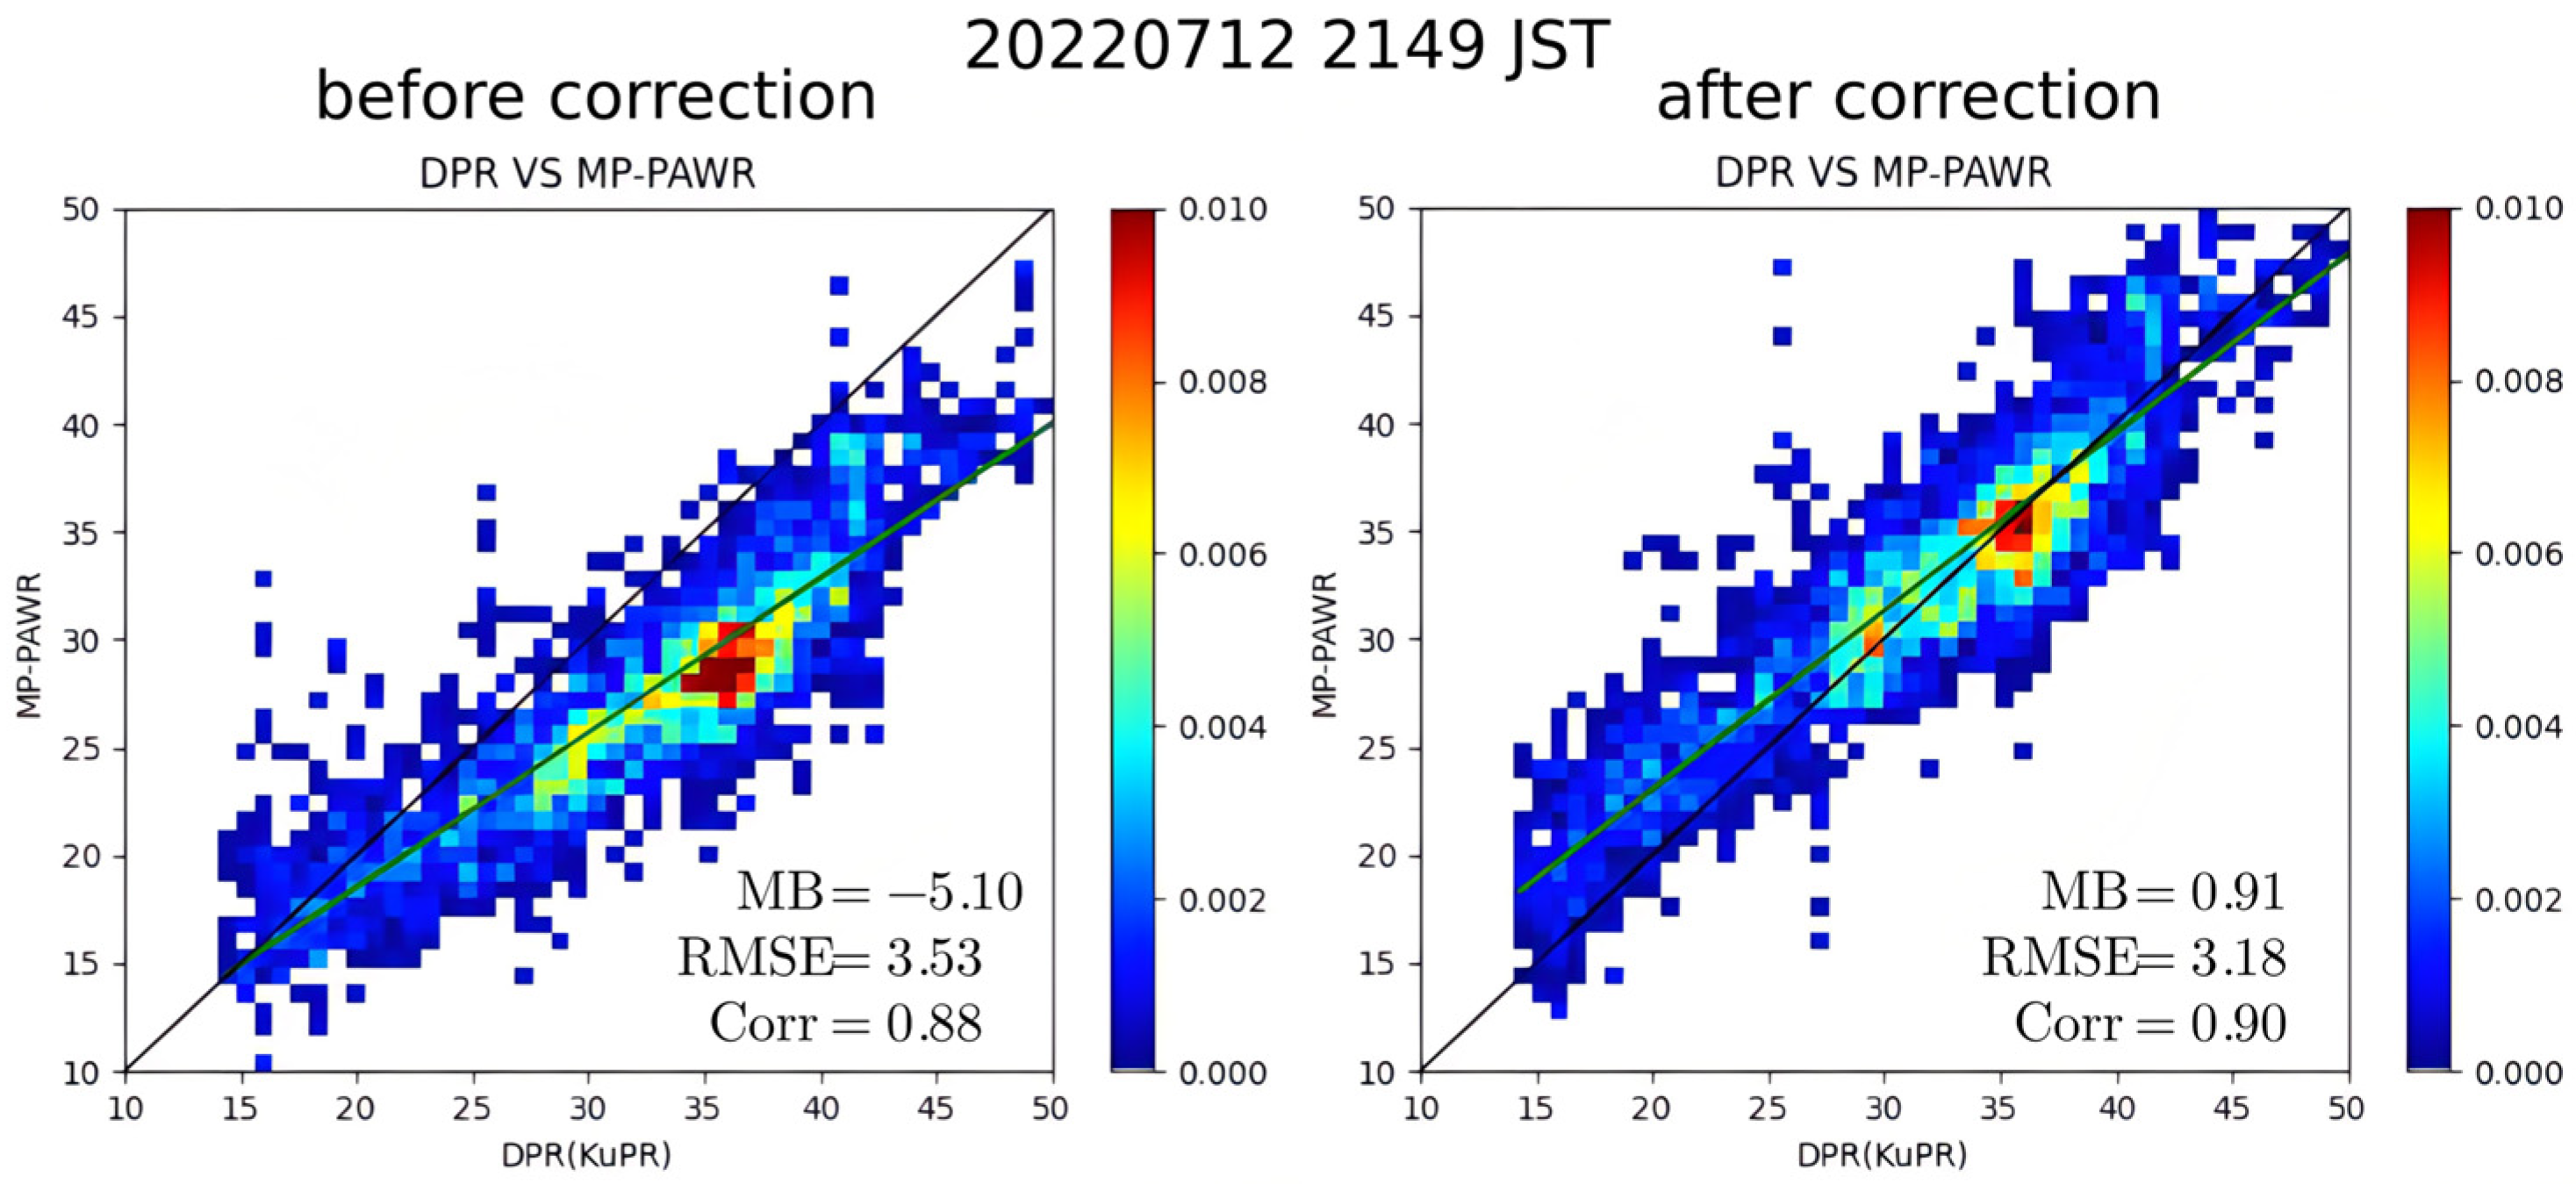
Because both MP-PAWR and XRAIN operate in the X-band, attenuation corrections for Z and ZDR using KDP were applied at elevation angles below 30°, whereas for higher angles corrections were performed based on the attenuation coefficient (k)–Z relationships for horizontal and vertical polarization below the freezing level. Figure 2 compares the two-dimensional histograms of Z between MP-PAWR and GPM KuPR before and after bias correction of MP-PAWR. According to [17], KuPR is well-calibrated using active radar calibrators, the normalized surface backscattering cross-section over the ocean, and internal calibration procedures. The left panel in Figure 2 shows a large negative bias of approximately −5 dB for MP-PAWR, whereas the bias is greatly improved to 0.91 after correction. A slight improvement in the root mean square error (RMSE) and the correlation coefficient (Corr) are also evident in Figure 2.
For hydrometeor classification using MP-PAWR, we employed the method of Kouketsu et al. [18], an X-band fuzzy-logic-based classification algorithm that identifies eight hydrometeor types: drizzle, rain, ice crystals, wet snow, dry snow, wet graupel, dry graupel, and rain and hail. This method was only applied to elevation angles below 30°. Data within a radius of approximately 10 km could not be analyzed when focusing on hydrometeor types below 6 km (approximately 1 km above the freezing level) in the later analysis. For comparison with DPR solid precipitation products, we focused on the three categories relevant to graupel and hail: wet graupel, dry graupel, and rain and hail.
The DPR data used in this study correspond to flagGraupelHail, an experimental product in Version 07. This flag enhances graupel detectability by adjusting the threshold values used in the standard flagHail product. Note that the flag is defined for each angle bin in the radar observations and does not provide full three-dimensional hydrometeor-type profiles in this version.
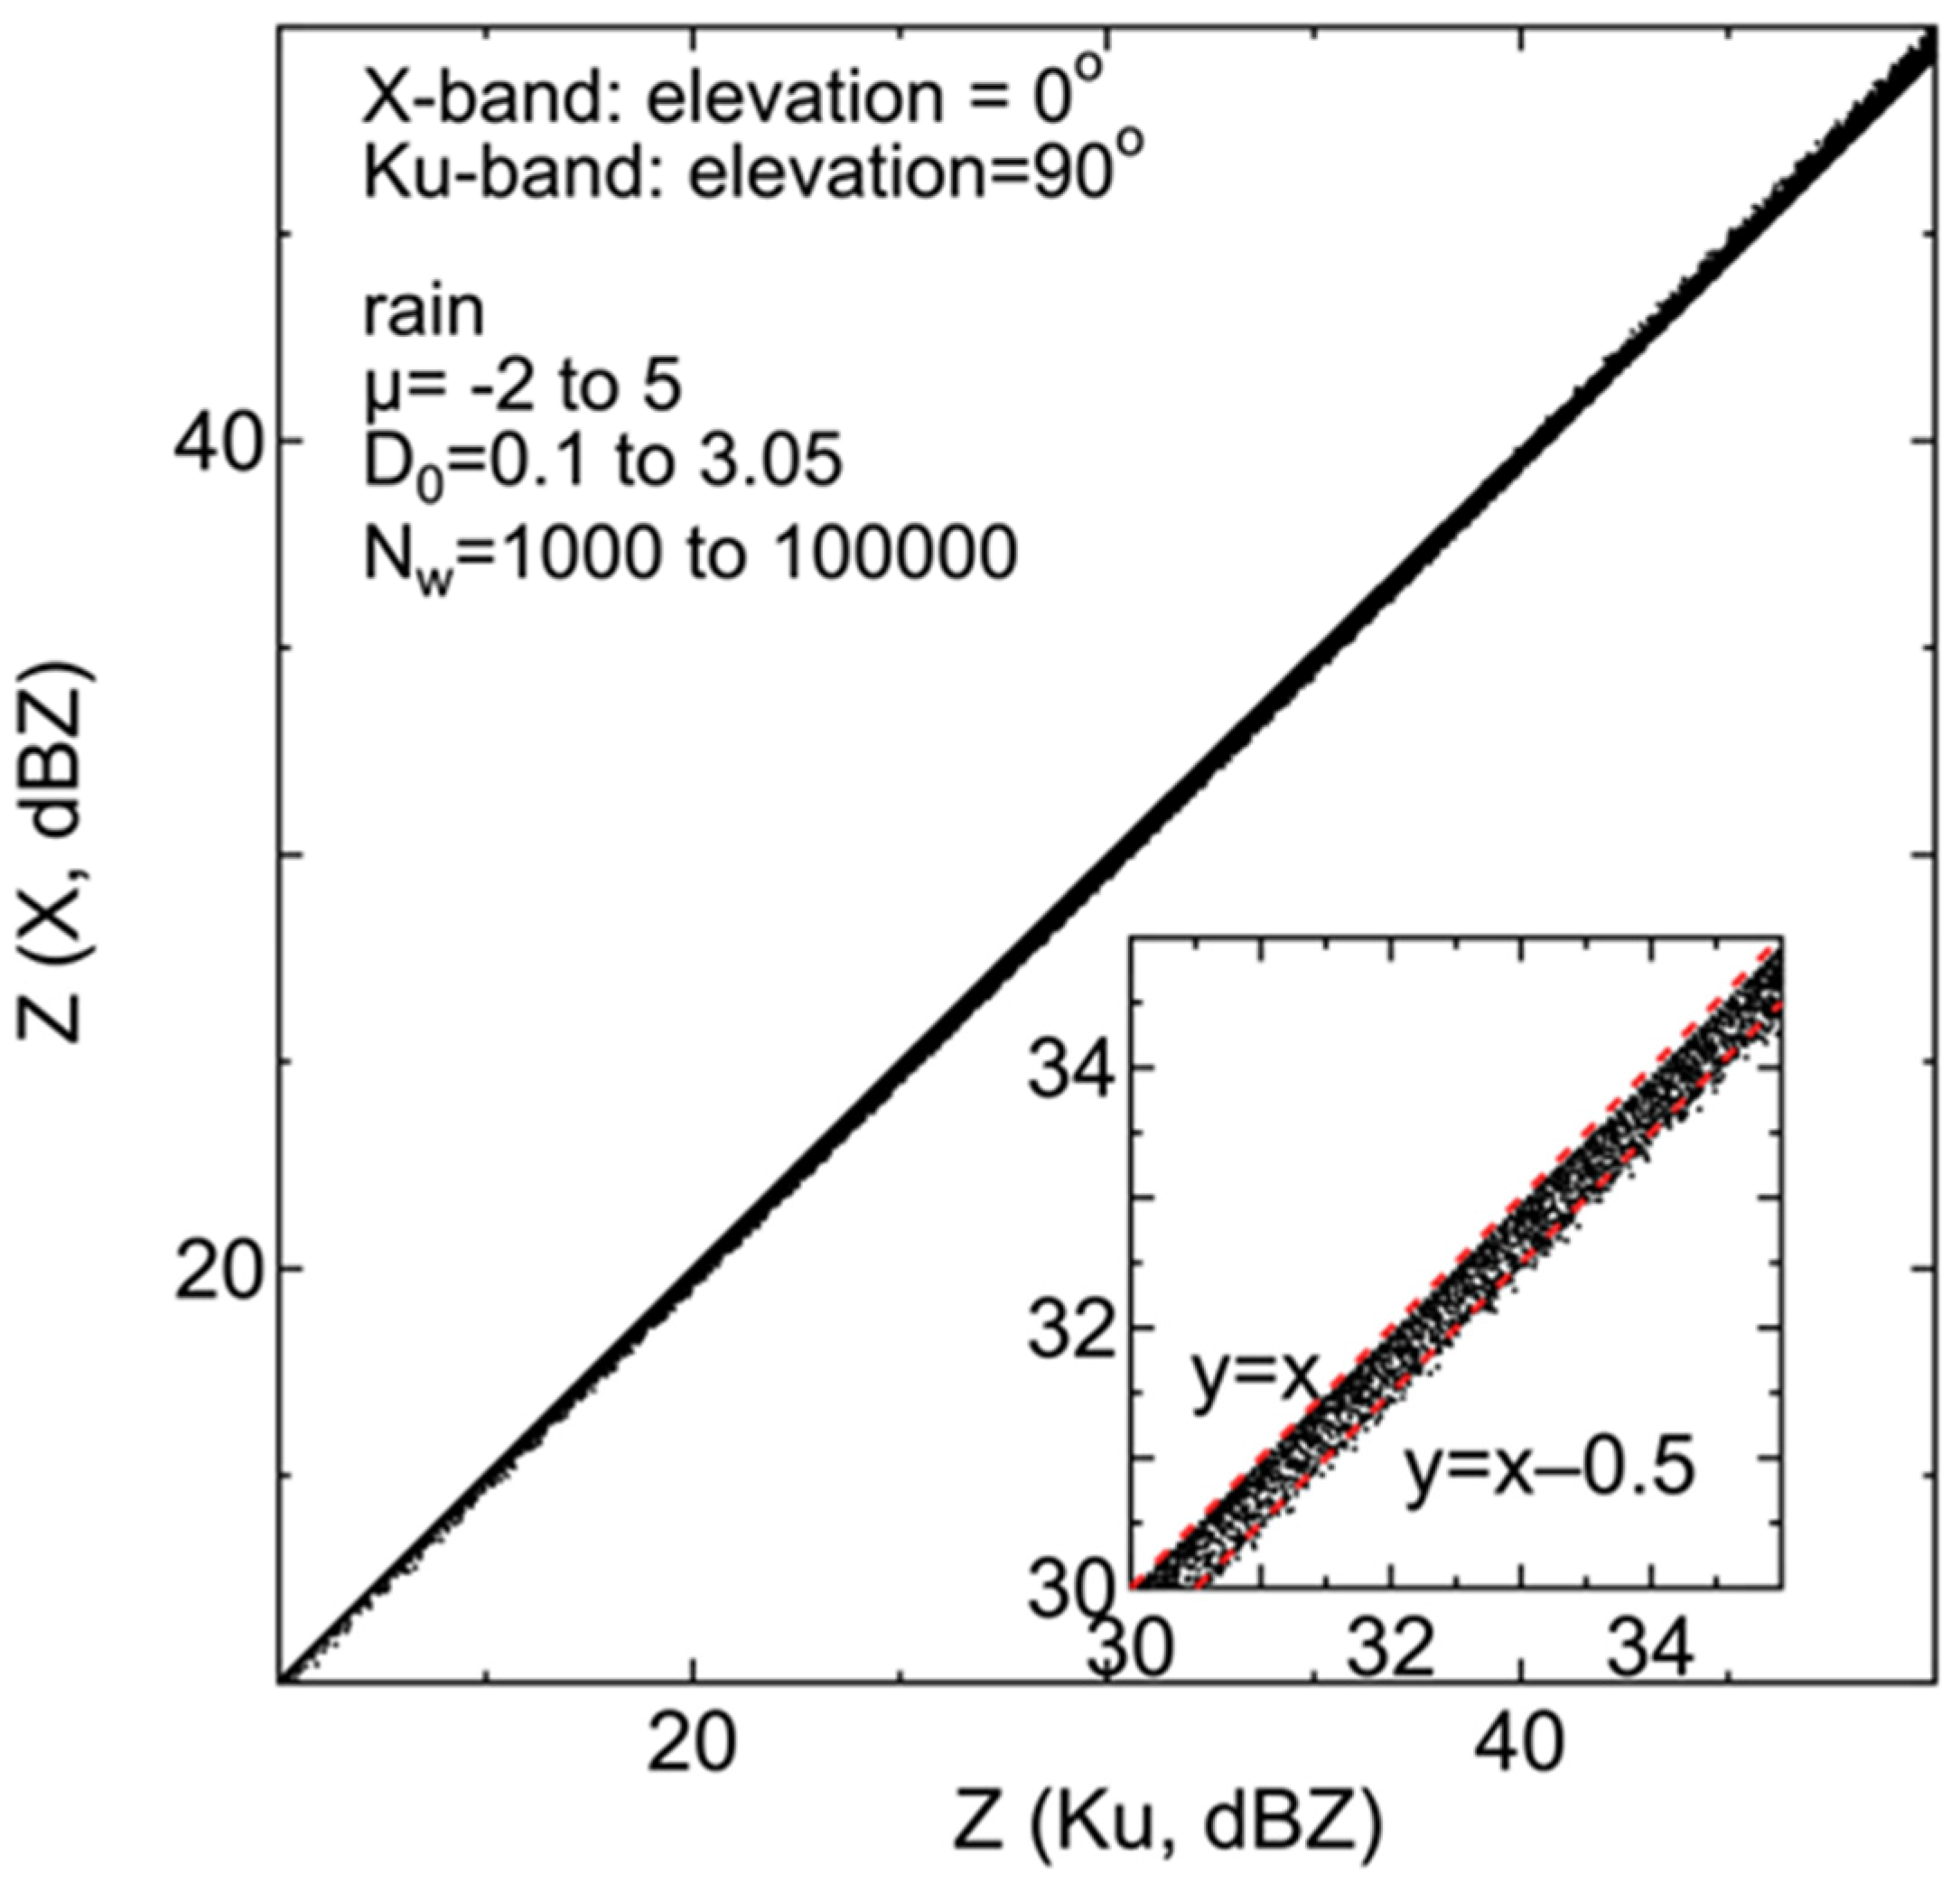
To compare MP-PAWR and DPR, we examined Z observed by MP-PAWR and KuPR. Differences in observation geometry, frequency, and sampling volume between spaceborne and ground-based radar must be taken into account [19,20]. The impacts of geometry and frequency were evaluated by simulating Z values using the T-matrix method [21] over a range of drop size distributions modeled with gamma functions [22]. Assuming a nadir-looking geometry for KuPR (90° elevation) and a near-horizontal scan for XRAIN (0° elevation), the KuPR reflectivity factor was found to be comparable to, or up to 0.5 dB higher than, that of the X-band (see Figure 3).
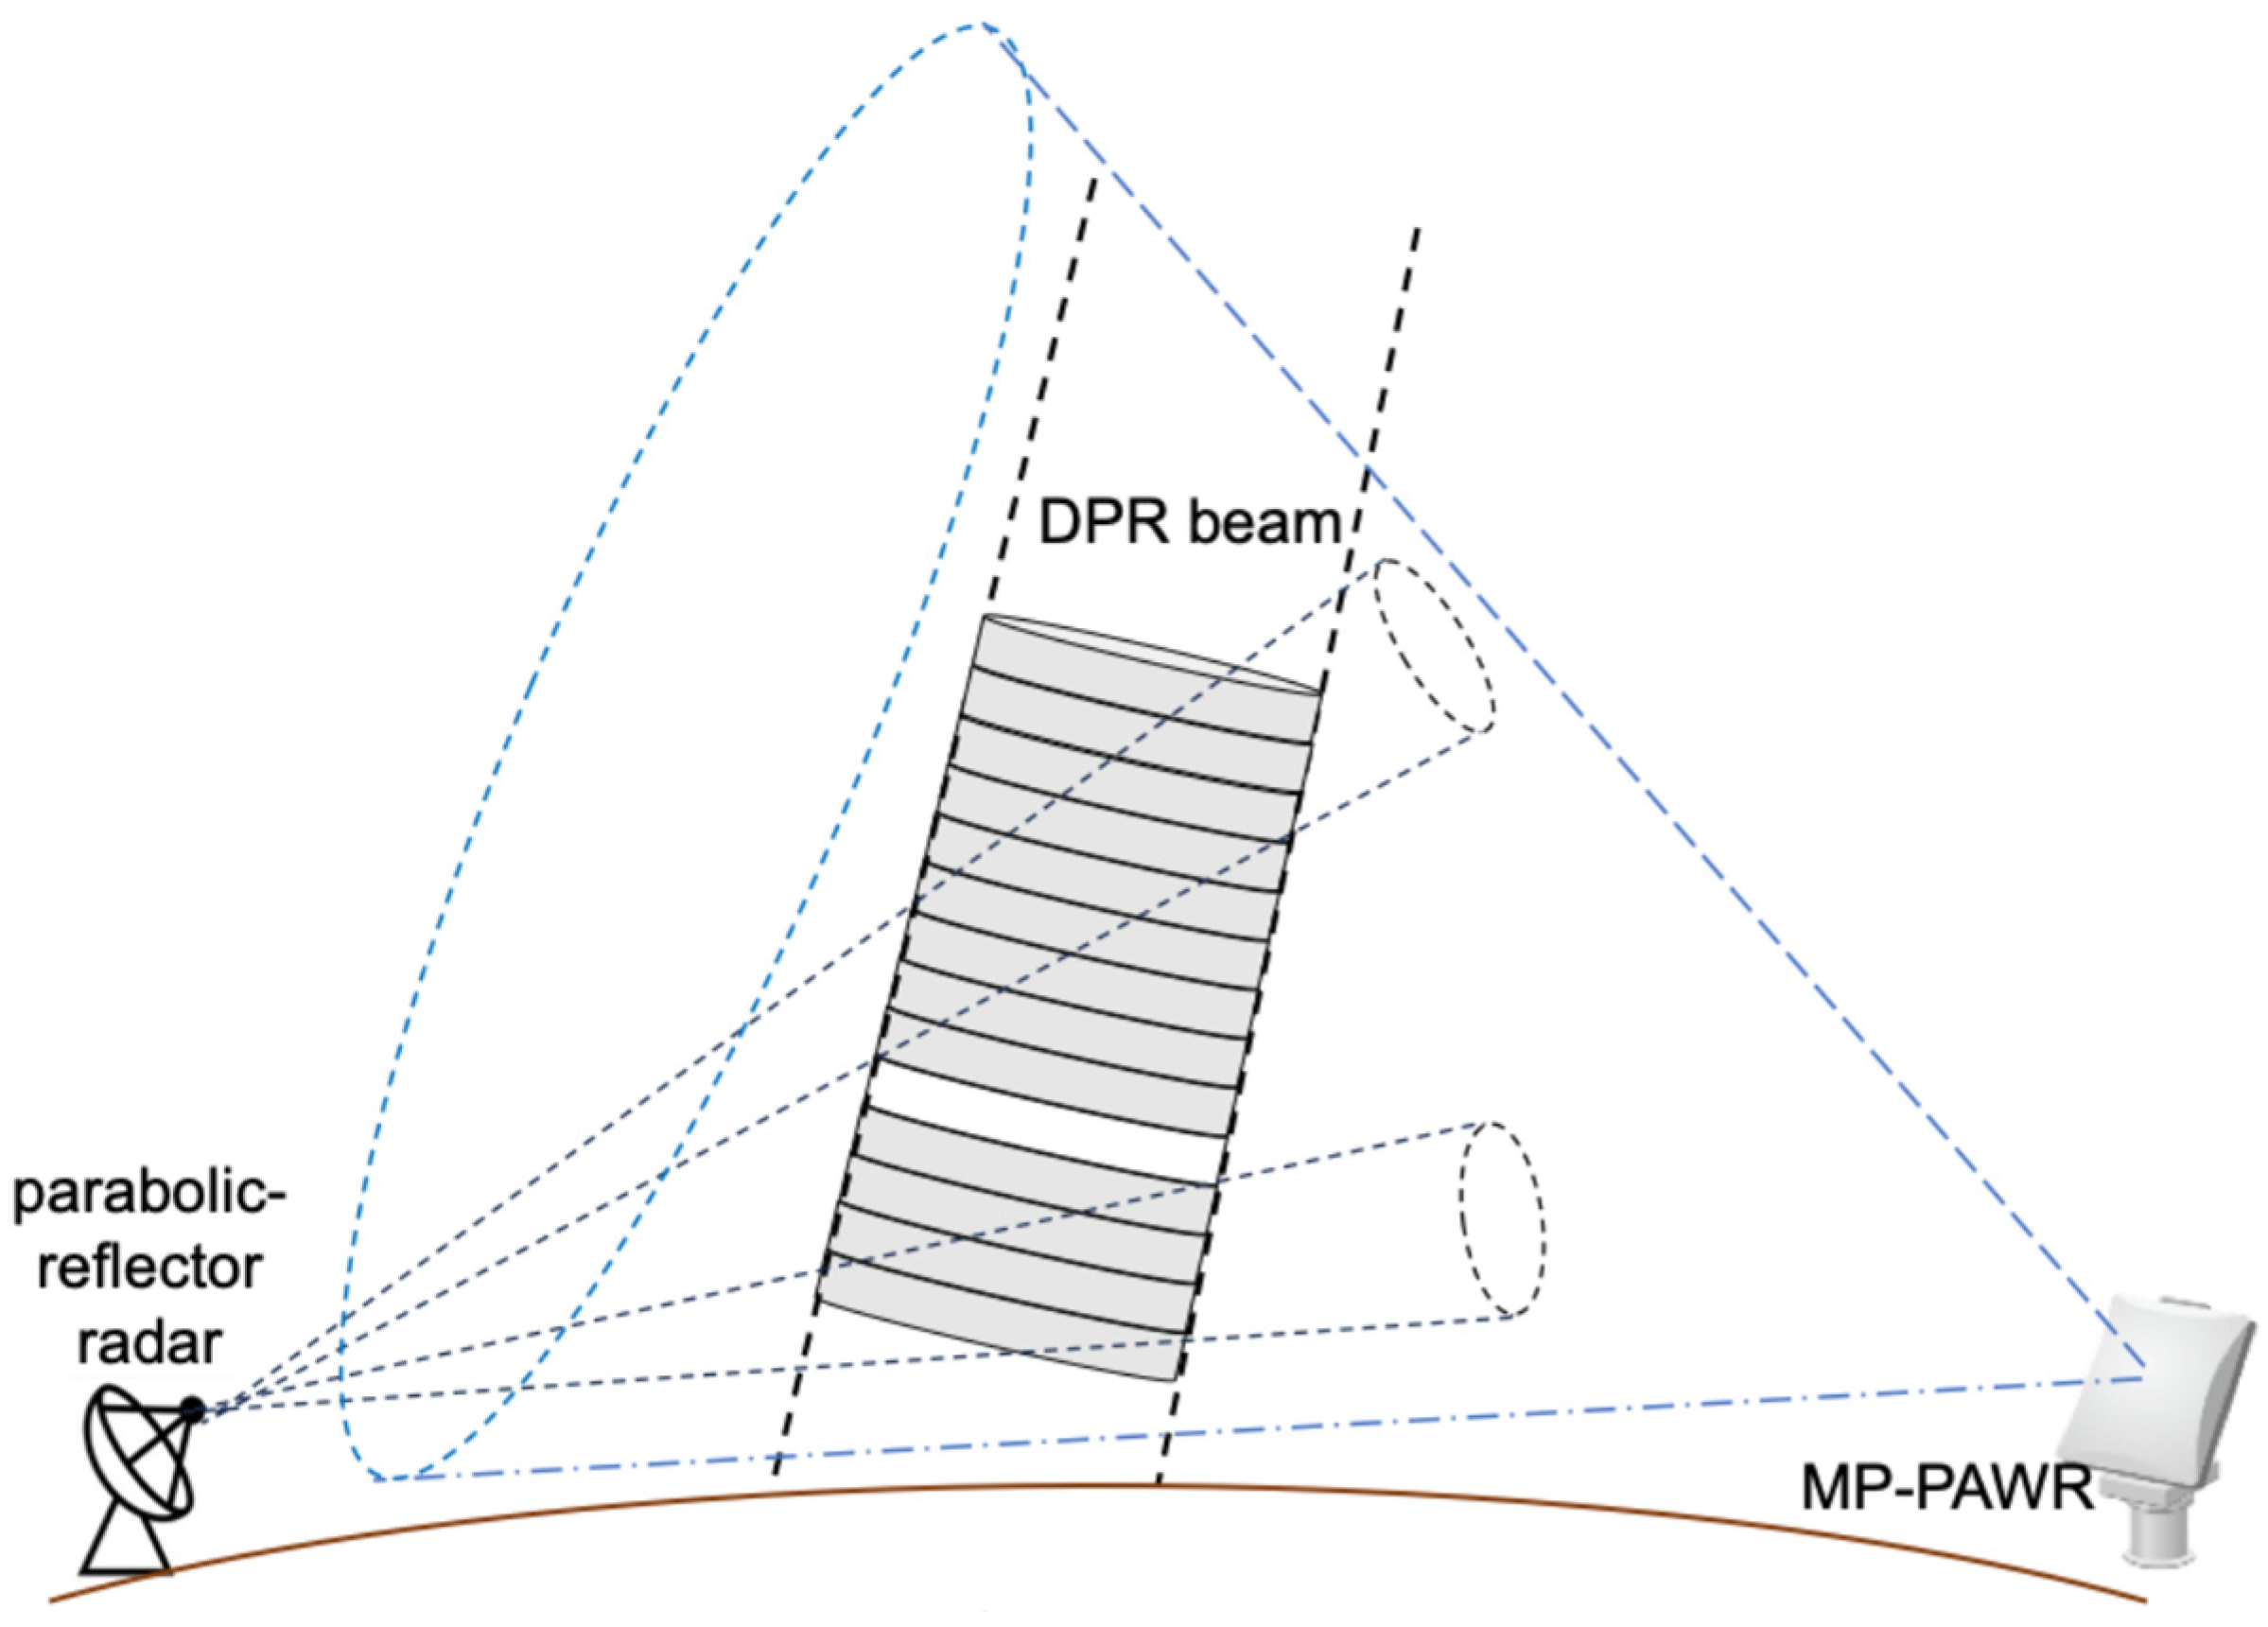
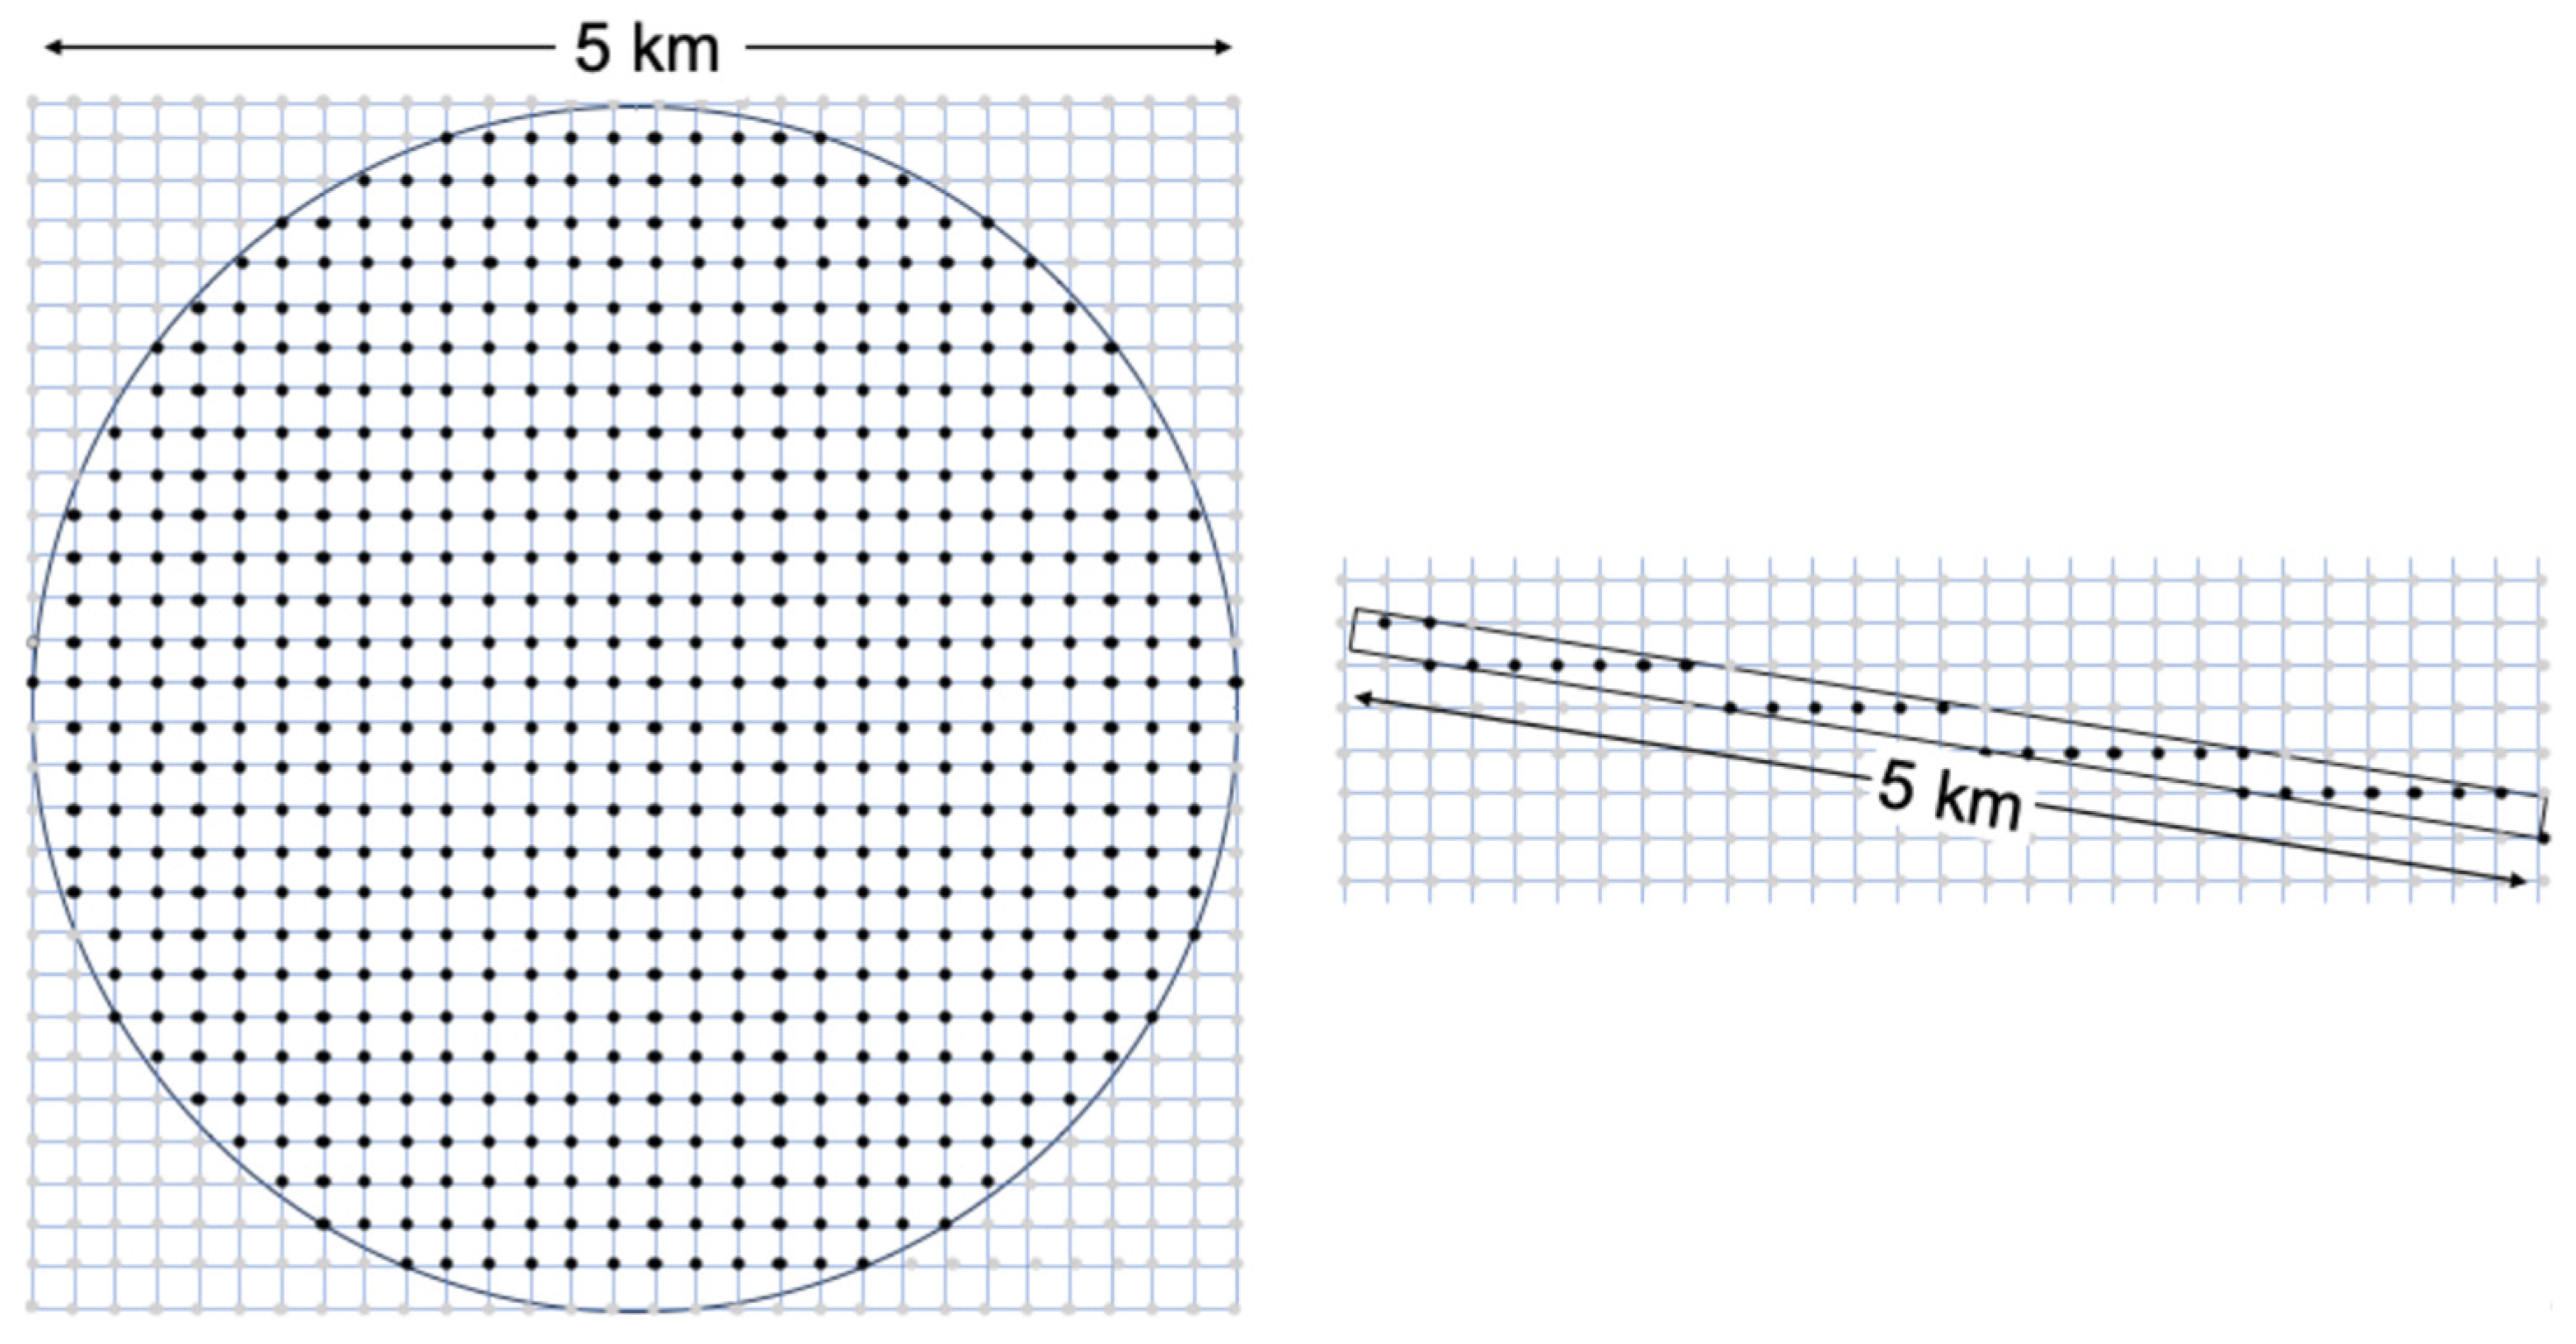
Regarding volume differences, averaging methods, such as those proposed by [19,20], adjust the spatial volumes between ground-based radar (parabolic reflector radar; Figure 4) and DPR by averaging over larger observation volumes. However, because this study focuses on evaluating hail and graupel detections—phenomena that are highly localized—such spatial averaging may not be appropriate. Instead, we gridded the high-resolution MP-PAWR data onto 0.25 × 0.25 × 0.25 km grids and convolved them with the DPR antenna pattern to simulate DPR observation volumes, assuming a 5 km of footprint diameter and 0.25 km range resolution. Figure 5 illustrates the number of MP-PAWR grid cells included within a single DPR observation volume. More than 300 grid cells were averaged to represent one DPR observation volume (grid-matching method). Averaging was performed within the DPR footprint, weighted by a Gaussian antenna pattern (−6 dB beamwidth), allowing for direct comparison between MP-PAWR and DPR. Figure 4 schematically illustrates the difference between MP-PAWR and a conventional parabolic reflector radar observations. It should be emphasized that MP-PAWR performs electrical RHI scans (115 elevation angles) while mechanically rotating the antenna in azimuth to complete three-dimensional observations within 30 s. Therefore, the MP-PAWR observations are nearly simultaneous with those of DPR, even for convective clouds, and the MP-PAWR data contain no spatial gaps. Gridded data with 0.25 km horizontal and vertical resolution were created by resampling the densely observed raw data after bias and attenuation correction.
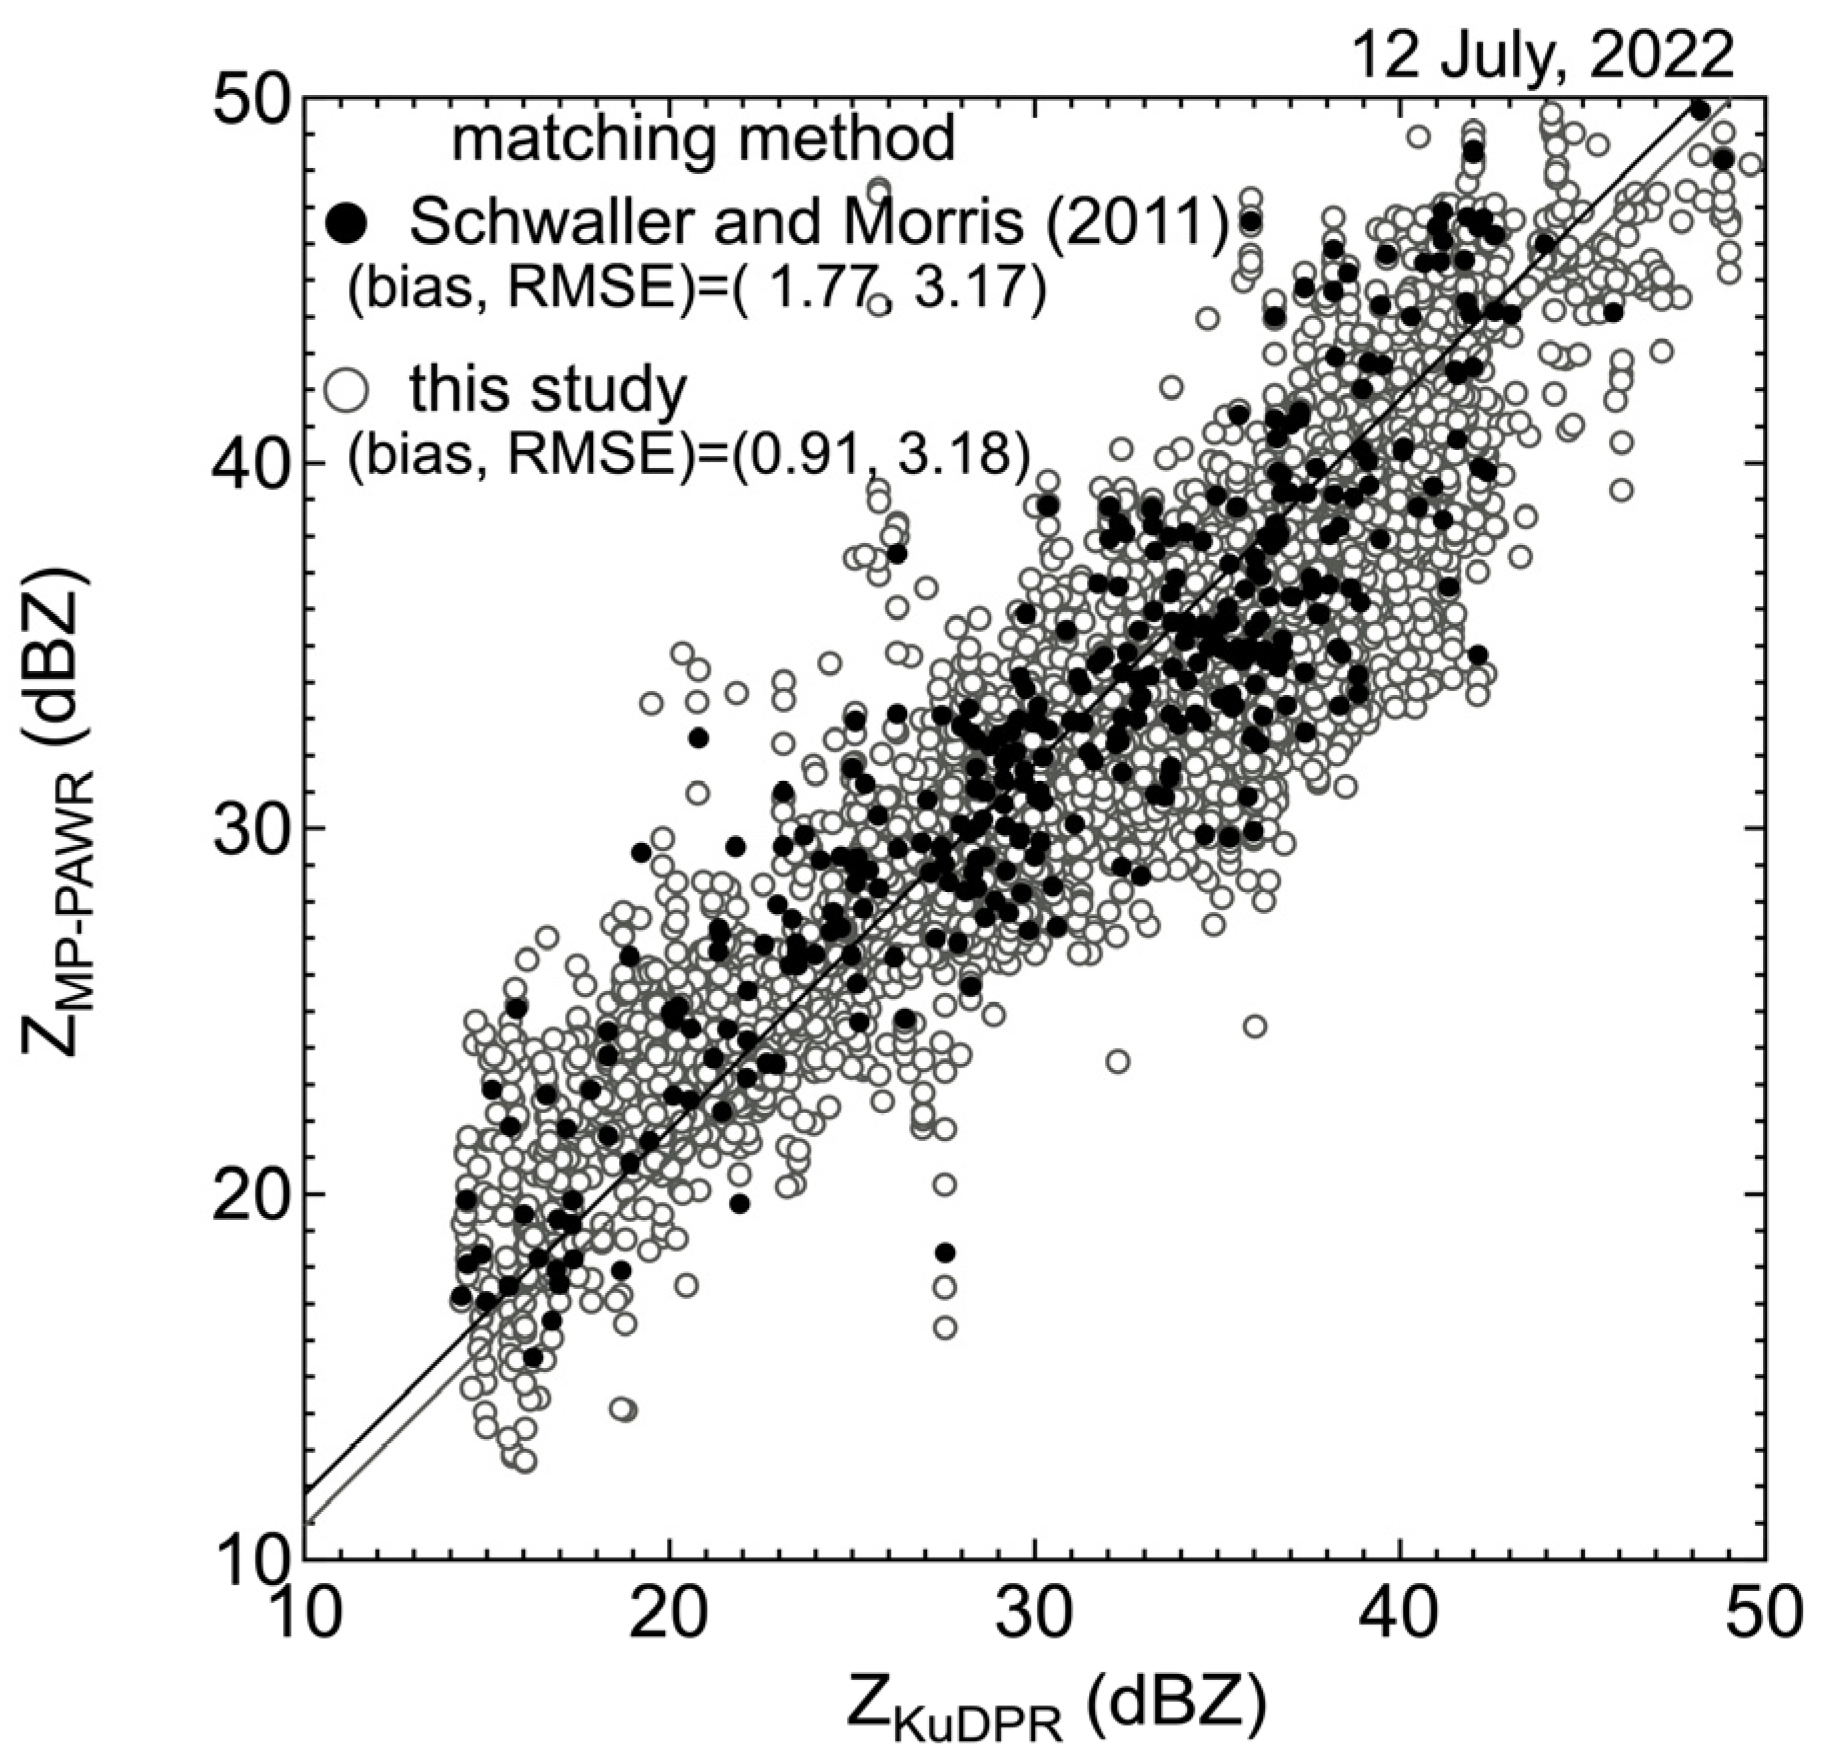
Figure 6 compares scatterplots generated using both the conventional volume-averaging method (e.g., [20]) and the proposed grid-matching method. The grid-matching method achieves less bias (0.91 dB compared to 1.77 dB for the volume-averaging method), and the RMSE is similar, indicating that most data points are concentrated along the diagonal line, although many points show larger deviations. Because comparisons using larger volumes (e.g., the method of [20]) tend to filter out extreme values, our method performs comparably to the conventional one, and it was therefore adopted for further analysis. In addition, because the volume-averaging method requires larger sampling volumes, only 339 points were compared between ground-based and spaceborne radar, whereas 3,293 points were compared using the grid-matching method, indicating that the conventional method is not suitable for detailed analysis. This grid-matching approach is feasible only with full-volume scan observations, such as those from MP-PAWR.
This approach, which compares each sampling volume of the DPR, also enables direct comparison of hail and graupel detection between MP-PAWR and DPR. The DPR graupel and hail detection algorithm [7,8] uses the Parameterized Textural Index (PTI), defined as
P T I = m e a n a b s D F R m s l o p e / { S t o r m   T o p   H e i g h t × Z m K u m a x } ,
where the numerator represents the mean absolute vertical gradient of the observed dual-frequency ratio (DFRm = Zm(Ku)/Zm(Ka)) and Zm(Ku) and Zm(Ka) denote the observed radar reflectivity factors of KuPR and KaPR, respectively. The subscript m denotes measured values, i.e., those uncorrected for attenuation. The denominator represents the product of the storm-top height and the maximum Ku-band reflectivity factor (Zm(Ku)max). The algorithm flags graupel or hail when PTI falls below a threshold of 5.5 near nadir and 4.6 elsewhere and specifically identifies hail when PTI is below 3.5. Lower PTI values indicate a greater likelihood of hail relative to graupel. Because this flag is assigned for each ray of DPR rather than each sampling volume, PTI values for each DPR angle bin were computed using the method in [5] and compared with hydrometeor classifications derived from MP-PAWR. Because MP-PAWR assigns a hydrometeor class to each 0.25 km3 grid cell, the graupel–hail ratio (GHratio) was defined as
G H r a t i o = N G H / N g r i d ,
where N G H is the number of grid cells classified as either “wet graupel” or “rain and hail” and N g r i d is the total number of grid cells within the DPR sampling volume. The GHratio was computed within a vertical layer of ±1 km around the 0 °C level to detect falling graupel or hail before melting, where most wet graupel was detected. A higher GHratio indicates a greater probability of graupel or hail being present.
To examine the formation and dynamics of graupel and hail within the cloud, we implemented dual-Doppler analysis using four XRAIN radars deployed around Tokyo (Figure 1). XRAIN performs PPI scans at 12 elevation angles from 1° to 20° within a 5 min cycle. Dual-Doppler wind fields were retrieved using Python-based pyDDA (ver. 1.5) software [23] by constructing the three-dimensional gridded data on a common grid for each radar. Because the XRAIN scan cycle is slower than MP-PAWR’s 30 s cycle, we used the three-dimensional wind field data obtained closest to the GPM overpass (21:45–21:49 JST).

3. Results

3.1. Comparison of Z

Figure 6 presents a scatterplot comparing Z between KuPR and the bias- and attenuation-corrected MP-PAWR data. The data points align closely along the 1:1 line, indicating good agreement between the two radar observations. The estimated bias and the root mean square error (RMSE) for the grid-matching method (open circles) are approximately 0.91 dB, and 3.18 dB, respectively, confirming the effectiveness of the bias and attenuation corrections applied to MP-PAWR. As mentioned previously, the grid-matching method produced approximately 3293 comparison points, whereas only 339 points were generated using the previous method, indicating the superior suitability of this approach for detailed precipitation analysis. Comparisons on standard deviation show both methods are nearly equivalent, but Figure 3 indicates extreme values are observed in grid-matching method. This is due to the smaller integration volume.
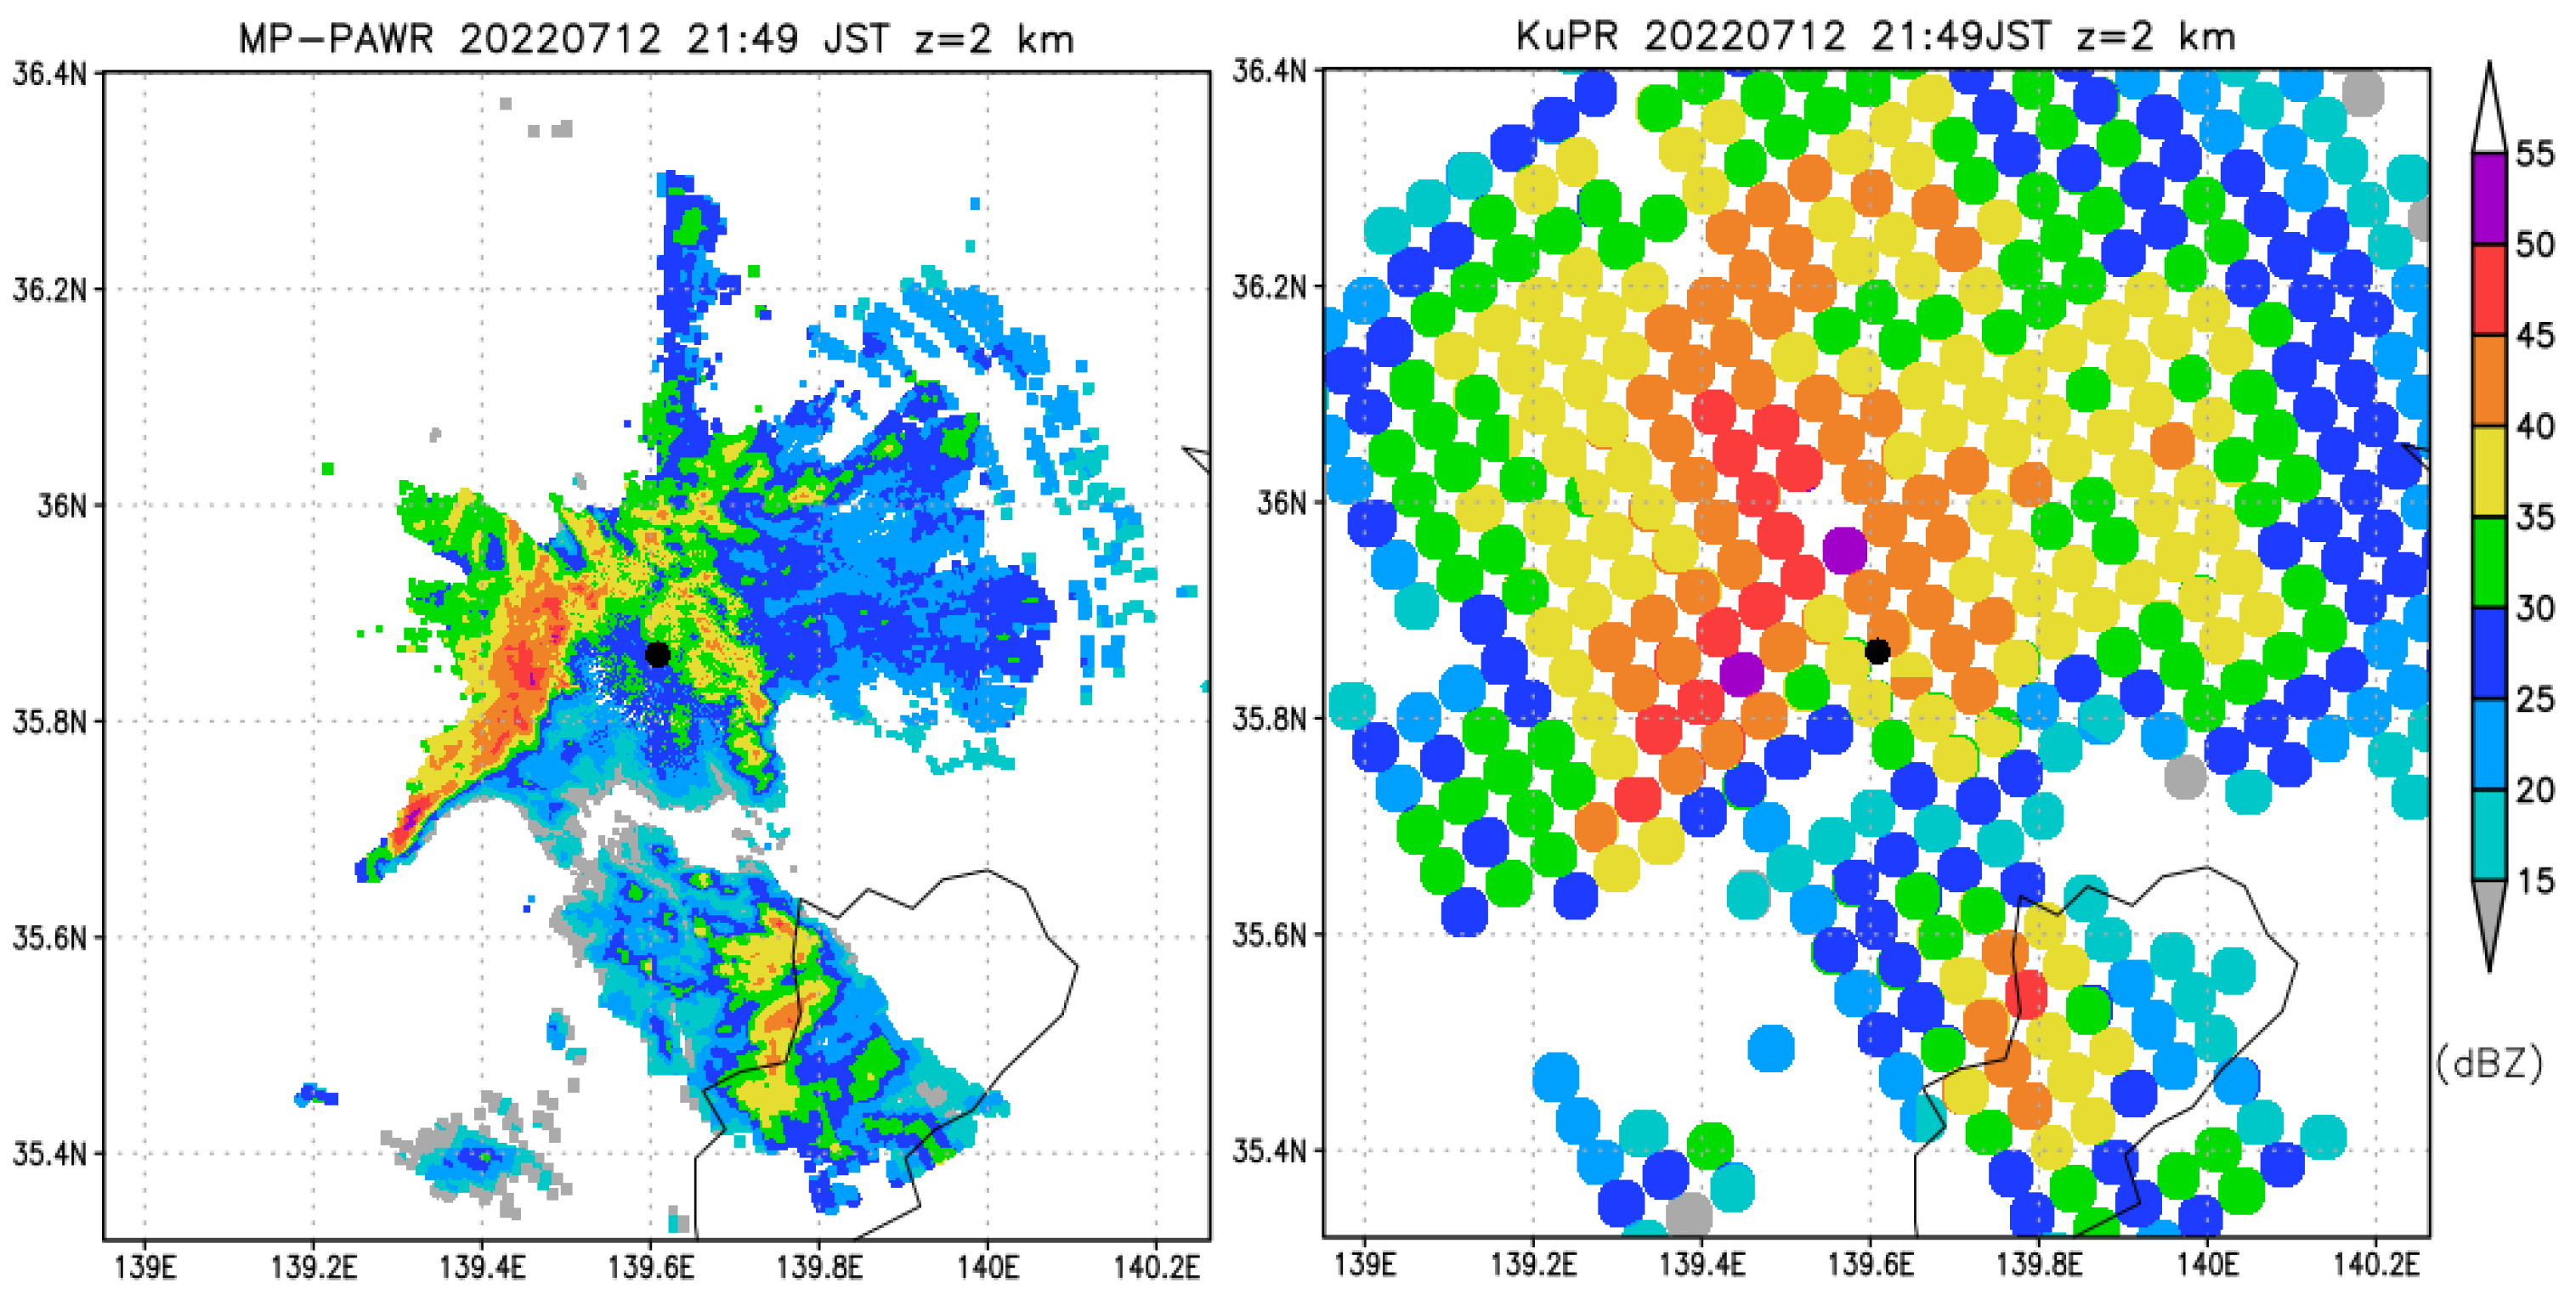
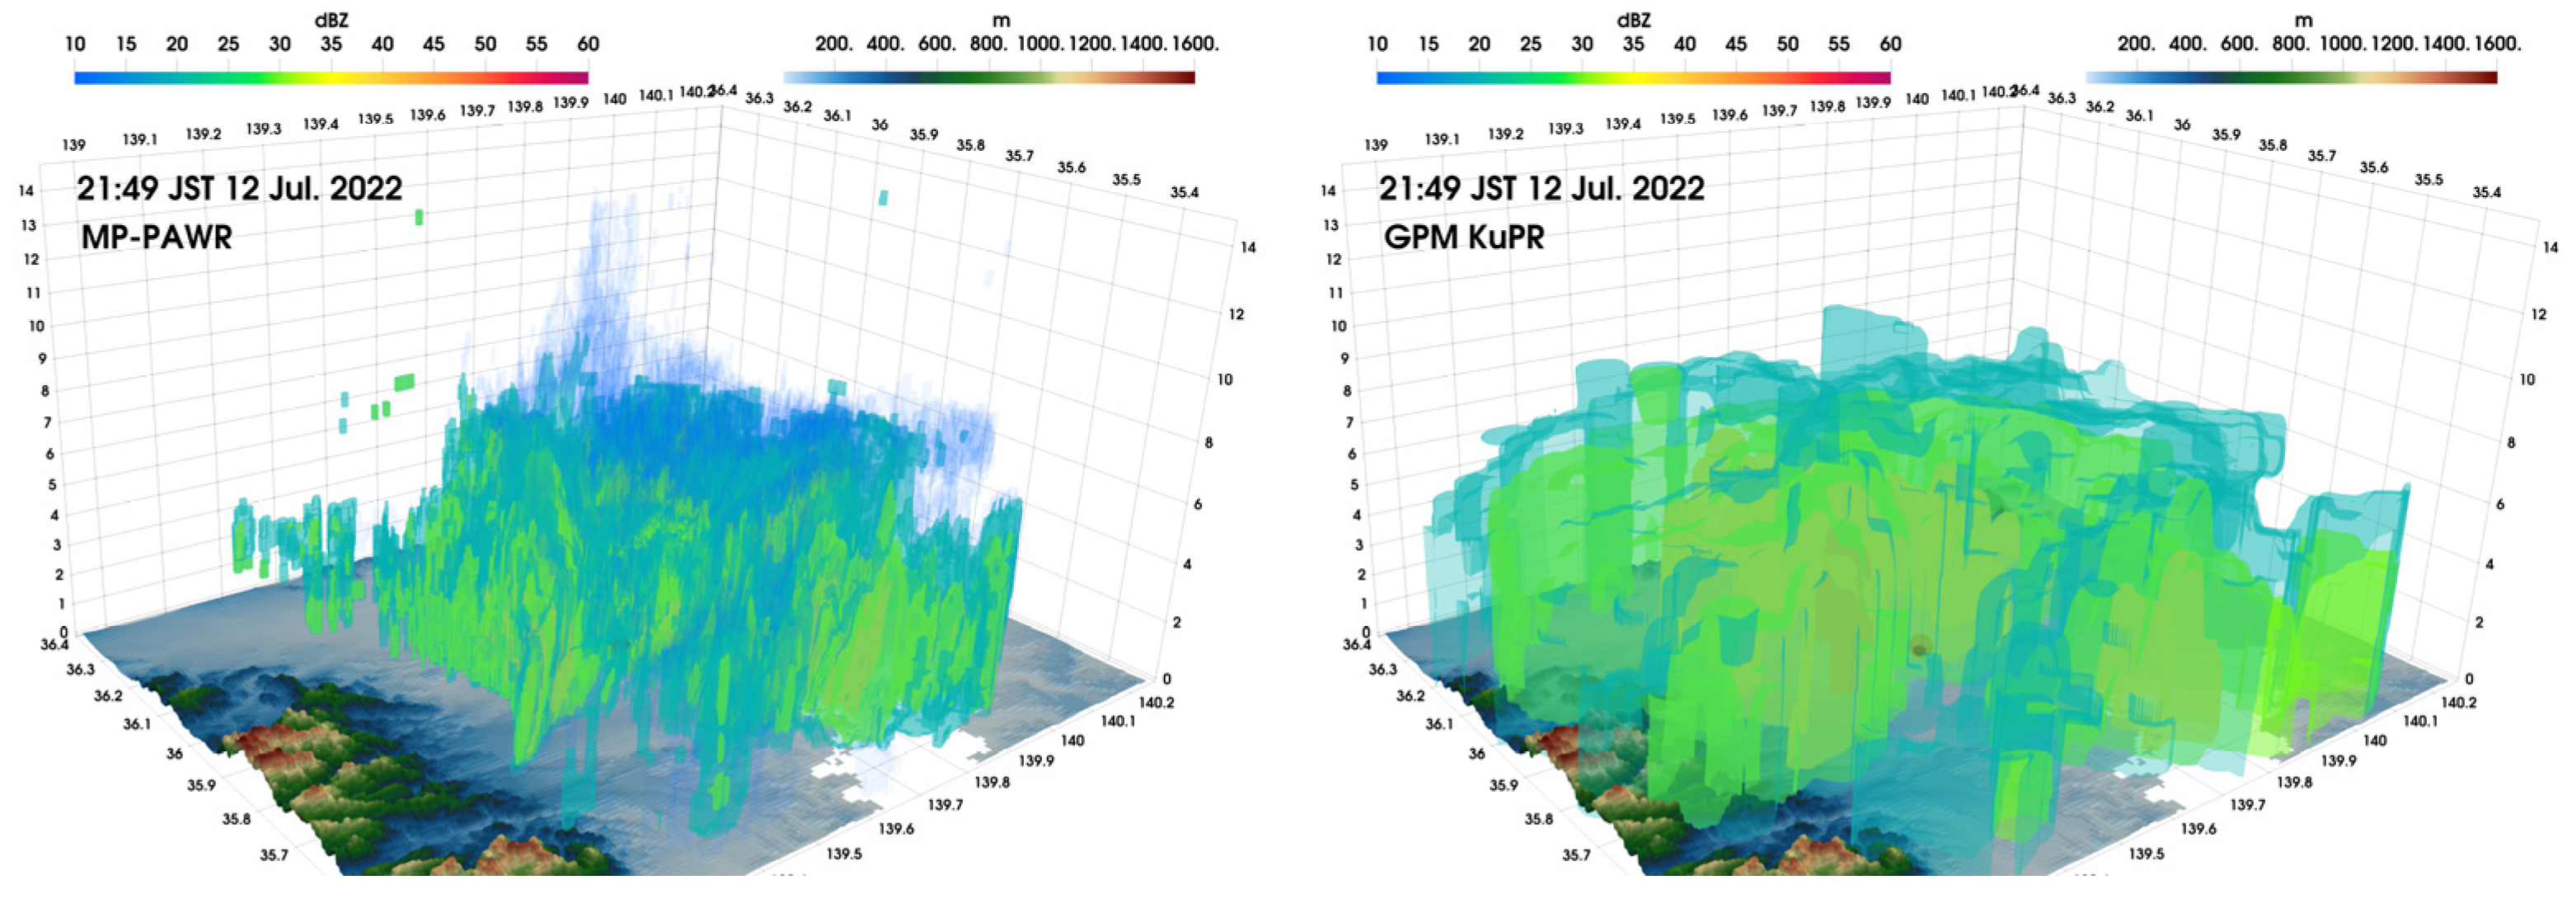
Figure 7 shows a horizontal cross-section of the reflectivity factor at an altitude of 2 km. Both radars display similar precipitation patterns near the radar site; however, MP-PAWR lacks echo detection on the northwest side. This is attributed to attenuation by strong nearby echoes (>55 dBZ in KuPR observation) and the blind zone induced by surrounding buildings. Owing to its downward-looking geometry from space, KuPR depicts a more extensive echo area without blind zones or blurred patterns due to its larger footprint. In contrast, echoes located about 30 km south of the MP-PAWR site show good correspondence between the two radars and are largely free from significant attenuation. These characteristics of MP-PAWR and KuPR, as shown in Figure 7, are also evident in the three-dimensional reflectivity fields (Figure 8). Both MP-PAWR and KuPR exhibit similar spatial patterns, except in regions affected by strong attenuation or blind zones. In this case, the average echo top height is less than 10 km in both observations, although MP-PAWR successfully captures vertically developed echo towers extending above 10 km. KuPR exhibits a broader horizontal extent of precipitation echoes, primarily because of its larger observation volume (footprint), which is approximately 5 km in diameter. Consequently, KuPR tends to lose fine structural details of precipitation echoes compared with the higher sensitivity and finer spatial resolution of MP-PAWR. These comparisons indicate that MP-PAWR effectively resolves fine-scale precipitation structures, whereas KuPR provides broader horizontal coverage. In this study, we focus on regions where echoes from MP-PAWR and DPR overlap to evaluate the flagGraupelHail product from DPR.

3.2. Evaluation of the Hail/Graupel Flag

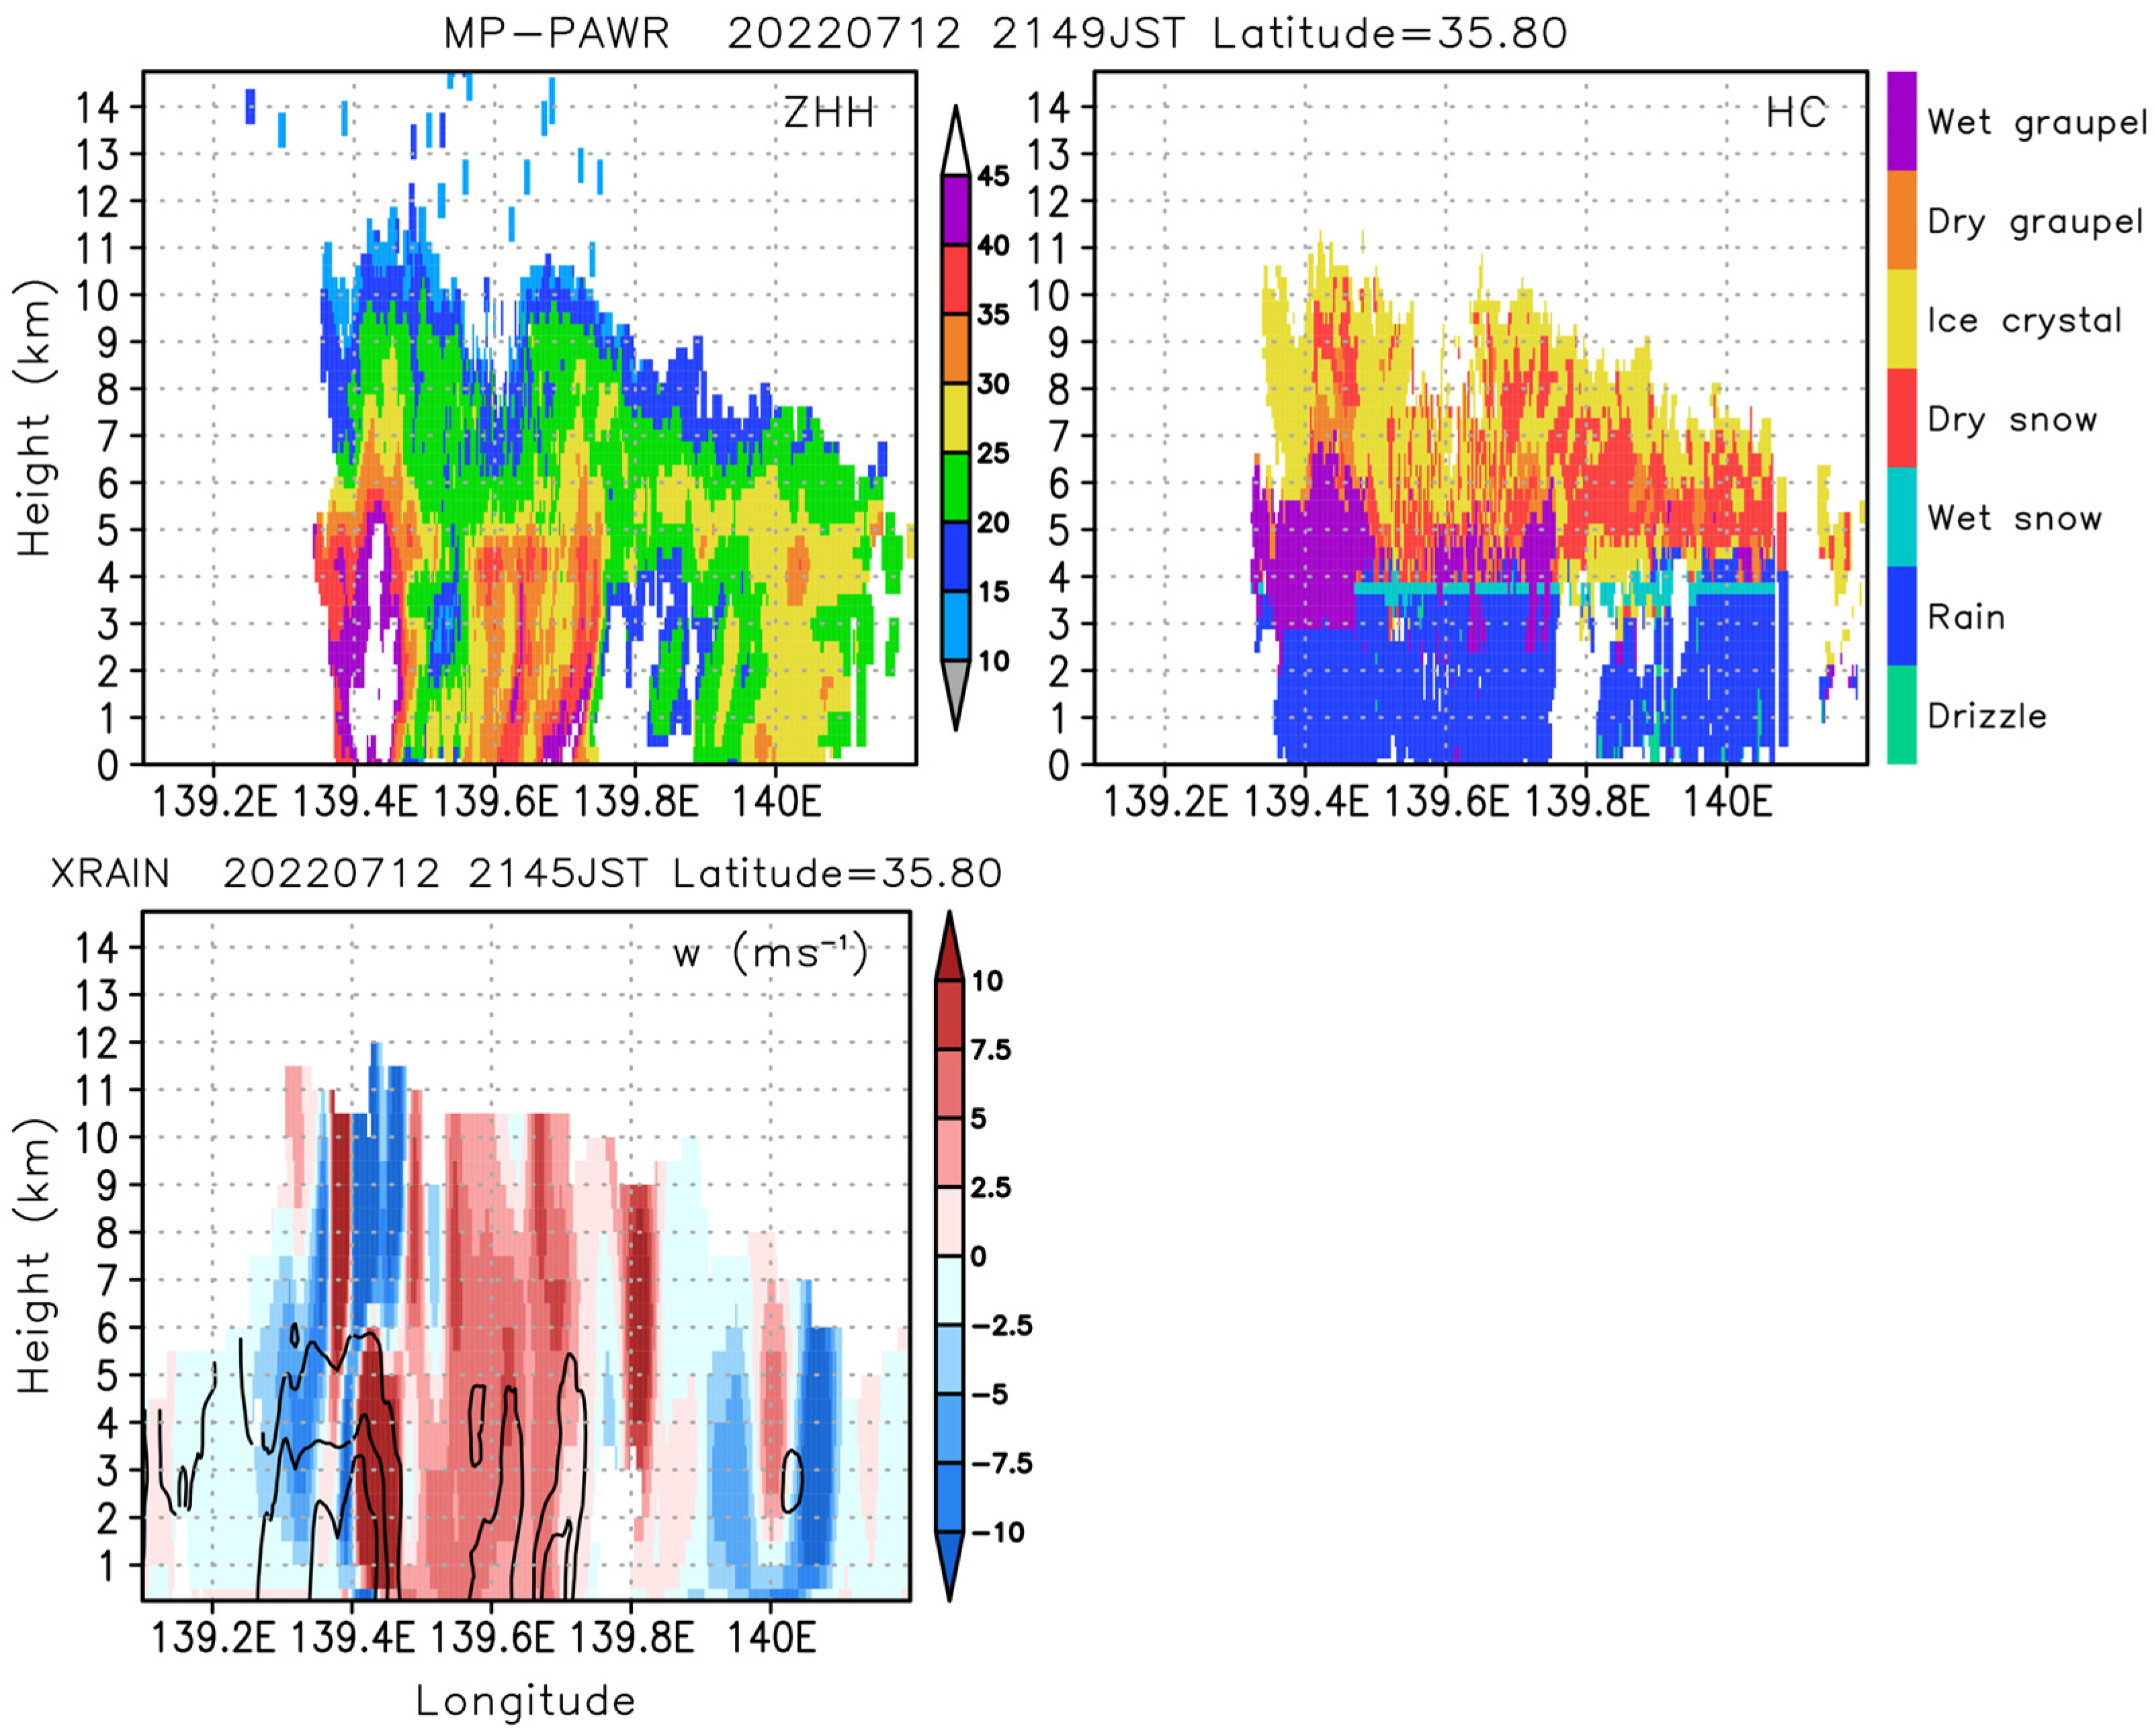
Figure 9 presents a vertical cross-section (along 35.8°N) of Z in dBZ (top left) and hydrometeor classification (top right) derived from MP-PAWR at the time of the GPM/DPR overpass (21:49 JST). At the western edge of the cross-section (around 139.4°E), radar echoes exceeding 45 dBZ were observed, with echo tops reaching above 12 km. In this region, wet graupel was detected near and above the 0 °C level, below an altitude of approximately 6.5 km. In the higher-reflectivity region (139.40 to 139.45°E), dry graupel extended between 6.5 and 8 km, and dry snow was found above this height. Ice crystals were mainly identified in the surrounding area above the 0 °C level. In the central part of the echo (around 139.7°E), a relatively high echo top (>10 km) was observed, with wet graupel and wet snow detected near the 0 °C level. The vertical extent of wet graupel was smaller than that in the western region. Ice crystals and dry snow were dominant at higher altitudes. The echo top height decreased toward the east, and graupel was not detected in this region. A dual-Doppler analysis using composite XRAIN data revealed that the strong echo region around 139.4°E observed by MP-PAWR corresponds to a distinct convective core identified in the 5 min composite XRAIN echoes (bottom panel in Figure 9). The strong echo region appeared wider than that in the corresponding MP-PAWR observation (left panel in Figure 9) because it represents a 5 min data accumulation and a composite of four radars. The western edge of the convective echo was dominated by two strong updrafts, with one exceeding 10 m s−1 and the other approximately 5 m s−1. The updraft region (top left panel in Figure 9) extended up to 9 km in altitude. A downdraft exceeding 5 m s−1 was observed in the strongest echo region between 1 and 7 km in altitude. No distinct vertical motion was seen east of the strongest echo region, even though relatively strong echoes exceeding 30 dBZ were present. These results indicate that the hydrometeor classification obtained from MP-PAWR is consistent with the observed convective structure. A relatively weaker updraft, with a maximum speed exceeding 5 m s−1, dominated a broad area between 139.5°E and 139.7°E from the surface to the echo top. These findings support the existence of graupel near the strong echo region, with larger graupel areas located in regions with stronger updrafts.
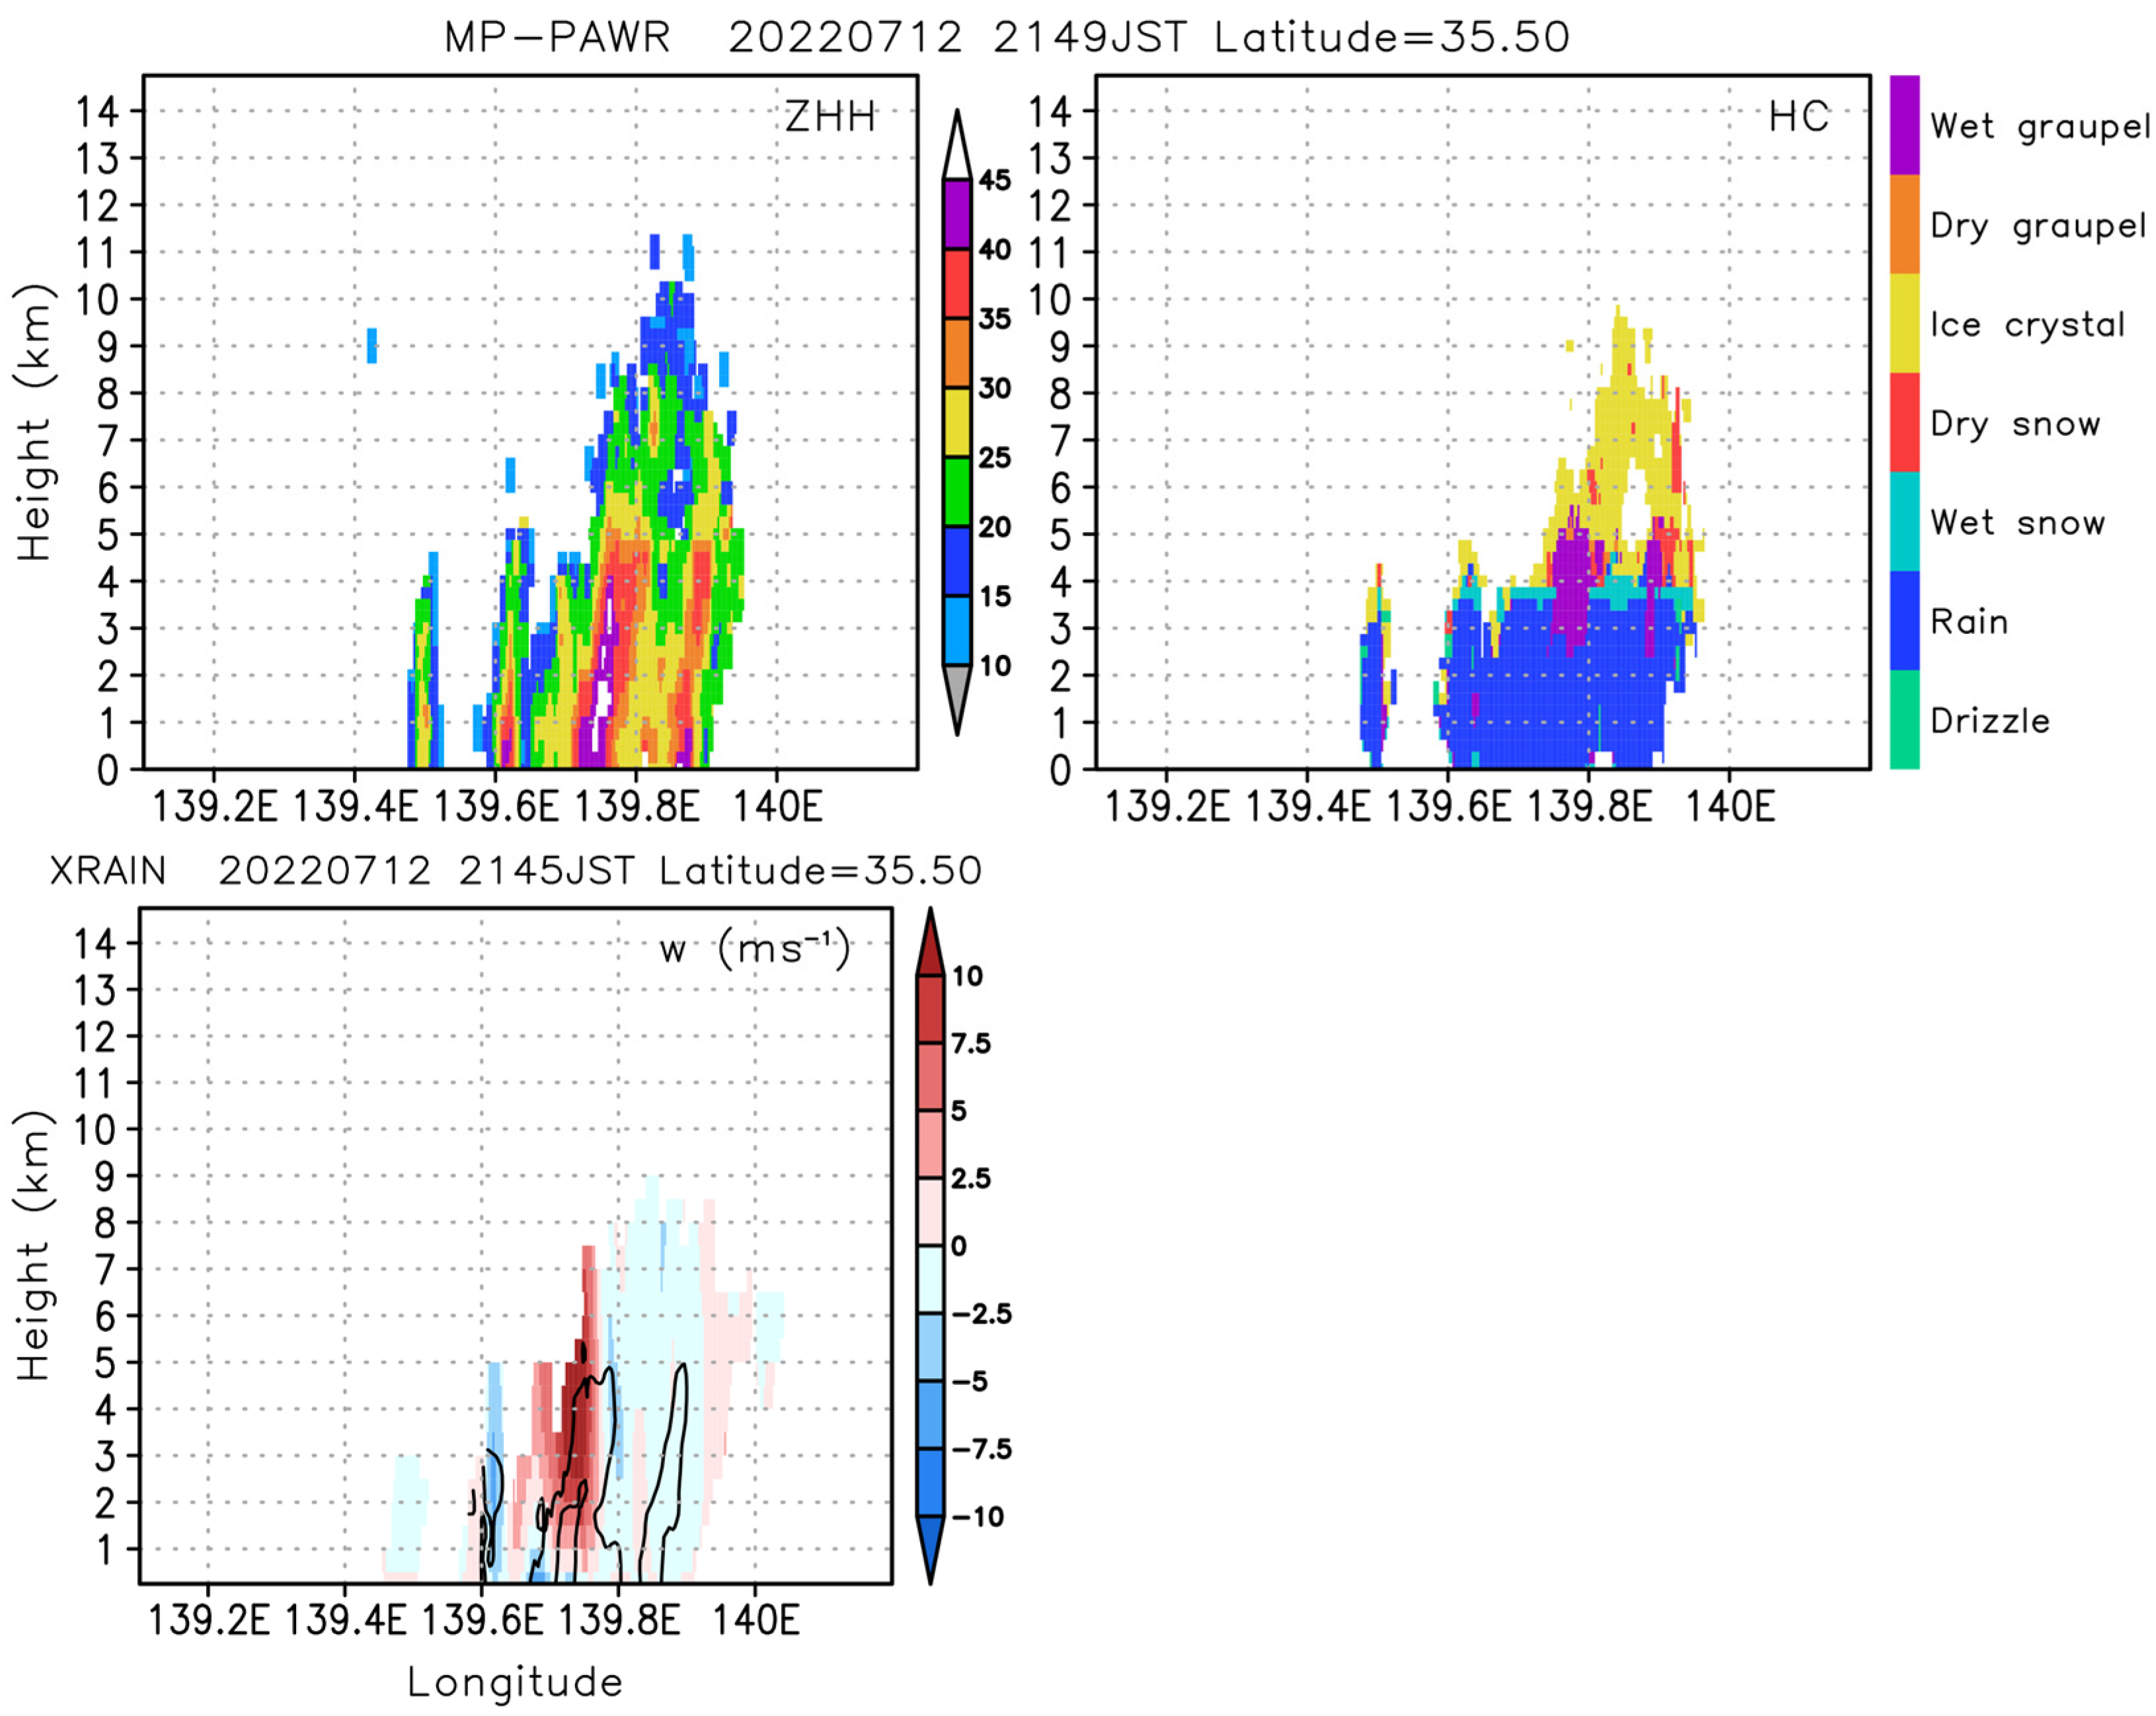
Figure 10 shows a vertical cross-section along 35.5°N of Z in dBZ (top left) and the hydrometeor classification derived from MP-PAWR (top right) at the time of the GPM/DPR overpass. This cross-section represents the vertical structure of a relatively small echo located south of the radar site (see Figure 7). The echo top height exceeded 10 km, and maximum reflectivity reached 45 dBZ. Wet graupel was identified in the middle of the echo, but the area was smaller than that shown in Figure 9. The bottom panel in Figure 10 shows the corresponding vertical air velocity (ms−1) field obtained from composite XRAIN data. A strong updraft, with a maximum speed of about 10 m s−1, was identified in the strong echo region, extending from 1 km to 7.5 km in altitude.
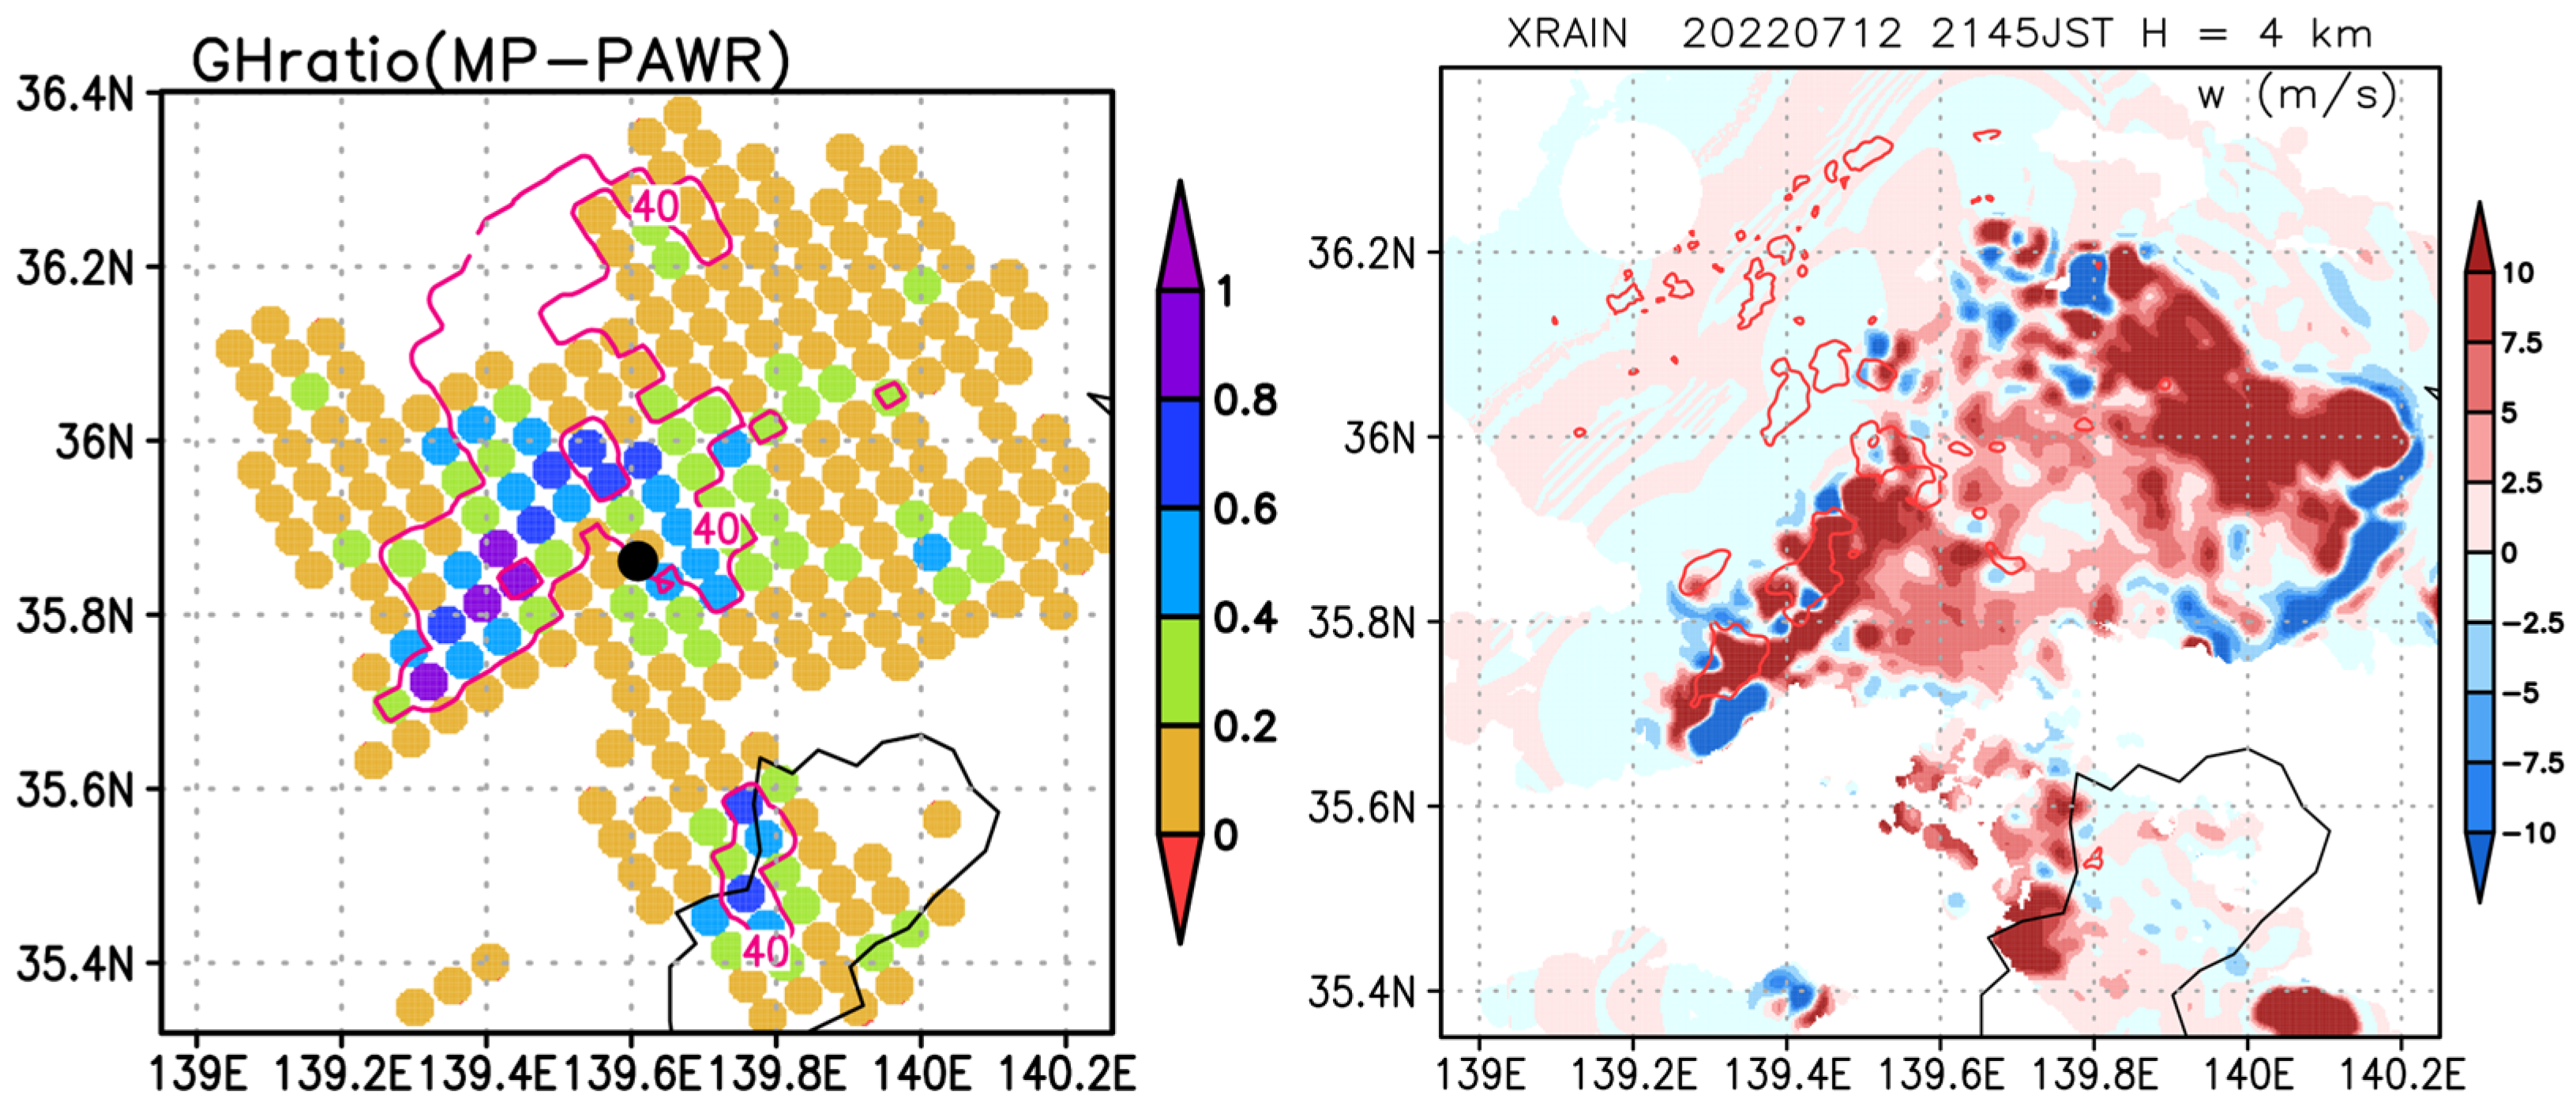
We further examined the spatial distribution of graupel and hail detections to investigate their relationship with DPR-derive parameters. Figure 11 shows the GHratio (graupel–hail ratio, Equation (2)) derived from MP-PAWR (color shading), overlaid on KuPR reflectivity contours ≥40 dBZ (contour) at an altitude of 2 km. The GHratio was calculated for each DPR observation volume, referring to the DPR footprint location and incident angle. In this case, the GHratio values were averaged between 1 km below and 1 km above the 0 °C level, where wet graupel frequently appears. High GHratio values (e.g., >0.6) generally coincide with strong (>40 dBZ) echo regions in KuPR, supporting the usefulness of the GHratio as an indicator of graupel or hail. Regions with a moderate GHratio (0.6 > GHratio > 0.4) were found surrounding the high-GHratio areas. The spatial pattern of moderate to high GHratio values corresponds to that of reflectivity factors exceeding 30 dBZ.
The right panel in Figure 11 shows the horizontal distribution of vertical air motion obtained from XRAIN radar. The high-GHratio region almost corresponds to the high-updraft region shown in Figure 9 and Figure 10, although the high-updraft region extended eastward into areas where the radar reflectivity factor is relatively low. This indicates that graupel formed in areas with strong updrafts and large Z values (high particle concentration or large particles), consistent with typical conditions for graupel formation. The hydrometeor classification algorithm for MP-PAWR [18] assigns greater weight to graupel for reflectivity above 30 dBZ and allows for a broader ZDR range above the 0 °C level.
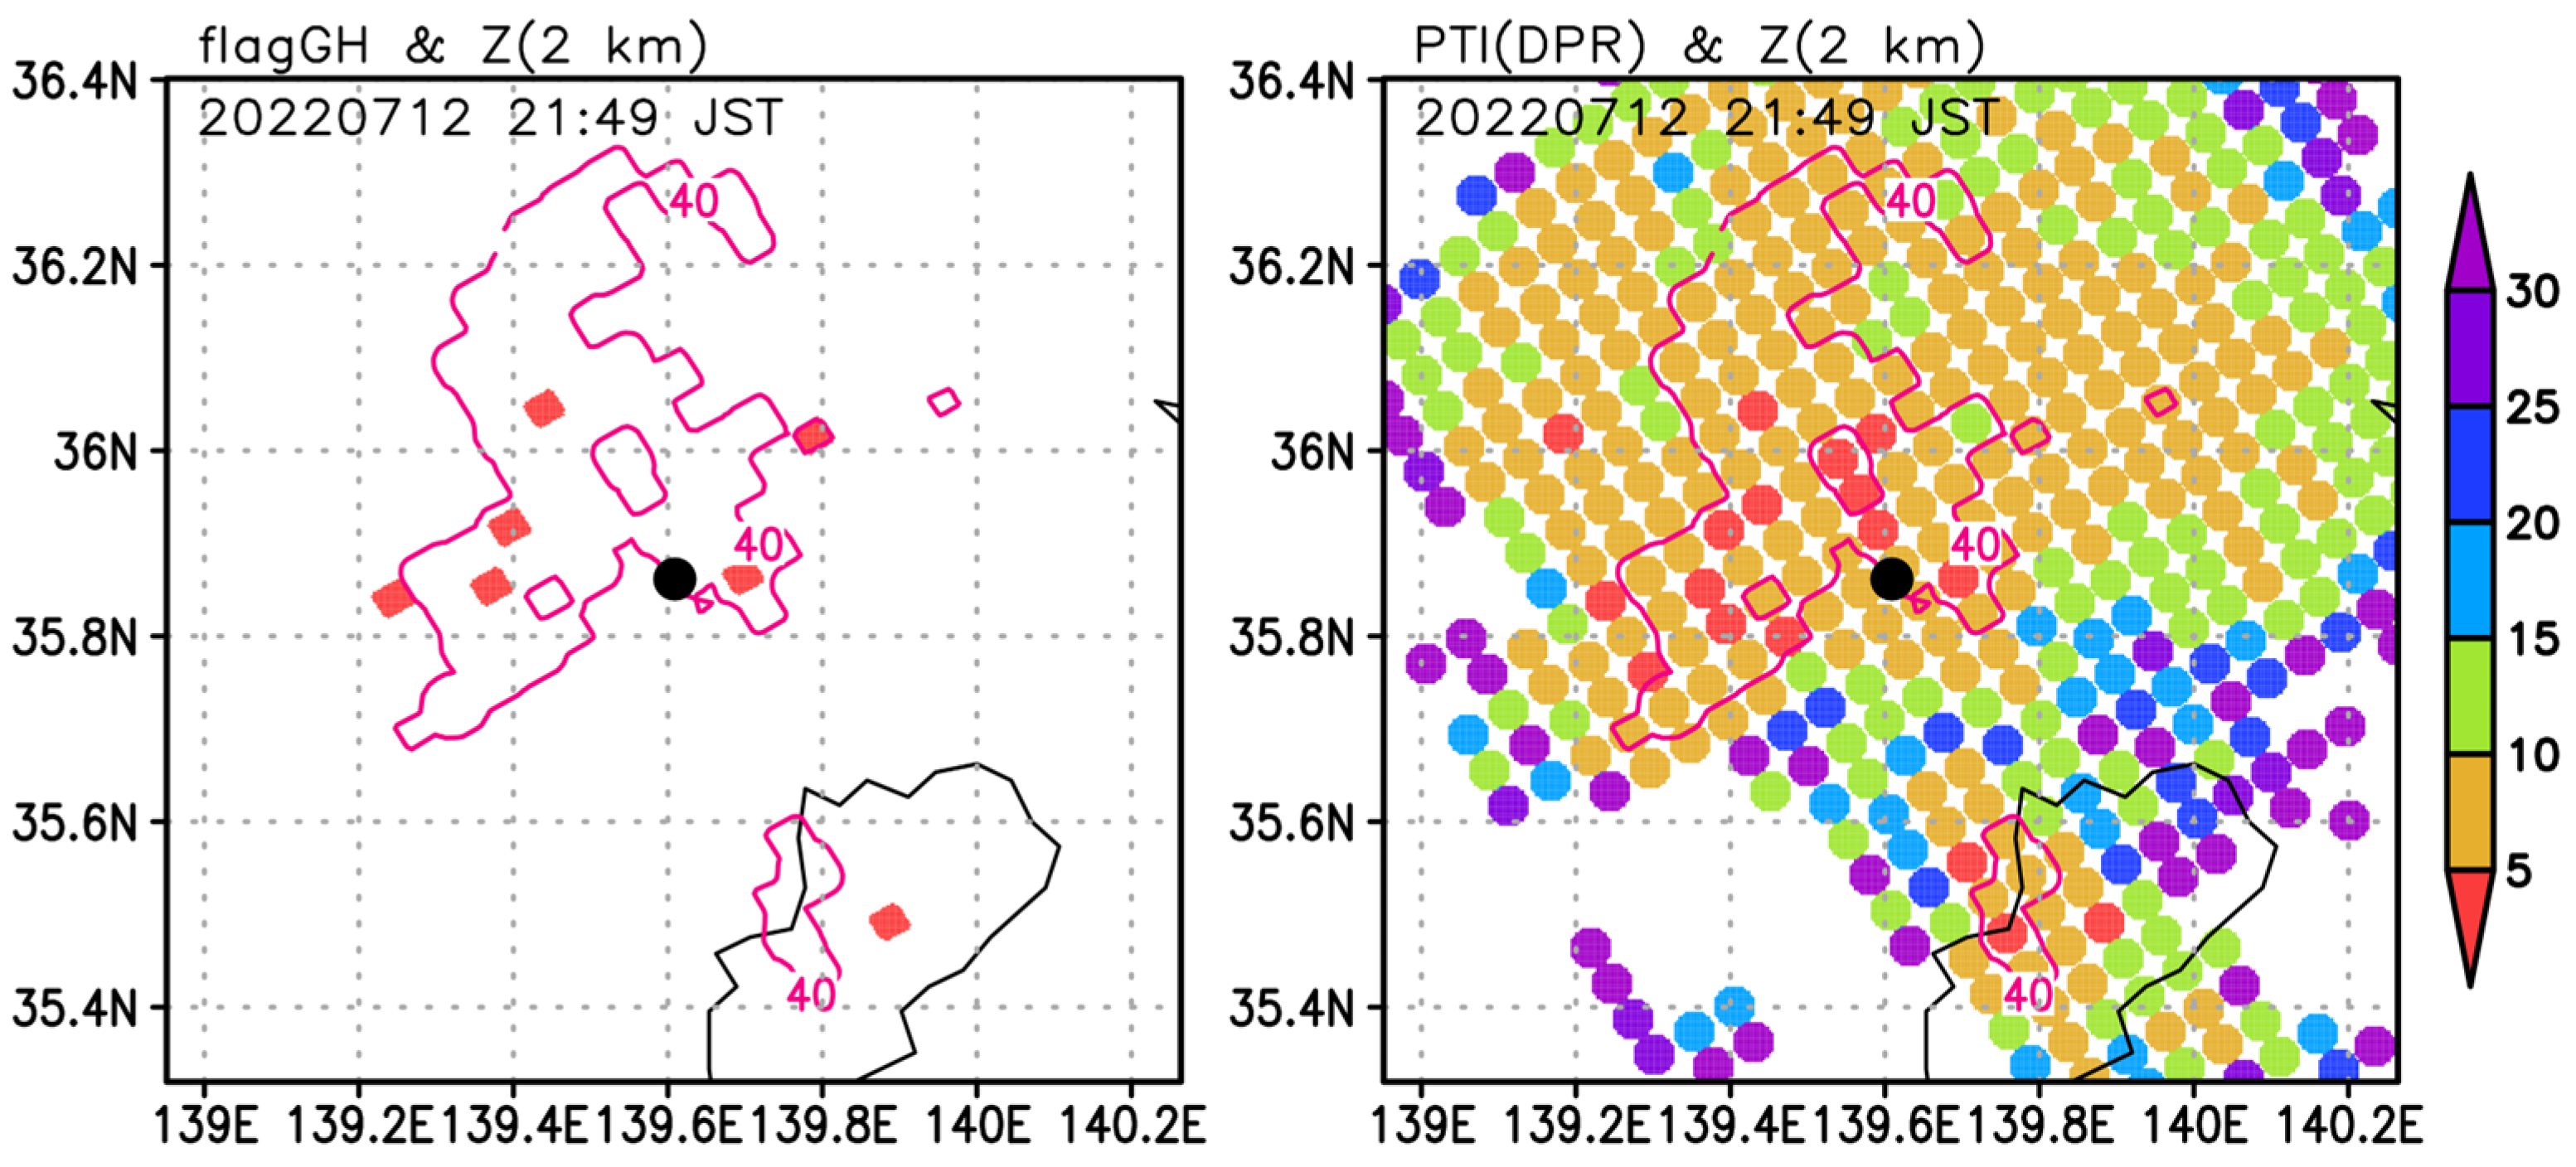
The left panel in Figure 12 shows the spatial distribution of DPR flagGraupelHail detections overlaid on KuPR reflectivity at an altitude of 2 km. Only seven DPR footprints indicated the presence of graupel. The flagGraupelHail detections coincide with high-GHratio regions; however, more than half of high-GHratio areas were not flagged as graupel by DPR. The right panel of Figure 12 shows that regions with low PTI values—the basis of flagGraupelHail—align well with high-GHratio areas (Figure 11), although the low-PTI regions are spatially discrete. This suggests that current PTI threshold tuning is insufficient to reproduce results consistent with the GHratio; therefore, additional parameters should be incorporated.
Figure 13 presents a two-dimensional histogram comparing PTI values and the GHratio within the overlapping observation volumes of DPR and MP-PAWR. A moderate negative correlation (r = −0.409) was observed, indicating that lower PTI values correspond to a higher likelihood of graupel or hail occurrence. However, the considerable scatter in the relationship suggests that low PTI values can appear even when the GHratio is small, indicating that a single PTI threshold may misclassify graupel or hail detection and highlighting the need for additional or alternative indices to represent graupel and hail occurrences.
Previous studies have proposed several single-polarization radar techniques for hail detection, including maximum reflectivity thresholds (≥55 dBZ: [24,25]), vertically integrated liquid water (VILD; [26]), the height of the 45 dBZ echo above the 0 °C level [27], and combinations of cloud-top temperature with low-level reflectivity [28]. For graupel detection, Antonescu et al. [29] note that reflectivity thresholds of 35–40 dBZ at the −10 °C level are widely used for cloud-to-ground lightning detection, emphasizing the critical role of graupel in cloud electrification processes. These results indicate that graupel and hail signatures can be characterized by cloud-top height (or temperature) and high reflectivity values.
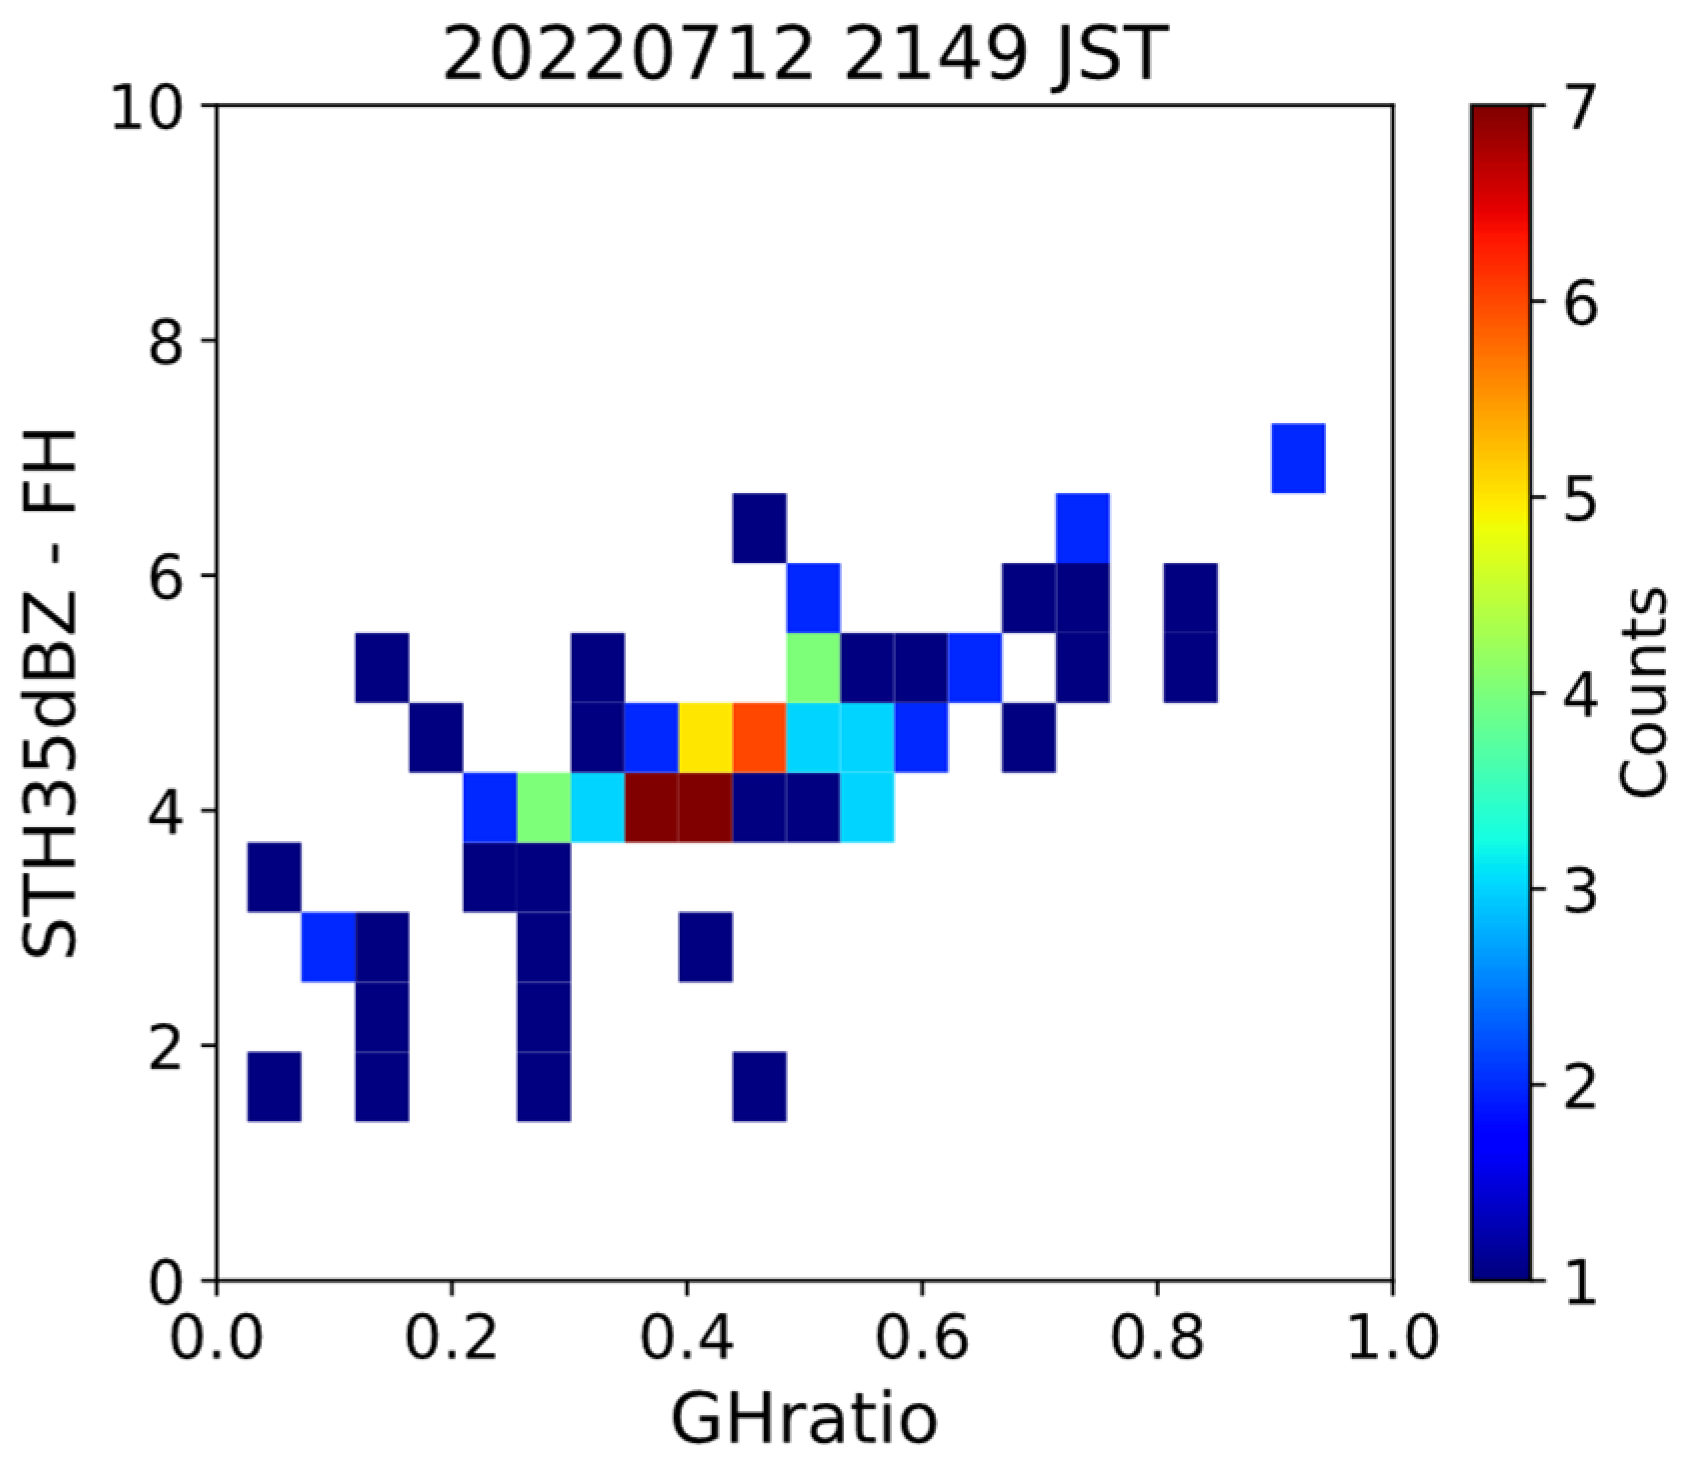
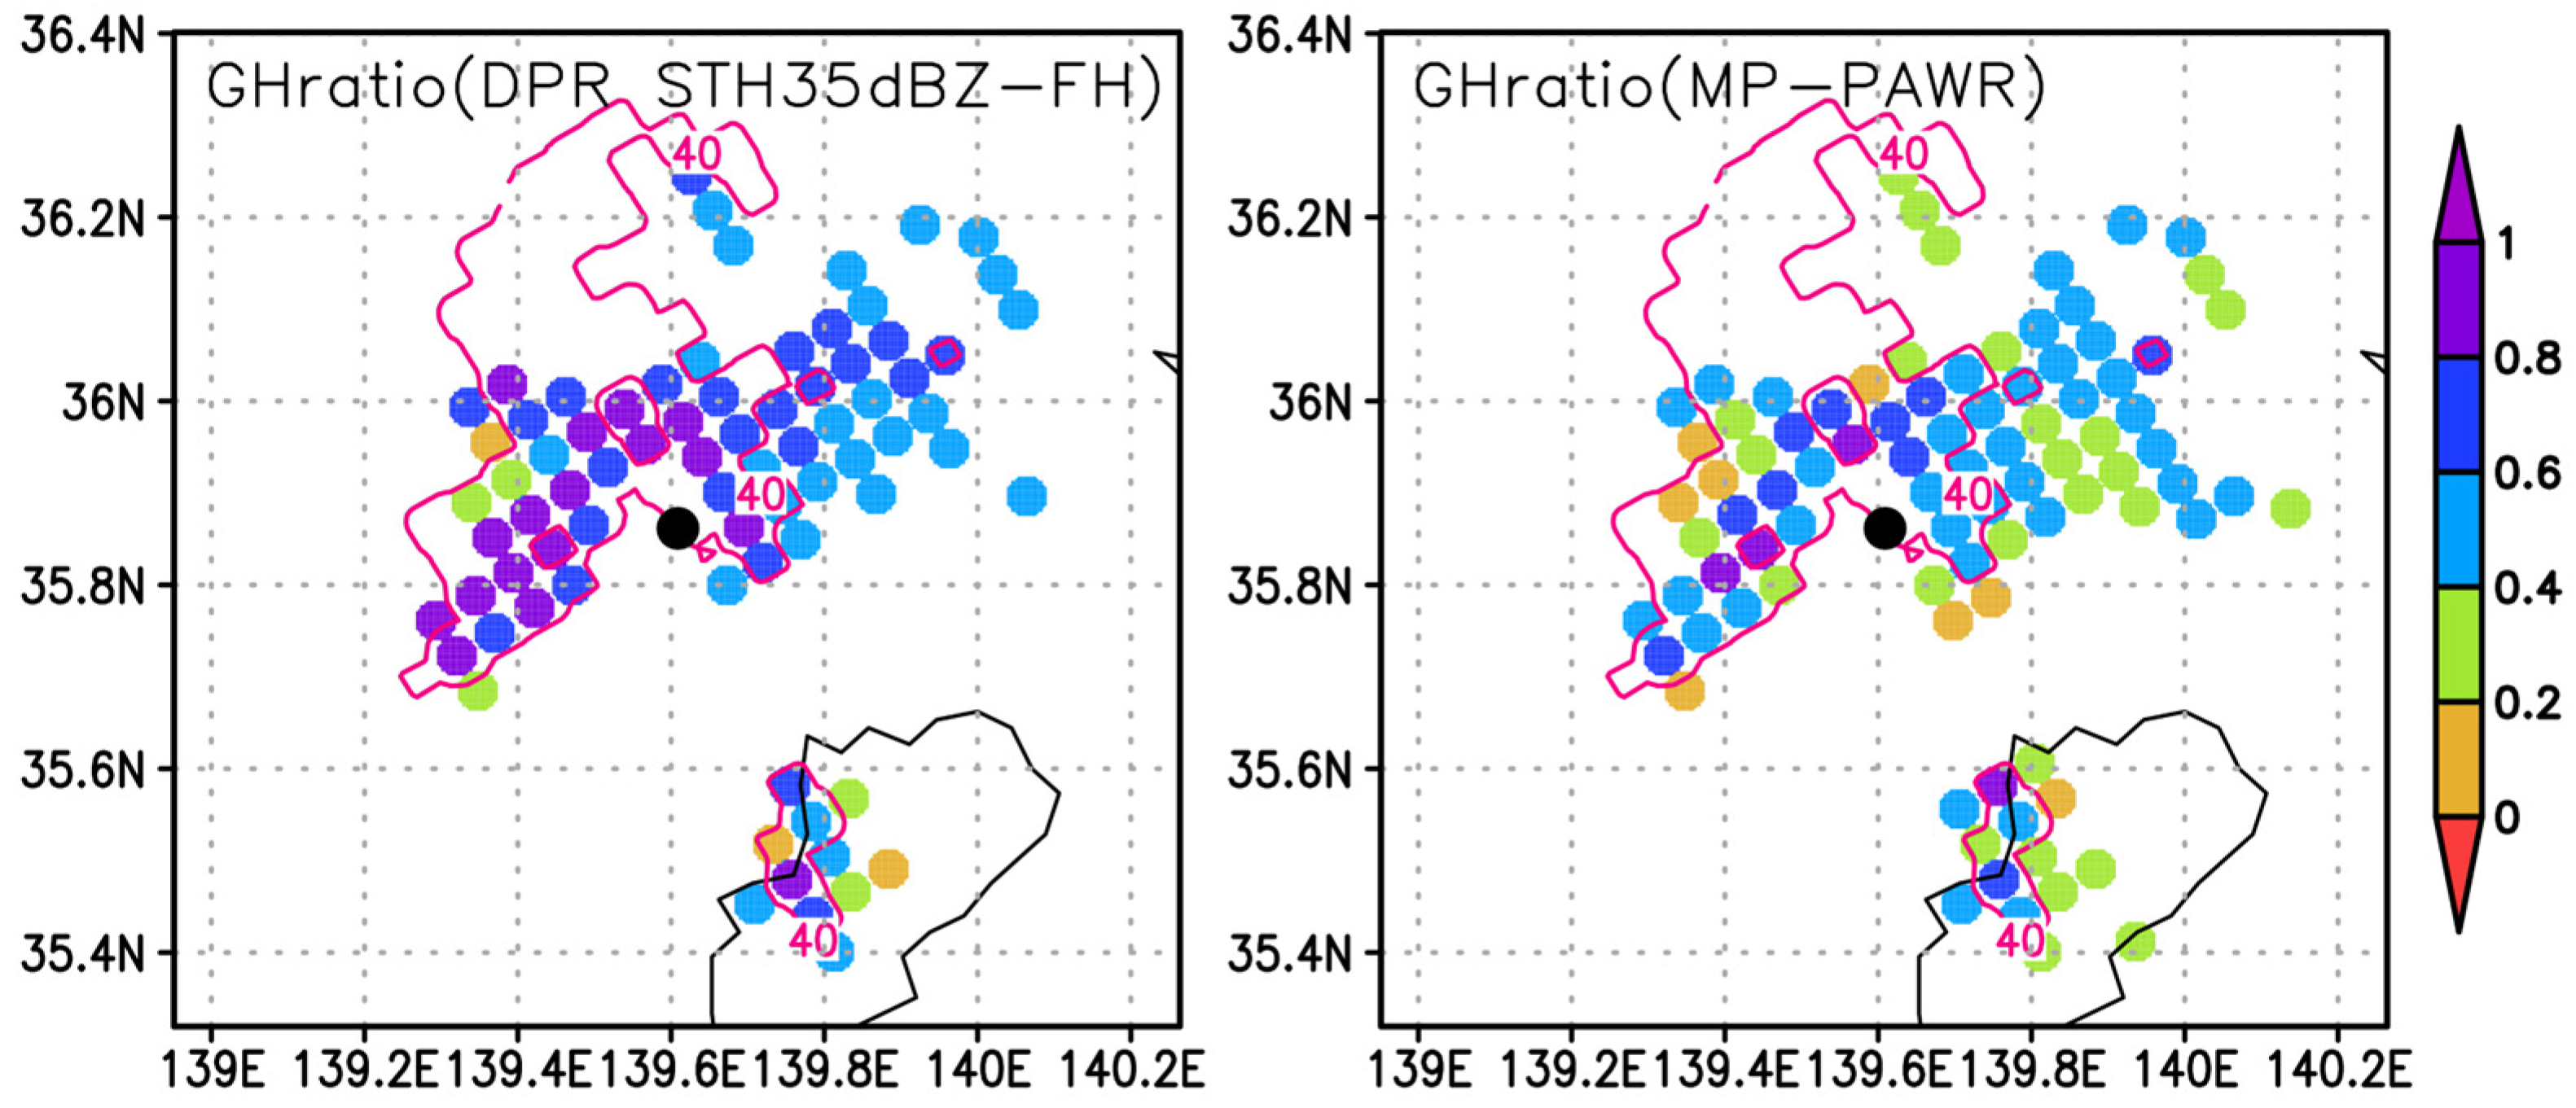
Based on these insights, we examined the height difference between the 35 dBZ echo top and the 0 °C level (hereafter referred to as STH35-FH) as a potential indicator for graupel or hail occurrence. Figure 14 shows the relationship between the GHratio and STH35-FH for the analyzed convective system. Among the tested reflectivity thresholds (25–40 dBZ), 35 dBZ yielded the highest correlation (r = 0.735), suggesting that STH35-FH effectively characterizes regions associated with graupel or hail. Incorporating STH35-FH into detection algorithms may therefore enhance the identification of graupel and hail, particularly within PTI-based algorithms. Based on the linear regression between the GHratio and STH35-FH, shown in Figure 14, we converted STH35-FH from DPR observations to a GHratio in the region with a PTI value less than 10. This PTI threshold is larger than that of the original algorithm (5.5 and 4.6 for graupel). Figure 15 compares the GHratio derived from the original MP-PAWR data with that retrieved from DPR using STH35-FH. Areas with a positive GHratio closely resemble one another, indicating the validity of introducing STH35-FH as an auxiliary parameter. It should be noted that the GHratio derived from MP-PAWR is displayed only for regions where reflectivity exceeds 30 dBZ. The GHratio retrieved from DPR exhibits relatively higher values than those from the original MP-PAWR data. Compared with original flagGraupelHail detections from DPR (Figure 12, left panel), the area with a high GHratio nearly coincides with the flagGraupelHail regions, except for where reflectivity is less than 40 dBZ. When the threshold for the retrieved high GHratio is set to 0.4, the high-GHratio area nearly corresponds to regions where the GHratio exceeds 0.2 in MP-PAWR observations (Figure 11).

4. Discussion

Previous evaluations of DPR graupel/hail-related products, such as flagHail and flagGraupelHail, have mainly been conducted in the United States using hydrometeors from the NEXRAD radar network and in a case study of a large hail event over Italy [7,8]. These studies reported good consistency between DPR detections and hydrometeor classifications obtained from ground-based observations. However, evaluations outside of the United States, particularly in humid climates, remain limited. This is because the likelihood of simultaneous thunderstorm observation by both DPR and ground-based radar is low, and few dual-polarization radars can cover higher altitudes above the freezing level.
The present study provides, for the first time, an evaluation of flagGraupelHail in convective systems that developed under moist environmental conditions typical of the region around Tokyo, Japan (35° to 36°N) during summer. In moist environments, updraft speeds in convective clouds are weaker than those in drier regions, such as the United States. Consequently, hail sizes tend to be smaller, and wet graupel is likely to occur. In this case, the CAPE was approximately 1200 J kg−1, and the freezing level was around 5.5 km, consistent with moist maritime air masses. In this study, we employed a hydrometeor classification algorithm for X-band radar, which is more sensitive to weaker precipitation than S-band radars, partly due to the higher sensitivity of KDP.
The analysis indicates that the graupel region estimated from MP-PAWR is generally larger than that identified by DPR (flagGraupelHail). In other words, the current PTI thresholds employed by DPR may be too low for effective detection of graupel and hail under such humid environmental conditions. Specifically, our analysis revealed several cases in which MP-PAWR detected significant graupel signatures (high GHratio), while the DPR flagGraupelHail remained inactive. Conversely, there were also cases where flagGraupelHail was detected in regions showing only weak graupel or hail signals in the MP-PAWR observations. This inconsistency suggests that PTI alone may not fully capture the complexities of graupel and hail occurrence, particularly in moist atmospheric conditions where the microphysical processes differ from those in drier regions, such as the central United States. As shown in Equation (1), the PTI value is calculated based on the slope of DFRm, storm-top height, and maximum reflectivity. Severe thunderstorms over the United States show extremely high Z and storm-top heights corresponding to large CAPE values, whereas thunderstorms in humid regions, such as Japan, have relatively weak Z and low storm-top heights, consistent with moderate CAPE values. Therefore, the PTI threshold should be adjusted according to regional conditions, or additional constraints should be introduced to improve graupel/hail detection.
It should be emphasized that MP-PAWR provides high-temporal-resolution (30 s) and high-spatial-resolution dual-polarization data without spatial gaps. Therefore, MP-PAWR observations offer much greater temporal and spatial overlap with spaceborne radar than previous comparisons using conventional parabolic antenna radars. It should be noted that we excluded both the blind zone caused by nearby buildings and regions heavily affected by attenuation in this study. The latter is an unavoidable issue for X-band radar. The reliability of MP-PAWR hydrometeor classification is subject to uncertainties arising from attenuation corrections applied to both reflectivity and differential reflectivity. When attenuation correction for Z is overestimated, the corresponding correction for ZDR also tends to become excessive. According to the method proposed by [18], this may lead to misclassifications, such as from dry graupel to wet graupel or from wet graupel to rain and hail categories. In addition, overestimation of ZDR can change the hydrometeor type from graupel to rain. As shown in Figure 2, which compares the attenuation-corrected Z between KuPR and MP-PAWR, the uncertainty of Z is approximately 3 dB. This value does not have a significant impact on graupel (dry/wet) determination when discussing Z values around 40 dBZ, as shown in [18]. ZDR uncertainty is approximately 0.5 dB based on our bias correction method, which does not affect graupel classification. In the present study, the absence of dry graupel near the 0 °C level suggests that the attenuation corrections applied were reasonably accurate.
Our results further suggest that incorporating the height of strong reflectivity cores relative to the 0 °C level—specifically, the STH35-FH parameter (defined as the height of the 35 dBZ echo above the freezing level)—can enhance the accuracy of graupel and hail detection. The GHratio calculated from DPR data using STH35-FH with a relaxed PTI threshold of 10 corresponded reasonably well with the GHratio derived from MP-PAWR. Introducing STH35-FH into the DPR algorithm improved the consistency between DPR detections and MP-PAWR observations, particularly by reducing false positives in regions with weak graupel or hail occurrence. In this study, the GHratio was calculated between 1 km below and 1 km above the 0 °C level, as most graupel signals appeared within that height range. Further approaches should be considered to detect graupel occurring at higher altitudes (>1 km above the 0 °C level).
This finding is consistent with previous hail detection methodologies emphasizing the importance of the vertical echo structure [27,29]. Stronger updrafts are required to sustain the growth of graupel and hail, resulting in elevated reflectivity cores above the melting level. The STH35-FH parameter effectively captures this physical characteristic, making it a promising candidate for incorporation into future DPR retrieval algorithms. The freezing level in this region during summer reaches approximately 5 km. Therefore, using the echo top height from the 0 °C level implies that it can more appropriately represent convective systems producing hail or graupel than simply using the echo top height in PTI. This suggests that STH35-FH may not be globally applicable. It should be noted that this algorithm is only applicable in cases of deep convection in which the echo top is sufficiently high above the freezing level (>2 km).
Furthermore, our analysis highlights the value of high-resolution ground-based radar networks, such as MP-PAWR, in complementing satellite-based observations. The rapid volumetric scanning capability of MP-PAWR enables the capture of rapidly evolving convective structures, providing insights that are difficult to obtain from spaceborne platforms alone. Integration of MP-PAWR and DPR data could thus contribute to refining global precipitation products and improving their applicability across diverse climatic regimes.
This study demonstrates the limitations of the current PTI-based approach in humid environments and proposes the incorporation of STH35-FH as a physically meaningful and operationally feasible enhancement to the flagGraupelHail algorithm. Future work should further examine the robustness of this approach across different storm types and climatic regimes and investigate additional microphysical indicators that could complement existing DPR detection frameworks.

5. Conclusions

In this study, we evaluated the performance of the flagGraupelHail product from the Dual-Frequency Precipitation Radar aboard the GPM Core Observatory using high-resolution, dual-polarization observations from MP-PAWR. Our analysis focused on a convective system that developed in a humid environment over the Tokyo region of Japan, providing a valuable assessment in a climatic regime that has been underrepresented in previous studies.
First, we developed a new match-up method between MP-PAWR and DPR, taking advantage of MP-PAWR’s gap-free volumetric scan, which requires only 30 s for full 3D observation. In this study, MP-PAWR data were gridded at a 0.25 km resolution, and all grid points within each DPR beam (range resolution of 250 m) were averaged and compared with DPR observations. Comparison with the preceding method [17] indicated that our approach agrees reasonably well with that of [17]. This method enables direct comparison with the original volumetric data of DPR. Second, bias correction for radar reflectivity in MP-PAWR was implemented using match-up data from the well-calibrated XRAIN radar network. The applied correction proved effective, yielding good agreement with KuPR reflectivity observations (bias ≈ 0.9 dB; RMSE ≈ 1.8 dB). MP-PAWR successfully captured fine-scale vertical structures of the precipitation system, including graupel and hail signatures, owing to its high temporal and spatial resolution.
Our comparison revealed that although DPR’s flagGraupelHail product generally corresponded to regions with high graupel or hail occurrence, as indicated by the MP-PAWR GHratio, notable discrepancies remained. Specifically, DPR tended to miss some regions with high graupel concentrations while also flagging graupel or hail in areas where MP-PAWR detected little to no such hydrometeors. These findings suggest that the current PTI-based detection algorithm, though effective in some environments, may not be fully optimized for humid conditions, such as those observed in this study.
To address this issue, we incorporated an alternative indicator, the height of the 35 dBZ echo relative to the 0 °C level (STH35-FH). This parameter effectively captured the vertical development of strong echoes associated with the growth of graupel and hail. By introducing STH35-FH with a relaxed PTI threshold of 10, graupel detection by DPR became more consistent with MP-PAWR observations, reducing false positives and enhancing detection accuracy. This study demonstrated improvements to the algorithm under humid conditions, but further investigation is needed to identify parameters applicable to various environments.
Our results highlight the importance of tailoring graupel and hail detection algorithms to account for environmental variability, particularly in humid climates where storm dynamics and microphysical processes differ from those in drier regions. The findings also demonstrate the value of synergistically combining spaceborne and ground-based radar observations to improve global precipitation retrieval.
Future work should extend this analysis to multiple storm cases across diverse climatic regions to further validate the proposed improvements. Because there were few overflight cases from the GPM Core Observatory within the MP-PAWR observation range during deep convection events, we conducted a case study. Additionally, incorporating other microphysical and dynamical indicators, such as updraft strength and dual-polarization signatures, could enhance the robustness of DPR’s solid precipitation products.
In conclusion, this study provides new insights into the detection of graupel and hail using spaceborne radar observations in humid environments, highlighting the potential of high-resolution phased array radar for improving satellite-based solid precipitation retrievals and advancing our understanding of graupel and hail microphysics in humid regions.

Author Contributions

Conceptualization, N.T.; methodology, N.T. and T.K.; software, T.K. and N.T.; writing—original draft preparation, N.T. and T.K.; writing—review and editing, N.T.; visualization, T.K. and N.T. All authors have read and agreed to the published version of the manuscript.

Funding

This work was supported by the 4th Research Announcement on the Earth Observations of the Japan Aerospace Exploration Agency (JAXA) JX-PSPC-576316.

Data Availability Statement

GPM data are available both from JAXA (https://gportal.jaxa.jp/) and NASA (https://gpm.nasa.gov/data) (accessed 1 May 2025). MP-PAWR data are available by contacting the National Institute of Information and Communications Technology (panda-pub@ml.nict.go.jp).

Conflicts of Interest

The authors declare no conflicts of interest.

References

  1. Brooks, H.E. Severe thunderstorms and climate change. Atmos. Res. 2013, 123, 129–138. [Google Scholar] [CrossRef]
  2. Diffenbaugh, N.S.; Scherer, M.; Trapp, R.J. Robust increases in severe thunderstorm environments in response to greenhouse forcing. Proc. Natl. Acad. Sci. USA 2013, 110, 16361–16366. [Google Scholar] [CrossRef] [PubMed]
  3. Taszarek, M.; Brooks, H.E.; Czernecki, B.; Allen, J.T.; Leskinen, M. Global climatology and trends in convective environments from ERA5. NPJ Clim. Atmos. Sci. 2021, 4, 30. [Google Scholar] [CrossRef]
  4. Hou, A.; Coauthors, Y. The Global Precipitation Measurement Mission. Bull. Amer. Meteor. Soc. 2014, 95, 701–722. [Google Scholar] [CrossRef]
  5. Iguchi, T.; Seto, S.; Meneghini, R.; Yoshida, N.; Awaka, J.; Le, M.; Chandrasekar, V.; Brodzik, S.; Tanelli, S.; Kanemaru, K.; et al. GPM/DPR Level-2 Algorithm Theoretical Basis Document. 2024. Available online: https://www.eorc.jaxa.jp/GPM/doc/algorithm/ATBD_DPR_L2.pdf (accessed on 15 April 2025).
  6. Takahashi, N.; Kurosawa, Y. Evaluation of Global Precipitation Measurement (GPM) Dual-Frequency Precipitation Radar (DPR) Heavy Ice Precipitation Products. J. Atmos. Ocean. Technol. 2025, 42, 1063–1084. [Google Scholar] [CrossRef]
  7. Le, M.; Chandrasekar, V. Graupel and hail identification algorithm for the Dual-frequency Precipitation Radar (DPR) on the GPM core satellite. J. Meteor. Soc. Jpn. 2021, 99, 49–65. [Google Scholar] [CrossRef]
  8. Le, M.; Chandrasekar, V. Hail Identification Algorithm for DPR Onboard the GPM Satellite. IEEE Trans. Geosci. Remote Sens. 2023, 61, 4106114. [Google Scholar] [CrossRef]
  9. Iguchi, T.; Kawamoto, N.; Oki, R. Detection of Intense Ice Precipitation with GPM/DPR. J. Atmos. Ocean. Technol. 2018, 35, 491–502. [Google Scholar] [CrossRef]
  10. Allen, J.T. Understanding Hail in the Earth System. Rev. Geophys. 2020, 58, e2019RG000665. [Google Scholar] [CrossRef]
  11. Bodine, D.J.; Griffin, C.B. Meteorological Research Enabled by Rapid-Scan Radar Technology. Mon. Weather Rev. 2024, 152, 3–37. [Google Scholar] [CrossRef]
  12. Takahashi, N.; Ushio, T.; Nakagawa, K.; Mizutani, F.; Iwanami, K.; Yamaji, A.; Kawagoe, T.; Osada, M.; Ohta, T.; Kawasaki, M. Development of Multi-Parameter Phased Array Weather Radar (MP-PAWR) and early detection of torrential rainfall and tornado risk. J. Disaster Res. 2019, 14, 235–247. [Google Scholar] [CrossRef]
  13. Takahashi, N.; Ushio, T.; Mizutani, F.; Hanado, H. Phased array weather radar developed in Japan. In Advances in Weather Radar; The Institution of Engineering and Technology: Edison, NJ, USA, 2023; Chapter 1. [Google Scholar] [CrossRef]
  14. Battaglia, A.; Tanelli, S.; Mroz, K.; Tridon, F. Multiple scattering in observations of the GPM dual-frequency precipitation radar: Evidence and impact on retrievals. J. Geophys. Res. Atmos. 2015, 120, 4090–4101. [Google Scholar] [CrossRef]
  15. Sano, H.; Ikoma, E.; Kitsuregawa, M.; Oguchi, M. Proposed method for disaster prevention-oriented synthetic rainfall of C-band radar and XRAIN. In IMCOM ’18, Proceedings of the 12th International Conference on Ubiquitous Information Management and Communication, Langkawi, Malaysia, 5–7 January 2018; Association for Computing Machinery: New York, NY, USA, 2018; p. 7. [Google Scholar] [CrossRef]
  16. Gourley, J.J.; Illingworth, A.J.; Tabary, P. Absolute Calibration of Radar Reflectivity Using Redundancy of the Polarization Observations and Implied Constraints on Drop Shapes. J. Atomos. Ocean. Technol. 2009, 26, 689–703. [Google Scholar] [CrossRef]
  17. Masaki, T.; Iguchi, T.; Kanemaru, K.; Furukawa, K.; Yoshida, N.; Kubota, T.; Oki, R. Calibration of the dual-frequency precipitation radar onboard the global precipitation measurement core observatory. IEEE Trans. Geosci. Remote Sens. 2022, 60, 5100116. [Google Scholar] [CrossRef]
  18. Kouketsu, T.; Uyeda, H.; Ohigashi, T.; Oue, M.; Takeuchi, H.; Shinoda, T.; Tsuboki, K.; Kubo, M.; Muramoto, K. A hydrometeor classification method for X-band polarimetric radar: Construction and validation focusing on solid hydrometeors under moist environments. J. Atmos. Ocean. Technol. 2015, 32, 2052–2074. [Google Scholar] [CrossRef]
  19. Bolen, S.M.; Chandrasekar, V. Methodology for aligning and comparing spaceborne radar and ground-based radar observations. J. Atmos. Ocean. Technol. 2003, 20, 647–659. [Google Scholar] [CrossRef]
  20. Schwaller, M.R.; Morris, K.R. A ground validation network for the Global Precipitation Measurement mission. J. Atmos. Ocean. Technol. 2011, 28, 301–319. [Google Scholar] [CrossRef]
  21. Mishchenko, M.I.; Videen, G.; Babenko, V.A.; Khlebtsov, N.G.; Wriedt, T. T-matrix theory of electromagnetic scattering by particles and its applications: A comprehensive reference database. J. Quant. Spectrosc. Radiat. Transf. 2004, 88, 357–406. [Google Scholar]
  22. Bringi, V.N.; Chandrasekar, V. Polarimetric Doppler Weather Radar: Principles and Applications; Cambridge University Press: Cambridge, UK, 2001; 636p. [Google Scholar]
  23. Jackson, R.; Collis, S.; Lang, T.; Potvin, C.; Munson, T. PyDDA: A Pythonic direct data assimilation framework for wind retrievals. J. Open Res. Softw. 2020, 8, 20. [Google Scholar] [CrossRef]
  24. Schiesser, H.H. Hailfall: The relationship between radar measurements and crop damage. Atmos. Res. 1990, 25, 559–582. [Google Scholar] [CrossRef]
  25. Hohl, R.; Schiesser, H.H.; Aller, D. Hailfall: The relationship between radar-derived hail kinetic energy and hail damage to buildings. Atmos. Res. 2002, 63, 177–207. [Google Scholar] [CrossRef]
  26. Amburn, S.A.; Wolf, P.L. VIL density as a hail indicator. Weather Forecast. 1997, 12, 473–478. [Google Scholar] [CrossRef]
  27. Waldvogel, A.; Federer, B.; Grimm, P. Criteria for the detection of hail cells. J. Appl. Meteor. Climatol. 1979, 18, 1521–1525. [Google Scholar] [CrossRef]
  28. Auer, A.H. Hail recognition through the combined use of radar reflectivity and cloud-top temperatures. Mon. Weather Rev. 1994, 122, 2218–2221. [Google Scholar] [CrossRef]
  29. Antonescu, B.; Burcea, S.; Tǎnase, A. Forecasting the onset of cloud-to-ground lightning using radar and upper-air data in Romania. Int. J. Climatol. 2013, 33, 1579–1584. [Google Scholar] [CrossRef]
Figure 1. Estimated surface precipitation rates (mm/hr) from DPR observations on 12 July 2022. The gray-shaded regions indicate areas outside of the DPR swath or those with undefined precipitation rates. The locations of MP-PAWR and XRAIN radar (KANTOU, FUNABASHI, SHINYOKO, and YATTAJIA) are overlaid with observation ranges of 60 km for MP-PAWR and 80 km for XRAIN. Circles indicate the ground meteorological stations at Tokorozawa and Saitama.
Remotesensing 17 03741 g001
Figure 2. Two-dimensional histogram of Z between MP-PAWR and KuPR at 21:49 JST 12 July 2022, before (left) and after (right) bias correction.
Remotesensing 17 03741 g002
Figure 3. Comparison of simulated Ku-band reflectivity derived from X-band measurements using the T-matrix method. Ku-band (KuPR) reflectivity values are up to approximately 0.5 dB higher than those of the X-band, indicating the need for frequency-dependent correction when comparing satellite and ground-based radar observations. Red dashed lines indicate the y = x and y = x − 0.5 (dB) line, respectively.
Remotesensing 17 03741 g003
Figure 4. Schematic illustration of volume matching between conventional parabolic reflector radar and DPR. The gray area of the DPR beam indicates the averaging volume for the comparison. The black dashed lines indicate the schematic view of parabolic-reflector radar beam. The MP-PAWR observation is also shown with the schematic image of simultaneous observation (blue dashed lines).
Remotesensing 17 03741 g004
Figure 5. Schematic illustration of the match-up between MP-PAWR gridded data and DPR observation volume. The left panel shows the top view and the right panel shows the side view of 9-degree scan angles of DPR. In this figure, the grid interval is 0.25 km, the DPR footprint size is 5 km, and the thickness of each volume is 250 m. Black dots indicate the data point of MP-PAWR included in a DPR volume.
Remotesensing 17 03741 g005
Figure 6. Scatterplot comparing the radar reflectivity factor (Z) between KuPR and bias-corrected MP-PAWR observations. Data points cluster around the 1:1 line, with an overall bias of approximately 0.91 dB and an RMSE of about 1.8 dB, confirming the effectiveness of bias correction.
Remotesensing 17 03741 g006
Figure 7. Horizontal cross-sections of reflectivity in dBZ at 2 km altitude observed by MP-PAWR (left) and KuPR (right). MP-PAWR data are converted to 0.25 km spatial resolution, and KuPR data are displayed as the original 5 km footprint. The black solid circle indicates the location of MP-PAWR (center of this figure). Both radars display similar precipitation patterns near the radar site, although MP-PAWR shows reduced echoes in the northwest sector due to local heavy attenuation and blind zones. Black line shows the coastline.
Remotesensing 17 03741 g007
Figure 8. Three-dimensional structures of reflectivity observed by MP-PAWR (left) and KuPR (right). View from southwest of the MP-PAWR observation domain. The smaller volume of the MP-PAWR observation is due to local attenuation and blind zones, but MP-PAWR captures fine-scale vertical structures and tower-like echoes exceeding 10 km in altitude.
Remotesensing 17 03741 g008
Figure 9. East–west vertical cross-section at 35.8°N showing the radar reflectivity factor in dBZ (top left), hydrometeor classification (top right) obtained from MP-PAWR at the time of DPR overpass (21:49 JST), and vertical velocity (ms−1) derived from XRAIN data using dual-Doppler analysis between 21:45 and 21:49 JST (bottom). Contours in the bottom panel indicate the radar reflectivity factor from composite XRAIN data from 30 dBZ with 5 dB intervals.
Remotesensing 17 03741 g009
Figure 10. East–west vertical cross-section at 35.5°N of radar reflectivity factor in dBZ (top left) and hydrometeor classification (top right) obtained from MP-PAWR at the time of DPR overpass (21:49 JST) and vertical velocity (ms−1) derived from XRAIN data using dual-Doppler analysis using data between 21:45 and 21:49 JST (bottom). Contours in the bottom panel indicate the radar reflectivity factor from composite XRAIN data from 30 dBZ with 5 dB intervals.
Remotesensing 17 03741 g010
Figure 11. (Left) Spatial distribution of GHratio (color shading) averaging between below 1 km and above 1 km from the 0 °C level derived from MP-PAWR hydrometeor classification, overlaid with KuPR reflectivity ≥40 dBZ (pink contours lines) at 2 km altitude. (Right) Spatial distribution of vertical air velocity at 4 km altitude obtained from XRAIN radar, overlaid with reflectivity ≥40 dBZ (pink contours lines) at 4 km altitude. Black line shows the coastline.
Remotesensing 17 03741 g011
Figure 12. (Left) Spatial distribution of flagGraupelHail detections from DPR (red squares), overlaid with KuPR reflectivity ≥ 40 dBZ at 2 km altitude (pink contours lines). (Right) Distribution of the Parameterized Textural Index (PTI) from DPR (colored circles), overlaid with KuPR reflectivity ≥40 dBZ (pink contours lines). Black line shows the coastline.
Remotesensing 17 03741 g012
Figure 13. Two-dimensional histogram showing the relationship between the PTI from DPR and the GHratio from MP-PAWR. A moderate negative correlation is observed (correlation coefficient: −0.409), indicating that lower PTI values are associated with greater graupel/hail likelihood.
Remotesensing 17 03741 g013
Figure 14. Two-dimensional histogram showing the relationship between the GHratio and the height of the 35 dBZ echo relative to the 0 °C level (STH35-FH). The correlation coefficient is 0.735.
Remotesensing 17 03741 g014
Figure 15. Retrieved GHratio maps using DPR’s STH35-FH and a PTI threshold of 10, overlaid with KuPR reflectivity ≥ 40 dBZ at 2 km altitude (pink contours lines) (left) and those derived from original MP-PAWR data with a high Z value of 30 dBZ, overlaid with KuPR reflectivity ≥ 40 dBZ at 2 km altitude (pink contours lines) (right). Each circle indicates the DPR footprint. Black line shows the coastline.
Remotesensing 17 03741 g015
Disclaimer/Publisher’s Note: The statements, opinions and data contained in all publications are solely those of the individual author(s) and contributor(s) and not of MDPI and/or the editor(s). MDPI and/or the editor(s) disclaim responsibility for any injury to people or property resulting from any ideas, methods, instructions or products referred to in the content.