Article

Analyzing Nighttime Lights Using Multi-Temporal Imagery from Luojia-1 and the International Space Station with In Situ and Land Use Data

by
Shengjie Kris Liu
1,2,†,
Chu Wing So
1 and
Chun Shing Jason Pun
1,*
1
Department of Physics, The University of Hong Kong, Hong Kong, China
2
Spatial Sciences Institute, Dornsife College of Letters, Arts and Sciences, University of Southern California, Los Angeles, CA 90089, USA
*
Author to whom correspondence should be addressed.
This work was primarily done at the University of Hong Kong. S.K.L is currently affiliated with the University of Southern California.
Remote Sens. 2025, 17(22), 3739; https://doi.org/10.3390/rs17223739
Submission received: 1 October 2025 / Revised: 9 November 2025 / Accepted: 13 November 2025 / Published: 17 November 2025

Highlights

What are the main findings?
  • Multitemporal imagery within a single night shows dynamic urban lighting, with commercial areas brighter early and ports brighter later.
  • Nighttime remote sensing correlates strongly (R = 0.8–1.0) with in situ night sky brightness measurements, with variations in images taken seconds apart.
What is the implication of the main finding?
  • Imaging timing is crucial for evaluating urban nighttime activity.
  • Viewing angles, color sensitivity, and atmospheric conditions significantly affect observed brightness in nighttime remote sensing.

Abstract

Remotely sensed nighttime lights (NTLs) have become essential in urban and environmental research but are typically captured at fixed local times by sun-synchronous satellites, limiting their ability to capture changes throughout the night. In contrast, in situ measurements of night sky brightness (NSB) can provide continuous records over time, but direct comparisons with NTLs have remained rare. This study first examines the relationship between in situ NSB and remotely sensed NTLs using multi-temporal imagery from Luojia-1 and the International Space Station (ISS), focusing on 10 sites in Hong Kong and Macau. We find moderate to strong correlations between NSB and Luojia-1 (R = 0.73) and between NSB and ISS imagery (R = 0.8–1.0), though notable spatial and temporal variations persist. Even images captured within seconds differ in brightness across locations (R = 0.88–0.96), driven by factors such as changing viewing angles in dense urban areas, variations in light transmission paths, and atmospheric conditions, all influenced by satellite position. Our further analysis reveals distinct temporal patterns across land use categories: port facilities and airports are brightest late at night, whereas commercial districts peak earlier and gradually dim throughout the night. Within individual ISS images, transportation-related lighting tends to be red, and commercial areas appear blue compared to other urban areas, which may be due to lamp type differences (high pressure sodium, LED). This study highlights the need to cross-examine in situ and remotely sensed data in NTL research, emphasizing that factors such as local pass time, viewing geometry, color sensitivity, and atmospheric conditions can influence observations and ultimately affect the conclusions.

1. Introduction

As a result of rapid urbanization in recent decades, urban areas now occupy approximately 3% of the Earth’s land surface [1], while this number may appear modest, it represents a substantial transformation of our planet, with its environmental consequences extending far beyond this spatial footprint. One of the most pervasive effects is the rise of artificial light at night (ALAN), resulting in a 10% yearly brightness increase in night sky background between 2011 and 2022 [2]. Consequently, over 99% of the global population now lives under a light-polluted night sky [3]. Among the world’s urbanized areas, Hong Kong—along with the Greater Bay Area, home to a population of 86 million in South China—is one of the most light-polluted metropolitan areas in the world [4,5,6].
Satellite imagery from outer space can monitor the Earth’s changing nighttime profile. One of the earliest satellite projects, the Defense Meteorological Satellite Program/Operational Linescan System (DMSP/OLS), enabled the first-ever large-scale monitoring of the nighttime Earth dating back to 1992 [7,8,9]. Using these data, researchers have identified strong correlations between nighttime lights (NTLs) and various socioeconomic indicators, including population density, economic development, and energy consumption [10,11,12]. However, as one of the earliest satellite missions, DMSP-OLS data has two major limitations: (a) data storage is constrained to 6-bit binary, with values ranging from 0 to 63, and (b) the lack of on-board calibration means that all values are relative [13]. Its successor, the Visible Infrared Imaging Radiometer Suite Day/Night Band (VIIRS/DNB), addresses these limitations by increasing data storage to 16-bit and incorporating on-board calibration using a solar diffuser system [14]. However, its spatial resolution—approximately 742m at the Equator—still poses challenges for detailed analysis within urban areas [5].
With enhanced sensor technology, the past decade has seen the development of numerous nanosatellites specifically designed for NTL monitoring [15,16]. In 2018, Wuhan University launched a small satellite, Luojia-1, capable of capturing NTL data at a ground sampling distance (GSD) of 130 m [17]. The Jilin-1 satellite achieves even finer resolution, with a GSD of 0.92 m [18]. Beyond conventional satellite systems, the International Space Station (ISS)—the often-overlooked and largest human-made satellite—occasionally provides high-resolution RGB imagery captured by astronauts using digital cameras [19,20]. Leveraging this new generation of satellite imagery, a variety of novel applications have emerged to analyze the nighttime Earth, including studies on housing prices [21], urban expansion [22], ghost cities [23], housing vacancy [24], urban structures [25], and freight traffic [26].
A basic assumption of existing studies is that brighter regions in satellite imagery indicate more human activities at night, while in general, this assumption should hold, there are other factors, often playing a dominant role, influencing the NTL data and their observations. To begin with, some economic activities create disproportionate NTL signals, such as gas flaring in Siberia [27]. Although NTL data have demonstrated good correlations with economic developments, evidence is often based on past experiences over the last three decades, primarily with the rise of developing countries in Asia [9]. Other studies have shown a break in such a relationship in East European and post-Soviet countries, where a stable or declining population corresponds to stable and increasing NTLs [28]. Scale is another problem. As most conclusions are drawn based on the coarse-resolution DMSP/OLS or VIIRS/DNB data, they may be only representative at the country level and may not apply to the city scale [29]. Apart from the socioeconomic factor and the scale problem, other physical factors such as angular effects, aerosols, and relative humidity all have an influence on the NTL data observed from outer space [5,30,31,32].
As research on NTL continues to advance, a critical question remains, as in other areas of remote sensing: how can we effectively ground truth observed NTL data, a challenge that remains unresolved [9,15,29,33]. On the ground, sky quality meters (SQMs, Unihedron, Grimsby, ON, Canada) have been widely deployed to measure the brightness of the night sky [34,35,36,37,38]. Several studies have examined the correlation between SQM measurements and satellite-observed NTL data, reporting a wide range of correlation coefficients, from 0.34 to 0.77 [29,39,40,41]. Notably, the strength of the correlation appears to vary considerably depending on the ambient brightness of the area. For instance, Ref. [41] found that, when analyzing coarse-resolution DMSP data, only SQM readings darker than 19 mag / arcsec 2 showed strong correlations with diffuse light emissions. This finding is consistent with other studies [42,43,44], which also reported stronger relationships between satellite observations and ground measurements primarily in relatively dark environments. However, these studies have been predominantly based on coarse-resolution satellite data. Research on medium-resolution observations, such as those from Luojia-1 and the International Space Station (ISS), remains limited. Given that conclusions often differ depending on spatial resolution, addressing this gap is increasingly important. Furthermore, because these studies rely on data from sun-synchronous satellites, their analyses are constrained to observations captured at approximately the same local time (around 2 a.m.). As a result, temporal variations in NTL within a single night have largely been overlooked [33].
Multitemporal information within a single night is critical for NTL studies, as nighttime activities are known to vary substantially over time. In Hong Kong and other major metropolitan areas across East Asia, decorative lighting on buildings—a primary source of NTL—is often turned off after 10 or 11 p.m. [6,16,34]. However, these early-night lighting activities are not captured by data from either DMSP or VIIRS satellites, due to their fixed local overpass times. Understanding the contributions of different land use types to NTL emissions is a central question in the field. Several studies have attempted to quantify these contributions using land use data [45,46,47]. For instance, using a panoramic image from EROS-B with a ground sampling distance finer than 1 m, Ref. [45] found that land use types explained 89% of the variability in NTL, with arterial roads, commercial areas, and service areas identified as the brightest sources. In Berlin and Massachusetts, multi-family residential and commercial areas were found to contribute the most to NTL emissions, while in Shanghai, commercial areas dominated, and in Quzhou, a smaller city in China, transportation facilities were the primary contributors [47]. Global studies consistently identify commercial and transportation-related land uses as major sources of NTL. However, because these conclusions are drawn primarily from data collected after midnight—when many commercial activities have ceased—analyzing NTL data from earlier in the night and across multiple time points is essential for developing a more comprehensive understanding of nighttime urban dynamics.
In this study, we conduct a comprehensive analysis using multi-temporal imagery from Luojia-1 and ISS to analyze NTL, primarily from two aspects.
  • First, we analyze the relationship between NTL data and ground-based NSB data across two multitemporal datasets. We find that even uncalibrated ISS images can achieve good agreements with NSB, and we find that the consistency across images taken within seconds is not as perfect as we thought.
  • Second, we analyze the changing NTLs overnight across land use categories in Hong Kong, identifying categories that contribute the most NTLs. We highlight the necessity of analyzing NTLs at different local times that most sun-synchronous data cannot fulfill.
The remainder of this paper is organized as follows. In the next section, we introduce the study area, the satellite data, and the NSB data. We then present methods used in this study in Section 3. In Section 4.1, we show the correlation between field and remote sensing data and analyze the changing NTL data across different hours from the two satellite sources in Section 4.2. Finally, we draw conclusions and provide discussion in Section 5.

2. Study Area and Data

2.1. Study Area

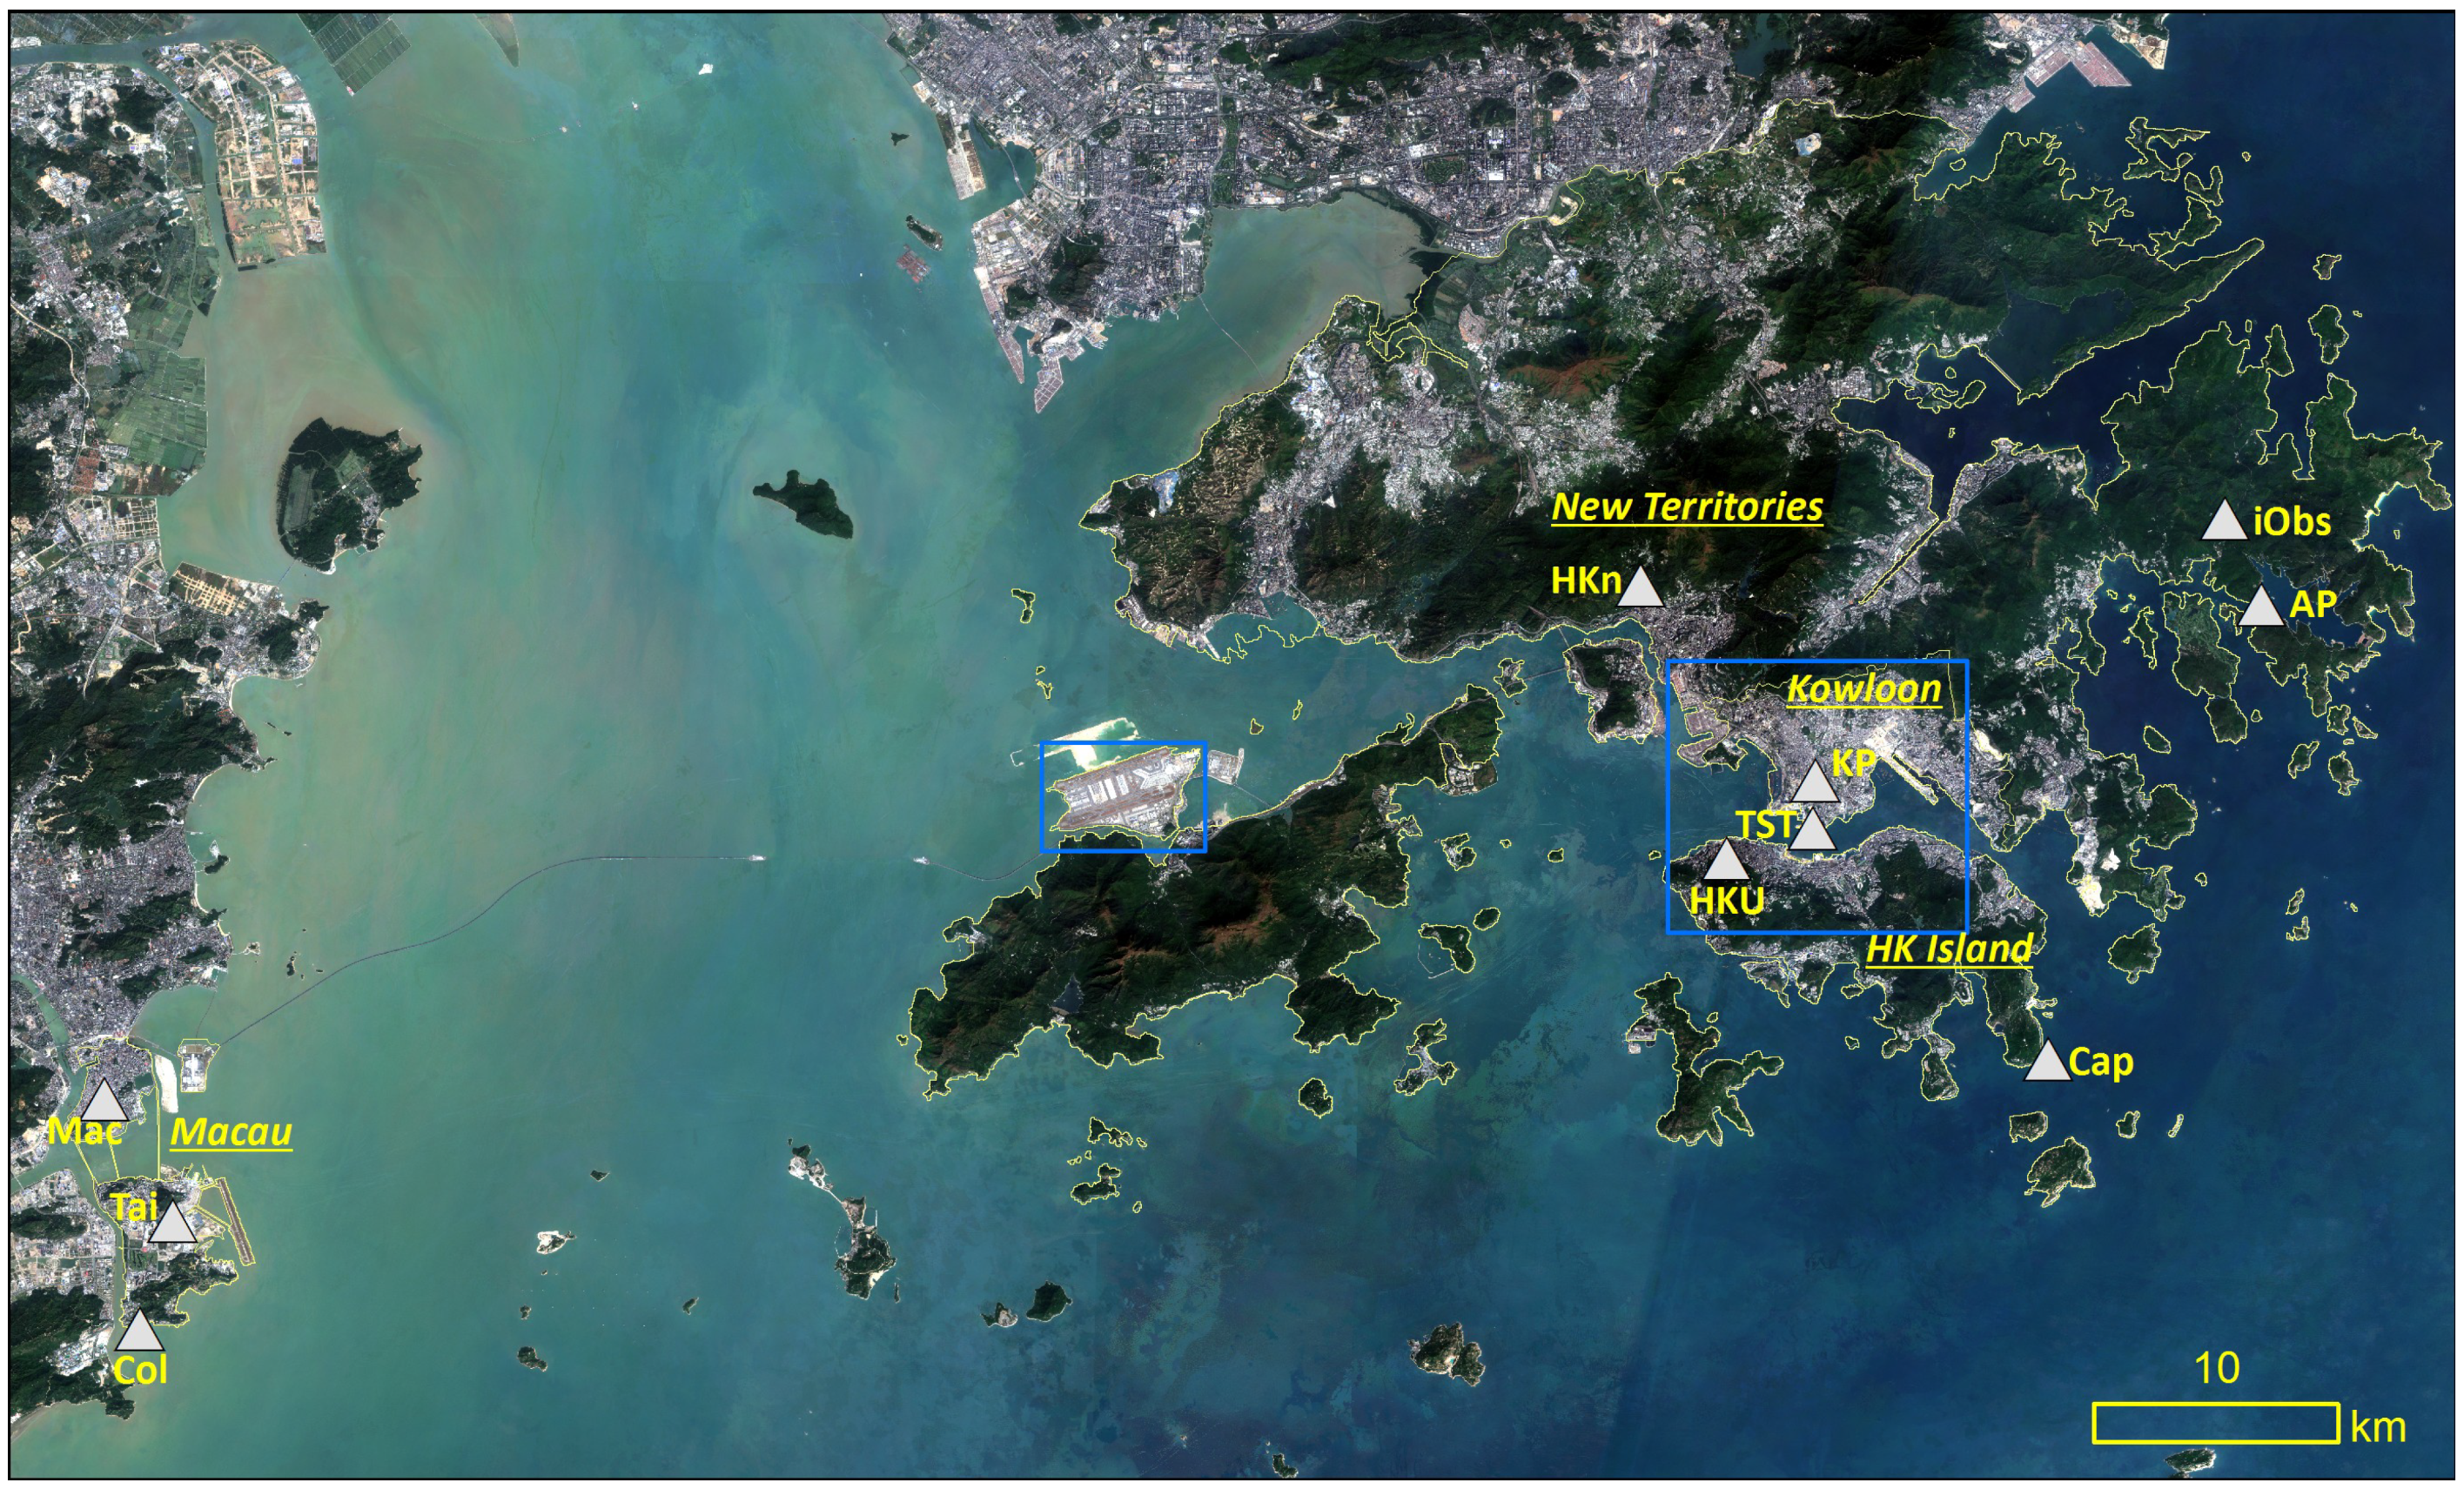
Hong Kong, with a population of over seven million in 2016 [48], is one of the most light-polluted cities in the world [34]. It comprises three major regions: Hong Kong Island, the Kowloon Peninsula, and the New Territories, as shown in Figure 1. Downtown areas occupy only a small portion of the total landmass, concentrated primarily in northern Hong Kong Island and the Kowloon Peninsula. Located in the southwest is the Hong Kong International Airport, an area characterized by relatively stable lighting conditions, which is included in this study. To the west of Hong Kong lies Macau, where three additional in situ stations (introduced later) provide data for correlation analysis. However, while Macau data are used to supplement the correlation analysis, detailed analyses of nighttime light sources are conducted only for Hong Kong, where comprehensive land use data are available.

2.2. Multi-Temporal Nighttime Satellite Imagery

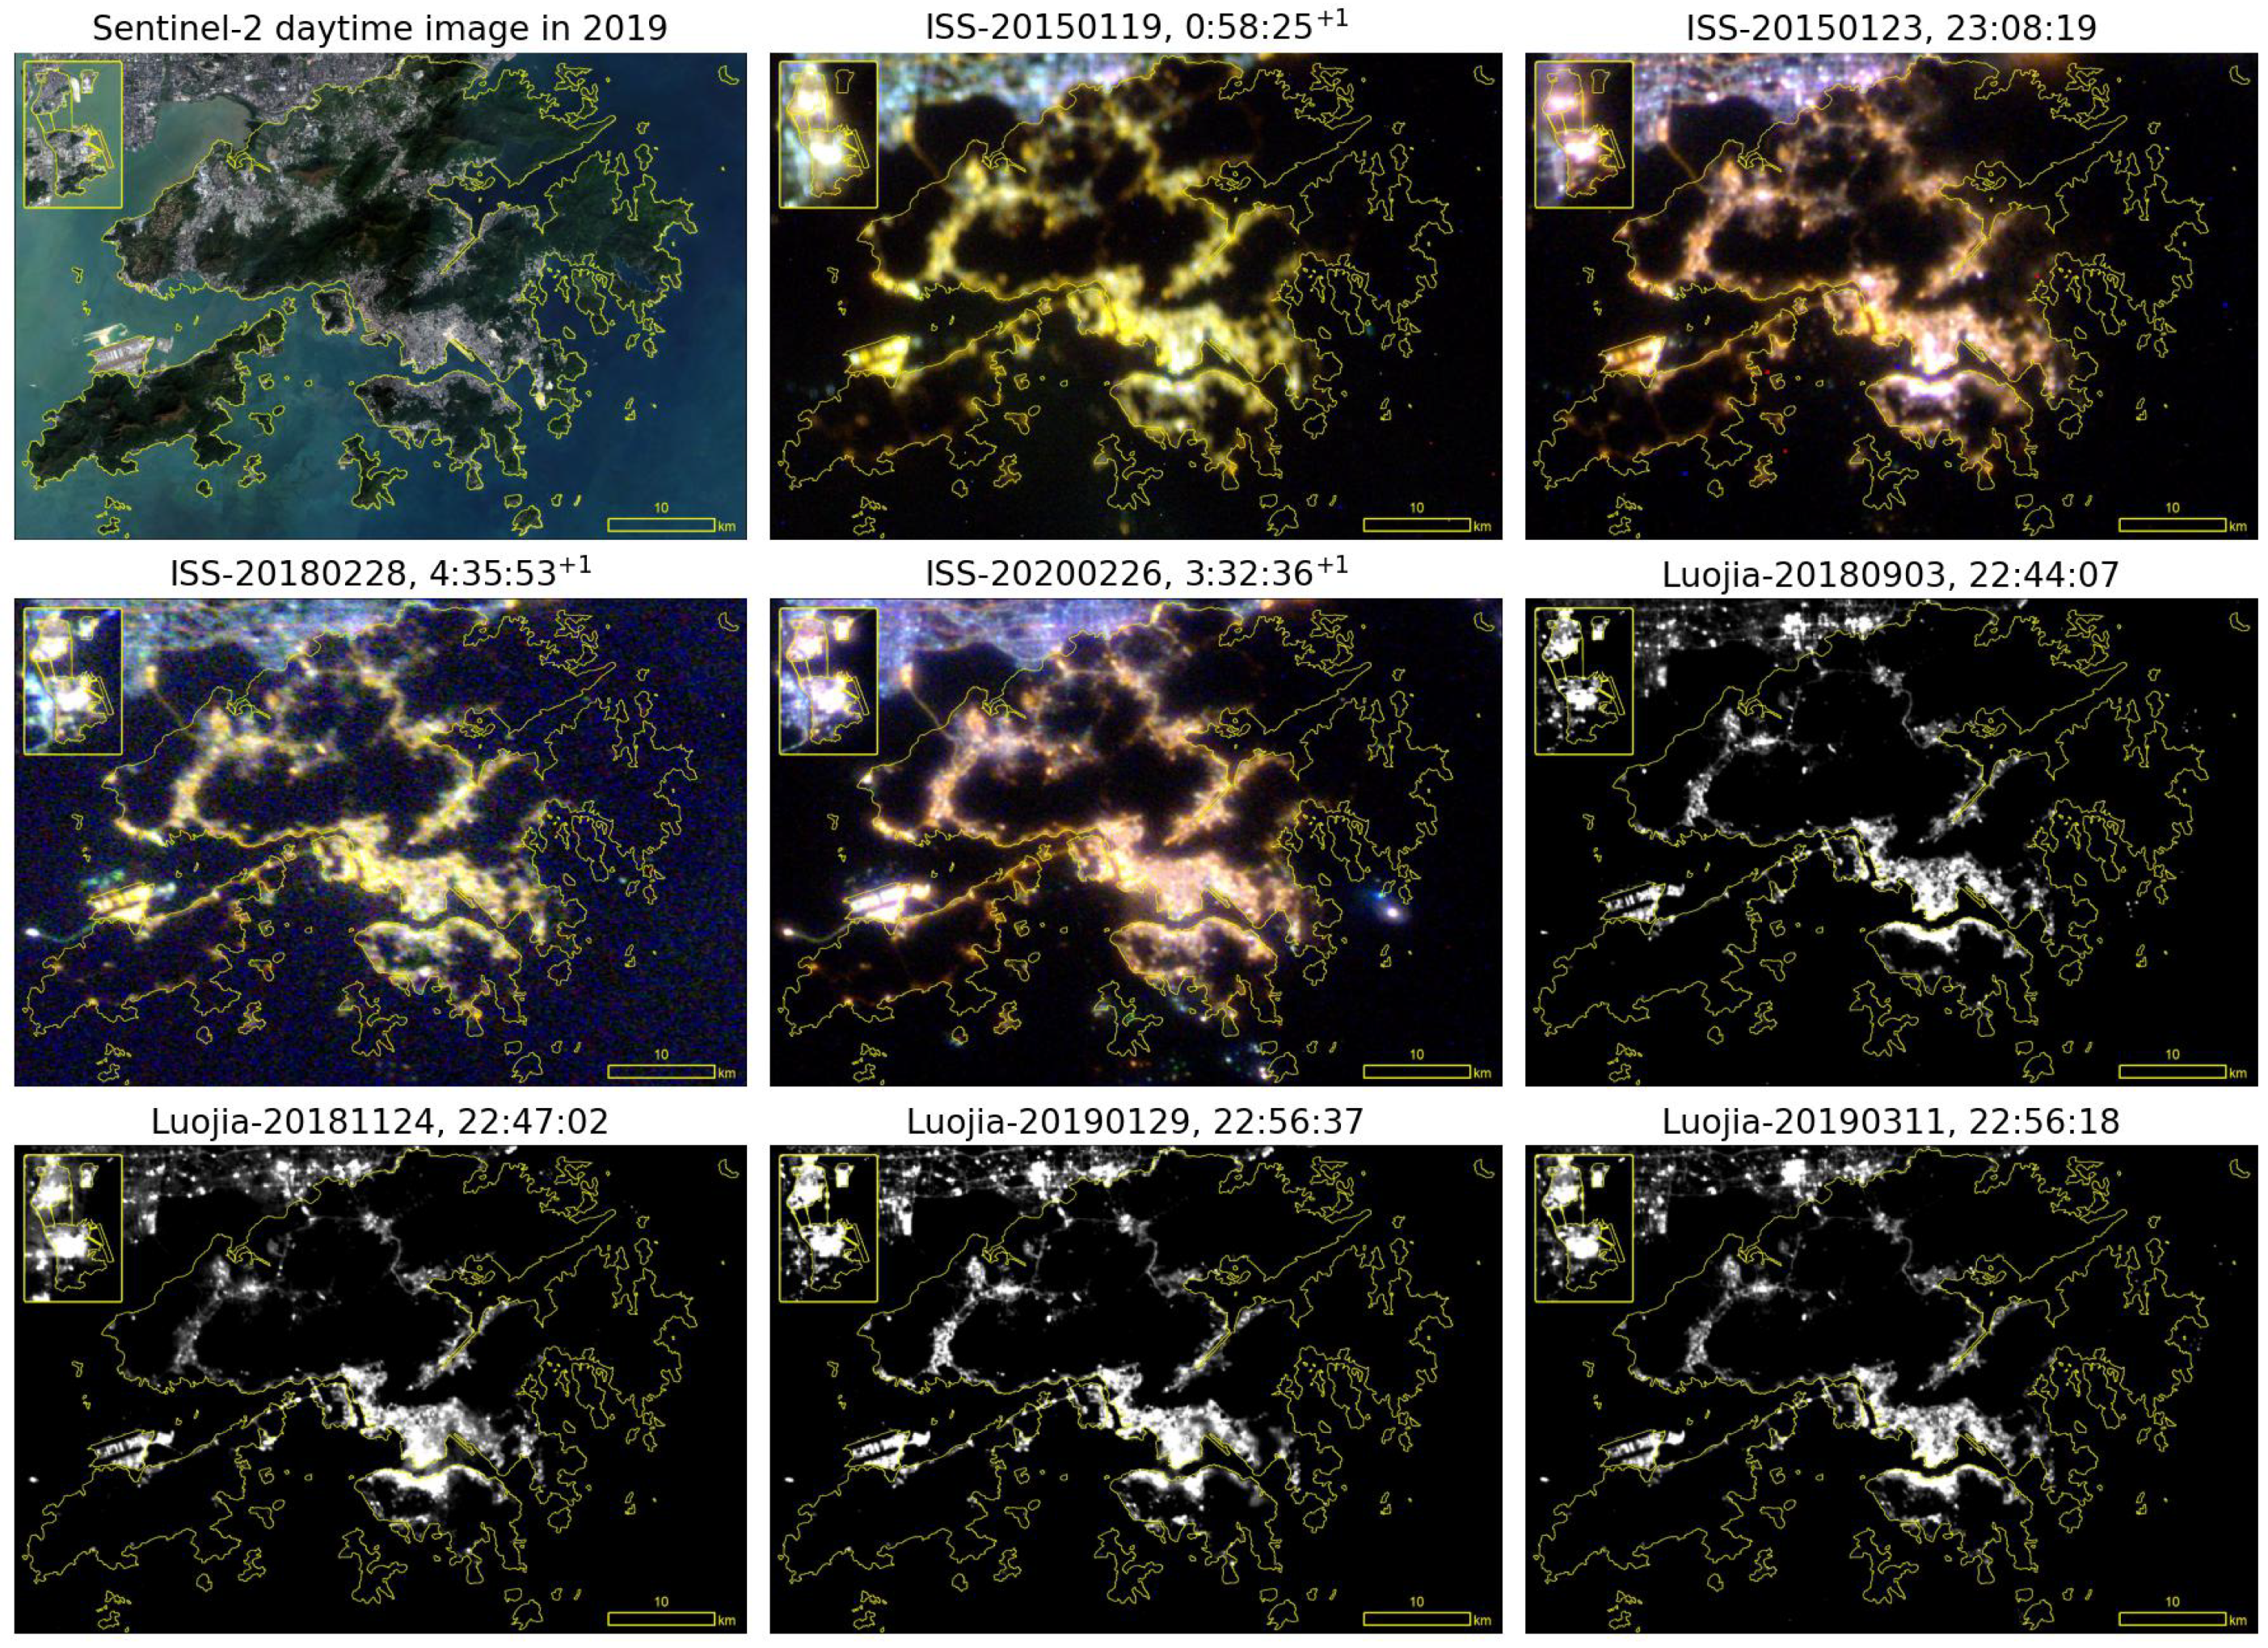
Two sets of multi-temporal imagery from the Luojia-1 satellite and the ISS are used in this study, as shown in Figure 2. These two datasets were selected for two main reasons: (a) their spatial resolutions are comparable—approximately 130 m for Luojia-1 and between 5 and 200 m for the ISS, depending on the specific image [15]—and both are substantially finer than that of VIIRS; and (b) the ISS images include color information, which is particularly valuable for light pollution studies. Urban lighting has increasingly transitioned from high-pressure sodium (HPS) lamps to light-emitting diodes (LEDs), with LEDs typically emitting a bluer spectrum compared to HPS [49]. However, current single-band nighttime satellite sensors, such as VIIRS-DNB, have limited sensitivity to wavelengths shorter than 500 nm [50], thereby underrepresenting blue light emissions and potentially underestimating NTLs [33]. As a result, multispectral imagery, such as that from the ISS, provides important advantages for investigating urban nighttime lighting conditions.

2.2.1. Luojia-1 Data

The Luojia-1 satellite, launched by Wuhan University in June 2018, provides calibrated nighttime imagery with a medium resolution of 130 m [51], while higher-resolution nighttime satellites, such as the commercial Jilin-1 with a 0.92-m ground sampling distance (GSD), are available, Luojia-1 stands out as the first satellite offering free-of-charge calibrated nighttime imagery, making it a valuable resource for night light analysis. The Luojia-1 satellite captures multiple snapshots within seconds, and we obtained all available cloudless image snapshots for Hong Kong (from http://59.175.109.173:8888/app/login_en.html, accessed on 15 June 2020). As shown in Table 1, four sets of images were used in this study, captured on 3 September 2018, 24 November 2018, 29 January 2019, and 11 March 2019. We also list the operating GaN-MN stations (to be discussed in Section 2.3) in the table.

2.2.2. ISS Imagery

ISS images are captured by astronauts using commercial digital single-lens reflex (DSLR) cameras onboard the ISS and have been utilized in several studies to investigate NTLs [19,34,52,53]. These images consist of three RGB channels but are not calibrated. Unlike most satellite systems, the local pass time of the ISS is not fixed, as the ISS orbits the Earth approximately every 90 min. A total of four image sets were retrieved (two from 2015, one from 2018, and one from 2020), as shown in Table 2. Similar to the Luojia-1 images, the ISS images consist of multiple snapshots, though these snapshots differ slightly as the ISS orbits while the images are captured. For the correlation analysis, we used all available image snapshots, and for the land use analysis, we selected the clearest image.
We had a list of available nighttime ISS images with thumbnail previews available. We first conducted a visual inspection and selected candidate images from a large pool of these ISS images. As Hong Kong has a unique nighttime footprint, this step helped filter out a large pool of candidates. We then obtained the raw ISS image files (in 16-bit) in NEF format and converted them to TIF format for visualization. Some candidate images were filtered out due to low image quality in terms of clouds or noise. Additionally, we cross-checked clouds by visualizing Himawari-8 geostationary satellite imagery within the hour of observation, which shows largely cloud-free conditions within the study area (see Supplementary Materials).
After these steps, we conducted georeferencing using ArcGIS 10.4 on the final candidate images. By selecting twenty to forty control points depending on the image, with high-resolution optical images and the OpenStreetMap road network as references, we obtained the georeferenced images using third-order polynomial interpolation—an interpolation chosen purposely to allow for uncertainty over control points. The obtained root mean square errors (RMSEs) are shown in Table 2. They are roughly between 0.00060 and 0.00177 (about 66–196 m). To reduce error and standardize comparison, the ISS images were exported to a spatial resolution of 0.001 (about 111 m) using the bilinear interpolation algorithm.

2.3. Field Measurements

The Globe at Night - Sky Brightness Monitoring Network (GaN-MN) was launched in 2014, aiming to record the skyglow brightness at an interval of 30 s to minutes. The network uses SQMs to measure the zenith night sky brightness (NSB). As of October 2025, the network has more than 90 stations around the world. Twelve stations are located in Hong Kong (seven were available for dates when the studied remote sensing images were captured), and an additional three are located in Macau, a city closely connected to Hong Kong (Figure 1) [4]. We use available sunlight- and moonlight-free data collected from these stations to compare with remote sensing data. Details and characteristics of the Hong Kong stations are listed in Table 3. For more information, please refer to the GaN-MN website (http://globeatnight-network.org/global-at-night-monitoring-network.html, accessed on 15 June 2020).
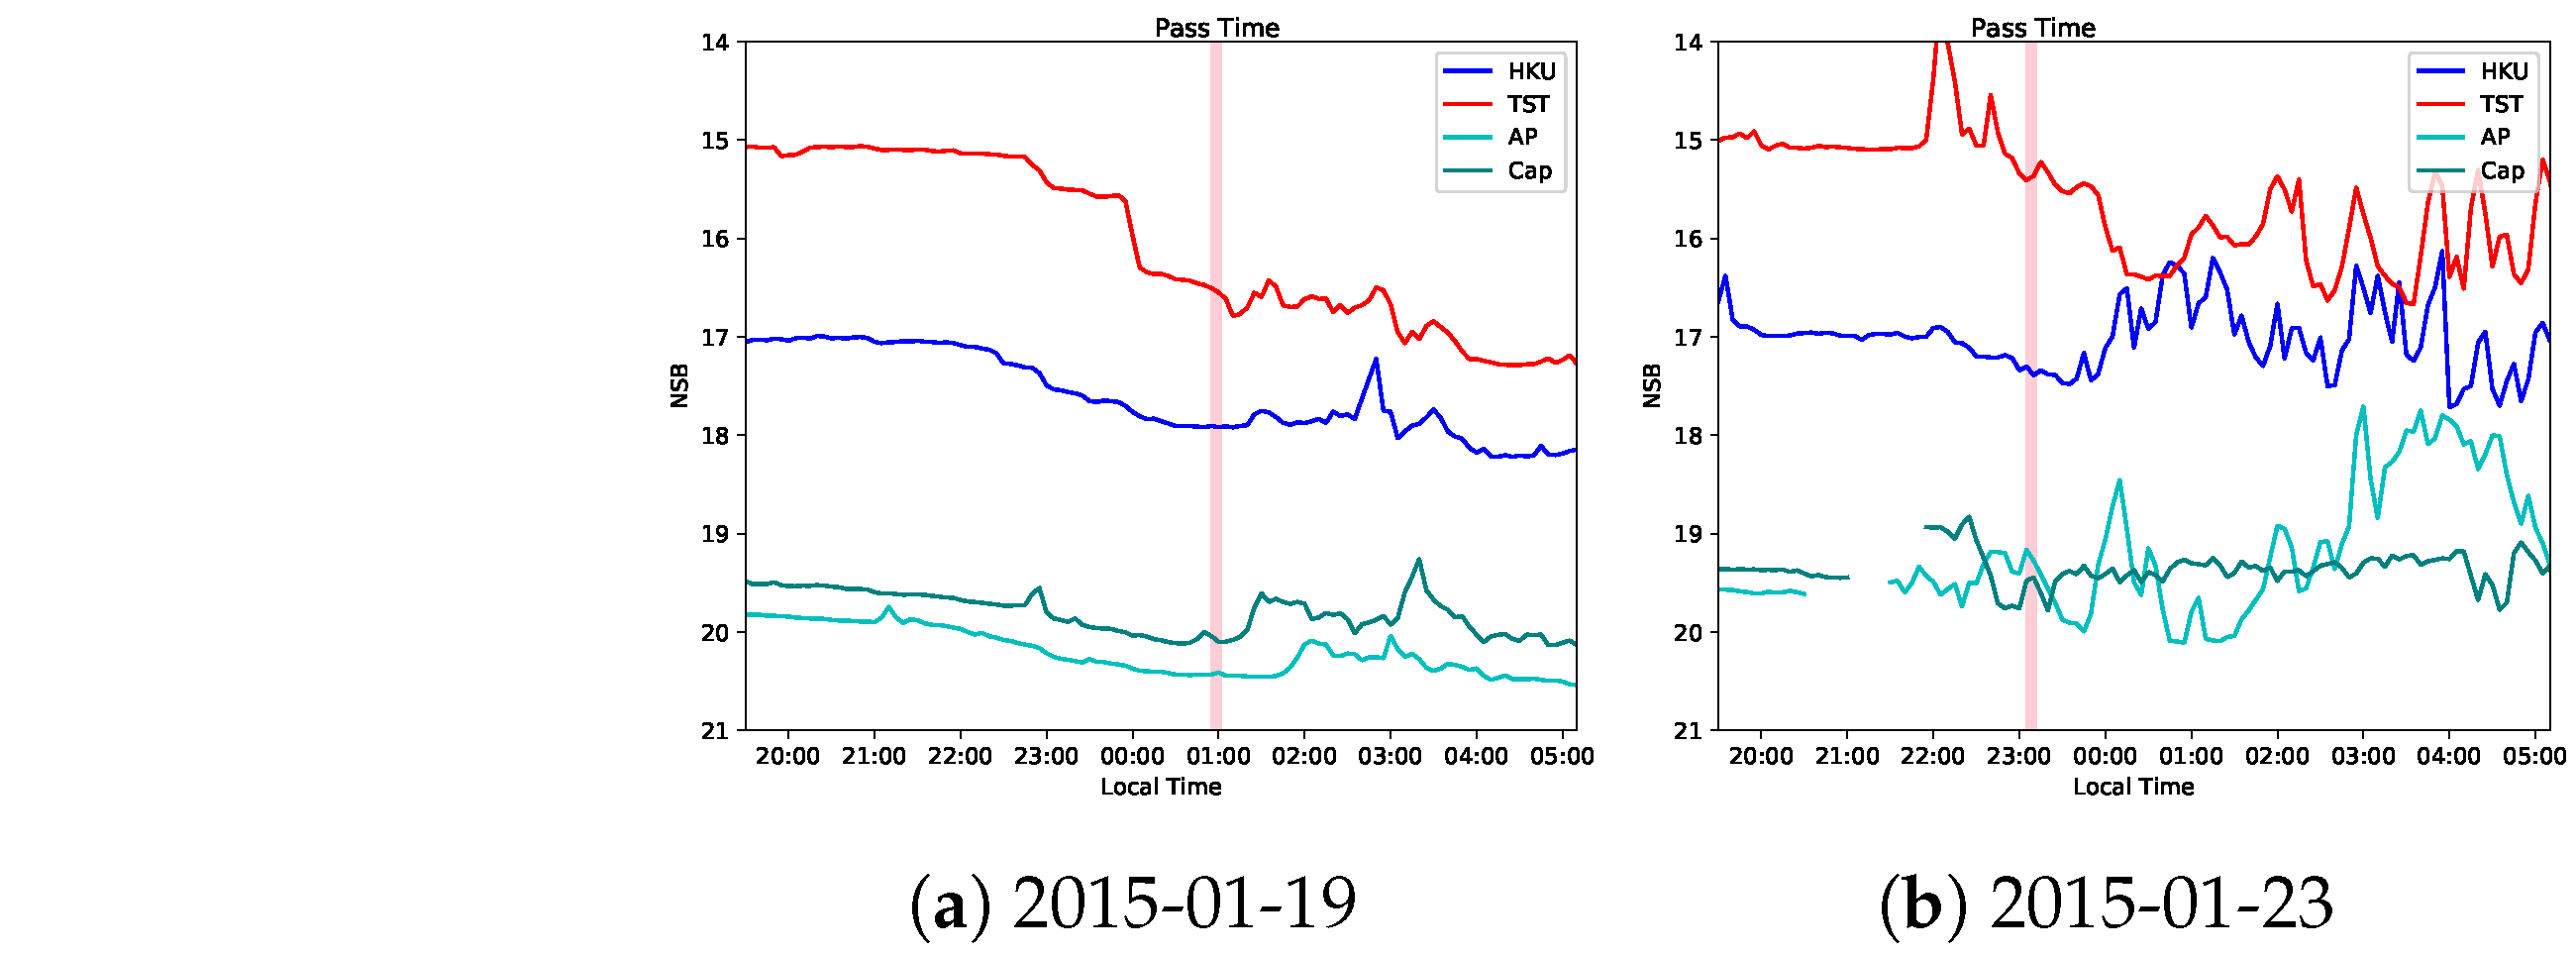
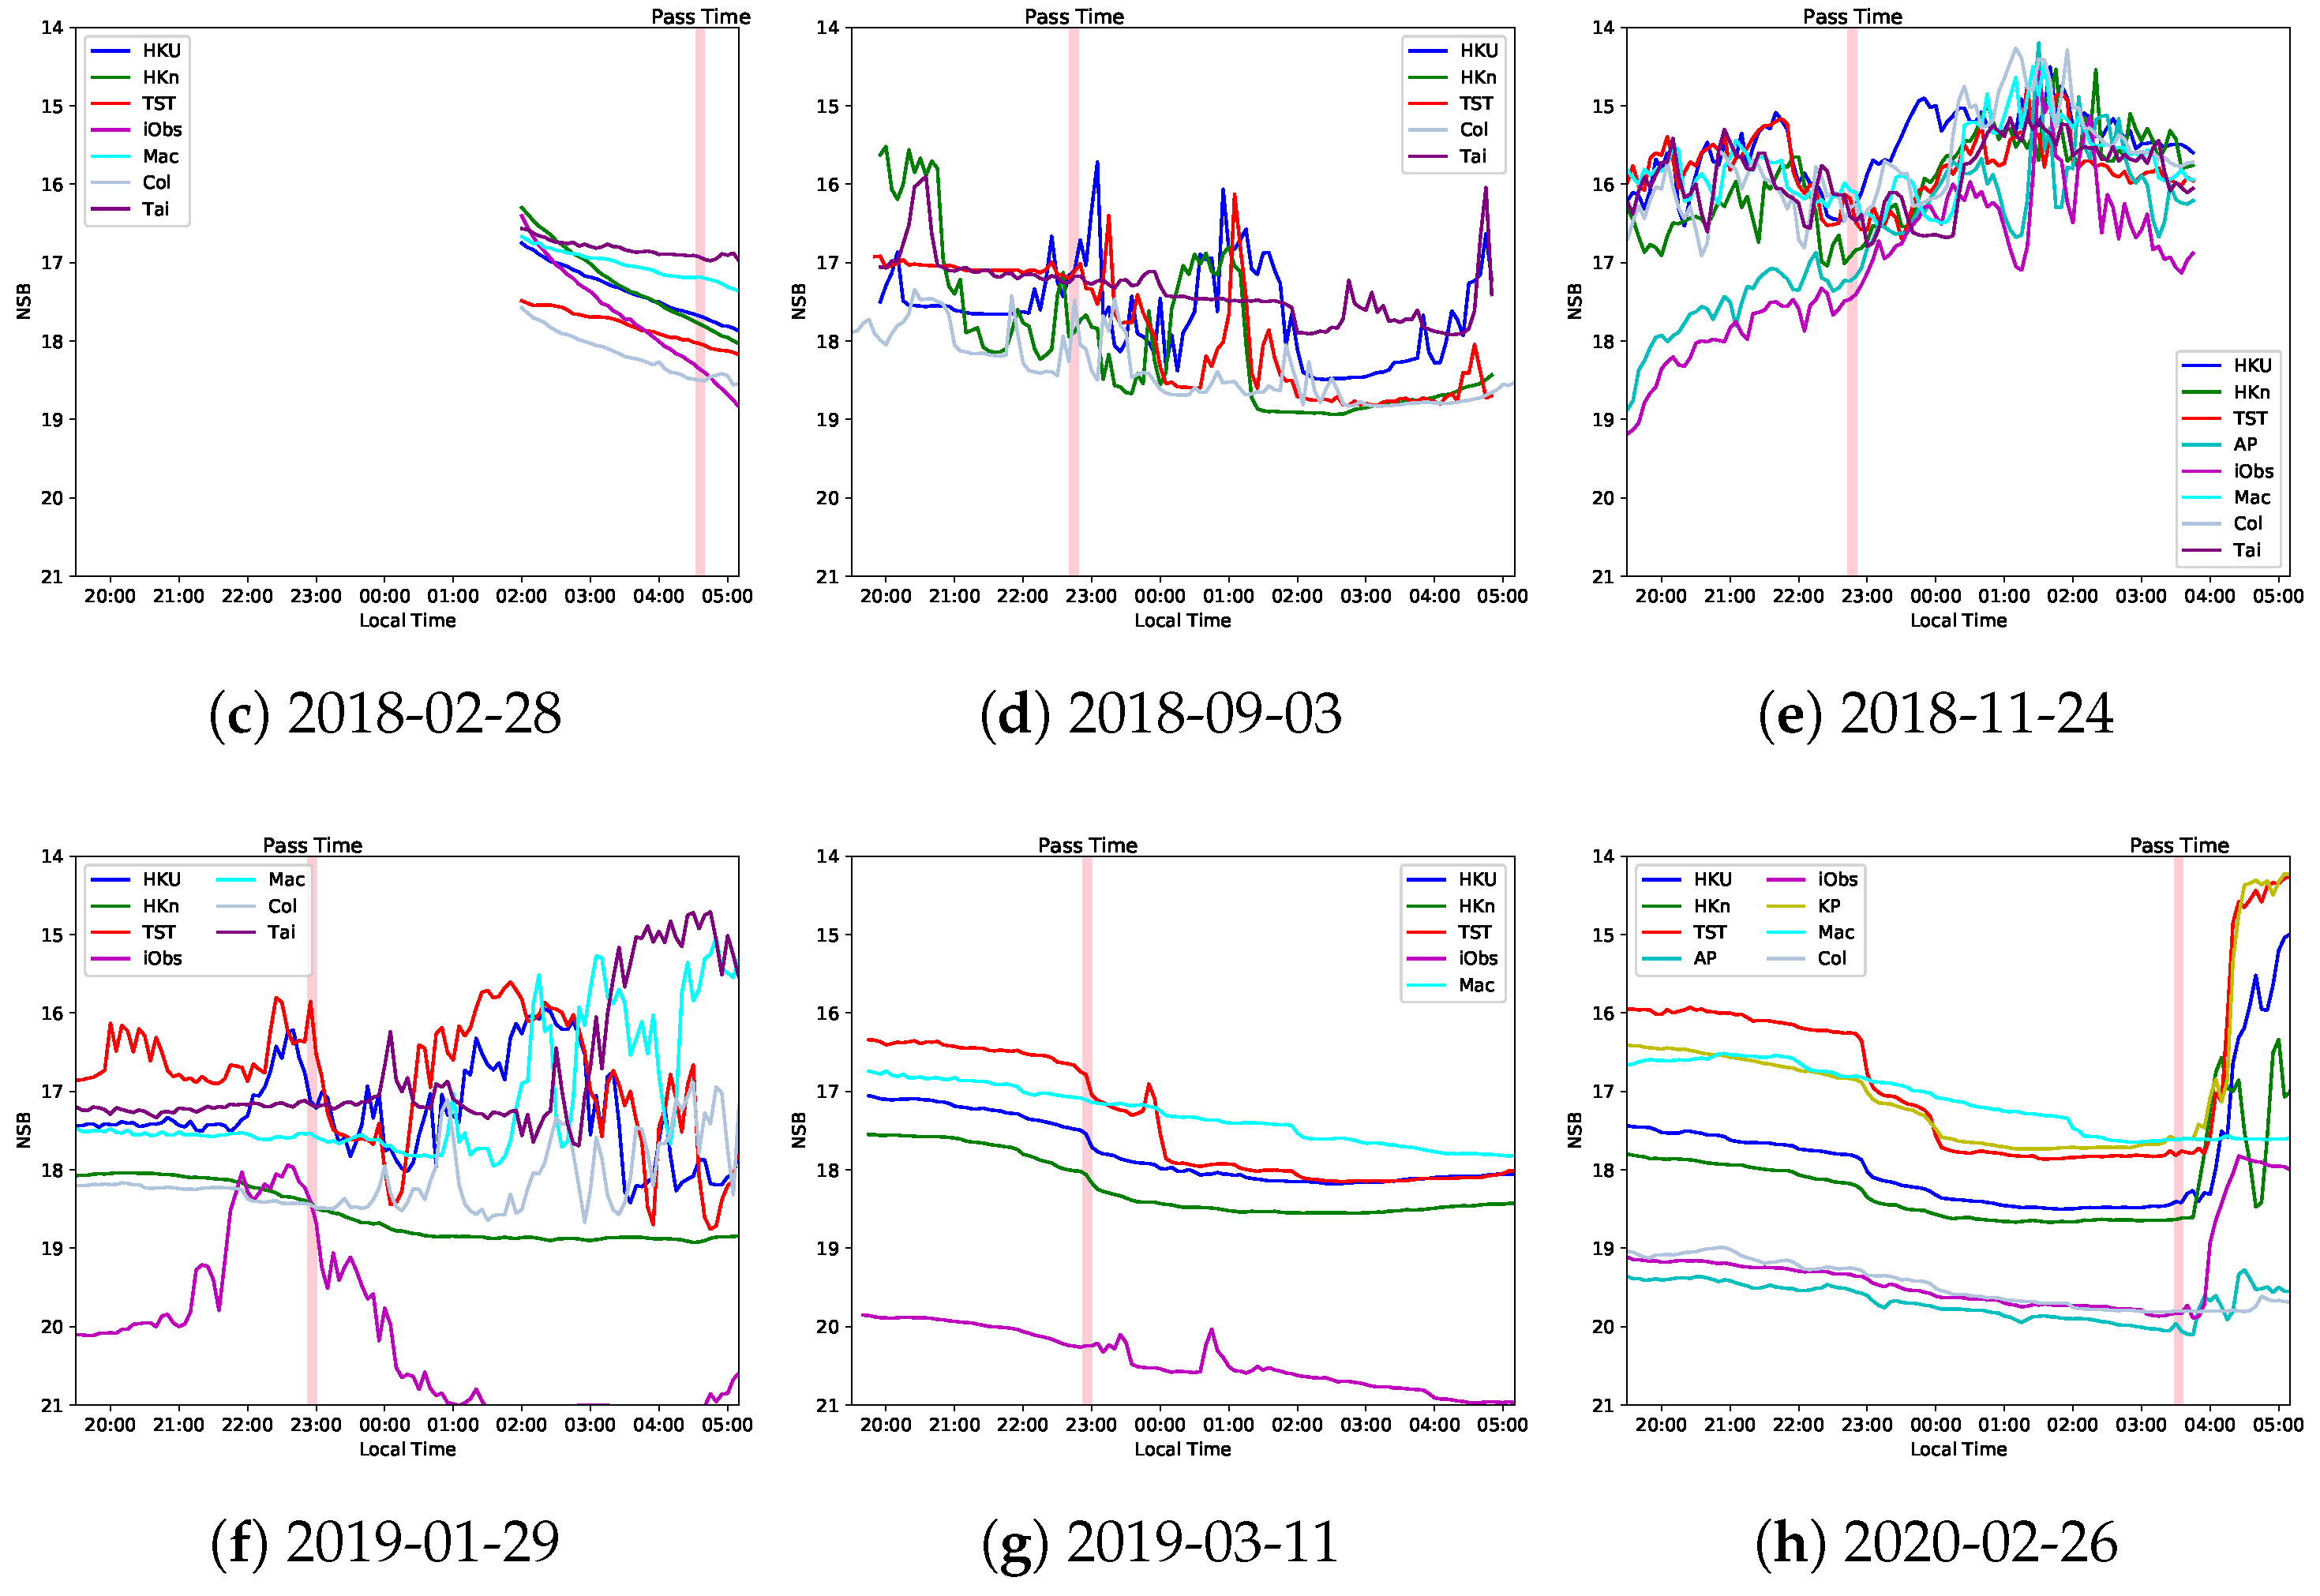
The NSB value is in logarithmic scale, and a larger value indicates a darker sky, and vice versa. We show some sample data collected on the same dates as the images were recorded in Figure 3. Some data were discarded due to moonlight, sunlight, etc. When it is cloudy, the backscattered ALAN from the sky and clouds becomes strong, increasing the measured brightness (a smaller number) [54]. In a cloudless condition, the brightness is relatively stable over time, and its temporal changes mainly reflect the changes in the local lighting environment [34]. Among the eight dates, the 11 March 2019 NSB value was quite stable. At around 23:00, the NSB value increased (darkened) sharply, because most decorative lights in the city were turned off at 23:00, as recommended in the Charter on External Lighting (https://www.charteronexternallighting.gov.hk/en/index.html, accessed on 15 June 2020).

2.4. Land Use Data

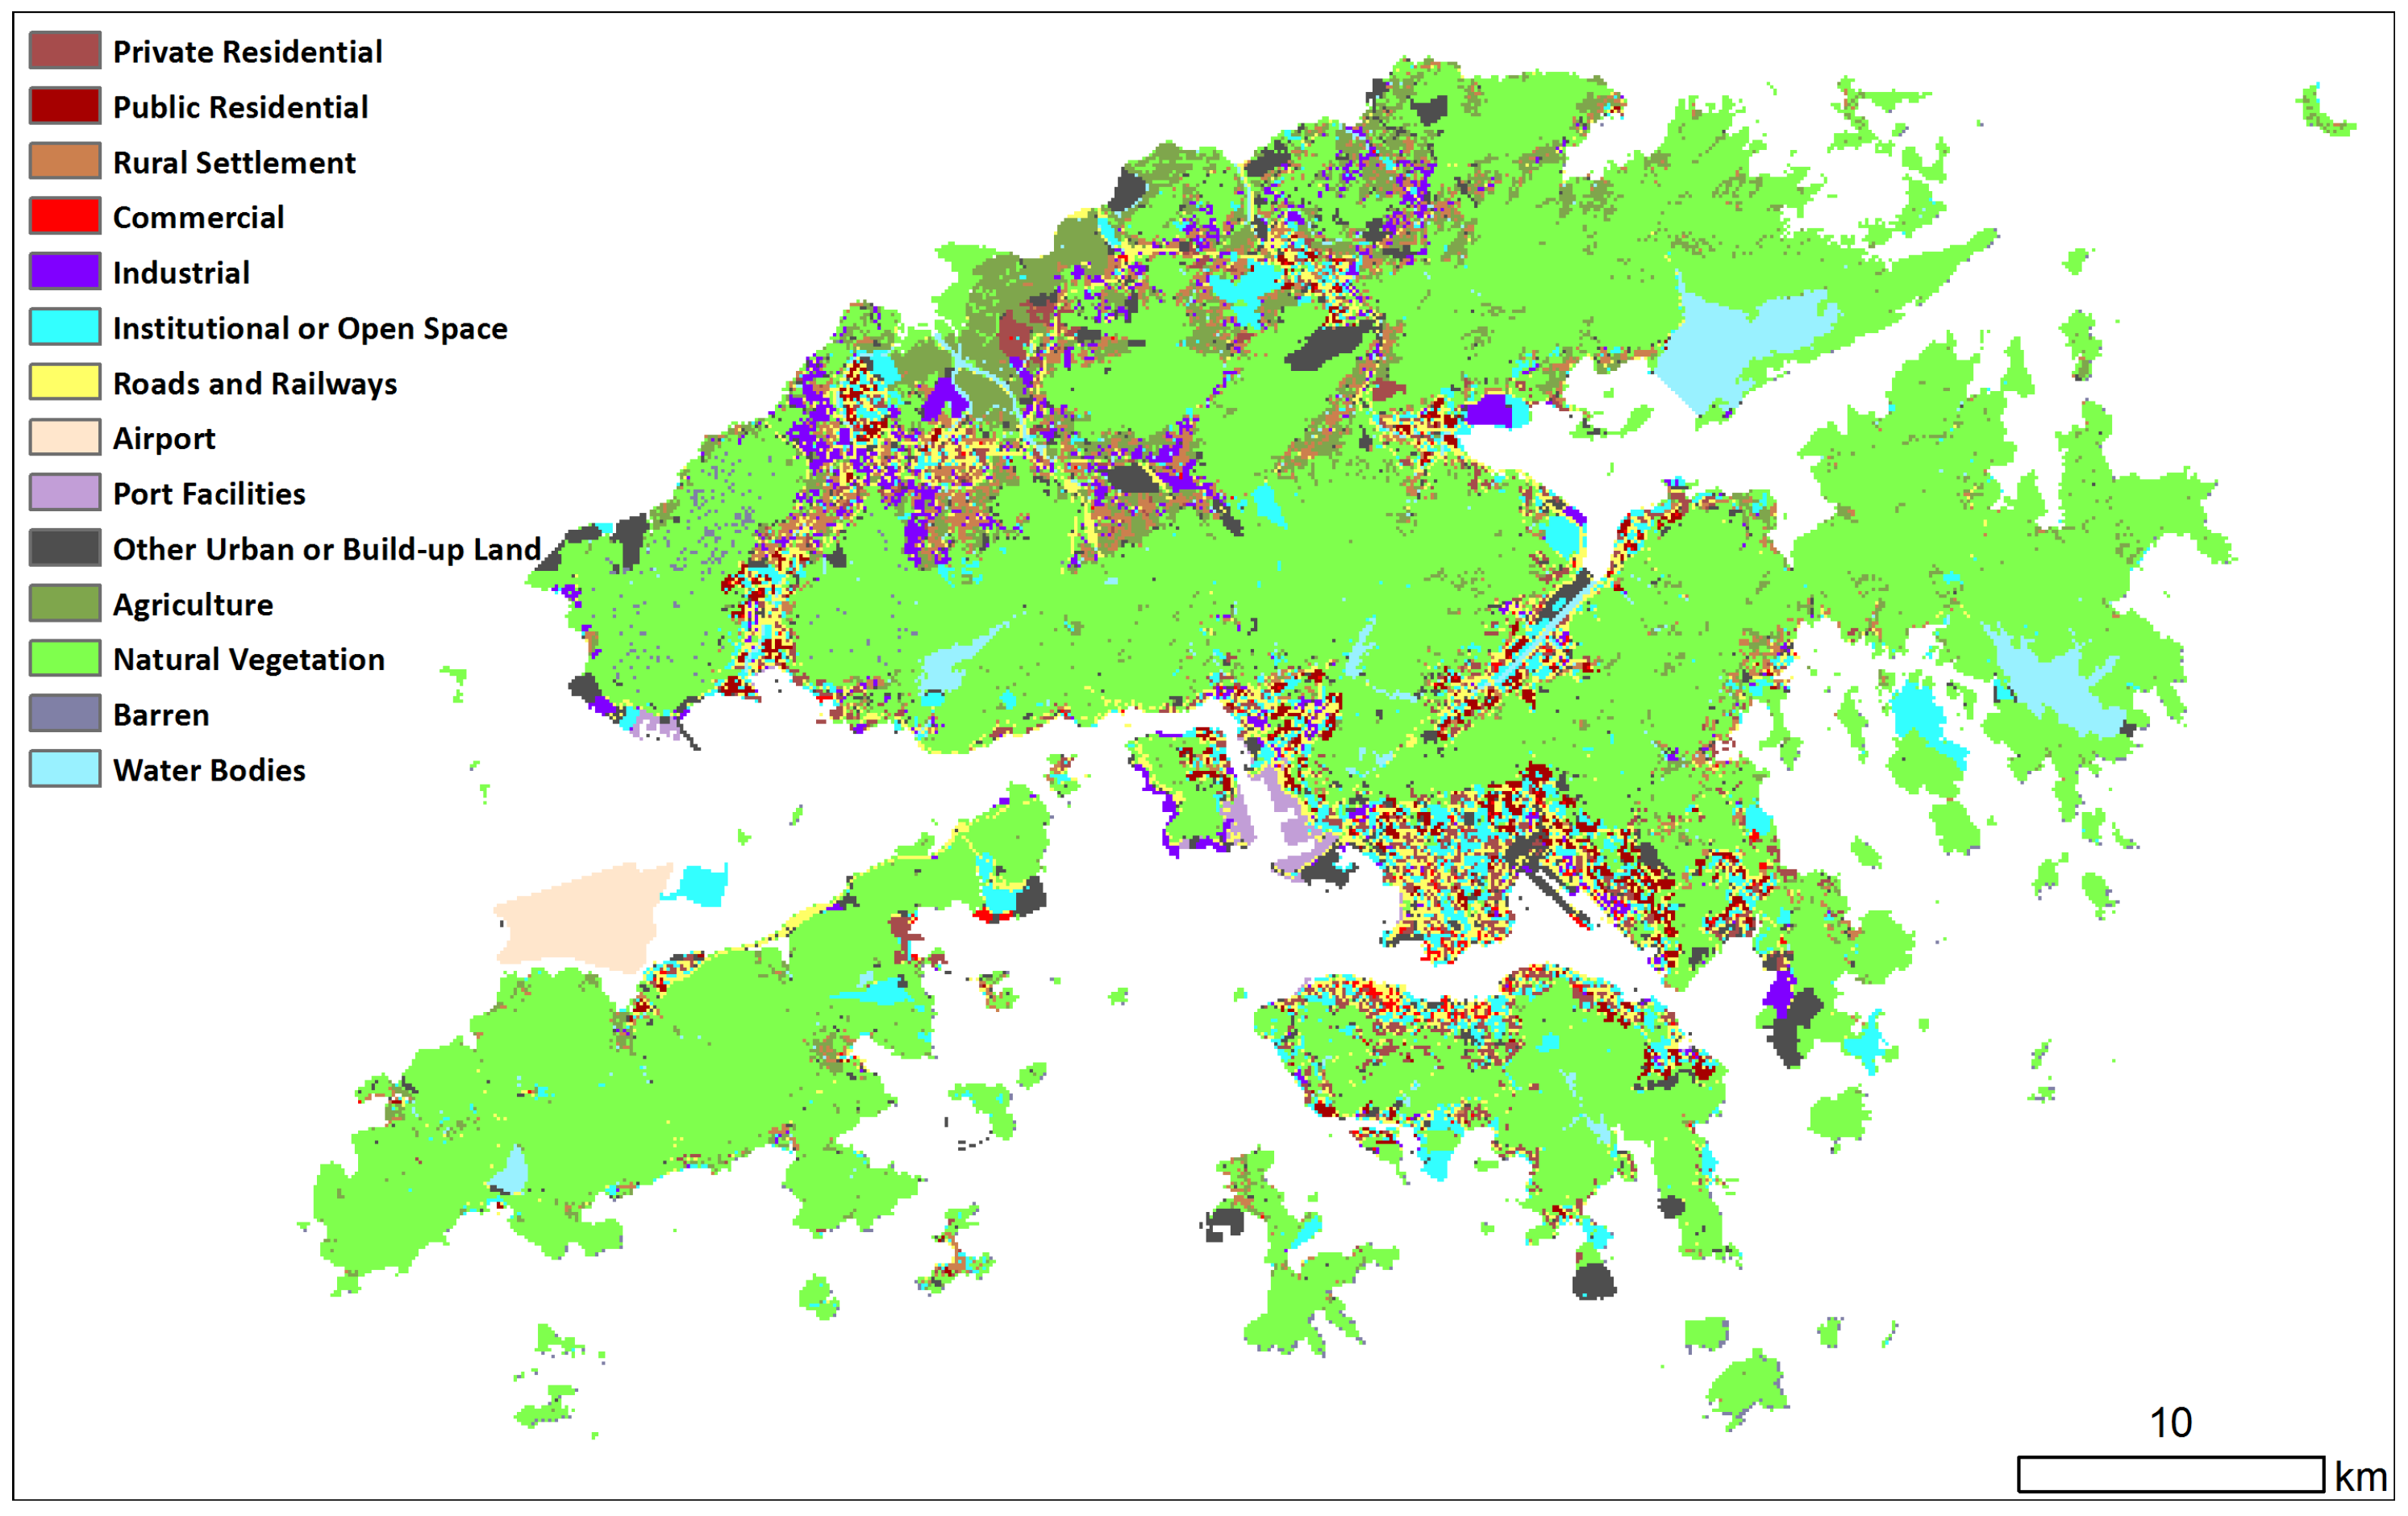
To analyze night lights in different city zones, we obtained the Hong Kong land use map in 2018 from the Planning Department (https://www.pland.gov.hk/pland_en/info_serv/open_data/landu/index.html, accessed on 15 June 2020). The original land use data are organized as a two-level classification system. A total of 10 classes with 27 subclasses are available. We grouped them into 14 categories as shown in Figure 4 and Table 4. As our study concerns human-perceived night lights in cities, we used subclasses in residential and commercial areas, and grouped the natural classes. We also grouped two subclasses—roads and railways—but kept the airport and port facilities in the transportation category separated. The land use pattern was stable in Hong Kong from 2015 to 2020, and land use changes were negligible.

3. Methodology

3.1. Luojia-1 Data Calibration

To calibrate the Luojia-1 data, we covert the raw digital number (DN) values to at-sensor radiance using the following equation [51]:
L = 10 10 d 3 / 2 W / ( m 2   ·   sr · μ m ) ,
where L and d are at-sensor radiance and raw DN value, respectively. The radiance data are then multiplied by 10 5 in our study so that the data range is roughly 0–10,000.

3.2. Luojia-1 Satellite’s Position

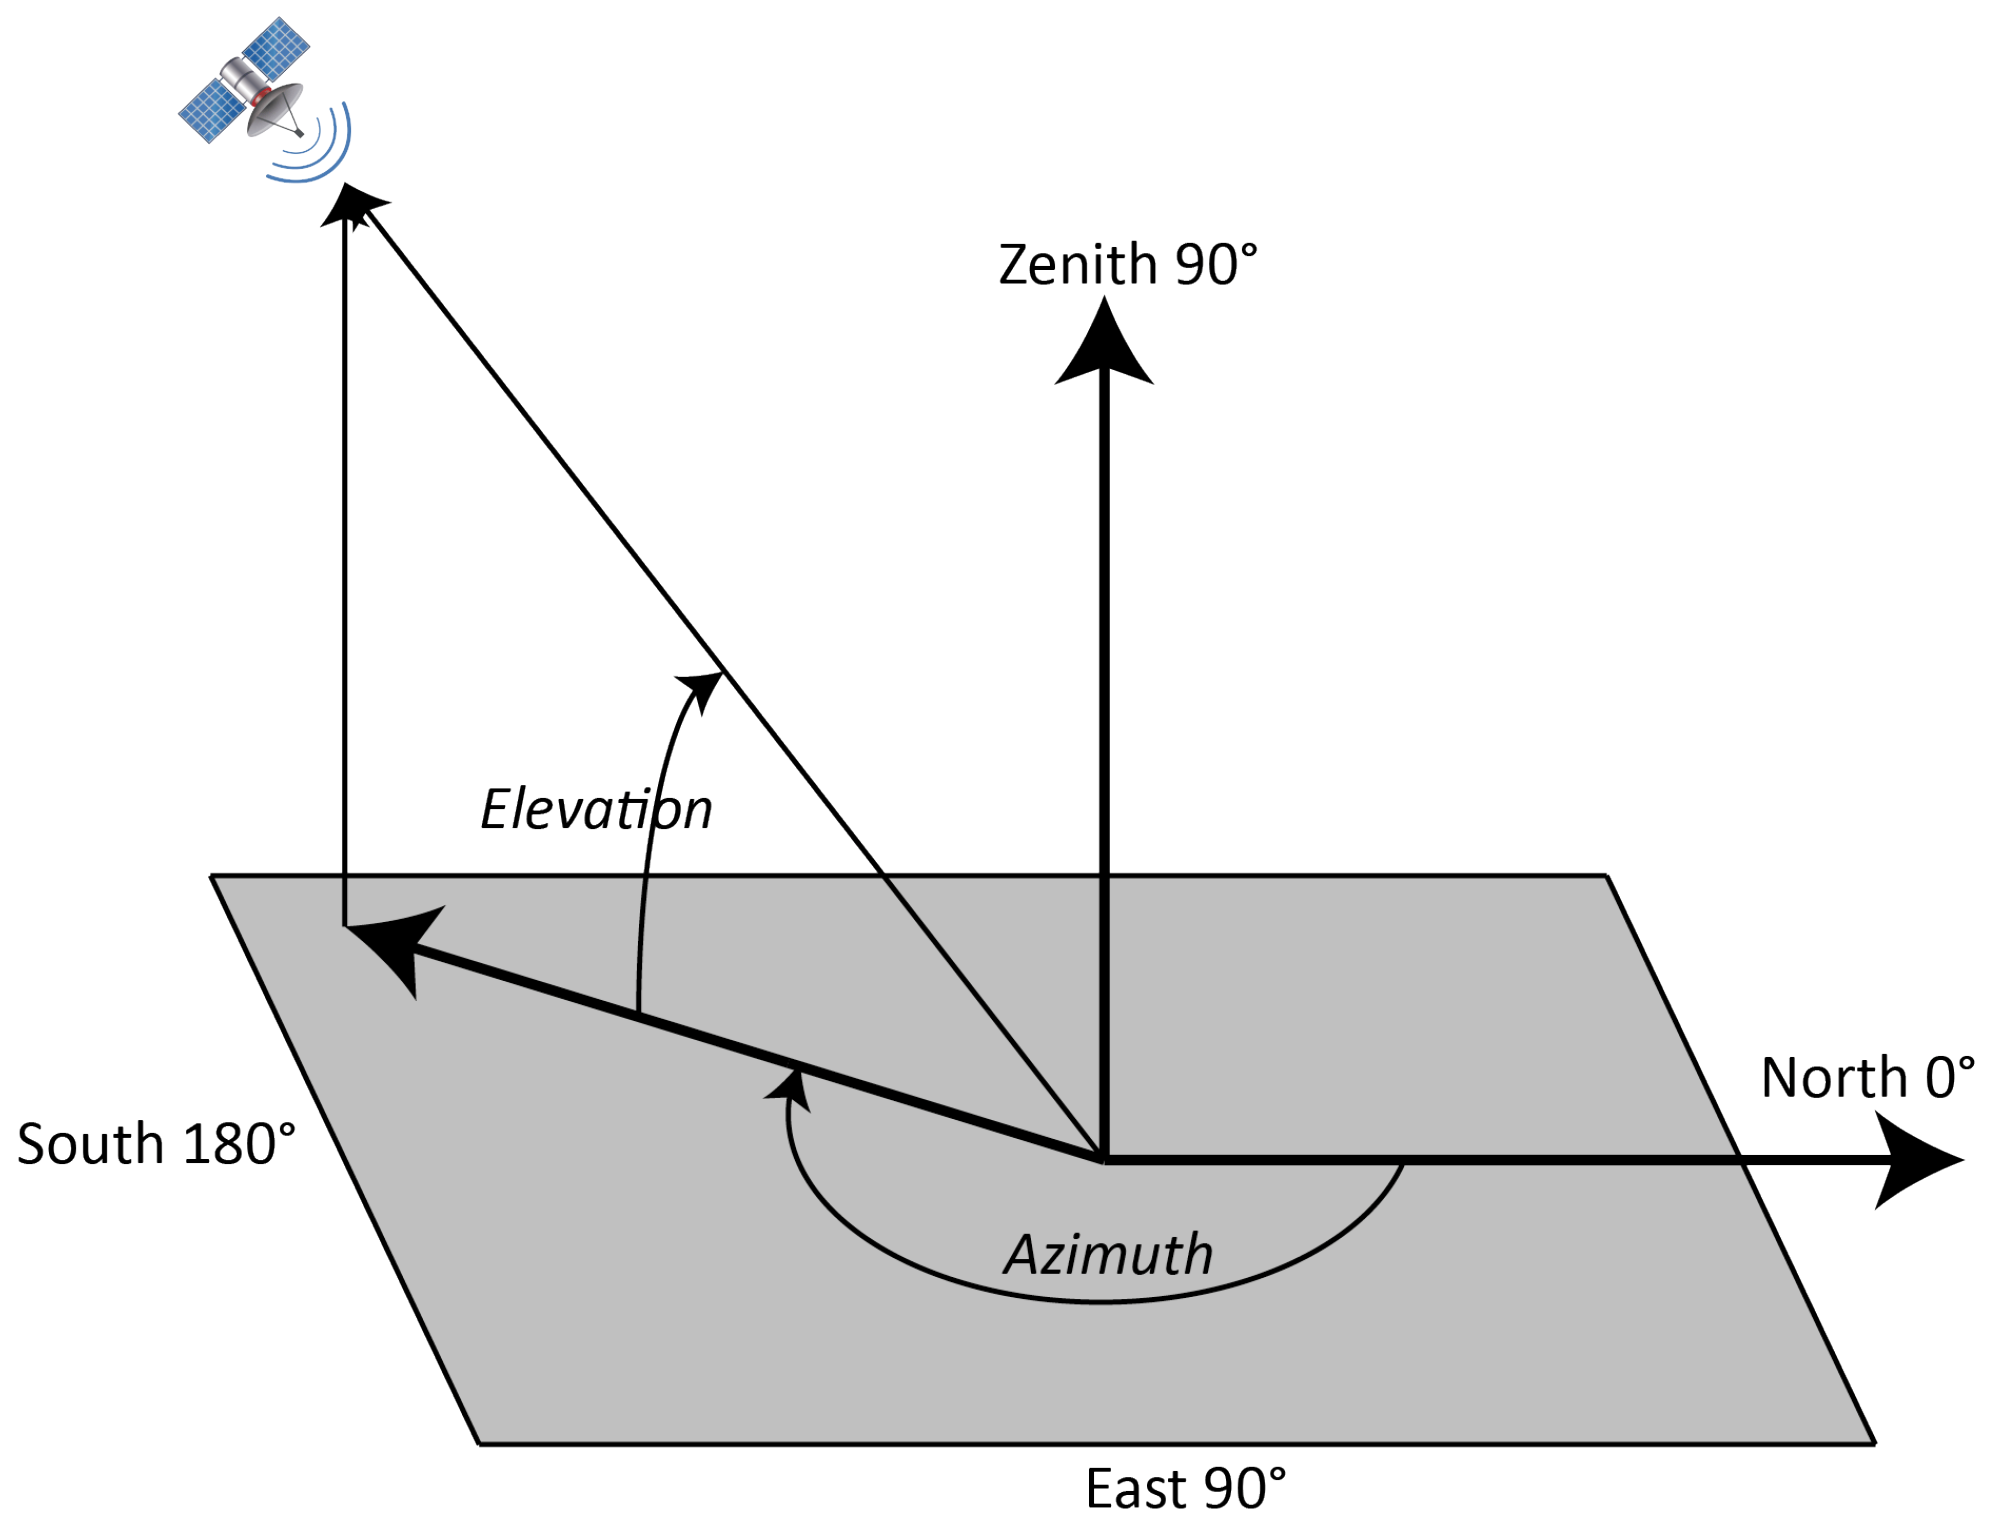
The received radiance is influenced by the elevation angle θ , whereas the satellite view is affected by the azimuth angle α (Figure 5). As multiple snapshots exist, these angles play an unneglectable role in recording the night light data [55]. We here denote the satellite height from the horizontal plane (sea level) as H and the projected point of the satellite on the horizontal plane as ( x , y ) . Then, assuming a flat-land case, for a given point (ground target) on the plane ( x i , y i ) , its elevation angle θ i to the satellite is formulated as follows:
θ i = arctan H d i ,
where d i is the distance between ( x , y ) and ( x i , y i ) is as follows:
d i = ( x x i ) 2 + ( y y i ) 2 .
In the header, the satellite azimuth α and elevation θ to the center point of the image are given. We here denote the center point as ( x c , y c ) . Then, the projected point ( x , y ) of satellite on the horizontal plane is calculated by solving the following equations:
( x x c ) 2 + ( y y c ) 2 = ( H tan θ ) 2 ,
tan α = y y c x x c .
For convenience, we denote x x c as δ and tan α as a; the formula becomes the following:
δ 2 + ( a δ ) 2 = ( H tan θ ) 2 ,
δ = H 2 ( 1 + a 2 ) tan 2 θ = H tan θ 1 + a 2 .
We can now obtain the projected point of the satellite ( x , y ) as follows:
x = δ + x c ,
y = a δ + y c .
After obtaining the projected satellite location on the horizontal plane, we can calculate individual elevation θ i , azimuth α i , and the distance τ i from a location i to the satellite as follows:
τ i = d i 2 + H 2 ,
θ i = arctan H d i ,
α i = arctan y y c x x c .
Calculating the satellite’s position is beneficial to understanding the anisotropic characteristic of night lights [55]. This becomes important as we have multiple snapshots within seconds on a single date.

3.3. Pearson R Correlation Coefficient

We use the Pearson correlation coefficient to analyze the relationship between satellite observed night lights and ground NSB values. The typical NSB value observed in Hong Kong is between 14 and 20 mag/arcsec2 and is in logarithmic scale. Therefore, we converted the satellite’s readings in the linear unit (radiance in remote sensing) to the logarithmic unit (magnitude) before analyzing their correlation.
In the analysis, both the calibrated Luojia-1 and raw ISS images (16-bit) are in linear scale. Denote their values as x, and their correlation coefficient with the NSB values is calculated as follows:
R = 1 N 1 i = 1 N x ^ i μ x ^ ¯ σ x ^ y i μ y σ y ,
where,
x ^ = l o g 10 x ,
where μ x ^ and σ x ^ are the mean and standard deviation of the logarithmic scale satellite observations, respectively, and μ y and σ y are the mean and standard deviation of NSB values, respectively.

4. Results and Analysis

4.1. Correlation Analysis

4.1.1. Multiple Snapshots and Satellite Locations

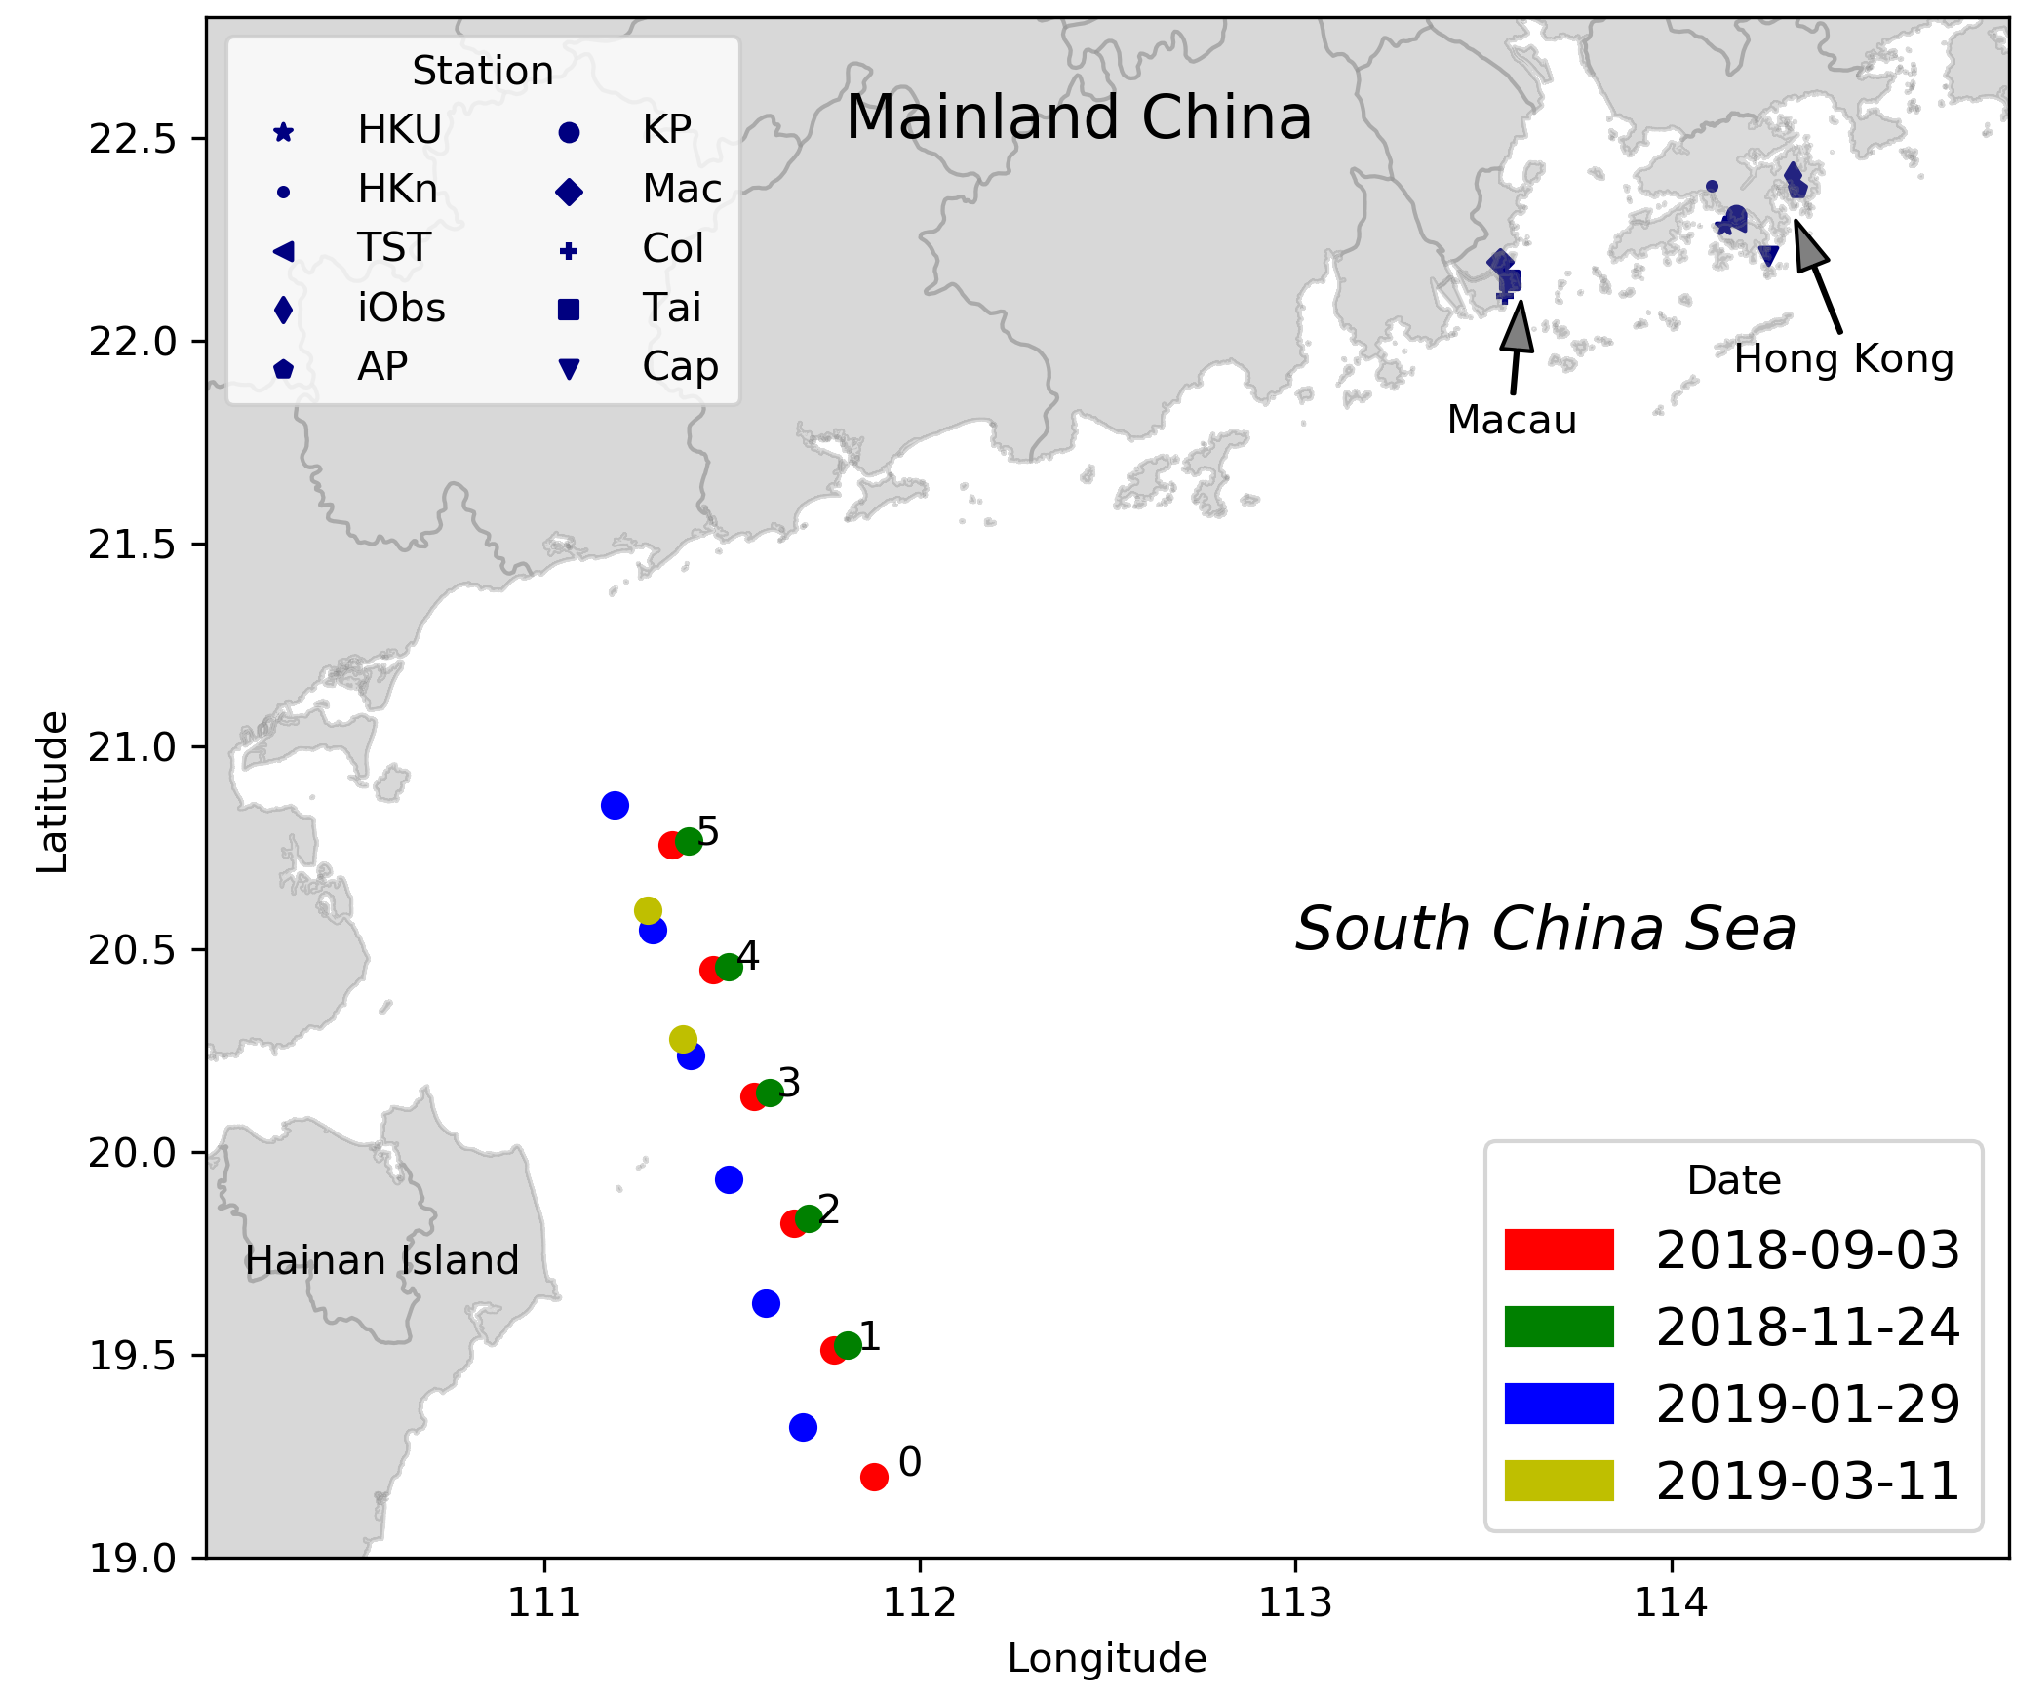
Figure 6 shows the Luojia-1 satellite’s positions when it was capturing the image snapshots. Take the data taken in September as an example. Although the images mainly cover Hong Kong and the Pearl River Delta, the satellite was to the southwest of the captured area near the Hainan Island (>700 km), going from south to north. The satellite was about 647 km high, and the path from the University of Hong Kong (HKU station) to the satellite is about 774 km. The azimuth changed from southwest 36.28 to 61.41 (from the position ’0’ to the position ’5’ in Figure 6). The difference in azimuth angle will lead to different light transmission paths. As Hong Kong is a highly populated city with many high-rise buildings, the angle effect is unneglectable [30].
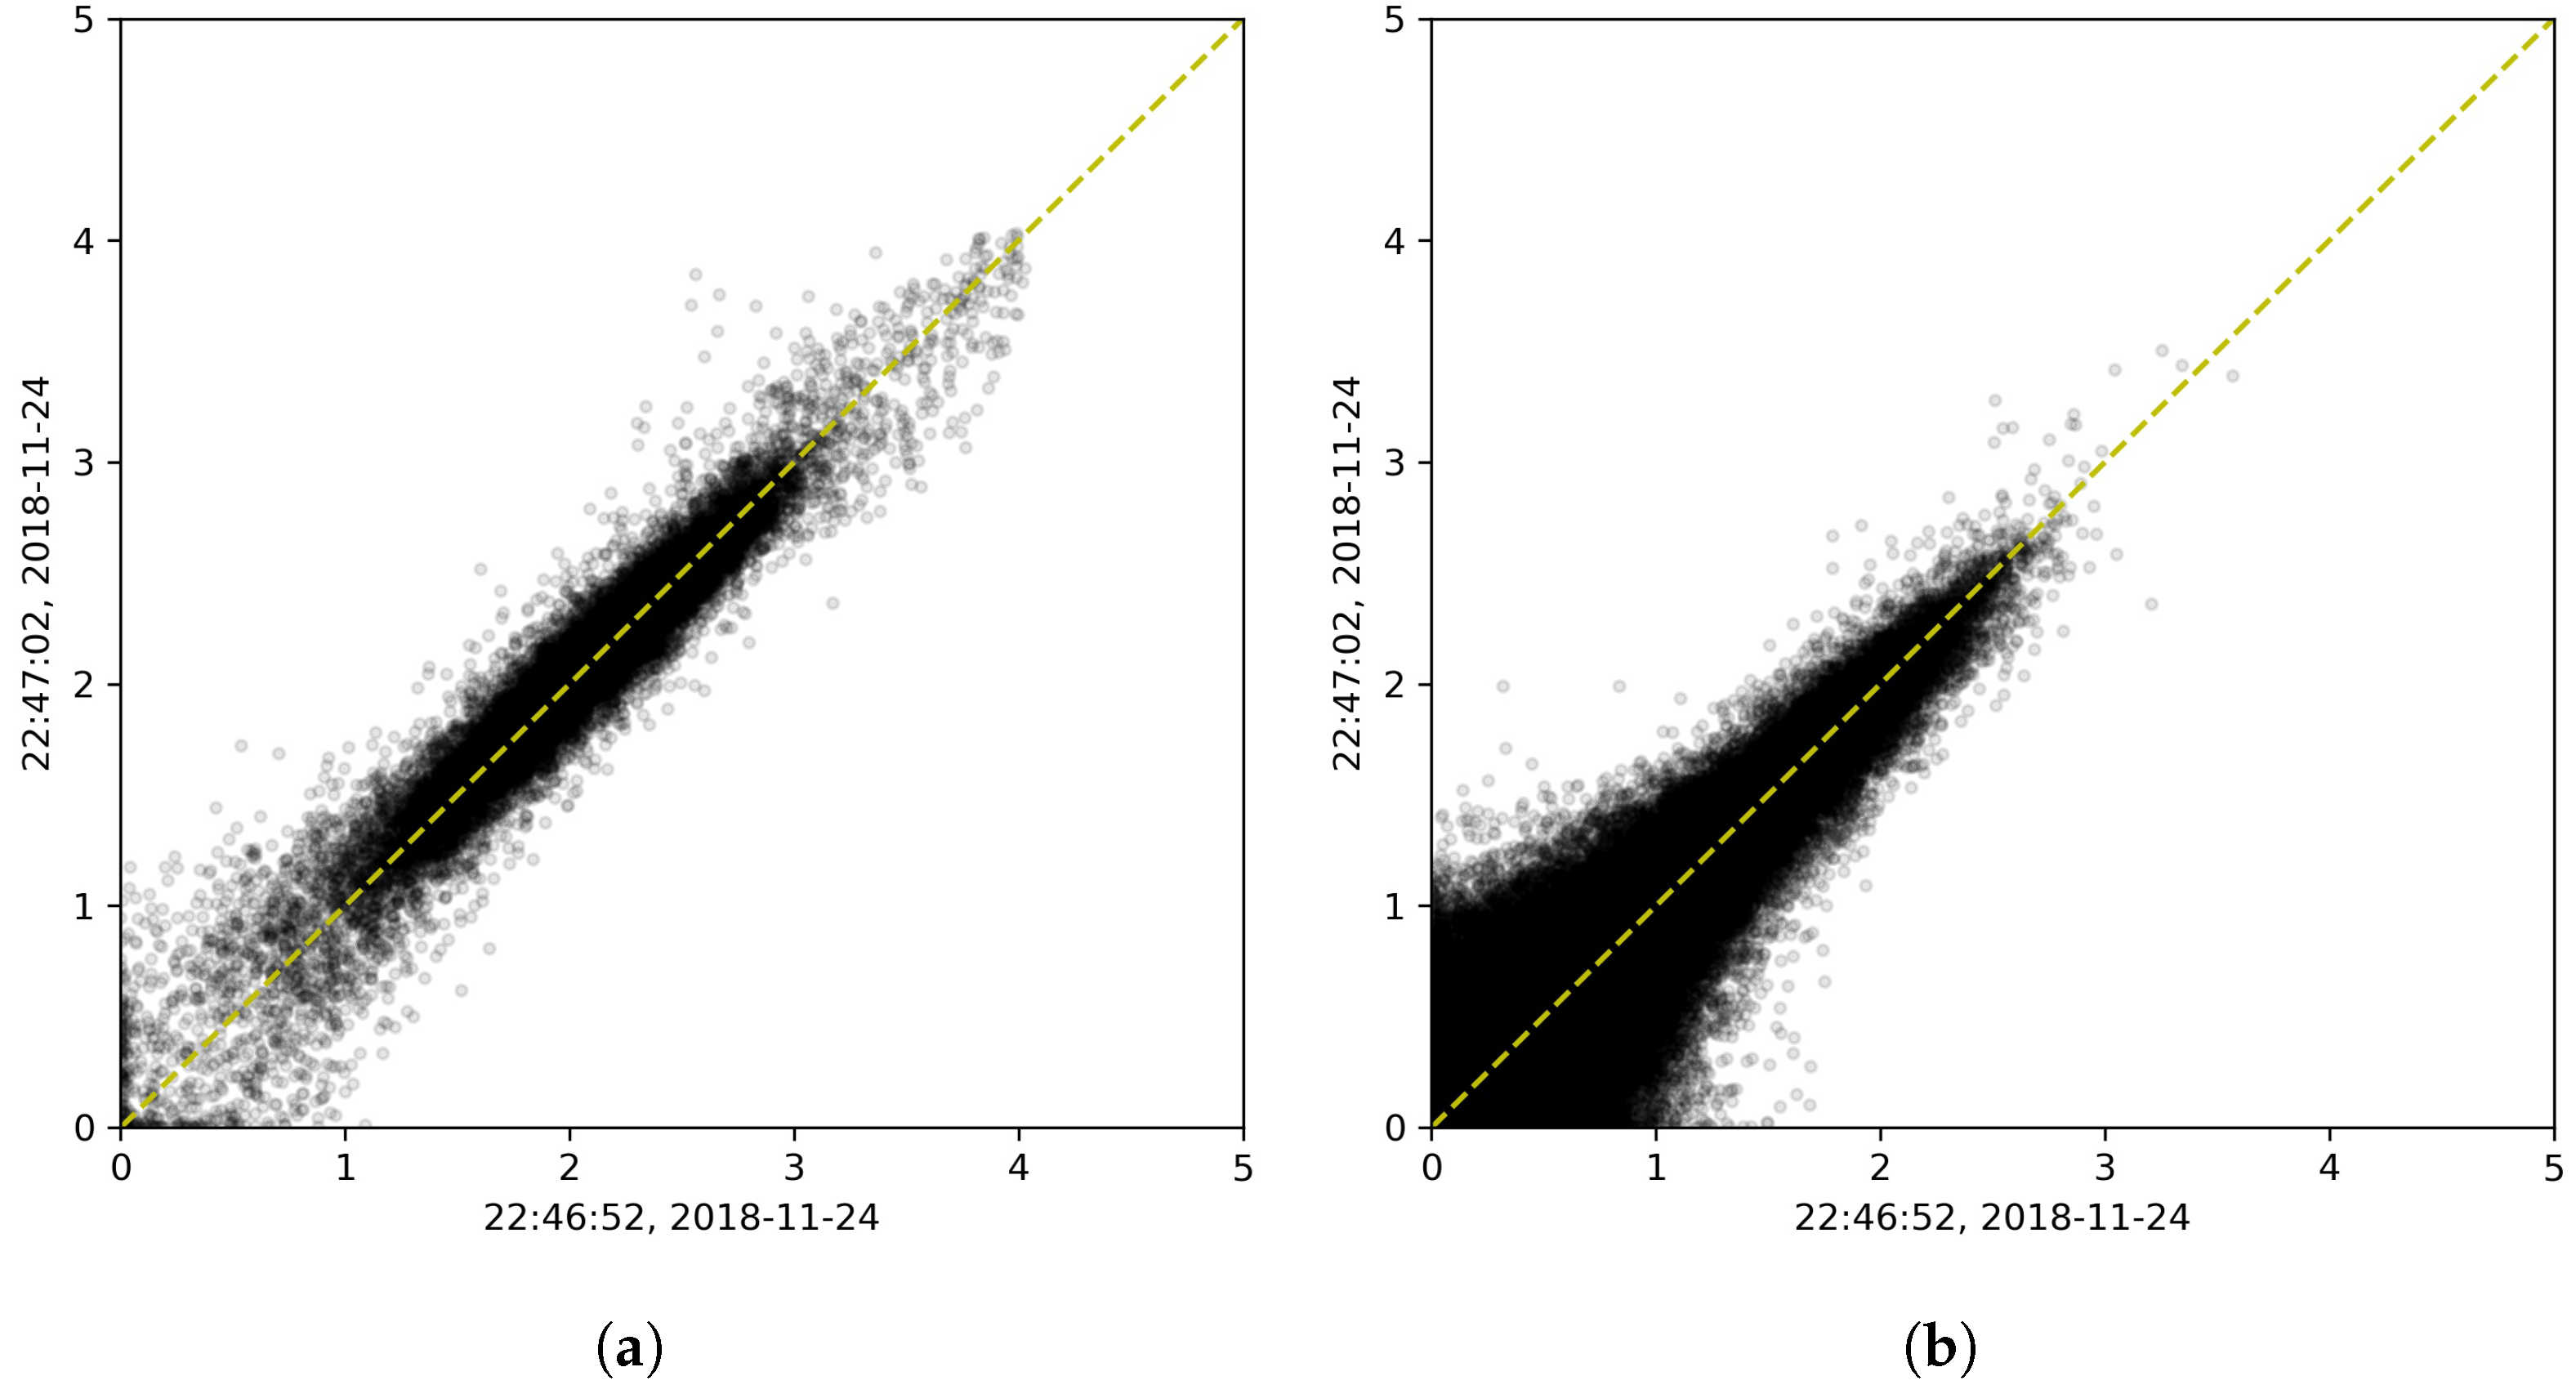
To analyze the consistency of Luojia-1 multiple snapshots in a short period, we resampled these Luojia-1 images to 0.001 (approximately 111 m) and conducted a scatter correlation analysis. The scatter plots are shown in Figure 7. We used two image snapshots taken within 10 s from November as an example. It should be safe to assume that ground lighting was unchanged within 10 s. We found that the correlation in urban areas (direct lights) is better than that in the natural environment (diffuse lights). However, even in the bright urban regions, the consistency is not exactly perfect, but R = 0.96 within 10 s.

4.1.2. Correlation Between the Luojia-1 Images and Field Measurements

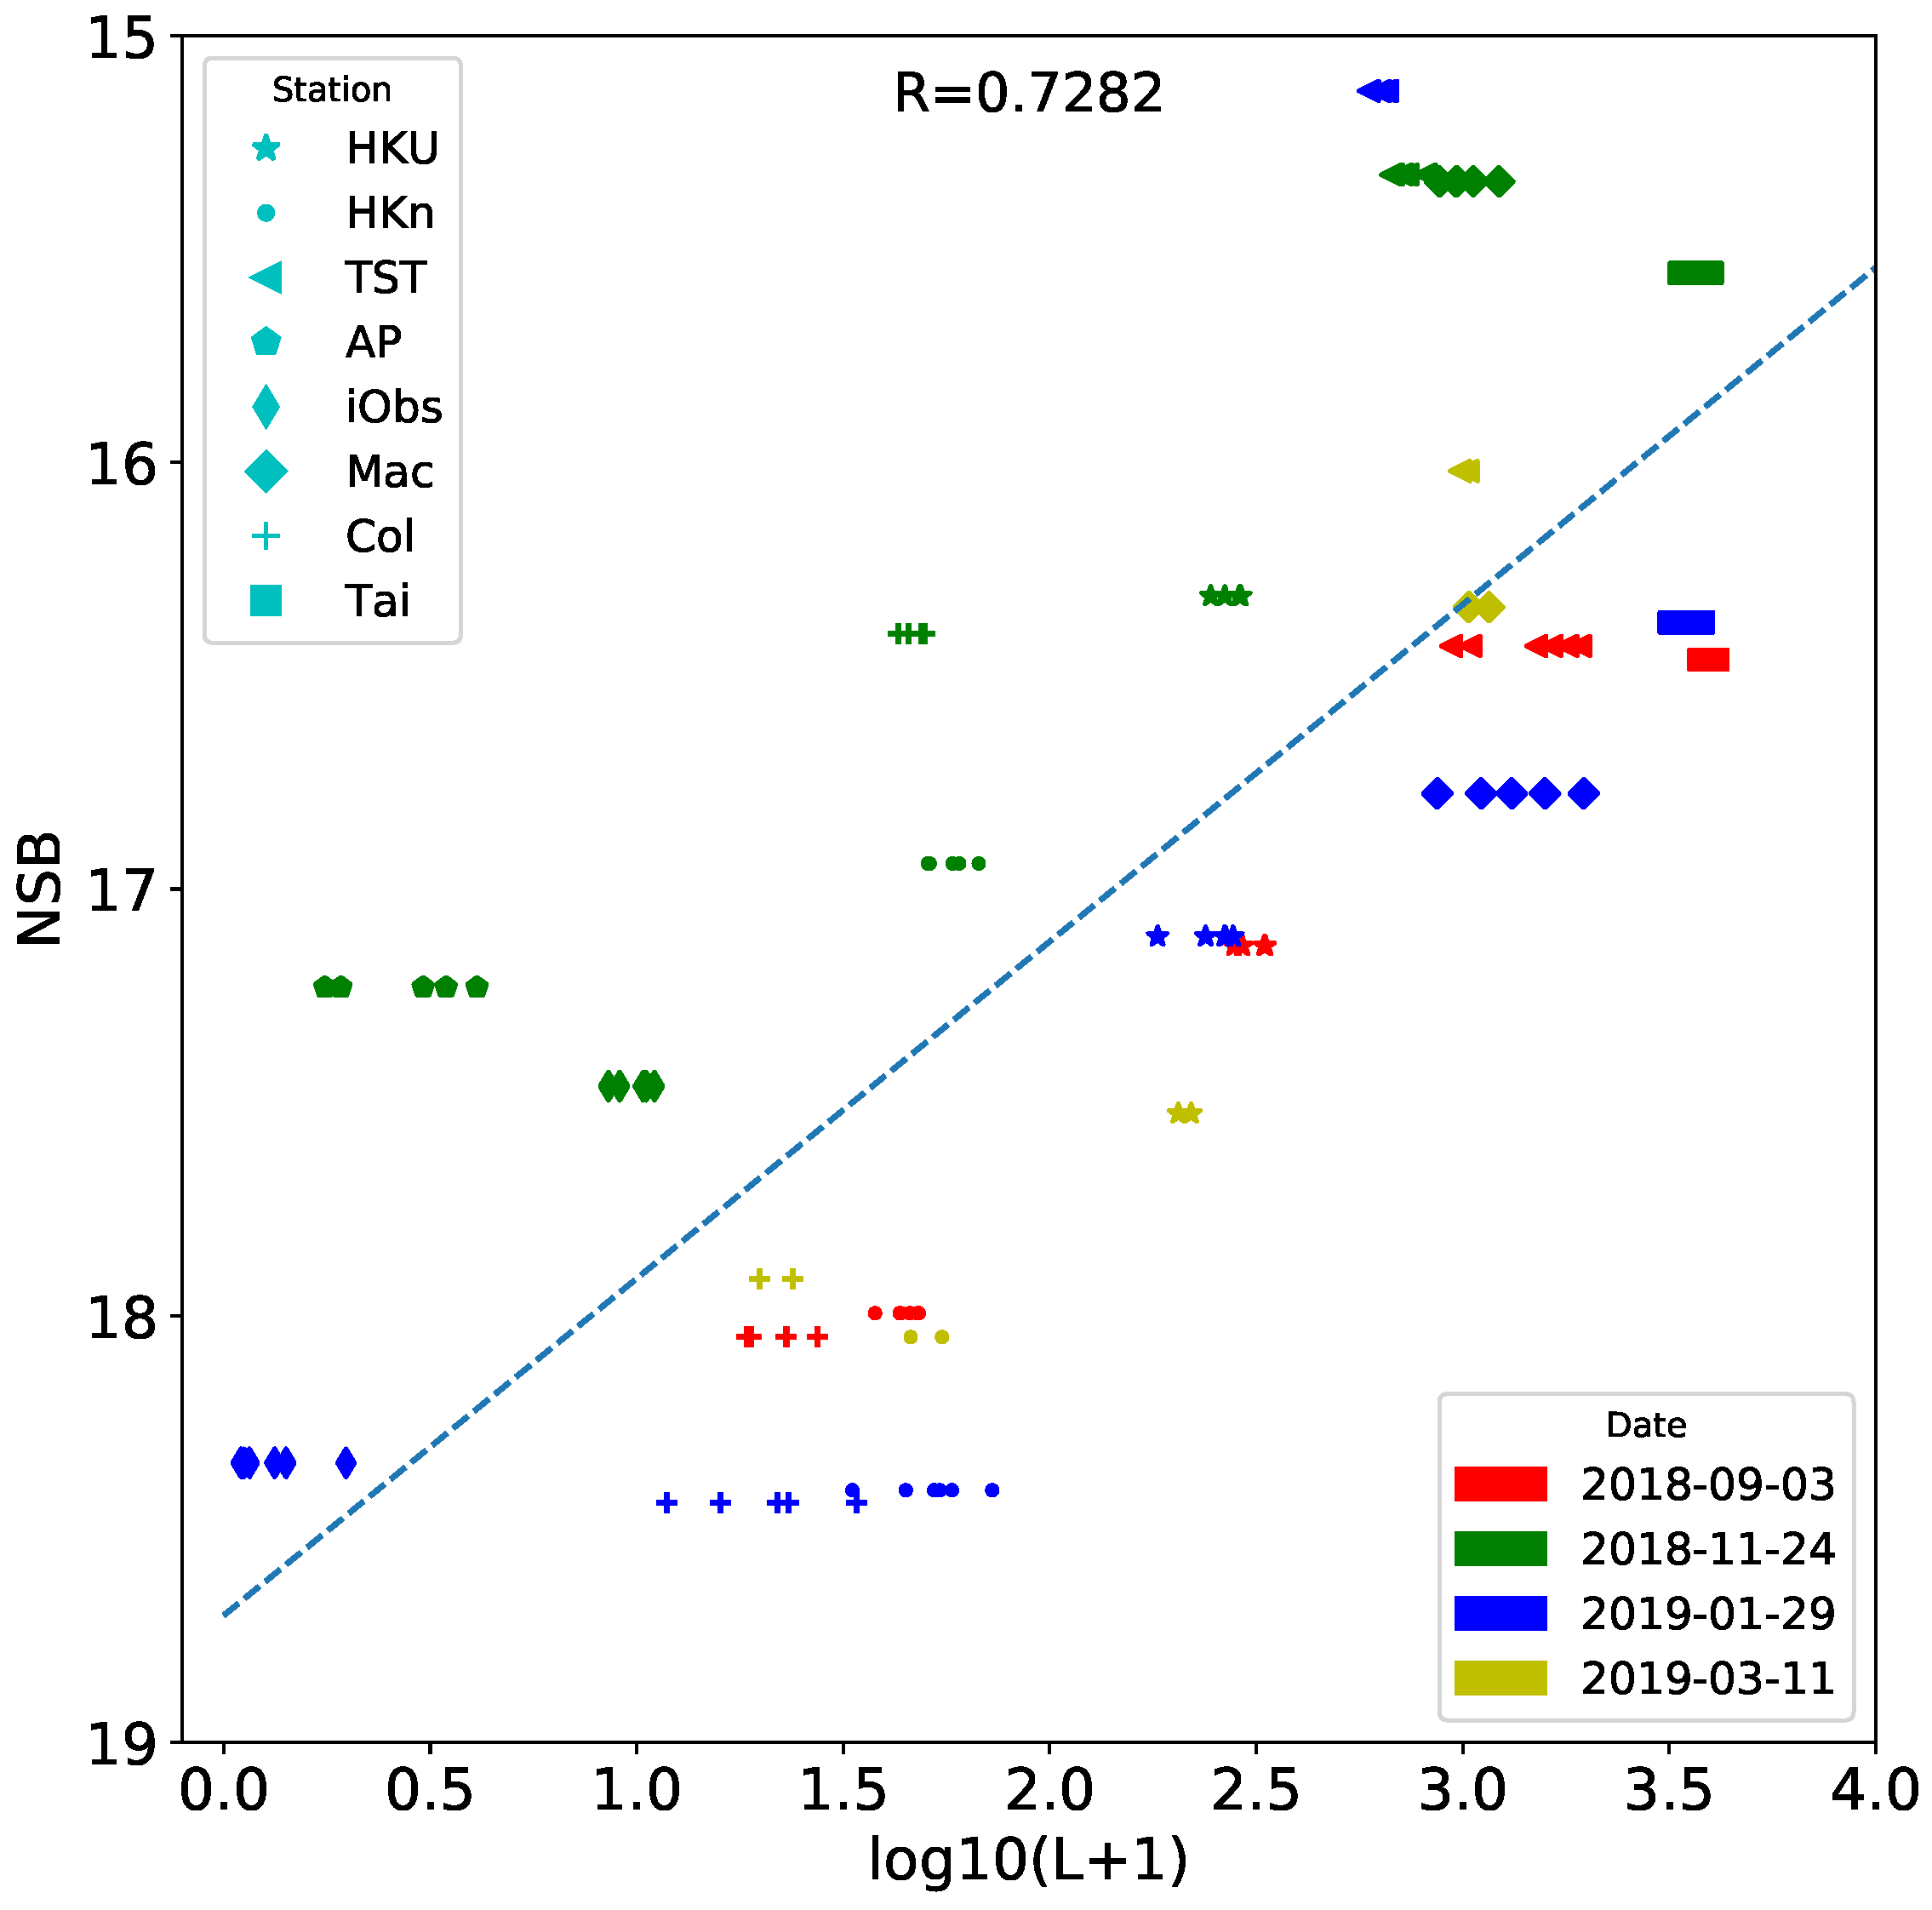
After analyzing multiple snapshots, we show the scatter plot between the calibrated Luojia-1 images and the field measurements from four different dates in Figure 8. As multiple snapshots exist, they are all used in the analysis. For the Luojia-1 data, we extracted the mean value from an 11 × 11 window (i.e., 1100 × 1100 m) of the centered pixel of the station. The mean standard deviation of the satellite data of these stations is 15.47%, or 10.14% if we exclude the three suburban stations (AP, iObs, and Col). In our analyses, we also tested for 1 × 1 window, 5 × 5 windows and with Gaussian kernels, their results were worse than 11 × 11.
For the NSB data, we used the mean of 5 min records from the network. The scatter plot is shown in Figure 8. The R coefficient of this plot is 0.7282 ( R 2 = 0.5302, p < 0.0001; we also conducted an analysis based on a 1 × 1 window and a 5 × 5 mean window, and the achieved R correlation coefficients are 0.6781 and 0.7176, respectively). Note that as the NSB values are in magnitude and reverse order, we use the negative values to calculate the coefficient. The obtained result is acceptable, considering in some images some clouds appeared in the central areas near the harbor (Figure 3g,h) and the images are slightly blurred. The result indicates that there is a positive linear correlation between the NSB values and remote sensing night lights: brighter in ground measurements leads to brighter remote sensing images. However, some deviations exist. For example, the brightest in satellite images is the Tai station, but it is not the brightest in our network. The ground data indicate that the TST station is the brightest among Hong Kong and Macau.

4.1.3. Correlation Between ISS Images and Field Measurements

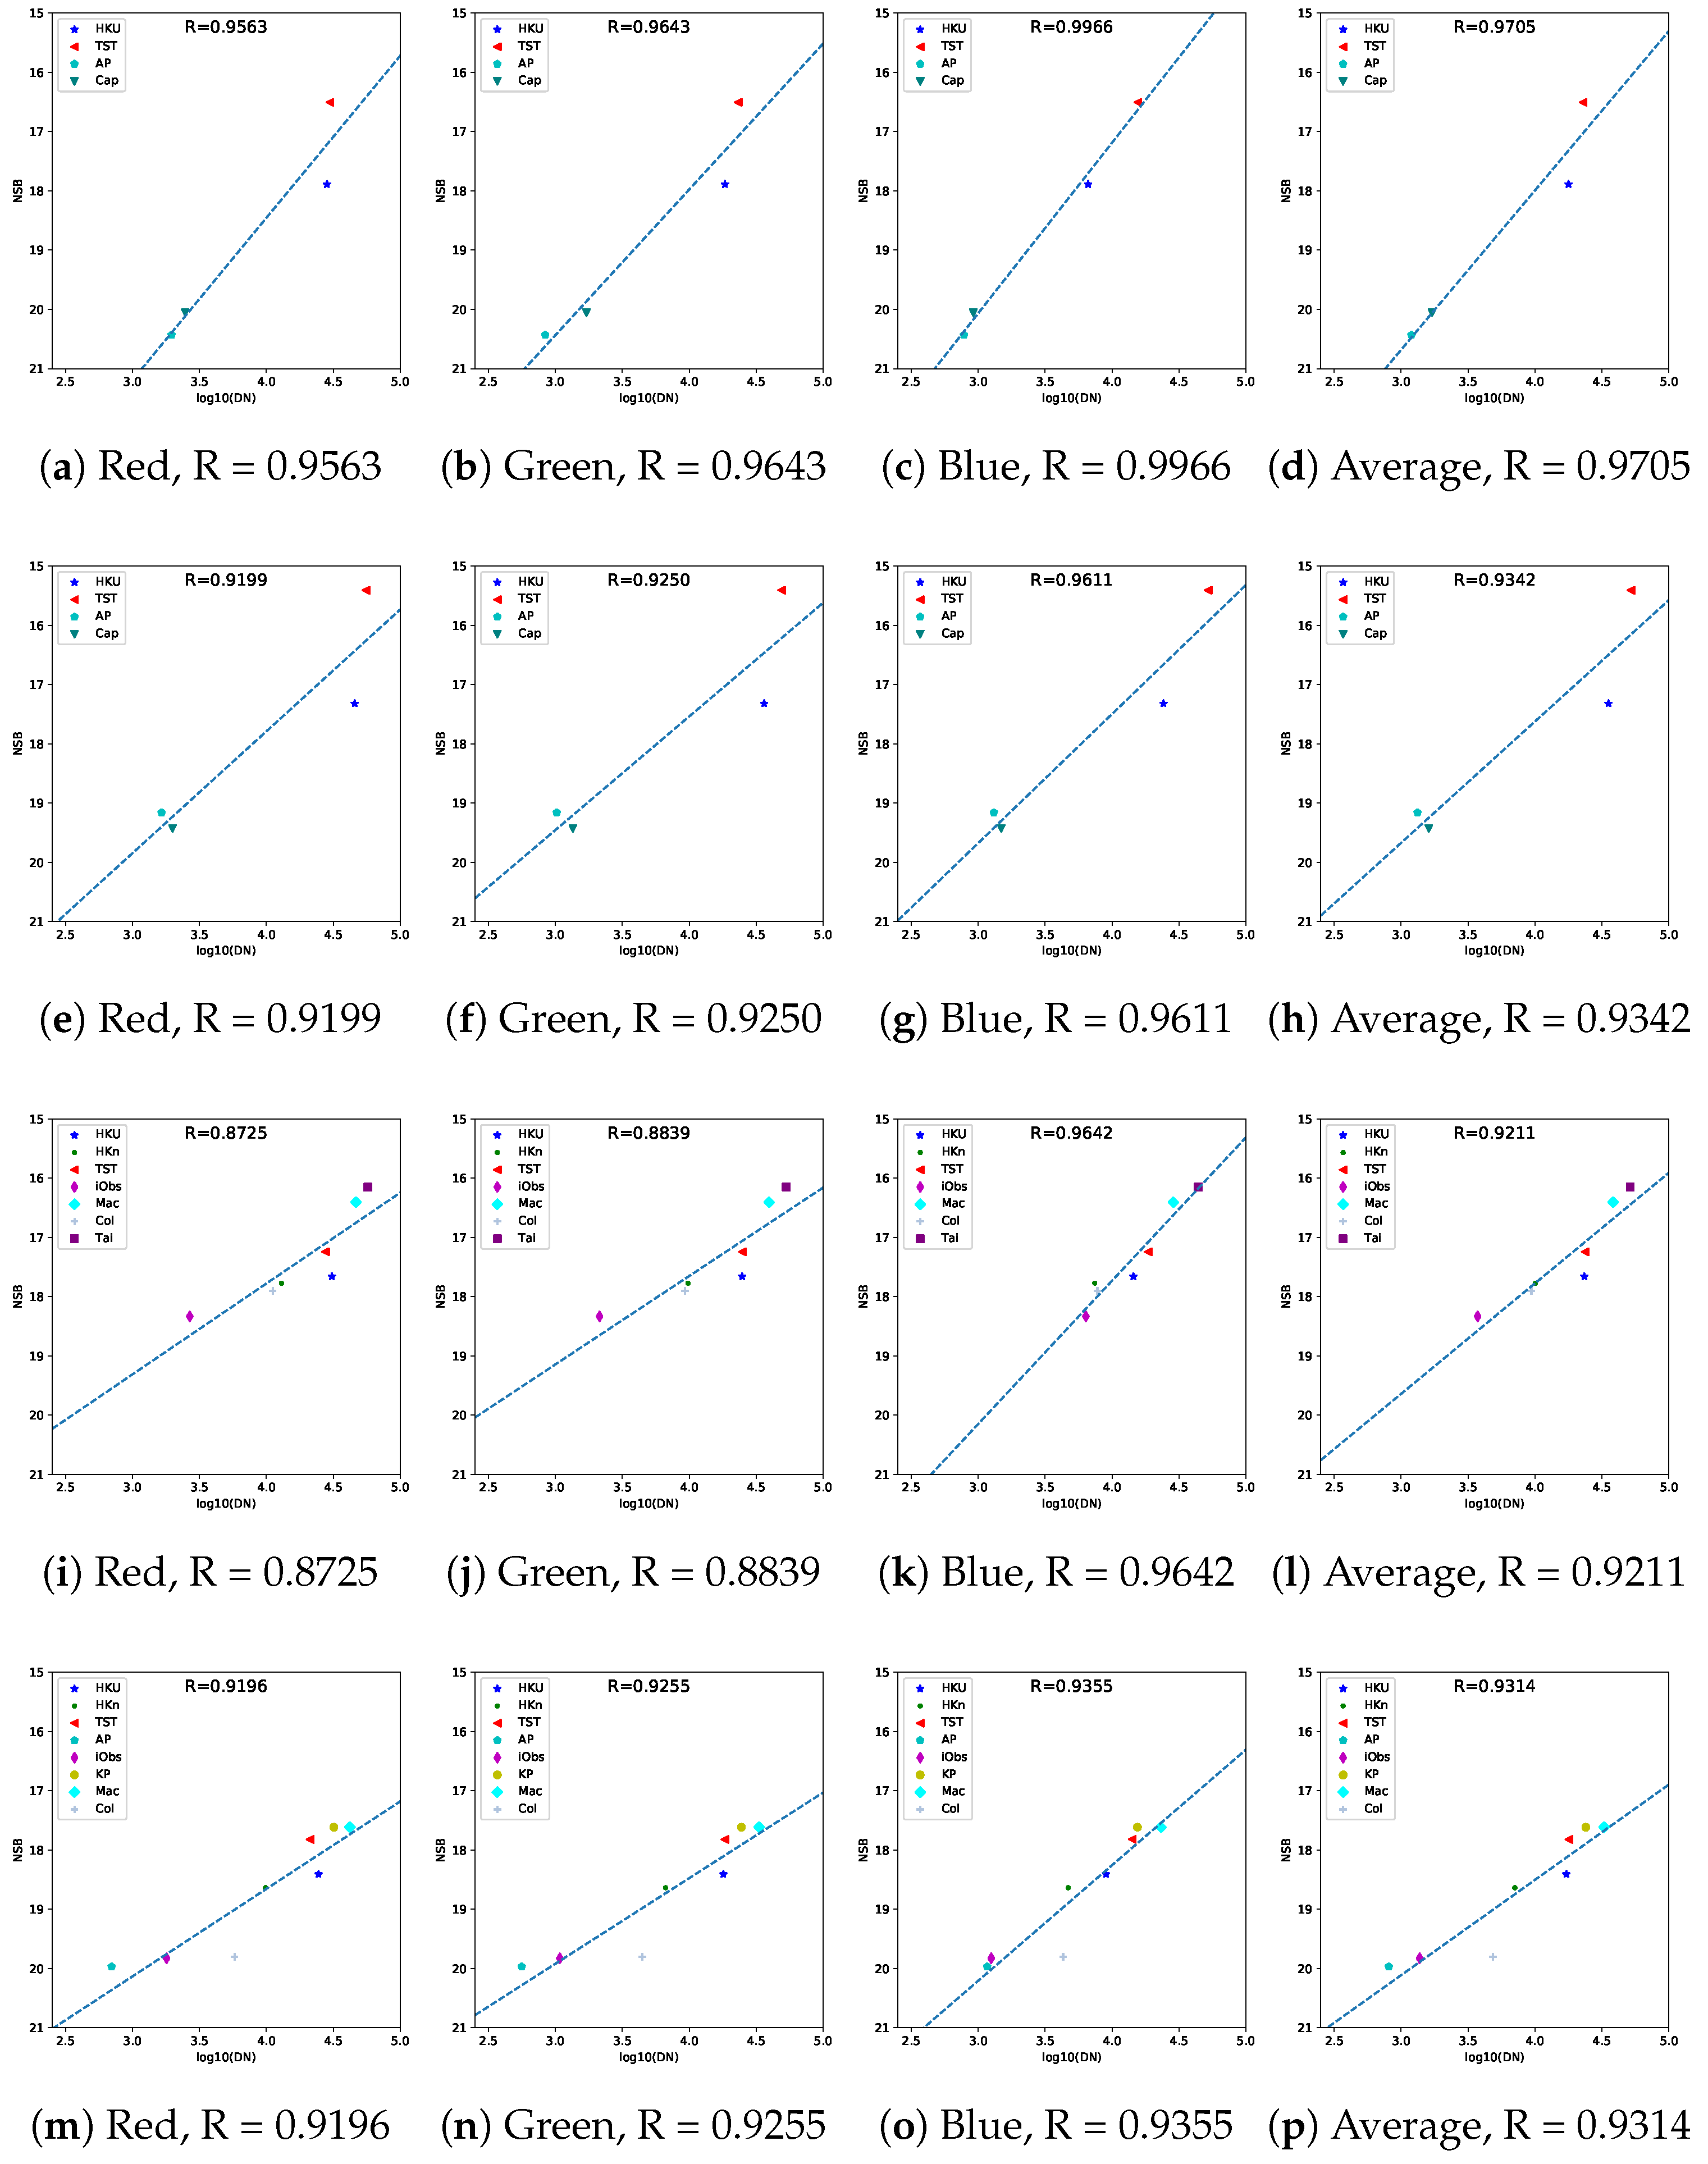
In this section, we analyze the relationship between NSB values and ISS imagery. The correlation plots of the four dates’ data in a channel-wise fashion are shown in Figure 9. The plots are obtained using the mean value of an 11 × 11 (i.e., 1100 × 1100 m) window from the best image snapshot. The first to the fourth row shows the results from the ISS-20150119, ISS-20150123, ISS-20180228, and ISS-20200226 data, respectively. A more detailed table including all obtained correlation coefficients using a single pixel and a 5 × 5 window (i.e., 110 × 110 m and 550 × 550 m, respectively) from other image snapshots of the same date is shown in Table 5.
From Figure 9, the obtained coefficients are between 0.85 and 0.99, indicating a high linear correlation between the NSB values and remote sensing night lights. For all data from four individual dates, the highest correlation is achieved at the blue channel and the lowest at the red channel.
To test the robustness of the correlation, we also analyze image snapshots captured on the same day, as shown in Table 5. The obtained correlation coefficients are all higher than 0.81 for the 28 image snapshots. For the blue channel, the coefficients are between 0.91 and 0.9984, the highest among the three channels. The coefficients for the red and green channels are between 0.81 and 0.96 and between 0.85 and 0.97. The obtained coefficients via a 5 × 5 mean window and 1 × 1 mean window are similar to (but slightly lower than) the ones via an 11 × 11 mean window.
Finally, we use all available ISS images from the four dates to conduct a correlation analysis. Note we should treat such comparisons carefully, as these ISS images are not calibrated. The correlation plots in a channel-wise fashion are shown in Figure 10. Even though the ISS images are not calibrated, an excellent linear correlation can still be achieved with the multitemporal data (R > 0.81).

4.2. Analysis with City Zones

4.2.1. Land Use Brightness Ranking Based on Land Use Data

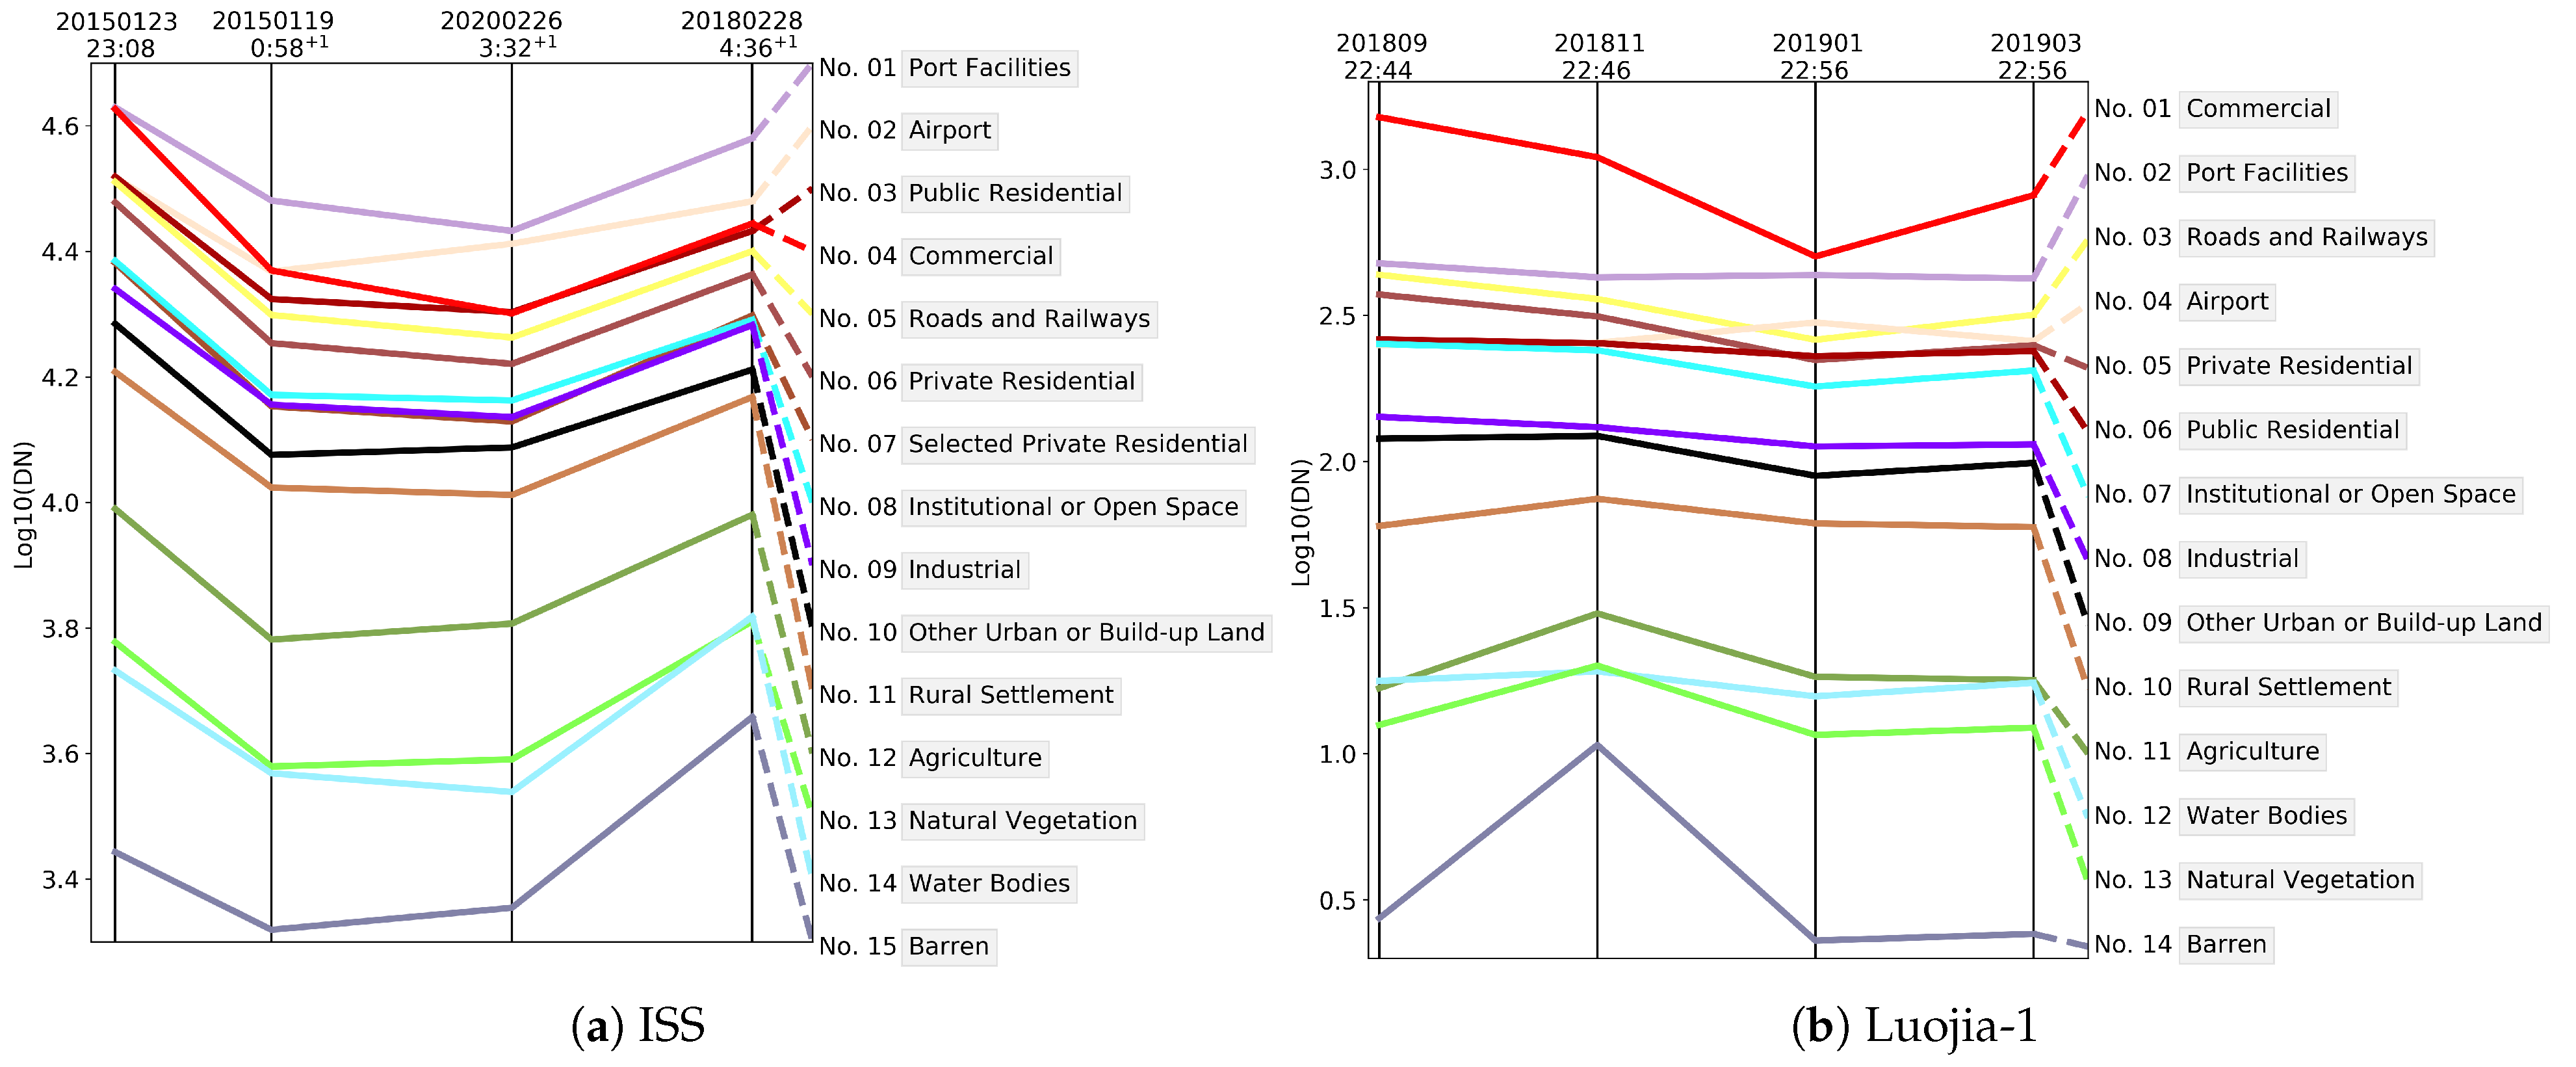
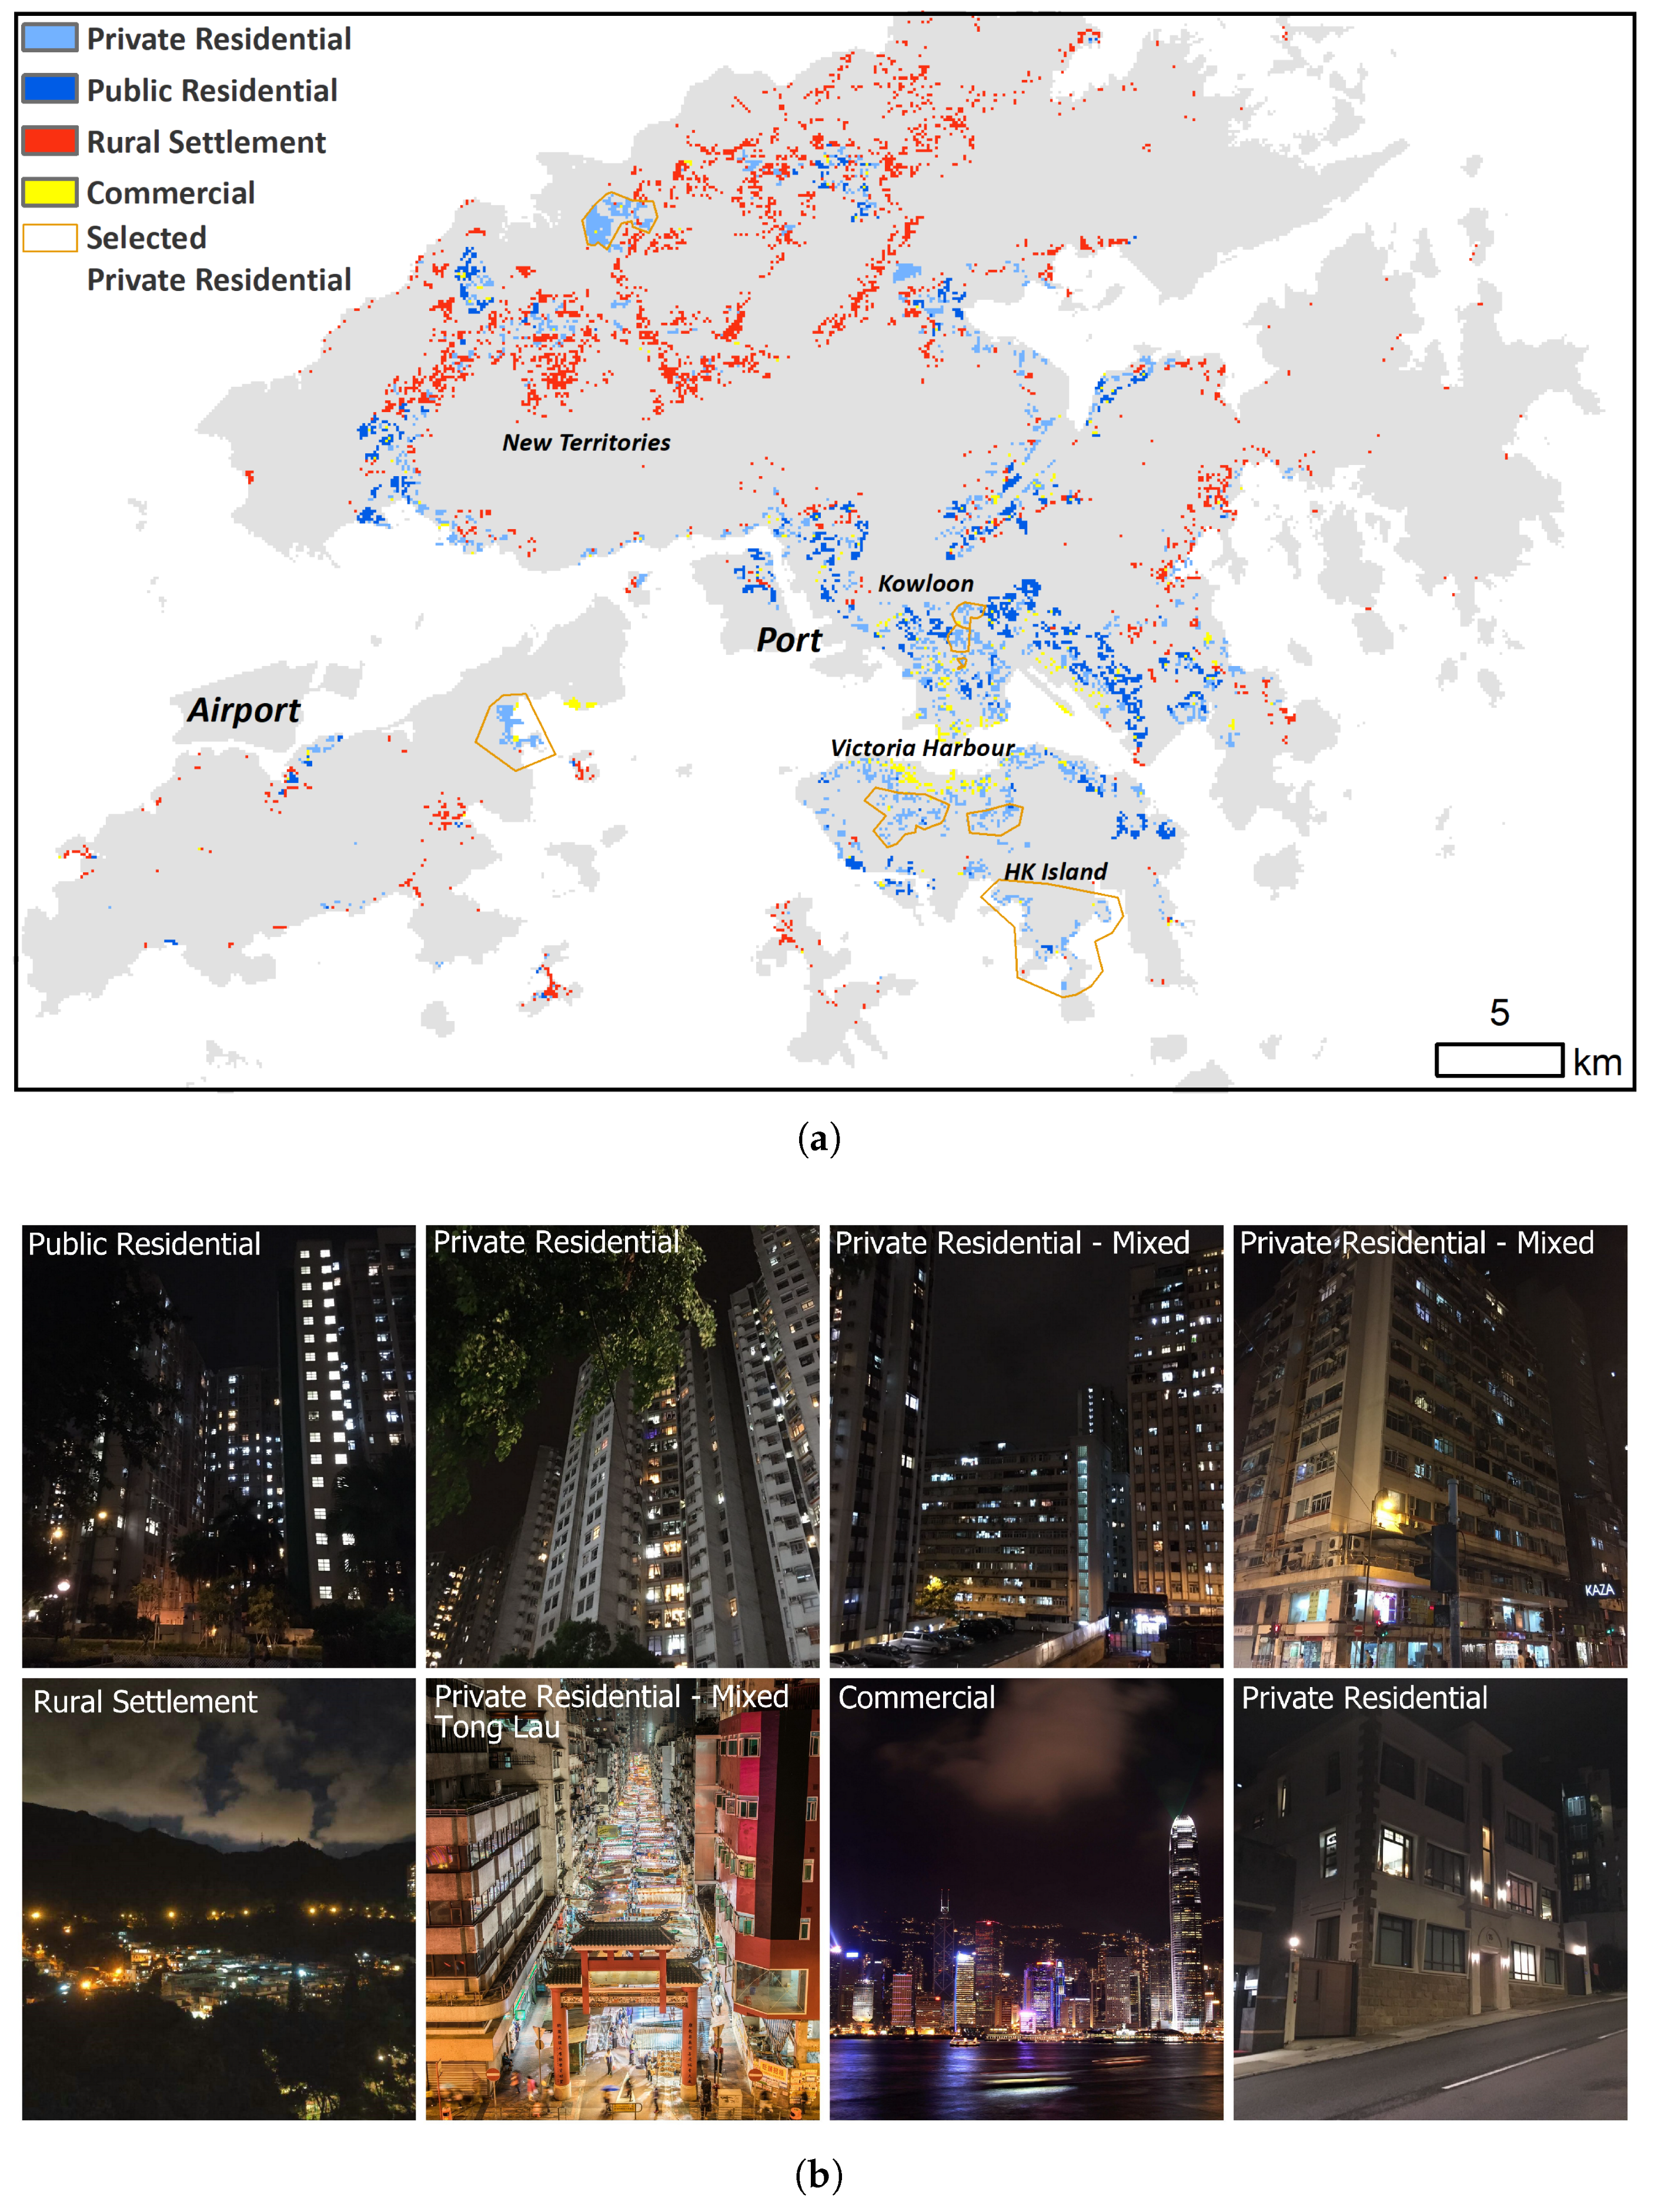
The brightness rankings of land use classes based on the ISS images and Luojia-1 images are shown in Figure 11. Both datasets have four available dates for analysis. For the ISS images, two were captured in 2015 at 0:58+1 and 23:08 local time, one was captured in 2018 at 4:36+1 local time, and another one was captured in 2020 at 3:32+1 local time. For the Luojia-1 images, they were captured between 22:44 and 22:56 local time and between September 2018 and March 2019. For reference purposes, we show the land use map with only residential and commercial areas in Figure 12 with sample nighttime photos in Figure 12. The complete land use map can be found in Figure 4.
We first analyze the ranking based on ISS images. It is consistent across the four-date ISS images: the class of port facilities ranks first, and barren ranks last. Within urban classes, public residential areas, and roads and railways are brighter than private residential areas throughout the night. Land use types that do not have nighttime activities, such as the institutional or open spaces, industrial areas, and other built-up areas, are darker. Rural settlements are the darkest of the urban classes. For the natural classes, agricultural areas are the brightest, followed by natural vegetation, water bodies, and barren. Commercial areas are brighter in early night (23:08, brighter than the airport) than late night after midnight (darker than the airport). This indicates that the brightness of ALAN changes with time in different city zones. In downtown early night, the city is lit up by human activities. With most people falling asleep and the decorative lighting near both sides of the Victoria Harbor turned off, commercial areas have almost the same brightness as residential areas.
The rankings based on the Luojia-1 images are slightly different from the ISS images. First, of all, as the Luojia-1 images were captured before 23:00, it is reasonable that commercial areas are the brightest in all classes, followed by port facilities. It is interesting that the airport is less bright in the Luojia-1 images and is even darker than roads and railways, which is inconsistent with the ISS images. As for residential areas, the brightness of public and private residential areas is similar. The rankings of the remaining land use classes are consistent with the ISS images.
Based on both remote sensing data sources, we found that commercial areas are brighter in early night, and port facilities are brighter in late night. Industrial areas, open space, and other build-up areas are the darkest within city zones. The natural classes are the darkest as expected. However, some inconsistency between the ISS images and Luojia-1 images should be emphasized. (1) The airport is brighter in ISS images and darker in Luojia-1 images. (2) Public residential areas are brighter than private residential areas in the ISS images, but they have similar brightness on the Luojia-1 images. The difference is likely due to their respective spectrum response functions as follows: Luojia-1 has a spectral response from about 500 to 900 nm [51], and ISS images were captured from Nikon D4 and D5 that have a spectral response that is closer to human eyes [19,56].

4.2.2. Private and Public Residential Areas

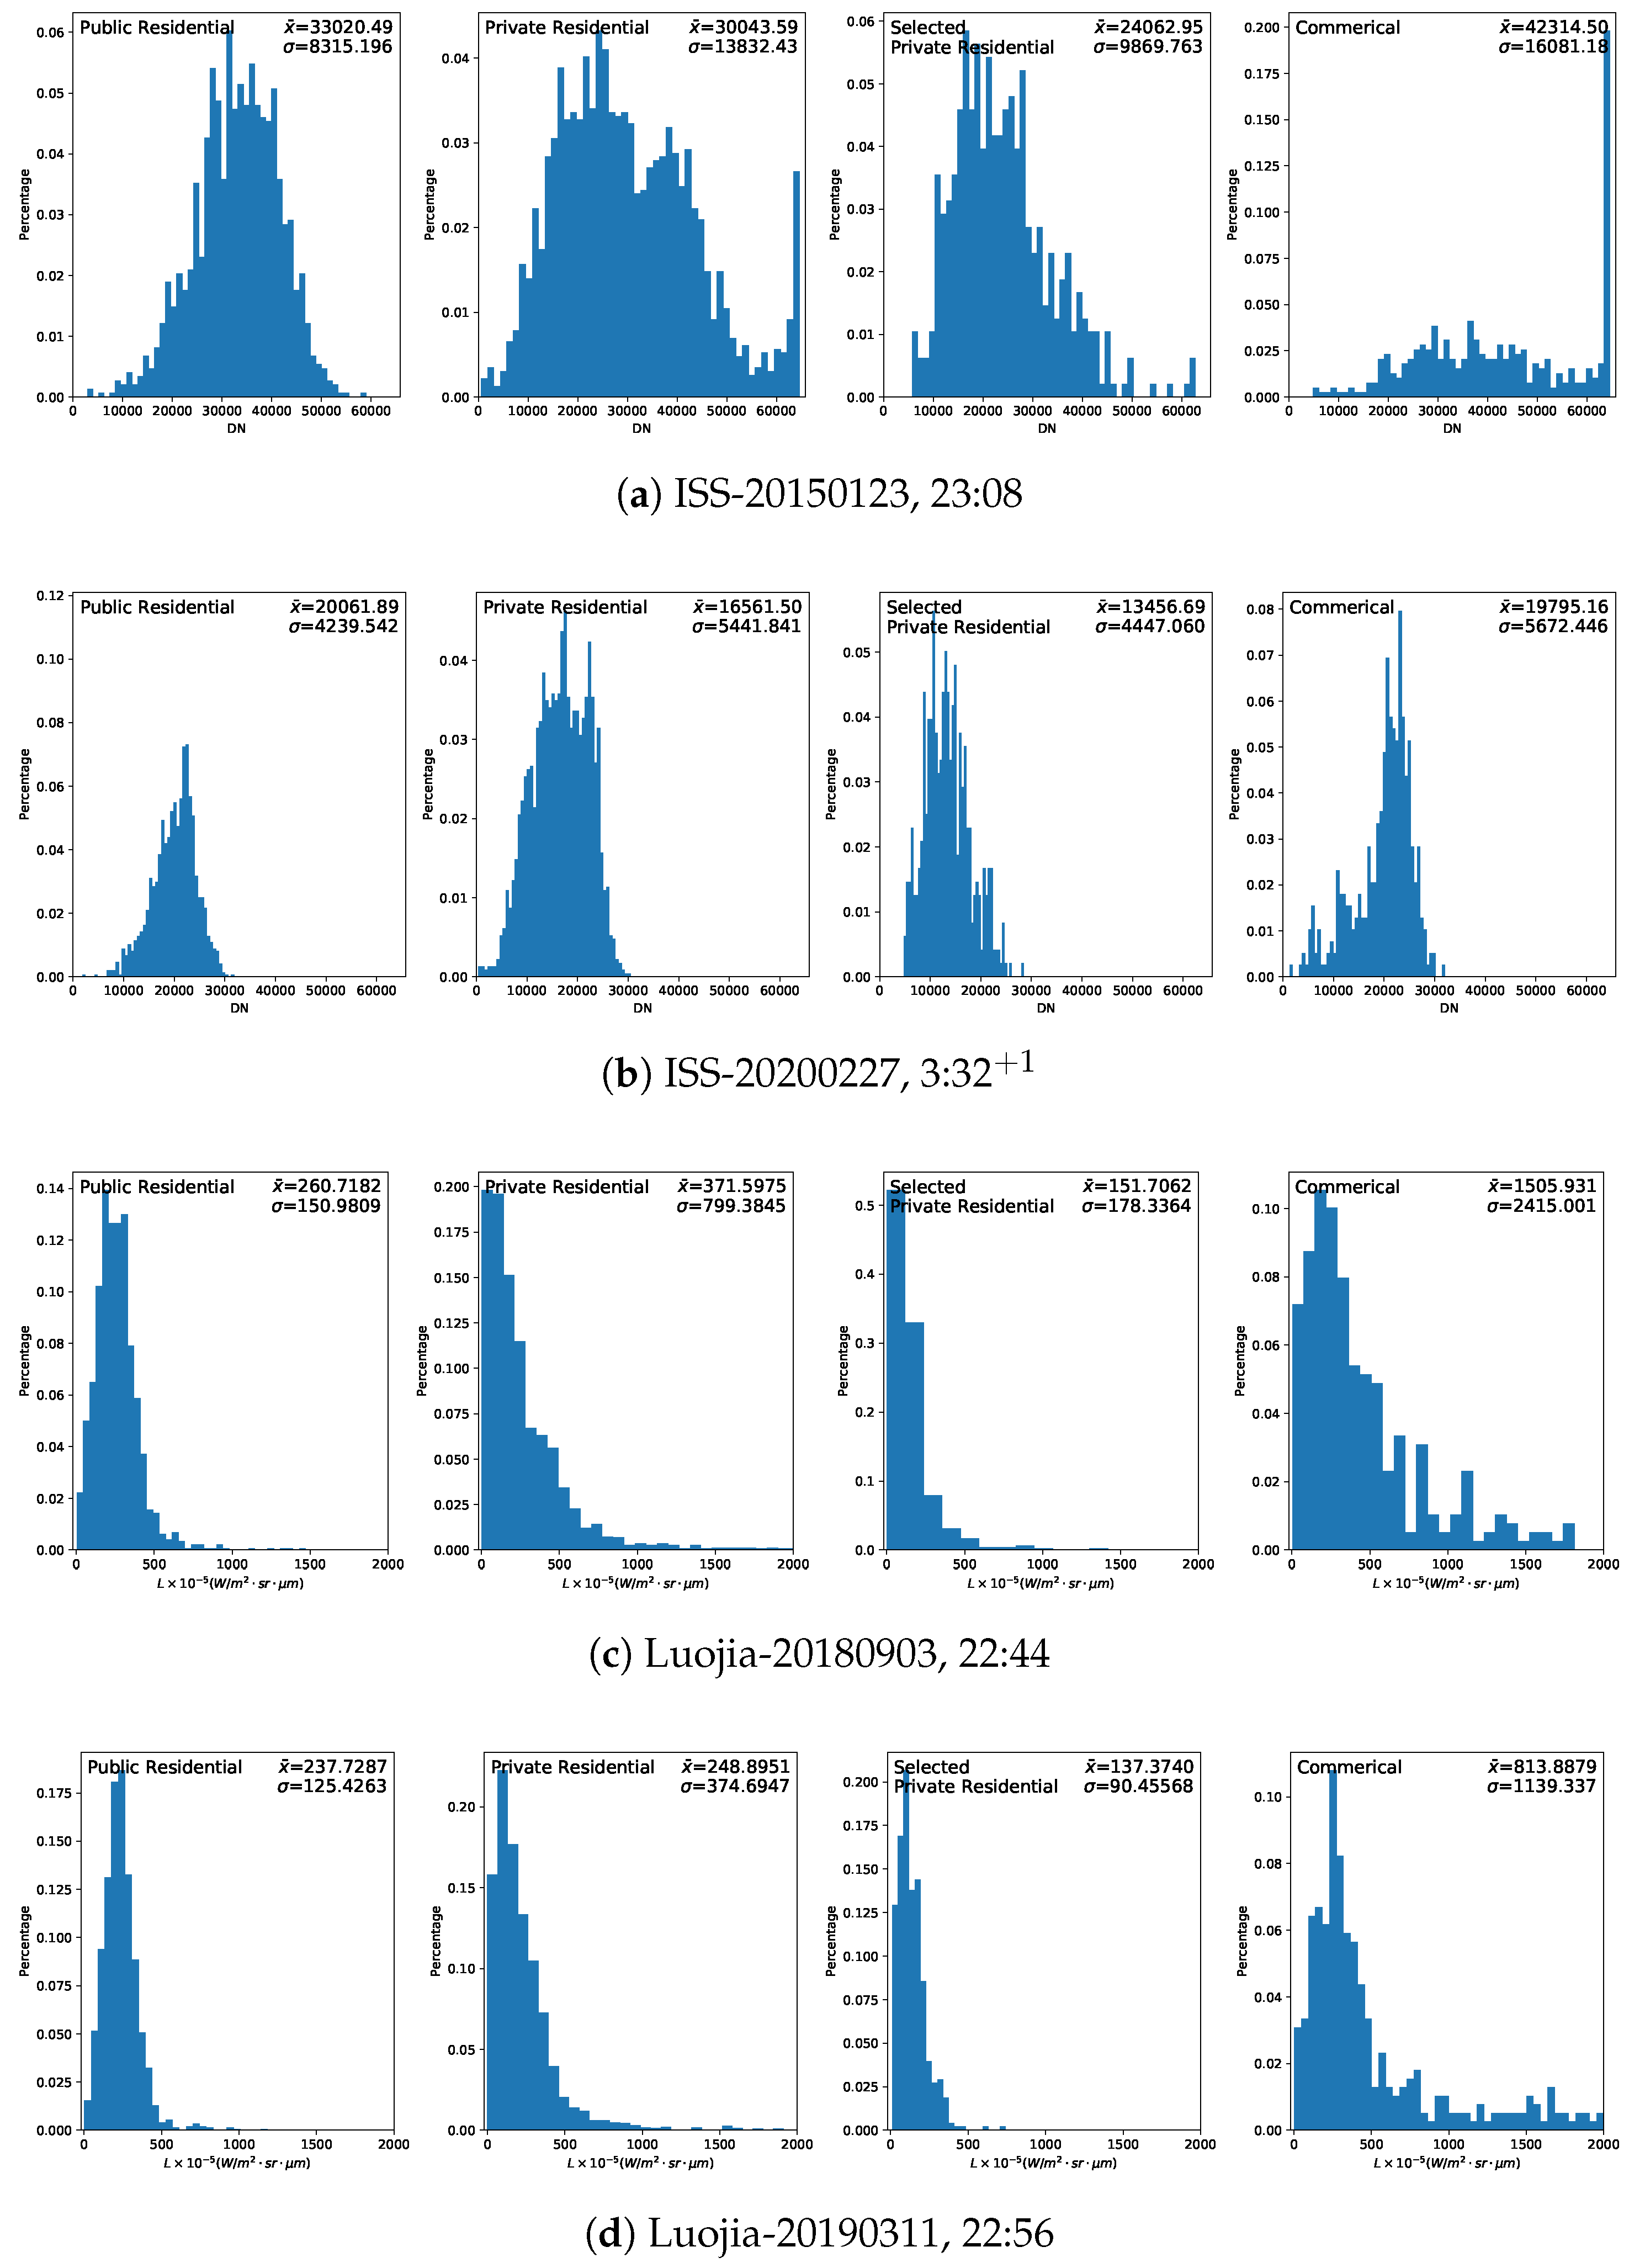
Private residential areas defined in the land use data include two types of buildings in Hong Kong: (1) typical residential areas such as houses in the west, villas, and condos; and (2) mixed-use residential buildings with ground-floor shopping like tong lau in Hong Kong and East Asia. From the nighttime photo of tong lau in Figure 12, it is apparent that the mixed-use private residential areas exhibit different external lighting features compared to typical residential areas (though mixed-use buildings are typical and common in Hong Kong). To further distinguish their difference, we selected some private residential areas we know for sure are not mixed-use (as shown in Figure 12), and then show the night light distributions of public, private, and the selected private residential areas in Figure 13. For simplicity, we show two results with ISS images and two with Luojia-1 images. Although the average brightness of private residential areas in the Luojia-1 images is brighter than public residential areas, the deviation within the former is larger as well, indicating that private residential areas are more heterogeneous. However, the selected private residential areas (without mixed-use buildings) are significantly darker with a lower deviation. Therefore, the brightness of private residential areas should be interpreted carefully in two parts. The selected private residential areas (pure residential) are darker than the mixed-use private residential areas and the public ones. On the other hand, the mixed-use private residential areas, e.g., tong lau (relatively poor living environment in Hong Kong [57]), receive more artificial lights.
Another interesting phenomenon is that the Luojia-1 data successfully captured the lighting changes in commercial and private residential areas (with mixed-use buildings) before and after external lighting was turned off. The Hong Kong Government has a task force on external lighting and recommends switching off external lighting (typically in commercial areas) after 23:00, following the switching-off recommendation outlined in the Charter on External Lighting. The turn-off time of individual buildings is not precisely 23:00 as measured from Figure 3, because some stakeholders enforce such action slightly before 23:00 (time alignment issues and other reasons). From Figure 13c,d observed by the Luojia-1 data at two different local times (22:44 and 22:56), it is apparent that commercial and private residential areas are significantly darker at 22:56 than at 22:44, e.g., the mean value of commercial areas dropped from 1505 to 813. It shows the effectiveness of the action, and also challenges remote sensing on how to monitor multitemporal night lights within one night.

4.2.3. The Airport

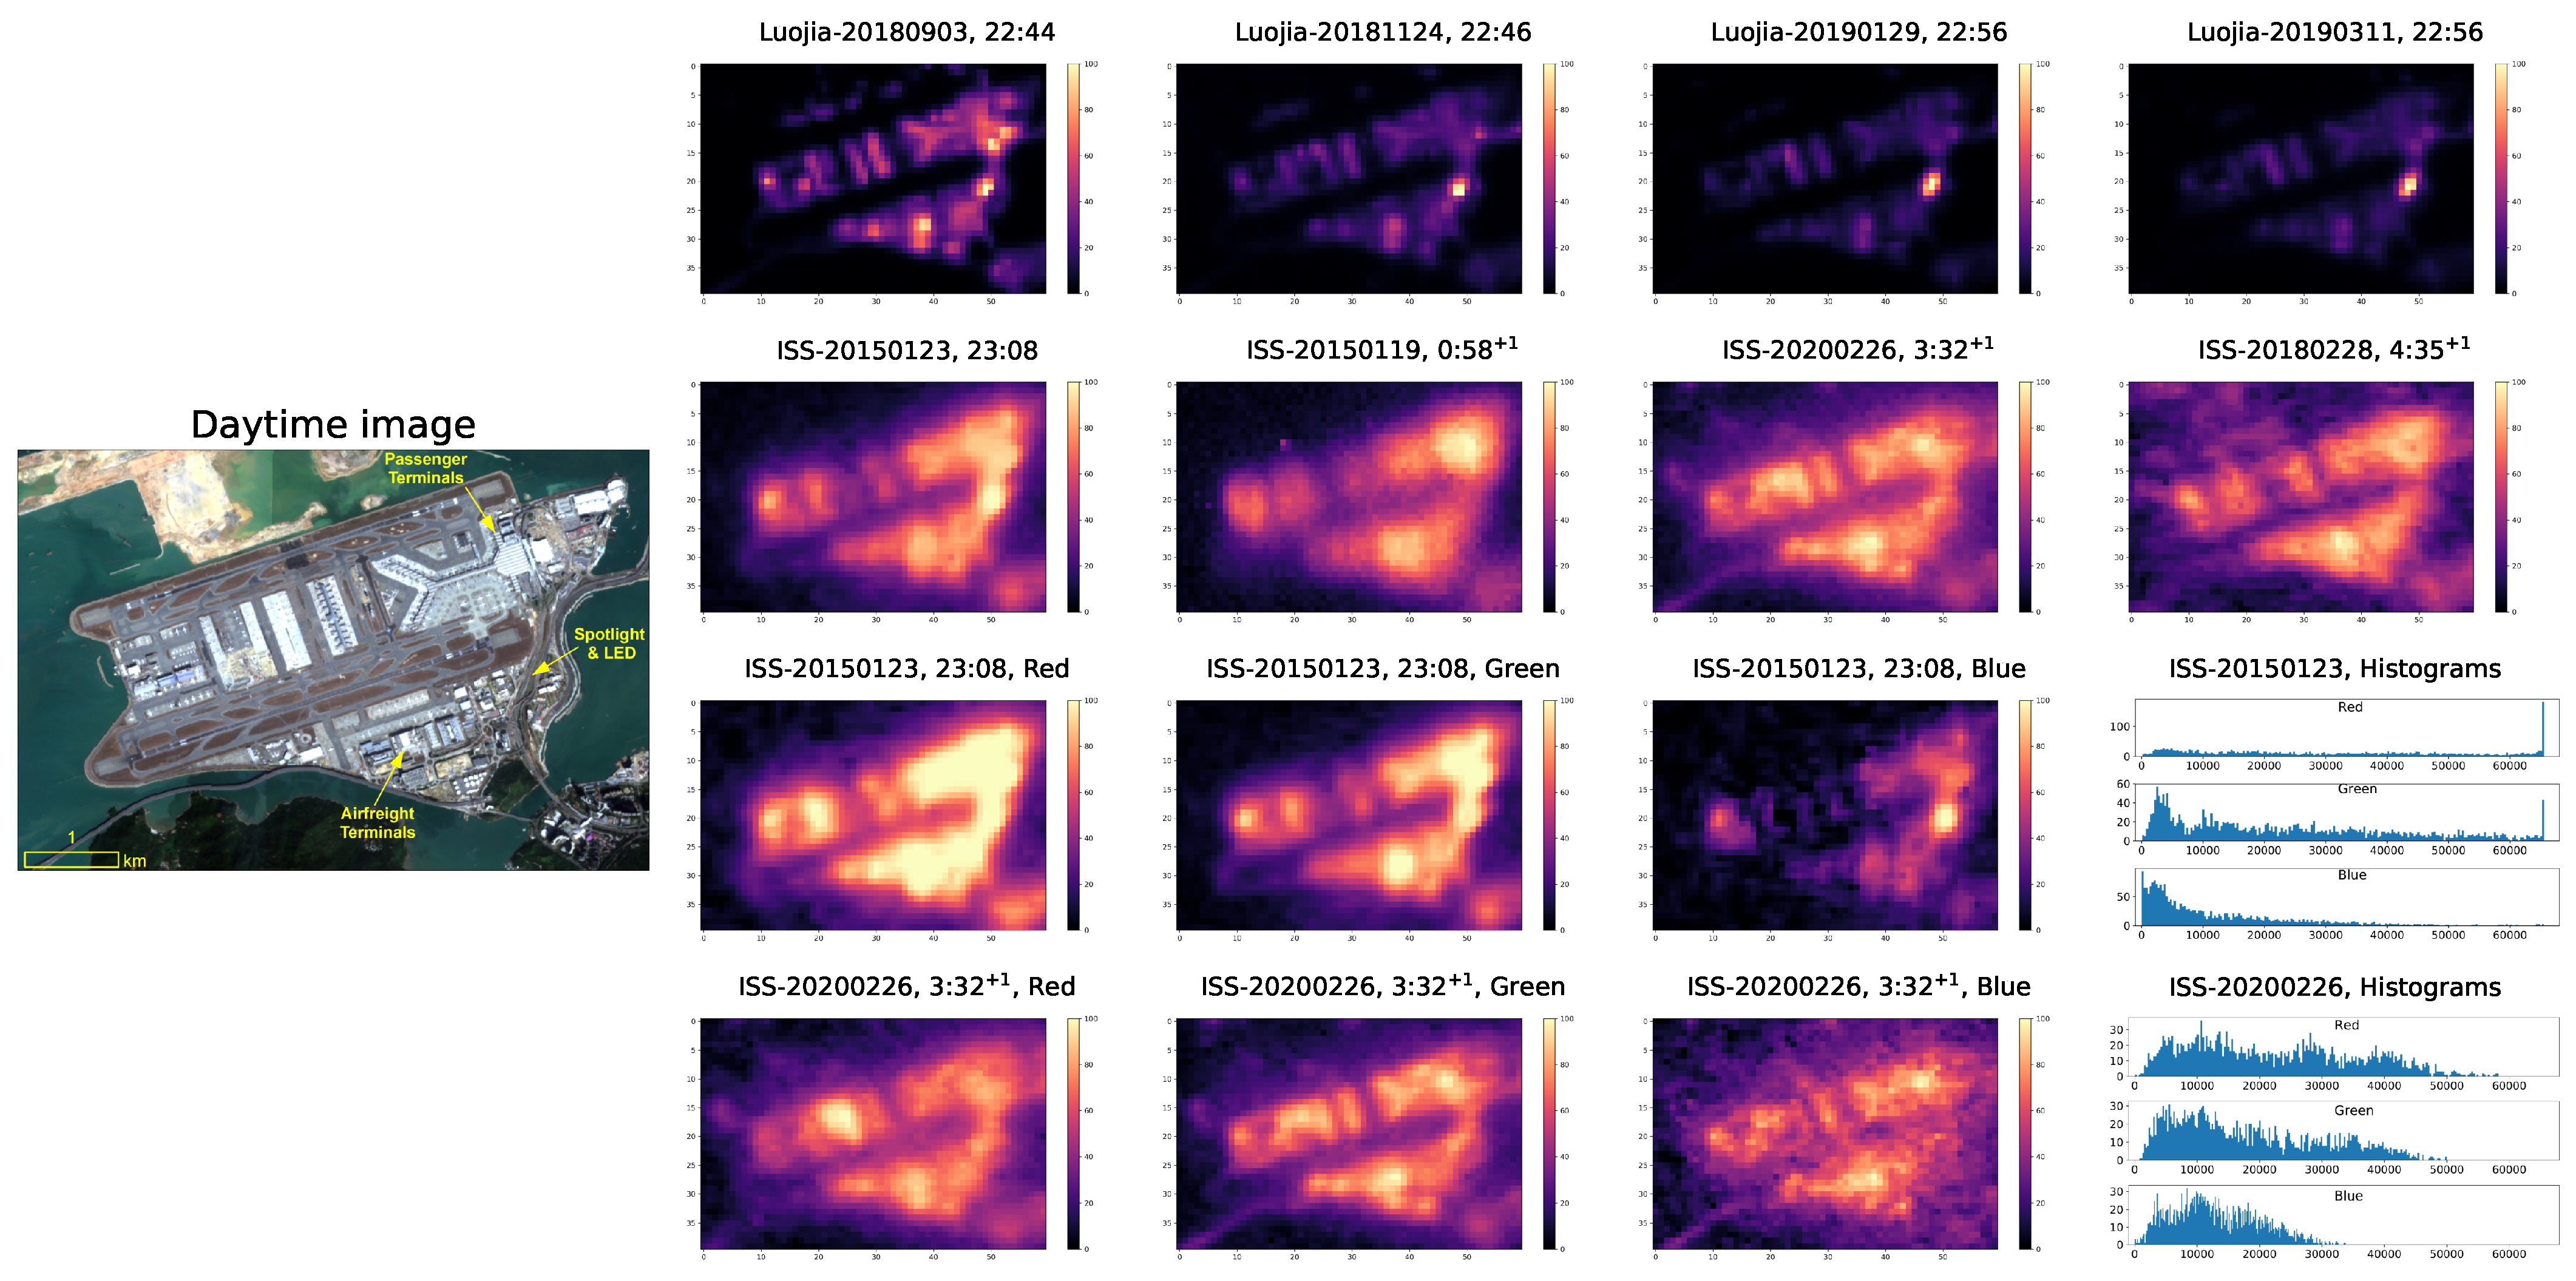
We show the normalized images of the airport in Figure 14, and of the downtown around the Victoria Harbor in Figure 15. Their locations are shown as blue rectangles in Figure 1. The image center of the latter is the major commercial areas in Hong Kong (Central and Tsim Sha Tsui), and the upper left is the Kwai Tsing Container Terminals.
Luojia-1 images and ISS images exhibit different features in the two areas. In the airport (Figure 14), runways are significantly darker in Luojia-1 images than in ISS images. In the Luojia-1 images, runways emit less than 10% of the light than the brightest spot of the airport; in the ISS images, runways show 40% to 60% brightness compared to the brightest spot. Based on the histograms (Figure 14), the ISS-20150123 image is saturated in the red and green channels, which is one of the reasons why the airport is brighter in the ISS images. The blue channel of the ISS-20150123 image is not saturated, and the locations of bright spots are similar to the Luojia-1 images at the lower right part of the airport (Figure 14).
As of the ISS-20200226 image captured at 3:32+1 local time, all three channels are not saturated, but still, the airport is much brighter than Luojia-1 images. One possible reason may be that the ISS images are not with such high resolution (0.001). The actual GSD may be three or five times larger, as the hot spot in ISS images is larger than that in the Luojia-1 images, and some details are missing. Therefore, an area of 5 × 5 pixels (i.e., 550 × 550 m) may be the same light source, making the ISS images much more averaged and blurred. If we calculate the average brightness in the airport, a lot of dark regions are included, and therefore the mean value will be small. This can be seen as a result of the modifiable areal unit problem [58,59]. We get different statistics from the two sets of images with different true spatial units.
An interesting observation is that light centers of the airport shift with time. In early night, the brightest regions are on the southeast of the airport. They are the passenger terminals and the roads to terminals. Some spotlights and LED signboards are located near the road. Late at night, after midnight, the brightest region shifts to the southwest of the airport, where the airfreight terminals are located. The Hong Kong International Airport is a busy transportation hub with more than 70 million passenger traffic and 5 million metric tons of cargo traffic in 2018 [60]. The observed light center shifting agrees with the fact that most cargo flights operate in late night [61].

4.2.4. Downtown: Commercial Areas and Port Facilities

We show the normalized nighttime images in the downtown around the Victoria Harbor and the corresponding daytime image in Figure 15, where the upper left is the Kwai Tsing Container Terminals. In the Luojia-1 images, the central areas are so bright that other regions are relatively dark. On the other hand, the ISS-20150123 image is bright in all regions and is saturated in all channels (Figure 15). In the second row of Figure 15, only the ISS image before midnight is very bright in the central commercial areas. For images after midnight, the central commercial areas have a similar brightness to residential areas. The night lights in central areas are bluer than the surrounding environment, as shown in the third row of Figure 15. The fourth row of Figure 15 indicates that in late night, central commercial areas and other regions have a similar brightness. The light center shifted from the central areas to the container terminals.
Based on the Luojia-1 and ISS images before and after midnight, we can see that the lighting situation changes with time. Central commercial areas are brighter in early night, and the container terminals are brighter in late night. The airport is brighter at the passenger terminals and the roads with spotlights and LED signboards in early night, and is brighter at the airfreight terminals in late night. The lighting difference among times reminds us to use the nighttime satellite data wisely, as most of them only reflect a snapshot of cities’ nighttime profile at a particular local time.

4.2.5. Color Difference Within City Zones

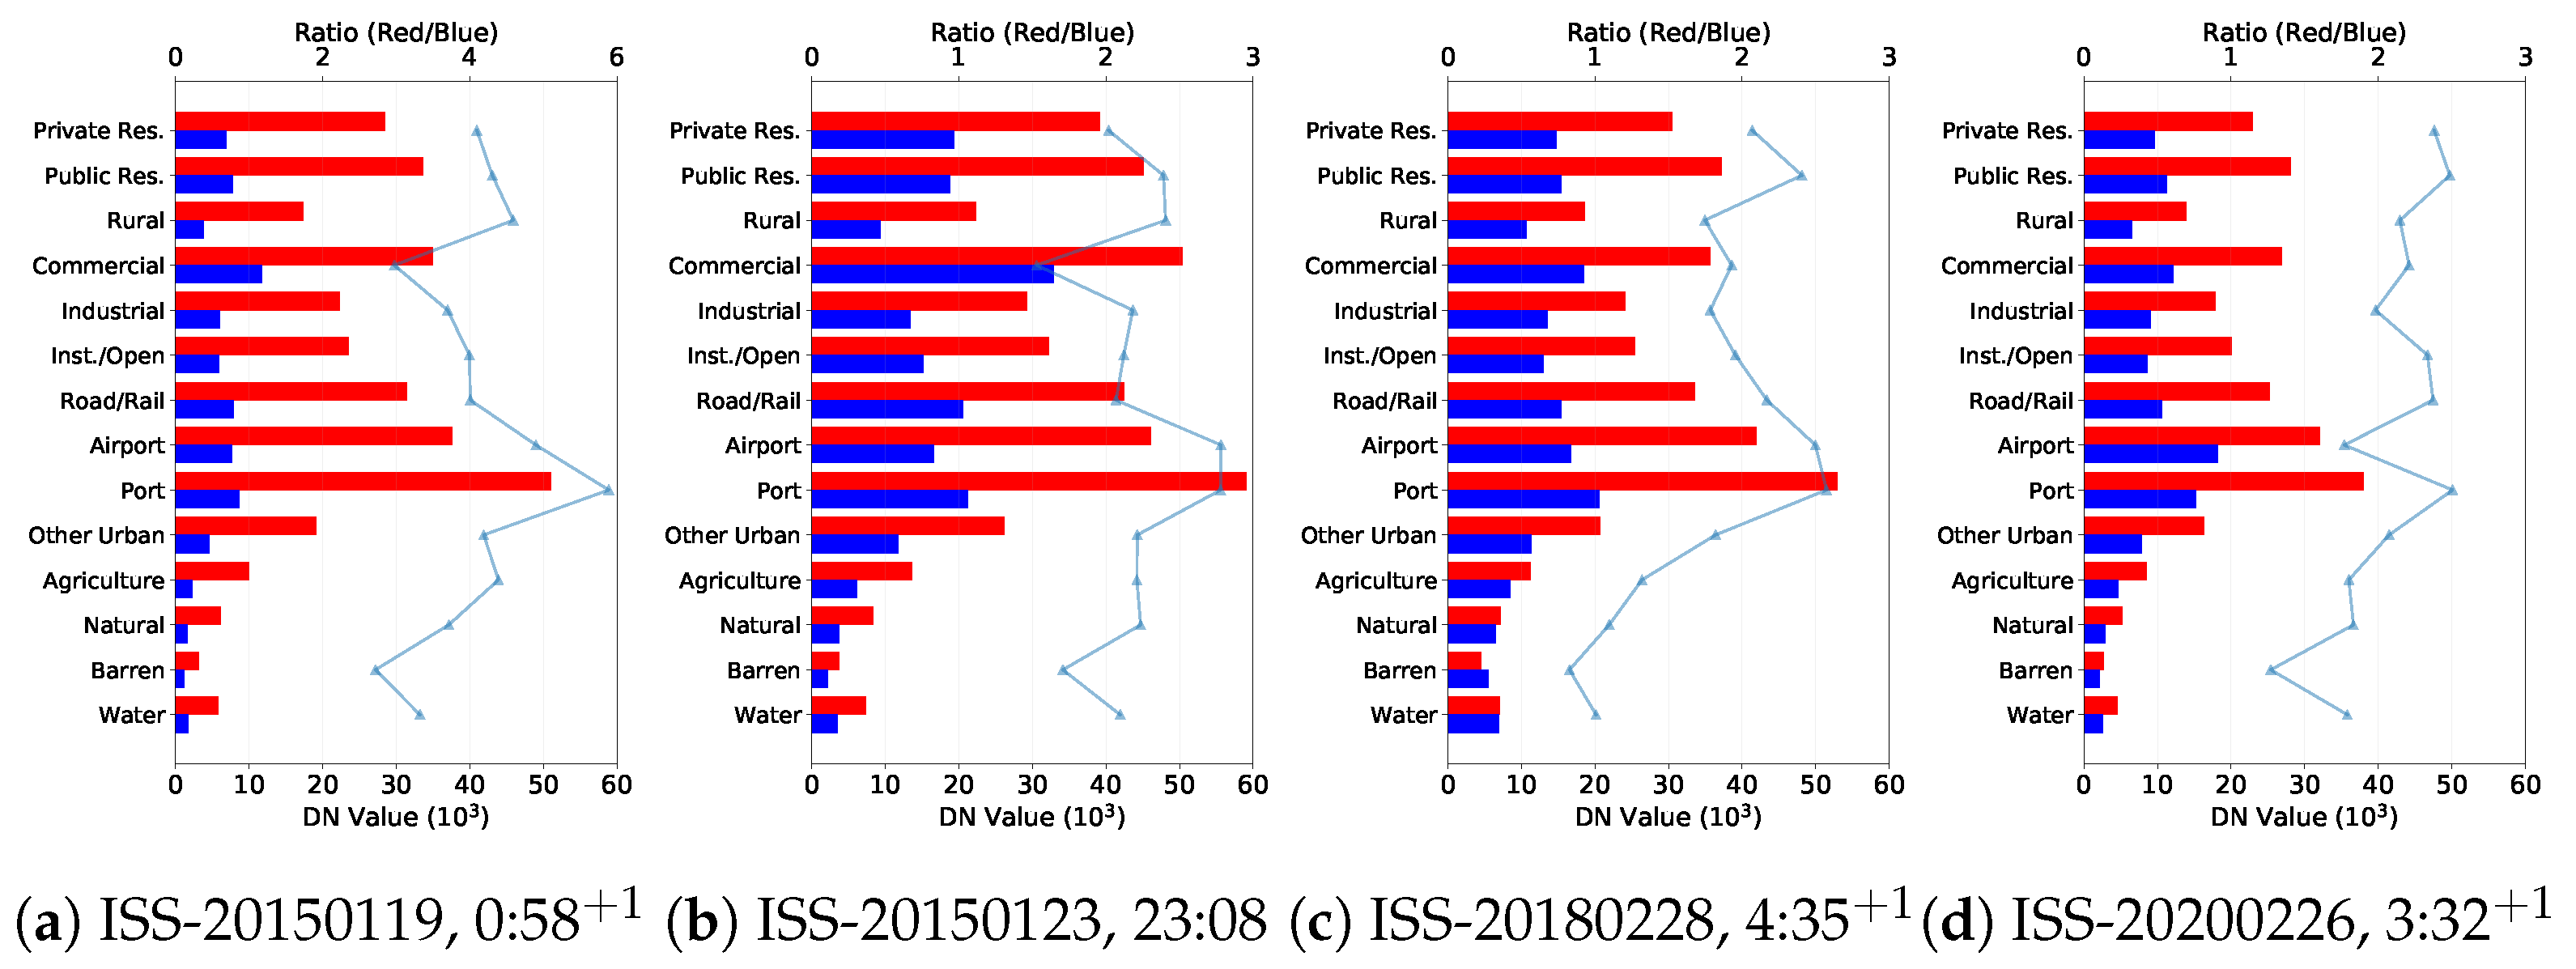
The ISS imagery is captured by commercial DSLR cameras, and therefore provides us a valuable source to analyze color effects. We further divide the nightlights based on land use types and generate average nightlights in red and blue channels, as shown in Figure 16. The ratio between red and blue values is also plotted and overlapped on the color bar. We show four images as follows: two from relatively early night (near midnight at 23:08 and 00:58+1 local time) and two from late night (at 3:32+1 and 4:35+1 local time). Of the four images, port facilities are the brightest in the red channel. But in the blue channel, commercial areas, for example, are the brightest before midnight in 2015. In Hong Kong, external lighting facilities are still dominated by the HPS type, as they were installed before the popularity of LEDs [49]. The public and private residential areas show similar lighting patterns and are bluer than commercial areas. Another interesting phenomenon is that the ratio between red and blue lights for the airport becomes less red and bluer in 2020, implying that a certain transformation of lighting technology might undergo.

5. Discussion and Conclusions

5.1. Findings and Strengths

In this paper, we presented a comprehensive analysis of remotely sensed nighttime lights (NTLs) using multi-temporal imagery from the Luojia-1 and International Space Station (ISS), two medium-resolution satellite data sources. We first tested the correlations between remotely sensed NTL data and night sky brightness (NSB) measured on the ground. Our results show moderate to strong correlations, with the Luojia-1 data over Hong Kong and Macau from four different dates in 2018–2019 yielding a correlation coefficient of R = 0.73 . For individual ISS imagery in 2015–2020, correlation coefficients ranged from 0.8 to 1.0. We observed notable differences in correlation by color channel, with the best correlations found in the blue channel and the weakest in the red channel.
Our further analysis highlights that NTL data changes throughout the night. In the early hours (before midnight), commercial areas are the brightest land-use category. These areas also appear bluer compared to other land-use types. After midnight, port facilities and airports become the brightest as commercial lighting diminishes. These areas also appear redder than other zones in the city. We also observe considerable heterogeneity in NTL across different residential areas, with mixed-use buildings (tong lau) being the brightest, followed by public housing. Private residential areas, associated with higher incomes, exhibited the least exposure to excessive lighting.
The usage of multi-temporal imagery from various local times makes this study possible, as existing sun-synchronous satellites can only obtain data at similar local times (2 a.m., for example). The comparison of two data sources, from their consistencies and differences, expands our understanding of NTL variations. The differences that occur among images obtained even seconds apart may expand considerable discussion and further analysis arising from this study.

5.2. Further Considerations and Limitations

There are a lot of factors that can affect the NTL values (Table 6). First, with the addition and removal of light sources, NTL values change as a reflection of real changes—the fundamental assumption of NTL data. However, real changes can also occur with the replacement of light sources; for example, switching from incandescent bulbs to LEDs. This may represent a real brightness change or a change in spectrum [49,62,63,64]. It remains an open question what the gold standard in brightness measurement should be: the value from a lux meter, the value closest to human perception, or something else? Most satellite sensors have a spectral response different from that of human eyes, and as of today, the debate continues. A standard, however, should be reached within the research community in the era of color remote sensing of NTLs [19,36,63].
Observation angle is another known yet complex factor. The directional effects of NTL call for additional angular correction [30,31]. But unlike daytime remote sensing, NTL exhibits more complicated directional effects, especially in cities [65]. In our study, we have detailed how the observation angle has changed significantly along satellite trajectory. Yet, due to the medium-resolution nature, and the lack of 3-D building data to properly model the urban canopy, we did not provide quantitative analysis. In the current literature, so far, although specific corrections and investigations have been discussed and specially handled in several studies [66], a universal solution for large-scale application is still pending in NTL research due to the complexity of this factor.
Some other known factors, often too complex to discuss in detail, include moonlight and atmospheric conditions such as PM2.5 and humidity that do not block NTL transmission [5,67,68]. These factors, in addition to the changing observation angle across snapshots taken within seconds, contribute to the imperfect correlations between such snapshots. As we observe better agreement in urban environments ( R = 0.96 ) than in natural environments ( R = 0.88 ), natural factors likely dominate.

5.3. ISS Imagery for Artificial Light Research

The ISS image repository has long been considered a valuable source for artificial light research [69], but it has not been used in practice until recent years [19,20,53,70]. One of the major concerns is its lack of radiometric calibration. In this study, we show that even without radiometric calibration, the ISS images still present high potential for artificial light research in a relative comparison fashion. Within an ISS image, the color comparison can be done relatively, and we saw a consistent, reasonable trend from land use lighting patterns in Hong Kong. Even so, in a cross-scene validation, the agreement between NSB and ISS is on par with the agreement between NSB and Luojia-1 (a calibrated data source). When calibrated data are not available, directly using the uncalibrated ISS images can be a starting solution to further our understanding of artificial light in cities.
We should note the limitations coming from using uncalibrated ISS images. First, as the ISS images were uncalibrated, their direct cross-comparison should be treated carefully. Second, there are also some other additional considerations, including flat-field correction and spectral response. In our analysis, as the study area is relatively small compared to the entire image, and we have georeferenced the image data carefully, factors related geometric correction remain but should be largely handled. The ISS images we used were captured by Nikon D4 and D5, and it is reasonable to assume that their spectral response should be similar [19]. But the spectral response is different with SQM [71] and Luojia-1 [51]. Yet, as the ISS-NSB agreement is on par with and even better than the agreement between Luojia-1 and NSB, the limitations mentioned here may not be as critical as we thought. Nonetheless, using uncalibrated ISS images is sufficient for our study that is large scale and across multiple years, but for a strictly rigorous and granular study, these limitations should be handled properly.

5.4. Conclusions and Future Directions

In conclusion, our study provides a comprehensive analysis of multi-temporal NTL changes over the night as observed from medium-resolution satellite data. We emphasize the importance of using multi-temporal data to analyze changing NTL patterns in cities, particularly in Hong Kong, one of the most light-polluted cities globally. By analyzing NTL data across different times of the night, we identified significant variations in NTL across land use categories, especially commercial areas. As NTL data are influenced by socioeconomic factors, physical characteristics, sensor parameters (e.g., spectrum and spatial resolution), and the changing position of satellites, conclusions drawn from these analyses should be interpreted with caution. Future studies exploring the scale, color, and potential multi-angle analysis on the same night would contribute significantly to understanding NTL sources and their broader socioeconomic implications.
Supplementary Materials

The following supporting information can be downloaded at: https://www.mdpi.com/article/10.3390/rs17223739/s1. Supplementary pp. 2–4: Workflow with the script to convert NEF to 16-bit TIF. Supplementary pp. 5–42: Cloud check with Himawari-8 imagery.

Author Contributions

Conceptualization, S.K.L., C.W.S. and C.S.J.P.; methodology, S.K.L.; software, S.K.L.; validation, S.K.L., C.W.S. and C.S.J.P.; formal analysis, S.K.L., C.W.S. and C.S.J.P.; investigation, S.K.L., C.W.S. and C.S.J.P.; resources, C.S.J.P.; data curation, S.K.L. and C.W.S.; writing—original draft preparation, S.K.L., C.W.S. and C.S.J.P.; writing—review and editing, S.K.L., C.W.S. and C.S.J.P.; visualization, S.K.L.; supervision, C.S.J.P.; project administration, C.S.J.P.; funding acquisition, C.S.J.P. All authors have read and agreed to the published version of the manuscript.

Funding

The Global at Night - Sky Brightness Monitoring Network (GaN-MN) is co-organized by the Office for Astronomy Outreach of the International Astronomy Union (IAU-OAO), the University of Hong Kong (HKU), National Astronomical Observatory of Japan (NAOJ), and Globe at Night. The Globe at Night citizen science campaign to monitor light pollution levels worldwide is hosted by the U.S. National Science Foundation National Optical-Infrared Astronomy Research Laboratory (NSF NOIRLab). GaN-MN was funded by the HKU Knowledge Exchange Fund granted by the University Grants Committee (Project No: KE-IP-2014/15-57, KE-IP-2015/16-54, KE-IP-2016/17-44, KE-IP-2017/18-54, KE-IP-2018/19-68, KE-IP-2019/20-54, and KE-IP-2020/21-78) and the IAU OAO, IAU/NAOJ, Tokyo, Japan. This research was supported by the Environment and Conservation Fund of the Government of the Hong Kong Special Administrative Region (Project IDs: 125/2018 and 113/2022). Any opinions, findings, conclusions, or recommendations expressed in this paper do not necessarily reflect the views of the Government of the Hong Kong Special Administrative Region and the Environment and Conservation Fund.

Data Availability Statement

The data used are publicly available through the links within the manuscript. The ISS image data can be obtained through the NASA/JSC Gateway to Astronaut Photography of Earth, a service provided by the International Space Station program and the JSC Earth Science & Remote Sensing Unit, ARES Division. The Luojia-1 image data can be obtained through Wuhan University. The land use data can be obtained through the Planning Department of HKSAR. Night sky brightness data can be obtained through the Global at Night - Sky Brightness Monitoring Network (GaN-MN). All links are available within the manuscript. The workflow is available in the Supplementary Materials. The project webpage can be found at https://skrisliu.com/nsbntl.

Conflicts of Interest

The authors declare no conflicts of interest.

Abbreviations

The following abbreviations are used in this manuscript:
NTLnighttime light
NSBnight sky brightness
ISSInternational Space Station
LEDlight-emitting diode
ALANartificial light at night
DMSPDefense Meteorological Satellite Program
OLSOperational Linescan System
VIIRSVisible Infrared Imaging Radiometer Suite
DNBDay/Night Band
GSDground sampling distance
SQMSky Quality Meter
HPShigh-pressure sodium
GaN-MNGlobe at Night - Sky Brightness Monitoring Network
RMSEroot mean square error

References

  1. Seto, K.C.; Güneralp, B.; Hutyra, L.R. Global forecasts of urban expansion to 2030 and direct impacts on biodiversity and carbon pools. Proc. Natl. Acad. Sci. USA 2012, 109, 16083–16088. [Google Scholar] [CrossRef]
  2. Kyba, C.C.; Altıntaş, Y.Ö.; Walker, C.E.; Newhouse, M. Citizen scientists report global rapid reductions in the visibility of stars from 2011 to 2022. Science 2023, 379, 265–268. [Google Scholar] [CrossRef] [PubMed]
  3. Falchi, F.; Bará, S. Light pollution is skyrocketing. Science 2023, 379, 234–235. [Google Scholar] [CrossRef]
  4. Pun, C.S.J.; So, C.W.; Leung, W.Y.; Wong, C.F. Contributions of artificial lighting sources on light pollution in Hong Kong measured through a night sky brightness monitoring network. J. Quant. Spectrosc. Radiat. Transf. 2014, 139, 90–108. [Google Scholar] [CrossRef]
  5. Liu, S.; So, C.W.; Pun, C.S.J. Analyzing the Sources and Variations of Nighttime Lights in Hong Kong from VIIRS Monthly Data. Remote Sens. 2025, 17, 1447. [Google Scholar] [CrossRef]
  6. So, C.W.; Pun, C.S.J.; Liu, S.; Cheung, S.L.; Hui, H.K.K.; Blumenthal, K.; Walker, C.E. Urban night sky is drastically lit up by a few decorative buildings: Natural experiments from Earth Hour. Sci. Rep. 2025, 15, 21414. [Google Scholar] [CrossRef] [PubMed]
  7. Croft, T.A. Nighttime images of the earth from space. Sci. Am. 1978, 239, 86–101. [Google Scholar] [CrossRef]
  8. Owen, T. Using DMSP-OLS light frequency data to categorize urban environments associated with US climate observing stations. Int. J. Remote Sens. 1998, 19, 3451–3456. [Google Scholar] [CrossRef]
  9. Bennett, M.M.; Smith, L.C. Advances in using multitemporal night-time lights satellite imagery to detect, estimate, and monitor socioeconomic dynamics. Remote Sens. Environ. 2017, 192, 176–197. [Google Scholar] [CrossRef]
  10. Lo, C. Modeling the population of China using DMSP operational linescan system nighttime data. Photogramm. Eng. Remote Sens. 2001, 67, 1037–1047. [Google Scholar]
  11. Doll, C.N.; Muller, J.P.; Morley, J.G. Mapping regional economic activity from night-time light satellite imagery. Ecol. Econ. 2006, 57, 75–92. [Google Scholar] [CrossRef]
  12. Amaral, S.; Câmara, G.; Monteiro, A.M.V.; Quintanilha, J.A.; Elvidge, C.D. Estimating population and energy consumption in Brazilian Amazonia using DMSP night-time satellite data. Comput. Environ. Urban Syst. 2005, 29, 179–195. [Google Scholar] [CrossRef]
  13. Elvidge, C.D.; Zhizhin, M.; Hsu, F.C.; Baugh, K.E. VIIRS Nightfire: Satellite Pyrometry at Night. Remote Sens. 2013, 5, 4423–4449. [Google Scholar] [CrossRef]
  14. Fulbright, J.; Lei, N.; Efremova, B.; Xiong, X. Suomi-NPP VIIRS solar diffuser stability monitor performance. IEEE Trans. Geosci. Remote Sens. 2015, 54, 631–639. [Google Scholar] [CrossRef]
  15. Levin, N.; Kyba, C.C.; Zhang, Q.; de Miguel, A.S.; Román, M.O.; Li, X.; Portnov, B.A.; Molthan, A.L.; Jechow, A.; Miller, S.D.; et al. Remote sensing of night lights: A review and an outlook for the future. Remote Sens. Environ. 2020, 237, 111443. [Google Scholar] [CrossRef]
  16. Liu, S.K.; So, C.W.; Pun, J.C.S. Using Time-Series Satellite Imagery to Detect Artificial Light At Night: The Case of Luojia-1 and International Space Station. In Proceedings of the IGARSS 2024-2024 IEEE International Geoscience and Remote Sensing Symposium, Athens, Greece, 7–12 July 2024; pp. 1305–1308. [Google Scholar]
  17. Jiang, W.; He, G.; Long, T.; Guo, H.; Yin, R.; Leng, W.; Liu, H.; Wang, G. Potentiality of using Luojia 1-01 nighttime light imagery to investigate artificial light pollution. Sensors 2018, 18, 2900. [Google Scholar] [CrossRef]
  18. Zheng, Q.; Weng, Q.; Huang, L.; Wang, K.; Deng, J.; Jiang, R.; Ye, Z.; Gan, M. A new source of multi-spectral high spatial resolution night-time light imagery—JL1-3B. Remote Sens. Environ. 2018, 215, 300–312. [Google Scholar] [CrossRef]
  19. de Miguel, A.S.; Kyba, C.C.; Aubé, M.; Zamorano, J.; Cardiel, N.; Tapia, C.; Bennie, J.; Gaston, K.J. Colour remote sensing of the impact of artificial light at night (I): The potential of the International Space Station and other DSLR-based platforms. Remote Sens. Environ. 2019, 224, 92–103. [Google Scholar] [CrossRef]
  20. de Miguel, A.S.; Zamorano, J.; Aubé, M.; Bennie, J.; Gallego, J.; Ocana, F.; Pettit, D.R.; Stefanov, W.L.; Gaston, K.J. Colour remote sensing of the impact of artificial light at night (II): Calibration of DSLR-based images from the International Space Station. Remote Sens. Environ. 2021, 264, 112611. [Google Scholar] [CrossRef]
  21. Li, C.; Zou, L.; Wu, Y.; Xu, H. Potentiality of using Luojia1-01 night-time light imagery to estimate urban community housing price—A case study in Wuhan, China. Sensors 2019, 19, 3167. [Google Scholar] [CrossRef]
  22. Ou, J.; Liu, X.; Liu, P.; Liu, X. Evaluation of Luojia 1-01 nighttime light imagery for impervious surface detection: A comparison with NPP-VIIRS nighttime light data. Int. J. Appl. Earth Obs. Geoinf. 2019, 81, 1–12. [Google Scholar] [CrossRef]
  23. Zheng, Q.; Deng, J.; Jiang, R.; Wang, K.; Xue, X.; Lin, Y.; Huang, Z.; Shen, Z.; Li, J.; Shahtahmassebi, A.R. Monitoring and assessing “ghost cities” in Northeast China from the view of nighttime light remote sensing data. Habitat Int. 2017, 70, 34–42. [Google Scholar] [CrossRef]
  24. Chen, Z.; Yu, B.; Hu, Y.; Huang, C.; Shi, K.; Wu, J. Estimating house vacancy rate in metropolitan areas using NPP-VIIRS nighttime light composite data. IEEE J. Sel. Top. Appl. Earth Obs. Remote Sens. 2015, 8, 2188–2197. [Google Scholar] [CrossRef]
  25. Chen, Z.; Yu, B.; Song, W.; Liu, H.; Wu, Q.; Shi, K.; Wu, J. A new approach for detecting urban centers and their spatial structure with nighttime light remote sensing. IEEE Trans. Geosci. Remote Sens. 2017, 55, 6305–6319. [Google Scholar] [CrossRef]
  26. Shi, K.; Yu, B.; Hu, Y.; Huang, C.; Chen, Y.; Huang, Y.; Chen, Z.; Wu, J. Modeling and mapping total freight traffic in China using NPP-VIIRS nighttime light composite data. GIScience Remote Sens. 2015, 52, 274–289. [Google Scholar] [CrossRef]
  27. Elvidge, C.D.; Ziskin, D.; Baugh, K.E.; Tuttle, B.T.; Ghosh, T.; Pack, D.W.; Erwin, E.H.; Zhizhin, M. A fifteen year record of global natural gas flaring derived from satellite data. Energies 2009, 2, 595–622. [Google Scholar] [CrossRef]
  28. Elvidge, C.D.; Hsu, F.C.; Baugh, K.E.; Ghosh, T. National trends in satellite-observed lighting. In Global Urban Monitoring and Assessment Through Earth Observation; CRC Press: Boca Raton, FL, USA, 2014; Volume 23, pp. 97–118. [Google Scholar]
  29. Guk, E.; Levin, N. Analyzing spatial variability in night-time lights using a high spatial resolution color Jilin-1 image—Jerusalem as a case study. ISPRS J. Photogramm. Remote Sens. 2020, 163, 121–136. [Google Scholar] [CrossRef]
  30. Kyba, C.C.M.; Aubé, M.; Bará, S.; Bertolo, A.; Bouroussis, C.A.; Cavazzani, S.; Espey, B.R.; Falchi, F.; Gyuk, G.; Jechow, A.; et al. Multiple angle observations would benefit visible band remote sensing using night lights. J. Geophys. Res. Atmos. 2022, 127, e2021JD036382. [Google Scholar] [CrossRef]
  31. Tan, X.; Zhu, X.; Chen, J.; Chen, R. Modeling the direction and magnitude of angular effects in nighttime light remote sensing. Remote Sens. Environ. 2022, 269, 112834. [Google Scholar] [CrossRef]
  32. Wang, X.; Mu, X.; Yan, G. Quantitative analysis of aerosol influence on Suomi-NPP VIIRS nighttime light in China. IEEE J. Sel. Top. Appl. Earth Obs. Remote Sens. 2020, 13, 3557–3568. [Google Scholar] [CrossRef]
  33. Levin, N. Challenges in remote sensing of night lights—A research agenda for the next decade. Remote Sens. Environ. 2025, 328, 114869. [Google Scholar] [CrossRef]
  34. So, C.W. Observational Studies of Contributions of Artificial and Natural Light Factors to the Night Sky Brightness Measured through a Monitoring Network in Hong Kong. Ph.D. Thesis, The University of Hong Kong, Hong Kong, China, 2014. [Google Scholar] [CrossRef]
  35. Arroyo, H.L.; Abascal, A.; Degen, T.; Aubé, M.; Espey, B.R.; Gyuk, G.; Holker, F.; Jechow, A.; Kuffer, M.; Sánchez de Miguel, A.; et al. Monitoring, trends and impacts of light pollution. Nat. Rev. Earth Environ. 2024, 5, 417–430. [Google Scholar] [CrossRef]
  36. Sánchez de Miguel, A.; Aubé, M.; Zamorano, J.; Kocifaj, M.; Roby, J.; Tapia, C. Sky Quality Meter measurements in a colour-changing world. Mon. Not. R. Astron. Soc. 2017, 467, 2966–2979. [Google Scholar] [CrossRef]
  37. Pun, C.S.J.; So, C.W. Night-sky brightness monitoring in Hong Kong. Environ. Monit. Assess. 2012, 184, 2537–2557. [Google Scholar] [CrossRef]
  38. Cavazzani, S.; Ortolani, S.; Bertolo, A.; Binotto, R.; Fiorentin, P.; Carraro, G.; Saviane, I.; Zitelli, V. Sky Quality Meter and satellite correlation for night cloud-cover analysis at astronomical sites. Mon. Not. R. Astron. Soc. 2020, 493, 2463–2471. [Google Scholar] [CrossRef]
  39. Katz, Y.; Levin, N. Quantifying urban light pollution—A comparison between field measurements and EROS-B imagery. Remote Sens. Environ. 2016, 177, 65–77. [Google Scholar] [CrossRef]
  40. Li, X.; Levin, N.; Xie, J.; Li, D. Monitoring hourly night-time light by an unmanned aerial vehicle and its implications to satellite remote sensing. Remote Sens. Environ. 2020, 247, 111942. [Google Scholar] [CrossRef]
  41. de Miguel, A.S.; Kyba, C.C.; Zamorano, J.; Gallego, J.; Gaston, K.J. The nature of the diffuse light near cities detected in nighttime satellite imagery. Sci. Rep. 2020, 10, 7829. [Google Scholar] [CrossRef]
  42. Duriscoe, D.M.; Anderson, S.J.; Luginbuhl, C.B.; Baugh, K.E. A simplified model of all-sky artificial sky glow derived from VIIRS Day/Night band data. J. Quant. Spectrosc. Radiat. Transf. 2018, 214, 133–145. [Google Scholar] [CrossRef]
  43. Netzel, H.; Netzel, P. High resolution map of light pollution over Poland. J. Quant. Spectrosc. Radiat. Transf. 2016, 181, 67–73. [Google Scholar] [CrossRef]
  44. Falchi, F.; Cinzano, P.; Duriscoe, D.; Kyba, C.C.; Elvidge, C.D.; Baugh, K.; Portnov, B.A.; Rybnikova, N.A.; Furgoni, R. The new world atlas of artificial night sky brightness. Sci. Adv. 2016, 2, e1600377. [Google Scholar] [CrossRef]
  45. Levin, N.; Johansen, K.; Hacker, J.M.; Phinn, S. A new source for high spatial resolution night time images—The EROS-B commercial satellite. Remote Sens. Environ. 2014, 149, 1–12. [Google Scholar] [CrossRef]
  46. Li, X.; Ge, L.; Chen, X. Quantifying contribution of land use types to nighttime light using an unmixing model. IEEE Geosci. Remote Sens. Lett. 2014, 11, 1667–1671. [Google Scholar] [CrossRef]
  47. Ren, Z.; Liu, Y.; Chen, B.; Xu, B. Where Does Nighttime Light Come From? Insights from Source Detection and Error Attribution. Remote Sens. 2020, 12, 1922. [Google Scholar] [CrossRef]
  48. Census and Statistics Department. 2016 Hong Kong Population Bycensus. 2017. Available online: https://www.bycensus2016.gov.hk/en/index.html (accessed on 1 August 2020).
  49. So, C.W.; Pun, C.S.J.; Liu, S. Spectroscopic study of the light-polluted night sky in Hong Kong. J. Quant. Spectrosc. Radiat. Transf. 2026, 348, 109696. [Google Scholar] [CrossRef]
  50. Miller, S.D.; Straka, W.; Mills, S.P.; Elvidge, C.D.; Lee, T.F.; Solbrig, J.; Walther, A.; Heidinger, A.K.; Weiss, S.C. Illuminating the capabilities of the Suomi National Polar-orbiting Partnership (NPP) visible infrared imaging radiometer suite (VIIRS) day/night band. Remote Sens. 2013, 5, 6717–6766. [Google Scholar] [CrossRef]
  51. Li, X.; Li, X.; Li, D.; He, X.; Jendryke, M. A preliminary investigation of Luojia-1 night-time light imagery. Remote Sens. Lett. 2019, 10, 526–535. [Google Scholar] [CrossRef]
  52. de Miguel, A.S.; Zamorano, J.; Castaño, J.G.; Pascual, S. Evolution of the energy consumed by street lighting in Spain estimated with DMSP-OLS data. J. Quant. Spectrosc. Radiat. Transf. 2014, 139, 109–117. [Google Scholar] [CrossRef]
  53. Kuffer, M.; Pfeffer, K.; Sliuzas, R.; Taubenböck, H.; Baud, I.; van Maarseveen, M. Capturing the urban divide in nighttime light images from the International Space Station. IEEE J. Sel. Top. Appl. Earth Obs. Remote Sens. 2018, 11, 2578–2586. [Google Scholar] [CrossRef]
  54. Kyba, C.C.M.; Ruhtz, T.; Fischer, J.; Hölker, F. Cloud Coverage Acts as an Amplifier for Ecological Light Pollution in Urban Ecosystems. PLoS ONE 2011, 6, e17307. [Google Scholar] [CrossRef]
  55. Li, X.; Ma, R.; Zhang, Q.; Li, D.; Liu, S.; He, T.; Zhao, L. Anisotropic characteristic of artificial light at night–Systematic investigation with VIIRS DNB multi-temporal observations. Remote Sens. Environ. 2019, 233, 111357. [Google Scholar] [CrossRef]
  56. Ji, W.; Rhodes, P.A. Spectral color characterization of digital cameras: A review. In Proceedings of the Photonics and Optoelectronics Meetings (POEM) 2011: Optoelectronic Sensing and Imaging, Wuhan, China, 2–5 November 2012; Volume 8332, pp. 72–79. [Google Scholar]
  57. Ng, S.; Zhang, Y.; Ng, K.; Wong, H.; Lee, J. Living environment and quality of life in Hong Kong. Asian Geogr. 2018, 35, 35–51. [Google Scholar] [CrossRef]
  58. Jelinski, D.E.; Wu, J. The modifiable areal unit problem and implications for landscape ecology. Landsc. Ecol. 1996, 11, 129–140. [Google Scholar] [CrossRef]
  59. Xu, P.; Huang, H.; Dong, N. The modifiable areal unit problem in traffic safety: Basic issue, potential solutions and future research. J. Traffic Transp. Eng. (Engl. Ed.) 2018, 5, 73–82. [Google Scholar] [CrossRef]
  60. Hong Kong Ineternational Airport. Building for the Future—Annual Report 2019/20. 2018. Available online: https://www.hongkongairport.com/en/airport-authority/publications/annual-interim-reports/annual2018 (accessed on 1 August 2020).
  61. Leleu, C.; Marsh, D. Dependent on the dark: Cargo and other night flights in European airspace. In Trends in Air Traffic; Eurocontrol: Brussels, Belgium, 2009; Volume 5. [Google Scholar]
  62. Spoelstra, H. New device for monitoring the colors of the night. J. Quant. Spectrosc. Radiat. Transf. 2014, 139, 82–89. [Google Scholar] [CrossRef]
  63. Robles, J.; Zamorano, J.; Pascual, S.; Sánchez de Miguel, A.; Gallego, J.; Gaston, K.J. Evolution of brightness and color of the night sky in Madrid. Remote Sens. 2021, 13, 1511. [Google Scholar] [CrossRef]
  64. Labrousse, C.; Haspel, C.; Levin, N. Quantifying the impact of the transition to LED lighting on night sky brightness and colour using ground-based measurements and satellite imagery. J. Quant. Spectrosc. Radiat. Transf. 2025, 340, 109450. [Google Scholar] [CrossRef]
  65. Liu, S.; So, C.W.; Ho, H.C.; Shi, Q.; Pun, C.S.J. Using high-resolution nighttime remote sensing data to identify light sources in Hong Kong. In Proceedings of the IGARSS 2023—2023 IEEE International Geoscience and Remote Sensing Symposium, Pasadena, CA, USA, 16–21 July 2023; pp. 2827–2830. [Google Scholar]
  66. Ou, C.; Tang, F.; Deng, X.; Wang, L. The Impact of Angular Effects on Nighttime Economy Observations: Determining the Optimal Observation Angle of Nighttime Light Remote Sensing. Appl. Spat. Anal. Policy 2025, 18, 11. [Google Scholar] [CrossRef]
  67. Wang, J.; Aegerter, C.; Xu, X.; Szykman, J.J. Potential application of VIIRS Day/Night Band for monitoring nighttime surface PM2. 5 air quality from space. Atmos. Environ. 2016, 124, 55–63. [Google Scholar] [CrossRef]
  68. Massetti, L. Drivers of artificial light at night variability in urban, rural and remote areas. J. Quant. Spectrosc. Radiat. Transf. 2020, 255, 107250. [Google Scholar] [CrossRef]
  69. Elvidge, C.D.; Cinzano, P.; Pettit, D.R.; Arvesen, J.; Sutton, P.; Small, C.; Nemani, R.; Longcore, T.; Rich, C.; Safran, J.; et al. The Nightsat mission concept. Int. J. Remote Sens. 2007, 28, 2645–2670. [Google Scholar] [CrossRef]
  70. Wang, C.; Chen, Z.; Yang, C.; Li, Q.; Wu, Q.; Wu, J.; Zhang, G.; Yu, B. Analyzing parcel-level relationships between Luojia 1-01 nighttime light intensity and artificial surface features across Shanghai, China: A comparison with NPP-VIIRS data. Int. J. Appl. Earth Obs. Geoinf. 2020, 85, 101989. [Google Scholar] [CrossRef]
  71. Cinzano, P. Night Sky Photometry with Sky Quality Meter; Technical Report, ISTIL Internal Report; STIL: Thiene, Italy, 2005. [Google Scholar]
Figure 1. Ten in situ stations from the Globe at Night Sky Brightness Monitoring Network (GaN-MN) in Hong Kong (HK) and Macau, overlapped with a daytime satellite image. The two rectangular regions highlighted in blue are the airport and downtown.
Remotesensing 17 03739 g001
Figure 2. Daytime and nighttime images from the Luojia-1 satellite and ISS on Hong Kong and Macau (inserted) at the same spatial resolution. All times are local times (UTC+8).
Remotesensing 17 03739 g002
Figure 3. Sample NSB data collected on the same dates when the nighttime images were captured. The stations are installed as parts of GaN-MN at the main campus of the University of Hong Kong (HKU), Ho Koon Nature Education cum Astronomical Centre (HKn), Tsim Sha Tsui (TST), Astropark (AP), iObservatory (iObs), King’s Park (KP), Macau Peninsula (Mac), Taipa (Tai), and Coloane (Col).
Remotesensing 17 03739 g003aRemotesensing 17 03739 g003b
Figure 4. Hong Kong 2018 land use map.
Remotesensing 17 03739 g004
Figure 5. Illustration of the elevation and azimuth angles of the Luojia-1 satellite.
Remotesensing 17 03739 g005
Figure 6. Luojia-1 satellite’s positions when taking the images.
Remotesensing 17 03739 g006
Figure 7. Scatter plots of two Luojia-1 images obtained within 10 s. The dashed line is the diagonal where 1:1 relationship is expected. (a) Urban, R = 0.9642, (b) natural, R = 0.8841.
Remotesensing 17 03739 g007
Figure 8. Scatter plots of Luojia-1 data from four dates, with R = 0.7282. The dashed line is the best-fitted line.
Remotesensing 17 03739 g008
Figure 9. Scatter plots between ISS image and NSB values in different channels. From the first to fourth row: ISS-20150119, ISS-20150123, ISS-20180228, ISS-20200226. The dashed line is the best-fitted line.
Remotesensing 17 03739 g009
Figure 10. Scatter plots of ISS data from four dates. The dashed line is the best-fitted line.
Remotesensing 17 03739 g010
Figure 11. Night lights rankings by land use types using the ISS and Luojia-1 images. We show the log-scale value since the variation between land use types is large. The dashed line links the log-scale brightness to the relative ranking.
Remotesensing 17 03739 g011
Figure 12. Residential and commercial areas in Hong Kong. (a) Geographic distribution of residential and commercial areas in Hong Kong. The private residential areas defined include two types of buildings: pure residential buildings and mixed-use buildings with ground-floor shopping. We manually selected some pure private residential areas (selected private residential) to distinguish the two types of buildings. (b) Sample nighttime photos in residential and commercial areas. Public and some purely private residential buildings are quite similar, as they are both gated communities. Another type of private residential building (the mixed-use type with ground-floor shopping) includes commercial activities and is common in Hong Kong. One of these typical mixed-use buildings is a tong lau.
Remotesensing 17 03739 g012
Figure 13. Distributions of nightlights in public residential, private residential, selected private residential, and commercial areas. Note some radiance values (L) of Luojia-1 data in commercial and private residential areas may exceed 2,000. We only show data within 0–2000, which should be capable of capturing the main distribution. From (a,b), commercial areas and private residential areas (with mixed-use buildings) are brighter in early night (23:08) than late night (3:32M+1). The Hong Kong Government has a task force on external lighting and recommends switching off external lighting (typical in commercial areas) after 23:00, following the switching-off recommendation outlined in the Charter on External Lighting. The turn-off time is not precisely 23:00 as measured from Figure 3, which is also reflected in (c,d) with local times of 22:44 and 22:56, respectively.
Remotesensing 17 03739 g013
Figure 14. Nighttime profile of the airport. The first row shows Luojia-1 images before 23:00 (with a light center at the lower right). The second row shows ISS images between 23:08 and 4:35+1 (with the light center shifted from the lower right at 23:08 to upper right and lower center after 0:00+1). The lower center is the airfreight terminals.
Remotesensing 17 03739 g014
Figure 15. Normalized nighttime images of the downtown Hong Kong. The upper left is the Kwai Tsing Container Terminals, and the center areas locate most of the commercial areas in Hong Kong (see Figure 12 for geographic distribution of commercial and residential areas). Commercial areas were brighter at 23:08 than at 3:32+1. The contrast of brightness was maximized at the blue channel.
Remotesensing 17 03739 g015
Figure 16. Color difference in ISS images grouped by land use types in Hong Kong. The red and blue bars show the average DN values of each land use type in red and blue channels, respectively. Their ratio is plotted and overlapped on the color bar.
Remotesensing 17 03739 g016
Table 1. Available cloudless Luojia-1 images used in this study, their captured time, and the operating GaN-MN stations in the scene.
DateLocal TimeOperating Station
3 September 201822:44:02HKU, HKn, TST, Col, Tai
22:44:07HKU, HKn, TST, Col, Tai
22:44:12HKU, HKn, TST, Col, Tai
22:44:17HKU, HKn, TST, Col, Tai
22:44:22HKU, HKn, TST, Col, Tai
22:44:27HKU, HKn, TST, Col, Tai
24 November 201822:46:52HKU, HKn, TST, AP, iObs, Mac, Col, Tai
22:46:57HKU, HKn, TST, AP, iObs, Mac, Col, Tai
22:47:02HKU, HKn, TST, AP, iObs, Mac, Col, Tai
22:47:07HKU, HKn, TST, AP, iObs, Mac, Col, Tai
22:47:12HKU, HKn, TST, AP, iObs, Mac, Col, Tai
29 January 201922:56:32HKU, HKn, TST, iObs, Mac, Col, Tai
22:56:37HKU, HKn, TST, iObs, Mac, Col, Tai
22:56:42HKU, HKn, TST, iObs, Mac, Col, Tai
22:56:47HKU, HKn, TST, iObs, Mac, Col, Tai
22:56:52HKU, HKn, TST, iObs, Mac, Col, Tai
22:56:57HKn, iObs
11 March 201922:56:18HKU, HKn, TST, iObs, Mac
22:56:23HKU, HKn, TST, iObs, Mac
Table 2. Available ISS images and the corresponding georeferencing error evaluated by the third-order polynomial interpolation in terms of RMSE. The last column lists the operating in situ stations in the scene.
DateLocal TimeRMSE (Degree)Operating Station
19 January 20150:57:46+10.00108HKU, TST, Cap
0:57:47+10.00118HKU, TST, Ap, Cap
0:57:58+10.00159HKU, TST, Cap
0:58:01+10.00102HKU, TST, Ap, Cap
0:58:04+10.00123HKU, TST, Ap, Cap
0:58:08+10.00135HKU, TST, Ap, Cap
0:58:25+10.00141HKU, TST, Ap, Cap
23 January 201523:07:220.00156HKU, TST, Ap, Cap
23:07:260.00132HKU, TST, Ap, Cap
23:07:290.00177HKU, TST, Ap, Cap
23:07:310.00127HKU, TST, Ap, Cap
23:07:340.00103HKU, TST, Ap, Cap
23:07:390.00119HKU, TST, Ap, Cap
23:07:430.00141HKU, TST, Ap, Cap
23:07:550.00077HKU, TST, Ap, Cap
23:08:020.00063HKU, TST, Ap, Cap
23:08:050.00077HKU, TST, Ap, Cap
23:08:110.00078HKU, TST, Ap, Cap
23:08:150.00060HKU, TST, Ap, Cap
23:08:190.00106HKU, TST, Ap, Cap
28 February 20184:35:42+10.00150HKU, HKn, TST, iObs, Mac, Col, Tai
4:35:47+10.00146HKU, HKn, TST, iObs, Mac, Col, Tai
4:35:53+10.00100HKU, HKn, TST, iObs, Mac, Col, Tai
4:35:57+10.00119HKU, HKn, TST, iObs, Mac, Col, Tai
4:36:03+10.00121HKU, HKn, TST, iObs, Mac, Col, Tai
4:36:05+10.00140HKU, HKn, TST, iObs, Mac, Col, Tai
26 February 20203:32:36+10.00128HKU, HKn, TST, AP, iObs, KP, Mac, Col
3:32:37+10.00149HKU, HKn, TST, AP, iObs, KP, Mac, Col
Table 3. Station details and characteristics.
StationLocationLatLonEleCharacteristics
HKUHKU Observatory Dome22.28114.14100Urban. Situated on an urban campus in a residential neighborhood. Within a 1.5 km circle, major land use classes: institutional open space, private residential, roads and transport facilities, and natural vegetation.
TSTHong Kong Space Museum22.29114.1710Urban. Situated in a planetarium in commercial neighborhood. Within 1.5 km major land use classes: commercial, other urban (park), roads and transport facilities, and water bodies.
KPKing’s Park Meteorological Station, Hong Kong Observatory22.31114.1765Urban. Situated in urban park in mixed residential/commercial neighborhood. Within 1.5 km major land use classes: other urban (park), institutional open space, commercial, and roads and transport facilities.
HKnHo Koon Nature Education cum Astronomical Centre (Sponsored by Sik Sik Yuen)22.38114.11140Situated between urban areas and mountains. Major land use classes: natural vegetation, institutional open space, and closest station to port facilities.
CapThe Swire Institute of Marine, HKU22.21114.265Situated in a research facility far away from built environment. Major land use: natural vegetation.
iObsiObservatory, Hong Kong Space Museum22.41114.3280Situated in an institutional facility far away from built environment. The 2nd farthest from urban areas. Major land use: natural vegetation.
APAstropark, Hong Kong Space Museum22.38114.345Situated in an institutional facility far away from built environment. The farthest from urban areas. Major land use: natural vegetation.
MacMacau22.19113.5430Macau urban center. Major land use classes: Mixed Commercial (Casinos and hotels), Private Residential, Public Residential.
TaiTaipa22.15113.5740Macau new town. Major land use class: commercial (casinos and hotels).
ColColoane22.11113.5610Major land use classes: natural vegetation, rural settlement.
Note: Lat/Lon in decimal degrees; Ele: Approximate elevation (units: meters); Lat/Lon in decimal degrees. Explore these stations at http://globeatnight-network.org/map.html, accessed on 15 June 2020.
Table 4. Hong Kong land use data and their corresponding pixel numbers (#). The original classes are defined in the map of Land Utilization 2018. The first ten classes are categorized as urban classes, and the last four are natural classes.
Class#PixelOriginal Class
Private Residential2291Private Residential
Public Residential1478Public Residential
Rural Settlement2998Rural Settlement
Commercial389Commercial
Industrial2291Industrial Land
Industrial Estates/SciTech Parks
Warehouse and Open Storage
Institutional Open Space4742Government, Institutional and Community Facilities
Open Space and Recreation
Roads and Railways4501Roads and Transport Facilities
Railways
Airport1127Airport
Port Facilities404Port Facilities
Other Urban3900Cemeteries/Funeral Facilities
Utilities
Vacant Land/Construction in Progress
Others
Agriculture5862Agricultural Land
Fish Ponds/Gel Wais
Natural Vegetation64,174Woodland
Shrubland
Grassland
Mangrove/Swamp
Barren533Badland
Rocky Shore
Water Bodies2692Reservoirs
Streams and Nullahs
Table 5. Summary of R correlation coefficients with different channels and integral windows across multiple snapshots (# denotes the number of snapshots).
11 × 115 × 51 × 1
Date# Red Green Blue Average Average Average
19 January 20157Remotesensing 17 03739 i001Remotesensing 17 03739 i002Remotesensing 17 03739 i003Remotesensing 17 03739 i004Remotesensing 17 03739 i005Remotesensing 17 03739 i006
23 January 201513Remotesensing 17 03739 i007Remotesensing 17 03739 i008Remotesensing 17 03739 i009Remotesensing 17 03739 i010Remotesensing 17 03739 i011Remotesensing 17 03739 i012
28 February 20186Remotesensing 17 03739 i013Remotesensing 17 03739 i014Remotesensing 17 03739 i015Remotesensing 17 03739 i016Remotesensing 17 03739 i017Remotesensing 17 03739 i018
26 February 20202Remotesensing 17 03739 i019Remotesensing 17 03739 i020Remotesensing 17 03739 i021Remotesensing 17 03739 i022Remotesensing 17 03739 i023Remotesensing 17 03739 i024
Table 6. Major factors affecting observed NTL values.
FactorEffects
Sensor
Spectral responseSpectral response is a sensor’s specific wavelength detection; it impacts NTLs by filtering bands, causing brightness overestimation, or underestimation.
Signal-to-noise (SNR) ratioA higher SNR reduces random noise interference, leading to more stable and accurate NTL brightness measurements.
Low light sensitivitySensors with higher low light sensitivity can capture dim NTL signals (e.g., rural areas) more effectively.
SaturationWhen NTL brightness exceeds the sensor’s saturation threshold, the signal is clipped, resulting in underestimated brightness for high-light areas (e.g., city centers).
AgingMainly reduces sensitivity, raises noise, shifts spectrum, and biases long-term NTL data; not considered in most analyses.
False Changes (artifacts)
CloudsClouds block NTL signals, leading to artificially reduced brightness in covered areas.
Lunar interferenceMoonlight can increase background brightness.
Real Changes (condition)
Local timeNTL brightness varies with local time (e.g., higher at night when lights are on, lower in early morning).
Atmospheric conditionsEven without clouds, atmospheric conditions affect scattering, leading to NTL changes (e.g., humidity is known to be associated with NTLs).
Observational angleMountainous and tall buildings can block NTL, leading to observed target change; also change the path length of NTL signals through the atmosphere, causing brightness underestimation.
Real Changes (source)
AdditionNew light sources (e.g., new buildings, streetlights) increase local NTL brightness, reflecting regional development or expansion.
ReplacementReplacing old light sources (e.g., incandescent with LED) changes brightness intensity or spectral characteristics, altering measured NTL values.
RemovalRemoving light sources (e.g., demolished buildings, turned-off streetlights) decreases NTL brightness, indicating land-use changes or reduced human activity.
Disclaimer/Publisher’s Note: The statements, opinions and data contained in all publications are solely those of the individual author(s) and contributor(s) and not of MDPI and/or the editor(s). MDPI and/or the editor(s) disclaim responsibility for any injury to people or property resulting from any ideas, methods, instructions or products referred to in the content.