Abstract
The South China Sea (SCS) is a critical fishery region facing sustainability challenges due to overexploitation, geopolitical tensions, and inadequate monitoring. Traditional monitoring methods, such as AIS and VMS, have limitations due to data gaps and vessel deactivation. We developed an improved remote sensing algorithm using VIIRS nighttime light observations (2013–2022) to detect and classify lit fishing boats in the SCS. The study introduces a Two-Dimensional Constant False Alarm Rate (2D-CFAR) algorithm integrated with morphological analysis, which enhances boats’ detection accuracy. The classification of fishing boat types was based on light power thresholds derived from spatial entropy analysis, where distinct clustering patterns indicated three operational categories: small interfering lights (<1.2–3.7 kW), small-to-medium-sized lit fishing boats (1.2–3.7 to 28.6–43.2 kW), and large lit fishing boats (>28.6–43.2 kW). Our findings reveal a 4.4-fold dominance of small-to-medium-sized lit fishing boats over large lit fishing boats. China’s summer fishing moratorium effectively reduces large lit fishing boats activity by 85%, yet small-to-medium-sized lit fishing boats, primarily from neighboring countries like Vietnam, persist, exploiting this period illegally. Spatially, small-to-medium-sized lit fishing boats concentrate in the central SCS, southeast Vietnam, and Nansha Islands, while large lit fishing boats target upwelling zones near Hainan and Guangdong. Moreover, a new fishing hotspot emerged in eastern SCS, reflecting intensified resource and geopolitical competition. Light intensity analysis reveals rapid growth in contested areas (10% annually, p < 0.01), underscoring ecological risks. These findings highlight the limitations of unilateral policies and the urgent need for regional cooperation to curb illegal, unreported, and unregulated (IUU) fishing. Our algorithm offers a robust tool for monitoring fishing dynamics, providing quantitative insights into vessel distribution, policy impacts, and resource-driven patterns. This supports evidence-based fisheries management and biodiversity conservation in the SCS, adaptable to other marine regions facing similar challenges.
1. Introduction
The South China Sea (SCS) is endowed with abundant fishery resources and serving as a critical breeding, foraging, spawning, and migratory habitat for numerous economically important fish species. With high ecological and economic value, the SCS ranks among the most vital commercial fishing grounds globally. However, with population growth and economic development, fishery resources in the SCS are under inevitable pressure [1,2]. Overfishing, environmental pollution, and climate change have resulted in the gradual depletion of these resources. By 2015, the SCS accounted for 12% of the global marine fish catch, with more than half of the world’s lit fishing boats operating in the SCS [3]. The widespread use of light-fishing techniques has further intensified exploitation levels and has posed substantial challenges to the sustainable development of regional fisheries [4].
In recent years, nearshore fishery resources have been observed to decline due to overfishing and environmental pressures, leading fishing activities to expand into offshore areas. This trend is particularly evident in the rapidly developing mid-upper layer fisheries that rely on light attraction (such as squid and mackerel), which use high-intensity lights to attract phototactic fish species [2,5,6,7]. While this method improves fishing efficiency, the absence of effective regulation has raised concerns about resource depletion and ecological imbalance. Fisheries in the SCS are often considered to be overexploited, and differences in management policies among regional countries exacerbate resource competition [8,9,10]. For example, China’s summer fishing moratorium system (from May to August each year) effectively protects spawning fish populations during their breeding season. However, some neighboring countries often lack similar regulatory frameworks, allowing foreign vessels to take advantage of the fishing ban period for Chinese boats, intensifying resource competition [10,11,12]. Moreover, destructive fishing practices such as trawling pose significant threats to benthic habitats like coral reefs. These challenges underscore the urgent need for robust monitoring approaches to track the spatiotemporal dynamics of light-based fishing activities and to support evidence-based policy development in the South China Sea [13].
The spatial distribution of lit fishing boats provides critical basic information for managing fishery activities [14]. While Automatic Identification System (AIS) and vessel monitoring system (VMS) are widely adopted by government agencies to track lit fishing boats. fishermen may close the AIS/VMS to escape from monitoring their illegal fishing activities. Moreover, many small lit fishing boats are not equipped with AISs or VMSs due to cost constraints. As a result, reliance solely on AIS/VMS leads to significant gaps in fishery activity monitoring. Nighttime remote sensing is an effective supplementary method for monitoring the spatial distribution of lit fishing boats, addressing gaps left by AIS/VMS. In conjunction with vessel monitoring system data, nighttime remote sensing products of lit fishing boats are widely used to map fishing effort, identify Illegal, Unreported, and Unregulated (IUU) fishing, locate suitable fishing grounds, and assess responses to environmental events [4,15,16,17,18].
The nighttime detection of well-lit fishing boats was first attempted using low-light imaging sensors on the Defense Meteorological Satellite Program’s Operational Linescan System (DMSP-OLS) in the 1970s. However, its limited spatial resolution resulted in low detection accuracy [19]. With the advancement of satellite technology, nighttime images from high-resolution sensors such as the Visible Infrared Imaging Radiometer Suite (VIIRS) have been widely used for detecting lit fishing boats. Early methods primarily relied on manually setting grayscale thresholds to distinguish boat lights from the ocean background, but this approach introduced significant subjectivity and regional variability, limiting its applicability across diverse spatial and temporal contexts [17]. To resolve these issues, machine learning techniques have been increasingly employed. For example, Xue et al. (2022) [20] utilized sparse coding and dictionary learning to enhance detection in the Gulf of Mexico and East China coastal regions. Cheng et al. (2023) [21] applied an attention-based multiscale fusion algorithm using YOLOv5 to identify lit fishing boats in the Arabian Sea. Tsuda et al. (2023) [22] further advanced automated detection with a machine learning-based system in the Yellow Sea. Although such methods improve detection performance, they often entail increased model complexity, reducing their generalizability to other regions. Moreover, the sparse feature representation of point-like boat lights in nighttime imagery limits their suitability for deep learning applications, as such targets lack sufficient spatial and structural information for effective feature extraction. To address these challenges, alternative approaches such as monthly digital number (DN) histogram analysis [23], dynamic image segmentation [24,25], dual-band fusion using Day and Night Band (DNB) and brightness temperature at 3.7 μm (BT3.7) [26], and image denoising with random forest models [27]. Among these, the 2D-CFAR algorithm has been more widely adopted due to its strong flexibility and intuitive logic [28,29].
The VIIRS Boat Detection (VBD) product, derived from the VIIRS Day/Night Band (DNB), is the most widely used operational product for detecting lit fishing boats and has been extensively applied in fisheries remote sensing to map fishing activities and assess environmental responses [4,15,16,17,18,30,31,32]. Despite its widespread use, VBD was initially optimized for low lunar illumination, which caused significant errors under cloud cover and strong lunar surface reflections [33]. Subsequent improvements incorporated longwave infrared imagery to mitigate these interferences, enhancing the detection of dim targets and reducing false positives [22,34]. Nevertheless, persistent challenges remain, including incomplete data coverage, duplicated detections in overlapping satellite swaths, and the presence of background noise. These limitations underscore the necessity for complementary approaches to improve detection reliability, ensure data completeness, and support long-term spatiotemporal analyses.
In this study, a region-specific remote sensing algorithm is proposed that combines the Two-Dimensional Constant False Alarm Rate (2D-CFAR) approach with morphological filtering. This method enables rapid and large-scale extraction of illuminated fishing grounds with relatively low computational complexity. Rather than replacing the existing VIIRS Boat Detection (VBD) dataset, the proposed algorithm is intended to complement it by addressing instances of missed detections. By integrating results from our algorithm with those from the VBD product, we achieve a more complete reconstruction of lit fishing boats activity in the South China Sea (SCS) from 2013 to 2022 (Figure 1). By correlating the growth trends of different types of fishing boats with national policies and catch volumes, we can infer fishery development trends in the region. This approach enhances understanding of fishing activity patterns and their drivers, providing valuable insights for policymakers to improve regional fishery management and promote sustainable marine ecosystem services and biodiversity conservation.
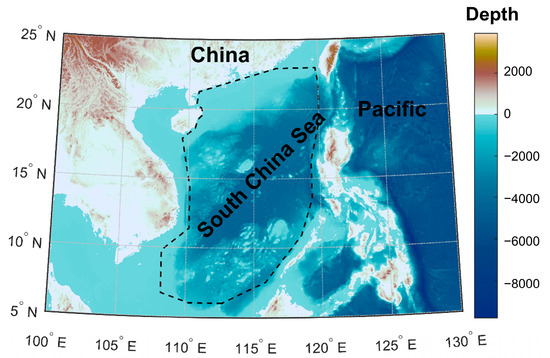
Figure 1.
Location of the study area in the SCS (the region within the dashed box).
2. Data and Methods
2.1. Satellite Data Preprocessing
The Earth Observation Group, Colorado School of Mines (EOG) global daily Visible Infrared Imaging Radiometer (VIIRS) nighttime mosaic images from 2013 to 2022 were used to develop the SCS lit fishing boat detection algorithm (https://eogdata.mines.edu/products/vnl/#daily, accessed on 5 March 2023). The spatial resolution of the images is approximately 15 arcseconds (~500 m at the equator). Before development of the algorithm, the VIIRS nighttime mosaic images were preprocessed via the following steps: (1) replace the missing grayscale values (−999) with neighboring pixel values to smooth edges; (2) normalize grayscale values in the logarithmic space to mitigate differences caused by lunar phases or cloud cover interference; and (3) apply a 2D-Gaussian filter with a standard deviation of 0.8 to the normalized images to flatten noise levels (Figure S1). In addition to algorithm development, a validate dataset for lit fishing boat detection was also developed by visual interpretation based on these preprocessed VIIRS images. All image processing and algorithm development were performed using MATLAB R2021a (The MathWorks, Inc., Natick, MA, USA).
2.2. Development of Lit Fishing Boat Identification Remote-Sensing Algorithm
This study employs two complementary methods to extract potential lit fishing boats (Figure 2). A 2D-CFAR method is used first for the initial extraction from the imagery, but this method would miss some blurred targets under cloud cover. Thus, a morphological approach is applied for an additional extraction. The light results of the two extractions are merged, and duplicate points are removed, followed by a masking process (Figure 2 mask processing) to determine the final lit fishing boat targets. The details of the two light extraction methods and mask processing are shown below.
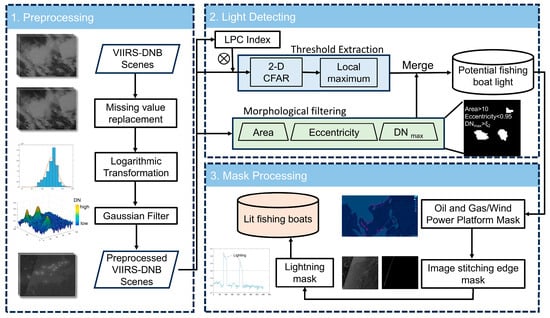
Figure 2.
Flowchart of the lit fishing boat detection algorithm in the SCS.
2.2.1. 2D-CFAR Light Extraction Method
Nighttime remote sensing images are often affected by extensive cloud cover. This study introduces the clarity index based on local phase coherence (LPC) [35] to calculate the sharpness (clarity) of remote sensing images. This index effectively suppresses the blurring effect caused by clouds and enhances point-like targets, such as lit fishing boats. The clarity index based on LPC is subsequently multiplied by the original grayscale values of the remote sensing images to reduce the interference of extensive cloud cover in light detection. The CFAR method is then employed to set the grayscale threshold for detecting lights in the images. The principles of the CFAR method are as follows (Figure S2): The background modeling in the CFAR algorithm is based on a local sliding window approach. Each pixel serves as the center of detection, surrounded by a 2-pixel-wide guard window that prevents signal leakage from the target into the background estimation. Beyond the guard window, an 8-pixel-wide reference window is applied to extract the local background, from which the average DN value is calculated as the background estimate. A dynamic detection threshold is then set by adding a constant offset to the background mean, enabling adaptive detection of bright targets under varying conditions of moonlight, cloud cover, and sea surface reflection. The mathematical expression of the CFAR method is provided below [29,36].
where represents the average DN value of the background unit, denotes the DN value of the target unit, and represents a constant offset at time t. After threshold extraction, local maxima are used to separate candidate targets. Adjacent lit fishing boats are delineated into separate regions to form individual light points.
Combined with the clarity index (LPC), the CFAR grayscale threshold segmentation method effectively identifies maritime light points across different lunar phases (Figure 3). This approach normalizes images with varying illumination characteristics, mitigating the blurring of light signatures caused by sea surface and cloud-reflected moonlight under low-interference conditions. It significantly improves the consistency and robustness of threshold values across lunar phases. Owing to varying lighting conditions and weather conditions over different periods, achieving a consistent optimal segmentation threshold between boat lights and the marine background is challenging. Therefore, this paper divides the images into three periods on the basis of lunar phases and image background values: the crescent moon period (Days 1–6 and 25–30; solar-lunar angle: 0°–90°, 270°–360°); the quarter moon period (Days 7–9 and 22–24; solar-lunar angle: ~90° and 270°); and the gibbous moon period (Days 10–21; solar-lunar angle: 90°–270°). Different basic grayscale thresholds are set for images in different periods (Table S1).
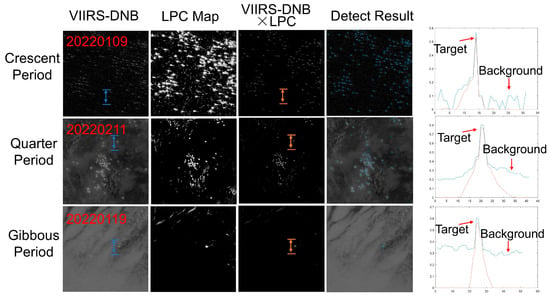
Figure 3.
An example of CFAR method verification based on the LPC index during three phases. Blue arrows indicate the transect drawn across the target in the VIIRS-DNB image; orange arrows indicate the corresponding transect in the VIIRS-DNB × LPC image. In the rightmost panels, the digital number (DN) profiles along these transects are plotted using the same color scheme.
2.2.2. Morphology Light Extraction Method
To extract candidate lit fishing boats from blurred or scattered light signals, we first converted the enhanced nighttime imagery into a binary image based on pixel intensity and shape characteristics. Specifically, we applied a threshold on object area and eccentricity, selecting features with an area between 10 and 500 pixels and an eccentricity lower than 0.95 (Figure 4). The area threshold (10–500 pixels) for morphological filtering was determined based on empirical observations and prior studies [34,37]. Given the spatial resolution of VIIRS-DNB data (~500 m per pixel), small-scale fishing boats typically generate light footprints spanning 1–4 pixels, corresponding to 0.25–4 km2, depending on light intensity and atmospheric scattering. Larger vessels or clustered lights may produce footprints extending to several dozen pixels. In this study, morphological filtering was primarily applied to detect vessel lights obscured by thin cloud cover. Under such conditions, cloud scattering causes the apparent size of light sources to expand. Setting a lower threshold of 10 pixels effectively suppresses random noise and non-vessel light artifacts, while preserving cloud-scattered vessel signals. The upper threshold of 500 pixels was used to exclude large non-fishing light sources such as urban spillover and offshore infrastructure. The threshold range was validated through manual interpretation of numerous scenes under varying cloud and moonlight conditions, confirming its effectiveness in capturing typical fishing vessel targets while minimizing false detections.
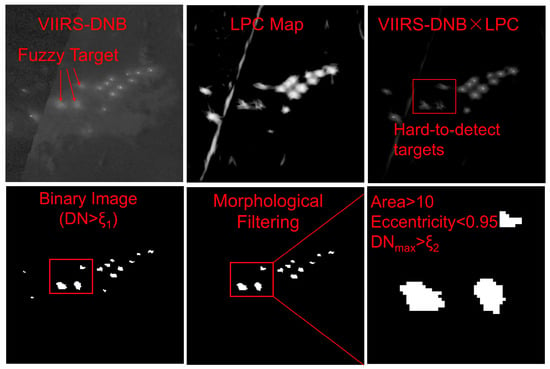
Figure 4.
Selection of morphological filtering parameters and examples of extracted results.
It is important to emphasize that the operator’s freedom to define these parameters is limited by the requirement for consistent performance across thousands of images. Although regional tuning is possible, consistent thresholds across the dataset were adopted to ensure reproducibility and minimize subjectivity in the detection pipeline.
2.2.3. Mask Processing
In addition to lit fishing boat lights, the bright spots identified through grayscale threshold segmentation and morphological recognition may include abnormal brightness at image mosaic edges, light sources from oil and gas platforms, offshore wind turbines, and lightning. This study employs an exclusion method to identify fishing boat lights, as follows: (1) Detect abnormal brightness at mosaic edges using a 30-pixel linear morphological structuring element, combined with Hough transform to extract edge masking factors (Figure S4a); (2) Detect light sources from oil/gas platforms and wind turbines by comparing extracted light points with existing platform databases, labeling matches as non-fishing boat lights [34,38,39,40]; (3) Identify lightning by scanning vertically for 26 consecutive rows with pixel brightness exceeding 0.4, marking and masking such segments (Figure S4b) [34]. After excluding these sources, the remaining lights are classified as fishing boat lights.
2.3. Validation of Lit Fishing Boat Identification Remote-Sensing Algorithm
To construct the validation dataset, this study employed manual visual interpretation of preprocessed VIIRS nighttime imagery to identify lit fishing boats. A total of 12,501 target points were identified across three different lunar phases, covering the period from 2013 to 2022. This dataset was then used to evaluate the performance of both the proposed detection algorithm and the VBD product. Evaluation metrics included precision, recall, and F1 score, following standard practices in remote sensing accuracy assessment [22,25]:
where represents the number of lit fishing boats detected by the algorithm that can be found in the validate dataset, represents the total number of lit fishing boats detected by the algorithm, and represents the actual number of lit fishing boats in the validate dataset.
Manual interpretation was conducted by three analysts with experience in low-light remote sensing image analysis. Lit fishing boats were identified from preprocessed VIIRS nighttime imagery based on the following criteria: (1) bright point sources spatially separated from urban areas or land boundaries; (2) radiance exhibiting elliptical or circular patterns with sharp edge gradients; (3) temporal persistence across consecutive daily images, indicating stability and mobility; and (4) light sources near coastlines or platforms were retained only if they showed signs of movement or spatial independence. Offshore platforms and lightning flashes were excluded by cross-referencing oil and gas platform databases and through visual inspection of light morphology, such as excessive brightness or elongated shape. Each image was independently examined by all three analysts, and only targets confirmed by at least two interpreters were retained. The interpretation process was assisted by ArcGIS 10.7 (Esri, Redlands, CA, USA) with radiance stretching and geographic overlay functions.
2.4. Calculation of the Light Power of the Lit Fishing Boat
Typically, light power is used to assess the brightness of fishing boats. Therefore, this study converts the radiance values of fishing boats into light power for the analysis of spatiotemporal distribution of the lit fishing boats in the SCS [37]:
where is the total radiance of the target within the band (W); is the radiance received by the satellite sensor (W·cm−2·sr−1); is the projected solid angle (sr); is the angle between the region’s surface normal and the observation line; is the atmospheric transmittance (this study does not consider the effects of scattering); and the value of is the projected area.
2.5. Spatial Distribution Entropy
In this study, lit fishing boats were classified based on the spatial distribution entropy of their radiated light power. It is assumed that vessels with different light power levels target different species or employ distinct fishing strategies, thereby exhibiting varying spatial aggregation patterns. To ensure year-to-year comparability, the vessels were first sorted by light power and then divided into 250 equal-sized bins. For each bin, spatial entropy was calculated to quantify the degree of spatial randomness or clustering. A higher entropy value indicates a more dispersed (disordered) distribution, suggesting the coexistence of multiple boat types, while a lower entropy value indicates a more spatially clustered distribution, likely corresponding to a specific type of vessel. The light power bin with the minimum entropy is considered the representative cluster center for a particular vessel class, and the maximum entropy value is used to define the threshold between different vessel types. The spatial entropy of each bin was computed following the method of [41]:
where H is the entropy value; i represents ith 0.25° × 0.25° spatial window, and pi denotes the probability of a fishing boat falling into the ith spatial window. Exclude values of pi that are equal to zero to prevent the computational issue of log2(0), and the sum of all the pi values equal 1:
where Ni is boats number in the ith spatial window, and j is the jth light power bin, and NT is the total boasts number in a VIIRS image.
In this study, all classification thresholds refer to the radiated light power of lit fishing boats, not their engine power. These thresholds were determined using spatial entropy analysis of VIIRS-DNB radiance values, reflecting the spatial stability and distribution patterns of different vessel types.
3. The Results
3.1. Performance of Lit Fishing Boat Identification Remote-Sensing Algorithm
By applying the algorithm to images from the SCS over the ten-year period from 2013 to 2022, the detection results under different lunar phases were obtained. The results demonstrate a significant improvement in precision for the developed algorithm proposed in this study (mostly >90%), which are better than the precision of the VBD product (mostly 50–90%) (Table 1). Double-count boats in areas with repeated satellite overpasses in VBD products may decrease it precision. Another source of lower precision of VBD products may be the SMI, which subtracts the median-filtered image from the original image, which can distort the target to some extent.

Table 1.
The Values of Precision, Recall, and F1 from This Study Algorithm and VBD. Values in bold indicate superior performance between the two algorithms for the corresponding metric.
In terms of the recall rate, the VBD product (mostly >85%) outperformed the results of this study (mostly 70–90%) across the gibbous moon phase (Table 1). Although our algorithm exhibits slightly lower recall compared to the VBD product, this is primarily due to the conservative threshold settings adopted during the gibbous moon phase to suppress false positives caused by cloud reflections. This strategy reflects the algorithm’s emphasis on high precision, which is particularly important in policy enforcement and regulatory applications. It is worth noting that our algorithm is highly flexible; if higher recall is desired, more aggressive thresholding can be applied to suit different operational scenarios. Additionally, we employed a result fusion strategy (see Section 3.2), whereby daily outputs from both the VBD product and our algorithm were compared, and the more accurate result was selected. This approach effectively leverages the strengths of both methods, ensuring completeness and consistency in long-term monitoring.
3.2. Classify of Lit Fishing Boats
In classifying lit fishing boats, this study acknowledges that both the VBD product and the proposed algorithm have distinct strengths and applicable scenarios. To ensure the reliability of the final dataset, a systematic verification process was implemented through visual inspection of daily extraction results from 2013 to 2022. Specifically, for each day, the detection outputs from both methods were overlaid onto the original VIIRS-DNB imagery. The result that exhibited stronger consistency with actual light signatures—characterized by better spatial alignment, fewer false positives (e.g., noise or offshore infrastructure), and lower omission rates—was selected as the final detection outcome for that day. This verification was conducted by a team of five experienced analysts, each independently comparing the outputs. The result favored by the majority (i.e., at least three of five analysts) was retained to reduce subjectivity and ensure consistency. After removing corrupted or missing imagery, a total of 3604 daily composite records were finalized and used for subsequent analysis.
According to the definition of spatial information entropy, lower entropy indicates a more concentrated distribution of fishing boats, while higher entropy suggests a more dispersed pattern. As shown in Figure 5, a sudden drop in entropy is observed for boats with light power < 1.2–3.7 kW, 1.2–3.7 kW to 28.6–43.2 kW, and >28.6–43.2 kW in different years, suggesting that boats in these ranges tend to cluster and are likely of the same type, while boats in different intervals represent different types. Based on Figure 5 and prior knowledge of lit fishing operations in the SCS, the boats are classified into three types: small lighted interfering boats (<1.2–3.7 kW) [34], small-to-medium-sized lit fishing boats (1.2–3.7 kW to 28.6–43.2 kW), and large lit fishing boats (>28.6–43.2 kW) [2]. The thresholds applied in this study reflect light power rather than engine capacity and are derived from spatial entropy analysis. Despite the lack of direct AIS validation, the resulting categories show good alignment with documented light power characteristics of fishing vessels in this region [2].
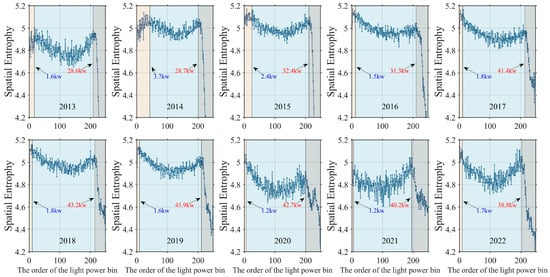
Figure 5.
Spatial information entropy of lit fishing boats.
3.3. Variations in the Abundance of Two-Types Lit Fishing Boats
From 2013 to 2022, a total of 1,946,947 small-to-medium-sized and 441,210 large lit fishing locations were detected, with the former being approximately 4.4 times more prevalent (Figure 6c,e), highlighting their dominance in the South China Sea (SCS). Both types of vessels showed an increasing trend over the decade, with small-to-medium-sized boats rising from 150,000 in 2013 to 260,000 in 2019, and large boats nearly doubling from 31,000 to 62,000 by 2021. The COVID-19 pandemic disrupted this growth: small-to-medium-sized boats saw a sharp decline from 2020 to 2022, while large vessels were less affected, maintaining high levels of operation through 2021 due to their longer-range, offshore capabilities.
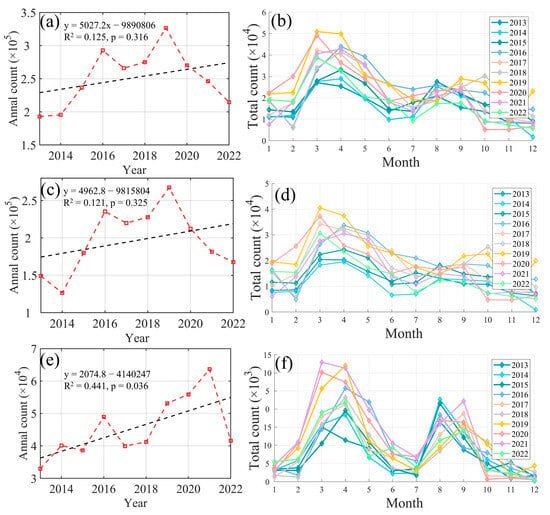
Figure 6.
(a) Annually number of lit fishing boats; (b) monthly number of lit fishing boats across different years; (c) annually number of small-to-medium lit fishing boats; (d) monthly number of small-to-medium lit fishing from 2013 to 2022 in the SCS; (e) Annually number of large lit fishing boats; (f) monthly number of large lit fishing boats across different years.
Seasonal patterns reveal that small-to-medium-sized boats peak from March to April, while large vessels show bimodal peaks in March–April and August–September (Figure 6d,f). The spring peak corresponds to the SCS fishing season, and the summer trough reflects China’s fishing moratorium. Post-moratorium recovery is more evident in large vessels, whereas small-to-medium-sized boats show little change, likely reflecting continued IUU activity by non-Chinese fleets during the moratorium [42]. The overall seasonal peak is dominated by small-to-medium-sized vessels, which may obscure the secondary peak of large vessels—underscoring the importance of analyzing vessel types separately.
To investigate the spatial distribution of lit fishing boats, the SCS was divided into three regions (Figure 7): Region 1 (>18° N), Region 2 (12°–18° N), and Region 3 (<12° N). This regional division reflects geographic, ecological, and operational differences in fishing activity across the basin. Over the past decade, lit fishing boat activity along the Guangdong coast (Region 1) has remained stable, consistent with data from the Chinese Statistical Yearbook showing stable catches and vessel numbers. In contrast, fishing activity in the central and southern SCS (Regions 2 and 3) has grown significantly, driven by illegal fishing by neighboring countries and geopolitical factors [43,44]. In recent years, illegal fishing activities by surrounding nations have intensified, contributing to the notable increase in lit fishing boats in the central and southern regions of the South China Sea [45]. Beginning in 2020, the decline in small--to-medium lit fishing boats coincided with the outbreak of the pandemic, primarily reflected in Region 3, while Region 2 showed stagnation in growth without a significant decline. Additionally, it is noteworthy that in Region 3, there was a significant decrease in large lit fishing boats from 2017 to 2018, which subsequently relocated to Region 2 for fishing, consistent with previous research. This shift is primarily attributed to restrictions on fishing licenses for lit fishing boats from Guangxi, China [30].
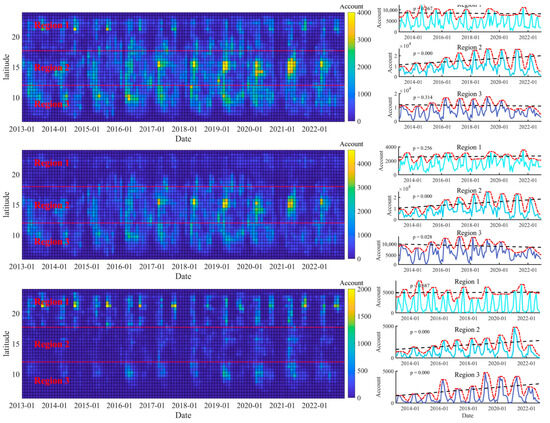
Figure 7.
Latitude–time distribution statistics of lit fishing boats (the top row); Latitude–time distribution statistics of small-to-medium lit fishing boats (the second row); Latitude–time distribution statistics of large lit fishing boats (the bottom row). The blue line represents the monthly number of lit fishing operations in the corresponding region, the red line indicates the variations in fishing operations during the peak fishing seasons (March and September each year), and the black dashed line denotes the linear fitting trend.
3.4. Spatial Variability of Two-Types Lit Fishing Boats
In the SCS, small-to-medium-sized lit fishing boats operate primarily in three regions: the central SCS, southeast near Vietnam, and the Nansha Islands (Figure 8). Their fishing intensity is significantly higher in the central and southern SCS than along Guangdong’s coast, with peak activity during March and April. Throughout the year, fishing hotspots alternate between the central and southern regions, maintaining consistently high fishing intensity due to frequent operations.
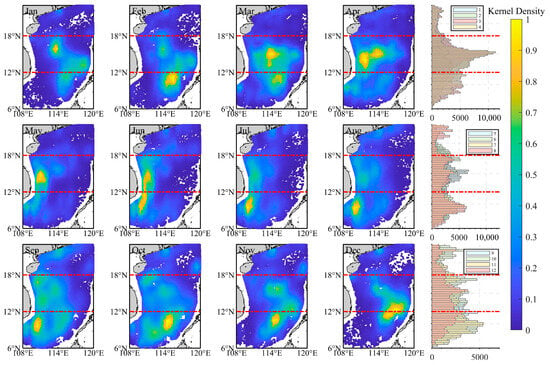
Figure 8.
Decade average spatial distribution density maps and latitude-based cumulative statistics histogram of small-to-medium lit fishing boats in 12 months from 2013 to 2022.
Large lit fishing boats are mainly concentrated northeast of Hainan Island (Region 1) during the fishing season, with fewer boats in region 2 (Figure 9). During the June–July moratorium, some concentration occurs east of Vietnam, though overall numbers remain low. In Region 3, fishing intensity peaks near the Nansha Islands in February–March, comparable to Guangdong’s coast, while from May to October, southern Vietnam shows higher intensity than the Nansha region. In December–January, moderate concentration occurs in the northeastern Nansha region, but overall intensity remains low during the off-season.
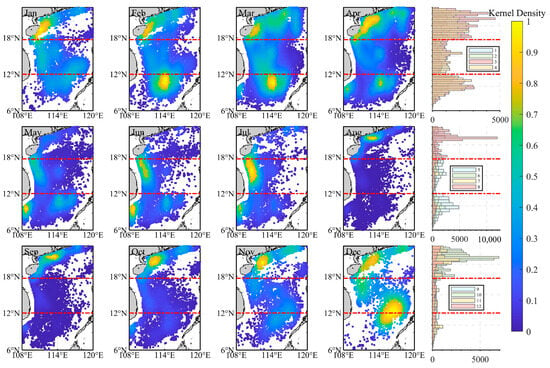
Figure 9.
Decade average spatial distribution density maps and latitude-based cumulative statistics histogram of large lit fishing boats in 12 months from 2013 to 2022.
4. Discussion
The South China Sea’s rich fisheries attract numerous countries, but geopolitical tensions have led to differing management approaches [46]. Countries such as China, Vietnam, and the Philippines often find themselves in a competitive state regarding SCS fisheries, especially concerning the Nansha Islands and surrounding waters, where competition has intensified [47]. The absence of an effective regional management mechanism results in overlapping fishing activities, resource overexploitation, and potential illegal fishing [48]. Fishing vessel distribution is influenced by both resource availability and geopolitical factors. To protect the SCS ecosystem and promote sustainable fisheries, more evidence is needed to assess operational patterns of neighboring countries. This study uses VIIRS nighttime light data (2013–2022) to reveal spatiotemporal heterogeneity in fishing activities (Figure 7, Figure 8 and Figure 9) and combines geopolitical policies with light intensity classification to provide quantitative insights into national fisheries policies.
4.1. Performance Comparison and Applicability
During the gibbous moon phase, the recall rate of the VBD product was significantly higher than that of the algorithm proposed in this study. This is mainly because imagery during this phase is often affected by enhanced moonlight reflection and scattered cloud interference, which substantially increases background noise and complicates threshold extraction. Although we implemented several preprocessing techniques—including logarithmic normalization, local phase coherence enhancement, and dynamic segmentation—to mitigate these effects, residual noise could not be entirely eliminated. Therefore, to reduce false positives, we adopted a more conservative thresholding strategy, which inevitably resulted in the omission of some dim targets. In contrast, the VBD algorithm performed better in detecting weak targets under high background brightness and fragmented cloud cover, likely due to proprietary noise suppression techniques integrated into its latest version, though the specific implementation details have not been disclosed.
However, the VBD product exhibited shortcomings in precision. These are mainly attributable to large amounts of duplicated detections in areas with overlapping satellite tracks, data gaps in certain periods, and repeated extraction of single light points caused by improper window settings in the Spatial Median Index (SMI) processing. In our method, the use of the SMI was intentionally avoided, as our analysis revealed that different light source scales require different optimal window sizes, making unified settings impractical. Additionally, we performed extraction on globally stitched VIIRS-DNB imagery, thereby avoiding duplicated detections in orbital overlap zones. One limitation of our method, however, is that on nights with few lit fishing boats, reduced image contrast may slightly lower detection accuracy.
Furthermore, the VBD dataset was less effective in masking fixed offshore infrastructure. According to recent radar remote sensing studies [38], relying solely on VIIRS-DNB or M10 data underestimates the number of oil and gas platforms in the South China Sea. By incorporating an updated platform database, our study improved the separation accuracy between platform lights and true lit fishing boats signals.
The 2D-CFAR and morphology-based algorithm proposed in this study also demonstrates good generalizability and can be applied to detect lit fishing boats in other marine regions. Its key advantages include structural simplicity, computational efficiency, and strong adaptability to complex environmental conditions such as varying moon phases and cloud cover. Unlike deep learning-based methods, which typically require large training datasets and intensive parameter tuning, our approach is unsupervised and parameter-tunable. The modular structure of the algorithm allows flexible adjustment of detection sensitivity based on user objectives, making it suitable for rapid deployment across broad spatial and temporal domains.
In summary, both VBD and our method have distinct strengths under different background conditions: VBD performs better in high-noise environments, while our algorithm excels in reducing redundant detections and improving temporal stability. Therefore, we adopted a fusion strategy in subsequent analyses, where daily outputs from 2013 to 2022 were visually compared, and the more accurate result was retained as the final fishing vessel detection outcome. In future work, we plan to further enhance detection performance by integrating longwave infrared VIIRS bands with DNB imagery to improve the visibility of weak light sources [22,34].
4.2. Driving Forces Behind the Spatiotemporal Variations of Lit Fishing Boats in the SCS
China, as the largest fishing nation in the SCS, plays a key role in the sustainability of its fisheries. Since the 1990s, China has implemented a summer fishing moratorium (May–August) to protect spawning fish and reduce overfishing [49]. This system has become the most influential conservation measure, significantly easing the pressure on marine resources and protecting nearshore fishery resources, particularly spawning fish and juveniles [13,50].
There are significant seasonal variations in the number of large lit fishing boats during spring and autumn, closely related to China’s fisheries policies. During the fishing moratorium period, China’s fishing activities significantly decrease [12]. After the end of the summer fishing moratorium, the number of fishing vessels and fishing intensity gradually increase, especially in Guangdong coastal fishing grounds. Nighttime light data from 2013 to 2022 shows that the number of large lit fishing boats operating decreased by 85% during the May-August fishing moratorium period (Figure 6f). After the moratorium, the catch per unit effort (CPUE) of single and double trawlers, otter trawl shrimp nets, and light-cage nets increased by 28.78%, 96.27%, and 4.20%, respectively [51]. During the same period, the Shannon-Wiener diversity index (H′) and Pielou evenness index (J′) of fishery resources in Daya Bay increased by 0.36 and 0.14, respectively [52]. These measures have helped protect fishery resources, particularly during marine organisms’ breeding seasons. However, foreign fishing activities, especially by Vietnamese vessels, undermine these efforts. Vietnamese boats engage in illegal, unreported, and unregulated (IUU) fishing during the moratorium, exacerbating resource competition in the central South China Sea (SCS) [11,45,46,53]. Despite an 85% decrease in large lit fishing boats, medium and small-sized vessels show no decline (Figure 6d), highlighting the limited effectiveness of unilateral policies. These challenges emphasize the need for stronger regional cooperation and unified fisheries management to address IUU fishing and protect SCS resources.
Vietnam is another significant fishing nation in the SCS region. When it comes to disputed waters in the SCS, Vietnam’s fishing activities often involve intense competition and conflicts with China [11,46]. Its operational intensity in the SCS has steadily risen in recent years [54,55]. Vietnam’s lit fishing boats are mostly concentrated in the central and southern parts of the SCS. In addition to some traditional fishing grounds, special attention should be given to the densely operated areas in the central SCS (Figure 10 and Figure S5). These areas are located within China’s nine-dash line. However, they are frequently subjected to illegal fishing activities by Vietnamese vessels, with the annual growth rate of light intensity in these areas reaching 10% (p < 0.01, Figure 10), particularly after 2020, forming dense clusters of fishing operations. The distribution shows a clear edge feature. By classifying the light power of the boats, it is observed that these lit fishing operations are primarily composed of small and medium-sized lit fishing boats (Figures S5 and S6). AIS data (Figures S7 and S8) confirms this distribution aligns with Vietnam’s fleet, reflecting geopolitical tensions and its claimed exclusive economic zone [42,56]. These smaller boats, often wooden and equipped with medium-to-low-power lights [30], show no decline during fishing moratoriums, unlike large vessels, which are mostly Chinese and concentrated in the northern SCS near Guangdong, reducing operations by 85% in summer (Figure S7). Therefore, our light vessel classification shows that large lit fishing boats are predominantly from China, while small-to-medium-sized lit fishing boats are mostly from neighboring countries. Operations by small-to-medium-sized boats in the study area are about 4.4 times more frequent than those by large lit boats. Strengthening regional fisheries cooperation and enhancing control over small-to-medium-sized lit boats are crucial for restoring SCS fishery resources and improving ecological governance.
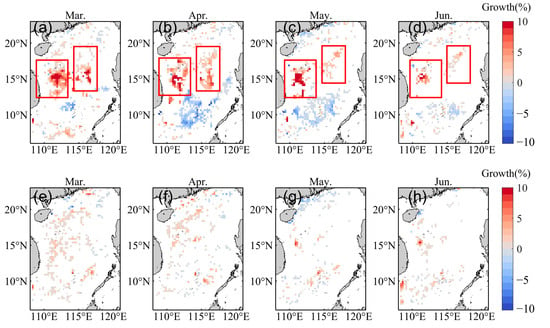
Figure 10.
The growth rate of lit fishing boats from March to June (the red box represents two areas with intense growth in fishery activities). (a–d) represent small-to-medium-sized lit fishing boats, while the (e–h) represent large lit fishing boats.
In addition to policy influences, the distribution of lit fishing boats is also driven by fishery resources. Large lit fishing boats, for instance, show the highest average catch on the northern continental shelf, particularly in April, when they concentrate in upwelling areas off the east coast of Hainan Island and western Guangdong Province, both major upwelling zones in the northern SCS [57]. These areas attract more fishing boats due to abundant resources [58]. Furthermore, previous studies have identified the Nansha Islands as fishing hotspots, considered potential squid fishing grounds [30]. Our study further reveals that large lit fishing boats began large-scale development in this fishing ground after 2016, with light intensity increasing by about four times compared to the previous year, maintaining high operational intensity thereafter (Figure 7). Peak operations from February to April match Guangdong’s coastal intensity (Figure 9). Conversely, small-to-medium-sized boats formed a hotspot in Nansha before 2013, but their activity dropped 10% annually after 2020. Geopolitical complexities, including the 2015 SCS Arbitration Case and lack of regional fisheries management [59], highlight fishing’s dual role in resource use and sovereignty claims. Finally, from May to September, a large number of small-to-medium-sized lit fishing boats gather in the eastern waters of Vietnam, a traditional upwelling area [60]. Its light intensity accounts for 33.7% of the total in the SCS. Notably, the hotspot area (KDE > 0.8) overlaps with known tuna fishing grounds by over 70% [61], with an annual growth rate of light intensity reaching 10% (p < 0.01) and involving the largest area (Figure 10). This highlights the need to balance resource development with ecological sustainability to prevent over-exploitation.
In this study, the distinction between fishing and non-fishing light sources was constrained by the VIIRS-DNB sensor’s single-band design, which lacks temporal or spectral resolution. As such, light-based classification approaches relying on flicker or spectral signatures could not be applied. Instead, we used a power-based classification scheme, wherein light sources with estimated radiative power below 3.7 kW were labeled as “other interfering lights.” This category may include container ships, naval vessels, buoys, or other low-intensity light-emitting targets. The classification thresholds were derived from spatial entropy analysis and align with previous observations of vessel lighting characteristics in the South China Sea [2]. While this provides a practical proxy for initial filtering, future work should aim to incorporate AIS-based vessel records and public infrared ship detection datasets to build a more detailed masking library and improve classification robustness. Furthermore, It is worth noting that the estimated ratio between small-to-medium-sized and large lit fishing boats may be affected by detection bias, as vessels with higher light intensity are more likely to be detected. Future studies will incorporate AIS data or official registries to enable more refined validation.
4.3. Advantages of Fisheries Management Based on Lit Fishing Vessel Distribution
Scientific assessment of SCS fisheries is essential for fostering future regional cooperation. Through pragmatic scientific collaboration, governments can build trust, prevent fish stock depletion, and promote peaceful resolution of fisheries disputes [62]. Hotspot areas identified by analyzing lit fishing boat distributions provide critical data to inform policy, helping countries and international organizations develop more science-based fishery conservation measures. This study highlights rapid increases in light intensity in the central and southern SCS, particularly in geopolitically sensitive areas. Governments must recognize the severity of these trends, which threaten fishery sustainability and risk escalating competition into regional conflicts. Establishing bilateral dialog mechanisms between China and Vietnam is crucial for building trust and mitigating risks related to fisheries and ecological cooperation [10,47,62].
Based on changes in light intensity, this paper offers several suggestions: Nighttime light distribution should be fully considered when identifying fisheries conflict hotspots. Satellite-derived nighttime light data are unaffected by tampering or device shutdowns (e.g., IUU vessels turning off AIS), providing objective and reliable observations of IUU and other fishing activities [17]. In regions with rapidly increasing operational intensity, environmental DNA (eDNA) and length-based spawning potential ratio (LBSPR) methods should be used to monitor biodiversity and population sustainability [63]. A multi-level early warning system should then be developed based on lit fishing boat densities, resource decline rates, and sustainability indices, triggering progressively stricter policy interventions. Joint management of SCS fishery resources should be promoted to enhance regional cooperation. Lastly, classifying light intensities is essential, as our results reveal distinct spatiotemporal patterns and fishing ground types. Without classification, critical information may be overlooked. Combining these classifications with AIS data would enable deeper analysis of operational characteristics across different countries.
5. Conclusions
In this study, we developed a novel algorithm based on VIIRS-DNB nighttime light data to automatically detect and classify lit fishing boats in the SCS. The algorithm integrates 2D-CFAR detection with morphological filtering and serves as a complementary tool to the VBD product. It enables high-precision identification of vessel lights under varying moonlight and cloud conditions, with flexible sensitivity adjustment to suit different monitoring objectives. Additionally, by applying spatial information entropy analysis, we classified detected vessels into small-to-medium-sized and large fishing boats, providing further insights into fishing fleet composition and operational intensity across the region.
Our analysis of the spatiotemporal distribution of lit fishing boats from 2013 to 2022 revealed that small-to-medium-sized lit fishing boats outnumbered large boats by approximately 4.4 times, indicating their dominance in regional light fishing activities. Temporally, the number of large lit fishing boats declined by about 85% during China’s annual fishing moratorium, while small-to-medium-sized vessels exhibited no significant decrease, suggesting potential IUU activity by fleets beyond the moratorium’s jurisdiction. Spatially, small-to-medium-sized lit fishing boats predominantly operated in three zones: the central SCS basin, the upwelling zone off southeast Vietnam, and the waters around the Nansha Islands. In contrast, large vessels concentrated in two areas: the upwelling zones near Guangdong and Hainan Islands, and the Nansha Islands region.
These observed distribution patterns are shaped by both environmental and policy-driven factors. Resource-rich areas such as upwelling zones attract high fishing intensity, while national policies, such as fishing bans, influence temporal fishing dynamics. Notably, in geopolitically sensitive regions, particularly around the central SCS basin, the rapid increase in light intensity suggests escalating fishing pressure. This underscores the urgent need for enhanced regional cooperation, particularly between China and Vietnam, to mitigate risks of fishery conflict escalation. Establishing bilateral dialog mechanisms focused on fisheries’ management and ecological conservation is essential. The findings of this study provide valuable information for fishers, policymakers, and management agencies, contributing to the development of effective, cooperative resource management strategies in the SCS.
Supplementary Materials
The following supporting information can be downloaded at: https://www.mdpi.com/article/10.3390/rs17172967/s1, Figure S1. Schematic diagram of VIIRS nighttime image processing process; Figure S2. Schematic representation of the surrounding pixels; Figure S3. Schematic diagram of the conversion between constant false alarm rate parameters and light point extraction thresholds; Figure S4. (a) Abnormal edge brightness. (b) Lightning; Figure S5. The distribution of lit fishing boats operation points during the fishery season (March to April). The top figure represents small-to-medium-sized lit fishing boats (a–c), while the bottom figure represents large lit fishing boats (d–f); Figure S6. The distribution of lit fishing boats operation points during the summer fishing moratorium (May to July). The top figure represents small-to-medium-sized lit fishing boats (a–c), while the bottom figure represents large lit fishing boats (d–f); Figure S7. The heat map of the distribution of Chinese lit fishing boats identified through matching with AIS data in 2022 (Data sourced from the Global Fishing Watch: https://globalfishingwatch.org/map); Figure S8. The heat map of the distribution of Vietnamese lit fishing boats identified through matching with AIS data in 2022 (The red boundary represents the boundary of Vietnamese fishing boat distribution, Data sourced from the Global Fishing Watch: https://globalfishingwatch.org/map); Table S1. False Alarm Rates of the CFAR Method Based on the LPC Index During the Three Lunar Phases (δ); Table S2. Confusion Matrix—concave Moon Phase; Table S3. Confusion Matrix—Crescent Moon Phase; Table S4. Confusion Matrix—Gibbous Moon Phase.
Author Contributions
Conceptualization, D.W.; Data curation, W.Z., S.T., L.Z. and Y.L.; Formal analysis, W.Z. and J.Y.; Funding acquisition, S.T. and Y.L.; Methodology, D.W., W.Z., L.Z., Y.L. and J.Y.; Project administration, S.T.; Software, D.W.; Supervision, S.T., L.Z., Y.L. and J.Y.; Validation, W.Z., S.T. and L.Z.; Visualization, D.W.; Writing—original draft, D.W.; Writing—review and editing, S.T. All authors have read and agreed to the published version of the manuscript.
Funding
This work was supported in part by the Guangdong Special Key Team Program (No. 2019BT02H594); in part by the National Natural Science Foundation of China (41876207); in part by the self-deployed project of South China Sea Institute of Oceanology, Chinese Academy of Sciences (SCSIO202209), in part by the National Natural Science Foundation of China (NSFC) (42206186).
Data Availability Statement
The 2013–2022 Nighttime Light-based Fishing Vessel Activity Dataset for the South China Sea is available for free accessed at: https://figshare.com/articles/dataset/lit_fishing_boats_mat/28660931 (accessed on 1 October 2022), The dataset is released in .mat format, with each daily file containing variables such as latitude, longitude, DN value, and classification results. Access does not require registration and is governed by the CC BY 4.0 license, which permits free use, sharing, and adaptation with proper attribution. The VBD (Visible Brightness Detection) data products are freely available at: https://eogdata.mines.edu/vbd/ (accessed on 1 October 2022).
Acknowledgments
We thank to the Global Fishing Watch, Earth Observation Group for their public datasets. We used ChatGPT (OpenAI) to assist in language polishing and figure summarization.
Conflicts of Interest
The authors declare no conflicts of interest.
References
- Pang, Y.; Tian, Y.; Fu, C.; Wang, B.; Li, J.; Ren, Y.; Wan, R. Variability of coastal cephalopods in overexploited China Seas under climate change with implications on fisheries management. Fish. Res. 2018, 208, 22–33. [Google Scholar] [CrossRef]
- Li, J.; Qiu, Y.; Cai, Y.; Zhang, K.; Zhang, P.; Jing, Z.; Wu, Q.; Ma, S.; Liu, H.; Chen, Z.; et al. Trend in fishing activity in the open South China Sea estimated from remote sensing of the lights used at night by fishing vessels. ICES J. Mar. Sci. 2022, 79, 230–241. [Google Scholar] [CrossRef]
- Watson, R.A.; Tidd, A. Mapping nearly a century and a half of global marine fishing: 1869–2015. Mar. Policy 2018, 93, 171–177. [Google Scholar] [CrossRef]
- Hoang, T.X.; Le, D.T.; Nguyen, H.M.; Vuong, N.D.T. Labor market impacts and responses: The economic consequences of a marine environmental disaster. J. Dev. Econ. 2020, 147, 102538. [Google Scholar] [CrossRef]
- Li, H.; Liu, Y.; Sun, C.; Dong, Y.; Zhang, S. Satellite Observation of the Marine Light-Fishing and Its Dynamics in the South China Sea. J. Mar. Sci. Eng. 2021, 9, 1394. [Google Scholar] [CrossRef]
- Tian, H.; Liu, Y.; Tian, Y.; Jing, Y.; Liu, S.; Liu, X.; Zhang, Y. Advances in the use of nighttime light data to monitor and assess coastal fisheries under the impacts of human activities and climate and environmental changes: A case study in the Beibu Gulf. Mar. Policy 2022, 144, 105227. [Google Scholar] [CrossRef]
- Zhao, M.; Zhou, Y.; Li, X.; Cao, W.; He, C.; Yu, B.; Li, X.; Elvidge, C.D.; Cheng, W.; Zhou, C. Applications of Satellite Remote Sensing of Nighttime Light Observations: Advances, Challenges, and Perspectives. Remote Sens. 2019, 11, 1971. [Google Scholar] [CrossRef]
- Zhang, H.; Li, M. Fisheries governance in the south China sea: Problems, progress, and prospects. Mar. Policy 2020, 121, 104237. [Google Scholar] [CrossRef]
- Cui, H.-M.; Zulfiqar, K. Effective law enforcement in gray zone operations: A Chinese perspective of coastguard law implementation in delimited maritime zones. Mar. Policy 2024, 169, 106366. [Google Scholar] [CrossRef]
- Chen, W.-C.; Ou, C.-H.; Yang, M.-H.; Shih, Y.-C. China’s gray zone actions in the East China Sea, Taiwan Strait, and South China Sea: A comparative study and impact on fisheries. Mar. Policy 2024, 167, 106246. [Google Scholar] [CrossRef]
- Zhang, L.; Zhou, Y.; Ma, S.; Huang, Y.; Gao, L.; Du, G.; Wu, Q. Analysis of the index weights of the order evaluation system during the summer fishing moratorium in the South China Sea. J. Shanghai Ocean Univ. 2022, 31, 491–501. [Google Scholar]
- Zhang, L.; Ma, S.; Tang, Y.; Zhou, Y.; Wu, Q. Acceptance of the summer fishing moratorium among small-scale fishers in China. Mar. Policy 2025, 173, 106556. [Google Scholar] [CrossRef]
- Ke, C.; Gu, Y.-G.; Huang, X.; Wu, W.; Ma, Z.; Song, C. Editorial: Fisheries ecological environment in South China Sea. Front. Environ. Sci. 2022, 10, 981443. [Google Scholar] [CrossRef]
- Exeter, O.M.; Htut, T.; Kerry, C.R.; Kyi, M.M.; Mizrahi, M.; Turner, R.A.; Witt, M.J.; Bicknell, A.W.J. Shining Light on Data-Poor Coastal Fisheries. Front. Mar. Sci. 2021, 7, 625766. [Google Scholar] [CrossRef]
- Straka, W.C.; Seaman, C.J.; Baugh, K.; Cole, K.; Stevens, E.; Miller, S.D. Utilization of the Suomi National Polar-Orbiting Partnership (NPP) Visible Infrared Imaging Radiometer Suite (VIIRS) Day/Night Band for Arctic Ship Tracking and Fisheries Management. Remote Sens. 2015, 7, 971–989. [Google Scholar] [CrossRef]
- Cozzolino, E.; Lasta, C.A. Use of VIIRS DNB satellite images to detect jigger ships involved in the Illex argentinus fishery. Remote Sens. Appl. Soc. Environ. 2016, 4, 167–178. [Google Scholar] [CrossRef]
- Oozeki, Y.; Inagake, D.; Saito, T.; Okazaki, M.; Fusejima, I.; Hotai, M.; Watanabe, T.; Sugisaki, H.; Miyahara, M. Reliable estimation of IUU fishing catch amounts in the northwestern Pacific adjacent to the Japanese EEZ: Potential for usage of satellite remote sensing images. Mar. Policy 2018, 88, 64–74. [Google Scholar] [CrossRef]
- Gao, Z.; Ma, S.; Li, J.; Sun, P.; Liu, Y.; Xing, Q.; He, Q.; Tian, Y. Climate-induced long-term variations of the Arctic ecosystems. Prog. Oceanogr. 2023, 213, 103006. [Google Scholar] [CrossRef]
- Croft, T.A. Nighttime Images of Earth from Space. Sci. Am. 1978, 239, 86–89. [Google Scholar] [CrossRef]
- Xue, C.; Gao, C.; Hu, J.; Qiu, S.; Wang, Q. Marine Boat Lights Detection Method Based on Sparse Representation for Low Light Remote Sensing Images During Night. J. Electron. Inf. Technol. 2022, 44, 1747–1757. [Google Scholar]
- Cheng, T.F. Spatial-Temporal Variation of Light-Fishing Grounds Based on Nighttime Light Remote Sensing in the Arabian Sea; Shanghai Ocean University: Shanghai, China, 2023; pp. 21–35. [Google Scholar]
- Tsuda, M.E.; Miller, N.A.; Saito, R.; Park, J.; Oozeki, Y. Automated VIIRS Boat Detection Based on Machine Learning and Its Application to Monitoring Fisheries in the East China Sea. Remote Sens. 2023, 15, 2911. [Google Scholar] [CrossRef]
- Kiyofuji, H.; Saitoh, S.-I. Use of nighttime visible images to detect Japanese common squid fishing areas and potential migration routes in the Sea of Japan. Mar. Ecol. Prog. Ser. 2004, 276, 173–186. [Google Scholar] [CrossRef]
- Wenyue, W. Spatio-Tempral Distribution of Fishery Production Intensity in the South China Sea Based on the Night-Time Images; The University of Chinese Academy of Sciences: Beijing, China, 2016; pp. 21–28. [Google Scholar]
- Xue, C.; Gao, C.; Hu, J.; Qiu, S.; Wang, Q. Automatic boat detection based on diffusion and radiation characterization of boat lights during night for VIIRS DNB imaging data. Opt. Express 2022, 30, 13024–13038. [Google Scholar] [CrossRef] [PubMed]
- Yamaguchi, T.; Asanuma, I.; Park, J.G.; Mackin, K.J.; Mittleman, J. Estimation of vessel traffic density from Suomi NPP VIIRS day/night band. In Proceedings of the OCEANS 2016 MTS/IEEE Monterey, Monterey, CA, USA, 19–23 September 2016; pp. 1–5. [Google Scholar]
- Huang, R.; Wu, W.; Yu, K. Building consistent time series night-time light data from average DMSP/OLS images for indicating human activities in a large-scale oceanic area. Int. J. Appl. Earth Obs. Geoinf. 2022, 114, 103023. [Google Scholar] [CrossRef]
- Zhao, Z.; Qiu, S.; Zhang, Y.; Yao, W.; Liu, Z.; Wang, X.; Shu, Z.; Wang, F.; Cheng, H.; Zhang, Y.; et al. Vessel Target Detection Method Based on an Improved CFAR Method in Nighttime Remote Sensing Images. IEEE Trans. Geosci. Remote Sens. 2024, 62, 4209213. [Google Scholar] [CrossRef]
- Lebona, B.; Kleynhans, W.; Celik, T.; Mdakane, L. Ship Detection Using Viirs Sensor Specific Data. In Proceedings of the 2016 Ieee International Geoscience and Remote Sensing Symposium (Igarss), Beijing, China, 10–15 July 2016; pp. 1245–1247. [Google Scholar]
- Li, J.; Cai, Y.; Zhang, P.; Zhang, Q.; Jing, Z.; Wu, Q.; Qiu, Y.; Ma, S.; Chen, Z. Satellite observation of a newly developed light-fishing “hotspot” in the open South China Sea. Remote Sens. Environ. 2021, 256, 112312. [Google Scholar] [CrossRef]
- Xing, Q.; Yu, H.; Wang, H.; Ito, S.; Chai, F. Mesoscale eddies modulate the dynamics of human fishing activities in the global midlatitude ocean. Fish Fish. 2023, 24, 527–543. [Google Scholar] [CrossRef]
- Seto, K.L.; Miller, N.A.; Kroodsma, D.; Hanich, Q.; Miyahara, M.; Saito, R.; Boerder, K.; Tsuda, M.; Oozeki, Y.; S., O.U. Fishing through the cracks: The unregulated nature of global squid fisheries. Sci. Adv. 2023, 9, eadd8125. [Google Scholar] [CrossRef] [PubMed]
- Levin, N.; Kyba, C.C.; Zhang, Q.; de Miguel, A.S.; Román, M.O.; Li, X.; Portnov, B.A.; Molthan, A.L.; Jechow, A.; Miller, S.D.; et al. Remote sensing of night lights: A review and an outlook for the future. Remote Sens. Environ. 2020, 237, 111443. [Google Scholar] [CrossRef]
- Elvidge, C.D.; Zhizhin, M.; Baugh, K.; Hsu, F.-C. Automatic Boat Identification System for VIIRS Low Light Imaging Data. Remote Sens. 2015, 7, 3020–3036. [Google Scholar] [CrossRef]
- Hassen, R.; Wang, Z.; Salama, M.M.A. Image sharpness assessment based on local phase coherence. IEEE Trans Image Process 2013, 22, 2798–2810. [Google Scholar] [CrossRef]
- Rohling, H. Radar Cfar Thresholding in Clutter and Multiple Target Situations. IEEE Trans. Aerosp. Electron. Syst. 1983, 19, 608–621. [Google Scholar] [CrossRef]
- Cao, C.; Bai, Y. Quantitative Analysis of VIIRS DNB Nightlight Point Source for Light Power Estimation and Stability Monitoring. Remote Sens. 2014, 6, 11915–11935. [Google Scholar] [CrossRef]
- Paolo, F.S.; Kroodsma, D.; Raynor, J.; Hochberg, T.; Davis, P.; Cleary, J.; Marsaglia, L.; Orofino, S.; Thomas, C.; Halpin, P. Satellite mapping reveals extensive industrial activity at sea. Nature 2024, 625, 85–91. [Google Scholar] [CrossRef] [PubMed]
- Elvidge, C.D.; Zhizhin, M.; Hsu, F.-C.; Baugh, K.E. VIIRS Nightfire: Satellite Pyrometry at Night. Remote Sens. 2013, 5, 4423–4449. [Google Scholar] [CrossRef]
- Elvidge, C.D.; Zhizhin, M.; Baugh, K.; Hsu, F.-C.; Ghosh, T. Methods for Global Survey of Natural Gas Flaring from Visible Infrared Imaging Radiometer Suite Data. Energies 2015, 9, 14. [Google Scholar] [CrossRef]
- Kraskov, A.; Stögbauer, H.; Grassberger, P. Estimating mutual information. Phys. Rev. E 2004, 69, 066138. [Google Scholar] [CrossRef]
- SCSPI. China Begins Fishing Moratorium in May, While Vietnamese Fishing Vessels Intensify Illegal Activities. 2020. Available online: http://www.scspi.org/zh/dtfx/1591200000 (accessed on 15 October 2024).
- Huang, Y. Consuming geopolitics and feeling maritime territoriality: The case of China’s patriotic tourism in the South China Sea. Political Geogr. 2022, 98, 102669. [Google Scholar] [CrossRef]
- Mitchell, M.D. The South China Sea: A Geopolitical Analysis. J. Geogr. Geol. 2016, 8, 14. [Google Scholar] [CrossRef]
- Runxi, S.; Teng, W. Overview of Illegal Fishing Activities by Vietnamese Fishing Vessels in the South China Sea in 2022. 2022. Available online: http://www.scspi.org/zh/dtfx/1687235456 (accessed on 15 October 2024).
- Han, Y.; Zhang, Y.; Liu, W.; Liu, C. Development Trends and Policies of Marine Fishing and Fisheries in Countries and Regions Surrounding the South China Sea. Word Agric. 2016, 1, 102–107. [Google Scholar]
- Zhang, H. Fisheries cooperation in the South China Sea: Evaluating the options. Mar. Policy 2018, 89, 67–76. [Google Scholar] [CrossRef]
- Hsiao, A. Opportunities for fisheries enforcement cooperation in the South China Sea. Mar. Policy 2020, 121, 103569. [Google Scholar] [CrossRef]
- Yugui, Z. Research on the Effects of China’s Summer Fishing Moratorium; Ocean University of China: Qingdao, China, 2009. [Google Scholar]
- Zou, J.; Jin, X.; Shan, X.; Ren, Y.; Chen, Y. Whether the summer fishing moratorium can improve the status of fisheries resources in the Yellow Sea and Bohai Sea. Heliyon 2024, 10, e38100. [Google Scholar] [CrossRef] [PubMed]
- Zou, J.W.; Wang, Q.; Huang, J.; Yang, B.; Pan, P. Evaluation of the Effectiveness of the Closed Season Fishing Ban in the Northern Continental Shelf Fisheries of the South China Sea in 2016. Fish. Sci. Technol. Inf. 2016, 43, 318–323. [Google Scholar]
- Yu, J.; Hu, Q.; Yuan, H.; Chen, P. Effect assessment of summer fishing moratorium in Daya Bay based on remote sensing data. South China Fish. Sci. 2018, 14, 1–9. [Google Scholar]
- SCSPI. Surge in Illegal Activities by Vietnamese Fishing Vessels in March in Hainan and the Entire South China Sea | Vietnamese Fishing Vessel Tracking and Monitoring Project Report (3). 2020. Available online: http://www.scspi.org/zh/dtfx/1585922607 (accessed on 15 October 2024).
- General Statistics Office. Statistical Summary Book of Viet Nam; Statistical Publishing House: Hanoi, Vietnam, 2020; pp. 285–325. Available online: https://www.nso.gov.vn/en/data-and-statistics/2021/07/statistical-summary-book-of-viet-nam-2020/ (accessed on 22 February 2025).
- General Statistics Office. Statistical Summary Book of Viet Nam; Statistical Publishing House: Hanoi, Vietnam, 2023; pp. 553–693. Available online: https://www.nso.gov.vn/en/default/2024/12/statistical-summary-book-of-viet-nam-2023/ (accessed on 22 February 2025).
- SCSPI. Persisting at High Levels: Illegal Fishing Activities by Vietnamese Vessels in the South China Sea in July. 2020. Available online: http://www.scspi.org/zh/dtfx/1596530374 (accessed on 15 October 2024).
- Lin, P.; Hu, J.; Zheng, Q.; Sun, Z.; Zhu, J. Observation of summertime upwelling off the eastern and northeastern coasts of Hainan Island, China. Ocean Dyn. 2016, 66, 387–399. [Google Scholar] [CrossRef]
- Wang, X.; Yu, J.; Li, Y.Z.; Chen, G.B.; Huang, M.F. The relationship between major upwelling and the upwelling fishing grounds in the South China Sea. Mar. Sci. 2013, 39, 131–137. [Google Scholar]
- Dan, L. Dilemmas and Solutions for Marine Environmental Cooperation in the South China Sea: Including a Rebuttal to Relevant Arbitration Issues in the South China Sea Arbitration Case. Foreign Aff. Rev. 2017, 34, 113–140. [Google Scholar]
- Dang, X.; Bai, Y.; Gong, F.; Chen, X.; Zhu, Q.; Huang, H.; He, X. Different Responses of Phytoplankton to the ENSO in Two Upwelling Systems of the South China Sea. Estuaries Coasts 2022, 45, 485–500. [Google Scholar] [CrossRef]
- Zhang, J.; Qiu, Y.; Chen, Z.; Zhang, P.; Zhang, K.; Fan, J.; Chen, G.; Cai, Y.; Sun, M. Advances in pelagic fishery resources survey and assessment in open South China Sea. South China Fish. Sci. 2018, 14, 118–127. [Google Scholar]
- SCSPI. Policy Brief: The First Joint Analysis Report on Fisheries Resources in the South China Sea. 2022. Available online: http://www.scspi.org/zh/dtfx/1664075772 (accessed on 15 October 2024).
- Cousido-Rocha, M.; Cerviño, S.; Alonso-Fernández, A.; Gil, J.; Herraiz, I.G.; Rincón, M.M.; Ramos, F.; Rodríguez-Cabello, C.; Sampedro, P.; Vila, Y.; et al. Applying length-based assessment methods to fishery resources in the Bay of Biscay and Iberian Coast ecoregion: Stock status and parameter sensitivity. Fish. Res. 2022, 248, 106197. [Google Scholar] [CrossRef]
Disclaimer/Publisher’s Note: The statements, opinions and data contained in all publications are solely those of the individual author(s) and contributor(s) and not of MDPI and/or the editor(s). MDPI and/or the editor(s) disclaim responsibility for any injury to people or property resulting from any ideas, methods, instructions or products referred to in the content. |
© 2025 by the authors. Licensee MDPI, Basel, Switzerland. This article is an open access article distributed under the terms and conditions of the Creative Commons Attribution (CC BY) license (https://creativecommons.org/licenses/by/4.0/).