Article

Predictive Benthic Habitat Mapping Reveals Significant Loss of Zostera marina in the Puck Lagoon, Baltic Sea, over Six Decades

Maritime Institute, Gdynia Maritime University, Roberta de Plelo 20, 80-548 Gdańsk, Poland
*
Author to whom correspondence should be addressed.
Remote Sens. 2025, 17(22), 3725; https://doi.org/10.3390/rs17223725 (registering DOI)
Submission received: 10 September 2025 / Revised: 10 November 2025 / Accepted: 13 November 2025 / Published: 15 November 2025

Highlights

What are the main findings?
  • Binary machine learning classification models (Random Forest, Support Vector Machine, and K-Nearest Neighbors) achieved 93.3% accuracy for Zostera marina presence/absence detection, while substrate-level classification (EUNIS Level 3) reached 86.7% accuracy; however, fine-scale habitat classifications (EUNIS Level 4/5) achieved only 43–62% accuracy due to severe class imbalance in training data, demonstrating that classification performance is fundamentally constrained by data representation rather than algorithmic complexity.
  • Object-based image analysis (OBIA) combined with Boruta feature selection identified geomorphometric variables (slope, aspect, and terrain ruggedness index) and optical features (airborne LiDAR intensity, and spectral bands) as the most significant discriminators for benthic habitat classification; ALB intensity, MBES backscatter, and DEM proved critical for substrate characterization, while geometric descriptors (roundness and compactness) enhanced finer-scale habitat discrimination.
What are the implications of the main findings?
  • Change detection analysis revealed catastrophic Zostera marina habitat loss in the Puck Lagoon of 84–99% over the 66-year period (1957–2023), with seagrass coverage declining from 61.15% of the study area to just 9.70% or 0.63% depending on the classification model; even accounting for seasonal phenological mismatch, corrected estimates indicate minimum 69% net loss, confirming severe ecosystem degradation and emphasizing the imperative for immediate conservation and restoration action at the landscape scale.
  • Future operational benthic habitat mapping programs must prioritize balanced sampling design with a minimum of 50–80 samples per rare habitat type, multi-temporal ground-truth campaigns rather than single-season surveys, and dynamic oceanographic predictors (temperature, light, and nutrients) to advance beyond the current capability limitations; this study establishes critical baselines and provides a reproducible methodology framework for analogous habitat monitoring in shallow nearshore environments globally.

Abstract

This research presents a comprehensive analysis of the spatial extent and temporal change in benthic habitats within the Puck Lagoon in the southern Baltic Sea, utilizing integrated machine learning classification and multi-sourced remote sensing. Object-based image analysis was integrated with Random Forest, Support Vector Machine, and K-Nearest Neighbors algorithms for benthic habitat classification based on airborne bathymetric LiDAR (ALB), multibeam echosounder (MBES), satellite bathymetry, and high-resolution aerial photography. Ground-truth data collected by 2023 field surveys were supplemented with long temporal datasets (2010–2023) for seagrass meadow analysis. Boruta feature selection showed that geomorphometric variables (aspect, slope, and terrain ruggedness index) and optical features (ALB intensity and spectral bands) were the most significant discriminators in each classification case. Binary classification models were more effective (93.3% accuracy in the presence/absence of Zostera marina) compared to advanced multi-class models (43.3% for EUNIS Level 4/5), which identified the inherent equilibrium between ecological complexity and map validity. Change detection between contemporary and 1957 habitat data revealed extensive Zostera marina loss, with 84.1–99.0% cover reduction across modeling frameworks. Seagrass coverage declined from 61.15% of the study area to just 9.70% or 0.63%, depending on the model. Seasonal mismatch may inflate loss estimates by 5–15%, but even adjusted values (70–94%) indicate severe ecosystem degradation. Spatial exchange components exhibited patterns of habitat change, whereas net losses in total were many orders of magnitude larger than any redistribution in space. These findings recorded the most severe seagrass habitat destruction ever described within Baltic Sea ecosystems and emphasize the imperative for conservation action at the landscape level. The methodology framework provides a reproducible model for analogous change detection analysis in shallow nearshore habitats, creating critical baselines to inform restoration planning and biodiversity conservation activities. It also demonstrated both the capabilities and limitations of automatic techniques for habitat monitoring.

1. Introduction

The Baltic Sea coastal ecosystems are some of the most vital and endangered marine ecosystems in Europe, with the Puck Lagoon on Poland’s northern coast being an important biodiversity hotspot containing protected seagrass beds and other valued benthic habitats [1,2]. This shallow sea basin, approximately 102.69 km2 in size with an average depth of 3.13 m, is bounded by the Hel Peninsula to the northwest and partially cut off from Puck Bay by the seafloor Seagull Sandbar to the southwest [2]. While ecologically significant, previously there has not been extensive high-resolution mapping of this area to date, which limits our understanding of habitat distribution, seasonal variation, and ecosystem health. The present study fills this knowledge gap through an integrated methodology for benthic habitat mapping by combining remote sensing tools with machine learning classification techniques [3].
Benthic habitats are distinct ecological units located on or within the seabed, where the physical characteristics of the substrate—such as sediment type, bathymetry, and hydrodynamic energy—interact with characteristic biological assemblages. These assemblages consist of organisms that attach to, burrow into, or move across the seafloor, collectively forming habitat classes that are both environmentally and ecologically significant [4]. Benthic habitat mapping is a significant methodology of marine ecosystem assessment, providing spatial information on seafloor character and associated biota of immense value to conservation planning and resource management [3]. New technologies have enabled more comprehensive and accurate mapping tools that integrate various sources of information like airborne bathymetric LiDAR (ALB), multibeam echosounder (MBES), satellite-derived bathymetry (SDB), and high-resolution aerial imagery [2,5]. These technologies provide ancillary data on bathymetry, substrate, and habitat distribution, allowing more complete and accurate characterization of habitat than has been achieved with any one method alone [6].
The integration of object-based image analysis (OBIA) with machine learning algorithms has emerged as a promising technique for benthic habitat classification because it enables automated processing of high-level remote sensing datasets and improves classification accuracy [7]. As opposed to pixel-based approaches, OBIA divides imagery into semantics-based objects—groups of joined pixels with similar characteristics—so that features accounting for not only spectral characteristics but also shape, texture, and spatial context can be obtained [8]. This approach is an alternative to pixel-based classification, which, despite its limitations, may enhance the accuracy of habitat mapping, particularly in complex nearshore environments [9].
Of particular interest in the Puck Lagoon are the conditions of the Zostera marina (eelgrass) meadows, which provide vital ecosystem functions like nursery habitat, sediment stabilization, and sequestration of carbon [10]. Historical records indicate that the Puck Lagoon contained extensive eelgrass beds to depths of 10 m in the 1950s, but these have undergone catastrophic collapse in later decades [11]. While the “wasting disease” caused by the slime mold Labyrinthula zosterae devastated eelgrass beds around the world in the 1930s [12], the Puck Lagoon was probably protected by its low salinity, only to later fall victim to anthropogenic stresses like eutrophication and pollution [13].
The EUNIS (European Nature Information System) habitat classification scheme is a hierarchical system of habitat categorization for standardized mapping and evaluation of European habitats, including both terrestrial and marine environments [14]. The classification system encompasses abiotic elements (e.g., depth, substrate, and energy levels) and biotic assemblages, allowing habitats to be described at varying levels of detail [15,16]. It operates through several levels: at Level 3, habitats are identified primarily by broad physical criteria, such as dominant substrate type (e.g., sand or gravel); Level 4 further distinguishes biotopes based on specific ecological features; and Level 5 focuses on characteristic biological assemblages, reflecting unique community compositions associated with particular environmental settings. This granularity enables researchers and regulatory agencies to conduct detailed habitat assessments and facilitates effective cross-region comparisons. Notably, the regulatory importance of EUNIS underpins much of the EU’s marine habitat monitoring and reporting, as it is referenced in directives such as the Habitats Directive (92/43/EEC) and the Marine Strategy Framework Directive (2008/56/EC), where it supports the identification, protection, and management of marine biodiversity. Application of EUNIS classification to benthic habitat mapping of the Puck Lagoon provides a uniform scheme to compare against other marine environments within Europe and to evaluate the habitats.
Based on the overall approach described in the article, some of the key research questions were formulated:
  • How reliable are different machine learning algorithms (Random Forest [17], Support Vector Machine [18], and K-Nearest Neighbors [19]) for the classification of benthic habitats at the various levels of the EUNIS classification hierarchy, and what influences their performance?
  • Which are the most significant environmental predictors and derived features for benthic habitat classification, as determined by the Boruta [20] feature selection algorithm, and how does their significance vary across classification scenarios?
  • What are the capabilities and limitations of object-based image analysis (OBIA) for benthic habitat mapping in the Puck Lagoon when applied to heterogeneous remote sensing datasets, and how do object-based geometric features contribute to habitat classification accuracy?
  • How have the area and distribution of Zostera marina meadows in the Puck Lagoon changed since 1957, and what are the patterns of habitat loss, gain, and spatial redistribution exhibited by change detection analysis?
  • How do class imbalance and sampling strategy influence benthic habitat classification accuracy, and how do temporal sampling strategies rank compared to spatial sampling density for monitoring certain types of habitats?
  • What are the ecosystem implications of the observed distributional shifts in Zostera marina on Baltic Sea ecosystem function, and what are the management actions necessary to reduce habitat loss?
Through these research questions, the study gains a comprehensive picture of methodological approaches to mapping benthic habitats and of the ecological functioning and condition of the Puck Lagoon system, with an emphasis on the ecologically important Zostera marina beds that have suffered a disastrous decline over the past six decades.
The hierarchical classification framework adopted in this study was designed to simultaneously assess the operational capabilities of machine learning approaches at different ecological and taxonomic scales while explicitly identifying the data and methodological requirements that must be met before advancing toward finer-scale classifications. Following standard practice in remote sensing accuracy assessment, we adopted the interpretation that classification models with Cohen’s kappa values ≥ 0.4 represent results suitable for scientific and management applications, while those below this threshold indicate exploratory findings that highlight critical methodological limitations requiring resolution [21,22]. Accordingly, primary findings presented herein derive from the EUNIS Level 3 classification and binary Zostera marina presence/absence classification, both of which meet this operational threshold. Fine-scale classifications (EUNIS Level 4–5 and dominant species) were retained in the analysis to transparently demonstrate the current state-of-the-art capabilities and to specify the particular challenges and data requirements that must be addressed to operationalize fine-scale benthic habitat mapping.

Related Work

Recent advances in benthic habitat mapping have increasingly emphasized the value of integrating multiple remote sensing data sources. The use of airborne bathymetric ALB, MBES, SDB, and high-resolution aerial/multispectral imagery has become standard practice in coastal zone research. Studies by Agrafiotis et al. (2024), Janowski et al. (2025) and Janowski et al. (2021) have demonstrated that multi-source data fusion consistently outperforms single-source approaches, with integrated bathymetric datasets providing complementary information for substrate characterization [23,24,25]. The complementary nature of optical (ALB intensity and spectral reflectance) and acoustic (MBES backscatter) properties enables more robust discrimination of sediment types, particularly in shallow nearshore environments where traditional approaches are limited.
The combination of OBIA with machine learning algorithms has emerged as a dominant paradigm in seabed classification. OBIA segmentation approaches provide semantic rather than pixel-based units, capturing habitat patch morphology and texture information. Recent studies have successfully applied OBIA with Random Forest, Support Vector Machine (SVM), and K-Nearest Neighbors (KNN) classifiers to MBES bathymetry and backscatter data, achieving accuracies ranging from 87.5% to 94% [24]. The integration of geomorphometric features—including slope, aspect, terrain ruggedness index (TRI), and derived bathymetric variables—has been shown to be particularly effective for habitat discrimination at multiple classification levels [26].
Feature selection algorithms, particularly Boruta, have become increasingly prominent in remote sensing-based habitat mapping. Unlike traditional dimensionality reduction approaches such as Principal Component Analysis (PCA), Boruta preserves the interpretability of original environmental variables while identifying all relevant predictors [20]. Recent applications in geospatial analysis demonstrate that Boruta-selected features consistently improve model performance and ecological interpretability. The algorithm’s wrapper approach, based on Random Forest importance measures, has proven particularly effective for handling high-dimensional remote sensing datasets with complex, non-linear relationships between environmental variables and ecological outcomes.
The European Nature Information System (EUNIS) has established itself as the standard hierarchical framework for benthic habitat classification across European marine regions, including the Baltic Sea [14]. Recent studies utilizing EUNIS classification at multiple levels have identified fundamental trade-offs between classification detail and mapping accuracy [27,28]. Level 3 classifications (substrate-based) typically achieve Cohen’s kappa coefficients ≥ 0.4, suitable for scientific and management applications, while Level 4 and Level 5 classifications face significant challenges from class imbalance and environmental overlap. The Baltic Sea-specific applications of EUNIS have been supported by initiatives such as HELCOM’s Underwater Biotope and Habitat Classification (HUB), which adapts the broader European scheme to regional conditions.
Comparative studies evaluating multiple machine learning algorithms for benthic classification have revealed consistent performance hierarchies. Random Forest algorithms generally perform better on moderate-complexity multi-class problems, while Support Vector Machines excel at binary classification tasks [7,29]. K-Nearest Neighbors exhibits competitive performance in certain classification scenarios [30]. These patterns reflect fundamental machine learning principles regarding the relationship between task complexity, training sample size, and generalization capability.
Remote sensing-based monitoring of seagrass meadows has been particularly active in recent years, driven by widespread ecosystem degradation and conservation imperatives [31,32]. Studies from both Atlantic and Baltic coastal regions have employed diverse remote sensing platforms (satellites, aerial photography, and UAVs) combined with machine learning classifiers to detect and map Zostera marina distribution. Change detection analysis comparing historical and contemporary seagrass coverage has revealed substantial habitat losses in many regions [33,34]. Methodological challenges specific to seagrass monitoring include phenological variations affecting temporal comparisons, spectral confusion with macroalgae, and depth-dependent light attenuation limiting detection in deeper waters.
A critical emerging theme in benthic habitat classification is the severe constraint imposed by class imbalance [3]. Ecological systems characteristically follow power-law distributions where few habitat types dominate while many remain rare. Recent studies have documented how extreme class imbalance can theoretically reduce multiple class classification problems to effective 2–3 class recognition regardless of algorithm selection [35]. This finding shifts focus from algorithmic optimization toward fundamental improvements in sampling strategy, with recommendations including spatially balanced designs, adaptive oversampling of rare habitats, and multi-temporal campaigns to capture habitat variability [36,37].
Recent advances in deep learning have introduced novel approaches to seabed mapping, including convolutional neural networks (CNNs) for image classification, transfer learning frameworks leveraging pre-trained models, and multi-task networks simultaneously predicting bathymetry and habitat class [38]. Studies employing deep learning on multibeam backscatter mosaics and multispectral data have achieved accuracies comparable to or exceeding traditional machine learning approaches while providing automatic feature extraction capabilities [39]. However, these methods often require substantially larger training datasets than classical approaches.
Recent developments in data fusion protocols have addressed systematic artifacts arising from multi-source integration, particularly striping artifacts in backscatter intensity caused by differences in sensor calibration or environmental conditions [40]. Advanced preprocessing workflows incorporating radiometric corrections, angular response analysis (ARA), and feathering-based blending have been developed to minimize artificial class boundaries while preserving legitimate habitat distinctions [41]. These technical advances have substantially improved the operational feasibility of multi-source benthic mapping projects.

2. Materials and Methods

2.1. Study Area

2.1.1. Geographic Setting and Geological Context

The Puck Lagoon is located in the southern Baltic Sea on Poland’s northern coast (54°38′N–54°46′N, 18°23′E–18°35′E), forming part of the larger Gulf of Gdansk system. This semi-enclosed coastal water body represents a post-glacial lagoon formed during the late Pleistocene and Holocene periods through complex interactions of sea-level changes, sediment deposition, and coastal barrier development [42]. The lagoon is bounded by the Hel Peninsula spit to the northwest and is partially separated from the outer Puck Bay by the submerged Seagull Sandbar (Ryf Mew) to the southwest [43,44].
The geological foundation consists of Quaternary deposits overlying Paleozoic and Mesozoic bedrock. Surface sediments are predominantly composed of fine to medium marine sands with varying admixtures of silt and organic matter, reflecting the complex depositional history influenced by Baltic Sea transgression and regression cycles [1]. Post-glacial isostatic adjustment continues to influence the regional geology, with ongoing land uplift rates of approximately 1–2 mm/year [45].
The Puck Lagoon encompasses an area of 102.69 km2 with highly variable bathymetric characteristics reflecting its shallow-water nature and complex geomorphology [2]. Based on our integrated bathymetric measurements from ALB, MBES, and satellite-derived bathymetry, the lagoon exhibits the following morphometric parameters: mean depth—3.29 m (±1.6 m standard deviation); minimum depth—0.18 m (nearshore and sandbar areas); maximum depth—13.12 m (navigation approach runway to Kuźnica); and volume—approximately 352 million m3.
The main geomorphologic bedforms located in the area are ripple structures, shore-adjacent features (like sandbanks and sloping transitional areas), undulating seafloor, current-related bedforms, deltaic features, relict/erosional forms, organic-rich areas, flat seafloor, and anthropogenic features [46]. The main sedimentological zones include fine to medium sands, silty sands and sandy silts, and medium to coarse sands. The sediments are generally well sorted and rarely enriched in organic content.

2.1.2. Hydrodynamic Environment

The Puck Lagoon operates as a microtidal environment with complex circulation patterns influenced by wind forcing, density gradients, and restricted exchange with adjacent water bodies [47]. While salinity is a defining feature of the brackish Baltic environment (average ~7.3 PSU), temperature exhibits strong seasonal variation, ranging from about 1.4 °C in winter to 19 °C in summer [1].
The Puck Lagoon represents a significant biodiversity hotspot within the Baltic Sea ecosystem, supporting protected seagrass meadows (Zostera marina), diverse macroalgal communities, and serving as habitat for commercially important fish species. The shallow depths and diverse substrate types create optimal conditions for benthic habitat diversity, making it an ideal natural laboratory for testing advanced remote sensing and machine learning approaches to habitat mapping [24].
The lagoon is designated as part of the Natura 2000 network (PLH220032 “Zatoka Pucka i Półwysep Helski”) under the EU Habitats Directive, with specific protection measures for seagrass beds and associated marine ecosystems [48]. Current environmental pressures include historical eutrophication effects (although improving), recreational boating activities, and climate change impacts on water temperature and stratification patterns [13].

2.2. Data Acquisition and Processing

2.2.1. Remote Sensing Data Collection

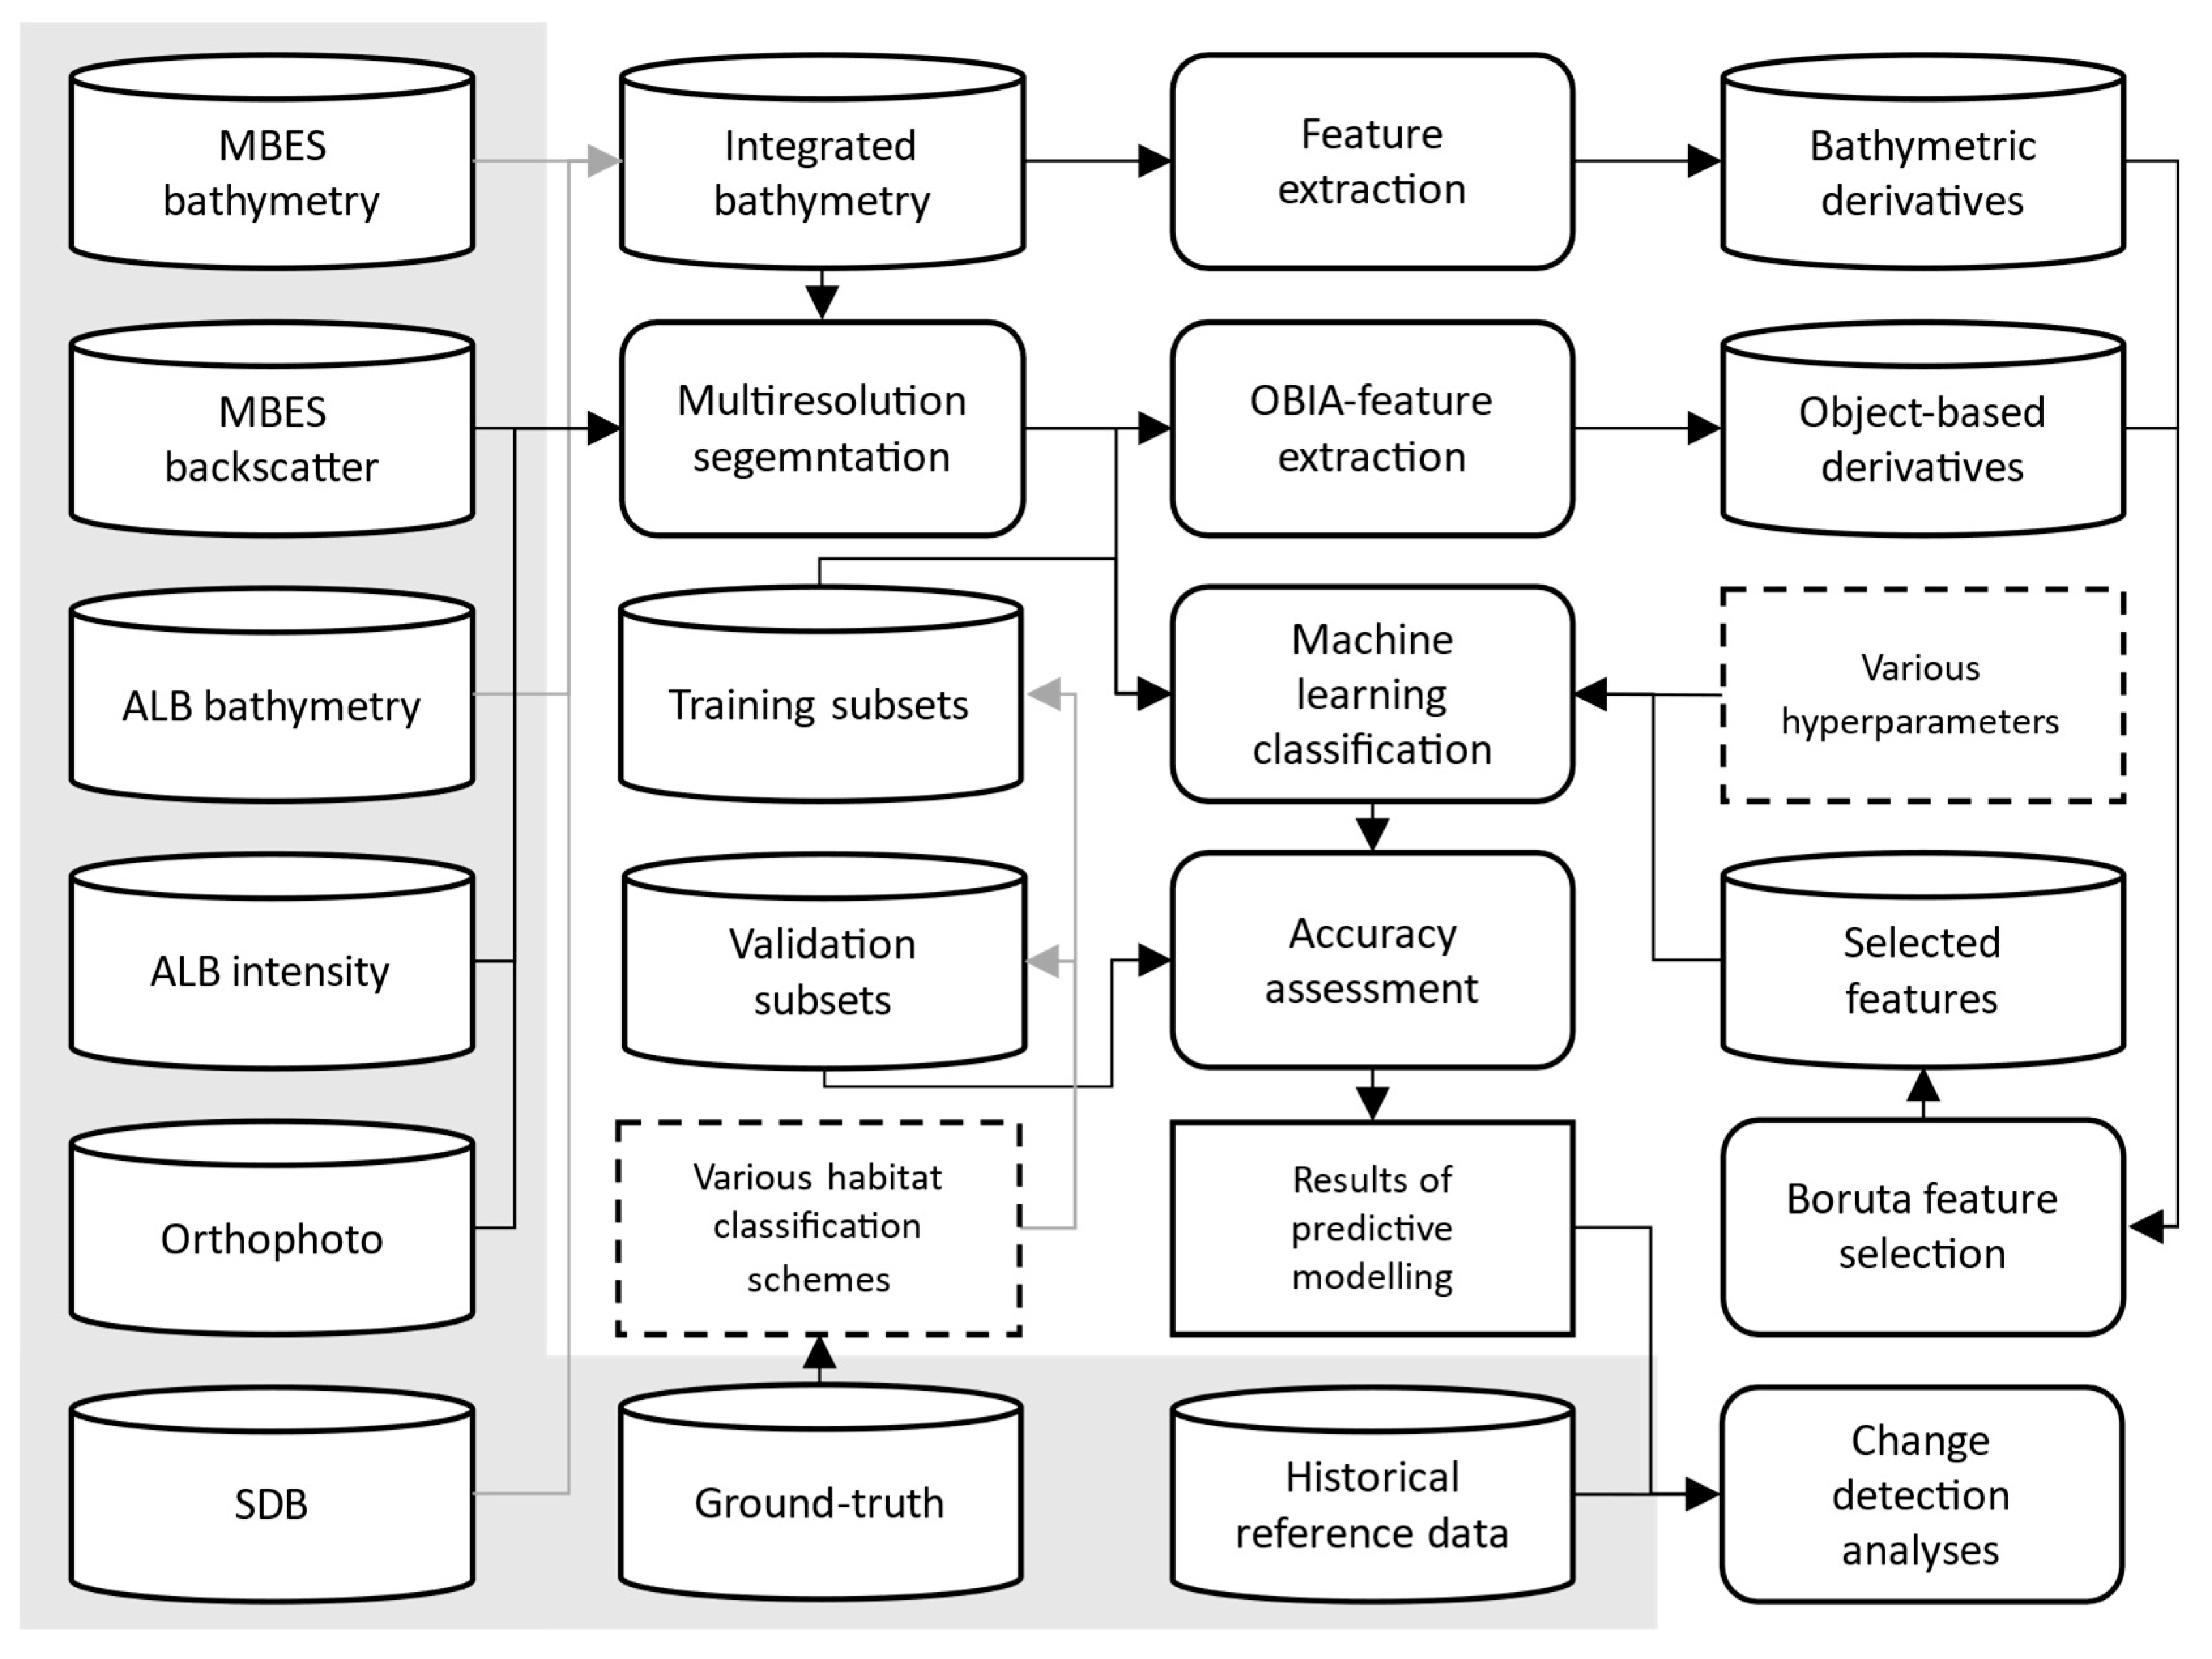
Multiple remote sensing technologies were utilized to generate comprehensive datasets for benthic habitat mapping (Figure 1). Data acquisition took place during three field campaigns conducted on the following dates: 27 February–2 March 2022, 22 March–22 June 2022, and 7–10 March 2025. Detailed information regarding the data acquisition process—including the specific measuring instruments used, data management protocols, and technical validation of bathymetric results in accordance with IHO standards—can be found in a previous study [2]. Below, we provide a general overview of all remote sensing sources employed for data collection in the Puck Lagoon. All the datasets were registered within the ETRS89/UTM zone 34 N and the PL-EVRF2007-NH vertical datum.
Airborne bathymetric LiDAR (ALB) obtained high-resolution bathymetric data using an airborne LiDAR system (Riegl, Horn, Austria) able to penetrate shallow water to measure seafloor depth and properties. One of the main features of the system is the emission of green and red laser pulses that have different properties regarding penetration of the water column. While red pulse was completely absorbed in the sea surface, green laser pulses penetrated the water column and returned from the seafloor, providing both bathymetric measurements and intensity measurements that are indicative of substrate properties [49]. Accompanying high-resolution aerial photography was taken to generate orthophotography maps of the study area, providing visual information about shallow benthic habitats. The imagery was processed to eliminate geometric distortions and georeferenced to align with other spatial datasets [2].
ALB bathymetric and intensity measurements are most effective in clear-water conditions due to the green laser’s sensitivity to suspended sediments. In this study, survey dates were selected during periods of minimal turbidity (Table 1), and water transparency exceeded 2 m Secchi depth, ensuring adequate ALB penetration to the maximum seagrass depths (~10 m).
The MBES system was calibrated following standard procedures to ensure accurate backscatter measurements, which provide information about seafloor hardness and sediment characteristics [50]. Multibeam echosounder (MBES) systems were employed for seafloor mapping, simultaneously collecting bathymetric data and backscatter intensity.
MBES backscatter and ALB intensity data provide complementary substrate information: while MBES backscatter characterizes seafloor acoustic reflectivity and roughness across the full depth range, ALB intensity delivers optical reflectance measurements in shallow, clear-water areas. The combined use of both datasets enhances sediment classification by integrating acoustic and optical signatures, particularly in nearshore zones where beam-angle limitations reduce MBES coverage.
Satellite-derived bathymetry (SDB) was generated from 4-Band SPOT 6 satellite imagery to derive bathymetric information for areas where direct measurements were challenging [51]. The SDB methodology employed a Random Forest (RF) approach to estimate water depths from the spectral characteristics of the imagery [2].

2.2.2. Data Processing and Integration

The preprocessing and validation workflow for the Puck Lagoon study involved multiple data sources and specialized software [2]. For LiDAR data, the steps included trajectory alignment, refraction correction, surface fitting, hierarchical filtering, and vegetation removal, using tools like OPALS, RiHydro, Riegl suite, CloudCompare 2.13.2, and GlobalMapper. Corrections addressed beam refraction and systematic errors, while validation showed a mean trajectory deviation of 0.0647 m.
Aerial photogrammetry employed Structure-from-Motion and Multi-View Stereo, with machine learning-based refraction correction (DepthLearn) and orthorectification in Agisoft Metashape 1.8.1. Validation achieved 1.19 px reprojection error, 2.97 cm camera error, and reduced bathymetric RMSE from 0.956 m to 0.420 m.
For multibeam echosounder (MBES) data, preprocessing included outlier removal, line matching, and manual cleaning, using Beamworx Autoclean 1.3, QINSy 8.18.6, and FMGT 7.11.2. Corrections involved radiometric and angular adjustments, with validation confirming 99.83% compliance with IHO S-44 standards. Satellite-derived bathymetry (SDB) used SPOT 6 imagery and Random Forest regression trained on ALB and SBES depths, achieving RMSE of 0.498 m and R2 of 0.917.
All remotely sensed datasets were processed and integrated into a shared spatial context. The SDB, ALB, and MBES datasets were merged to create a seamless Digital Elevation Model (DEM) of the seafloor. Integration was achieved in the SAGA GIS 9.6.1 software using the Mosaicking routine with the following parameters: feathering of overlap regions, blending distance of 100, blending boundary for valid data cells, and the regression option for match to create a continuous bathymetric surface [2]. During mosaicking of ALB intensity and MBES backscatter, overlapping flight lines and sonar swaths often exhibit slight calibration and environmental discrepancies that result in linear seams or striping artifacts. These artifacts appear as abrupt intensity shifts unrelated to substrate characteristics, and if uncorrected, can induce artificial sharp class boundaries in subsequent OBIA classification. To mitigate these effects, a feathering distance of 100 m and regression-based bias correction were applied, but residual discontinuities remained. Awareness of these artifacts is important, as they may lead the classifier to detect non-ecological boundaries.
Bathymetric derivatives, including slope [52], aspect [52], curvature [52], and terrain ruggedness index (TRI; Riley et al. [53]), were calculated in the SAGA GIS software from the integrated DEM. These geomorphometric features provide information about seafloor complexity and habitat structure that is relevant for benthic species distribution [54]. The overall methodological flowchart of all the processes used in this study is provided in Figure 2.

2.3. Ground-Truth Data Collection

2.3.1. Field Sampling Strategy

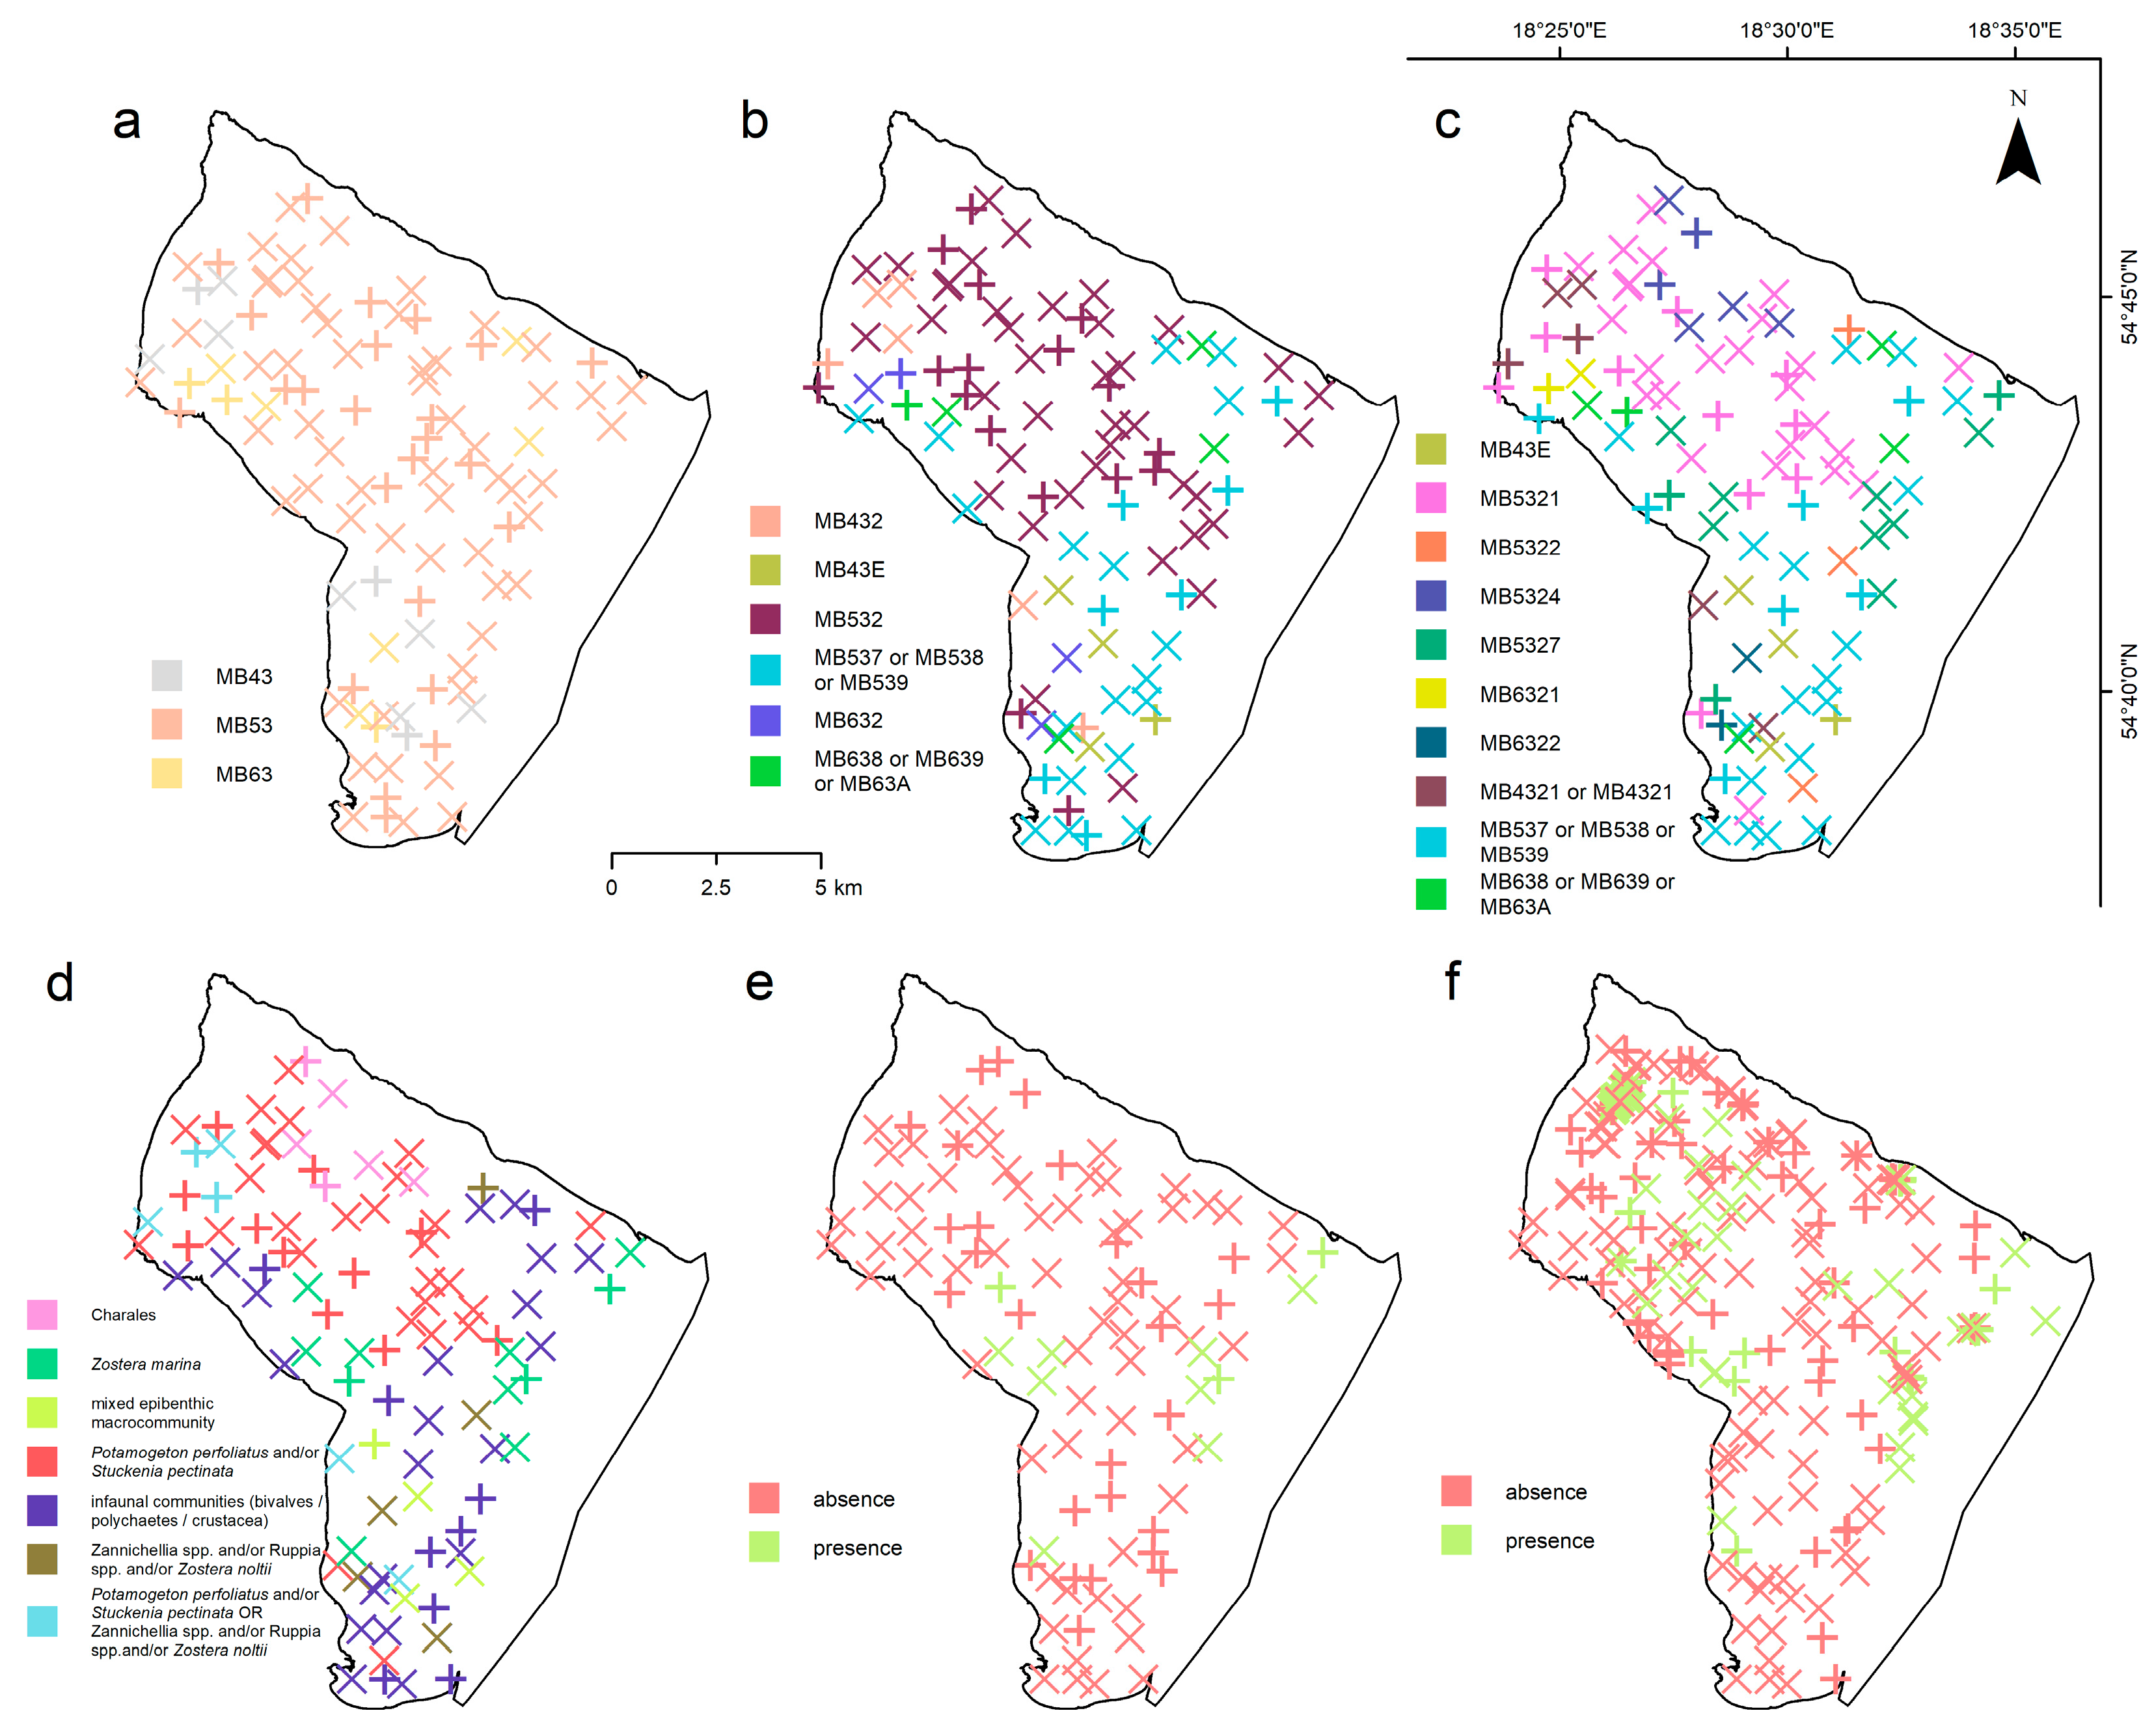
The main ground-truth (GT) dataset used in this study (100 samples in total) was collected from the IMOROS 2 research vessel during 21–24 April 2023. The sampling strategy followed a stratified random approach to ensure adequate representation of different habitat types and environmental properties (Figure 3). For the specific task of modeling Zostera marina meadows, in one modeling scenario, we also added ground-truth samples from the “Zostera—Restitution of key elements of the inner Puck Bay ecosystem” project that were taken in the years 2010–2015 (https://www.iopan.gda.pl/projects/Zostera/index-pl.html (accessed on 1 September 2025)).
Sampling points were distributed across the study area based on a preliminary analysis of bathymetric and backscatter data, and satellite-derived bathymetry to capture the range of potential habitat types. Sediment samples were collected using a Van Veen grab sampler for sediment characterization and biological assessment. Visual sampling using a GoPro Hero 11 (GoPro, Inc., San Mateo, California, USA) underwater camera mounted on an in-house-developed tripod was employed to document epibenthic communities and vegetation cover, particularly for Zostera marina meadows. Initial characterization of the sediment samples was performed using standard sieve analysis. For samples containing more than 5% of material finer than 0.063 mm, a combined sieve and hydrometer method was applied to ensure accurate particle-size distribution. All the laboratory procedures were conducted in accredited facilities of the Offshore Geotechnics Department at the Maritime Institute, Gdynia Maritime University, in full compliance with PN-EN ISO 17892-4:2017-01 standard. Biological samples were identified to the lowest possible taxonomic level, with special attention to habitat-forming species and dominant taxa.

2.3.2. Habitat Classification Scheme

Benthic habitats were classified according to the European Nature Information System (EUNIS) habitat classification scheme, which provides a hierarchical framework for habitat categorization (Table 2). EUNIS Level 3 represents broad habitat types based on substrate characteristics such as MB43, MB53, and MB63. EUNIS Level 4 provides a more detailed habitat classification incorporating biological communities. EUNIS Level 4/5 offers fine-scale habitat classification with specific biological assemblages. Because habitats at higher classification levels often comprise complex assemblages of coexisting species, our visual assessment of benthic communities occasionally did not allow for precise identification at the EUNIS Level 5 (see Table A1). In such cases, we used the logical connector “OR” to indicate possible species alternatives. When even this was not feasible, we assigned the habitat to the broader EUNIS Level 4 category. Therefore, the highest EUNIS classification level in this study is marked as 4/5.
It is important to note that the EUNIS classification scheme provides a pan-European typology, which in some regions may be more general than locally adopted habitat classifications. For example, in the southern Baltic Sea, certain species included at Level 5, such as Zostera noltii, do not actually occur, although they are part of the general European classification. Similarly, in some national typologies (e.g., for Polish coastal waters), habitat classes may reflect finer-scale distinctions tailored to local conditions, whereas EUNIS retains broader categories for comparability across countries. This reflects the trade-off between maintaining a harmonized system applicable across Europe and accounting for regional ecological differences.
For the following steps, we annotated the GT samples, separating them into EUNIS 3/4/5 levels representing a traditional supervised machine learning classification approach, where EUNIS habitat categories serve as discrete class labels for standard feature-based classification using remote sensing and bathymetric variables. Moreover, we compared it with the other approach, representing environmental descriptors and binary classification for Zostera marina seagrass beds. The concept of predictive benthic habitat modeling was brought forth in technical reports produced by EMODnet research groups [15,16]. Based on those reports, habitat was defined as a combination of a number of environmental descriptors. For the Baltic Sea area, the descriptors used for the EUNIS Level 3 were energy zone, biological zone, salinity level, and sediment type. In order to summarize benthic habitats on the higher levels, the other descriptor of dominant habitat species for this study had to be determined. In this way, the other classification approach included dominant species descriptors based on the dominant species or assemblages present, such as Zostera marina, Potamogeton perfoliatus/Stuckenia pectinata, and infaunal communities. The other, binary classification, specifically focused on the presence or absence of Zostera marina seagrass beds, was also implemented. The maps provided in Figure 3 show all the approaches of GT sampling, including their separation into training and test subsets.

2.4. Object-Based Image Analysis (OBIA) and Machine Learning Classification

2.4.1. Segmentation of Remote Sensing Datasets and Extraction of Object-Based Features

All machine learning classification in this study was performed using an object-based image analysis (OBIA) approach in the eCognition Developer 10.4 software by Trimble company. Unlike traditional pixel-based methods, OBIA segments the input imagery and remote sensing datasets into meaningful objects—groups of adjacent pixels with similar spectral, spatial, and contextual properties. This segmentation process allows for the extraction of features that describe not only the spectral characteristics of each object but also its shape, texture, and spatial relationships, thereby addressing the limitations of pixel-based classification and potentially improving the accuracy of habitat mapping [25].
The delimitation of images was conducted using a multiresolution segmentation algorithm, where parameters such as scale, shape, and compactness were optimized to best delineate benthic habitat features [8,9]. In this study, multiresolution segmentation was used on all the primary features (integrated bathymetry, MBES backscatter, LiDAR intensity, and orthophotomap) with the following settings: scale—42; shape—0.1; and compactness—0.5.
Each resulting image object was then characterized by a suite of features derived from both the underlying remote sensing data and the geometric properties of the objects themselves. In addition to standard geomorphometric textural features, a variety of object-based features were calculated, including asymmetry, border index, elliptic fit, rectangular fit, shape index, compactness, and roundness. The border index quantifies the complexity of an object’s perimeter, while the elliptic fit measures the similarity of an object to an ideal ellipse. The shape index describes the smoothness or irregularity of the object’s boundary, and roundness evaluates how closely the object resembles a perfect circle. Other features, such as compactness, rectangular fit, and main direction, were also considered to capture additional aspects of object geometry.
For each object, zonal statistics including mean geomorphometric and bathymetric variables were computed, enabling the integration of multi-source data at the object level. The resulting feature set, combining spectral, textural, and geometric descriptors, was used as input for the machine learning classification algorithms.

2.4.2. Feature Selection

The Boruta algorithm was employed for selecting relevant features to find the most important variables per classification task. Unlike traditional feature selection methods that aim to find minimal optimal feature sets, Boruta identifies all the variables that are significantly related to the target variable, making it particularly valuable for understanding complex ecological relationships in habitat classification. The Boruta algorithm is an all-relevant feature selection algorithm that identifies which features are significantly related to the classification target by comparing with randomly permuted shadow features [20,55].
The algorithm works by iteratively training Random Forest models on extended datasets that include both original features and their randomly shuffled copies (shadow features). For each iteration, variable importance scores are calculated using the Random Forest’s built-in importance measure (mean decrease in accuracy). Features that consistently score higher than the maximum importance of shadow features across multiple iterations are confirmed as relevant, while those scoring consistently lower are rejected. The statistical significance is determined using a two-tailed binomial test, ensuring robust feature selection that accounts for the stochastic nature of Random Forest [56].
We selected Boruta over alternative dimensionality reduction approaches such as Principal Component Analysis (PCA) for several methodologically important reasons. First, Boruta preserves the interpretability of original environmental variables, allowing for direct ecological interpretation of results—a crucial requirement for habitat mapping applications where understanding environmental drivers is as important as classification accuracy. In contrast, PCA creates synthetic principal components that are linear combinations of original features, making ecological interpretation challenging. Second, PCA assumes linear relationships between features and may eliminate small but ecologically significant predictors that contribute little to overall variance but are important for habitat discrimination. Third, as an unsupervised method, PCA does not consider target habitat classes and may retain irrelevant variance while discarding discriminative information relevant for classification tasks.
Recent applications of Boruta in seabed mapping have demonstrated its effectiveness for handling the complex, multivariate nature of marine environmental data. Trzcinska, Janowski, Nowak, Rucinska-Zjadacz, Kruss, Schneider von Deimling, Pocwiardowski, and Tegowski [26] successfully applied Boruta for spectral feature selection in multibeam echosounder-based seafloor mapping, while Ilich et al. [57] and Nemani et al. [58] employed the method for benthic habitat mapping, confirming its suitability for marine habitat classification tasks. The method’s statistical robustness through comparison with shadow features provides reliable feature selection that is particularly valuable when dealing with class imbalance issues common in habitat mapping datasets.
In our study, the Boruta algorithm was run in R (programming language) using the “Boruta” package for feature importance calculation. In every classification scenario, like EUNIS 3, EUNIS 4, EUNIS 4/5, dominant species description, and presence/absence of Zostera marina, the algorithm cross-evaluated the importance of all the available features and chose those that overperformed random features. The selected features varied by classification context and included bathymetric derivatives such as slope, aspect, and TRI; remote sensing factors such as ALB intensity and MBES backscatter; object-based features such as roundness; and spectral information in the RGB bands of orthophoto data.

2.4.3. Machine Learning Classification

Multiple supervised machine learning algorithms were implemented and compared for habitat classification. K-Nearest Neighbors (KNN) represents a non-parametric method that classifies samples based on the majority class among their K-Nearest Neighbors in feature space [19]. Different values of k were tested to optimize classification performance. Bayes classifier calculates posterior class probabilities using Bayes’ theorem under the assumption of conditional independence between predictor variables. It is one of the simplest machine learning classifiers to implement, as it does not require hyperparameter tuning.
Classification and Regression Trees (CART) is a non-parametric, decision-tree algorithm that recursively divides the feature space into binary nodes based on the Gini impurity criterion, resulting in an explicit, readily interpretable tree structure [59]. In this study, various values for the number of trees and tree depth were tested within the eCognition 10.4 software environment. Random Forest (RF) works as an ensemble learning method that constructs multiple decision trees during training and outputs the class that is the mode of the classes from individual trees [17]. The number of trees and tree depth were optimized through cross-validation. Support Vector Machine (SVM) serves as a supervised learning algorithm that finds the optimal hyperplane to separate classes in feature space [18]. We tested mainly radial basis function and its parameters, like C and gamma, to optimize classification performance. Since the eCognition software only allows manual adjustment of key hyperparameters for its built-in classifiers, we manually evaluated over 350 hyperparameter combinations across multiple classifiers (Table 3).
Two modeling approaches were implemented throughout the study: Model 1 utilized classification using only the features selected by the Boruta algorithm. Model 2 employed classification using all the primary remote sensing features regardless of the feature selection results.
The validation scheme employed stratified holdout validation, with 70% of the ground-truth samples used for training and 30% reserved for independent testing. This approach was applied consistently across all 350+ hyperparameter combinations tested. While k-fold cross-validation was not implemented due to software constraints within eCognition Developer 10.4, the holdout approach ensured unbiased performance assessment across habitat classes.

2.5. Accuracy Assessment

The performance of the classification models was evaluated using a comprehensive accuracy assessment framework. A portion of the ground-truth data, approximately 30%, was withheld from model training for independent validation. Confusion matrices were generated for each classification scenario and modeling approach to evaluate the correspondence between the predicted and observed habitat classes [29].
Multiple accuracy metrics were calculated to provide a comprehensive assessment of classification performance [60]. Overall accuracy represents the proportion of correctly classified samples across all the classes. Cohen’s kappa serves as a measure of agreement that accounts for the possibility of chance agreement [21]. Class-specific metrics, including precision (user’s accuracy), recall (producer’s accuracy), and F1-score, were calculated for each habitat class [61,62]. Operational suitability was determined using established interpretation thresholds: Cohen’s kappa values ≥ 0.4 indicate results suitable for scientific research and management applications, while values < 0.3 represent results unreliable for operational deployment [21,22]. This threshold-based interpretation guided the classification of the results as either operationally defensible (EUNIS Level 3, binary Zostera) or exploratory (EUNIS Level 4–5, dominant species), ensuring transparency regarding which outputs can inform conservation decisions and which highlight methodological limitations and future research needs. The performance of different machine learning algorithms and modeling approaches was compared to identify the optimal classification strategy for each habitat classification scenario.
It is important to note that overall accuracy has significant limitations when applied to imbalanced datasets, as encountered in this study. With severely uneven class distributions, overall accuracy can appear misleadingly high when classifiers achieve accuracy simply by predicting the majority class, while providing a poor representation of the actual class distribution and failing to classify minority classes. This limitation is particularly relevant given the extreme class imbalances observed in our datasets, where dominant classes (e.g., MB5321: 36 samples; MB537/538/539: 26 samples) overwhelmed minority classes (e.g., MB4322: 1 sample; MB6321/6322: 2 samples each). To address this limitation, we supplemented overall accuracy with Cohen’s kappa coefficient, which accounts for chance agreement and provides a more robust assessment of classification performance in imbalanced scenarios. Additionally, class-specific metrics (precision, recall, and F1-score) were calculated to evaluate performance for individual habitat classes, particularly minority classes that may be inadequately represented by overall accuracy measures alone.

2.6. Map Generation and Spatial Analysis

The final habitat maps were generated by applying the best-performing classification models to the full extent of the study area. The selected machine learning models were applied to the processed remote sensing datasets to generate continuous habitat maps across the Puck Lagoon. For specific applications, maps of sediment substrate (EUNIS 3) and dominant species descriptors were combined to provide comprehensive habitat characterization.

Change Detection Analysis

Change detection analysis was implemented to assess temporal variations in benthic habitat distribution within the Puck Lagoon, with particular focus on Zostera marina meadows. The analysis utilized historical reference data from 1957 as a baseline for comparison with the contemporary habitat mapping results generated through machine learning classification approaches [63]. The 1957 baseline map was digitized from hand-drawn seagrass distribution charts compiled by Ciszewski, Demel, Ringher, and Szatybełko [63] during July–August diving surveys of the Puck Lagoon. These charts were georeferenced and rasterized to 0.5 m resolution to match contemporary mapping.
The change detection methodology employed spatial overlay analysis to compare the current habitat distributions from all the models that predicted Zostera marina meadows with historical reference coverage from 1957. This approach enabled quantification of habitat gains, losses, and persistence over the 66-year study period.
To assess the metrics of the change detection results, we intersected the current and archival results and marked all “from-to” scenarios with presence and abundance of Zostera marina meadows. Moreover, we calculated the gain, loss, total change, swap in every location, and net quantity for each predictive model following established protocols for temporal accuracy assessment in remote sensing applications [64,65].

3. Results

3.1. Feature Selection

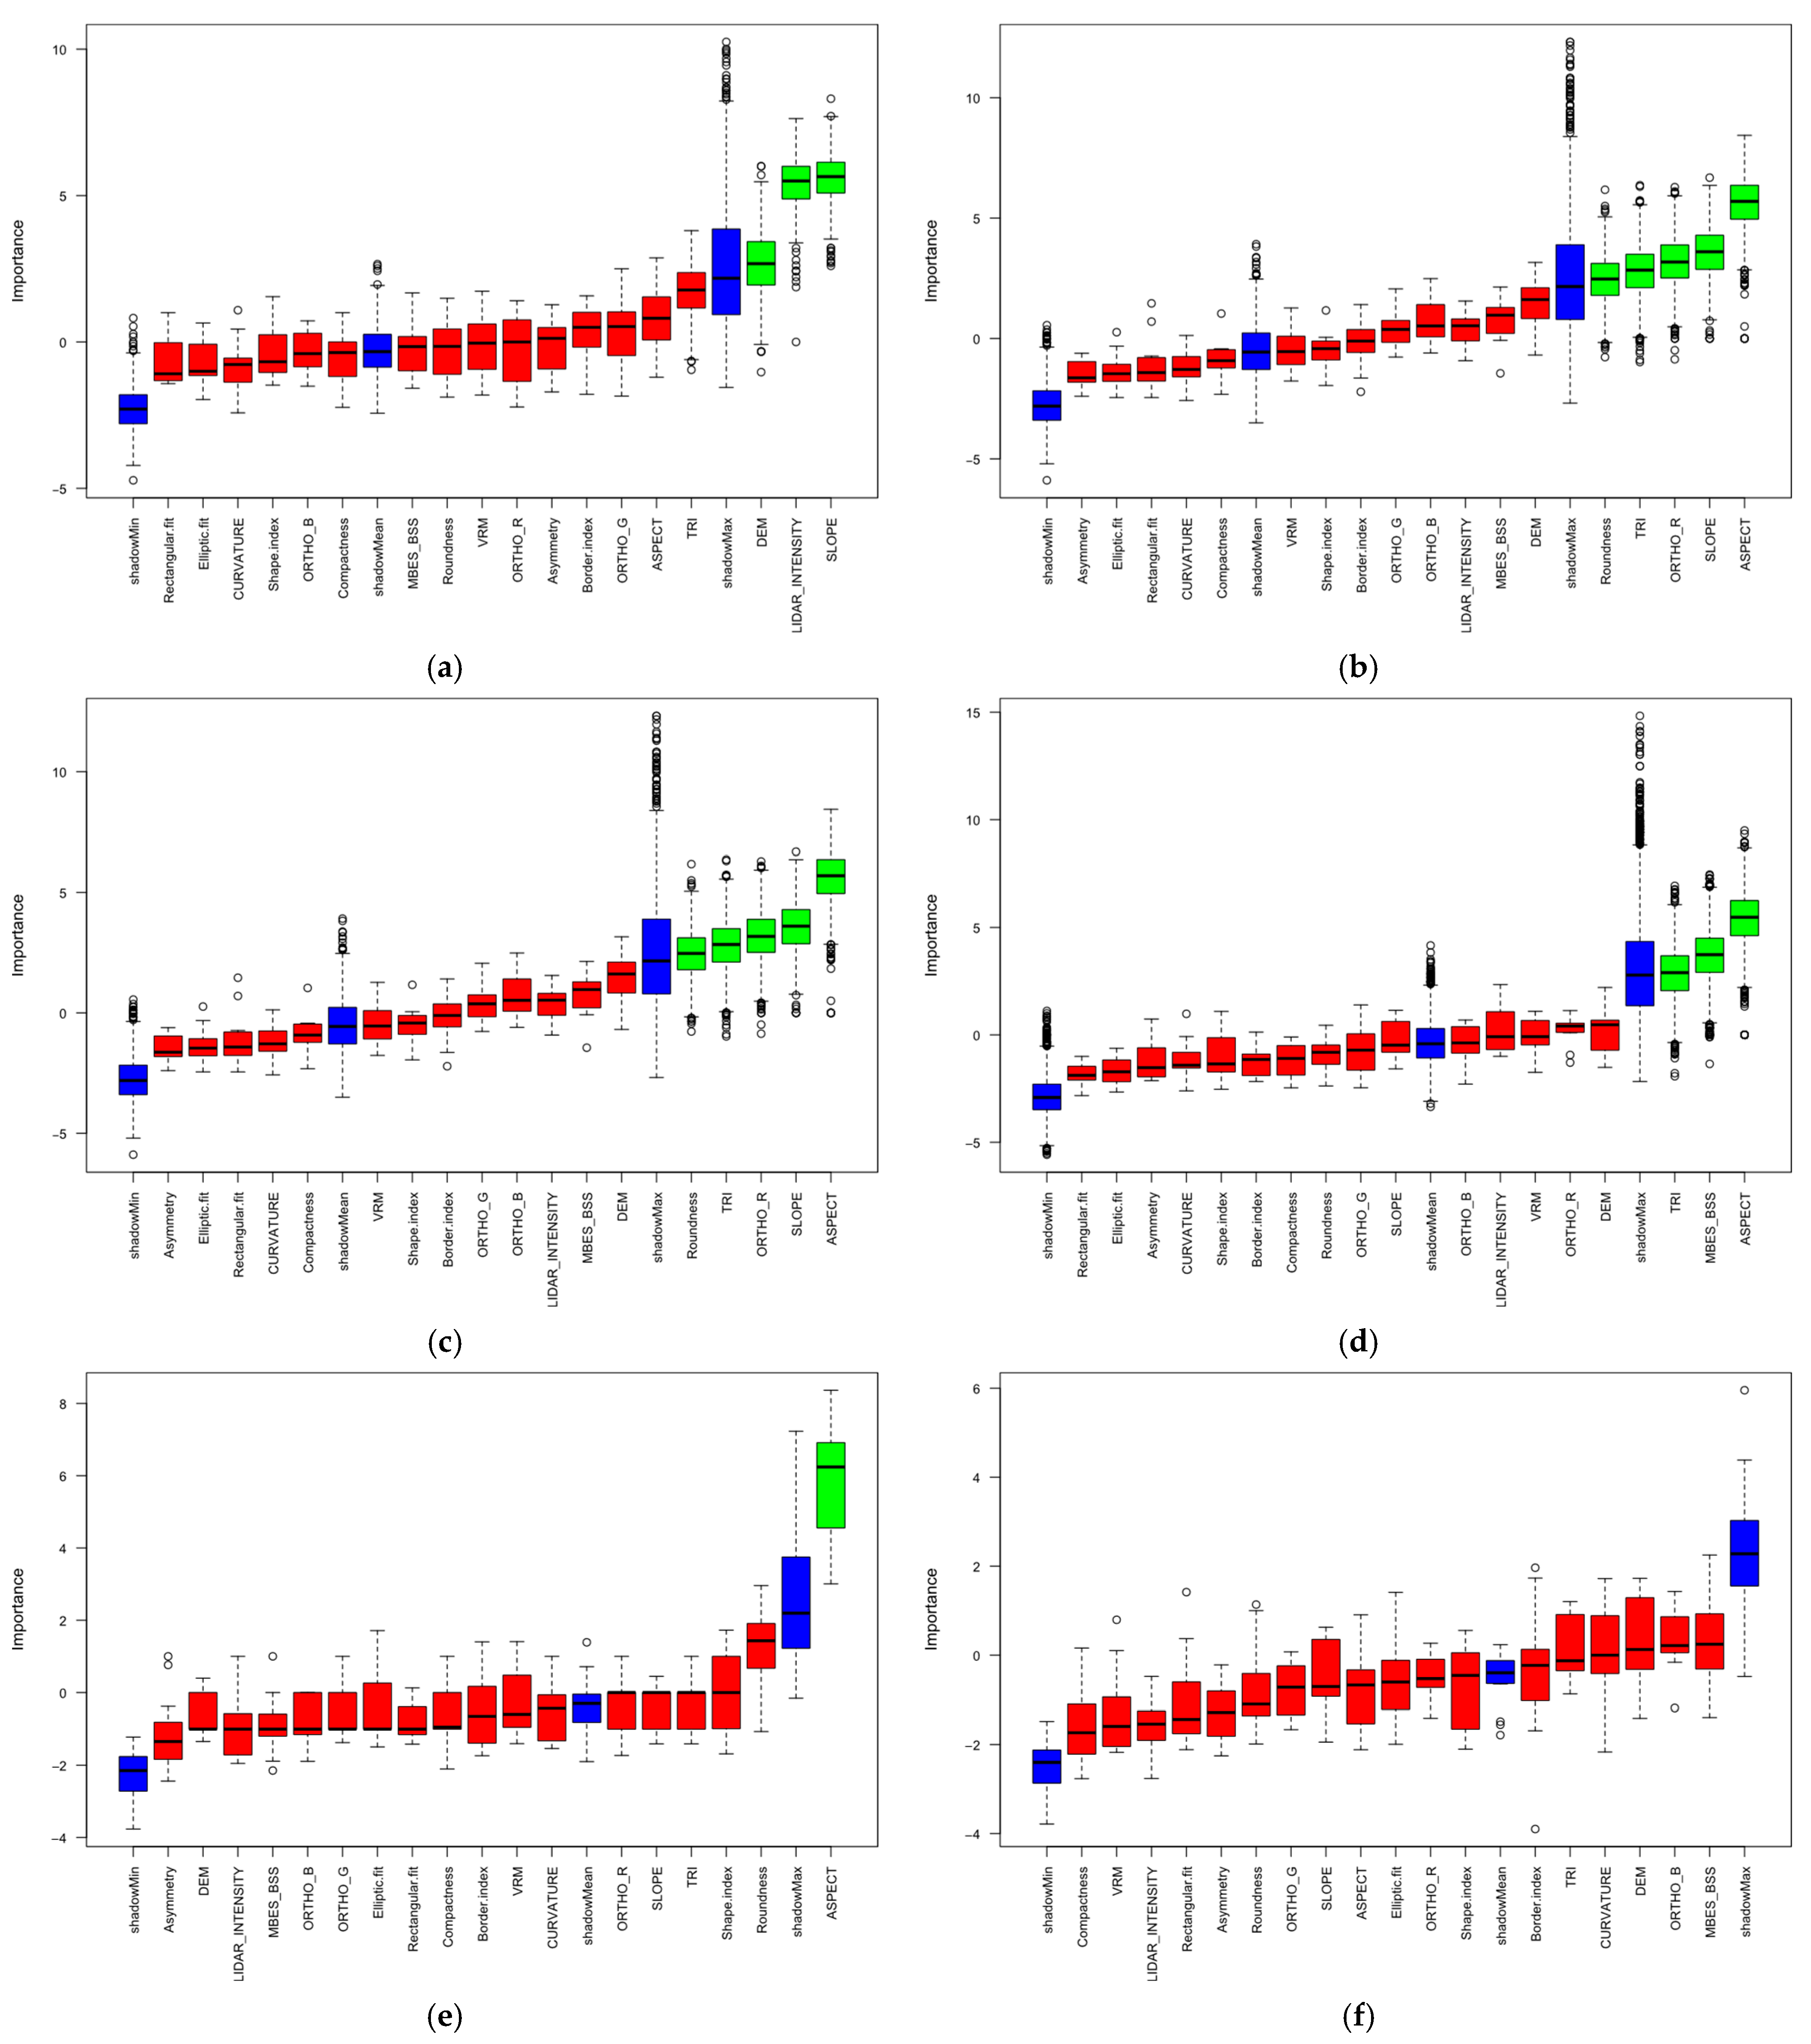
The Boruta feature selection results indicated that for EUNIS Level 3 delimitation, slope, ALB intensity, and DEM were significant features to be used for classification (Figure 4a). The other features were irrelevant. But, for EUNIS Level 4 classification, aspect, slope, red (R) band of orthophoto, terrain ruggedness index (TRI), and roundness (an object-based feature) were significant features (Figure 4b). For EUNIS Level 4/5 classification, the most important features were aspect, TRI, DEM, slope, and the R band of orthophoto (Figure 4c). For the dominant species descriptor classification, aspect, MBES backscatter, and TRI were three of the features that were applicable (Figure 4d).
For Zostera marina presence/absence classification from the 2023 survey samples, only the aspect feature was an applicable feature (Figure 4e). For the other situation with the 2010–2023 survey samples, no feature was useful (Figure 4f). Because of that, we omitted performing classifications of Model 1 for these two scenarios.

3.2. Predictive Modeled Maps of Benthic Habitats

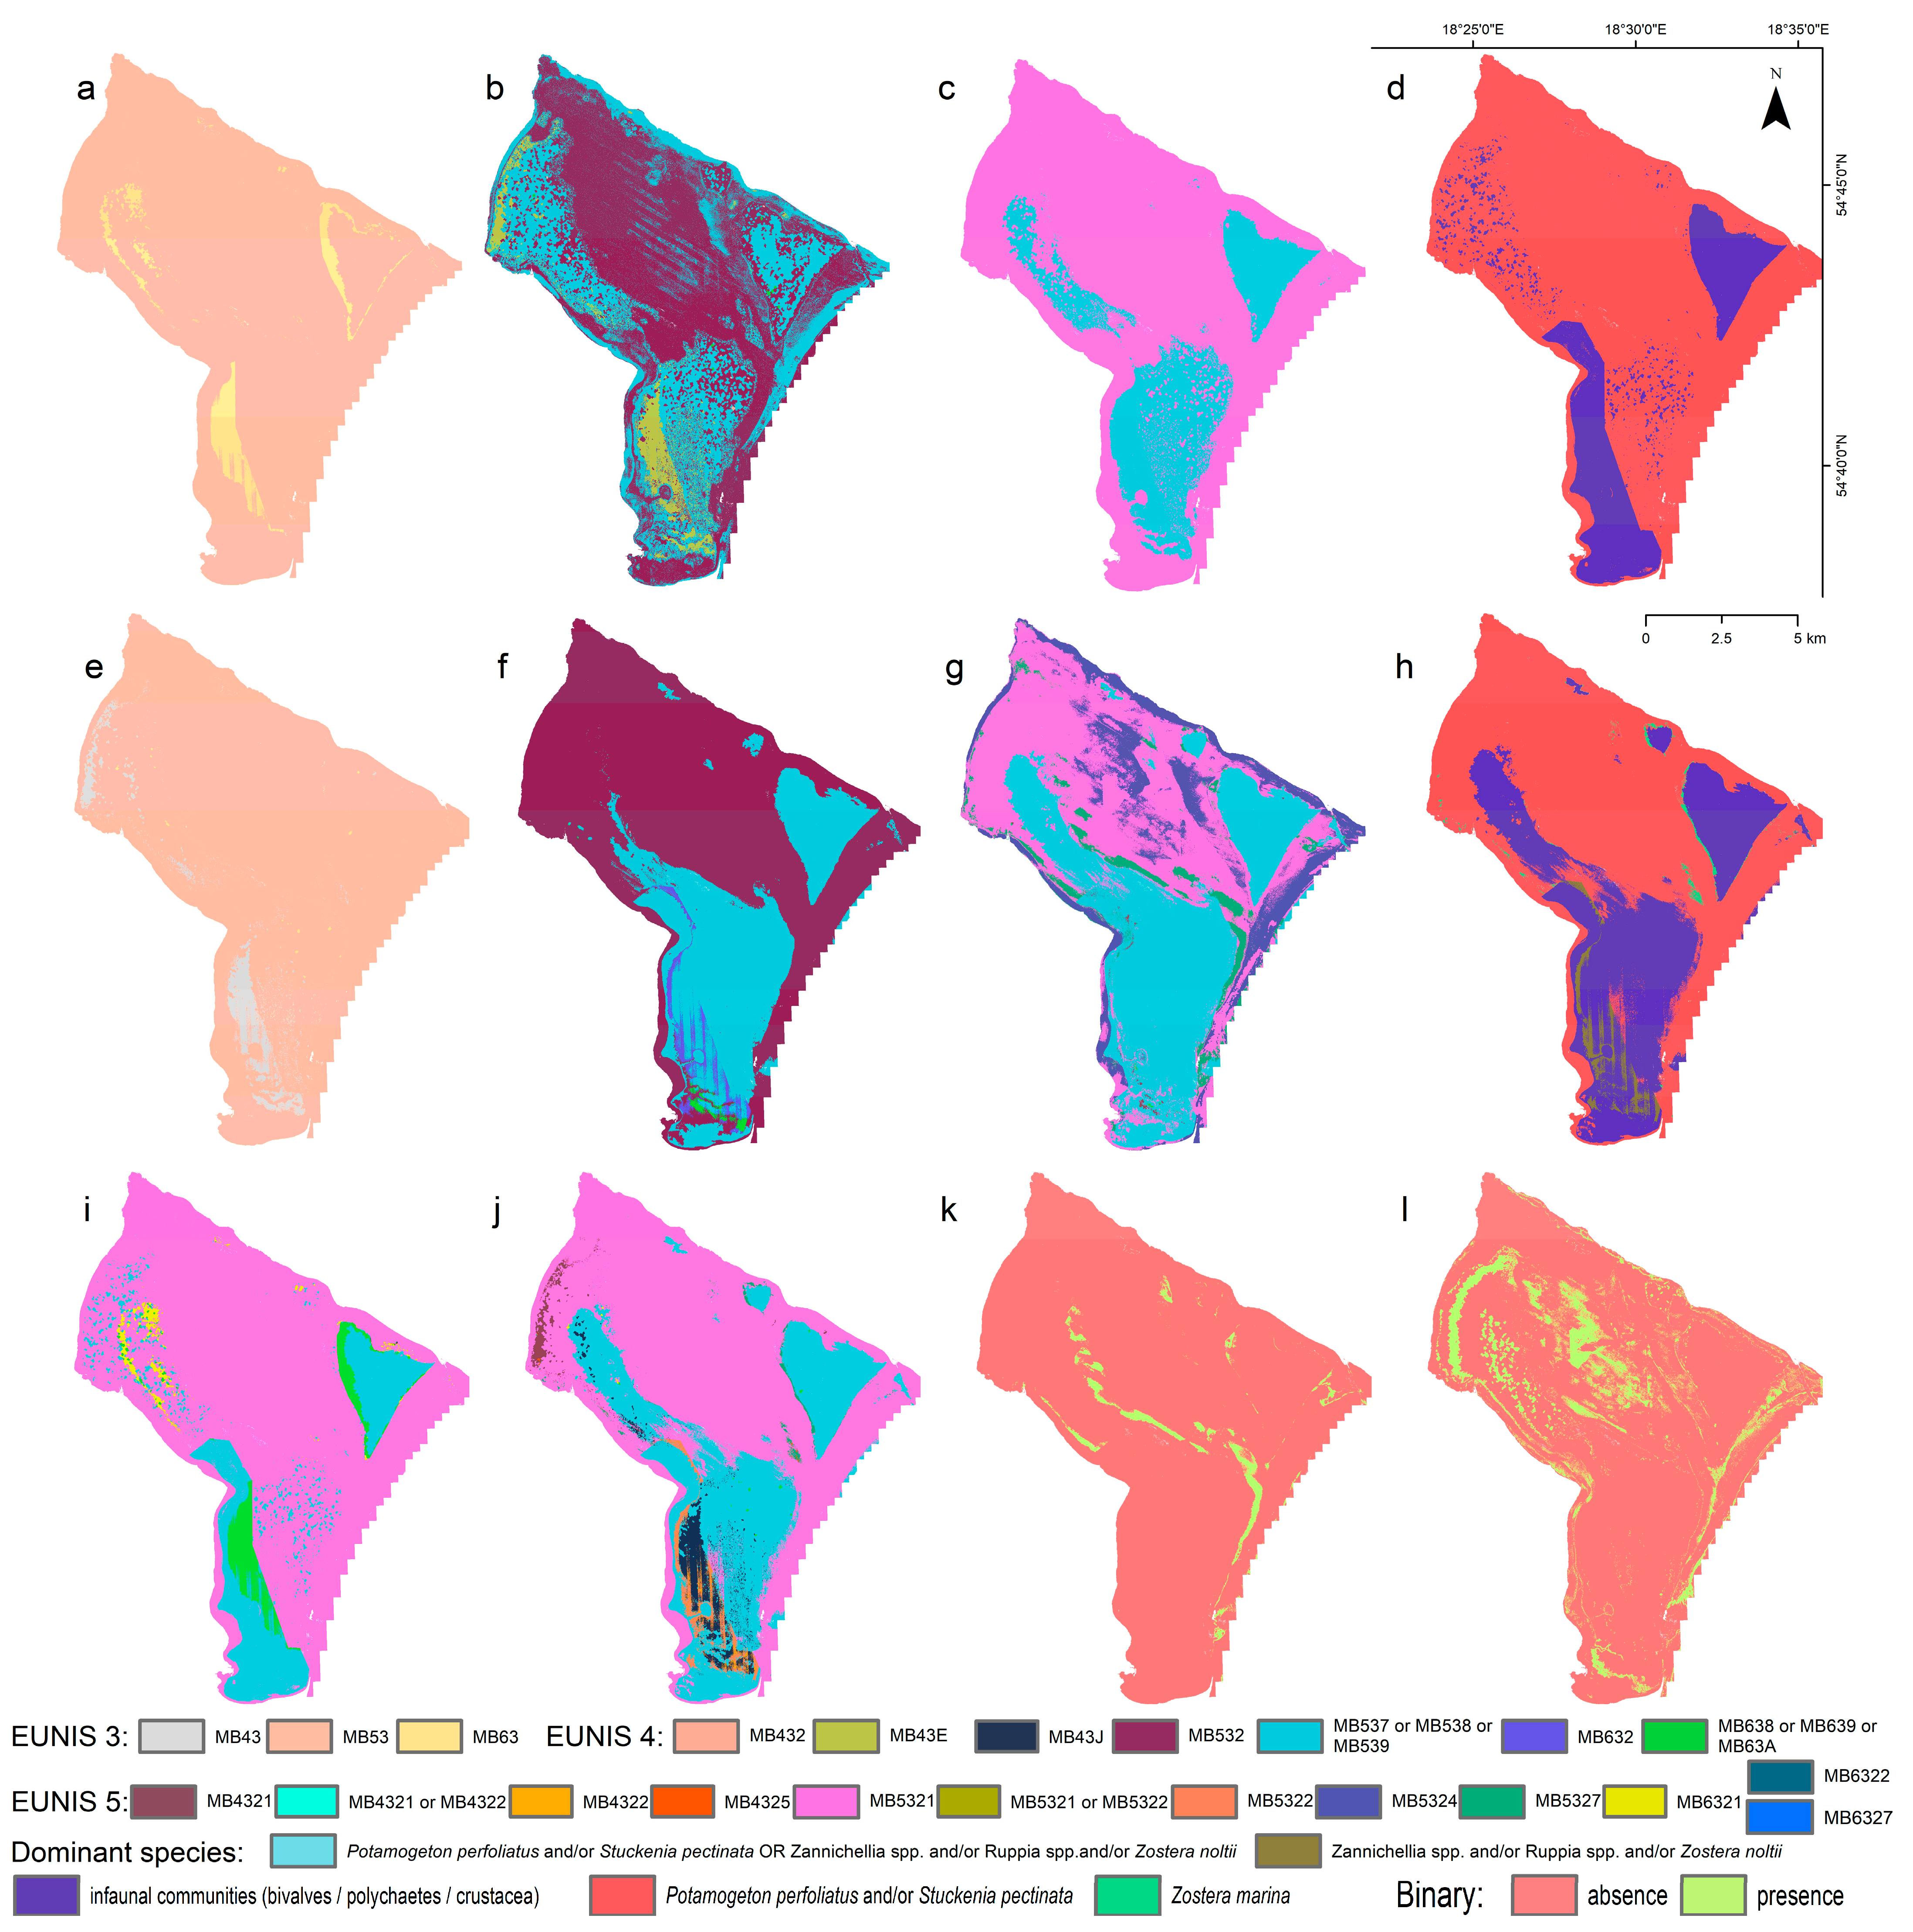
The results of predictive modeling of benthic habitats for different scenarios are presented in Figure 5. Each map represents the outcome of a supervised classifier that indicated the highest performance of all the tested machine learning methods. While the first row represents the results of supervised classification using only features selected with the Boruta algorithm as input for machine learning algorithms (Model 1; Figure 5a–d), the second row provides the results of application of all the primary features as input for classification (Model 2; Figure 5e–h). The third row shows a combination of sediment substrate and dominant species descriptors (Figure 5i,j), and the results of presence/abundance modeling of Zostera marina using all the primary features as input attributes for classification but different sets of GT samples (Figure 5k,l). The qualitative assessment of the results shows that in some of the generated maps, the artifacts resulting from the spatial representation of the input datasets had a significant impact on the final outcome (for example, compare Figure 5b with Figure 1c or Figure 5d with Figure 1d). This resulted in generation of artificial sharp class boundaries that probably do not exist in real life but are an effect of the different input datasets that covered such areas. Table 4 provides all the machine learning classification parameters that were evaluated for generation of the results, in correspondence to Figure 5.
Importantly, the analysis of the outcome presented in Figure 5j revealed habitat areas characterized by infaunal communities on mixed sediment substrates that do not correspond precisely to the existing EUNIS classification categories. Based on our field observations and the distinct ecological assemblages identified, we propose a new EUNIS 4 habitat designation: MB43J—Baltic infralittoral mixed sediment characterized by infaunal communities. This proposed classification addresses gaps in the current EUNIS scheme for Baltic Sea mixed sediment environments dominated by infaunal bivalves, polychaetes, and crustacea assemblages observed in our study area.

3.3. Accuracy Assessment of the Machine Learning Results

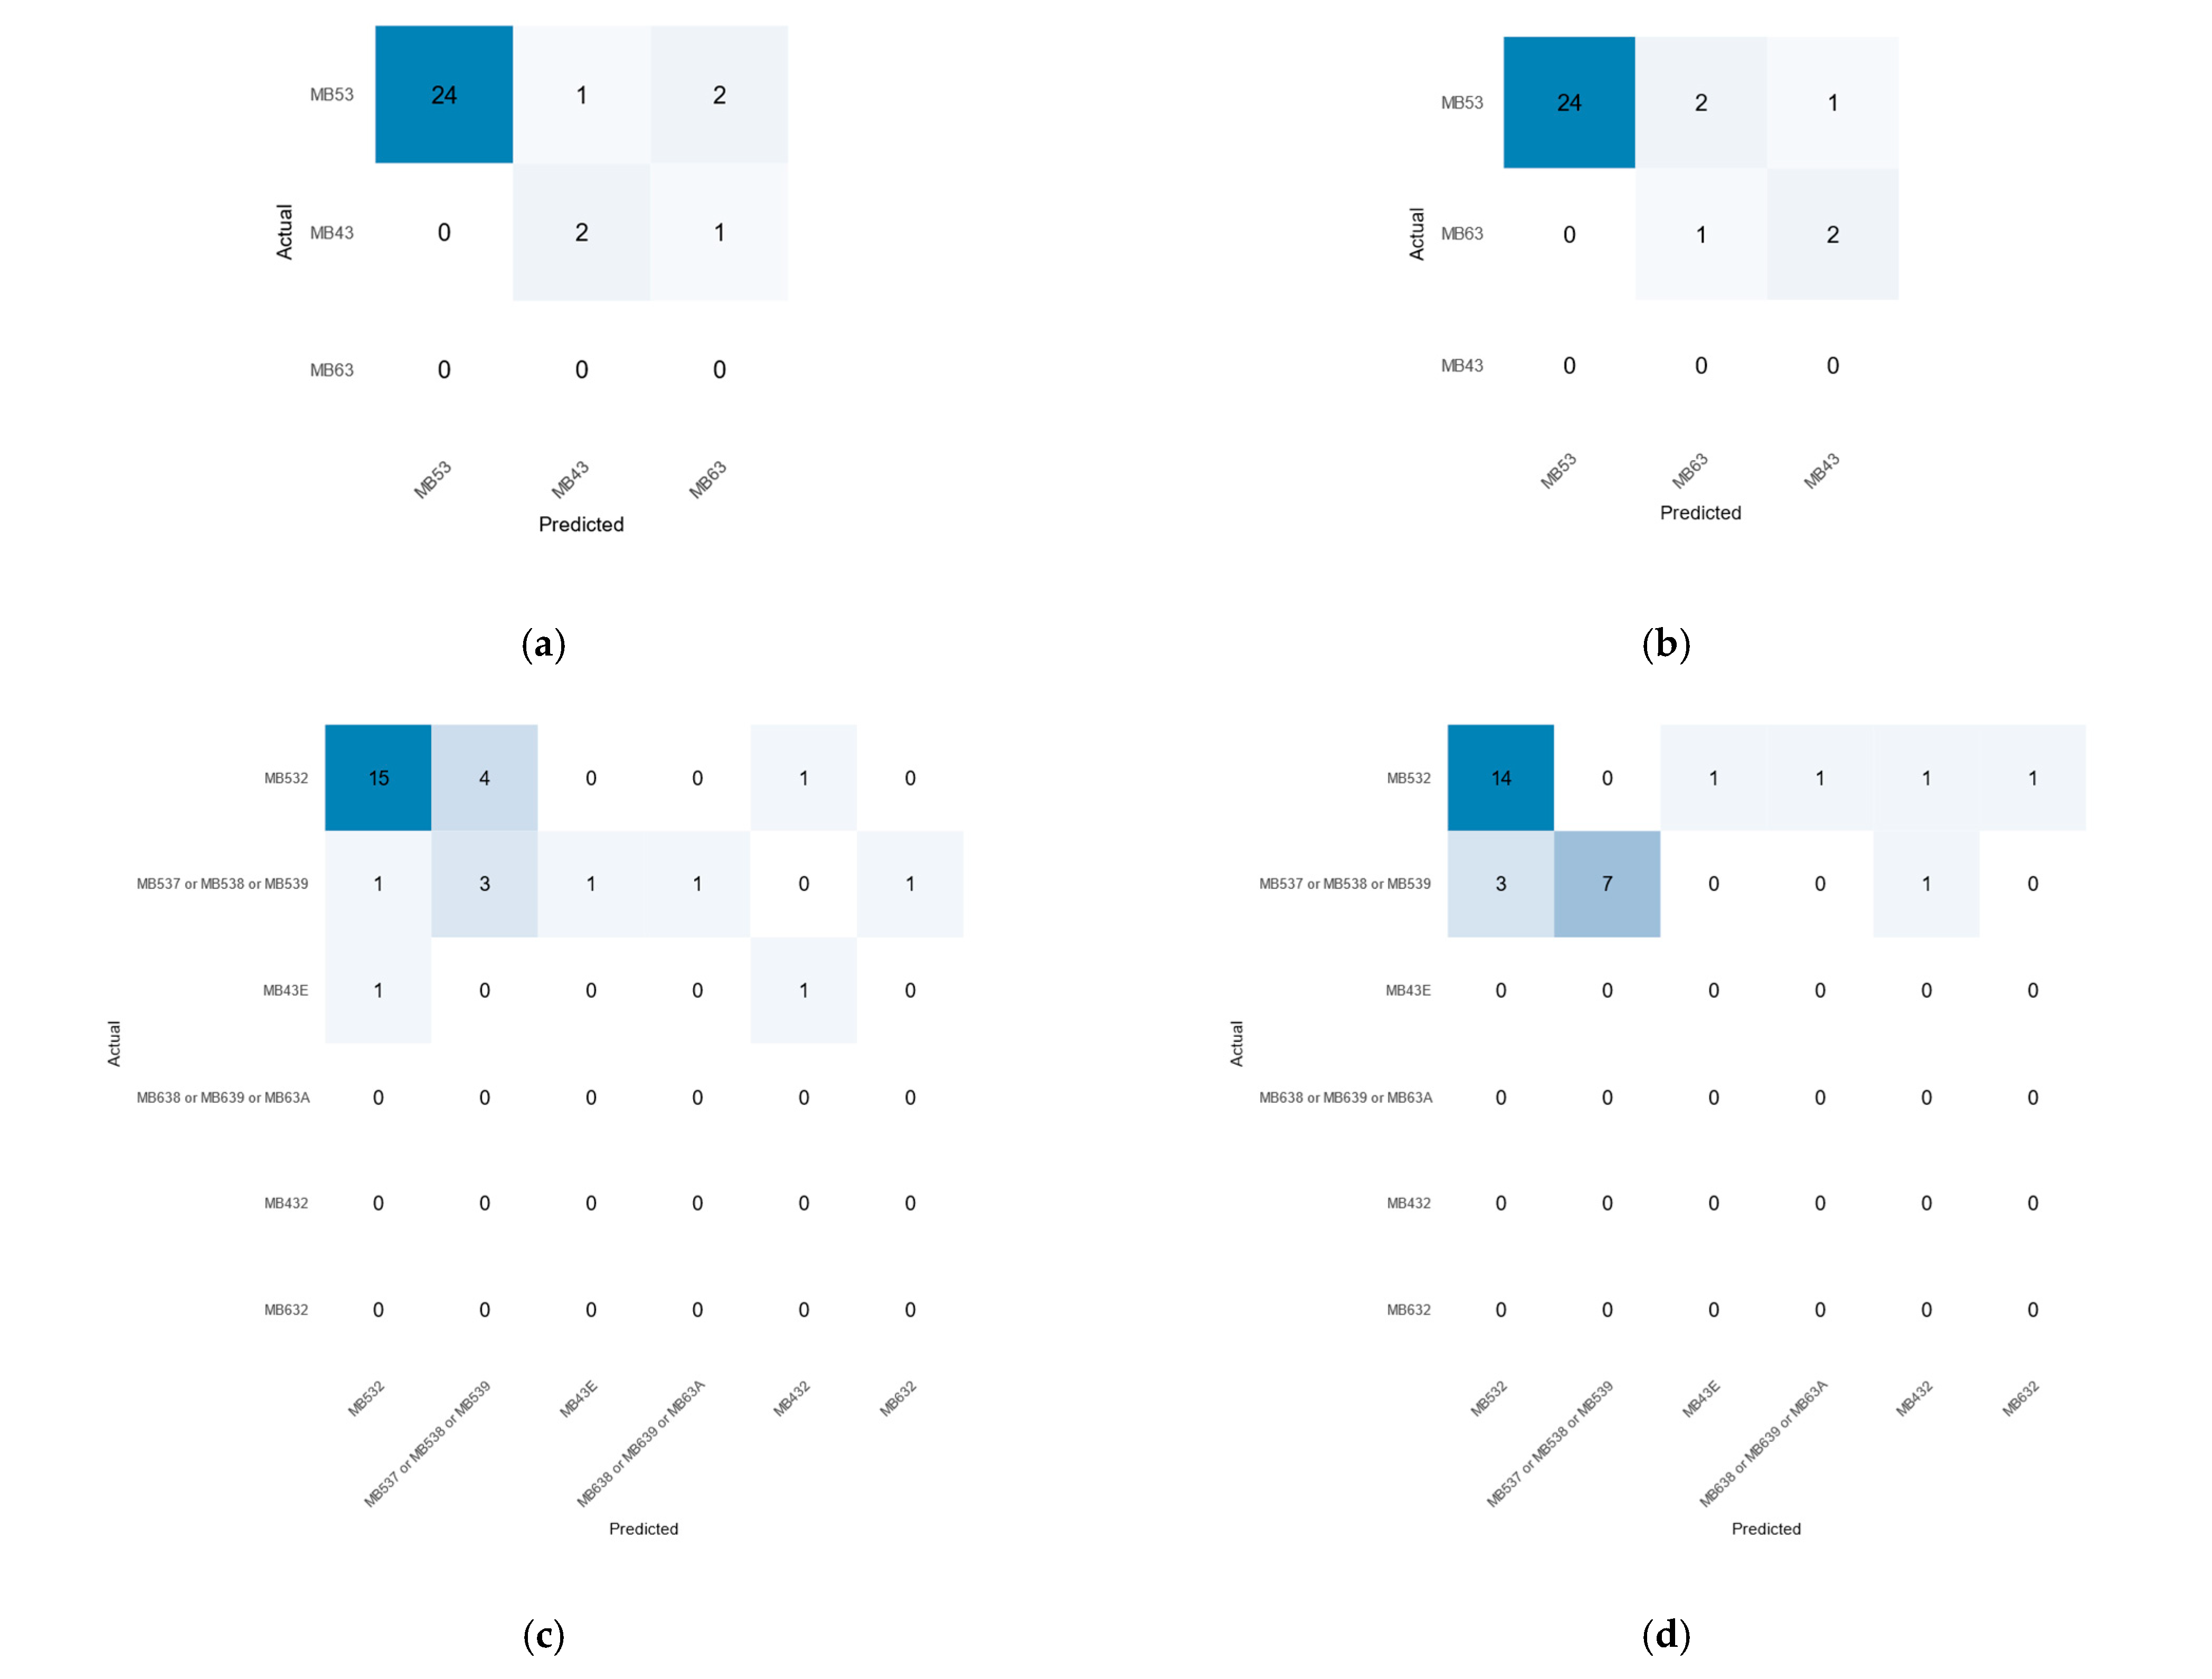
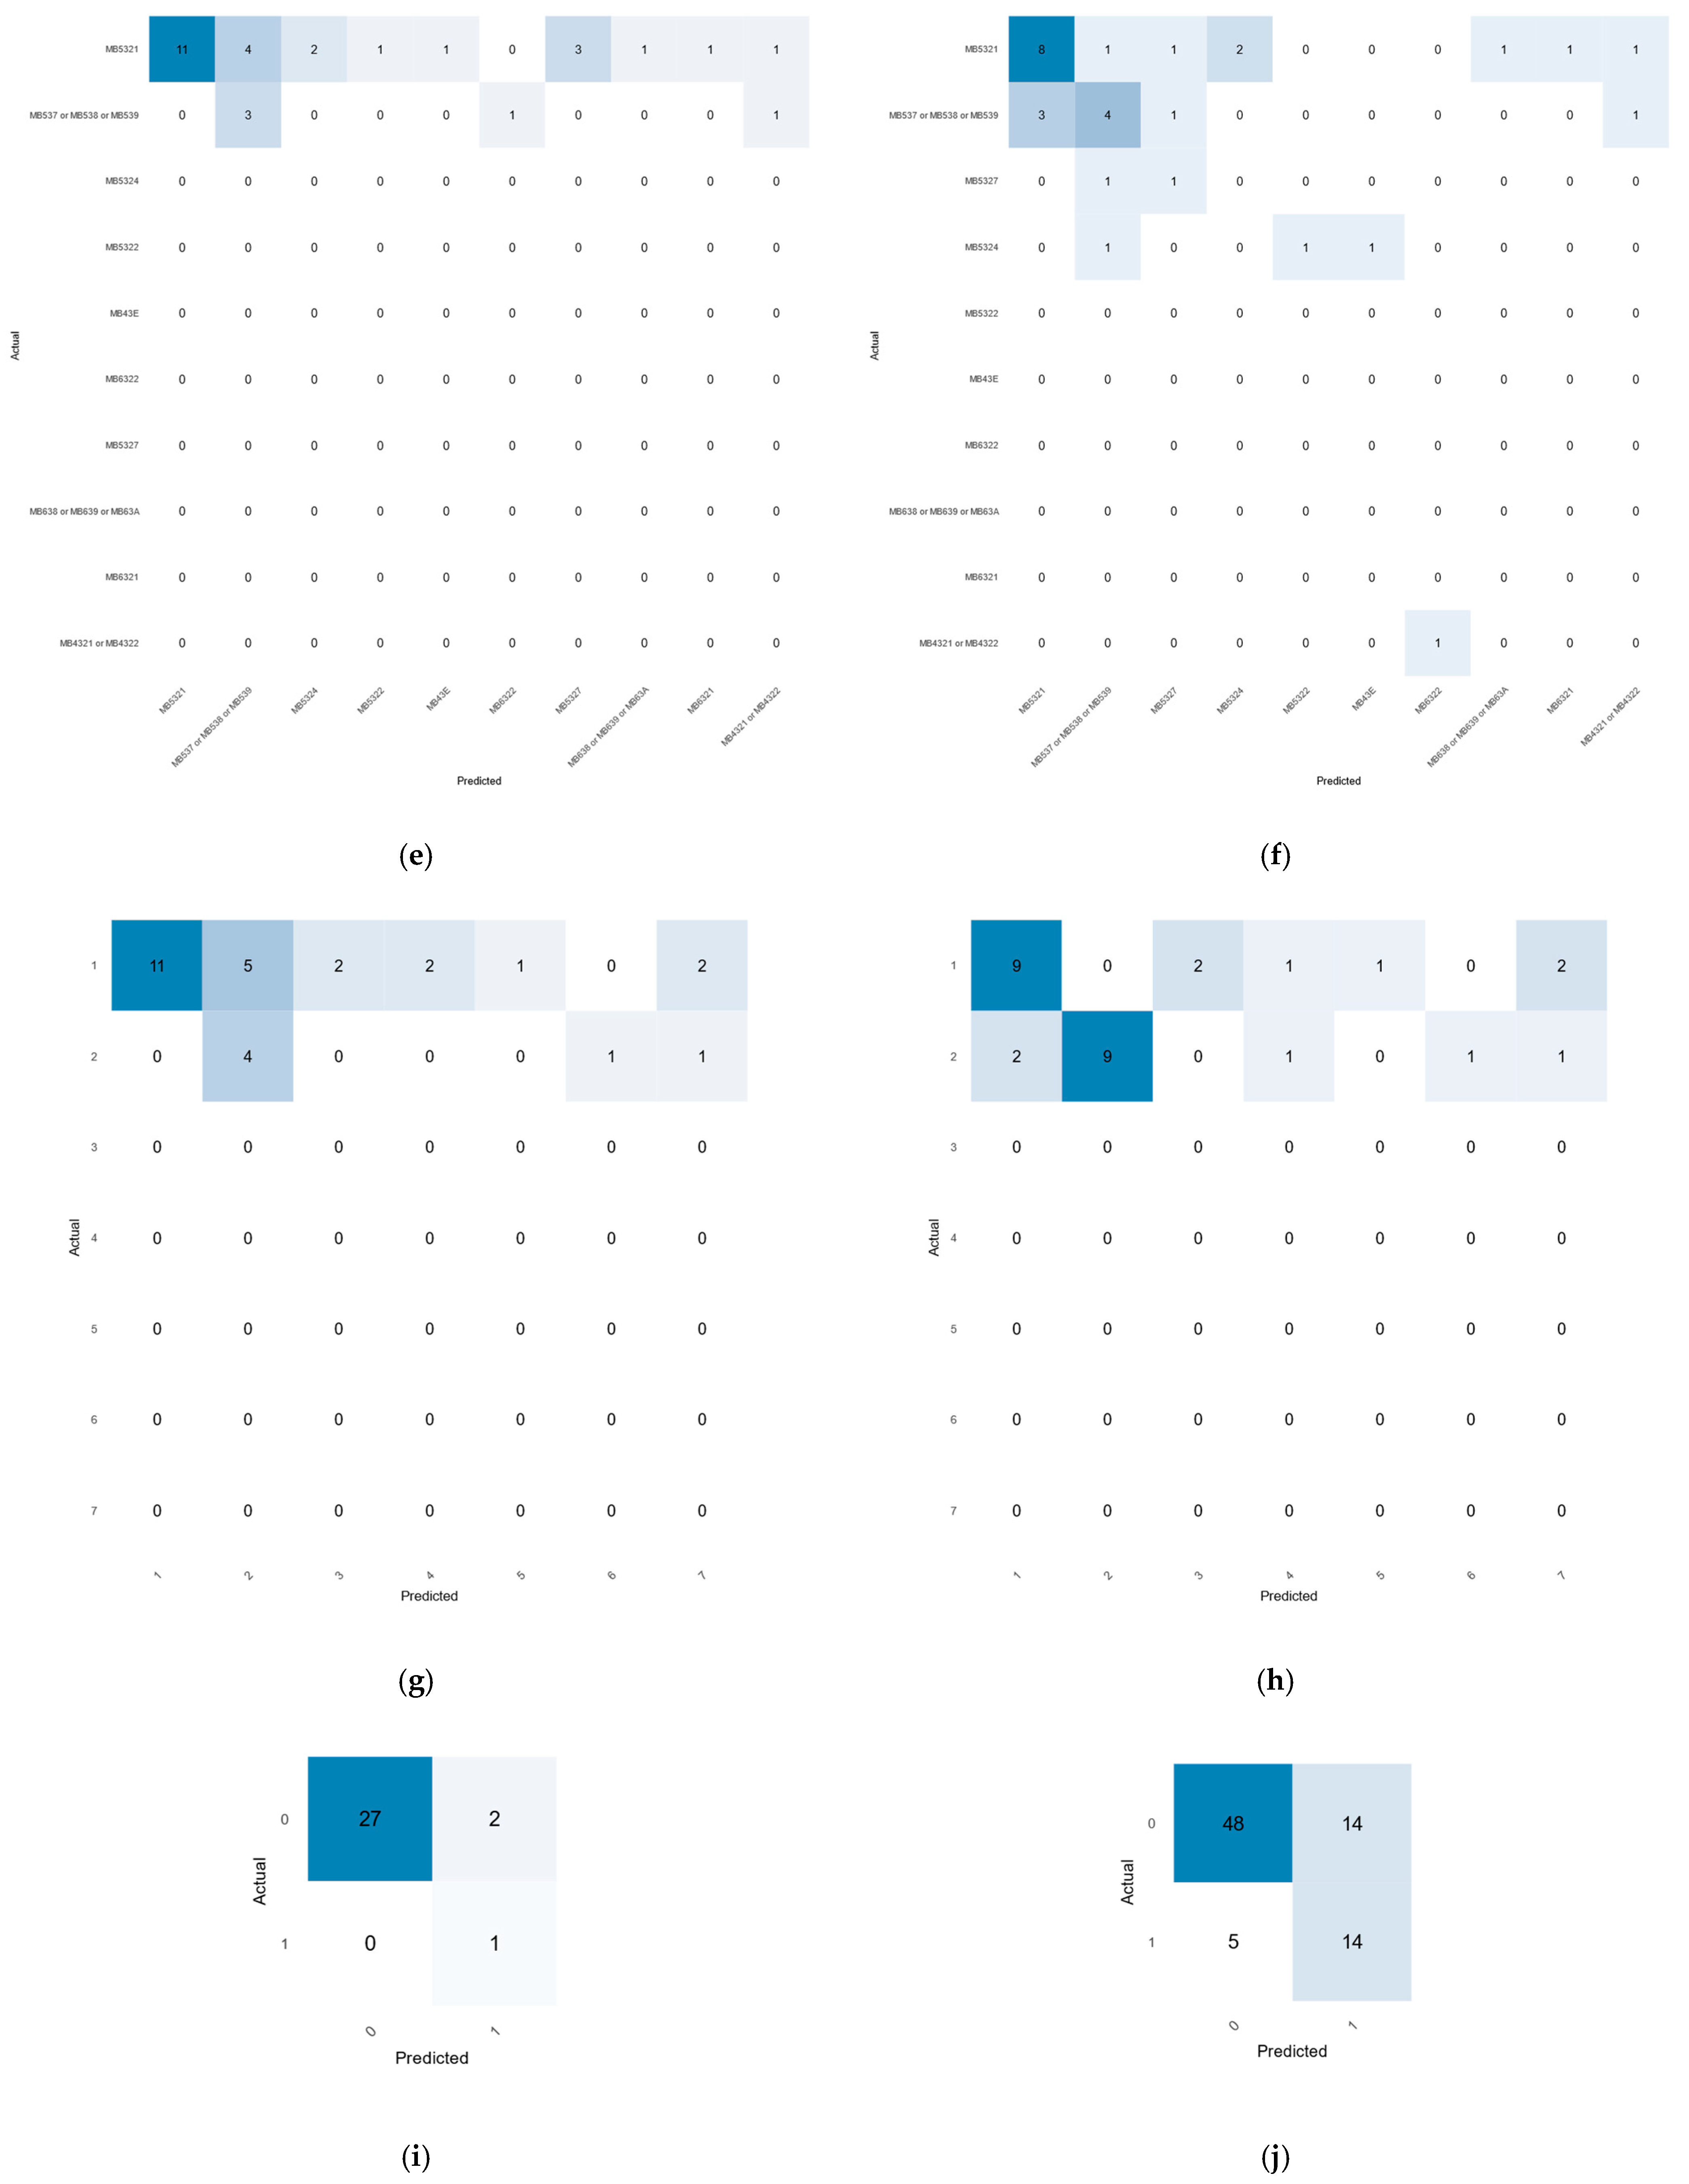
The quantitative assessment of the generated results is represented in error matrices for all ten results of supervised classification (Figure 6) and accuracy assessment statistics, including overall accuracy and kappa for all the outcomes (Figure 7). Comparing the ten machine learning models on different habitat and species classification tasks highlighted enormous differences in performance metrics. The overall accuracy ranged from 0.433 to 0.933, and Cohen’s kappa coefficients ranged from 0.186 to 0.506, highlighting enormously diverse model performances on different classification approaches (Figure 7). Performance decreased with increasing numbers of classes, indicating the challenge of model complexity and class discrimination with high-dimensional classification tasks.
The EUNIS 3, RF classifier, Model 1 achieved an overall accuracy of 0.867 and a kappa of 0.506 compared to its KNN counterpart, achieving the second-highest overall accuracy among all the models. The model classified MB53 with an F1-score of 0.941 and MB43 with an F1-score of 0.667 (Figure 6a). The model achieved an F1-score of 0.941 for the dominant class MB53 and an F1-score of 0.667 for the minority class MB43, with an inability to classify the MB63 class and a class imbalance of 90% MB53, 10% MB43.
The EUNIS 3, KNN classifier, Model 2 achieved an overall accuracy of 0.833 and a kappa of 0.383, indicating reduced agreement beyond chance compared to the Random Forest approach. The model showed similar patterns to the RF model but with different class distribution challenges (Figure 6b). The model classified the dominant class MB53 with an F1-score of 0.941, but also completely failed to classify the MB43 class.
While fine-scale habitat classifications at EUNIS Level 4–5 and dominant species levels represent an important objective for advancing benthic habitat mapping, the current ground-truth data limitations constrain their operational application. The following results present these classifications as exploratory analyses that highlight both the state of the art in machine learning applications to benthic ecology and the critical data gaps that must be addressed.
The EUNIS 4, RF classifier, Model 1 achieved an overall accuracy of 0.621 and a kappa of 0.291 compared to the KNN approach, suggesting that increased model complexity may not always improve performance in habitat classification tasks. It classified the MB532 class with an F1-score of 0.811 and a kappa of 0.291, but it showed complete failure to classify majority of the classes and lower overall performance compared to the KNN alternative (Figure 6c).
The EUNIS 4, KNN classifier, Model 2 achieved an overall accuracy of 0.724 and a kappa of 0.493, demonstrating effective discrimination between the two primary habitat classes. The model classified MB537/538/539 with an F1-score of 0.778 and MB532 with an F1-score of 0.800 (Figure 6d). The model achieved a kappa of 0.493, but it completely failed to classify four out of six classes.
The EUNIS 4–5, SVM classifier, Model 1 showed marginally better overall accuracy (0.467) but worse kappa (0.186) than EUNIS 4–5, Model 2. The model essentially reduced the 10-class problem to a binary classification between two dominant classes (Figure 6e). It had a precision for the MB5321 class of 0.440 and a recall of 0.430 for the MB537/538/539 class. In comparison, it had the lowest kappa coefficient among all the models, class reduction (10 classes → 2 classes), and overfitting to the dominant class.
The EUNIS 4–5, RF classifier, Model 2 achieved an overall accuracy of 0.433 and a kappa of 0.225, highlighting the challenges associated with high-dimensional habitat classification. Despite having five classes represented in the sample, the model achieved meaningful classification for two classes. For example, the MB5321 class achieved an F1-score of 0.615 (Figure 6f).
The dominant species descriptor, SVM classifier, Model 1 achieved an overall accuracy of 0.517 and a kappa of 0.240 compared to the KNN approach, with reduced discrimination ability and lower overall effectiveness in species classification. Its strengths were visible in classification of Potamogeton/Stuckenia and moderate performance for infaunal communities. However, it indicated reduced sensitivity for species detection and class imbalance affecting minority species (Figure 6g).
To compare, the dominant species descriptor, KNN classifier, Model 2 achieved an overall accuracy of 0.621 and a kappa of 0.420 in species classification, distinguishing between two major biological communities. The model demonstrated F1-score performance for infaunal communities of 0.783, precision of 0.643, and recall of 1.000. However, it had a reduction of a 7-class problem to a 2-class problem and a complete failure to classify the five species classes (Figure 6h).
The Zostera marina absence/presence using samples from the 2023 survey, SVM classifier, Model 2 achieved an overall accuracy of 0.933, with a kappa coefficient of 0.474. The model achieved an F1-score of 0.964, precision of 1.000, and recall of 0.931 in detecting Zostera. However, the model showed an F1-score of 0.500, precision of 0.333, and recall of 1.000 in Zostera marina presence detection (Figure 6i). The model had limited generalizability due to a small positive class representation.
The Zostera marina absence/presence using samples from the 2010–2023 surveys, RF classifier, Model 2 achieved an overall accuracy of 0.765 and a kappa of 0.439 with the largest sample size (n = 81). The model showed balanced performance between classes, with better recall for Zostera marina presence (0.737) compared to the SVM model’s precision-recall trade-off. The model had a larger, more representative sample size than the previous one and balanced performance across both classes (Figure 6j). In comparison, it had moderate precision for positive class detection, and class imbalance was still present (23.5% positive samples).
The comparison reveals clear hierarchies of performance for varying classification contexts. The best values for performance were achieved through binary classification models (Zostera marina), then low-dimensional habitat classification (EUNIS 3), with a notable degradation in performance when class complexity increased. The RF algorithm performed better than the alternatives for less complex problems, while the KNN algorithm performed well with moderate complexity.
Class imbalance subsequently emerged as the key constraining factor across all the models, wherein most of them were only able to have effective classification for 2–3 classes, regardless of the theoretical class space. This suggests that the real problem is not algorithmic complexity but representation and sampling paradigms.
The extensive range in kappa coefficients (0.186–0.506) implies extensive discrepancies in model validity beyond precision measures. Models with kappa < 0.3 will probably be unreliable for operational use, while those >0.4 imply extensive agreement suitable for scientific and management applications.

3.4. Change Detection Analysis

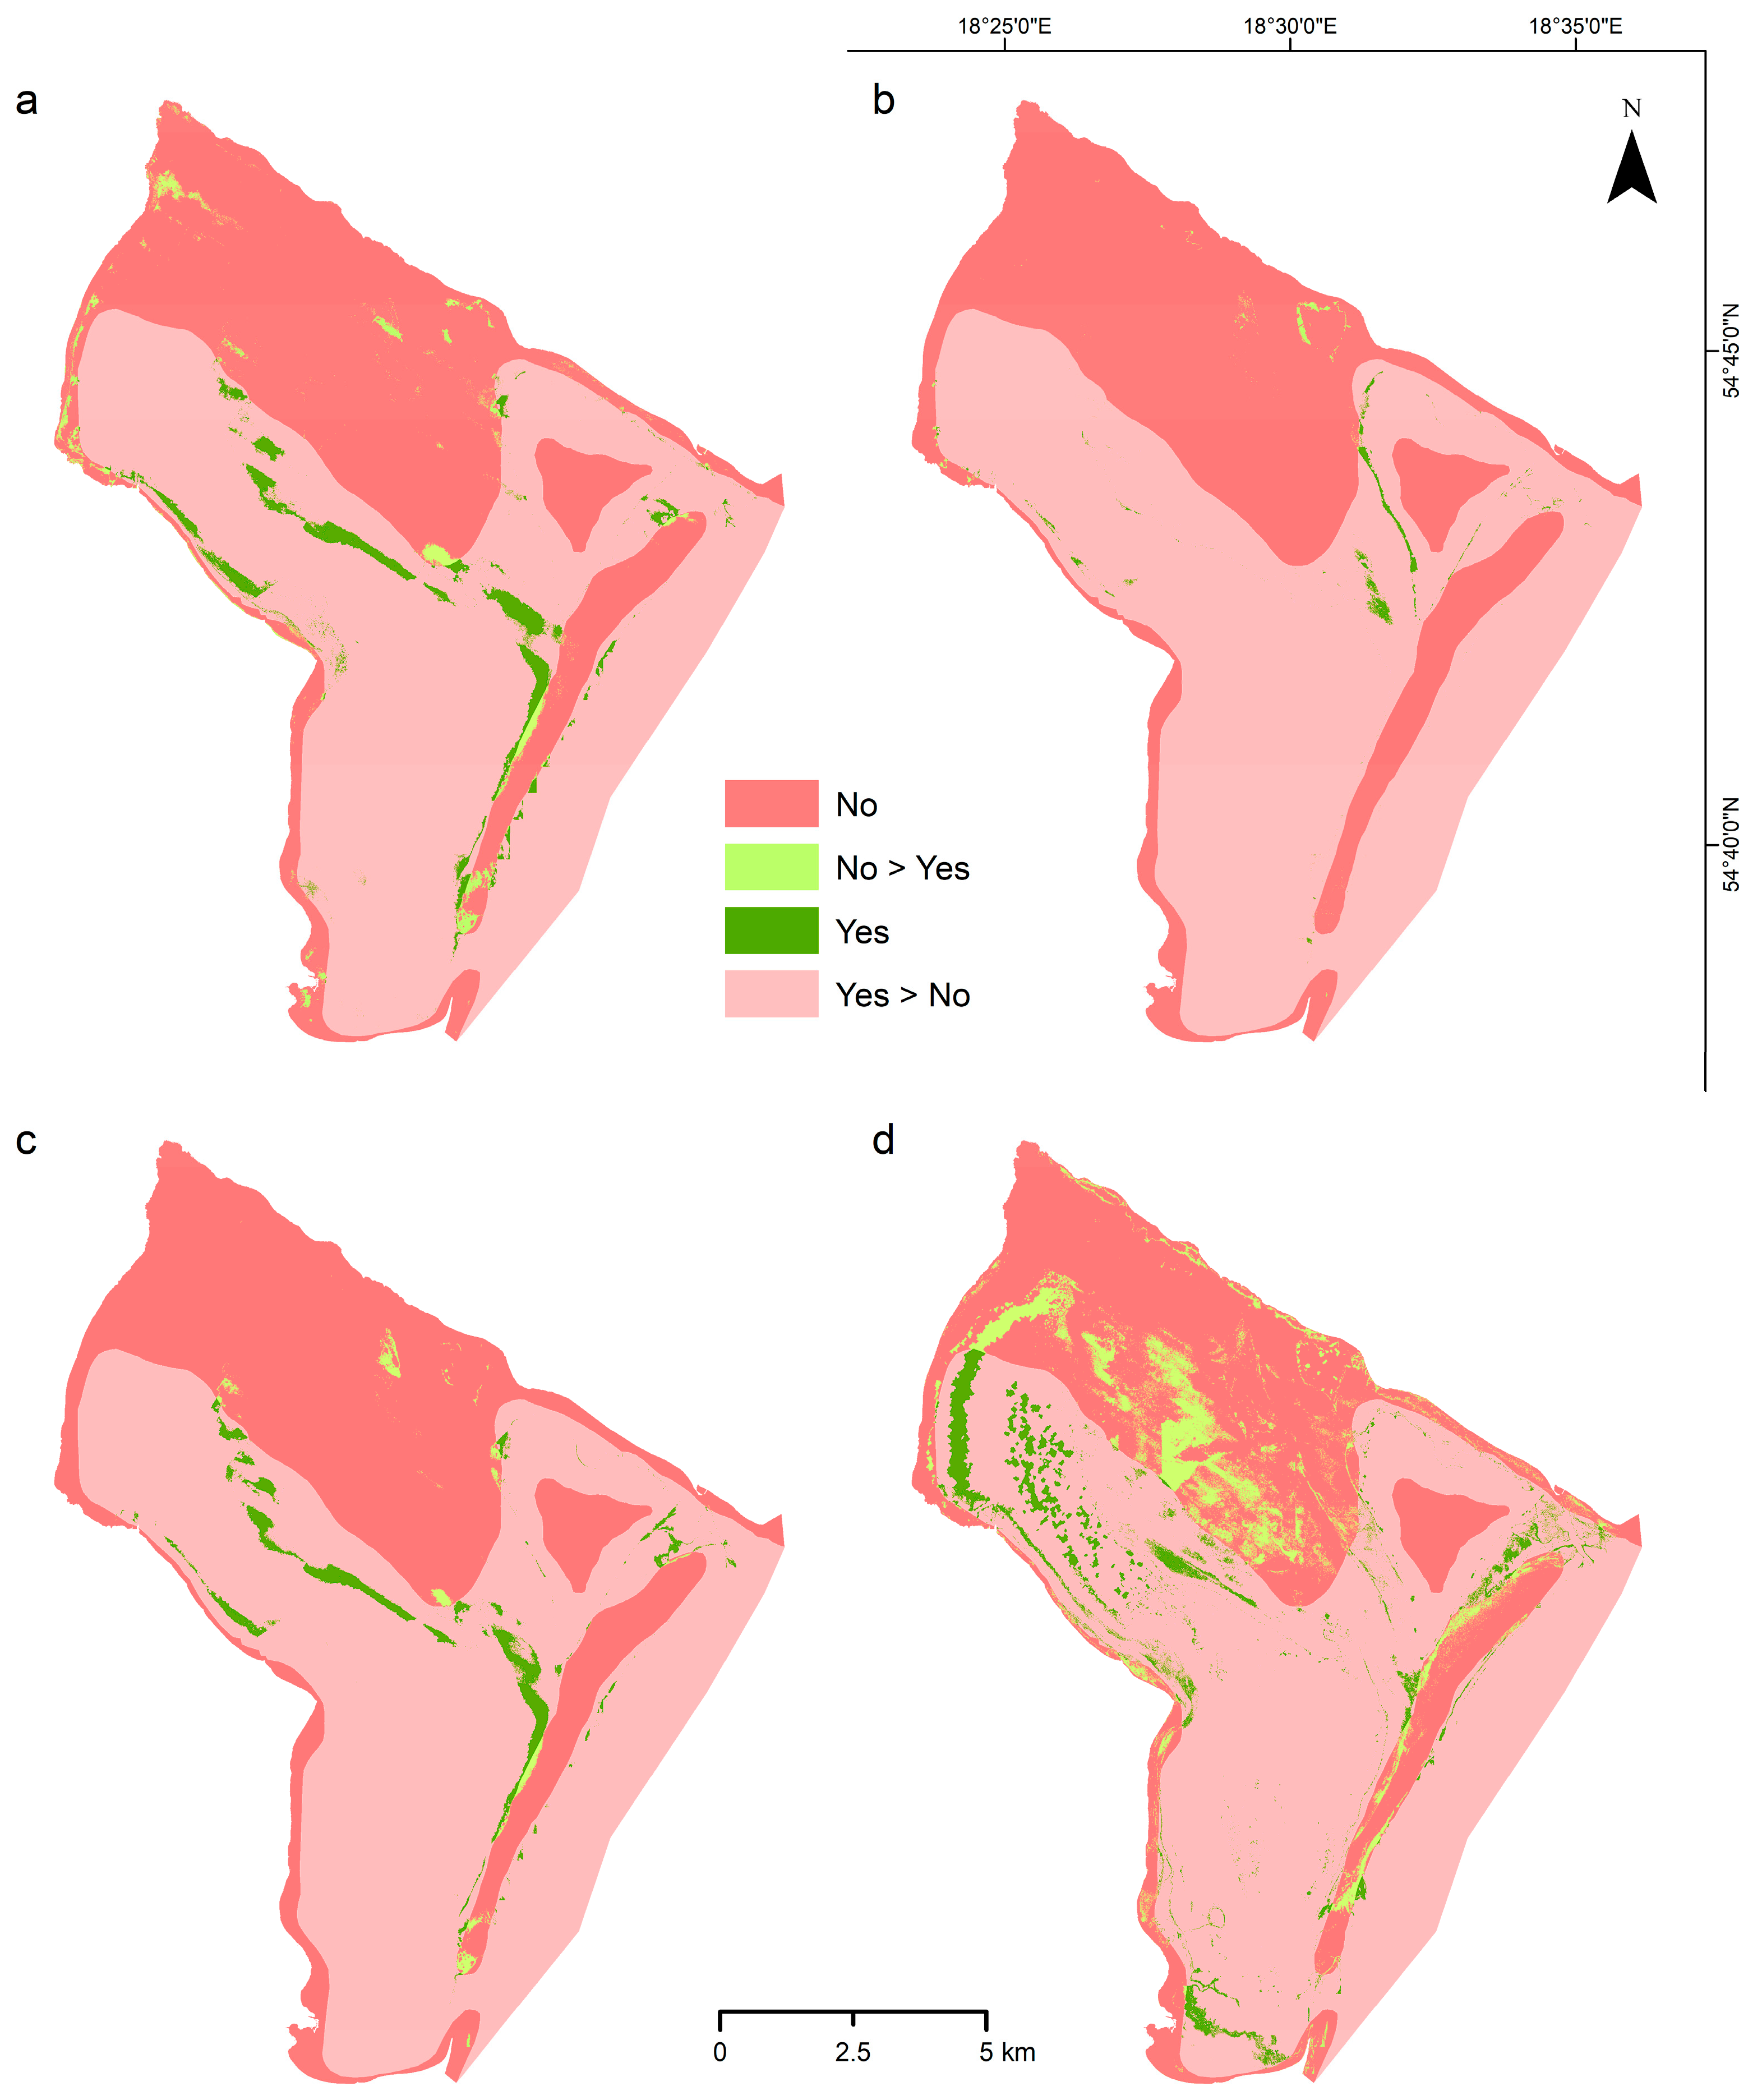
The change detection analysis revealed significant temporal variations in benthic habitat distribution within the Puck Lagoon when compared to the 1957 reference baseline (Figure 8). The comparison between the current habitat mapping results and historical spatial coverage provided insights into long-term ecosystem dynamics and habitat transformation patterns over the 66-year study period.
The change detection statistics from Table 5 reveal consistent patterns of substantial Zostera marina habitat loss across all four modeling approaches, though with notable differences in magnitude and spatial distribution patterns. The historical baseline coverage of the study area was 61.1472 km2 in 1957, representing the reference extent of seagrass meadows.
The Zostera marina change detection analysis revealed significant habitat decline across all the classification approaches. The EUNIS Level 4/5 Random Forest model showed a 93.4% reduction from 1957, with current coverage at 4.05 km2, minimal gains (1.31 km2), and a net loss of 57.09 km2. The combined sediment substrate and dominant species model indicated the most severe decline—99.0%—with only 0.63 km2 remaining and the highest net loss (60.51 km2). The binary 2023 classification showed a 95.6% decline, with 2.69 km2 of current coverage and a net loss of 58.45 km2. In contrast, the extended 2010–2023 GT dataset offered a slightly more optimistic view, with 9.70 km2 remaining (84.1% decline), the highest gains (5.52 km2), and the lowest net loss (51.45 km2), along with the most substantial spatial shift (11.05 km2), suggesting notable habitat relocation over time (Table 5).
Areas of historical seagrass coverage showed varying degrees of persistence, with some regions maintaining ecological continuity while others demonstrated complete habitat transformation. The spatial swap components across all the models (ranging from 0.2997 to 11.0493 km2) indicated that while substantial habitat relocation has occurred, the magnitude of net losses far exceeds any compensatory gains through spatial redistribution.
The change detection results presented in Table 5 must be interpreted with explicit recognition of a significant systematic bias arising from seasonal phenological mismatch. The 1957 historical baseline was compiled from diving surveys conducted in July–August, capturing seagrass at peak seasonal biomass and maximum spatial extent. In contrast, contemporary mapping data were acquired in early March (winter/early spring conditions), representing pre-leafing phenology before full seasonal canopy development. This temporal mismatch results in the contemporary surveys systematically underestimating the current Zostera marina extent relative to what would be observed during peak summer biomass.
The reported loss estimates in Table 5 (84.1–99.0%) represent maximum values and likely overestimate true net loss by 5–15% due to seasonal phenology. After adjustment, corrected ranges are approximately 70–94% for the EUNIS 4/5 model, 84–99% for the combined model, 81–95% for the binary 2023 model, and 69–94% for the binary 2010–2023 model. Even under maximum correction, all approaches indicate catastrophic seagrass habitat loss, with a minimum corrected estimate of 69%. The consistency of extreme loss across diverse modeling strategies, despite accounting for seasonal uncertainty, provides robust evidence of ecosystem-level degradation.

4. Discussion

4.1. Classification Performance Hierarchy: From Operationally Defensible to Exploratory Findings

The comprehensive machine learning assessment revealed a clear performance hierarchy across classification scenarios that aligns with fundamental remote sensing principles and has critical implications for operational benthic habitat mapping. Two classification approaches achieved statistical robustness suitable for conservation and management applications (kappa ≥ 0.4): the EUNIS Level 3 classification (OA 86.7%, kappa 0.502 with Random Forest algorithm) and the binary Zostera marina presence/absence classification (OA 93.3%, kappa 0.474 with Support Vector Machine algorithm). These defensible models provide the empirical foundation for habitat mapping and change detection analysis. Fine-scale classifications (EUNIS Level 4–5, dominant species) did not achieve this operational threshold, with overall accuracies ranging from 43.3% to 62.1% and kappa values from 0.186 to 0.420. Rather than representing model failure, these results exemplify a fundamental constraint in machine learning applications to complex ecological systems: severe class imbalance in training data can limit operational performance regardless of algorithm selection. The following sections present these fine-scale results as exploratory findings that illuminate current methodological limitations and specify the data collection strategies required to advance operational benthic habitat mapping toward finer ecological scales.
The comprehensive machine learning algorithm comparison for benthic habitat mapping in the Puck Lagoon revealed significant differences in performance across classification scenarios and model complexities. Overall accuracy between 43.3% and 93.3% and Cohen’s kappa coefficients between 0.186 and 0.506 demonstrate the overriding significance of matching algorithm selection to classification complexity. The improved performance of the binary classification models, with Zostera marina presence/absence detection providing 93.3% overall accuracy, is in accordance with fundamental remote sensing classification principles in which lower class numbers tend to improve discrimination potential [66].
The performance hierarchy exhibited in this study—binary classification outperforming multi-class endeavors—reflects inherent constraints in current machine learning applications to complex ecological systems and demonstrates fundamental principles that should guide future benthic habitat monitoring program design. Random Forest algorithm provided consistent results in lower complexity conditions (EUNIS 3 classification: 86.7% accuracy), while Support Vector Machine gave optimum results in binary classification applications. The trend demonstrates that ensemble methods like Random Forest provide dependable solutions to habitat mapping of moderate complexity, while the SVM method is particularly useful for presence/absence detection applications.
The compromise between model performance and classification complexity illustrated in this study reflects fundamental machine learning principles that have important implications for biodiversity monitoring programs. The observed performance degradation with increasing habitat classes demonstrates the classic trade-off between ecological detail and mapping accuracy that is both expected and theoretically grounded. This pattern arises from three interconnected technical factors: First, mathematical complexity increases exponentially with the number of classes, as each additional habitat type introduces new decision boundaries that must be learned from finite training data, leading to increased model variance and reduced generalization capability. Second, class imbalance and environmental overlap become increasingly problematic at finer classification levels, where habitat classes often exist along environmental gradients rather than discrete boundaries [67]. Our results demonstrate this principle, as most models achieved effective classification for only 2–3 classes regardless of the theoretical 10-class space, indicating that environmental predictors alone may be insufficient to discriminate between ecologically similar but taxonomically distinct habitat types. Third, sample size requirements grow non-linearly with classification complexity, as the “curse of dimensionality” becomes problematic when feature space dimensionality approaches the number of training samples per class [68].

4.2. Feature Selection and Environmental Predictors

The Boruta feature selection algorithm results displayed distinctive environmental predictor importance patterns for every classification scenario, highlighting the multicomplexity of environmental–benthic habitat relationships. In the EUNIS Level 3 classification, the relative importance of slope, ALB intensity, and DEM indicates that broad-scale geomorphometric and optical features are key discriminators for substrate-based habitat classes. The transition to finer classifications (EUNIS Level 4/5) showed increased importance of terrain derivatives (aspect and TRI) and spectral information (red band of orthophoto), suggesting that multi-dimensional environmental characterization is required for fine-scale habitat discrimination.
The lack of important features for Zostera marina classification with extended temporal datasets (2010–2023) is a key result, highlighting the possibility that classical environmental predictors alone may be inadequate for seagrass distribution modeling at temporal scales. This shortfall required all the primary features to be used (Model 2) instead of feature-selected subsets (Model 1), implying that seagrass distribution is governed by intricate environmental interactions that cannot be suitably represented by standard feature selection methods [69].
The differential feature importance across models reflects the hierarchical nature of environmental controls on Zostera marina distribution. EUNIS-based models emphasize geomorphometric variables (aspect, slope, and TRI) and optical features (ALB intensity and spectral bands), indicating that broad-scale physical habitat structure remains the primary discriminator for substrate-based classifications. The dominance of aspect and MBES backscatter in species-specific models suggests that fine-scale acoustic properties and seafloor orientation are critical for biological community prediction. The inability of the Boruta algorithm to identify significant features for the 2010–2023 Zostera marina dataset indicates that temporal habitat dynamics are governed by complex, non-linear environmental interactions that exceed the discriminatory power of individual static predictors.
The hierarchical pattern of feature importance across the EUNIS classification levels reflects fundamental ecological principles governing benthic community organization. At broad habitat scales (EUNIS Level 3), physical factors controlling sediment transport and deposition (slope, ALB intensity, and bathymetry) determine substrate characteristics that constrain potential biological assemblages. The transition to finer biological classifications (EUNIS 4/5) reveals the critical importance of microtopographic complexity (TRI) and local hydrodynamics (aspect) in creating the habitat heterogeneity necessary for specialized community development. TRI’s prominence at higher classification levels reflects the dependence of diverse epibenthic assemblages on small-scale refugia, feeding structures, and settlement surfaces that enhance niche partitioning and species coexistence.
The spectral features’ importance (red band) at fine classification scales likely reflects their sensitivity to benthic primary production and organic matter distribution, distinguishing actively productive habitats from those dominated by detrital processing. MBES backscatter’s significance for species-level classification emphasizes the role of substrate acoustic properties in determining community composition, with backscatter intensity correlating with substrate consolidation, biogenic structure development, and epibenthic activity levels.

Temporal Dynamics and Environmental Predictors

The absence of significant features for the 2010–2023 Zostera marina dataset represents a critical finding highlighting the limitations of static environmental predictors for modeling dynamic ecological systems. This result suggests that seagrass distribution during this recovery period was governed primarily by temporal environmental variability rather than persistent topographic controls. Several mechanisms may explain this pattern:
First, the documented nutrient load reductions during 1995–2020 created non-stationary relationships between habitat suitability and environmental predictors, with Zostera marina distribution reflecting transitional ecosystem states rather than equilibrium conditions. Second, ecological memory effects may decouple current distribution from contemporary environmental suitability, as areas degraded during peak eutrophication periods may require decades for sediment biogeochemical recovery and propagule recolonization.
Most critically, this finding underscores the need for dynamic oceanographic predictors that capture temporal environmental variability. Future modeling efforts should incorporate time-varying factors, including seasonal temperature regimes, light availability dynamics influenced by water column properties, nutrient concentration fluctuations, and salinity variations that directly influence seagrass physiological performance and competitive interactions. The integration of such dynamic predictors may be essential for understanding and predicting seagrass recovery trajectories in degraded coastal ecosystems.

4.3. Effectiveness of Object-Based Image Analysis

The OBIA application was moderately effective in different habitats and classification scenarios. The geometric descriptors, in particular, roundness, compactness, and shape index, proved valuable for the EUNIS Level 4 classification, with roundness, in addition to the classical remote sensing variables, being significant in this approach. This result supports the hypothesis that benthic habitat patches present some typical spatial patterns, quantifiable with object-based geometric analysis [70].
However, the existence of sharp class boundaries in many of the generated maps, which correspond directly to the inherent spatial representation artifacts of the input dataset, exemplifies an important limitation in OBIA-based approaches applied to heterogeneous datasets of remote sensing data. The spatial discontinuities, specifically in ALB intensity and MBES backscatter-derived classifications, indicate an urgent need for refining the procedures used in integrating the datasets so that artificial boundary effects that result in non-natural habitat transitions can be eliminated.
Despite the challenges inherent in applying geometric descriptors to marine environments—where habitat patches often lack sharply defined edges—our Boruta feature selection results (Figure 3b) demonstrate that roundness exhibited a consistently higher median importance score than its permuted shadow counterparts. This finding aligns with previous marine OBIA studies that have successfully leveraged geometric metrics to discriminate benthic habitats. Ierodiaconou, Schimel, Kennedy, Monk, Gaylard, Young, Diesing, and Rattray [7] showed that object perimeter complexity and shape indices improved habitat differentiation in shallow reef environments, while Phinn, Roelfsema, and Mumby [70] demonstrated that roundness and compactness metrics enhanced discrimination of coral geomorphic zones in ultra-high-resolution bathymetry. These studies validate the inclusion of geometric descriptors for mapping benthic habitats where texture and spectral signatures alone may be insufficient.
The implementation of OBIA in this study was predicated on literature-based evidence of its effectiveness for habitat mapping rather than direct comparison with pixel-based approaches within our study framework. While this represents a methodological limitation, our results demonstrate both the capabilities and constraints of OBIA for benthic habitat classification. The geometric descriptors (roundness, compactness, shape index) proved valuable for EUNIS Level 4 classification, supporting the hypothesis that benthic habitat patches exhibit quantifiable spatial patterns. However, the presence of artificial boundaries corresponding to input dataset artifacts highlights the need for improved data fusion protocols when applying OBIA to multi-source remote sensing data. Future studies should incorporate direct comparative analysis between OBIA and pixel-based approaches to validate the assumed advantages of object-based methods for marine habitat mapping applications.

4.4. Class Imbalance as Fundamental Constraint on Fine-Scale Classifications: Data Requirements for Advancement

The extreme class imbalance encountered across all the classification scenarios emerged as the primary factor limiting fine-scale habitat classification accuracy, independent of algorithm selection or model architecture. This finding has profound implications for operationalizing benthic habitat mapping and necessitates explicit specification of future data collection requirements. The results presented here serve as a quantitative foundation for designing next-generation ground-truth sampling campaigns that can support finer ecological resolution.
The pervasive impact of class imbalance on all the classification scenarios is among the most critical issues encountered in this study. Despite the theoretical multi-class situations, most of the models were able to classify correctly for at most 2–3 classes regardless of the initial class space, which indicates that the restriction is with sample representation rather than algorithmic complexity. The extreme reduction in class from 10 to 2 principal classes in the EUNIS 4/5 classification is an example of how extremely unbalanced datasets worsen model generalizability [14].
The misleading nature of overall accuracy in severely imbalanced datasets is exemplified in our results, where several models achieved seemingly acceptable OA values (>60%) while completely failing to classify 4–6 out of 6–10 theoretical classes. This demonstrates the critical importance of examining confusion matrices and class-specific performance metrics rather than relying solely on overall accuracy measures for habitat mapping applications with imbalanced training data.
The better model performance with larger, more temporally dynamic datasets (2010–2023 Zostera marina samples: 76.5% vs. 2023 samples: 93.3% accuracy with low generalizability) also suggests that the temporal sampling design may be more critical than spatial sampling density for certain habitats. The implication has important consequences for future ground-truth data collection protocols, with the need for long-term monitoring programs rather than intensive single-season campaigns [71].
The serious class imbalance observed across all the classification scenarios represents a fundamental challenge requiring geostatistical consideration. Our analysis revealed extreme distributional skewness, with dominant classes (MB5321: 36 samples; MB537/538/539: 26 samples) overwhelming minority classes (MB4322: 1 sample; MB6321/6322: 2 samples each). This imbalance pattern follows a power-law distribution characteristic of ecological communities, where few species dominate while many remain rare.
The clustering of samples within similar habitat patches likely introduced positive spatial autocorrelation, potentially inflating classification accuracy estimates. The effective sample size for model training was, therefore, lower than the nominal sample count, particularly affecting minority habitat classes. This spatial dependency violates the independence assumptions of traditional accuracy assessment methods.
Accuracy assessment acknowledged potential bias from spatial autocorrelation in ground-truth samples and class imbalance effects. Cohen’s kappa coefficients were interpreted cautiously, with values below 0.3 considered unreliable for operational use and those above 0.4 suitable for scientific applications, following recommendations for imbalanced datasets [22]. The extreme class reduction observed in multi-class scenarios (10 classes → 2 effective classes) indicates that classification limitations stem from sampling representation rather than algorithmic complexity.
The fine-scale habitat maps produced at EUNIS Level 4/5 and dominant species resolution should be regarded as exploratory outputs rather than operational products. Due to severe class imbalance and limited sample representation, these maps do not reliably capture the distribution of rare habitat types and therefore have low practical value for management decisions. For applications requiring robust and actionable habitat information, coarser classification levels—such as EUNIS Level 3—offer substantially greater reliability under the current data constraints. Future improvements in sampling design and data balance will be essential before fine-scale classifications can be considered for operational use.
Future studies should implement (1) spatially balanced sampling designs using generalized random-tessellation stratified (GRTS) approaches to minimize spatial autocorrelation effects, (2) adaptive sampling strategies that oversample rare habitat types to achieve more balanced training datasets, and (3) temporal stratification to capture seasonal habitat variability and transitional states.
To advance operationally defensible fine-scale benthic habitat classifications at EUNIS Level 4–5 and dominant species levels, several data collection strategies are recommended. The current sampling captured dominant classes (n = 26–36), while rare classes received only one or two samples. Achieving balanced representation would require a minimum of 50–80 samples per rare habitat type, necessitating spatial stratification focused on rare habitat patches identified through preliminary bathymetric and acoustic surveys. Multi-temporal ground-truth campaigns are also essential; the results from the extended 2010–2023 Zostera dataset demonstrated improved classification performance (kappa = 0.439) compared to single-season sampling. This suggests that temporal sampling design may be more critical than spatial density for certain habitat types, particularly those exhibiting seasonal or interannual variability. Expanded taxonomic resolution is another priority, as current species-level identifications were limited by time constraints during field operations. Enhanced microscopic analysis and molecular identification techniques (e.g., DNA barcoding for meiofaunal communities) would reduce misclassification errors in infaunal categories. Finally, controlled geographic replication is needed, as ground-truth sampling was concentrated within a single lagoon system. Replication across multiple Baltic Sea coastal habitats would test the transferability of classification models and help identify habitat-specific confounding variables.

4.5. Change Detection Analysis and Temporal Habitat Dynamics

The comparison across modeling approaches revealed important methodological considerations for change detection analysis. The extended temporal dataset (2010–2023 samples) provided more conservative loss estimates and higher spatial swap values, suggesting that incorporation of multi-temporal ground-truth data may better capture habitat dynamics and transitional areas. However, even this most optimistic approach still indicated catastrophic ecosystem degradation over the 66-year study period.
The analysis of change detection revealed catastrophic habitat loss of Zostera marina in all modeling strategies, ranging from 84.1% to 99.0% loss over the period of study (66 years). The concordance of extreme habitat loss among methodologically diverse strategies (EUNIS classification, integrated descriptors, binary presence/absence models) provides robust evidence of ecosystem degradation that is independent of methodological errors. Total historical coverage of 61.15% of the study area, reducing to current ranges of 0.63–9.70% is among the most appalling seagrass habitat losses documented in Baltic Sea ecosystems [72].
The spatial exchange components between 0.30 and 11.05% between models indicate that habitat movement has indeed occurred, but the magnitude of net losses (51.45–60.51%) is far greater than any balancing spatial redistribution. This pattern suggests that habitat degradation processes have surpassed mechanisms for natural resilience, or ecosystem-level as opposed to mere spatial reorganization [73]. The longer temporal series (2010–2023) with maximum spatial exchange (11.05%) and minimum net loss (51.45%) suggests that recent decades may have witnessed augmented mobility of habitats, most probably as a consequence of adaptive change in response to fluctuating environmental conditions.
The substantial variation in Zostera marina loss rates between models (84.1–99.0%) reflects critical differences in input data characteristics and classification methodologies rather than measurement uncertainty. The combined sediment-species model’s 99.0% loss rate represents the most stringent habitat definition, requiring simultaneous presence of appropriate substrate conditions and Zostera marina-dominated biological assemblages. Conversely, the extended 2010–2023 dataset model’s lower loss estimate (84.1%) contains multi-temporal ground-truth data that better captures habitat transition dynamics and intermediate recovery phases.
Environmental analysis of the most severely impacted areas reveals consistent patterns: fine to medium sand substrates with increased silt content, intermediate water depths (2–5 m), low terrain complexity (TRI), and proximity to anthropogenic nutrient sources. These characteristics align with eutrophication-driven habitat degradation processes documented in the additional ecological literature [74], where increased nutrient loading leads to Zostera marina algae proliferation, light attenuation, and subsequent seagrass mortality [75].
The temporal dataset’s higher spatial swap component (11.05 km2 vs. 0.30–2.62 km2 in other models) suggests that recent decades have witnessed increased habitat mobility, potentially reflecting adaptive responses to changing environmental conditions or early stages of ecosystem recovery following nutrient load reductions documented in regional monitoring programs.
Seasonal timing of surveys influences apparent seagrass extent. Our contemporary data represent early-season cover, prior to full leaf development, while the 1957 baseline reflects peak biomass. Consequently, change detection may overestimate net loss by 5–15% due to seasonal phenology. Future studies should align historical and modern surveys within the same phenological window or apply phenology-based correction factors.
The persistence of extreme habitat loss across all the modeling approaches, even after accounting for maximum (15%) seasonal correction, provides exceptionally strong evidence that the documented decline represents genuine ecosystem-level transformation rather than methodological artifact. The fact that even the most conservative corrected estimate (69% loss) far exceeds natural ecosystem variability or recovery thresholds demonstrates the magnitude of ecosystem degradation.

4.6. Methodological Limitations and Uncertainty Assessment

There are certain methodological limitations that must be kept in mind when interpreting the results. Historical reference data for 1957 used as a point of comparison introduces temporal bias into baseline habitat definitions and spatial precision requirements that may not have been achieved by the contemporary precision of remote sensing technology [40]. Merging multi-source remote sensing data (ALB, MBES, satellite imagery) created artifacts in space that propagated through classification, such as the potential for systematic bias in habitat boundary definition.
The nadir area high-intensity effect visible in the ALB intensity data (Figure 1c) represents another systematic artifact that requires consideration. This phenomenon, common in bathymetric LiDAR systems, results from enhanced backscatter intensities at near-nadir viewing angles due to specular reflection components and reduced water column path length variations. While this effect can potentially introduce bias in sediment classification applications that rely heavily on ALB intensity values, several factors mitigate its impact in our study. First, our multi-sensor integration approach reduces dependency on any single data source, with MBES backscatter providing complementary acoustic information for substrate characterization. Second, the object-based image analysis framework aggregates information spatially, reducing the influence of individual pixel-level artifacts. Third, our Boruta feature selection algorithm demonstrated that ALB intensity, while significant for broad substrate classification (EUNIS Level 3), was not consistently selected across all the classification scenarios, suggesting the algorithm’s ability to distinguish between genuine environmental signals and systematic artifacts. Nevertheless, future studies utilizing ALB intensity for benthic habitat mapping should implement nadir bias correction algorithms [references from search results] or restrict analysis to off-nadir areas where this effect is minimized.
Models with kappa values below 0.3 are questionable for operational application, while those above 0.4 are sufficient for science and management applications. The threshold-based interpretation means that only a few of the modeling approaches of this study are suitable for conservation planning applications. However, due to the complexity of interpreting the kappa statistic, its application should be approached with caution [22,76].
The 1957 historical baseline data, derived from systematic diving surveys by Ciszewski, Demel, Ringher, and Szatybełko [63], represents the most comprehensive pre-degradation seagrass assessment available for the Puck Lagoon. However, fundamental methodological differences between historical and contemporary data collection introduce quantifiable uncertainties that require explicit assessment.
The 1957 surveys employed scientific diving methods with spatial resolution limited to 10–50 m visual patch estimates and positional accuracy of ±50–100 m using celestial navigation techniques. Coverage assessment relied on qualitative abundance classes recorded in hand-drawn charts, contrasting sharply with modern 0.5 m pixel resolution multi-sensor remote sensing data achieving ±0.1–0.5 m positional accuracy through GPS/GNSS systems. To quantify the impact of historical data uncertainty on change detection conclusions, we evaluated four error scenarios representing potential systematic biases: conservative coverage estimates (20% underestimate), liberal coverage estimates (20% overestimate), positional errors (5% area discrepancy), and habitat classification errors (10% misclassification rate).
Under maximum uncertainty conditions (±20% baseline error), adjusted loss rates range from 80.2% to 99.1% across all the modeling approaches, with typical deviations of ±2–4% from original estimates. Critically, even the most conservative uncertainty scenario (20% historical underestimate) yields >80% habitat loss in all the models, substantially exceeding natural variation or recovery thresholds.
The convergence of catastrophic loss estimates (84.1–99.0%) across methodologically diverse classification approaches—including EUNIS hierarchical schemes, combined descriptor models, and binary presence-absence algorithms—provides robust evidence of ecosystem degradation independent of historical data precision limitations. The consistency of conclusions despite 100-fold improvements in spatial resolution and 200-fold improvements in positional accuracy demonstrates that the observed habitat collapse represents genuine ecological change rather than a methodological artifact.

4.7. Ecological Implications and Conservation Significance

The documented Zostera marina habitat loss represents a critical ecological crisis with cascading implications for Baltic Sea ecosystem function. Seagrass beds promote essential ecosystem services, including nursery habitat, sediment stabilization, and carbon sequestration, and their significant loss in the Puck Lagoon is therefore a regional environmental calamity [77]. The spatial patterns of habitat loss and persistence discerned through change detection analysis provide critical information for the prioritization of residual seagrass patches for protection and the identification of target restoration areas.
The compromise between model performance and classification complexity illustrated in this study has important implications for biodiversity monitoring programs [78]. That simpler classifications performed better suggests that management-driven habitat mapping will require trade-offs between reliability of mapping and ecological resolution. Binary presence/absence models of iconic indicator species like Zostera marina will probably deliver more decision-ready information for conservation planning than multi-class habitat classifications with low discrimination performance.

Anthropogenic Drivers and Spatiotemporal Correlation Analysis

The documented Zostera marina habitat loss exhibits strong spatiotemporal correlation with quantified anthropogenic stressors, providing empirical support beyond general speculation. Historical phosphate monitoring data reveal direct correspondence between nutrient enrichment and seagrass decline: peak concentrations of 1.35 μmol/L−1 (1986–1991) coincided with Zostera marina biomass nadirs of 4.5 g dw/m2—representing 87.8% biomass reduction from 1950s baseline levels of 37.0 g dw/m2 [79,80].
Multiple pollution vectors operated synergistically during the critical degradation period (1960s–1980s): municipal sewage outfalls from Hel Peninsula settlements and Gdynia discharged inadequately treated effluents directly to lagoon waters, while agricultural runoff from Reda, Płutnica, and Gizdepka catchments delivered chronic nutrient loads. The mechanistic pathway involved preferential uptake of N and P compounds by opportunistic filamentous algae (Pilayella, Ectocarpus), creating light-limited conditions and oxygen-depleted sediments that precluded seagrass persistence [11].
Physical habitat destruction through commercial macroalgae harvesting operations compounded chemical stressors, with seabed dredging activities directly disrupting seagrass rhizome networks and modifying substrate characteristics [81]. The combined effect generated ecosystem-scale collapse by the late 1970s, with filamentous algae dominance documented as early as 1979 [82].
The annual normalized total nitrogen load for the period 1995–2020 showed a statistically significant (p < 0.05) decreasing trend for the Vistula River catchment (approximately 23%) and for the Pomeranian and Przymorze rivers (approximately 16%). The annual normalized total phosphorus load for the same period also exhibited a statistically significant (p < 0.05) and pronounced decreasing trend for the Pomeranian and Przymorze rivers (approximately 42%) [10]. However, ecosystem recovery lags behind water quality improvements due to complex biogeochemical and ecological memory effects, emphasizing the importance of sustained management interventions.

4.8. Technological Integration and Future Directions

A performance comparison of the remote sensing technologies incorporated in this study provides lessons for planning future benthic habitat mapping. Because ALB intensity can be utilized in coarse habitat discrimination means that multi-sensor approaches continue to be the only way to map all of the biotopes successfully, while MBES backscatter may be more suitable for species-level classification. However, spatial artifacts generated as a byproduct of dataset integration bear witness to the fact that technological advancement must be complemented by more sophisticated data fusion algorithms [40].
That aspect and terrain ruggedness have been the consistently strong predictors across diverse classification settings and are evidence of the versatility of high-resolution bathymetric derivatives for habitat discrimination [83,84]. Standardized geomorphometric feature extraction routines that could be consistently applied across a suite of sensor systems and study locations need to be the subject of further research [85,86]. The modest success of feature selection on temporal data indicates that seagrass distribution modeling might necessitate different strategies, possibly using oceanographic predictors or trend modeling over time rather than static environmental predictors [87].

4.9. Management Applications and Operational Considerations

Empirical use of the results of this study in nearshore zone management entails careful regard for model reliability thresholds and uncertainty propagation. Confining allowable model-performance combinations to those of interest for operational use (binary classifications with kappa > 0.4) provides decisionally relevant counsel to managers implementing habitat monitoring programs. The extensive habitat loss indicated by change detection analysis establishes urgent priorities for restoration intervention and regulatory protection of the remaining seagrass.
The magnitude of altering habitats in this study (full conversion of the lagoon ecosystem) requires that management reactions operate at landscape levels as opposed to levels applicable to patches of habitats. The evidence of habitat reallocation as well as net loss requires adaptive management regimes to be guided to anticipate continued spatial reorganization of remaining habitats while trying to stop additional degradation of ecosystems. The methodological strategy presented in this study provides a repeatable technique for similar change detection analysis across other shallow coastal ecosystems, contributing to the general understanding of anthropogenic impact on marine ecosystems [88].

5. Conclusions

This comprehensive work demonstrates the scope and limitations of machine learning methods for benthic habitat mapping in shallow coastal environments, while also revealing catastrophic ecosystem transformations throughout the Puck Lagoon over 66 years. Integration of multiple remote sensing instruments (ALB, MBES, SDB) with object-based image analysis provided vital information on the classification performance of habitats, although key methodological challenges emerged in class imbalance, feature selection, and spatial artifact propagation. The improved performance of binary classifier models (93.3% accuracy for presence/absence of Zostera marina) compared to complex multi-class approaches (43.3% accuracy for EUNIS 4/5) reflects the intrinsic trade-off between ecological resolution and mapping consistency in practical habitat monitoring schemes. Boruta feature selector revealed characteristic environmental predictor importance trends across classification contexts, with geomorphometric (slope, aspect, TRI) and optical (ALB intensity, spectral bands) variables being top discriminators.
The change detection analysis documented one of the most severe seagrass habitat losses on record in Baltic Sea ecosystems, and Zostera marina cover reduced 84.1–99.0% since 1957, from 61.15% to a bare 0.63–9.70%, with different modeling approaches. The consistent pattern of catastrophic loss of habitat via methodologically different classification methods offers solid evidence of ecosystem-level degradation resistant to methodological error, with net losses (51.45–60.51%) overwhelming any compensatory spatial rearrangement by way of habitat transfer. Such findings point to the imperatively necessary landscape-scale conservation interventions and adaptive management actions for mitigating continued spatial reorganization of current habitats while attempting to forestall further ecosystem degradation. The methodological protocol developed herein provides a replicable approach to similar change detection analysis in other shallow coastal ecosystems that works towards enhanced understanding of the anthropogenic forces on marine ecosystems and the formulation of key baselines for restoration planning and biodiversity conservation practices.
This study identified two classification approaches suitable for immediate application in conservation planning and resource management. First, EUNIS Level 3 habitat maps (substrate-based classification, OA = 86.7%) provide spatially explicit habitat information for identifying broad-scale habitat types and evaluating ecosystem composition. Second, binary Zostera marina presence/absence maps (OA = 93.3%) deliver the highest-confidence products for this critical indicator species and ecosystem engineer, supporting targeted conservation prioritization and restoration site selection. All the conservation recommendations and management applications presented herein derive exclusively from these defensible models.
Fine-scale habitat classifications at EUNIS Level 4–5 and dominant species levels represent important research frontiers but currently lack the statistical robustness required for operational deployment. Our exploratory results demonstrate both the sophistication of state-of-the-art machine learning approaches to benthic ecology and the specific data constraints that must be overcome. The clear identification of these constraints—particularly severe class imbalance and insufficient sample sizes for rare habitat types—provides a quantitative roadmap for future ground-truth data collection campaigns. These improvements will eventually enable operationally defensible fine-scale habitat mapping in benthic ecosystems.
The documented Zostera marina habitat loss of 84.1–99.0% (depending on modeling approach) represents one of the most severe seagrass ecosystem collapses recorded in Baltic Sea coastal waters. This finding is subject to systematic bias from seasonal phenological mismatch: the 1957 baseline reflects peak summer biomass, while contemporary surveys represent early spring conditions. Accounting for this 5–15% potential overestimation due to seasonal phenology, corrected loss estimates range from approximately 69–99%, still representing catastrophic ecosystem degradation. The robustness of extreme loss estimates across all the methodologically diverse approaches—despite substantial inherent uncertainty from phenological variation—provides compelling evidence of genuine ecosystem-level transformation. These findings establish urgent priorities for landscape-scale seagrass restoration and regulatory protection of remaining meadows.

Supplementary Materials

The following supporting information can be downloaded at: https://www.mdpi.com/article/10.3390/rs17223725/s1, File S1: Geodatabase.

Author Contributions

Conceptualization, Ł.J.; methodology, Ł.J. and A.B.; data acquisition, Ł.J. and M.K.; data processing: Ł.J.; data curation: Ł.J., M.M. and A.T.; resources: Ł.J., A.B. and K.Z.; software: Ł.J.; validation: Ł.J., investigation: Ł.J. and M.N.; writing—original draft preparation, Ł.J.; writing—review and editing of the manuscript, Ł.J., visualization, Ł.J.; supervision, Ł.J. and J.G.; project administration, Ł.J. and J.G.; funding acquisition, Ł.J. All authors have read and agreed to the published version of the manuscript.

Funding

This research was funded in whole or in part by the National Science Centre, Poland [Grant number: 2021/40/C/ST10/00240]. The MBES backscatter processing part of the research was funded by Gdynia Maritime University [project number: IM/2025/PI/01].

Data Availability Statement

All remote sensing datasets utilized in this paper can be accessed through the Marine Geoscience Data System [89]. The results of predictive modeling are in the Supplementary Materials.

Acknowledgments

The authors gratefully acknowledge the skilled support provided by the crews of the research boats IMOROS 2 and IMOROS 3 during the field surveys. Special thanks are also extended to the Offshore Geotechnics Department of the Maritime Institute at Gdynia Maritime University for their laboratory assistance with sediment analysis.

Conflicts of Interest

The authors declare no conflicts of interest.

Abbreviations

The following abbreviations are used in this manuscript:
ALBAirborne LiDAR Bathymetry
MBESMultibeam Echosounder
KNNK-Nearest Neighbors
RFRandom Forest
SVMSupport Vector Machine
GTGround-Truth
TRITerrain Ruggedness Index
EUNISEuropean Nature Information System
OBIAObject-Based Image Analysis

Appendix A

Table A1. List of ground-truth samples collected and used for training and testing machine learning classifiers within this study, with their geological and biological descriptions. The depth is expressed in meters.
NoDepthXYSediment AnalysesDescription of the Video Recordings
11.618.395554.7299fine SAND with medium sandvascular plants rooted in the seabed: Stuckenia pectinata, Cerastoderma glaucum shells, Stuckenia pectinata covered with mats of Zostera marina brown algae
22.418.398854.7350fine SANDvascular plants in the seabed: Stuckenia pectinata; Charales green algae; all covered with dense algal mat
32.518.410254.7235medium SAND and fine SANDMya arenaria shells; single stems of Stuckenia pectinata
43.318.412654.7406fine SAND with medium sandvascular plants in the bottom: Stuckenia pectinata; all covered with dense algal mat; shells of Cerastoderma glaucum
52.918.412654.7549fine SAND with medium sandvascular plants: Stuckenia pectinata; prominent Charales green algae; all covered with dense algal mat
63.018.413854.7298sandy SILTvascular plants: Stuckenia pectinata; all covered with dense algal mat;
74.018.425454.7330sandy SILTvascular plants: Stuckenia pectinata; all covered with dense algal mat;
83.418.416654.7500silty SANDvascular plants: Stuckenia pectinata; all covered with dense algal mat;
94.218.424454.7404fine SANDplants in the bottom: Stuckenia pectinata; prominent Charales green algae and probably Zostera marina; all covered with dense algal mat
104.218.427754.7263sandy SILTshells mainly of Mya arenaria; single stems of Stuckenia pectinata covered with algal mats
113.418.424354.7557silty SANDvascular plants: Stuckenia pectinata; all covered with dense algal mat
123.518.425654.7518silty SANDvascular plants: Stuckenia pectinata; visible Charales green algae; all covered with dense algal mat
133.418.436754.7446fine SANDvascular plants: Stuckenia pectinata; all covered with dense algal mat
144.518.439354.7337fine SANDvascular plants in the seabed: Stuckenia pectinata, Zannichellia palustris; all covered with dense algal mat
154.418.439554.7198medium SAND with fine sandsingle stems of vascular plants in the seabed: Stuckenia pectinata; all covered with dense algal mat; shells of Cerastoderma glaucum
164.618.442454.7250sandy clayey SILTshells of Cerastoderma glaucum and Mya arenaria
172.118.440654.7593fine SAND with medium sandvascular plants in bottom: Stuckenia pectinata; Charales green algae; all covered with algal mat
182.918.442254.7516fine SAND with medium sandvascular plants in bottom: Stuckenia pectinata, Zannichellia palustris; Charales green algae; all covered with dense algal mat
192.718.442854.7521fine SAND with medium sandvascular plants: Stuckenia pectinata; Charales green algae; all covered with algal mat
203.118.449554.7286medium SAND with fine sandvascular plants: Stuckenia pectinata; Charales green algae; all covered with algal mat
214.118.450054.7047medium SAND with fine sandsingle stems of vascular plants in the seabed: Stuckenia pectinata; all covered with algal mat; shells of Cerastoderma glaucum; remains of Zostera marina
221.618.450854.7679fine SAND with medium sandvascular plants in bottom: Stuckenia pectinata; Charales green algae; all covered with algal mat
233.118.450254.7342fine SAND and medium SANDvascular plants in bottom: Stuckenia pectinata; Charales green algae; all covered with dense algal mat
241.618.457154.7697fine SAND with medium sandCharales green algae; covered with algal mat
252.218.453954.7519fine SAND with medium sandCharales green algae; single stems of Stuckenia pectinata; covered with algal mat
263.318.456254.7285fine SAND and medium SANDvascular plants: Stuckenia pectinata; all covered with algal mat
273.618.458154.7074medium SAND with coarse and fine sandvascular plants: Zostera marina; covered with algal mat and overgrown with Hydrozoa
282.718.458454.7211medium SAND with fine sandvascular plants: Zostera marina, Stuckenia pectinata; covered with algal mat
292.118.451354.7568fine SANDvascular plants in bottom: Stuckenia pectinata; Charales green algae; covered with algal mat
302.318.460554.7463fine SANDvestigial stems of vascular plants in bottom: Stuckenia pectinata; Charales green algae; all covered with algal mat
312.218.464854.7429fine SANDCharales green algae; covered with algal mat
324.218.466054.7154medium SAND with fine sandvascular plants in the seabed, probably Stuckenia pectinata, Zannichellia palustris; all covered with dense algal mat; remains of Zostera marina
331.618.467354.7629fine SAND with medium sandvascular plants in the seabed: Stuckenia pectinata; Charales green algae
342.318.470454.6614SANDsingle stems of vascular plants in the seabed, probably Stuckenia pectinata, Zannichellia palustris; all covered with algal mat
353.418.470754.6843silty SANDvascular plants in the seabed, probably Stuckenia pectinata, Zannichellia palustris; all covered with dense algal mat
362.018.472654.7364fine SAND with medium sandvascular plants in the seabed: Stuckenia pectinata; Charales green algae; small amounts of algal mat; visible Zostera marina
372.918.474254.7011medium SAND with fine sandvascular plants: Zostera marina and Stuckenia pectinata; covered with algal mat
383.418.475554.6645medium SAND with fine sandvascular plants: Zostera marina and Stuckenia pectinata; covered with algal mat
391.918.475954.6368fine SAND and medium SANDvascular plants: single stems of Stuckenia pectinata; covered with algal mat
402.418.475654.7243fine SAND with medium sandvascular plants: Stuckenia pectinata and Myriophyllum spicatum; Charales green algae; covered with algal mat
414.118.477854.7071medium SANDvascular plants: Zostera marina (overgrown with Hydrozoa), Zannichellia palustris and Stuckenia pectinata; covered with algal mat; Cerastoderma glaucum shells
423.818.477854.6590sandy SILTvascular plants: Zannichellia palustris and probably Stuckenia pectinata; all covered with dense algal mat
432.218.479354.6477medium SAND with coarse sandsingle stems of the bottom vascular plants, probably Stuckenia pectinata; covered with algal mat
441.818.480854.7475medium SAND and fine SANDvascular plants: Stuckenia pectinata; Charales green algae; covered with algal mat
451.718.483254.7382fine SAND with medium sandvascular plants in the bottom: Stuckenia pectinata; Charales green algae; covered with algal mat in small amount
465.418.483754.6875silty SANDloose mat; Cerastoderma glaucum shells
474.918.486854.6732sandy SILTvascular plants in the bottom: Zannichellia palustris; all covered with dense algal mat
481.718.486954.6586medium SAND with coarse sandvestigial stems of vascular plants covered with algal mat
495.018.487354.7078medium SANDsingle stems of vascular plants: Stuckenia pectinata; covered with algal mat; Cerastoderma glaucum shells
504.018.484254.6561sandy SILTalgal mats, Cerastoderma glaucum shells
511.518.488154.6368medium SAND with fine sandvestigial stems of vascular plants: probably Stuckenia pectinata; covered with algal mat
522.718.487954.6409fine SAND with medium sandvascular plants in the bottom: Stuckenia pectinata; all covered with dense algal mat
533.718.488854.6473medium SAND with fine sandsingle stems of vascular plants: Stuckenia pectinata; small amount of algal mat; shells mainly of Cerastoderma glaucum
545.218.488954.6969fine SAND and medium SANDshells of Cerastoderma glaucum
553.318.491554.7450fine SAND with medium sandvascular plants in the bottom: Stuckenia pectinata; overgrown with Hydrozoa; covered with algal mat
564.718.493154.6585sandy SILTsingle stems of Zannichellia palustris, covered with algal mat, remains of Zostera marina
572.618.497154.7139fine SAND with medium sandvascular plants in the bottom: Stuckenia pectinata; overgrown with Hydrozoa; covered with algal mat
582.018.494554.6358medium SAND with fine sandalgal mat, shells of Cerastoderma glaucum, vascular plant stalk remains, probably Stuckenia pectinata
591.818.495954.7501fine SAND and medium SANDvascular plants in the bottom: Stuckenia pectinata; Charales green algae; covered with algal mat in small amount; peat outcrop
604.518.495554.6545silty SANDvascular plant stalk remains: probably Stuckenia pectinata and/or Zannichellia palustris; covered with algal mat
612.818.497854.7440fine SAND with medium sandCharales green algae; covered with algal mat, single stems of Stuckenia pectinata
625.218.500154.6764silty SANDloose mat; shells of Cerastoderma glaucum
632.918.500654.7331fine SANDvascular plants: Stuckenia pectinata; covered with algal mat in small quantity
642.918.501754.7308fine SAND with medium sandvascular plants: Stuckenia pectinata (overgrown with Hydrozoa); Charales green algae visible; covered with algal mat
651.818.502254.7184medium SAND and fine SANDvascular plants: Stuckenia pectinata; covered with algal mat
662.118.504054.7225fine SAND and medium SANDvascular plants: Stuckenia pectinata (overgrown Hydrozoa); covered with algal mat
672.718.504654.7112fine SAND with medium sandvascular plants in the bottom: Stuckenia pectinata (overgrown Hydrozoa); covered with algal mat
685.518.503854.6927fine SAND with medium sandloose mat; Cerastoderma glaucum shells
692.618.505754.7350fine SAND with medium sandvascular plants in the bottom: Stuckenia pectinata (single stems); Charales green algae visible; covered with algal mat
705.218.504854.6644fine SANDloose mat in small quantity; Cerastoderma glaucum shells
713.718.507054.7055fine SAND with medium sandsingle stems of vascular plants: Stuckenia pectinata and Zannichellia palustris, covered with algal mat
724.718.506254.6522silty SANDshells of Cerastoderma glaucum
733.918.507654.6459SANDvascular plants: Zannichellia palustris and Stuckenia pectinata, covered with algal mat
742.418.511054.7224fine SAND with medium sandsingle stems of vascular plants: Stuckenia pectinata, probably remains of green algae visible; covered with algal mat
758.018.523454.7427medium SAND with fine sandvascular plants: Zannichellia palustris and Stuckenia pectinata, covered with algal mat
762.918.512654.6370fine SANDshells mainly of Cerastoderma glaucum
775.818.500054.6833medium SAND and fine SANDshells mainly of Cerastoderma glaucum
785.218.516054.6689fine SANDvascular plants: Zannichellia palustris, covered with algal mat
795.018.516054.6642fine SANDloose algal mats in small amount, shells
802.718.518454.7129fine SAND with medium sandvascular plants in the bottom: Stuckenia pectinata; Charales green algae visible; covered with algal mat
812.818.519454.6603coarse SAND with medium sand and medium gravelSandy bottom
822.818.520154.7166fine SAND with medium sandvascular plants in the bottom: Stuckenia pectinata; covered with algal mat
833.018.522354.7385fine SAND with medium sandloose algal mats, Cerastoderma glaucum shells
844.518.523254.6759fine SAND with medium sandloose algal mats, Cerastoderma glaucum shells, remains of Zostera marina
855.318.521654.6939fine SAND with medium sandvascular plants: Zannichellia palustris and Stuckenia pectinata, covered with dense algal mat
863.418.529054.7100fine SANDvascular plants: Stuckenia pectinata, covered with algal mats
875.018.528654.6867fine SANDsandy bottom, shells
885.918.535454.7394sandy SILTSandy bottom
893.418.533154.6995fine SAND with medium sandvascular plants: Zostera marina, covered with algal mats
902.618.533854.7075medium SAND and fine SANDvascular plants: Zostera marina and Stuckenia pectinata, covered with algal mat
913.318.536054.6871fine SANDvascular plants: Zostera marina and Stuckenia pectinata, covered with algal mat
925.318.540154.7178sandy SILTsandy bottom, shells
932.018.540054.7017medium SAND with fine sandvascular plants: Zostera marina, covered with algal mat
945.918.542754.7381fine SAND and medium SANDsandy bottom
956.018.545354.7088fine SAND and medium SANDsandy bottom, shells
967.018.545354.7278SANDsandy bottom, shells
978.018.563654.7349medium SANDvascular plants: Stuckenia pectinata, covered with dense algal mats
987.018.563154.7278fine SAND with medium sandsandy bottom, shells mainly of Cerastoderma glaucum
992.718.570954.7212medium SAND with fine sandvascular plants: Zostera marina, covered with algal mats
1001.318.578354.7290medium SANDvascular plants: Zostera marina and Stuckenia pectinata, covered with dense algal mats

References

  1. Uścinowicz, S.; Witak, M.; Miotk-Szpiganowicz, G.; Burska, D.; Cieślikiewicz, W.; Jegliński, W.; Jurys, L.; Sydor, P.; Pawlyta, J.; Piotrowska, N. Climate and sea level variability on a centennial time scale over the last 1500 years as inferred from the Coastal Peatland of Puck Lagoon (southern Baltic Sea). Holocene 2020, 30, 1801–1816. [Google Scholar] [CrossRef]
  2. Janowski, Ł.; Skarlatos, D.; Agrafiotis, P.; Tysiąc, P.; Pydyn, A.; Popek, M.; Kotarba-Morley, A.M.; Mandlburger, G.; Gajewski, Ł.; Kołakowski, M.; et al. High resolution optical and acoustic remote sensing datasets of the Puck Lagoon. Sci. Data 2024, 11, 360. [Google Scholar] [CrossRef]
  3. Wicaksono, P.; Aryaguna, P.A.; Lazuardi, W. Benthic Habitat Mapping Model and Cross Validation Using Machine-Learning Classification Algorithms. Remote Sens. 2019, 11, 1279. [Google Scholar] [CrossRef]
  4. Strong, J.A.; Clements, A.; Lillis, H.; Galparsoro, I.; Bildstein, T.; Pesch, R. A review of the influence of marine habitat classification schemes on mapping studies: Inherent assumptions, influence on end products, and suggestions for future developments. ICES J. Mar. Sci. 2019, 76, 10–22. [Google Scholar] [CrossRef]
  5. Coveney, S.; Monteys, X. Integration Potential of INFOMAR Airborne LIDAR Bathymetry with External Onshore LIDAR Data Sets. J. Coast. Res. 2011, 62, 19–29. [Google Scholar] [CrossRef]
  6. Li, Z.; Peng, Z.; Zhang, Z.; Chu, Y.; Xu, C.; Yao, S.; García-Fernández, Á.F.; Zhu, X.; Yue, Y.; Levers, A.; et al. Exploring modern bathymetry: A comprehensive review of data acquisition devices, model accuracy, and interpolation techniques for enhanced underwater mapping. Front. Mar. Sci. 2023, 10, 1178845. [Google Scholar] [CrossRef]
  7. Ierodiaconou, D.; Schimel, A.C.G.; Kennedy, D.; Monk, J.; Gaylard, G.; Young, M.; Diesing, M.; Rattray, A. Combining pixel and object based image analysis of ultra-high resolution multibeam bathymetry and backscatter for habitat mapping in shallow marine waters. Mar. Geophys. Res. 2018, 39, 271–288. [Google Scholar] [CrossRef]
  8. Benz, U.C.; Hofmann, P.; Willhauck, G.; Lingenfelder, I.; Heynen, M. Multi-resolution, object-oriented fuzzy analysis of remote sensing data for GIS-ready information. ISPRS J. Photogramm. Remote Sens. 2004, 58, 239–258. [Google Scholar] [CrossRef]
  9. Blaschke, T.; Hay, G.J.; Kelly, M.; Lang, S.; Hofmann, P.; Addink, E.; Queiroz Feitosa, R.; van der Meer, F.; van der Werff, H.; van Coillie, F.; et al. Geographic Object-Based Image Analysis—Towards a new paradigm. ISPRS J. Photogramm. Remote Sens. 2014, 87, 180–191. [Google Scholar] [CrossRef] [PubMed]
  10. Sokołowski, A.; Jankowska, E.; Balazy, P.; Jędruch, A. Distribution and extent of benthic habitats in Puck Bay (Gulf of Gdańsk, southern Baltic Sea). Oceanologia 2021, 63, 301–320. [Google Scholar] [CrossRef]
  11. Ciszewski, P.; Kruk-Dowgiałło, L.; Andrulewicz, E. A study on pollution of the Puck Lagoon and possibility of restoring the lagoon′s original ecological state. Acta Ichthyol. Piscat. 1991, 21, 29–37. [Google Scholar] [CrossRef]
  12. Bockelmann, A.-C.; Tams, V.; Ploog, J.; Schubert, P.R.; Reusch, T.B. Quantitative PCR reveals strong spatial and temporal variation of the wasting disease pathogen, Labyrinthula zosterae in northern European eelgrass (Zostera marina) beds. PLoS ONE 2013, 8, e62169. [Google Scholar] [CrossRef]
  13. Dybowski, D.; Dzierzbicka-Głowacka, L. Analysis of the impact of nutrients deposited from the land side on the waters of Puck Lagoon (Gdańsk Basin, Southern Baltic): A model study. Oceanologia 2023, 65, 386–397. [Google Scholar] [CrossRef]
  14. Galparsoro, I.; Connor, D.W.; Borja, Á.; Aish, A.; Amorim, P.; Bajjouk, T.; Chambers, C.; Coggan, R.; Dirberg, G.; Ellwood, H. Using EUNIS habitat classification for benthic mapping in European seas: Present concerns and future needs. Mar. Pollut. Bull. 2012, 64, 2630–2638. [Google Scholar] [CrossRef]
  15. Vasquez, M.; Manca, E.; Inghilesi, R.; Martin, S.; Agnesi, S.; Al Hamdani, Z.; Annunziatellis, A.; Bekkby, T.; Pesch, R.; Askew, N.; et al. EUSeaMap 2019, A European Broad-Scale Seabed Habitat Map; Technical Report; EMODnet: Oostende, Belgium, 2020. [Google Scholar]
  16. Populus, J.; Vasquez, M.; Albrecht, J.; Manca, E.; Agnesi, S.; Al Hamdani, Z.; Andersen, J.; Annunziatellis, A.; Bekkby, T.; Bruschi, A.; et al. EUSeaMap. A European Broad-Scale Seabed Habitat Map; Ifremer: Plouzané, France, 2017. [Google Scholar]
  17. Breiman, L. Random Forests. Mach. Learn. 2001, 45, 5–32. [Google Scholar] [CrossRef]
  18. Cortes, C.; Vapnik, V. Support-vector networks. Mach. Learn. 1995, 20, 273–297. [Google Scholar] [CrossRef]
  19. Bremner, D.; Demaine, E.; Erickson, J.; Iacono, J.; Langerman, S.; Morin, P.; Toussaint, G. Output-Sensitive Algorithms for Computing Nearest-Neighbour Decision Boundaries. Discret. Comput. Geom. 2005, 33, 593–604. [Google Scholar] [CrossRef]
  20. Kursa, M.B.; Rudnicki, W.R. Feature Selection with the Boruta Package. J. Stat. Softw. 2010, 36, 1–13. [Google Scholar] [CrossRef]
  21. Landis, J.R.; Koch, G.G. The Measurement of Observer Agreement for Categorical Data. Biometrics 1977, 33, 159–174. [Google Scholar] [CrossRef] [PubMed]
  22. Pontius, R.G.; Millones, M. Death to Kappa: Birth of quantity disagreement and allocation disagreement for accuracy assessment. Int. J. Remote Sens. 2011, 32, 4407–4429. [Google Scholar] [CrossRef]
  23. Agrafiotis, P.; Janowski, Ł.; Skarlatos, D.; Demir, B. MAGICBATHYNET: A Multimodal Remote Sensing Dataset for Bathymetry Prediction and Pixel-Based Classification in Shallow Waters. In Proceedings of the IGARSS 2024 IEEE International Geoscience and Remote Sensing Symposium, Athens, Greece, 7–12 July 2024; pp. 249–253. [Google Scholar]
  24. Janowski, Ł. Advancing Seabed Bedform Mapping in the Kuźnica Deep: Leveraging Multibeam Echosounders and Machine Learning for Enhanced Underwater Landscape Analysis. Remote Sens. 2025, 17, 373. [Google Scholar] [CrossRef]
  25. Janowski, L.; Wroblewski, R.; Dworniczak, J.; Kolakowski, M.; Rogowska, K.; Wojcik, M.; Gajewski, J. Offshore benthic habitat mapping based on object-based image analysis and geomorphometric approach. A case study from the Slupsk Bank, Southern Baltic Sea. Sci. Total Environ. 2021, 801, 149712. [Google Scholar] [CrossRef] [PubMed]
  26. Trzcinska, K.; Janowski, L.; Nowak, J.; Rucinska-Zjadacz, M.; Kruss, A.; Schneider von Deimling, J.; Pocwiardowski, P.; Tegowski, J. Spectral features of dual-frequency multibeam echosounder data for benthic habitat mapping. Mar. Geol. 2020, 427, 106239. [Google Scholar] [CrossRef]
  27. Si-Moussi, S.; Hennekens, S.; Mücher, S.; De Keersmaecker, W.; Chytrý, M.; Agrillo, E.; Attorre, F.; Biurrun, I.; Bonari, G.; Čarni, A. EUNIS Habitat Maps: Enhancing Thematic and Spatial Resolution for Europe through Machine Learning. arXiv 2025, arXiv:2506.13649. [Google Scholar] [CrossRef]
  28. Leblanc, C.; Bonnet, P.; Servajean, M.; Chytrý, M.; Aćić, S.; Argagnon, O.; Bergamini, A.; Biurrun, I.; Bonari, G.; Campos, J.A. A deep-learning framework for enhancing habitat identification based on species composition. Appl. Veg. Sci. 2024, 27, e12802. [Google Scholar] [CrossRef]
  29. Diesing, M.; Mitchell, P.; Stephens, D. Image-based seabed classification: What can we learn from terrestrial remote sensing? ICES J. Mar. Sci. 2016, 73, 2425–2441. [Google Scholar] [CrossRef]
  30. Montereale Gavazzi, G.; Madricardo, F.; Janowski, L.; Kruss, A.; Blondel, P.; Sigovini, M.; Foglini, F. Evaluation of seabed mapping methods for fine-scale classification of extremely shallow benthic habitats—Application to the Venice Lagoon, Italy. Estuar. Coast. Shelf Sci. 2016, 170, 45–60. [Google Scholar] [CrossRef]
  31. Anderson, R.O.D. High Resolution Remote Sensing of Eelgrass (Zostera marina) in South Slough, Oregon. Master’s Thesis, University of Oregon, Eugene, OR, USA, 2020. [Google Scholar]
  32. Moniruzzaman, M.; Islam, S.; Lavery, P.; Bennamoun, M.; Lam, C.P. Imaging and classification techniques for seagrass mapping and monitoring: A comprehensive survey. arXiv 2019, arXiv:1902.11114. [Google Scholar] [CrossRef]
  33. Dunic, J.C.; Brown, C.J.; Connolly, R.M.; Turschwell, M.P.; Côté, I.M. Long-term declines and recovery of meadow area across the world’s seagrass bioregions. Glob. Change Biol. 2021, 27, 4096–4109. [Google Scholar] [CrossRef]
  34. Lyons, M.B.; Phinn, S.R.; Roelfsema, C.M. Long term land cover and seagrass mapping using Landsat and object-based image analysis from 1972 to 2010 in the coastal environment of South East Queensland, Australia. ISPRS J. Photogramm. Remote Sens. 2012, 71, 34–46. [Google Scholar] [CrossRef]
  35. Lango, M.; Stefanowski, J. What makes multi-class imbalanced problems difficult? An experimental study. Expert Syst. Appl. 2022, 199, 116962. [Google Scholar] [CrossRef]
  36. Lecours, V.; Devillers, R.; Schneider, D.C.; Lucieer, V.L.; Brown, C.J.; Edinger, E.N. Spatial scale and geographic context in benthic habitat mapping: Review and future directions. Mar. Ecol. Prog. Ser. 2015, 535, 259–284. [Google Scholar] [CrossRef]
  37. Lamarche, G.; Orpin, A.; Mitchell, J.; Pallentin, A. Chapter 5: Benthic habitat mapping. In Biological Sampling in the Deep Sea; Clark, M.R., Consalvey, M., Rowden, A.A., Eds.; Wiley-Blackwell: Hoboken, NJ, USA, 2016; pp. 80–102. [Google Scholar]
  38. Mohamed, H.; Nadaoka, K.; Nakamura, T. Semiautomated mapping of benthic habitats and seagrass species using a convolutional neural network framework in shallow water environments. Remote Sens. 2020, 12, 4002. [Google Scholar] [CrossRef]
  39. Menandro, P.S.; Misiuk, B.; Brown, C.J.; Bastos, A.C. Multispectral multibeam backscatter response of heterogeneous rhodolith beds. Sci. Rep. 2023, 13, 20220. [Google Scholar] [CrossRef]
  40. Zhang, C. Applying data fusion techniques for benthic habitat mapping and monitoring in a coral reef ecosystem. ISPRS J. Photogramm. Remote Sens. 2015, 104, 213–223. [Google Scholar] [CrossRef]
  41. Hasan, R.; Ierodiaconou, D.; Laurenson, L.; Schimel, A. Integrating multibeam backscatter angular response, mosaic and bathymetry data for benthic habitat mapping. PLoS ONE 2014, 9, e97339. [Google Scholar] [CrossRef]
  42. Rucińska, M.; Wróblewski, R.; Pałgan, D.; Trzcińska, K.; Belicki, J. Exploring sand ridge formation and preservation in a semi-enclosed tideless basin, Puck Bay, Baltic Sea. Earth Surf. Process. Landf. 2025, 50, e70098. [Google Scholar] [CrossRef]
  43. Szymczak, E.; Rucińska, M. Characteristics of morphodynamic conditions in the shallows of Puck Bay (southern Baltic Sea). Oceanol. Hydrobiol. Stud. 2021, 50, 220–231. [Google Scholar] [CrossRef]
  44. Moskalewicz, D. Hel Peninsula-development and future of sandy barrier under sea level rise. In Quaternary Geology of North-Central Poland: From the Baltic Coast to the LGM Limit; University of Gdańsk: Gdańsk, Poland, 2016; Volume 5. [Google Scholar]
  45. Miotk-Szpiganowicz, G. Holocene shoreline migrations in the Puck Lagoon (Southern Baltic Sea) based on the Rzucewo Headland case study. Landf. Anal. 2003, 4, 3–97. [Google Scholar]
  46. Janowski, Ł.; Wróblewski, R. Application and Evaluation of the AI-Powered Segment Anything Model (SAM) in Seafloor Mapping: A Case Study from Puck Lagoon, Poland. Remote Sens. 2024, 16, 2638. [Google Scholar] [CrossRef]
  47. Urbański, J.A.; Grusza, G.; Chlebus, N.; Kryla, L. A GIS-based WFD oriented typology of shallow micro-tidal soft bottom using wave exposure and turbidity mapping. Estuar. Coast. Shelf Sci. 2008, 78, 27–37. [Google Scholar] [CrossRef]
  48. Sokołowski, A.; Lasota, R.; Alias, I.S.; Piłczyńska, J.; Wołowicz, M. Prospects and opportunities for mussel Mytilus trossulus farming in the southern Baltic Sea (the Gulf of Gdańsk). Oceanol. Hydrobiol. Stud. 2022, 51, 53–73. [Google Scholar] [CrossRef]
  49. Tysiac, P. Bringing Bathymetry LiDAR to Coastal Zone Assessment: A Case Study in the Southern Baltic. Remote Sens. 2020, 12, 3740. [Google Scholar] [CrossRef]
  50. Montereale-Gavazzi, G.; Roche, M.; Degrendele, K.; Lurton, X.; Terseleer, N.; Baeye, M.; Francken, F.; Van Lancker, V. Insights into the Short-Term Tidal Variability of Multibeam Backscatter from Field Experiments on Different Seafloor Types. Geosciences 2019, 9, 34. [Google Scholar] [CrossRef]
  51. Sagawa, T.; Yamashita, Y.; Okumura, T.; Yamanokuchi, T. Satellite derived bathymetry using machine learning and multi-temporal satellite images. Remote Sens. 2019, 11, 1155. [Google Scholar] [CrossRef]
  52. Zevenbergen, L.W.; Thorne, C.R. Quantitative analysis of land surface topography. Earth Surf. Process. Landf. 1987, 12, 47–56. [Google Scholar] [CrossRef]
  53. Riley, S.J.; De Gloria, S.D.; Elliot, R. A Terrain Ruggedness that Quantifies Topographic Heterogeneity. Intermt. J. Sci. 1999, 5, 23–27. [Google Scholar]
  54. Lecours, V.; Dolan, M.F.J.; Micallef, A.; Lucieer, V.L. A review of marine geomorphometry, the quantitative study of the seafloor. Hydrol. Earth Syst. Sci. 2016, 20, 3207–3244. [Google Scholar] [CrossRef]
  55. Kursa, M.B.; Rudnicki, W.R. Package ‘Boruta’. Wrapper Algorithm for All Relevant Feature Selection. 2016. Available online: https://cran.r-project.org/web/packages/Boruta/Boruta.pdf (accessed on 1 September 2025).
  56. Menandro, P.S.; Lavagnino, A.C.; Vieira, F.V.; Boni, G.C.; Franco, T.; Bastos, A.C. The role of benthic habitat mapping for science and managers: A multi-design approach in the Southeast Brazilian Shelf after a major man-induced disaster. Front. Mar. Sci. 2022, 9, 1004083. [Google Scholar] [CrossRef]
  57. Ilich, A.R.; Brizzolara, J.L.; Grasty, S.E.; Gray, J.W.; Hommeyer, M.; Lembke, C.; Locker, S.D.; Silverman, A.; Switzer, T.S.; Vivlamore, A.; et al. Integrating Towed Underwater Video and Multibeam Acoustics for Marine Benthic Habitat Mapping and Fish Population Estimation. Geosciences 2021, 11, 176. [Google Scholar] [CrossRef]
  58. Nemani, S.; Cote, D.; Misiuk, B.; Edinger, E.; Mackin-McLaughlin, J.; Templeton, A.; Shaw, J.; Robert, K. A multi-scale feature selection approach for predicting benthic assemblages. Estuar. Coast. Shelf Sci. 2022, 277, 108053. [Google Scholar] [CrossRef]
  59. Breiman, L.; Friedman, J.H.; Olshen, R.A.; Stone, C.J. Classification and Regression Trees; Wadsworth: Belmont, CA, USA, 1984. [Google Scholar]
  60. Foody, G.M. Status of land cover classification accuracy assessment. Remote Sens. Environ. 2002, 80, 185–201. [Google Scholar] [CrossRef]
  61. Stehman, S.V.; Czaplewski, R.L. Design and Analysis for Thematic Map Accuracy Assessment—An application of Satellite Imagery. Remote Sens. Environ. 1998, 64, 331–344. [Google Scholar] [CrossRef]
  62. Story, M.; Congalton, R.G. Accuracy assessment: A user’s perspective. Photogramm. Eng. Remote Sens. 1986, 52, 397–399. [Google Scholar]
  63. Ciszewski, P.; Demel, K.; Ringher, Z.; Szatybełko, M. Zasoby widlika w Zatoce Puckiej oszacowane metodą nurkowania. Pr. MIR 1962, 11/A, 9–36. [Google Scholar]
  64. Rattray, A.; Ierodiaconou, D.; Monk, J.; Versace, V.L.; Laurenson, L.J.B. Detecting patterns of change in benthic habitats by acoustic remote sensing. Mar. Ecol. Prog. Ser. 2013, 477, 1–13. [Google Scholar] [CrossRef]
  65. Janowski, L.; Madricardo, F.; Fogarin, S.; Kruss, A.; Molinaroli, E.; Kubowicz-Grajewska, A.; Tegowski, J. Spatial and Temporal Changes of Tidal Inlet Using Object-Based Image Analysis of Multibeam Echosounder Measurements: A Case from the Lagoon of Venice, Italy. Remote Sens. 2020, 12, 2117. [Google Scholar] [CrossRef]
  66. Brown, C.J.; Smith, S.J.; Lawton, P.; Anderson, J.T. Benthic habitat mapping: A review of progress towards improved understanding of the spatial ecology of the seafloor using acoustic techniques. Estuar. Coast. Shelf Sci. 2011, 92, 502–520. [Google Scholar] [CrossRef]
  67. Vassallo, P.; Bianchi, C.N.; Paoli, C.; Holon, F.; Navone, A.; Bavestrello, G.; Cattaneo Vietti, R.; Morri, C. A predictive approach to benthic marine habitat mapping: Efficacy and management implications. Mar. Pollut. Bull. 2018, 131, 218–232. [Google Scholar] [CrossRef] [PubMed]
  68. Köppen, M. The curse of dimensionality. In Proceedings of the 5th Online World Conference on Soft Computing in Industrial Applications (WSC5), Online, 4–18 September 2000; pp. 4–8. [Google Scholar]
  69. Li, J.; Tran, M.; Siwabessy, J. Selecting Optimal Random Forest Predictive Models: A Case Study on Predicting the Spatial Distribution of Seabed Hardness. PLoS ONE 2016, 11, e0149089. [Google Scholar] [CrossRef]
  70. Phinn, S.R.; Roelfsema, C.M.; Mumby, P.J. Multi-scale, object-based image analysis for mapping geomorphic and ecological zones on coral reefs. Int. J. Remote Sens. 2012, 33, 3768–3797. [Google Scholar] [CrossRef]
  71. Rhoads, D.C.; Germano, J.D. Interpreting long-term changes in benthic community structure: A new protocol. In Proceedings of the Long-Term Changes in Coastal Benthic Communities: Proceedings of a Symposium, Brussels, Belgium, 9–12 December 1985; pp. 291–308. [Google Scholar]
  72. Torn, K.; Herkül, K.; Martin, G.; Oganjan, K. Assessment of quality of three marine benthic habitat types in northern Baltic Sea. Ecol. Indic. 2017, 73, 772–783. [Google Scholar] [CrossRef]
  73. Bekkby, T.; Gerovasileiou, V.; Papadopoulou, N.; Sevastou, K.; Dailianis, T.; Fiorentino, D.; McOwen, C.; Smith, C.; Amaro, T.; Bakran-Petricioli, T. State of the Knowledge on European Marine Habitat Mapping and Degraded Habitats. MERCES Project. 2017. Available online: https://research.abo.fi/en/publications/state-of-the-knowledge-on-european-marine-habitat-mapping-and-deg/ (accessed on 1 September 2025).
  74. Alexander, T.J.; Vonlanthen, P.; Seehausen, O. Does eutrophication-driven evolution change aquatic ecosystems? Philos. Trans. R. Soc. B Biol. Sci. 2017, 372, 20160041. [Google Scholar] [CrossRef]
  75. Boström, C.; Bonsdorff, E.; Kangas, P.; Norkko, A. Long-term changes of a brackish-water eelgrass (Zostera marina L.) community indicate effects of coastal eutrophication. Estuar. Coast. Shelf Sci. 2002, 55, 795–804. [Google Scholar] [CrossRef]
  76. Foody, G.M. Explaining the unsuitability of the kappa coefficient in the assessment and comparison of the accuracy of thematic maps obtained by image classification. Remote Sens. Environ. 2020, 239, 111630. [Google Scholar] [CrossRef]
  77. Jankowska, E.; Jankowska, K.; Włodarska-Kowalczuk, M. Seagrass vegetation and meiofauna enhance the bacterial abundance in the Baltic Sea sediments (Puck Bay). Environ. Sci. Pollut. Res. 2015, 22, 14372–14378. [Google Scholar] [CrossRef] [PubMed]
  78. Lacharité, M.; Brown, C.J. Utilizing benthic habitat maps to inform biodiversity monitoring in marine protected areas. Aquat. Conserv. Mar. Freshw. Ecosyst. 2019, 29, 938–951. [Google Scholar] [CrossRef]
  79. Bolałek, J.; Falkowska, L.; Korzeniewski, K. The hydrochemistry of gulfs. In Gulf of Gdańsk and Puck Bay; Springer: Berlin/Heidelberg, Germany, 1993; pp. 222–303. [Google Scholar]
  80. Kruk-Dowgiałło, L.; Szaniawska, A. Gulf of Gdańsk and Puck Bay. In Ecology of Baltic Coastal Waters; Springer: Berlin/Heidelberg, Germany, 2008; pp. 139–165. [Google Scholar]
  81. Trokowicz, D.; Andrulewicz, E. Wydobycie i przetwórstwo wodorostów z Zatoki Puckiej. Wiad. Ryb. Pismo Mor. Inst. Ryb. Panstw. Inst. Badaw 2019, 32, 11–12. [Google Scholar]
  82. Kruk-Dowgiałło, L. Wieloletnie zmiany składu taksonomicznego oraz biomasy fitobentosu Zatoki Gdańskiej. Inst. Mor. W Gdańsku 2004. [Google Scholar]
  83. Schönke, M.; Wiesenberg, L.; Schulze, I.; Wilken, D.; Darr, A.; Papenmeier, S.; Feldens, P. Impact of Sparse Benthic Life on Seafloor Roughness and High-Frequency Acoustic Scatter. Geosciences 2019, 9, 454. [Google Scholar] [CrossRef]
  84. Tęgowski, J.; Trzcińska, K.; Janowski, Ł.; Kruss, A.; Kusek, K.; Nowak, J. Comparison of Backscatter and Seabed Topographic Characteristics Recorded by Multibeam Echosounder at Rewal Area—Southern Baltic Sea. In Proceedings of the 2018 Joint Conference-Acoustics, Ustka, Poland, 11–14 September 2018; pp. 1–4. [Google Scholar]
  85. Misiuk, B.; Brown, C.J. Benthic habitat mapping: A review of three decades of mapping biological patterns on the seafloor. Estuar. Coast. Shelf Sci. 2024, 296, 108599. [Google Scholar] [CrossRef]
  86. Ilich, A.R.; Misiuk, B.; Lecours, V.; Murawski, S.A. MultiscaleDTM: An open-source R package for multiscale geomorphometric analysis. Trans. GIS 2023, 27, 1164–1204. [Google Scholar] [CrossRef]
  87. Pearman, T.R.R.; Robert, K.; Callaway, A.; Hall, R.; Iacono, C.L.; Huvenne, V.A.I. Improving the predictive capability of benthic species distribution models by incorporating oceanographic data—Towards holistic ecological modelling of a submarine canyon. Prog. Oceanogr. 2020, 184, 102338. [Google Scholar] [CrossRef]
  88. Montereale-Gavazzi, G.; Roche, M.; Lurton, X.; Degrendele, K.; Terseleer, N.; Van Lancker, V. Seafloor change detection using multibeam echosounder backscatter: Case study on the Belgian part of the North Sea. Mar. Geophys. Res. 2018, 39, 229–247. [Google Scholar] [CrossRef]
  89. Janowski, Ł.; Skarlatos, D.; Agrafiotis, P.; Tysiąc, P.; Pydyn, A.; Popek, M.; Kotarba-Morley, A.; Mandlburger, G.; Gajewski, Ł.; Kolakowski, M.; et al. Bathymetry and remote sensing data of the Puck Lagoon, Southern Baltic Sea. 2023. Available online: https://www.marine-geo.org/doi/10.26022/IEDA/331456 (accessed on 1 September 2025).
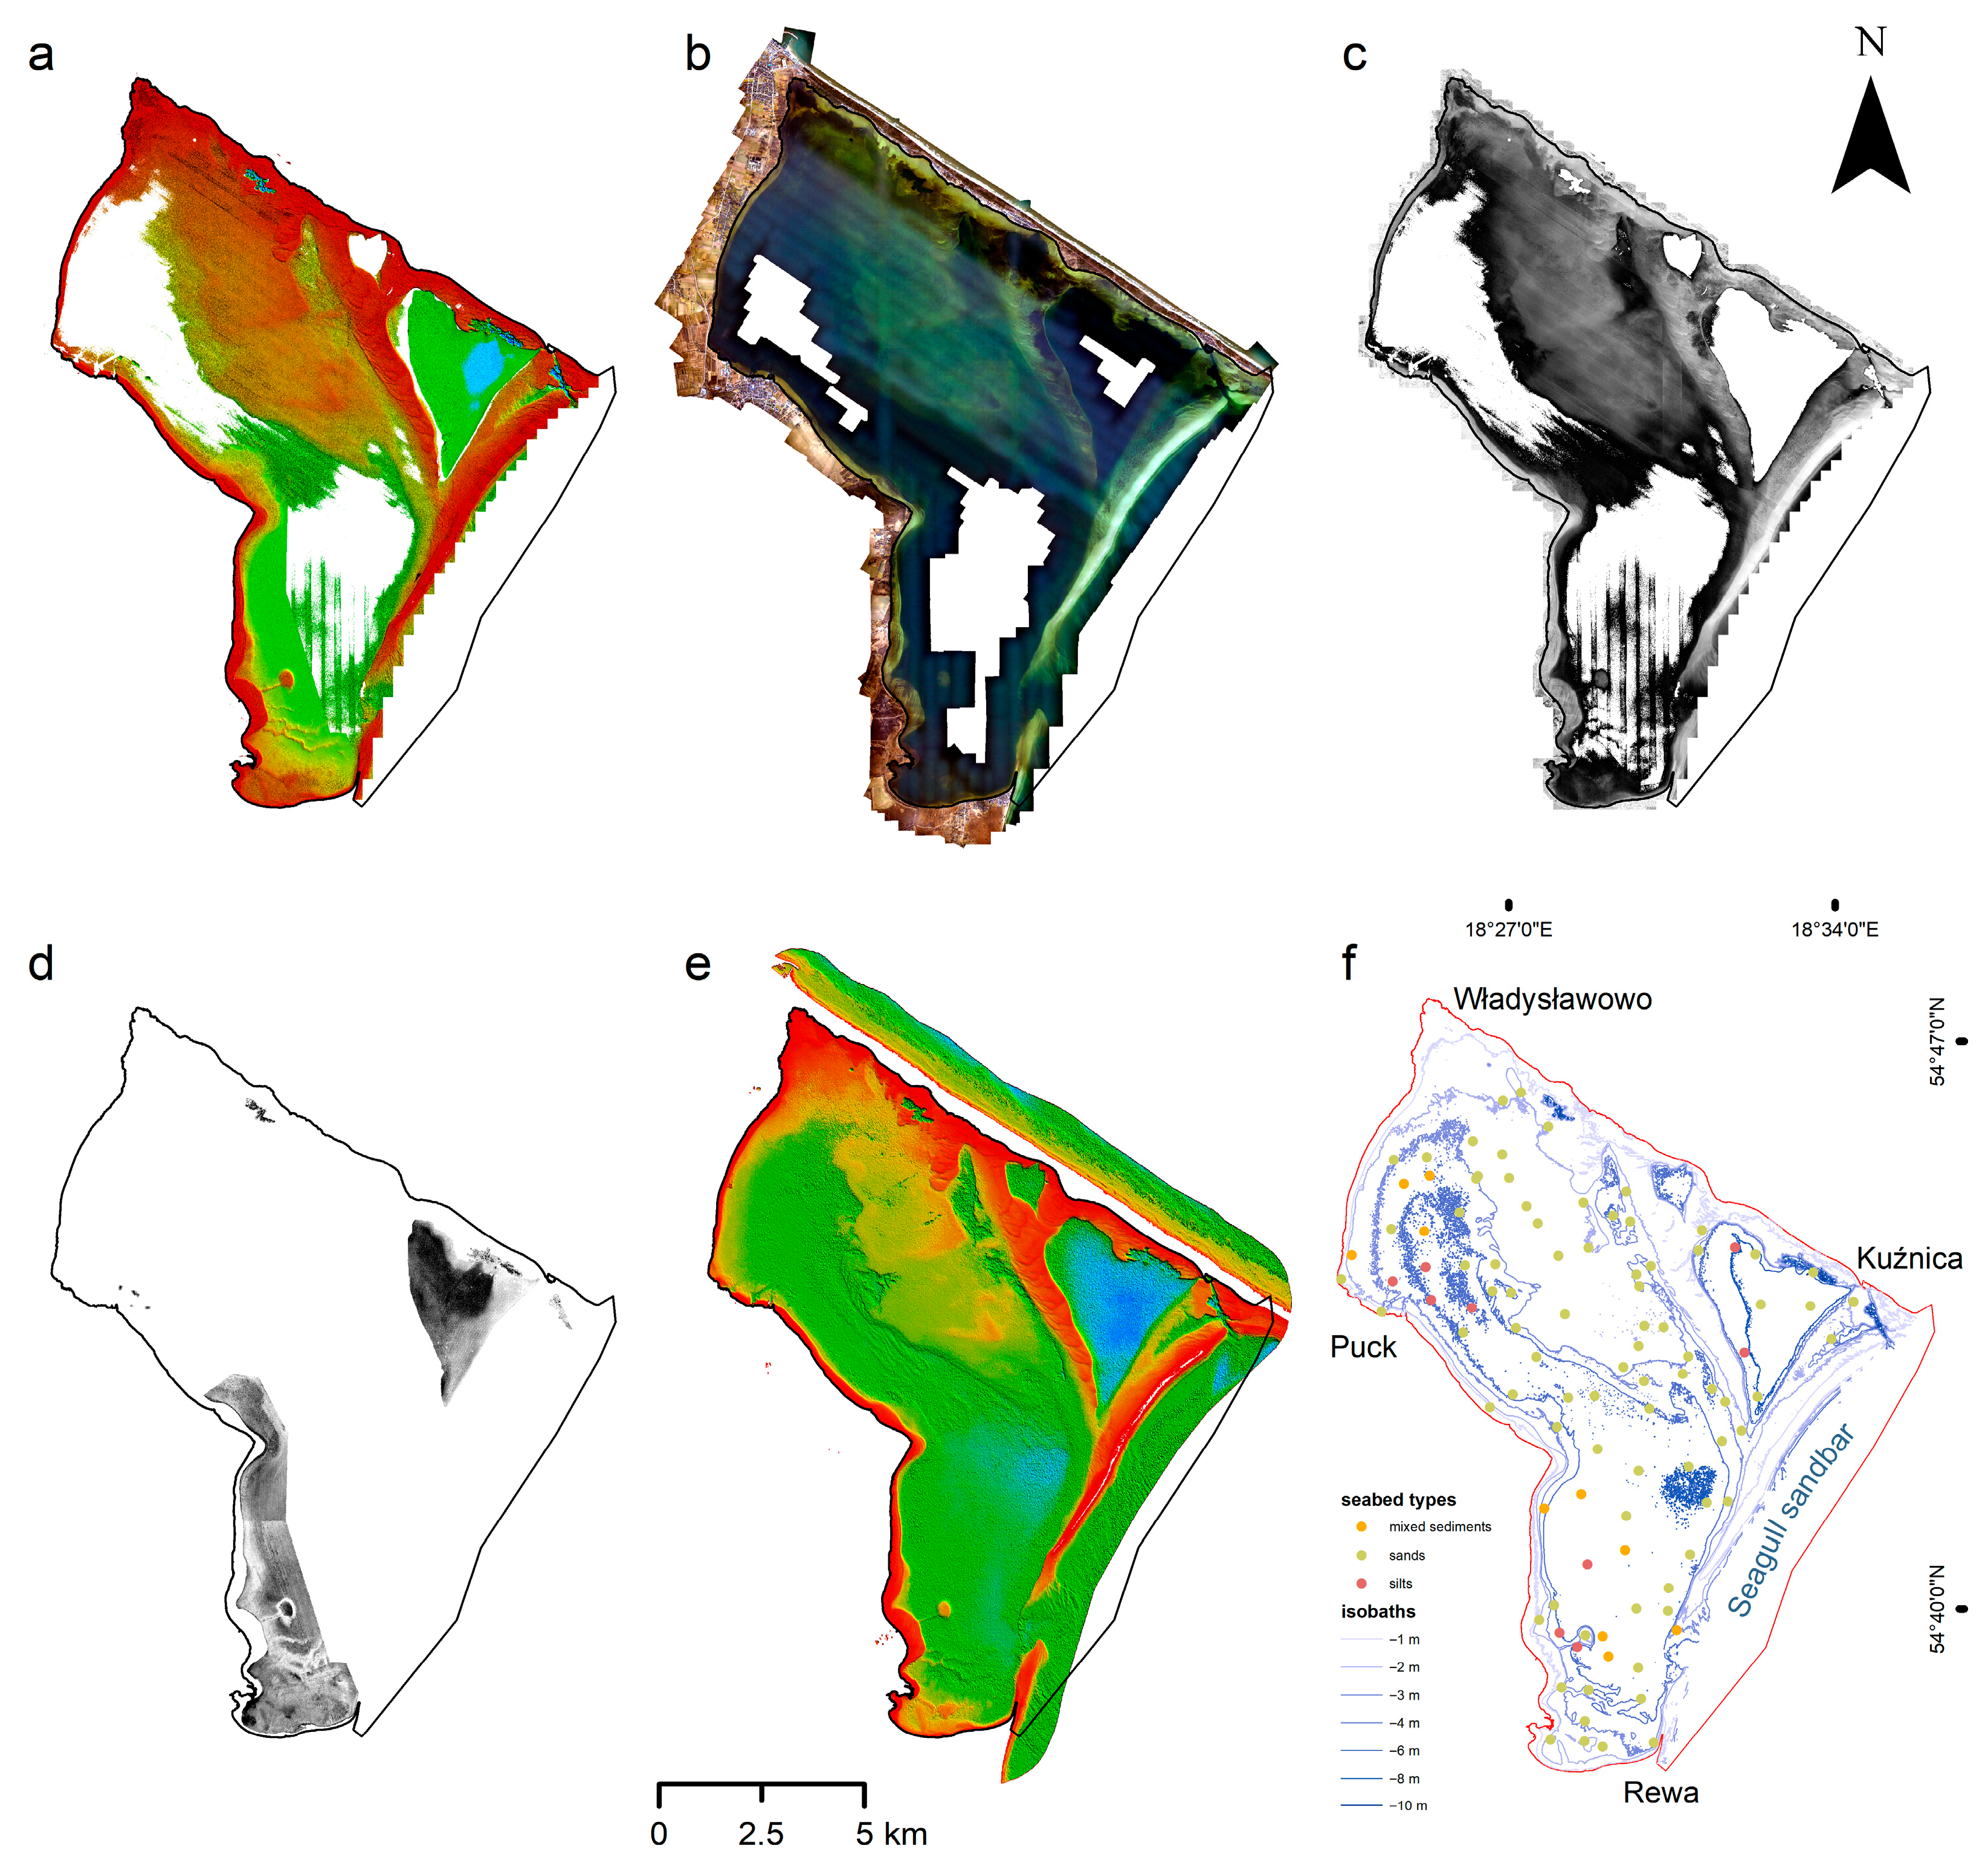
Figure 1. Spatial representation of the study area and remote sensing datasets that were used as inputs for analyses: (a) integrated bathymetry (colour scale from red for the shallowest areas to blue for the deepest areas) generated from acoustic and laser measurements; (b) orthophoto map; (c) intensity measured from bathymetric laser scanner; (d) multibeam echosounder baskscatter intensity; (e) satellite-derived bathymetry (colour scale from red for the shallowest areas to blue for the deepest areas); (f) representation of the study area (red mark) with bathymetric contours, sediment types and key reference points.
Remotesensing 17 03725 g001
Figure 2. Processing workflow of this study, illustrating datasets, processing steps, tested parameters, and research outcomes.
Remotesensing 17 03725 g002
Figure 3. Spatial representation of ground-truth samples used for training (X) and validation (+) of machine learning classifiers, annotated for (a) EUNIS 3 classes; (b) EUNIS 4 classes; (c) EUNIS 4/5 classes; (d) dominant species descriptor; (e) Zostera marina absence/presence using samples from the 2023 survey; (f) Zostera marina absence/presence using samples from the 2010–2023 surveys.
Remotesensing 17 03725 g003
Figure 4. Boxplots representing results of Boruta feature selection algorithm for different modeling scenarios: (a) EUNIS 3; (b) EUNIS 4; (c) EUNIS 4/5; (d) dominant species descriptor; (e) Zostera marina absence/presence using samples from the 2023 survey; (f) Zostera marina absence/presence using samples from the 2010–2023 surveys.
Remotesensing 17 03725 g004
Figure 5. Results of predictive modeling of benthic habitats in the Puck Lagoon: (ad) only the features selected with Boruta algorithm included as input for classifiers; (eh) all the primary features included for classification; (i) result of combination of descriptors of sediment substrate with dominant species—combination of (a,d) outcomes; (j) result of combination of descriptors of sediment substrate with dominant species—combination of (e,h) outcomes; (k) modeling of Zostera marina using GT samples from the 2023 survey; (l) modeling of Zostera marina using the GT samples from the 2010–2023 surveys. Classification approach and/or machine learning classifiers used: (a) EUNIS 3, KNN; (b) EUNIS 4, RF; (c) EUNIS 4/5, SVM; (d) dominant species descriptor, SVM; (e) EUNIS 3, RF; (f) EUNIS 4, KNN; (g) EUNIS 4/5, RF; (h) dominant species descriptor, KNN; (k) SVM; (l) RF. The scale bar, north arrow, and coordinate grids visible in (d) are related to all the other subplots.
Remotesensing 17 03725 g005
Figure 6. Error matrices representing results of accuracy assessment for different modeling scenarios: (a) EUNIS 3, RF classifier, Model 1; (b) EUNIS 3, KNN classifier, Model 2; (c) EUNIS 4, RF classifier, Model 1; (d) EUNIS 4, KNN classifier, Model 2; (e) EUNIS 4–5, SVM classifier, Model 1; (f) EUNIS 4–5, RF classifier, Model 2; (g) dominant species descriptor, SVM classifier, Model 1; (h) dominant species descriptor, KNN classifier, Model 2; (i) Zostera marina absence/presence using samples from the 2023 survey, SVM classifier, Model 2; (j) Zostera marina absence/presence using samples from the 2010–2023 surveys, RF classifier, Model 2. Class legend for panels (g,h): 1 = Potamogeton perfoliatus and/or Stuckenia pectinata; 2 = Infaunal communities (bivalves, polychaetes, crustacea); 3 = Charales; 4 = Potamogeton perfoliatus and/or Stuckenia pectinata OR Zannichellia spp. and/or Ruppia spp. and/or Zostera noltii; 5 = Zannichellia spp. and/or Ruppia spp. and/or Zostera noltii; 6 = Mixed epibenthic macrocommunity; 7 = Zostera marina; Class legend for panels (i,j): 0 = Absence; 1 = Presence.
Remotesensing 17 03725 g006aRemotesensing 17 03725 g006b
Figure 7. Accuracy assessment statistics representing (a) overall accuracy results for all the tested scenarios and models; (b) kappa results for all the tested scenarios and models. “Species” is related to scenarios focused on dominant species modeling. “Zostera all” means Zostera marina absence/presence using samples from the 2010–2023 surveys.
Remotesensing 17 03725 g007
Figure 8. Analysis of Zostera marina change detection in relation to the reference spatial coverage from 1957, based on outcomes from various classification approaches. Labels: “Yes” and “No” refer to presence and absence of seagrass meadows and “from-to” scenarios. Classification approaches: (a) EUNIS 4/5, RF; (b) result of combination of descriptors of sediment substrate with dominant species (see Figure 5j); (c) modeling of Zostera marina using GT samples from the 2023 survey; (d) modeling of Zostera marina using GT samples from the 2010–2023 surveys.
Remotesensing 17 03725 g008
Table 1. Summary list of all remote sensing data collection sources and their properties.
SensorPlatformTypeResolutionWavelength/FrequencyDate of AcquisitionConditions
Riegl VQ-880-GIISP-PROBathymetry0.5 m532/1064 nm27 February–2 March 2022; 7–10 March 2025Clear water, optimal light conditions
Riegl VQ-880-GIISP-PROIntensity0.5 m532/1064 nm27 February–2 March 2022; 7–10 March 2025
Riegl VQ-880-GIISP-PROPhotogrammetry0.5 mRGB27 February–2 March 2022; 7–10 March 2025
Reson T20/T50R/V IMOROS 2/3Bathymetry0.5 m420 kHz22 March–22 June 2022Sea state ≤ 2, calm weather
Reson T20/T50R/V IMOROS 2/3Backscatter0.5 m420 kHz22 March–22 June 2022
NAOMISPOT-6SDB5.2 × 8.3 mRGB19 April 2021Cloud-free
Table 2. EUNIS classification levels used in the study.
EUNIS LevelEUNIS CodeDescription
Level 3MB43Baltic infralittoral mixed sediment
Level 3MB53Baltic infralittoral sand
Level 3MB63Baltic infralittoral mud
Level 4MB432Baltic infralittoral mixed sediment characterized by submerged rooted plants
Level 4MB43EBaltic infralittoral mixed sediment characterized by mixed epibenthic macrocommunity
Level 4MB532Baltic infralittoral sand characterized by submerged rooted plants
Level 4MB537Baltic infralittoral sand characterized by infaunal bivalves
Level 4MB538Baltic infralittoral sand characterized by infaunal polychaetes
Level 4MB539Baltic infralittoral sand characterized by infaunal crustacea
Level 4MB632Baltic infralittoral mud sediment characterized by submerged rooted plants
Level 4MB638Baltic infralittoral mud characterized by infaunal bivalves
Level 4MB639Baltic infralittoral mud characterized by infaunal polychaetes
Level 4MB63ABaltic infralittoral mud characterized by infaunal crustacea
Level 5MB4321Baltic infralittoral mixed sediment dominated by Potamogeton perfoliatus and/or Stuckenia pectinata
Level 5MB4322Baltic infralittoral mixed sediment dominated by Zannichellia spp. and/or Ruppia spp. and/or Zostera noltii
Level 5MB4325Baltic infralittoral mixed sediment dominated by Zostera marina
Level 5MB5321Baltic infralittoral sand dominated by Potamogeton perfoliatus and/or Stuckenia pectinata
Level 5MB5322Baltic infralittoral sand dominated by Zannichellia spp. and/or Ruppia spp. and/or Zostera noltii
Level 5MB5324Baltic infralittoral sand dominated by Charales
Level 5MB5327Baltic infralittoral sand dominated by Zostera marina
Level 5MB6321Baltic infralittoral mud sediment dominated by Potamogeton perfoliatus and/or Stuckenia pectinata
Level 5MB6322Baltic infralittoral mud sediment dominated by Zannichellia spp. and/or Ruppia spp. and/or Zostera noltii
Level 5MB6327Baltic infralittoral mud sediment dominated by Zostera marina
Table 3. Ranges of machine learning supervised classifier hyperparameters tested in this study.
Model/ParameterkNumber of TreesTree DepthCGamma
K-Nearest Neighbors1–9----
Classification and Regression Trees-0–200–25--
Random Forest-0–200–25--
Support Vector Machine---2–40–1.2
Table 4. Parameters of machine learning classifiers evaluated and used for generation of the results.
Model/ParameterkNumber of TreesTree DepthCGamma
EUNIS 3, KNN3----
EUNIS 4, RF-1015--
EUNIS 4/5, SVM---20
Dominant species descriptor, SVM---30
EUNIS 3, RF-88--
EUNIS 4, KNN8----
EUNIS 4/5, RF-56--
Dominant species descriptor, KNN8----
Zostera modeling, SVM---21
Zostera modeling, RF-115--
Table 5. Change detection statistics for Zostera marina meadows from 1957 to 2023 across four predictive benthic habitat models. All the values represent the percentage coverage of the study area. These results likely overestimate net loss by 5–15% due to seasonal phenological mismatch between the 1957 baseline (July–August peak biomass) and contemporary surveys (March, early season).
ModelTotal 1957Total RecentGainLossTotal ChangeSwap (Location)Net (Quantity)
EUNIS 4/5, RF61.154.051.3158.4059.712.6257.09
Combined model61.150.630.1560.6660.810.3060.51
GT samples ′2361.152.690.5358.9859.501.0558.45
GT samples ′10–2361.159.705.5256.9762.5011.0551.45
Disclaimer/Publisher’s Note: The statements, opinions and data contained in all publications are solely those of the individual author(s) and contributor(s) and not of MDPI and/or the editor(s). MDPI and/or the editor(s) disclaim responsibility for any injury to people or property resulting from any ideas, methods, instructions or products referred to in the content.