Article

Random Walk Detection of Small Targets Based on Information Entropy and Intensity Local Contrast Method


1
Shenzhen Institute for Advanced Study, University of Electronic Science and Technology of China, Chengdu 610054, China
2
Acoustic Science and Technology Laboratory, Harbin Engineering University, Harbin 150001, China
3
College of Underwater Acoustic Engineering, Harbin Engineering University, Harbin 150001, China
4
Key Laboratory of Marine Information Acquisition and Security (Harbin Engineering University), Ministry of Industry and Information Technology, Harbin 150001, China
*
Author to whom correspondence should be addressed.
Remote Sens. 2025, 17(22), 3724; https://doi.org/10.3390/rs17223724
Submission received: 20 September 2025 / Revised: 5 November 2025 / Accepted: 13 November 2025 / Published: 15 November 2025
(This article belongs to the Special Issue Underwater Remote Sensing: Status, New Challenges and Opportunities)

Highlights

What are the main findings?
  • In the dynamic and unpredictable underwater environment, the signal-to-noise ratio is typically low, and intensity levels fluctuate. Therefore, achieving effective and stable detection is crucial.
  • The local contrast method, which relies on information entropy and target intensity, can provide a rough estimate of the potential target range.
What are the implication of the main findings?
  • A multi-scale local contrast approach more effectively suppresses background noise. Meanwhile, the random walk fine local contrast descriptor can distinguish the target from the background, accurately locate it, and enhance its visibility.
  • By integrating the local contrast description with the random walk fine local contrast descriptor using the nesting principle, accurate target detection is possible even in harsh conditions.

Abstract

Underwater sonar target detection and tracking face persistent challenges due to the complex and variable aquatic environment, resulting in low signal-to-noise ratios and fluctuating intensity levels. These challenges are further exacerbated when detecting small, weakly scattering targets, making effective and stable detection crucial. This paper introduces a nested multi-scale sonar target detection method leveraging random walk principles, based on the local contrast of information entropy and target intensity. The method unfolds in four stages: Initially, target intensity and information entropy are calculated to estimate the potential target range. Subsequently, a multi-scale local contrast descriptor suppresses background noise. The random walk fine local contrast descriptor then distinguishes the target from the background, precisely locating and enhancing the target. Finally, these descriptors are integrated using the nesting principle to enhance targets while suppressing the background. This method has been validated through real lake experiments. Both qualitative and quantitative analyses, along with sequence data analysis, demonstrate superior target detection accuracy compared to traditional baseline methods.

1. Introduction

In recent years, compared with visible light, electricity, and magnetism, underwater acoustic detection has demonstrated clear advantages. These include long-distance, wide-area acoustic propagation, the ability to penetrate complex media, and reliable all-weather, continuous operation. As a result, it is widely applied in military security, resource exploration, and ecological monitoring underwater. Among its core technologies, underwater acoustic target detection (UATD) is particularly important. Detection accuracy determines both the effective range and operational complexity of the entire system and plays an important role in precision-guided weapons, security tracking, early warning, and marine surveillance. Therefore, sonar small target detection (SSTD) has become an area of active research, particularly in time-varying, space-varying, and low signal-to-noise ratio underwater environments.
Target detection in underwater sonar images remains highly challenging. Targets in long-distance imaging results often appear confined within 91 gray levels across 8 × 8 pixels, due to limitations in sonar detection frequency and aperture size. The imaging resolution of multi-beam sonar is constrained by aperture size; at long distances, target echoes are weak, often covering only a few pixels or even one, and can be obscured by noise and clutter. The absence of clear shape and texture features makes it difficult to detect small targets using conventional feature matching methods [1,2,3,4,5,6]. Moreover, sonar imaging results are subject to equipment noise, environmental interference, and scattering from multiple underwater sources. Underwater environments are filled with scatterers like fish schools, bubbles, and suspended particles, which produce echoes similar in intensity and statistical characteristics to those of actual targets, leading to a low signal-to-noise ratio. Consequently, acoustic imaging fundamentally relies on coherent sound waves for detection. When these waves hit an object’s surface, they scatter, creating multiple reflected echoes that overlap to form an image. This process inherently generates significant speckle noise. Small targets are often embedded within cluttered backgrounds of low contrast, making detection difficult and likely to cause over-detection or under-detection [7,8,9].
Despite numerous proposed techniques in recent years, reliably identifying small targets remains an unresolved problem. Existing small target detection approaches are generally divided into two main categories based on the target tracking process: track-before-detect (TBD) and detect-before-track (DBT) techniques [10,11]. TBD approaches rely on multi-frame continuous imaging to detect objects using prior knowledge of their characteristics. For instance, Reed, I. Li, M, and Liu, X. et al. [12,13,14] proposed constructing 3D data from sequences of 2D data. These techniques apply 3D directional matched filtering, bidirectional filtering, and related algorithms to separate moving foreground objects from static backgrounds. However, TBD requires temporal accumulation of data, which leads to high computational costs and significant resource consumption. Moreover, dependence on precise prior knowledge increases the likelihood of missing targets. Considering the energy limitation of underwater systems and the need for real-time processing, DBT is often a more practical option for sonar target detection and tracking in military contexts.
Over the past two decades, numerous single-frame detection techniques have emerged within DBT research. These methods primarily focus on enhancing target visibility and reducing background interference. Bai et al. have proposed improved methods such as the Top-hot filter [15,16,17], high-pass filter [18], matched filter, wavelet filter [19], as well as the max-mean and max-median ratio filter [20]. While these filters can improve detection, their performance deteriorates under low Signal-to-Noise Ratio (SNR) and Signal-to-Clutter Ratio (SCR) conditions, resulting in higher false alarm rates and reduced detection effectiveness. To mitigate clutter interference, Laplacian of Gaussian and edge detection filtering have been used for target detection and clutter suppression. However, sonar results of target echoes are susceptible to false detections caused by sidelobe leakage and line-shaped noise arising from strong main beam scattering in both horizontal and vertical directions [21,22]. Researchers have also explored detection approaches in spatial, frequency, and morphological domains. However, these methods typically rely on assumptions about the scene, and their performance degrades when actual conditions differ from expectations. This limitation is particularly pronounced in underwater environments, where time-varying spatial channels pose significant challenges. Consequently, the purported advantages of these methods remain largely unsubstantiated [23,24,25,26,27]. Numerous new theories and methods have recently emerged, based on the research work on small target detection conducted by researchers in this field from various perspectives. W. Li, J. Zhao, and Y. Zhao et al. [28,29,30] introduced a correlation algorithm for precise target detection that uses sparse representation and the principal curvature characteristics of targets. However, the algorithm’s effectiveness declines when detecting small targets, leading to subpar detection outcomes.
S. Kim, J.C.P. Chen, S. Qi et al. [31,32,33] have developed various methodologies and improvements inspired by the human visual system (HVS), demonstrating considerable potential in diverse detection tasks. S. Kim et al. [34] also introduced a target detection method leveraging the contrast mechanism rooted in HVS theory, designed to enhance targets while suppressing background clutter. However, this approach tends to misidentify noise as targets when noise is present horizontally and vertically. C.P. Chen et al. [32] developed the local contrast measure (LCM), assuming significant contrast between the target and background, but it performs poorly with low-contrast conditions. X. Shao, J. Han et al. [35,36] enhanced LCM using attention transfer and morphological mechanisms, resulting in the improved local contrast measure (ILCM), which increases detection probability and reduces false alarms. K. Xie and Y. Wei [7,37], as well as J. Han et al. [38] further refined LCM with center-surround differences and multi-scale contrast measures, proposing the multiscale patch-based contrast measure (MPCM), multiscale relative local contrast measure (MRLCM), and accumulated center-surround difference measure (ACSDM), achieving effective interference suppression. Deng, He et al. [39] employed the weighted local difference measure (WLDM) to distinguish targets from the background for improved detection.

2. Related Work

Despite advances in small target detection from various research perspectives, existing approaches still have notable limitations, particularly in sonar target detection. These shortcomings are evident in three main areas:
Area 1: The time- and space-varying nature of underwater channels, coupled with dynamic noise, results in sonar imaging results of target echoes with a low signal-to-noise ratio. The restricted detection frequency causes target and speckle noise to exhibit similar morphologies, complicating the detection of small targets and increasing the likelihood of missed detections.
Area 2: Acoustic scattering from multiple underwater objects often produces extensive contiguous false targets in sonar imaging results. Traditional detection methods may mistakenly identify these non-genuine targets as real, leading to false alarms.
Area 3: When the real target is embedded in background noise, HVS-based methods tend to produce poor target localization results because the reference units are contaminated by noise.
This paper addresses these challenges through the following key contributions:
To mitigate missed detections caused by variable pixel coverage of small targets at different detection distances, the target is separated from the background using a comparative approach. A multi-scale feature description method is adopted, wherein each reference unit consists of a volume of 3 × 3 , 5 × 5 , 7 × 7 pixels. Expanding the reference pixel count from 9 × 9 to 21 × 21 effectively reduces the risk of missed detections.
To mitigate the occurrence of extensive continuous false targets, the contrast method is enhanced with a local information entropy weighting factor. By assessing the information entropy, the noise level of background pixels is estimated, effectively reducing noise interference and significantly lowering false alarm rates.
To improve the accuracy of target positioning when noise interferes with the reference unit, the random walk method is applied. By establishing target and background seeds, this method accurately delineates their respective regions, precisely locating the target and improving detection performance.
A nested reference window structure has been developed to enhance detection accuracy. The multi-scale reference unit technique mitigates missed detections, while the information-entropy weighting factor reduces false alarms. Additionally, the random walk description factor further addresses both issues, resulting in improved detection performance.
  • The remainder of this paper is organized as follows.
Section 3 begins by introducing a local contrast measurement method for small targets. This method is then extended to a multi-scale detection approach with a wide field of view through the selection and fusion of different window sizes. Additionally, a local information entropy-weighted contrast measurement technique is presented to mitigate noise by estimating the background noise level. A precise target localization method based on random walks, using seeds from the outer-edge background and center target, is also proposed to strengthen target locking capabilities. Section 4 provides a comprehensive analysis of the proposed underwater small target detection method, comparing it with conventional approaches. The Section 5 summarizes the main findings of the paper.

3. Materials and Methods

3.1. Target Detection That Fuses Local Information Entropy and Local Contrast Through Random Walk

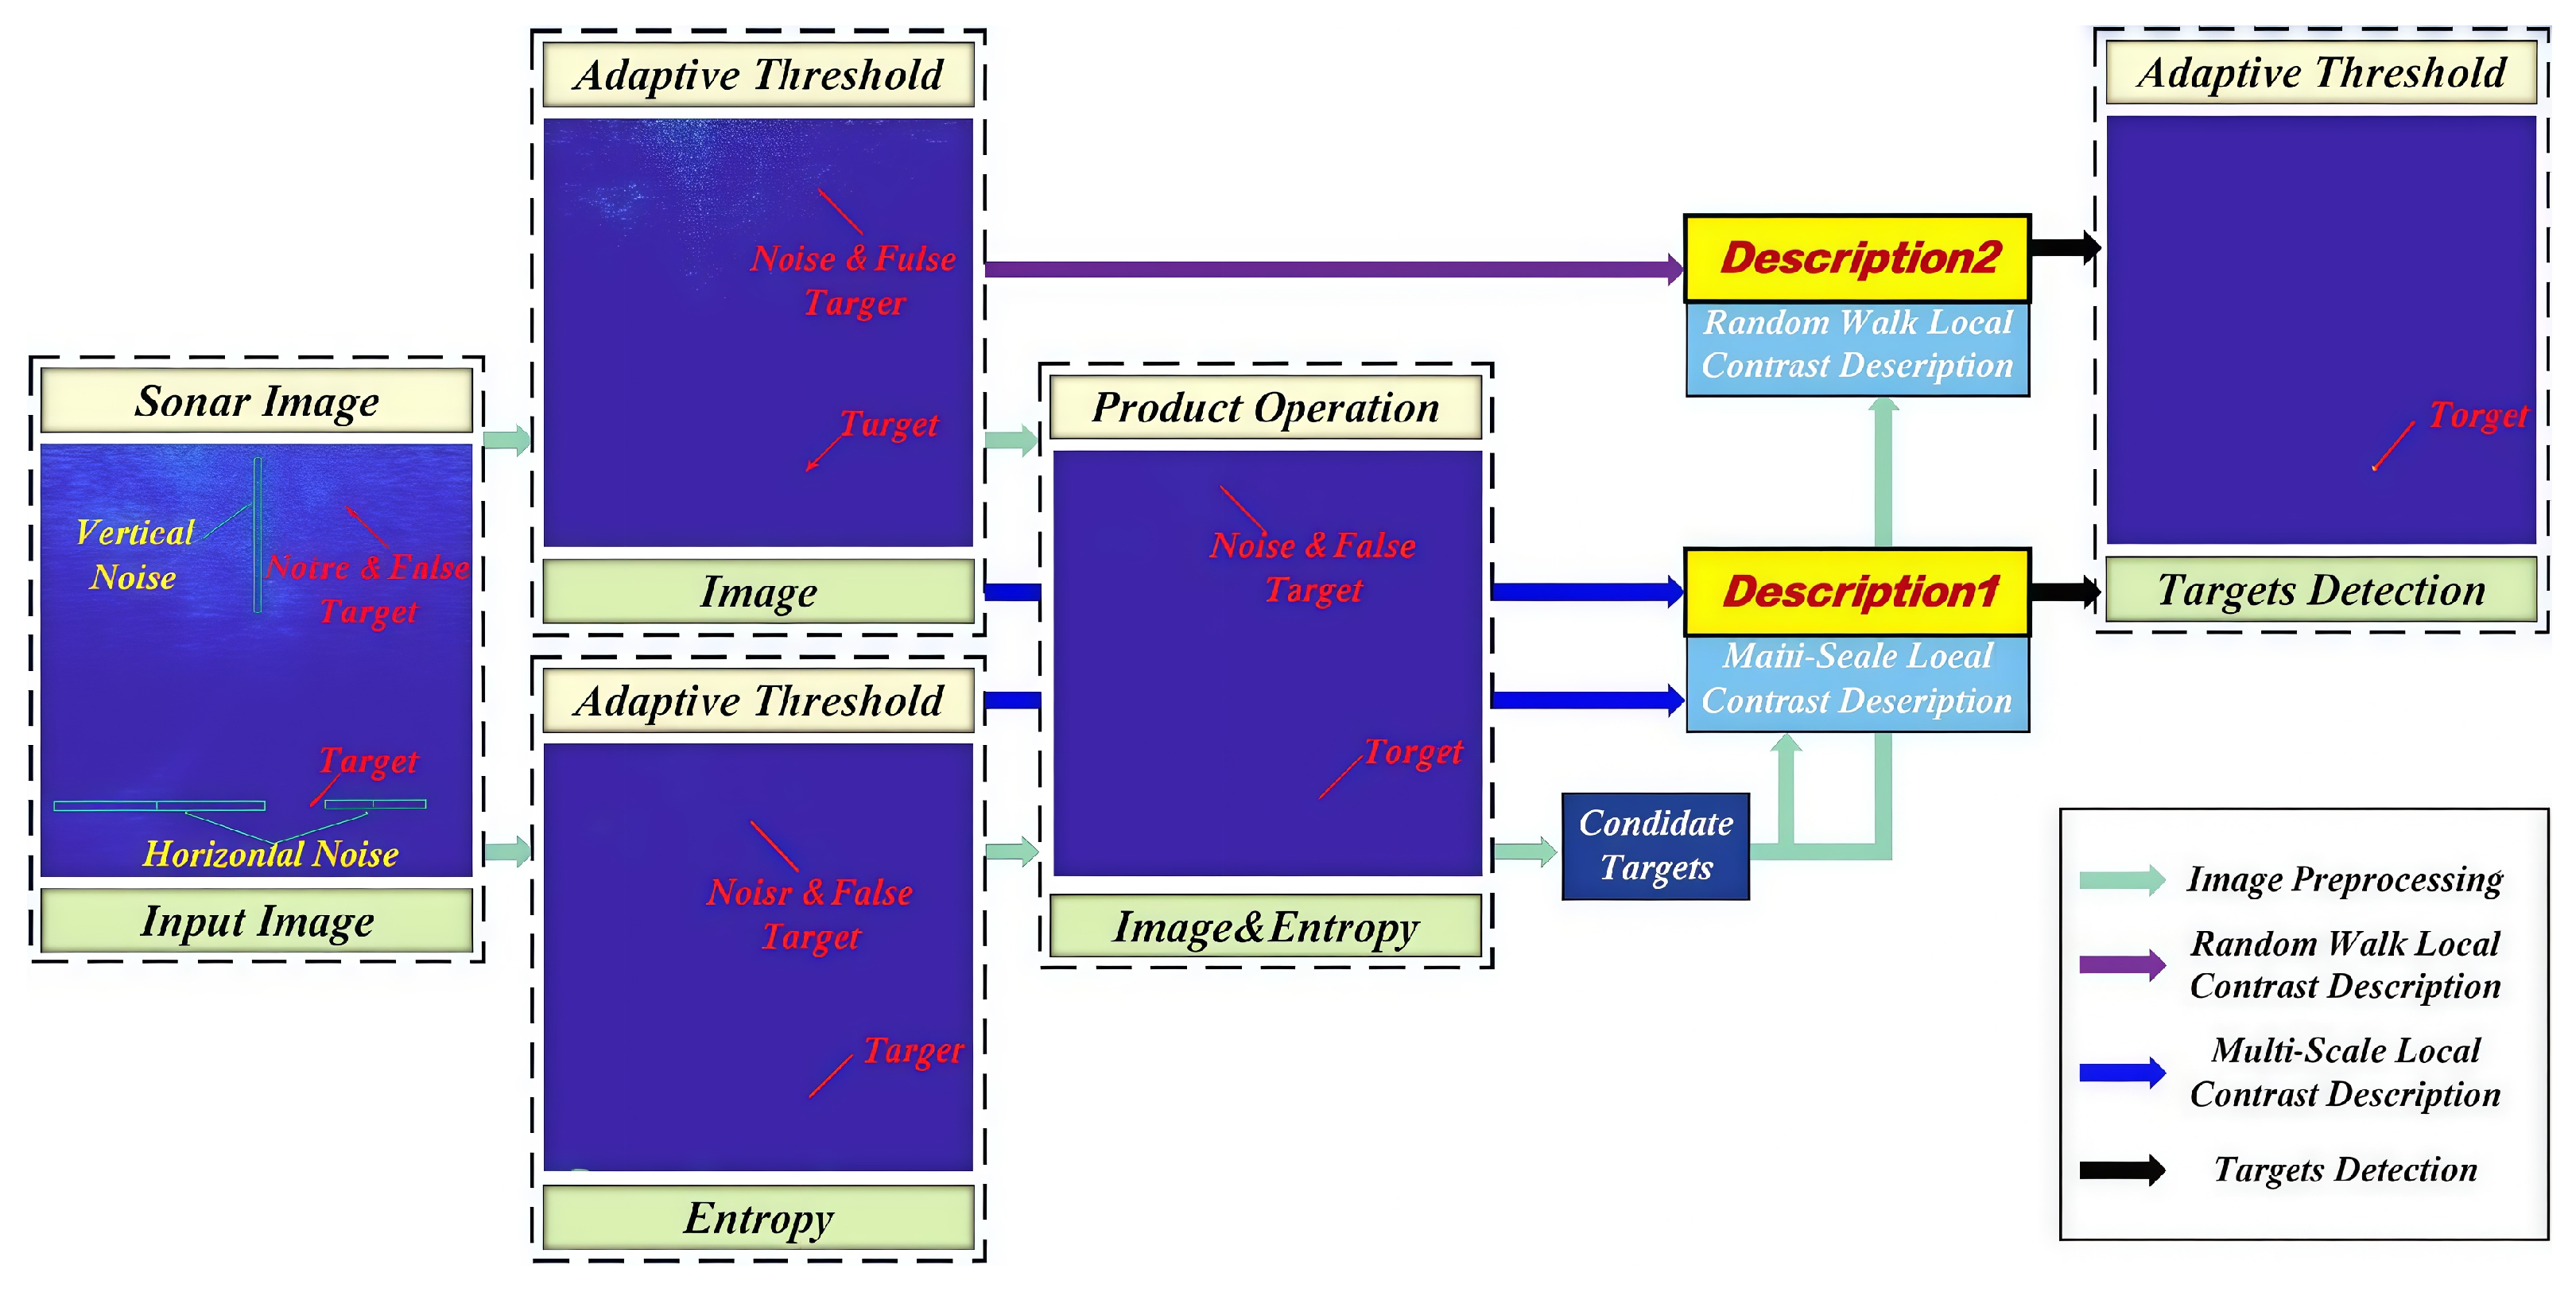
This paper proposes a novel method for detecting small targets based on local information entropy contrast. The approach combines three main techniques: multi-scale target detection, background interference suppression using information entropy, and fine localization through random walk. The framework starts with multi-scale target detection, where local contrast measurements help identify small targets over a wide field of view. Next, the background noise distribution is estimated using locally weighted information entropy contrast, which enhances the system’s ability to suppress noise. These two steps form the coarse detection stage, improving the visibility of foreground targets. In the final stage, the random walk algorithm calibrates target positions accurately by using background seeds around the target and seed templates centered on the target itself. This fine detection phase enables reliable small target identification in low SNR underwater sonar data. The proposed method achieves robust detection in challenging conditions by progressing systematically from coarse to fine processing, as illustrated in Figure 1.

3.2. Candidate Target Extraction

3.2.1. Soft Threshold of Sonar Intensity (STSI)

The sonar detection process is influenced by the operating frequency and detection range, which results in small-pixel representations of targets. Additionally, underwater acoustic imaging is affected by time-varying and space-varying channels, leading to backgrounds with low signal-to-noise ratios. Together, these factors make underwater target detection particularly challenging. To address this, the first step applies a soft-threshold operation to the sonar imaging results of target echoes, improving the target’s detectability:
T h i m a g e = μ i m a g e + k σ i m a g e ,
where μ i m a g e and σ i m a g e the mean and variance of the intensity, while k is an adjustment parameter. Experimental results show that setting k = 0.2 yields better performance.

3.2.2. Soft Thresholding of Local Weighted Information Entropy (STLWIE)

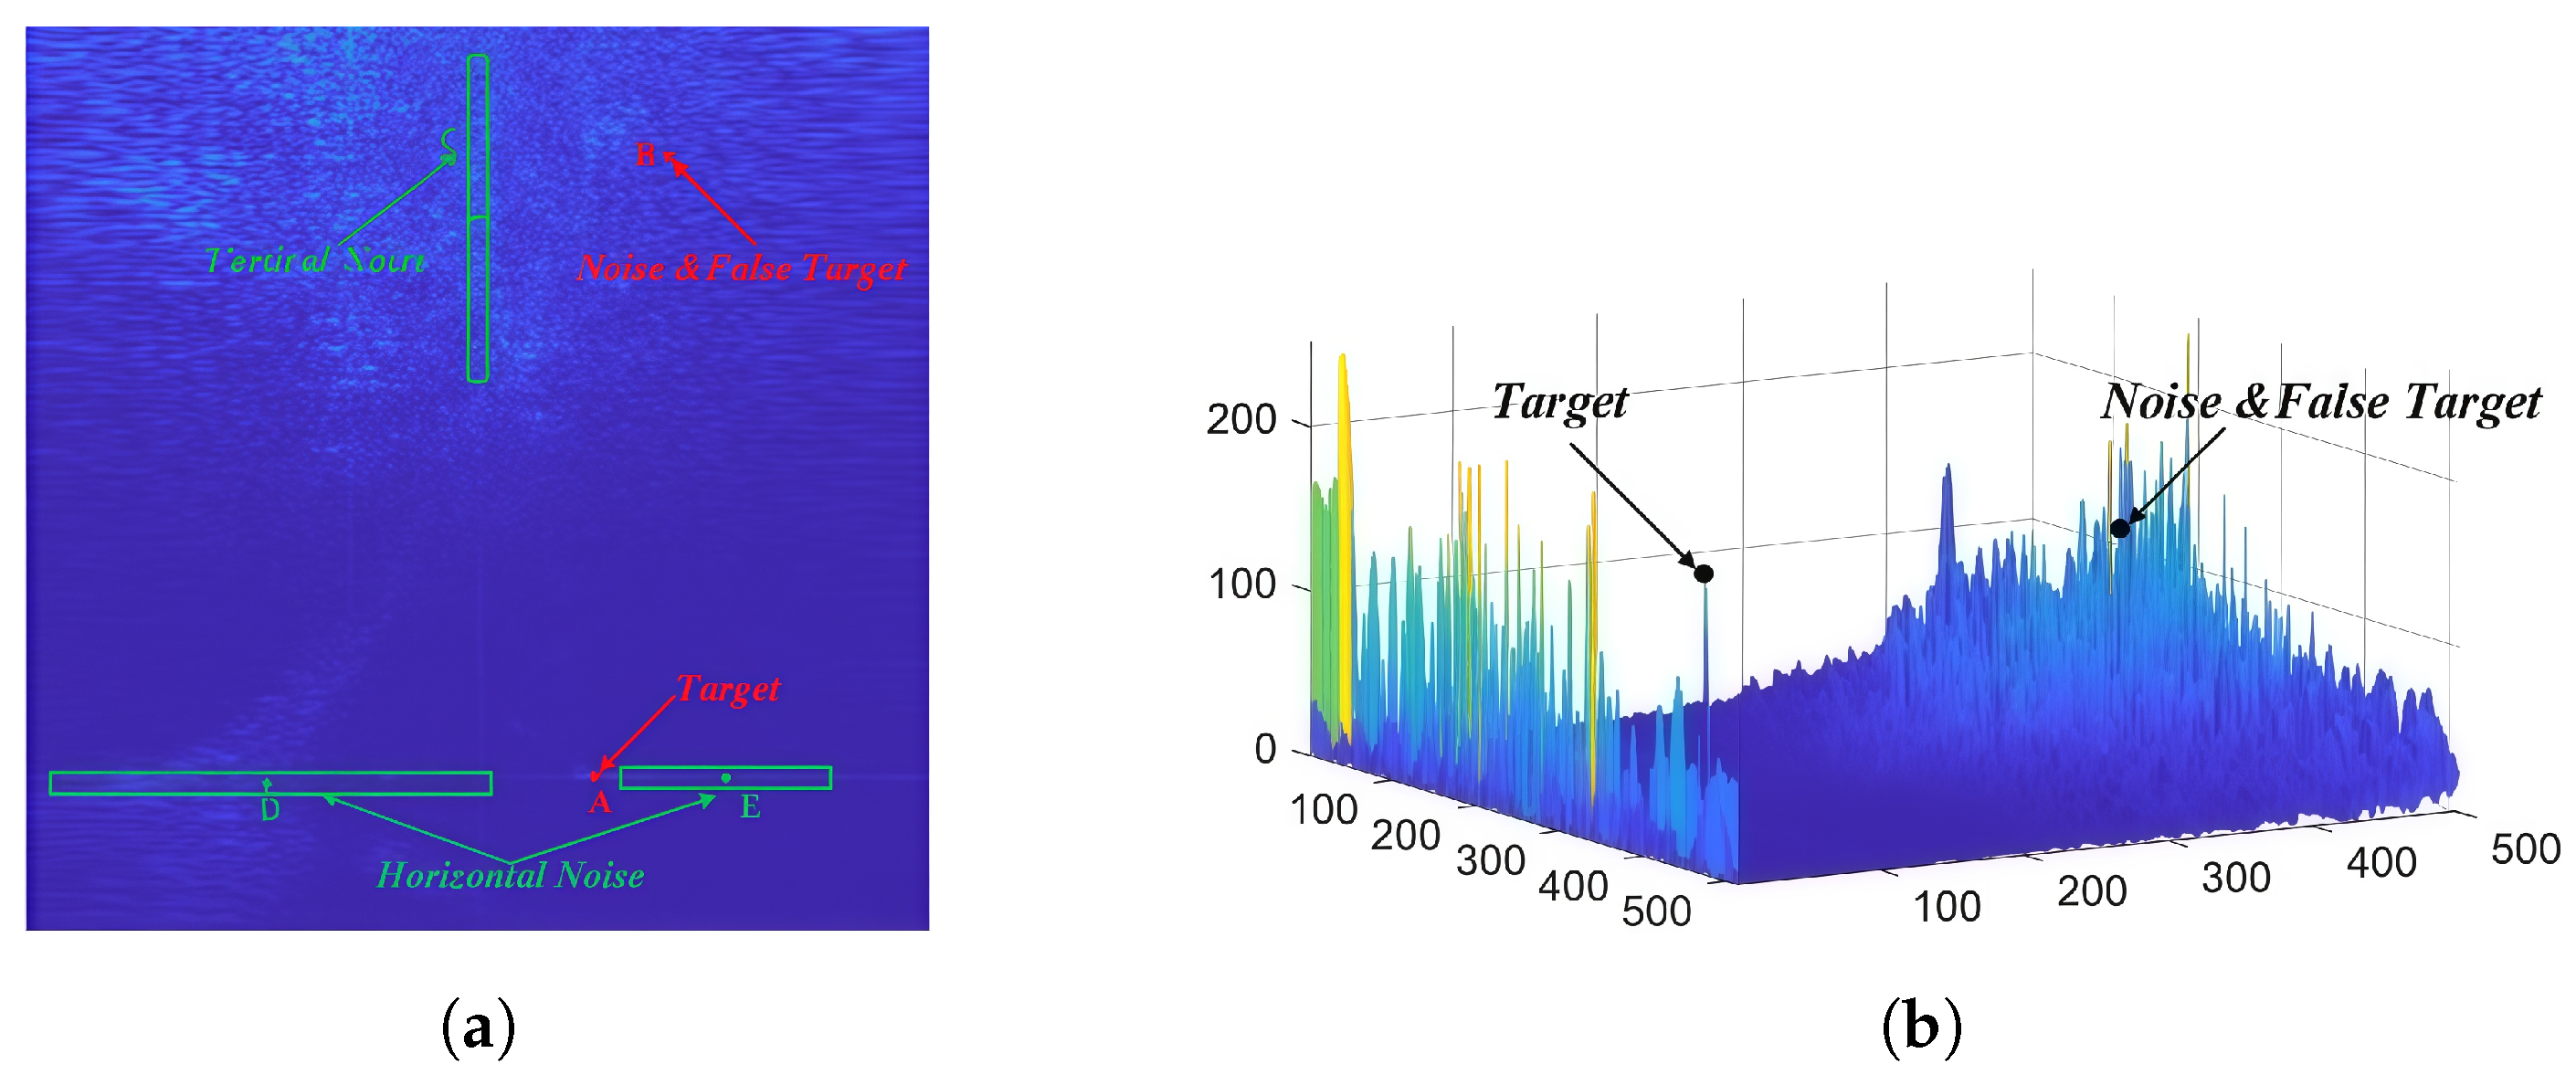
The complex underwater environment introduces significant noise into sonar echoe intensity backgrounds. As illustrated in Figure 2a, A denotes the target, B indicates point-like noise, C represents vertical noise, and D and E correspond to horizontal noise. This interference often causes the foreground target to appear weaker than the surrounding noise, which increases the likelihood of missed detections, as shown in Figure 2b. Therefore, a local weighted information entropy method is used to suppress background noise effectively.
Statistical analysis reveals clear differences in entropy between foreground targets and background areas. Backgrounds generally exhibit uniform intensity distributions due to large-scale noise, resulting in lower entropy values. Conversely, foreground targets show non-uniform intensity distributions, producing higher entropy. A locally weighted entropy operator can therefore effectively mitigate background interference in sonar echo intensity images. For an intensity image I of dimensions ( M × N ), divided into L non-overlapping levels based on target intensity magnitude, the intensity image information entropy is computed as:
E i m a g e = i = 1 L p i · log 2 p i p i = n i / M × N
The weighted local information entropy (WLIE) computes a weighted sum of the entropy of intensity values from m classes around each point ( x , y ) . In this context, m signifies that the intensity values within the reference window around point ( x , y ) are partitioned into non-overlapping levels based on the target intensity’s magnitude, aligning with the description of L in Equation (2). Along with the contrast between each class’s intensity and that of the point under analysis, this method enhances non-uniform points while suppressing uniform ones, effectively separating the foreground target from the background as expressed in:
E L W I E ( x , y ) = i = 1 m I i I ( x , y ) p I i · log 2 p I i .
This method enhances non-uniform regions and suppresses uniform ones, effectively separating the foreground target from the background.
This study considers the probabilities p I i ( i = 1 , 2 , , m ) of m target types within the reference window around the detection point, along with their corresponding intensities I i ( i = 1 , 2 , 3 , , m ) . A self-developed HT multi-beam sonar system, equipped with 256 array elements and operating at 600 kHz, was used. The sonar has an aperture of 0.32 m, corresponding to the array configuration. Using a classical imaging method, the main lobe exhibits a 3 dB beamwidth of 0.006919 rad. For a 3 m target, the image coverage ranges from 9 to 5 pixels at detection distances of 50 m to 100 m, respectively. To address variations in target size due to detection distance and to mitigate the impact of speckle noise, multiple reference window sizes ( 5 × 5 , 7 × 7 , 9 × 9 ) are applied to improve robustness in detecting targets of different scales. The multi-reference window weighted local information entropy is computed as:
E L W I E m w i n d o w ( x , y ) = max E L W I E 5 × 5 ( x , y ) , E L W I E 7 × 7 ( x , y ) , E L W I E 9 × 9 ( x , y ) .
The entropy map is preprocessed using a soft threshold operation to further suppress background noise:
T h E = μ E + k σ E ,
where μ E and σ E represent the mean and variance of the intensity image’s information entropy, respectively, while k is the adjustment parameter. Experimental results confirm that k = 0.2 is the most suitable setting.

3.2.3. Rough Extraction of the Target by Intersecting Two Sources of Information

To simultaneously address the challenges of pre-detecting foreground targets and suppressing background noise in sonar intensity images, this paper integrates the thresholding methods STSI ( T Pr e S I ) and STLWIE ( T Pr e L W I E ) through multiplication:
S e t r o u g h = I ( x , y ) E L W I E m w i n d o w ( x , y ) > T h E T Pr e L W I E I ( x , y ) I ( x , y ) > T h i m a g e T Pr e S I
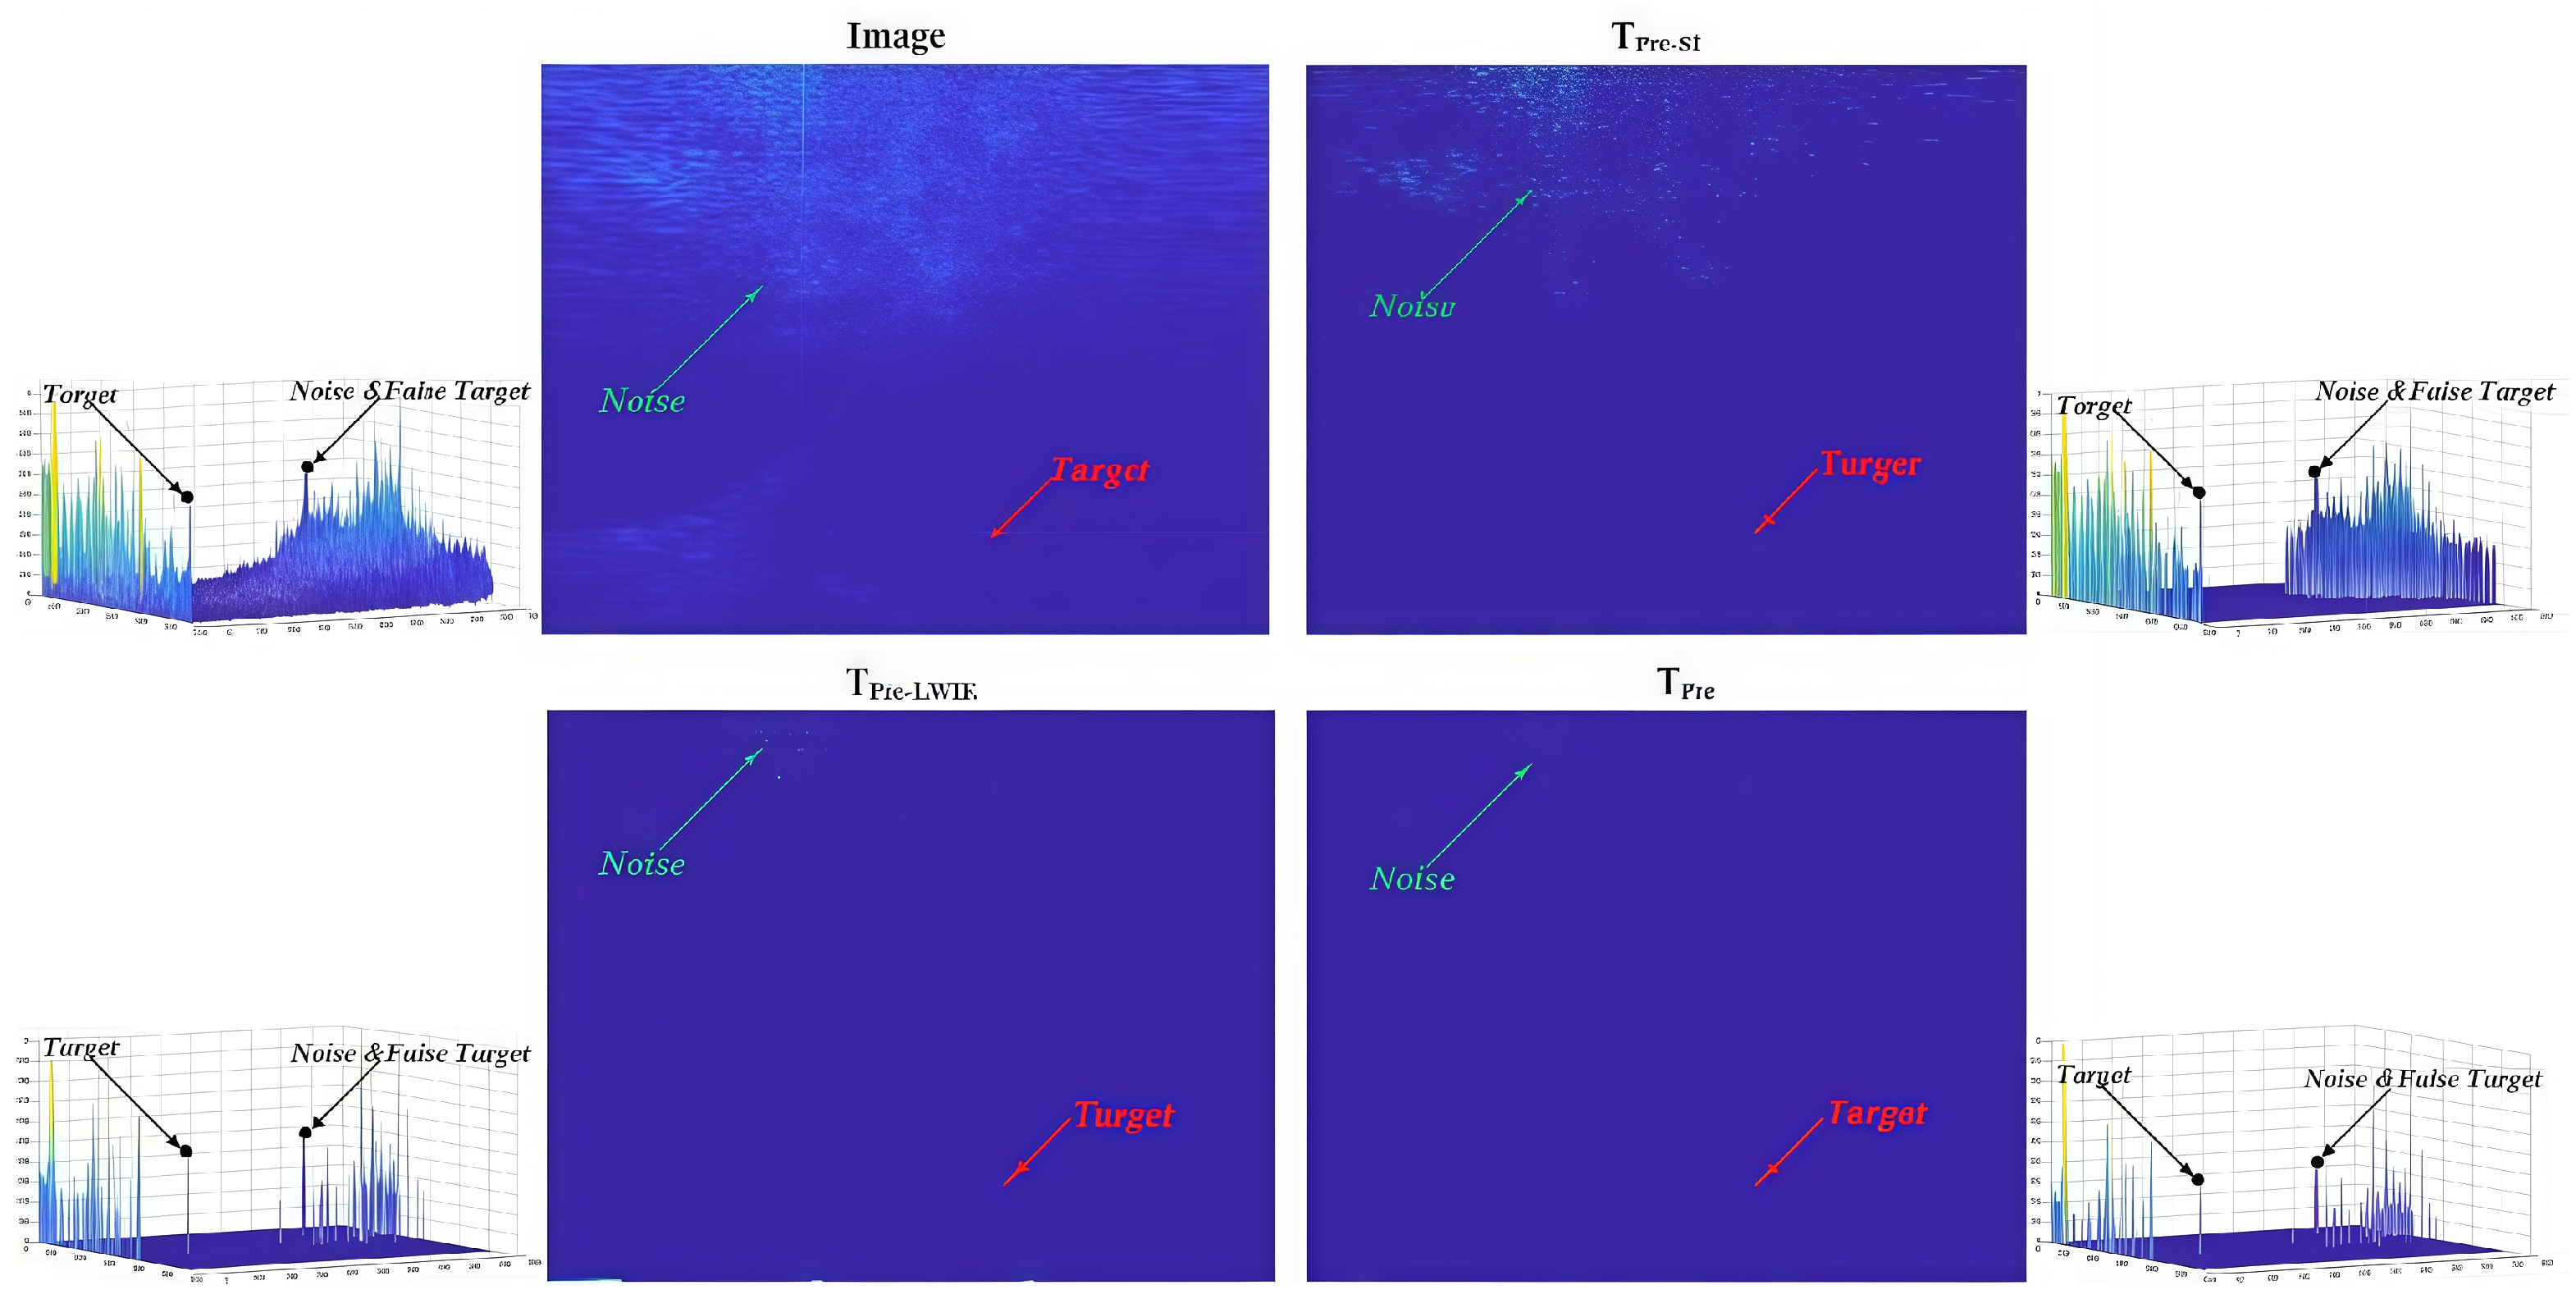
where T Pr e S I and T Pr e L W I E are the results derived from applying the two distinct threshold calculations to intensity image I ( x , y ) . The final result S e t r o u g h is obtained by intersecting T Pr e S I and T Pr e L W I E , thus identifying potential candidate target locations. Figure 3 shows the maps of these threshold calculation results. Figure 3 demonstrates that T Pr e S I , derived from STSI, effectively detects and extracts foreground targets, while T Pr e L W I E , obtained through STLWIE, significantly suppresses background interference. The fusion of STSI and STLWIE into S e t r o u g h enables rough detection of small targets and delineates candidate regions, thereby reducing false detection rates.

3.3. Multi-Scale Local Contrast Measure Description ( Description 1 )

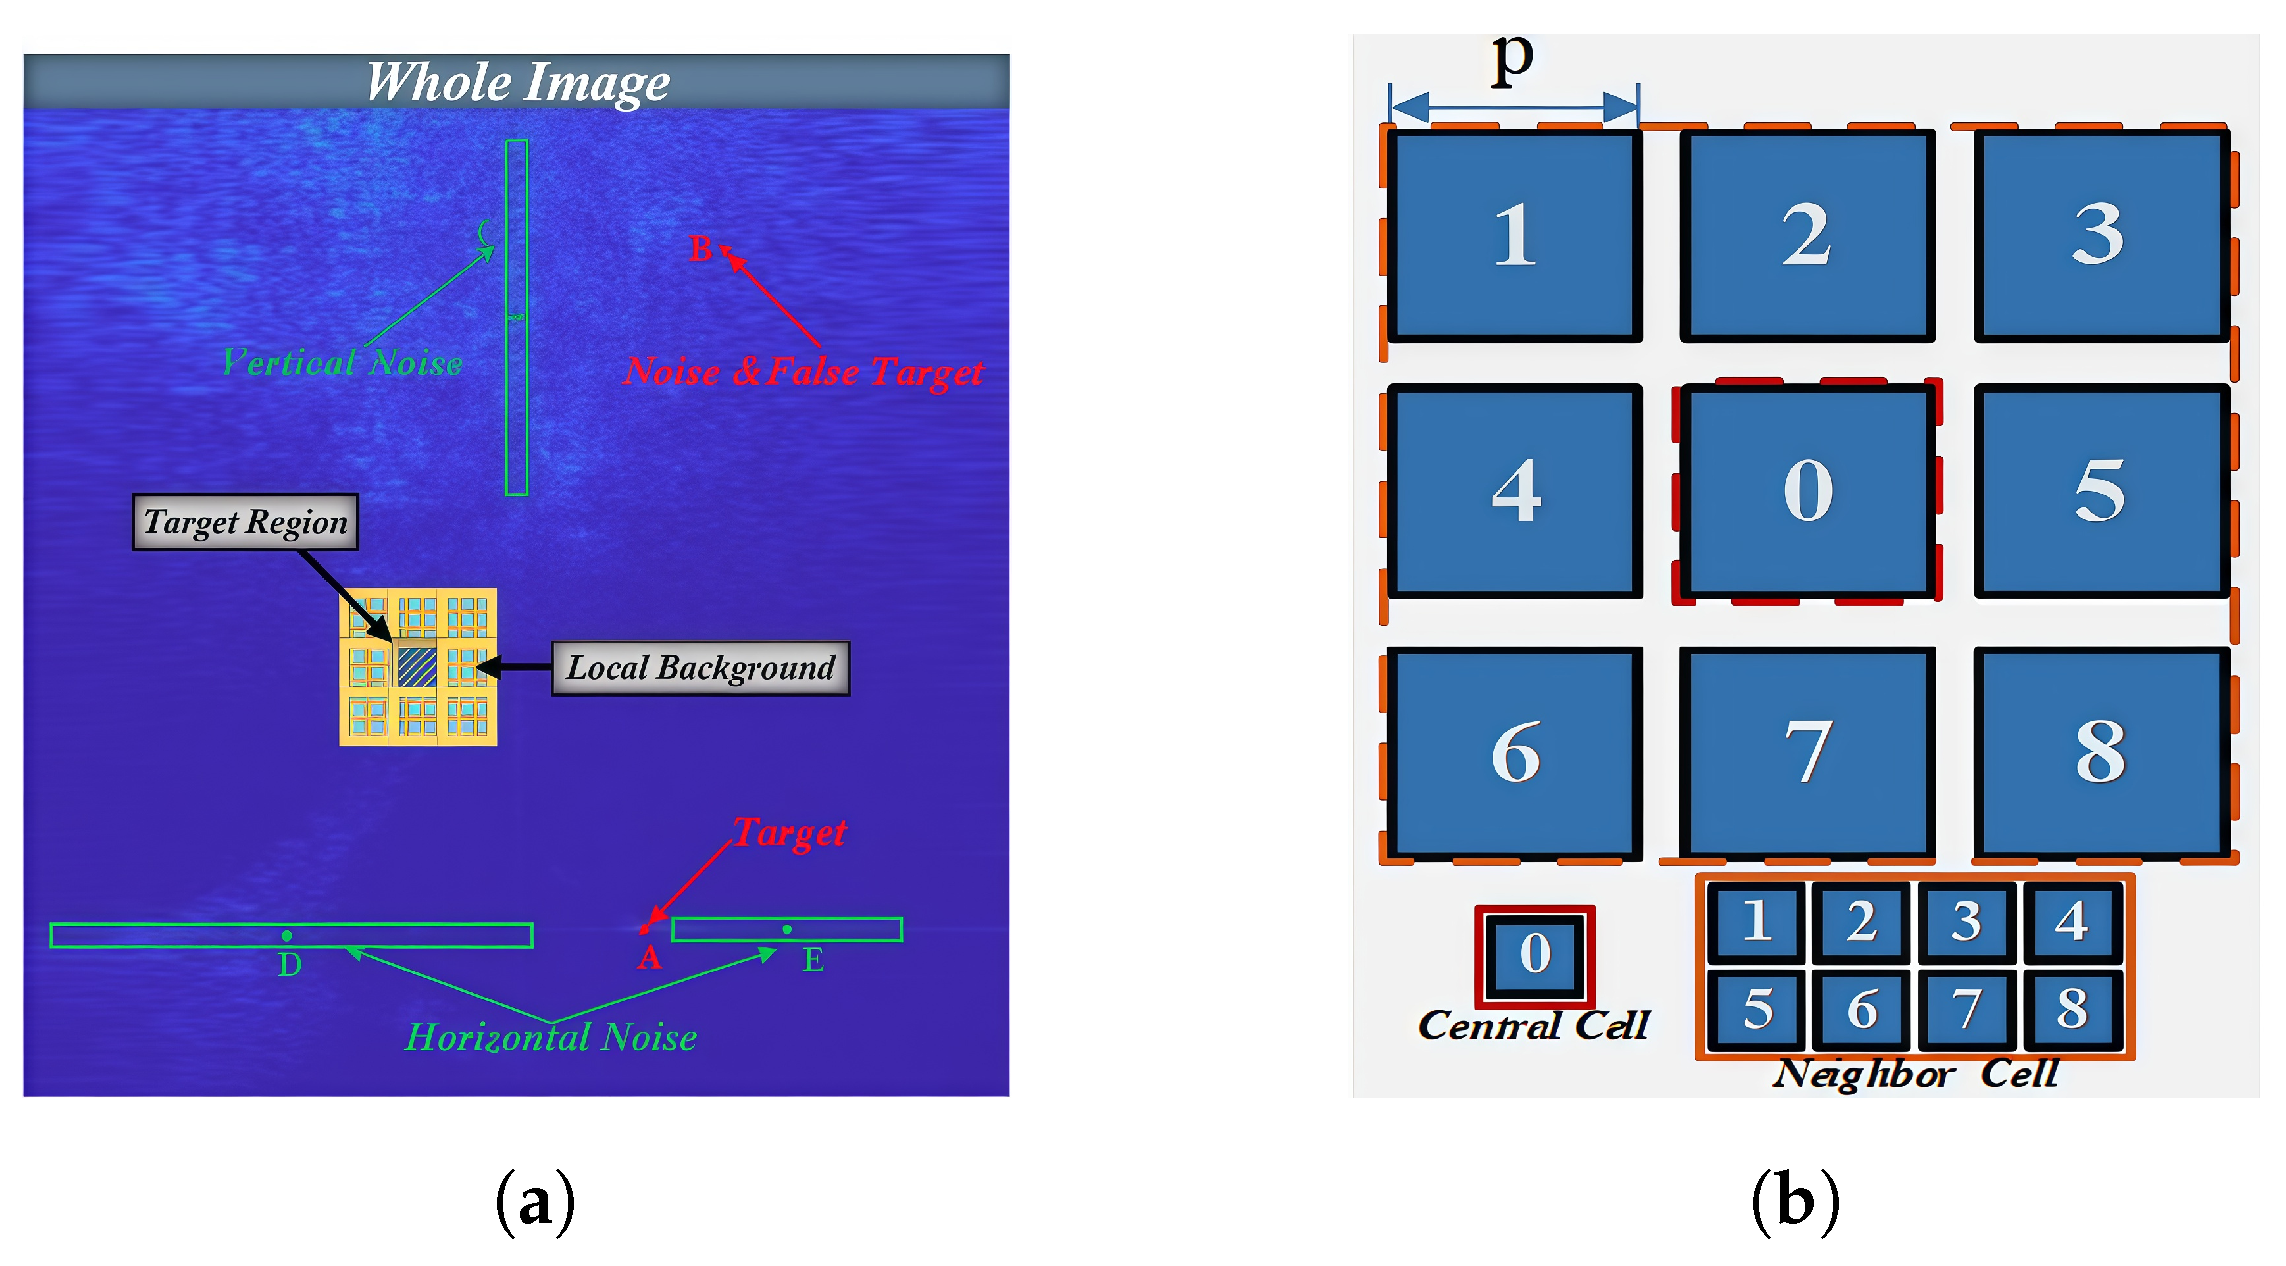
Section 3.2 addresses background noise by removing extensive interference regions, including areas B, C, and D in Figure 4a. To quantify the local contrast between the target region and the surrounding background, the LCM approach is used. As illustrated in Figure 4a, the target region and the local background are enclosed within a yellow rectangular window. This window is further divided into a 3 × 3 grid of reference cells, each sized p × p pixels. The central target cell is denoted by “0”, representing the area where the target may appear, while the surrounding background cells are labeled “1” through “8”, indicating potential background areas, as shown in Figure 4b. The LCM is computed by sliding this window across the sonar intensity image to characterize the local contrast variations.
To assess background intensity, the mean intensity for each cell is computed as:
M i = 1 P j P I j i i = 1 , 2 , , 8 I ( x , y ) S e t r o u g h ,
where P = p × p denotes the number of pixels in each cell, I j i represents the jth pixel value of the ith cell, and M i ( i = 1 , 2 , , 8 ) indicates the mean pixel value within each cell. By the same token, the calculation method for 8 cells based on local weighted information entropy N i ( i = 1 , 2 , , 8 ) can be obtained:
N i = 1 P j P E L W I E m w i n d o w j i i = 1 , 2 , , 8 E L W I E m w i n d o w ( x , y ) S e t r o u g h ,
To further suppress background interference and improve target-background contrast, let R o u g h [ I ( x , y ) ] and R o u g h [ E L W I E m w i n d o w ( x , y ) ] respectively represent I ( x , y ) S e t r o u g h and E L W I E m w i n d o w ( x , y ) S e t r o u g h , the LCM for a cell size of p × p is expressed as:
L C M p × p I = R o u g h [ I ( x , y ) ] 2 max { M 1 , M 2 , M 3 , M 4 , M 5 , M 6 , M 7 , M 8 } ,
L C M p × p E = R o u g h [ E L W I E m w i n d o w ( x , y ) ] 2 max { N 1 , N 2 , N 3 , N 4 , N 5 , N 6 , N 7 , N 8 } .
In practice, the apparent size of the target depends on factors such as sonar operating frequency, sonar array aperture, the number of array elements, and the distance to the target. Since the target size is inherently non-uniform, selecting an appropriate cell size p × p is critical. A small p value may allow background noise to overwhelm the target, while a large p can result in noise being misidentified as a target. To balance these issues, this study combines three different cell sizes, p = 3 , 5 , 7 , to derive a multi scale local contrast measure (Description1):
D e s c r i p t i o n 1 I = L C M 3 × 3 I , L C M 5 × 5 I , L C M 7 × 7 I ,
D e s c r i p t i o n 1 E = L C M 3 × 3 E , L C M 5 × 5 E , L C M 7 × 7 E ,

3.4. Random Walk Local Contrast Measure Description ( Description 2 )

Building on the candidate targets identified in Section 3.2 and Section 3.3, Section 3.4 focuses on precise detection and localization. Small-target localization is reframed as an intensity image segmentation problem, where known labels are assigned to foreground targets and background regions. The method predicts unknown labels based on these predefined examples, effectively separating the foreground from the background to achieving accurate target localization. This approach uses the random walk algorithm to categorize each unlabeled pixel using a limited set of labeled pixels (target and background). Precise detection is then achieved by incorporating all labeled pixels. The random walk method calculates the relationship between an image patch’s central pixel and its surroundings through gradient transformation, effectively preserving intensity relationships even with low contrast between target and background. This approach relies on global pixel connectivity rather than local relationships, making it resilient to sonar noise and capable of reducing local interference. When combined with the description operators discussed in Section 3.4 and the procedures from Section 3.2 and Section 3.3, it enables reliable underwater target detection.

3.4.1. Labeling of Unlabeled Pixels via Random Walk

The random walk method is a graph-based approach for pixel-wise labeling. In this framework, the intensity image is represented as a graph G = ( Q , E ) , where Q denotes the set of pixel intensities and E represents undirected connections between pixels. The relationship between the intensity values I ( m ) and I ( n ) of two pixels v m and v n is encoded in the edge weight ω m n defined as:
ω m n = exp β · I ( m ) I ( n ) 2 ,
where β is a control parameter that, when multiplied by I ( m ) I ( n ) 2 , influences the exponential function exp ( · ) . It acts as a “strictness factor,” regulating the similarity between I ( m ) and I ( n ) . The value of β determines how stringent the similarity metric is between two pixels in the echo intensity map. The Laplacian matrix of the graph is then constructed based on this representation. By leveraging the Laplacian matrix and the known labels of some pixels, the algorithm computes the probability that each unlabeled pixel belongs to a given category label c C (e.g., target, background).
For a patch of an intensity image I containing q × q pixels, the Laplacian matrix L q × q is constructed as:
L m × n = d m i f m = n ω m n i f v m a n d v n a r e a d j a c e n t p i x e l s 0 o t h e r w i s e ,
where d m = n ω m n is defined as the sum of edge weights connecting pixel v m to its neighboring pixels v n . The matrix L is symmetric.
Utilizing the Laplacian matrix along with the label information of known pixels, the probability that an unlabeled pixel belongs to a particular category is determined. Let p m c denote the probability that pixel v m is associated with category c. Each pixel within the image patch is assigned a probability of belonging to category c, forming a pixel probability set, p c = p 1 c , p 2 c , p 3 c , , p q × q , c . The probability distribution for known pixels is represented by p c l = p 1 c l , p 2 c l , p 3 c l , p ( m 1 ) c l , p ( m ) c l , while p c u = p 1 c u , p 2 c u , p 3 c u , , p ( ( q × q ) m 1 ) c u , p ( ( q × q ) m ) c u denotes the distribution for unknown pixels. The construction of probabilities for known labels is detailed in Equation (15).
p ( m ) c l = 1 i f v m b e l o n g s t o c 0 o t h e r w i s e
The p c problem is then solved by minimizing the energy function E ( p c ) = ( 1 / 2 ) p T c L p c , with the calculation process shown as:
E ( p c ) = 1 2 [ ( p c l ) T ( p c u ) T ] L l B T B L u p c l p c u p c u = L u 1 B T p c l
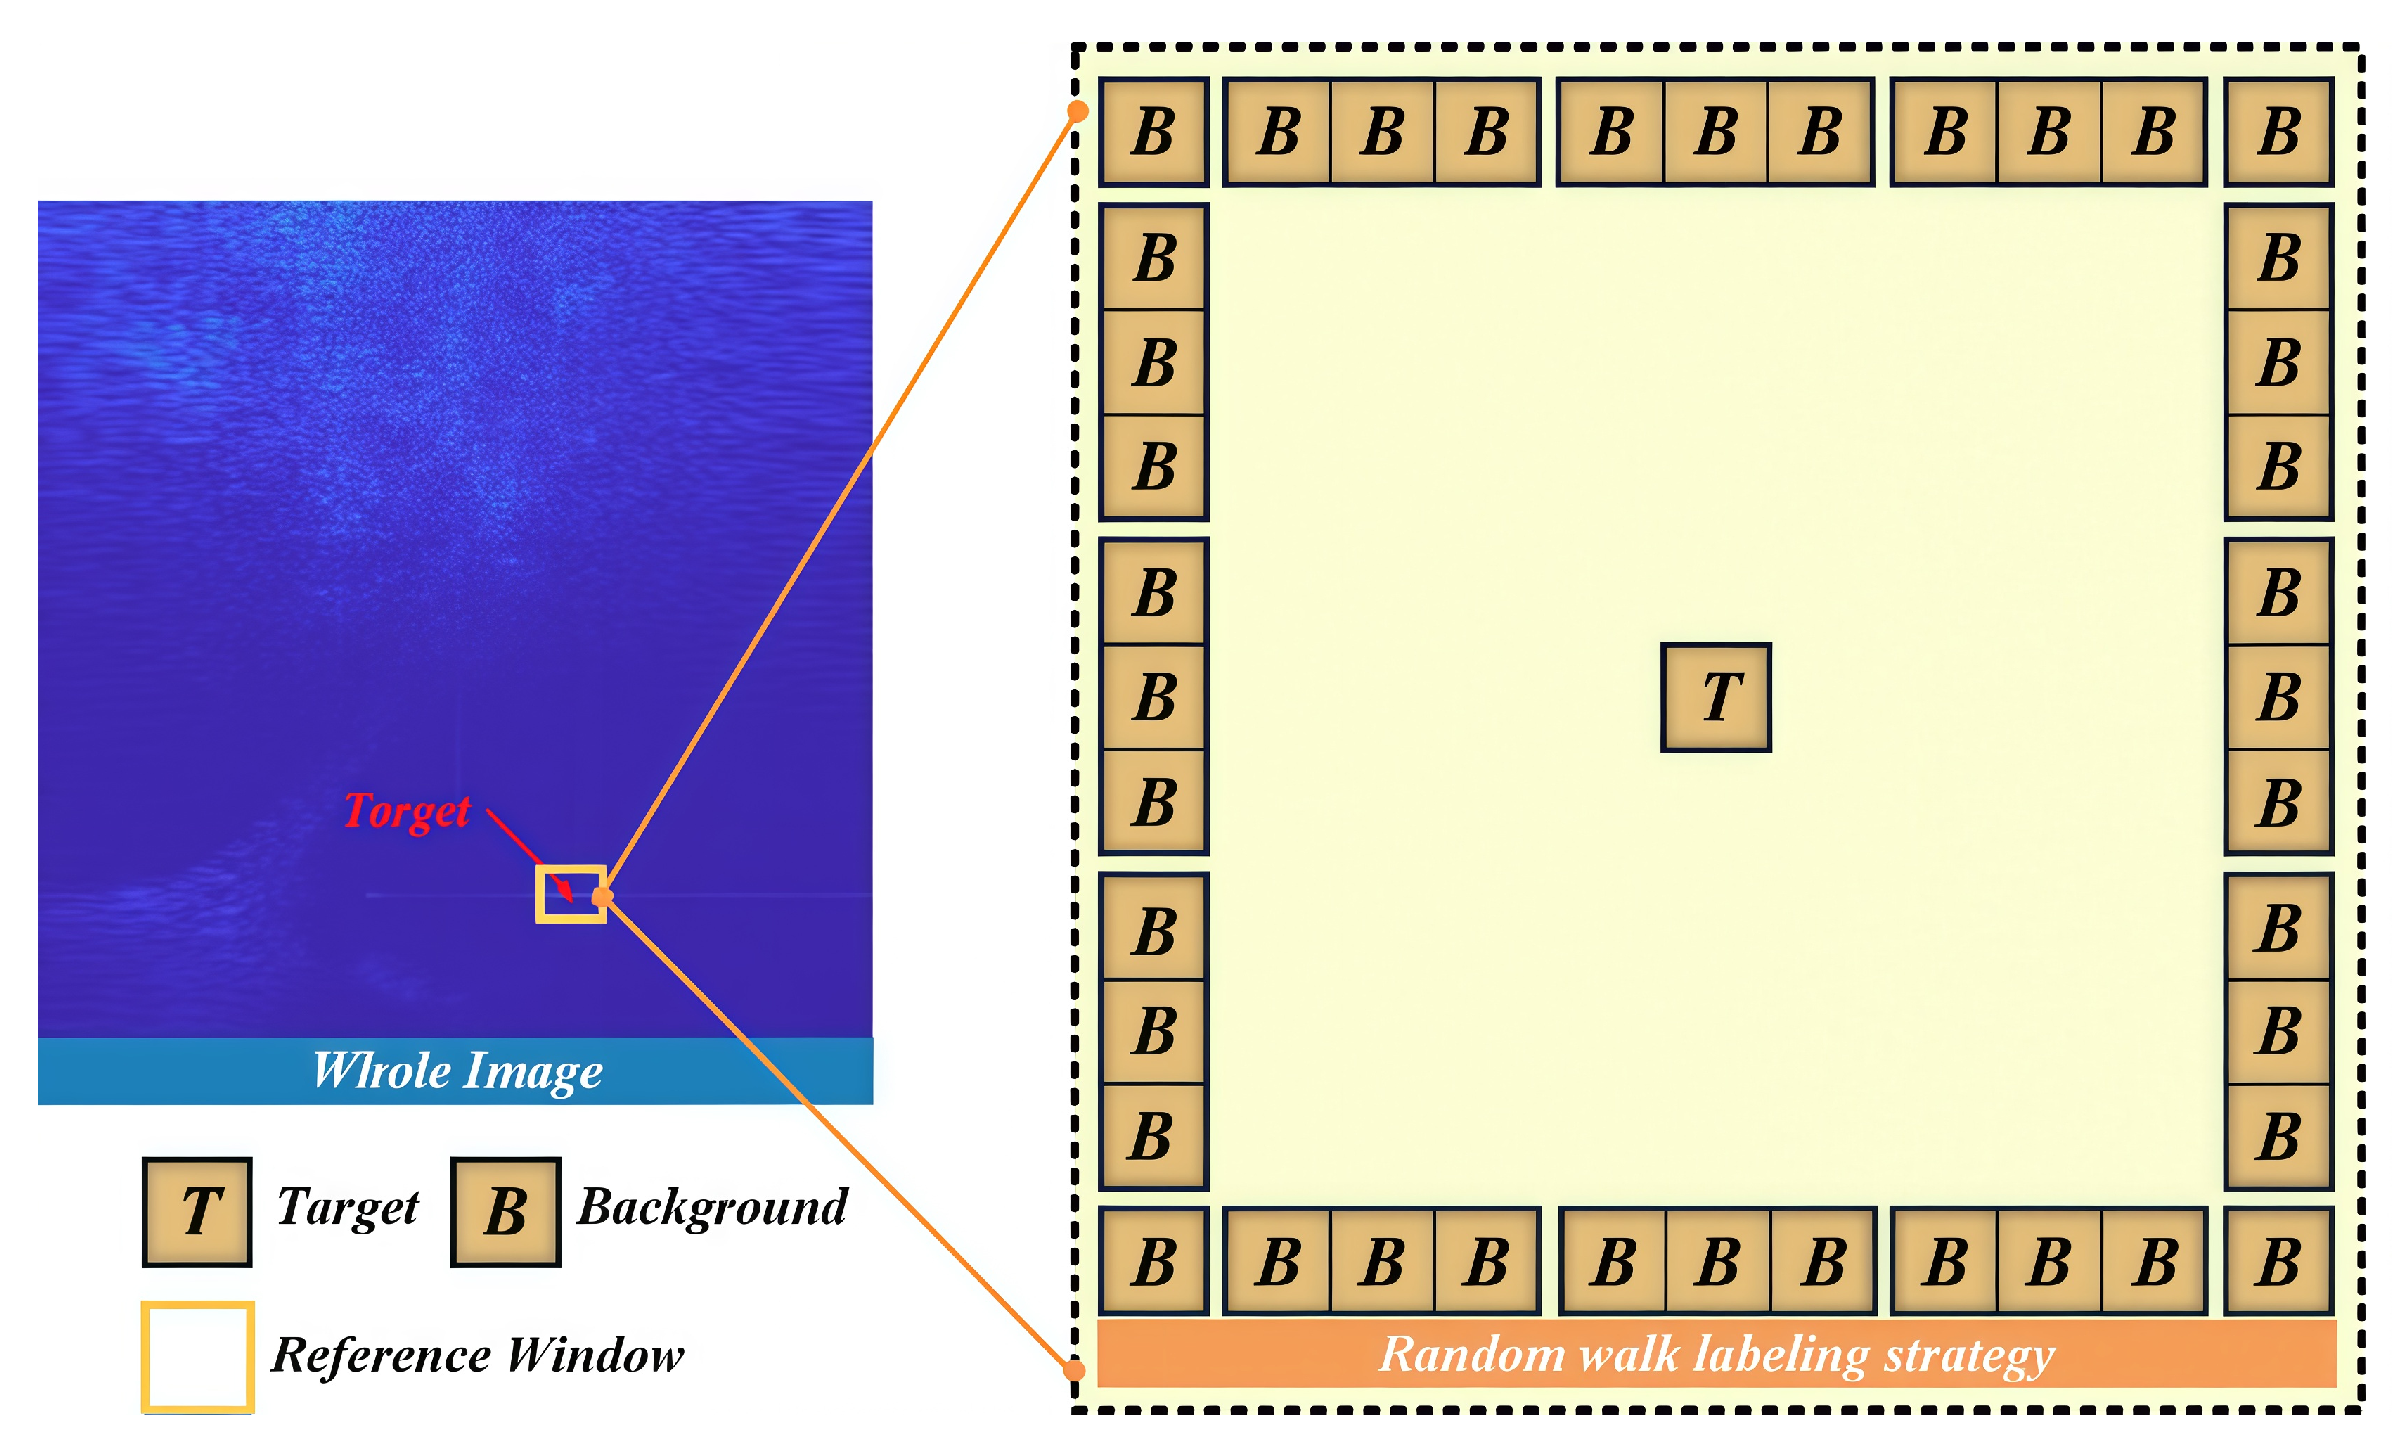
The Laplacian matrix, constructed from intensity image patches, can be partitioned into sub-matrices L l , L u and B, corresponding to known pixels, unknown pixels, and their interrelations, respectively. This partitioning enables efficient processing and analysis of the intensity data. This study used the sliding window method, with a window size of q × q as the reference for scanning the entire sonar intensity map. A two-class segmentation was conducted on the echo intensity within this reference window to examine the relationship between the surrounding intensity information and the central intensity of the q × q window. To address the challenge of pre-labeling known pixel categories for the random walk method, the central pixel is designated as the target category, while the surrounding pixels are labeled as background. Consequently, the known pixels are categorized into two groups: one target-class pixel and 4 ( q 1 ) background-class pixels. Figure 5 illustrates the strategy for labeling known categories within the patches.

3.4.2. Detailed Analysis of the Target’s Local Contrast

The calculation described in Section 3.4.1 enables partitioning of the target and background within the patch block of size q × q . Analysis of issues such as low signal-to-noise ratio and regional noise in sonar intensity images shows that poor target localization can occur when the noise intensity within the patch block is similar to the target’s intensity. This similarity can lead to missed detections due to high-brightness noise points. To address this problem, this paper introduces the random walk local contrast method (RLCM) for target detection, building upon the segmentation of target and background areas:
R L C M q × q = I ( C l s t   arg   e t ) ¯ I ( C l s b a c k g r o u n d ) ¯ , I S e t r o u g h ,
where I ( C l s t   arg   e t ) denotes the mean intensity of the target class after random walk segmentation within the patch block, while I ( C l s b a c k g r o u n d ) represents the mean intensity of the background class in the same block.

3.5. Dual Contrast Nested Measure Target Detection

To achieve effective target-background separation, target enhancement, background suppression, and precise localization in sonar target detection, this paper integrates Description 1 from Section 3.3 and Description 2 from Section 3.4, introducing a Dual Contrast Nested Measure Target Detection approach. Figure 6 shows the configuration of reference units within the detection window, as well as the arrangement of known pixels and labels used in the random walk process. The reference window consists of 3 × 3 reference cells, each containing p × p pixels with p = 3 , 5 , 7 . In the random walk method, the outermost pixels of each patch are labeled as background pixels. Accordingly, the reference window dimensions are defined as q × q , with q = 3 p + 2 , q = 11 , 17 , 23 . Description 2 of the dual contrast nested measure is:
D e s c r i p t i o n 2 = { R L C M 10 × 10 , R L C M 16 × 16 , R L C M 22 × 22 } ,
and its final description is expressed as:
D e s c r i p t i o n = max { D e s c r i p t i o n 2 } max { D e s c r i p t i o n 1 I } max { D e s c r i p t i o n 1 E }
D e s c r i p t i o n = max { R L C M 10 × 10 , R L C M 16 × 16 , R L C M 22 × 22 } max { L C M 3 × 3 I , L C M 5 × 5 I , L C M 7 × 7 I } max { L C M 3 × 3 E , L C M 5 × 5 E , L C M 7 × 7 E }

4. Experiment

This section outlines the experimental dataset, baseline comparison methods, and evaluation metrics (Section 4.1). Experiments were carried out using MATLAB R2022b on a workstation running Microsoft Windows 10, equipped with an NVIDIA GTX TITAN-XP GPU and 64 GB of RAM. Algorithm performance was assessed through qualitative, quantitative, combined, and optimal strategy analyses (Section 4.2 and Section 4.3).

4.1. Experimental Setup

4.1.1. Dataset

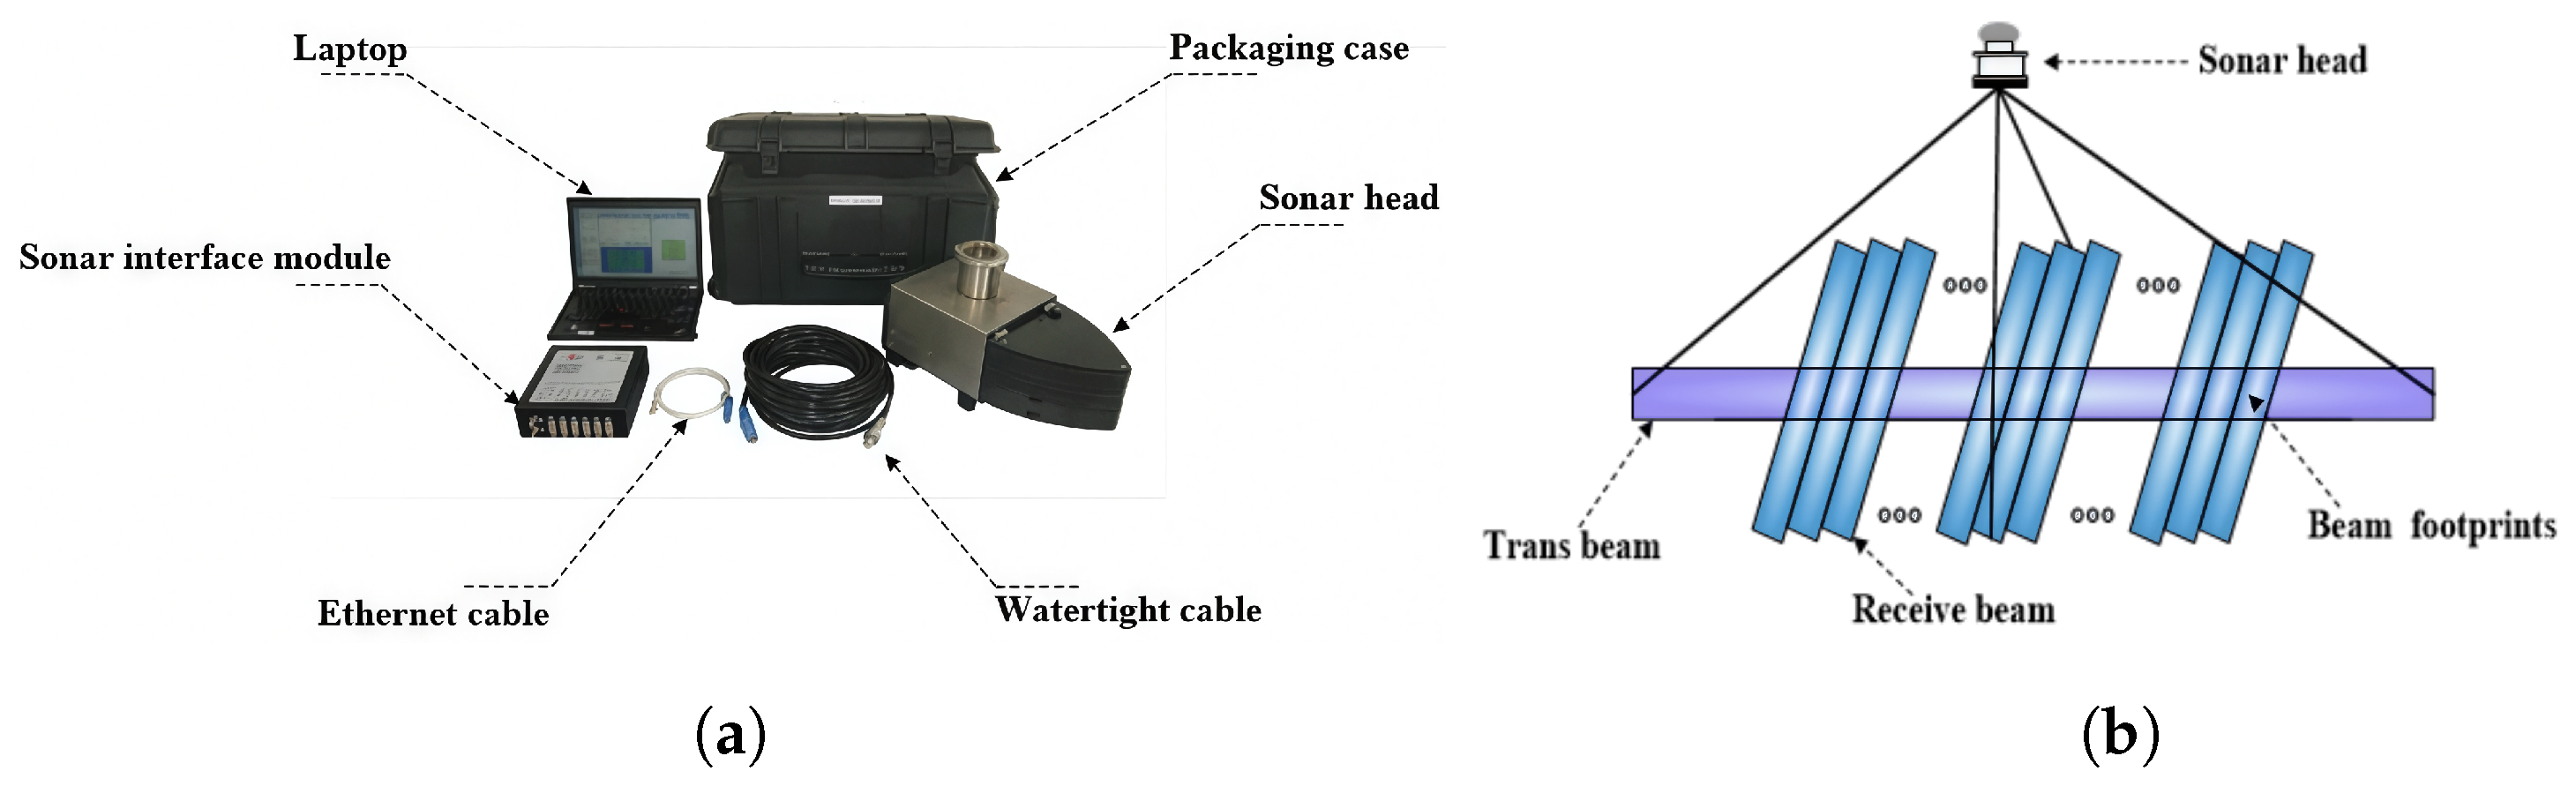
This study focuses on small underwater targets characterized by low signal-to-noise ratios and low contrast. For experimental validation, a dummy target with an echo intensity of −25 dB was selected. Data acquisition was performed using a self-developed HT series multi-beam sonar system. The system operated at a center frequency of 600 kHz and transmitted a matrix single-frequency rectangular pulse. The structure of the HT series multi-beam echo sounder is shown in Figure 7. This sonar system adopts Mill’s crossed-array sonar architecture, which integrates all modules and embeds the processor and controller within the sonar head to simplify deployment. A dedicated computer-based graphical user interface (GUI) enables surveyors to configure and control echosounder parameters. The GUI communicates with the sonar interface module (SIM) over Ethernet, providing power to the sonar head and transmitting raw multi-beam data to the acquisition computer. After filtering, demodulation, and FFT beamforming of the raw echo signals, actual lake test data were obtained to verify the effectiveness of the proposed detection algorithm.
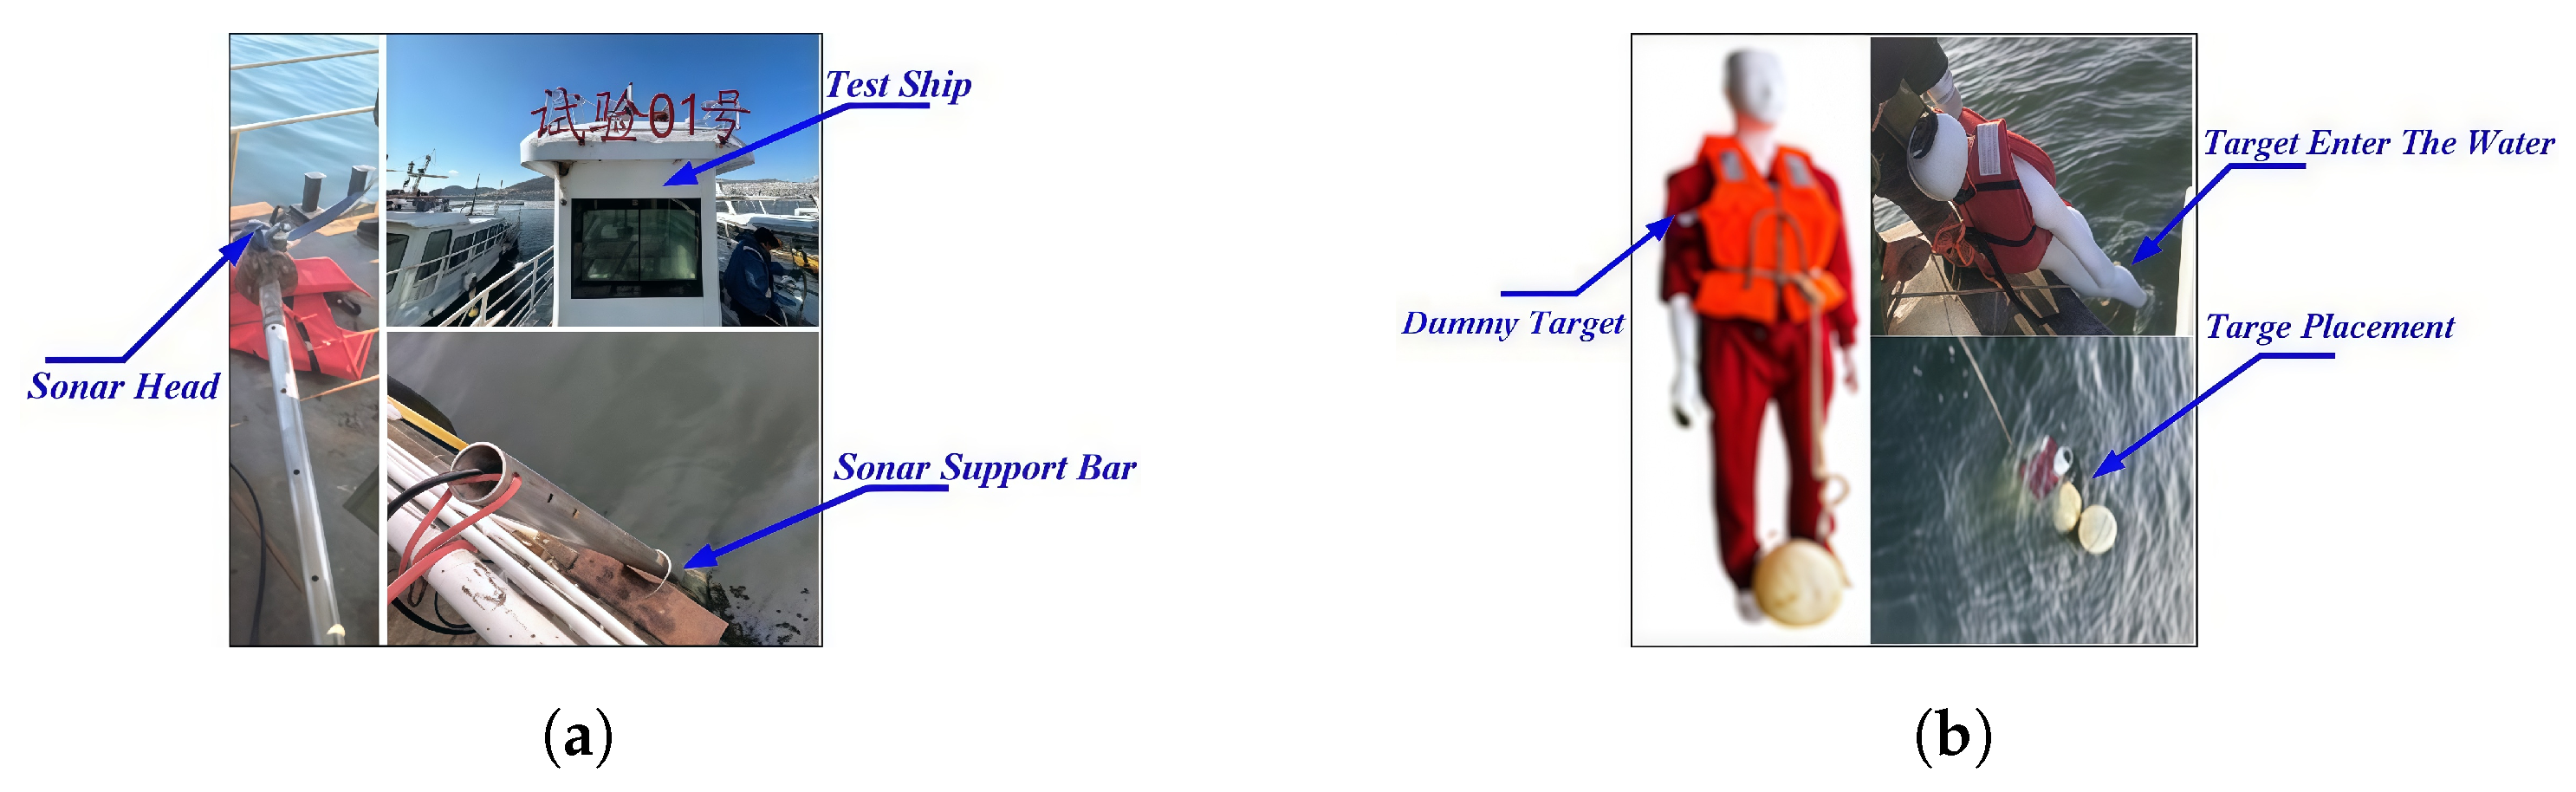
The study was conducted in the waters of Songhua Lake, Jilin City, Jilin Province, China. The sonar wet end was securely attached to the connecting rod using bolts and installed using a side-hanging method, ensuring the sonar wet end was fixed on a dedicated mounting frame on the left side of the survey vessel’s gunwale, with the probe submerged 1.5 m below the water surface. The experimental setup and installation are shown in Figure 8. To enable algorithm processing, all frame data acquired during the experiment were uniformly standardized to 512 × 512 intensity image data formats.

4.1.2. Baseline Methods

To evaluate the performance of the proposed detection algorithm, 15 baseline methods were selected for comparison. First, TOPHAT, MAXMED, and MAXMEAN [40] were included as representative conventional filtering approaches. Second, LCM [32], TLLCM [41], DLCM [42], and LIG [40] were chosen for their use of local contrast techniques inspired by the HVS. Third, MPCM [7], RLCM [38], and HBMLCM [43] were selected for their multi-scale target detection capabilities. Fourth, ADMD and AAGD [44,45] were incorporated for their emphasis on directional absolute target contrast. Finally, DGRAD [46], AMWLCM [47], and LR [48] were considered due to their focus on foreground–background separation. Comparing the proposed method with these 15 baselines enables a comprehensive assessment of its relative advantages.

4.1.3. Evaluation Metrics

Underwater sonar intensity images are characterized by low signal-to-noise ratios, which distinguish them from infrared and radar images. Additionally, target intensity in sonar intensity images fluctuates due to time-varying sound propagation in the underwater environment. This study uses the mean background suppression factor ( B S F M e a n ) and variance background suppression factor ( B S F V a r ) metrics to evaluate background suppression performance. For target enhancement assessment, the signal-to-clutter ratio ( S C R ) is employed. The relevant calculation formulas and descriptions are:
B S F M e a n = log I ¯ o I ¯ e B S F V a r = σ o σ e S C R = I t m b σ b
where I ¯ o denotes the mean value of the original intensity image, while I ¯ e indicates the mean value after detection and processing, σ o and σ e represent the variance of the original and processed intensity images, respectively, I t is the target intensity in the detected intensity image, with m b and σ b denoting the average and variance of intensity image intensity in the neighboring background regions around the target pixels, I t e , I t o , m b e , and m b o retain the same meanings as previously stated for I t and m b , with the Superscripts e and o referring to the original and detected intensity images, respectively. Additionally, to measure the algorithm’s ability to detect targets across sequences of intensity images, detection accuracy P d was calculated as:
P d = # The number of correctly detected targets # The number of actual targets .

4.2. Qualitative Comparisons

4.2.1. Comparison with Conventional Filtering Approaches

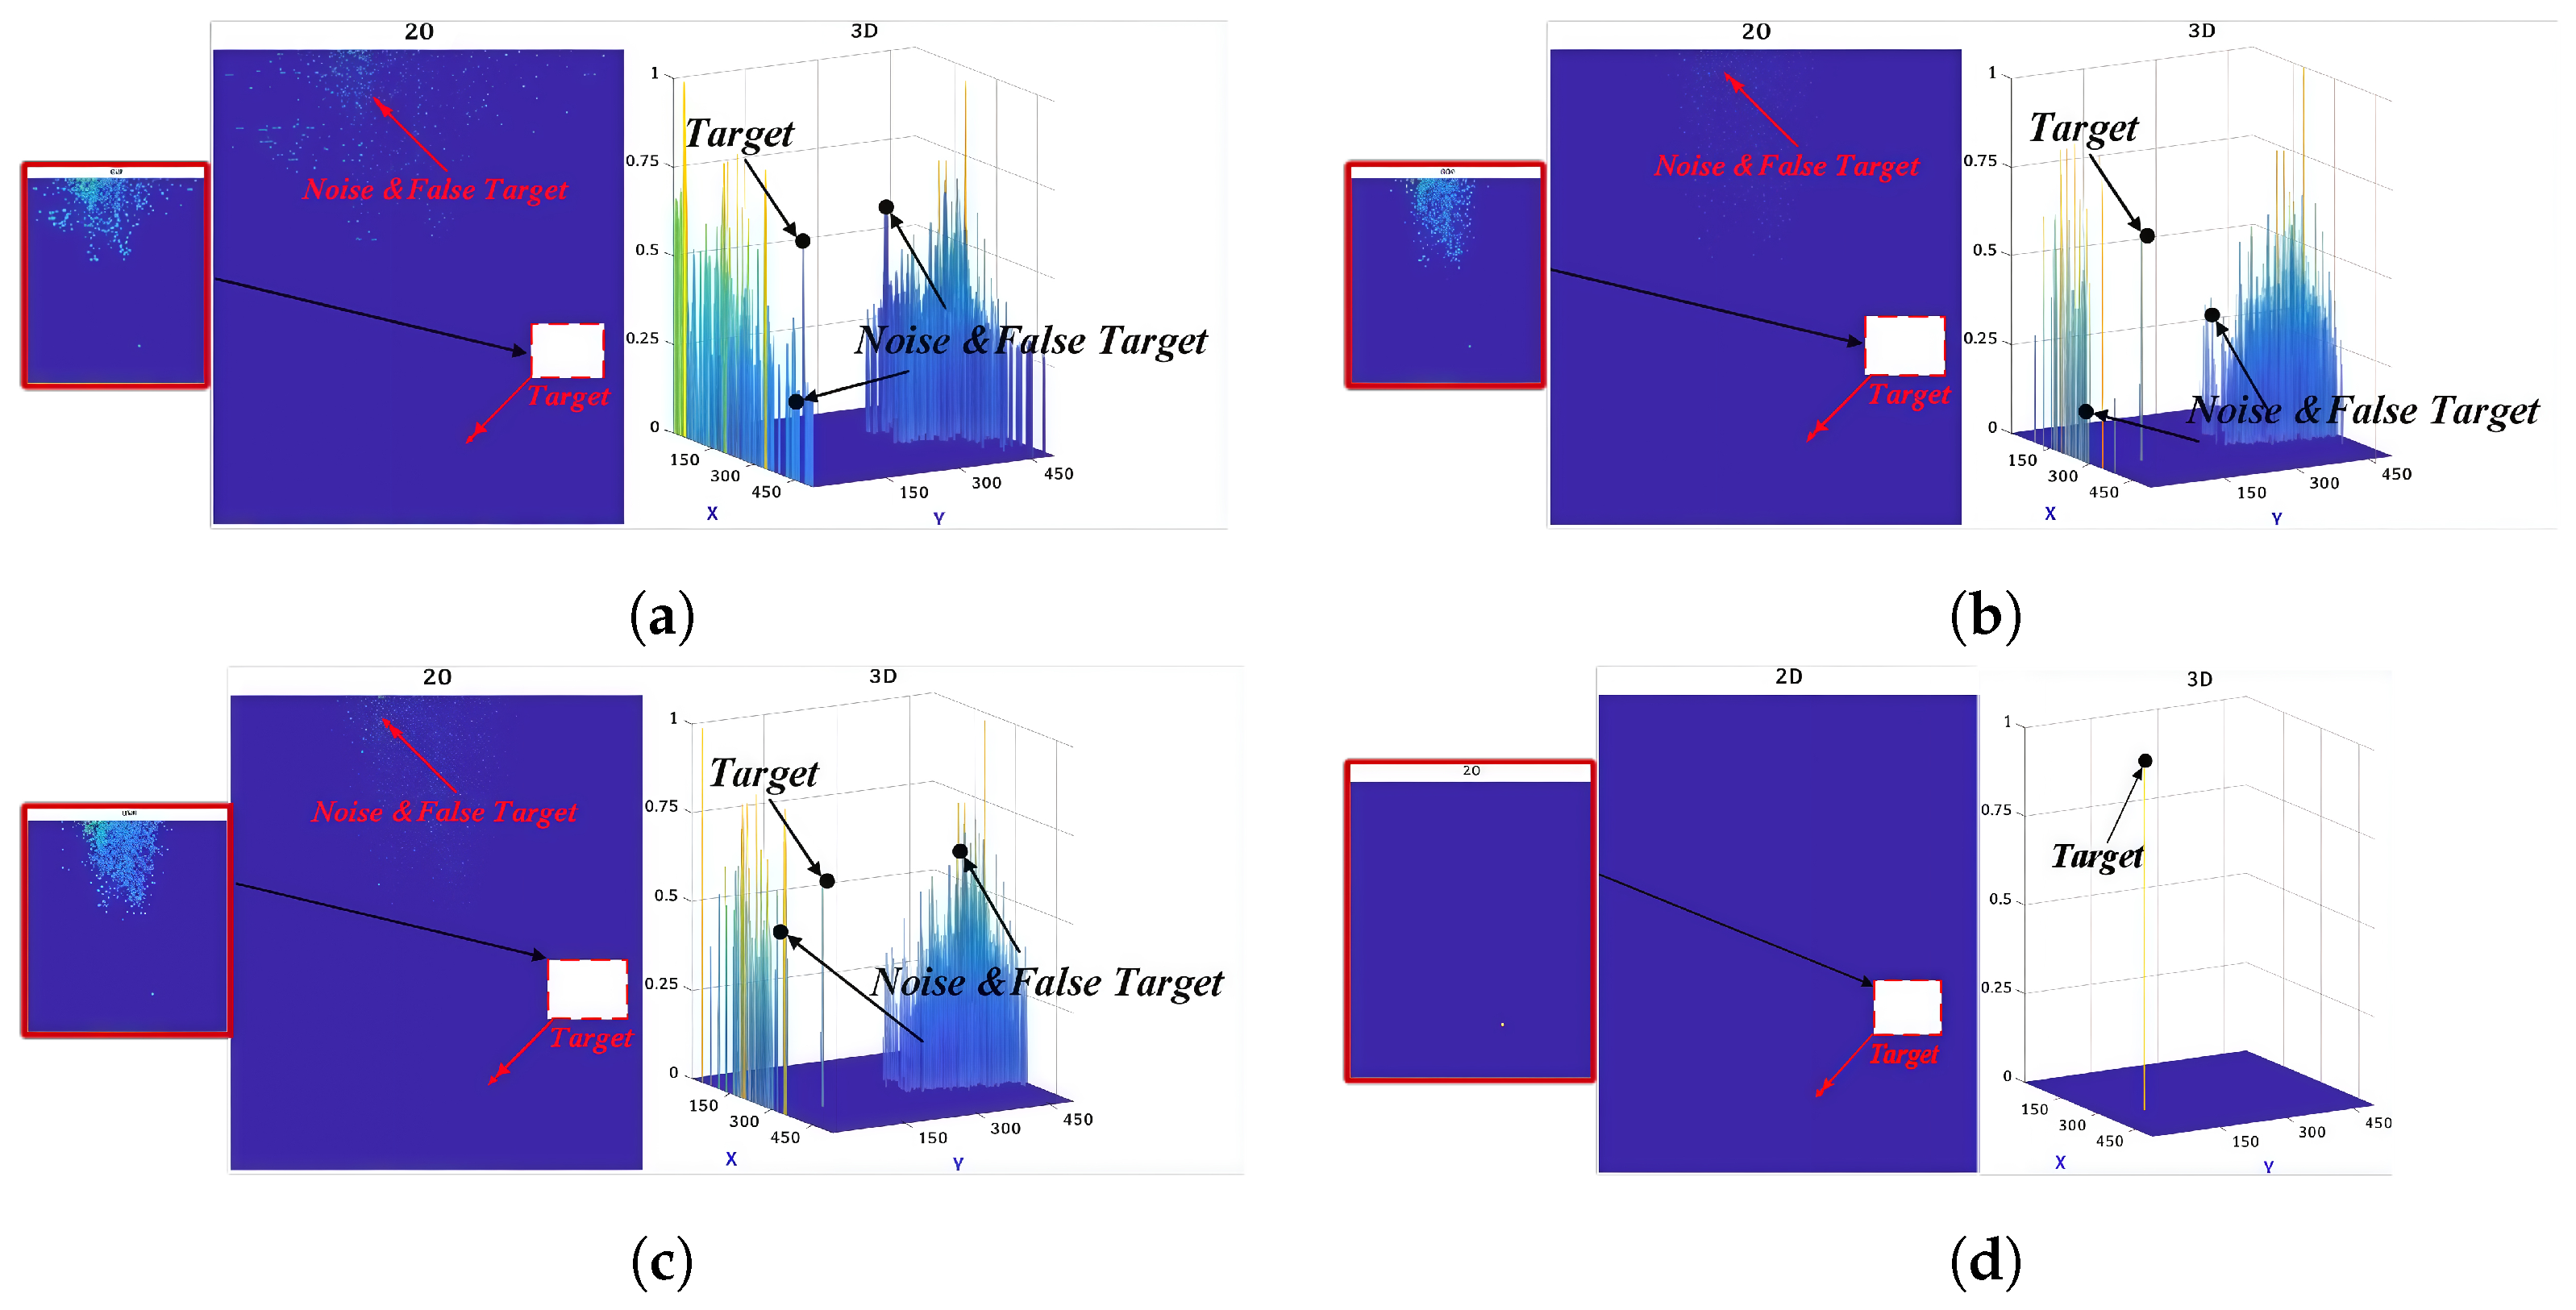
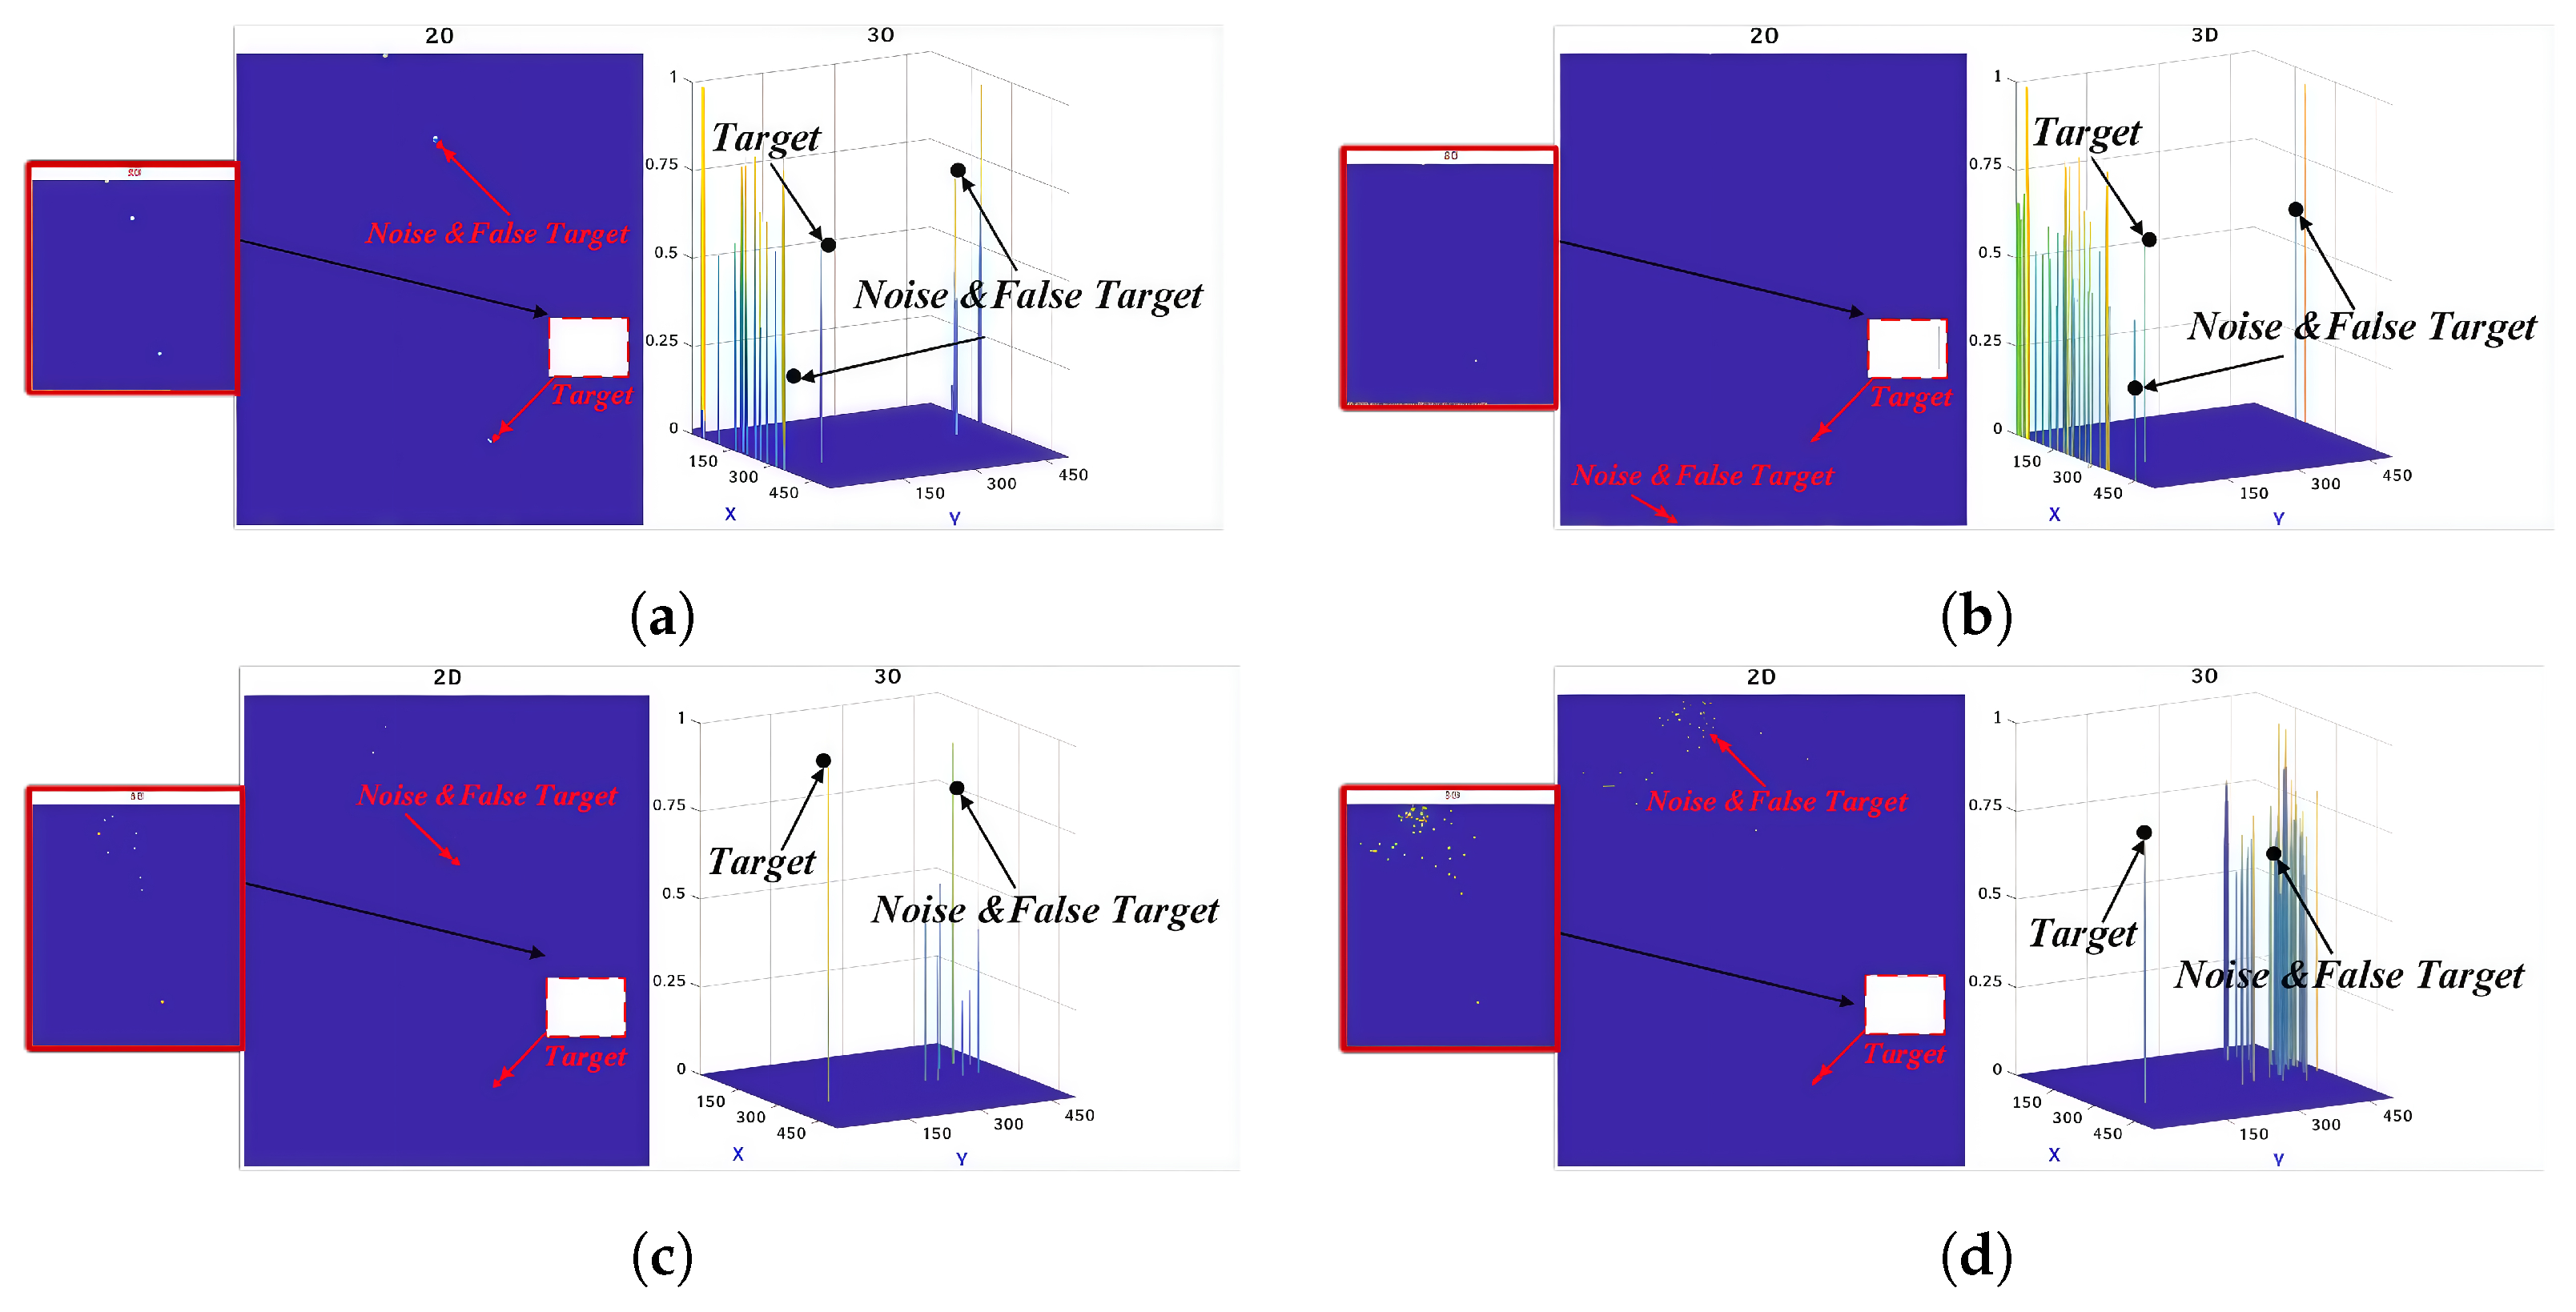
TOPHAT, MAXMED, and MAXMEAN are standard filtering techniques commonly used for target detection, relying on specially designed filter kernels. Figure 9 shows the experimental results of these methods: the left panel shows the dilation map, the middle panel shows the 2D detection map, and the right panel presents the 3D visualization of the detection results.
Figure 9 illustrates the target detection results. Panels (a), (b), and (c) display targets identified using conventional filter design. The 2D diagrams show that although all three methods suppress background noise to some extent, they fail to enhance target visibility effectively. In the 3D diagrams, target intensity is often overshadowed by noise, suggesting that applying a constant threshold for further detection could result in missed targets. In contrast, the method introduced in this study mitigates background interference through suppression and enhances target intensity using random walk contrast, improving detection performance and reducing false alarms. After normalization, target intensity increases from 0.6 to 1.0.

4.2.2. Comparison of Local Contrast Mechanism Approaches

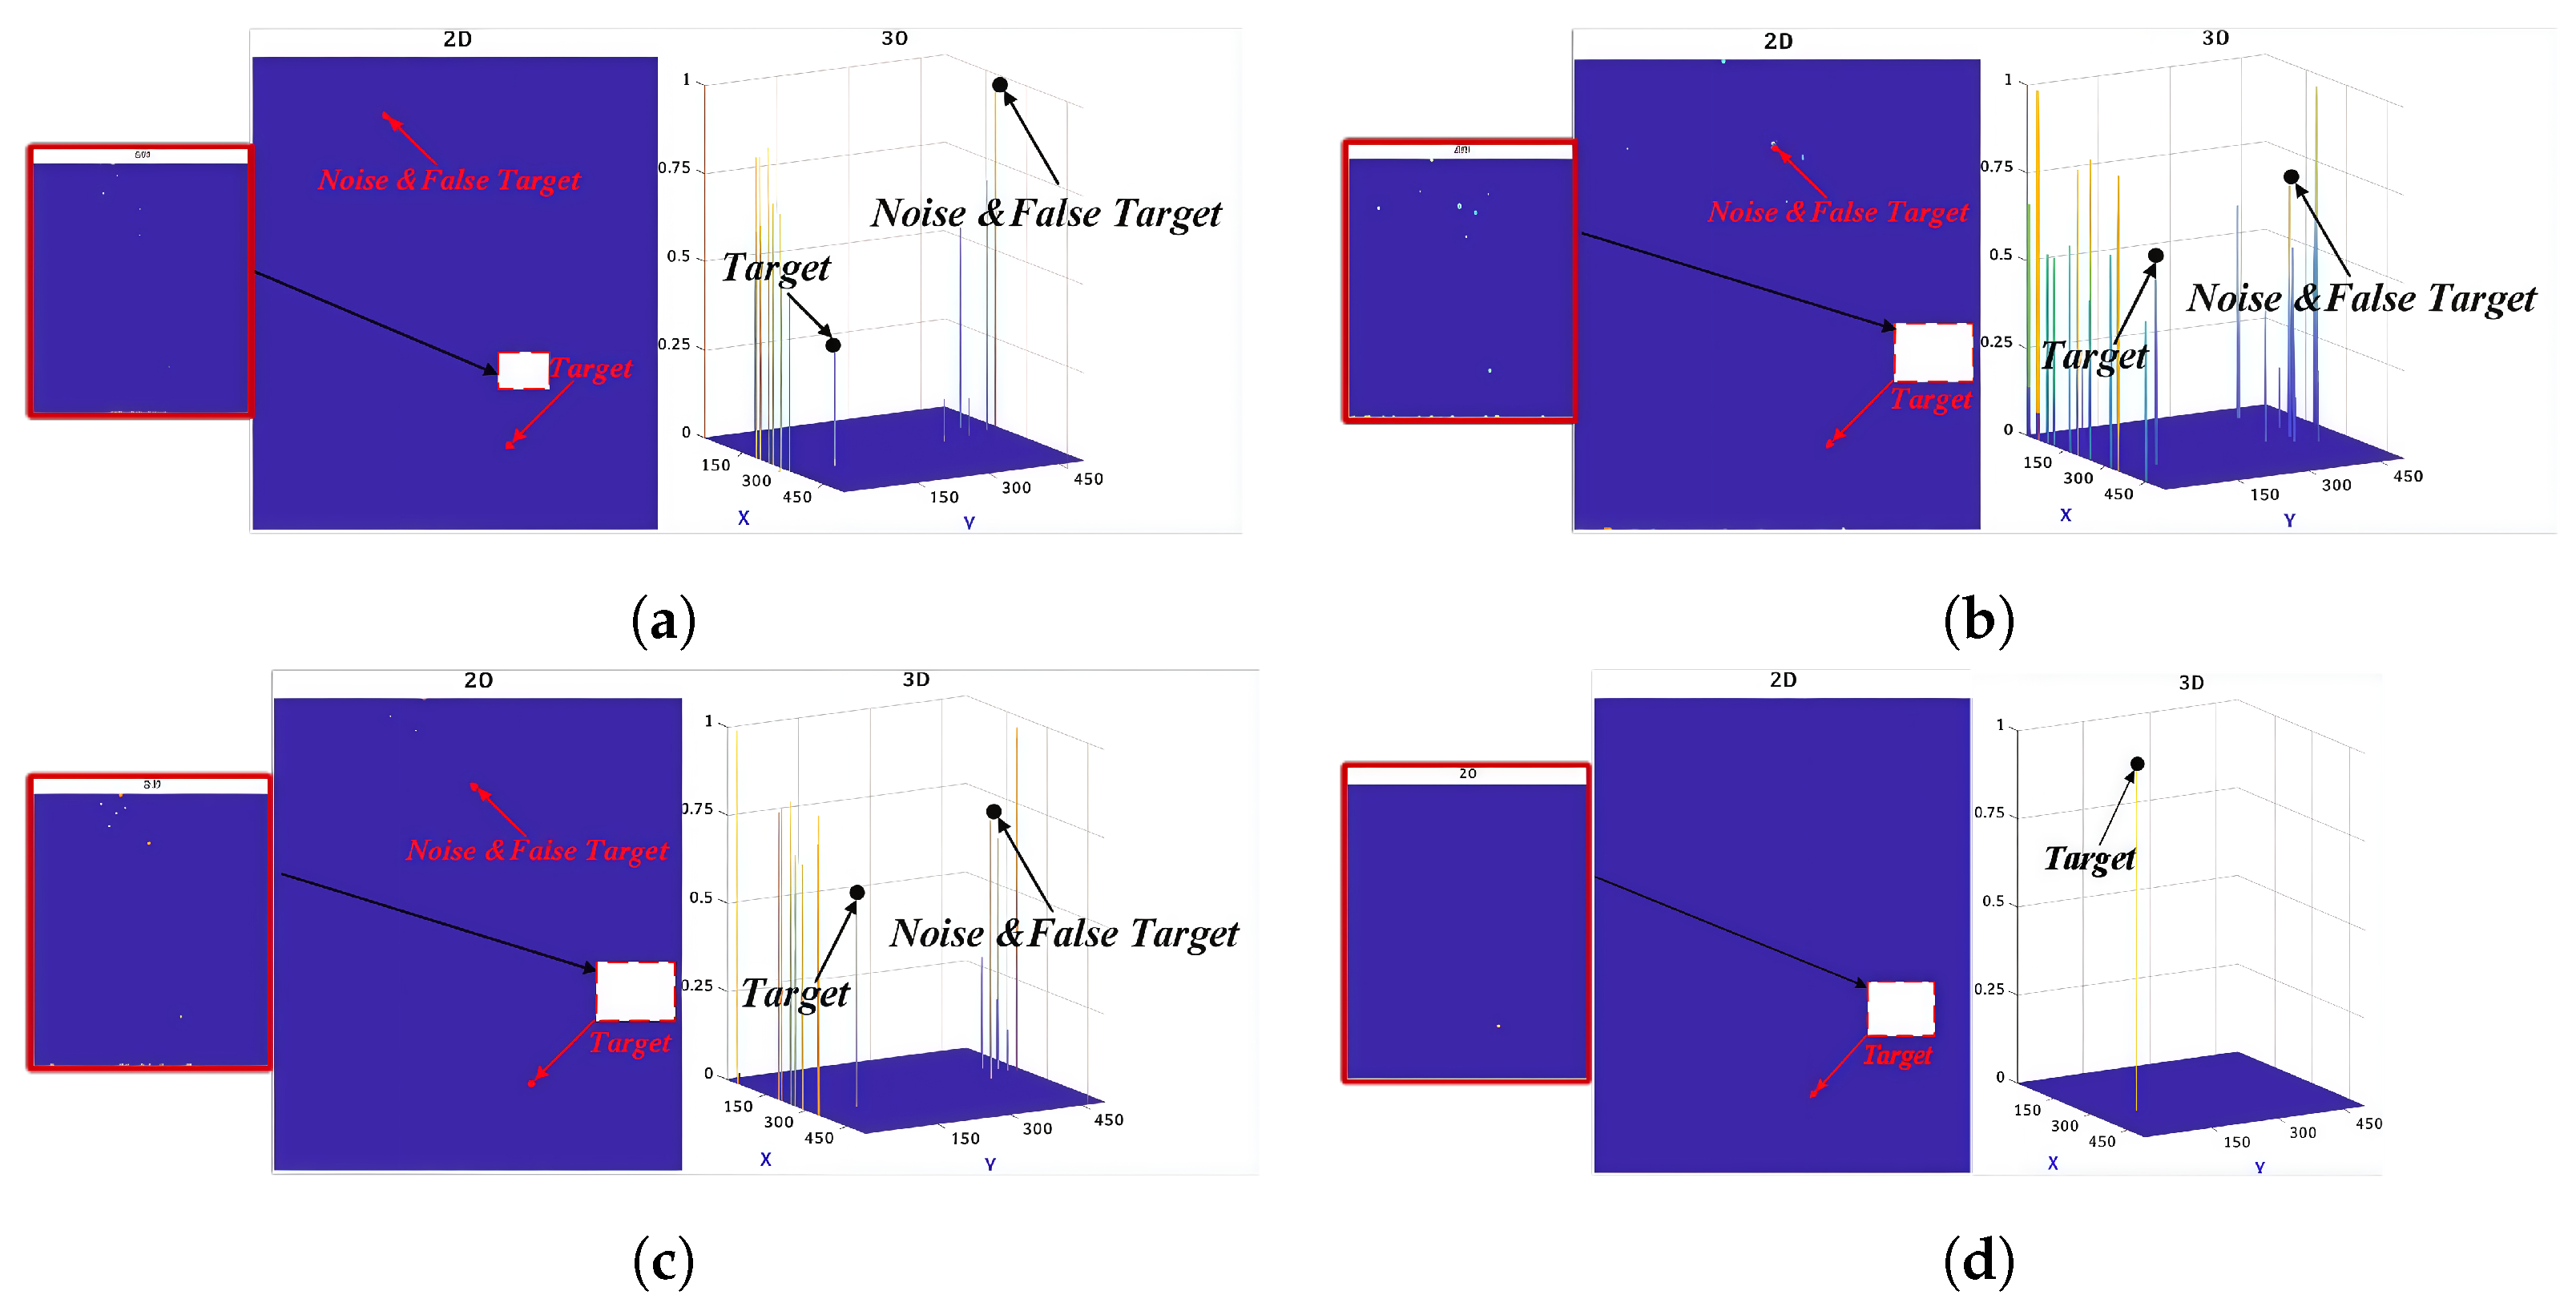
Among local contrast measurement techniques, the LCM method has demonstrated remarkable performance in detecting small targets. Building on LCM, the TLLCM and DLCM adopt different reference window strategies to improve performance further. Additionally, the LIG method integrates gradient attributes within the LCM framework to address LCM’s limitations. These four methods were selected to assess local contrast performance in small target detection, with results shown in Figure 10.
Figure 10 shows that all local contrast methods effectively detect small targets, as seen in panels (a) through (d). The double-layer contrast strategy of DLCM significantly improves detection performance. After normalization, DLCM achieves a target intensity of 1.0, outperforming LCM and TLLCM at 0.6 and LIG at 0.79, as evident in the 3D plots. Figure 10c also demonstrates that TLLCM excels in noise suppression compared to LCM and LIG, owing to its multi-reference window design. The proposed method surpasses these approaches in both target enhancement and background suppression by combining the inner-layer detection (Description 1) and outer-layer detection (Description 2).

4.2.3. Comparison of Multi-Scale Object Detection Methods

In small target detection, variations in target scales often lead to suboptimal performance. The MPCM, RLCM, and HBMLCM methods address this challenge by adopting multi-scale fusion strategies. To evaluate the multi-scale detection capability of the proposed method, these three techniques were selected for comparison. Experimental results are presented in Figure 11.
MPCM, RLCM, and HBMLCM are conventional techniques for multi-scale small target detection. As shown in Figure 11, these methods integrate target features across multiple scales and achieve effective background and noise suppression. However, their 3D detection maps reveal that target intensity remains unenhanced, with a maximum normalized intensity of only 0.6 and a minimum intensity as low as 0.36 for MPCM, which is notably lower than the background noise intensity. This limitation increases the likelihood of missed detections. In contrast, the proposed algorithm addresses multi-scale detection challenges by incorporating Description 1 and further enhancing target intensity using the formula introduced in Description 2. This dual approach enables precise target localization and substantially improves target detection performance compared to other methods.

4.2.4. Comparison of Different Directional Absolute Value Contrast Methods

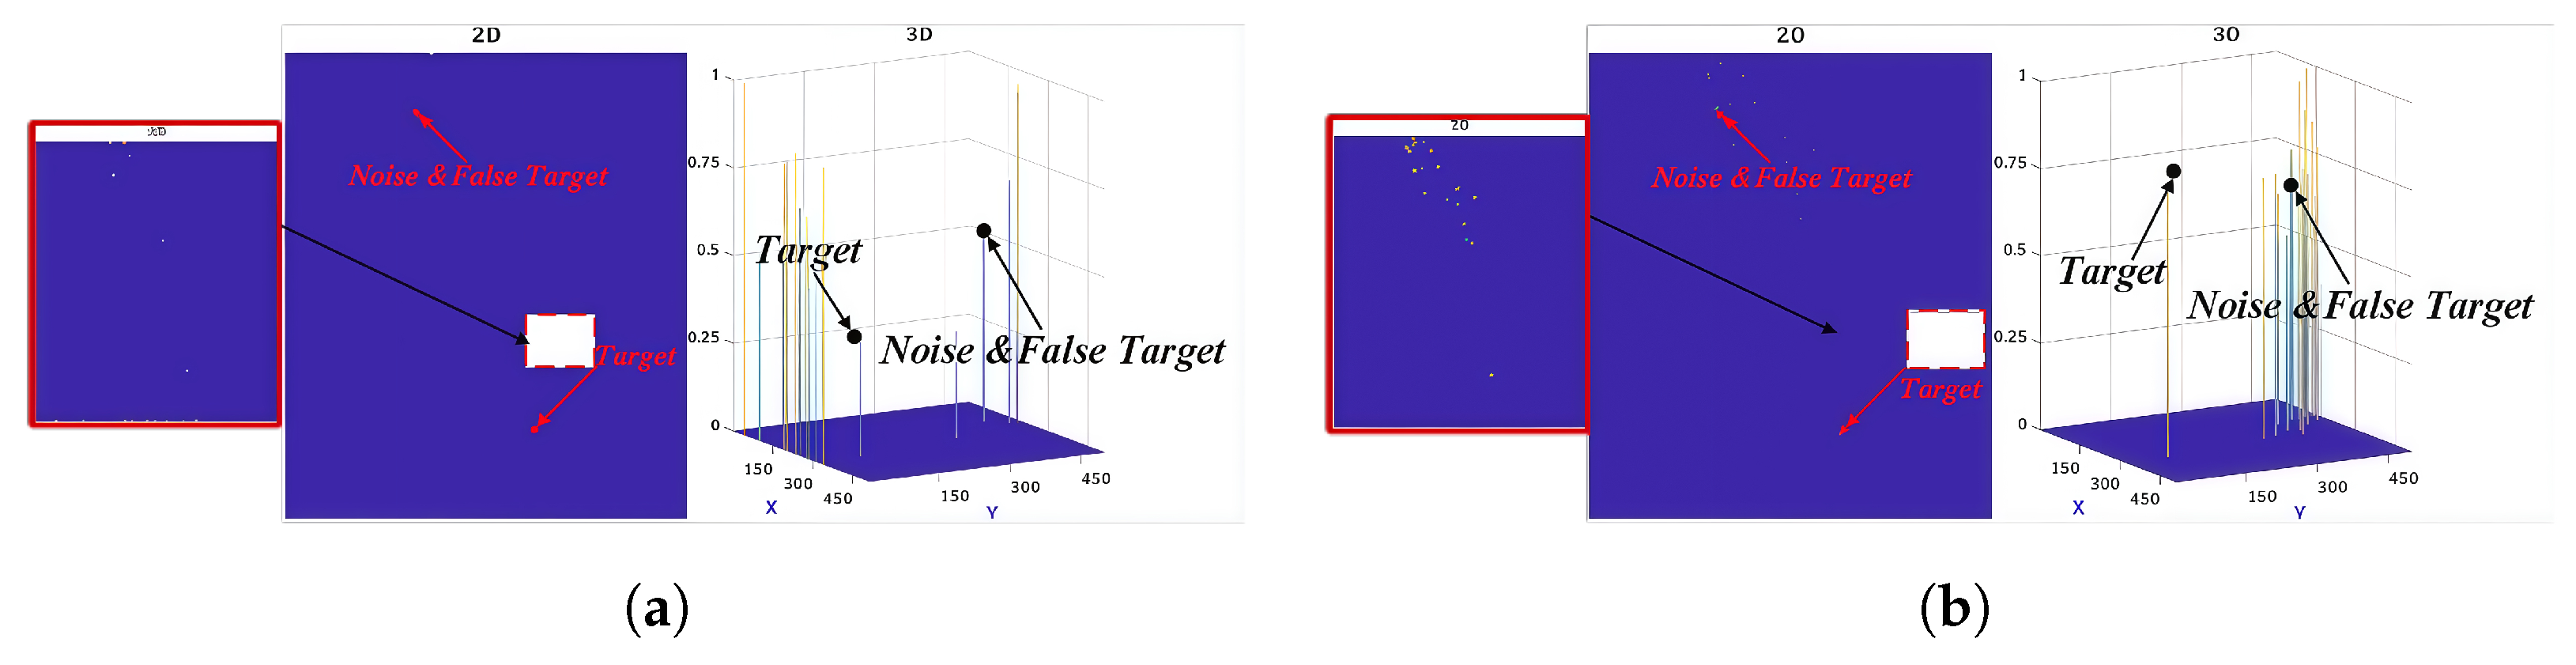
This study also evaluates the noise suppression capabilities of absolute value contrast methods by comparing the ADMD and AAGD, both known for their effectiveness in multi-directional noise reduction. Experimental results are presented in Figure 12.
The ADMD and AAGD methods are well-established multi-directional contrast detection techniques for small target identification. They mitigate background noise by leveraging multi-directional contrast factors. However, ADMD fails to enhance target intensity effectively, resulting in a normalized target intensity of only 0.36 in Figure 12a. In contrast, AAGD improves target intensity by weighting absolute differences across multiple directions. Nevertheless, its performance declines in sonar intensity images containing extensive dynamic noise due to insufficient suppression of continuous strong noise patterns. The method proposed in this study integrates both contrast and entropy information to provide robust suppression of large-area noise. Additionally, by incorporating the random walk framework, it enhances foreground targets while precisely suppressing local background interference, delivering superior performance compared to both ADMD and AAGD.

4.2.5. Comparison of Foreground–Background Separation Methods

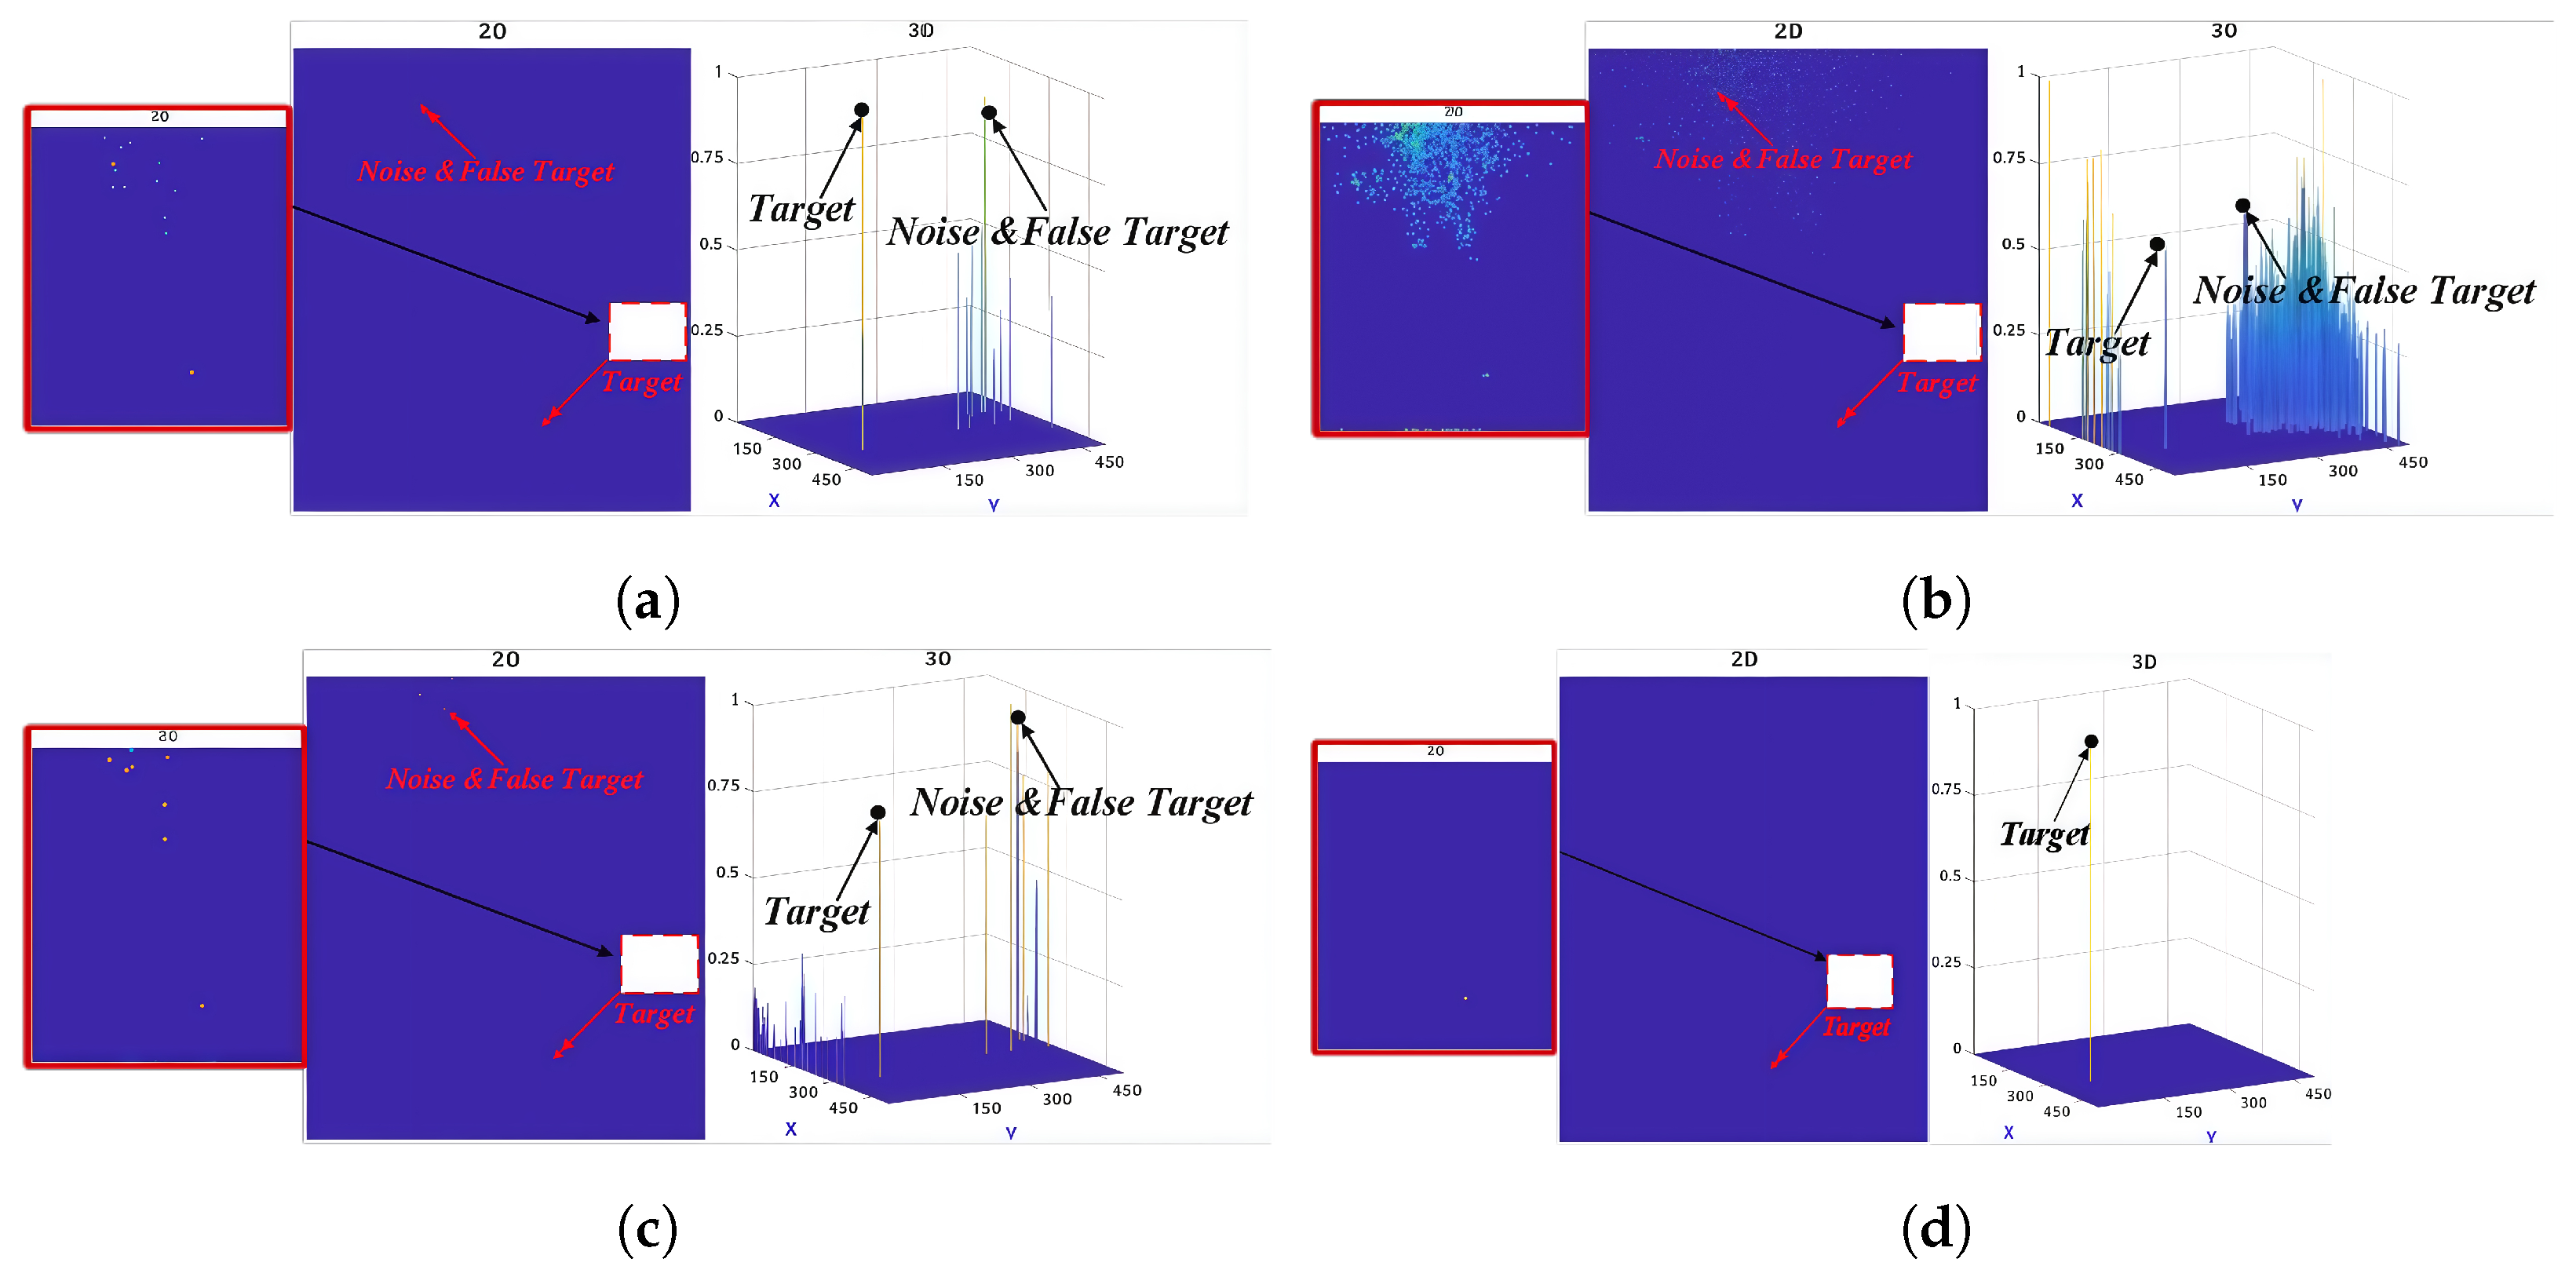
Small target detection inherently requires reliable separation of foreground targets from background clutter. DGRAD addresses this by employing dual neighborhood reference windows. AMWLCM adopts a weighted LCM approach, while LR achieves separation indirectly by reconstructing background information. These methods exemplify target detection strategies based on foreground–background separation. To evaluate the separation performance of the proposed approach, we conducted comparative experiments with these three techniques. The results are presented in Figure 13.
DGRAD, AMWLCM, and LR are commonly used techniques for small target detection through foreground–background separation. As shown in Figure 13a, DGRAD enhances target visibility using a dual neighborhood strategy, producing high normalized target intensity. However, it also amplifies strong impulse noise, leading to frequent false detections. Figure 13c demonstrates that the LR method effectively suppresses background regions and indirectly increases target intensity after normalization. Yet, due to imprecise enhancement at specific points, its effectiveness is limited, increasing the risk of missed detections in noisy conditions. The AMWLCM algorithm performs the worst, as it fails to adequately enhance target intensity or suppress background noise. In contrast, the method proposed in this study effectively suppresses noise using information entropy. Local Description 2 enhances target detection, while Description 1 addresses the challenges of multi-scale detection. By combining these components, the proposed method achieves superior target detection performance.

4.3. Quantitative Comparisons

This section evaluates the proposed method’s efficacy in detecting moving targets at both long and short ranges. A comparative analysis is conducted using evaluation metrics, with all calculations representing the average results from multiple frame detections. Three metrics, namely B S F V a r , B S F M e a n , and S C R , were used to quantitatively evaluate the algorithms, as summarized in Table 1. The results show that classical methods such as TOPHAT, MAXMED, and MAXMEAN, yield relatively low metric values. Notably, the MAXMED algorithm performs best, achieving B S F V a r = 3.422, B S F M e a n = 4.157, and SCR = 56.348. The limited performance of the other classical methods is mainly due to their insufficient suppression of background interference. In contrast, algorithms based on local contrast principles like LCM, TLLCM, and LIG outperform the classical filters. LCM records B S F V a r = 4.444 and B S F M e a n = 5.063, TLLCM achieves 3.998 and 4.897, and LIG reaches 3.421 and 4.551. Notably, their S C R values improve substantially, with LCM achieving 73.193, TLLCM 65.844, and LIG 56.345, reflecting their stronger target focus. Among the multi-scale and contrast-driven methods, including RLCM, HBMLCM, MPCM, AAGD, and ADMD, MPCM achieves the highest B S F V a r (8.630) and B S F M e a n (6.496). These methods also demonstrate significant improvements in S C R , with MPCM reaching a peak value of 142.172. These gains are largely attributable to advances in multi-scale and contrast enhancement strategies. Across the 12 evaluated techniques, DLCM, DGRAD, and LR deliver notable performance improvements, particularly in the S C R index. DLCM achieves the highest SCR value of 204.925, underscoring the benefits of its dual-layer contrast approach. The proposed method incorporates two complementary descriptions that together address key factors such as multi-scale variability, fine-grained local contrast, and information entropy. Multi-scale information improves detection robustness across various target sizes, the random walk strategy strengthens target contrast extraction, and entropy-based analysis effectively suppresses background noise. By integrating these elements, the method enhances target visibility while suppressing background interference. Consequently, the proposed approach records outstanding metric values: B S F V a r = 16.054, B S F M e a n = 7.696, and S C R = 264.492, surpassing all baseline algorithms.
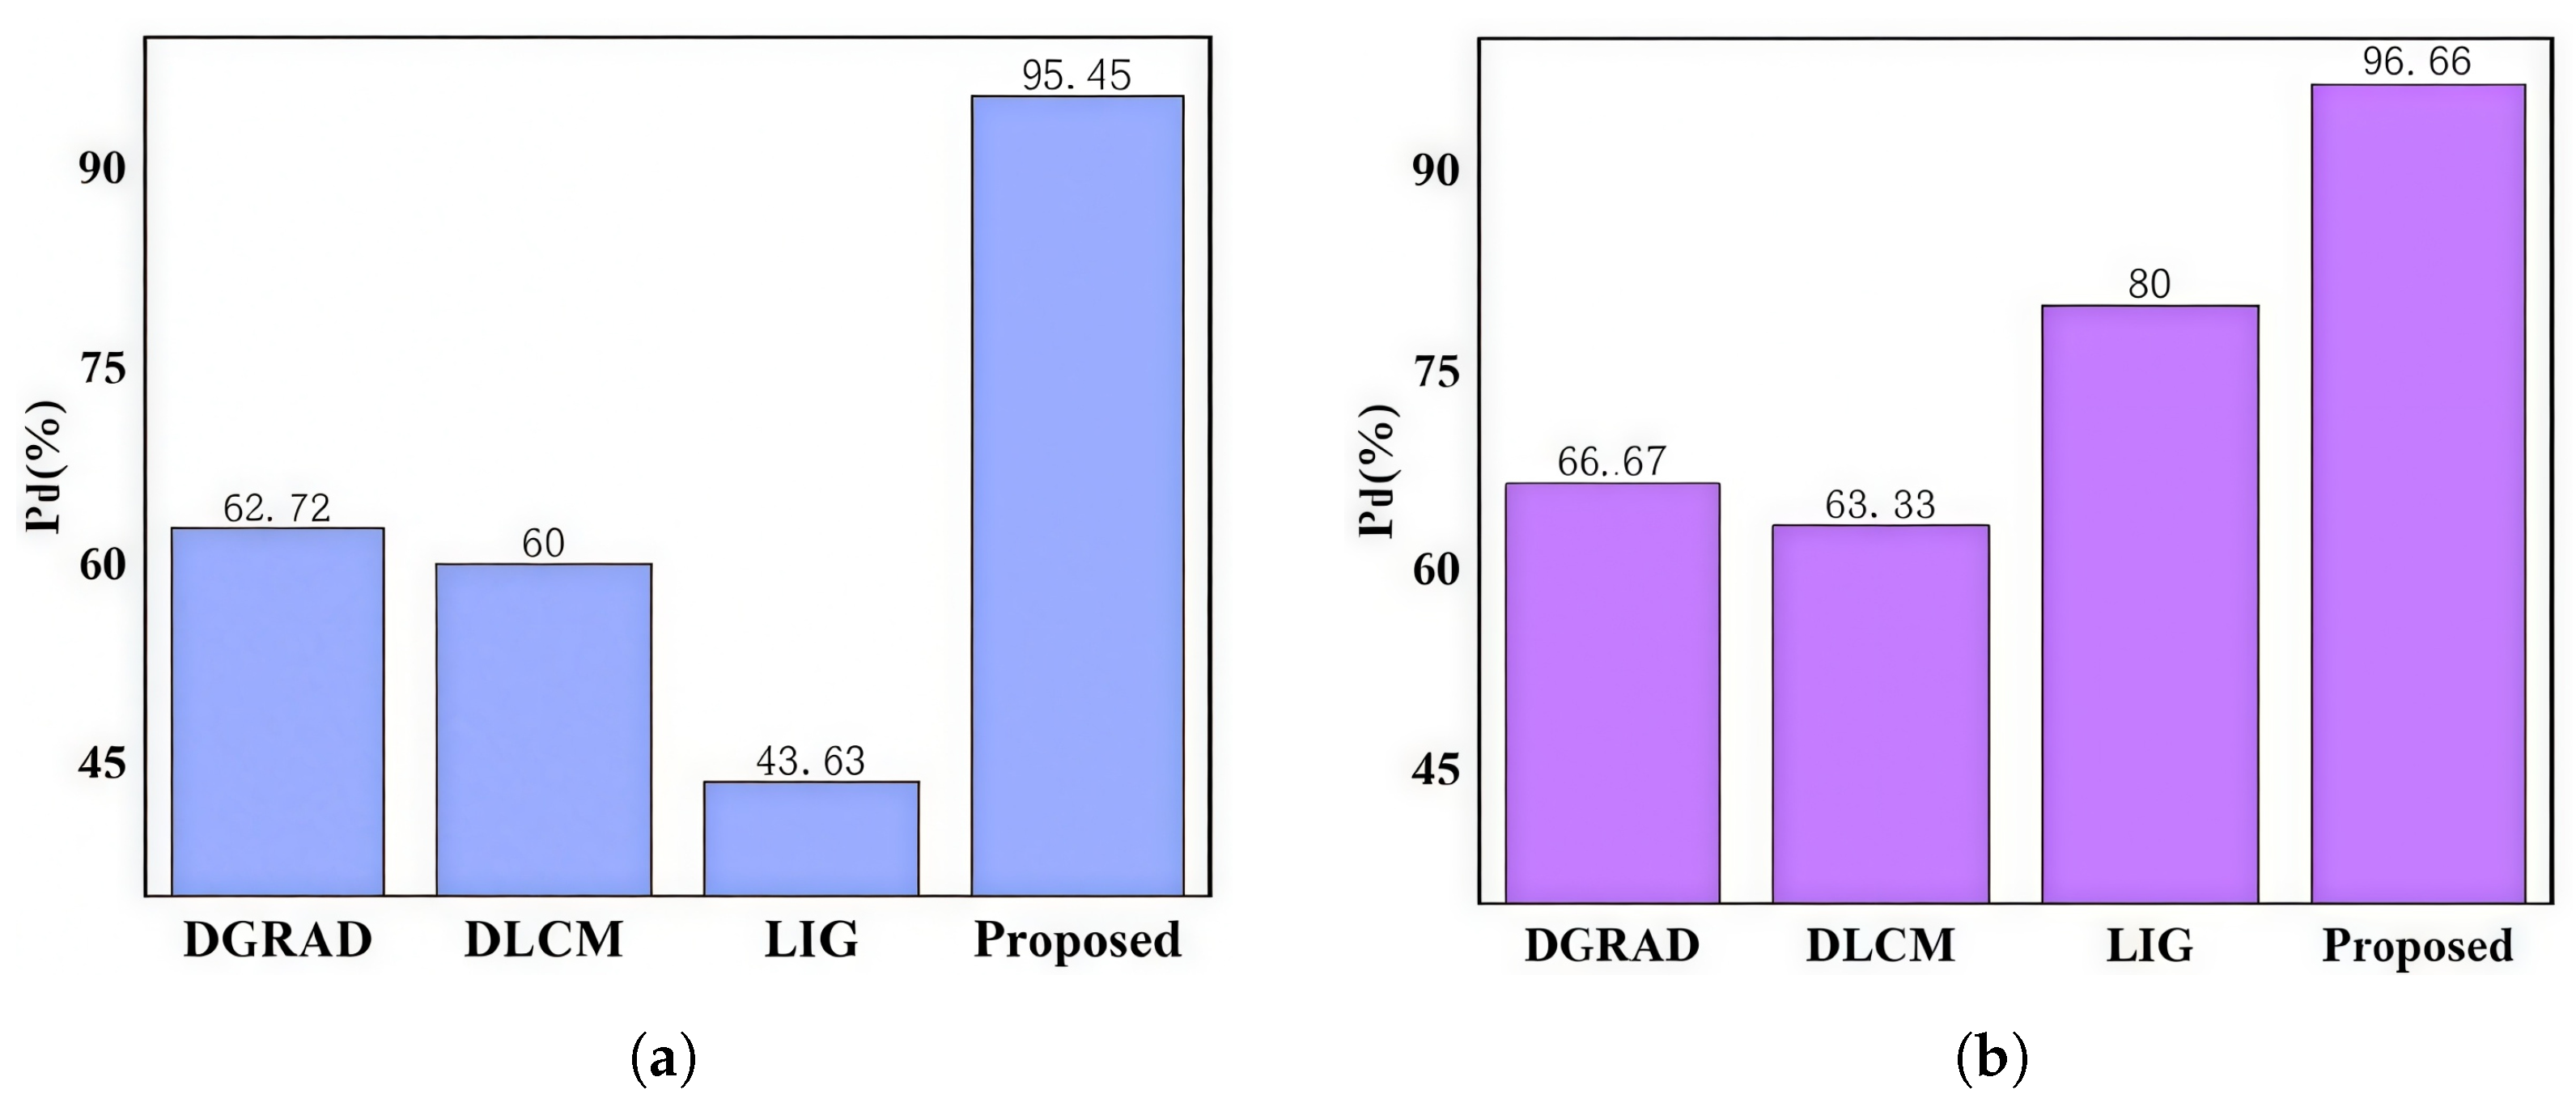
To evaluate the proposed method’s target detection capability in multi-frame sonar intensity images, which are affected by time- and space-varying characteristics, we used sonar data of moving targets collected at both long and short distances. The proposed method was compared against three established techniques, namely DGRAD, DLCM, and LIG, selected for their distinct detection principles and strong performance in prior studies. Detection accuracy results are presented in Table 2 and Figure 14.
In moving target detection and analysis, significant differences emerge between moving and stationary targets in sonar detection, primarily in terms of target blurring, echo intensity, signal-to-noise ratio (SNR), and resolution. Target motion introduces phase and amplitude inconsistencies in range-direction echoes and causes angular defocusing, resulting in blurring. Additionally, echo intensity varies with angular changes induced by target motion. As the target continues to move, variations in distance result in continuous SNR fluctuations, even under constant echo intensity, and alter the number of pixels occupied after imaging. These effects collectively necessitate more precise target detection. Figure 14 and Table 2 show the detection accuracies of the four methods across two sonar multi-frame datasets. DGRAD and DLCM achieved over 60% accuracy on both long- and short-distance data, with DGRAD slightly outperforming DLCM. The LIG method reached 43.63% accuracy on long-distance data and 80% on short-distance data, indicating that the relative gradient changes in target intensity become more pronounced at closer ranges, improving LIG’s effectiveness. In contrast, the proposed method, which integrates multi-scale information, fine-grained local intensity contrast, and background noise assessment, achieved superior accuracies of 95.45% and 96.66% for long- and short-distance data, respectively.

4.4. Generalization Performance Analysis

4.4.1. 200 kHz HT Sonar Target Detection Performance Analysis

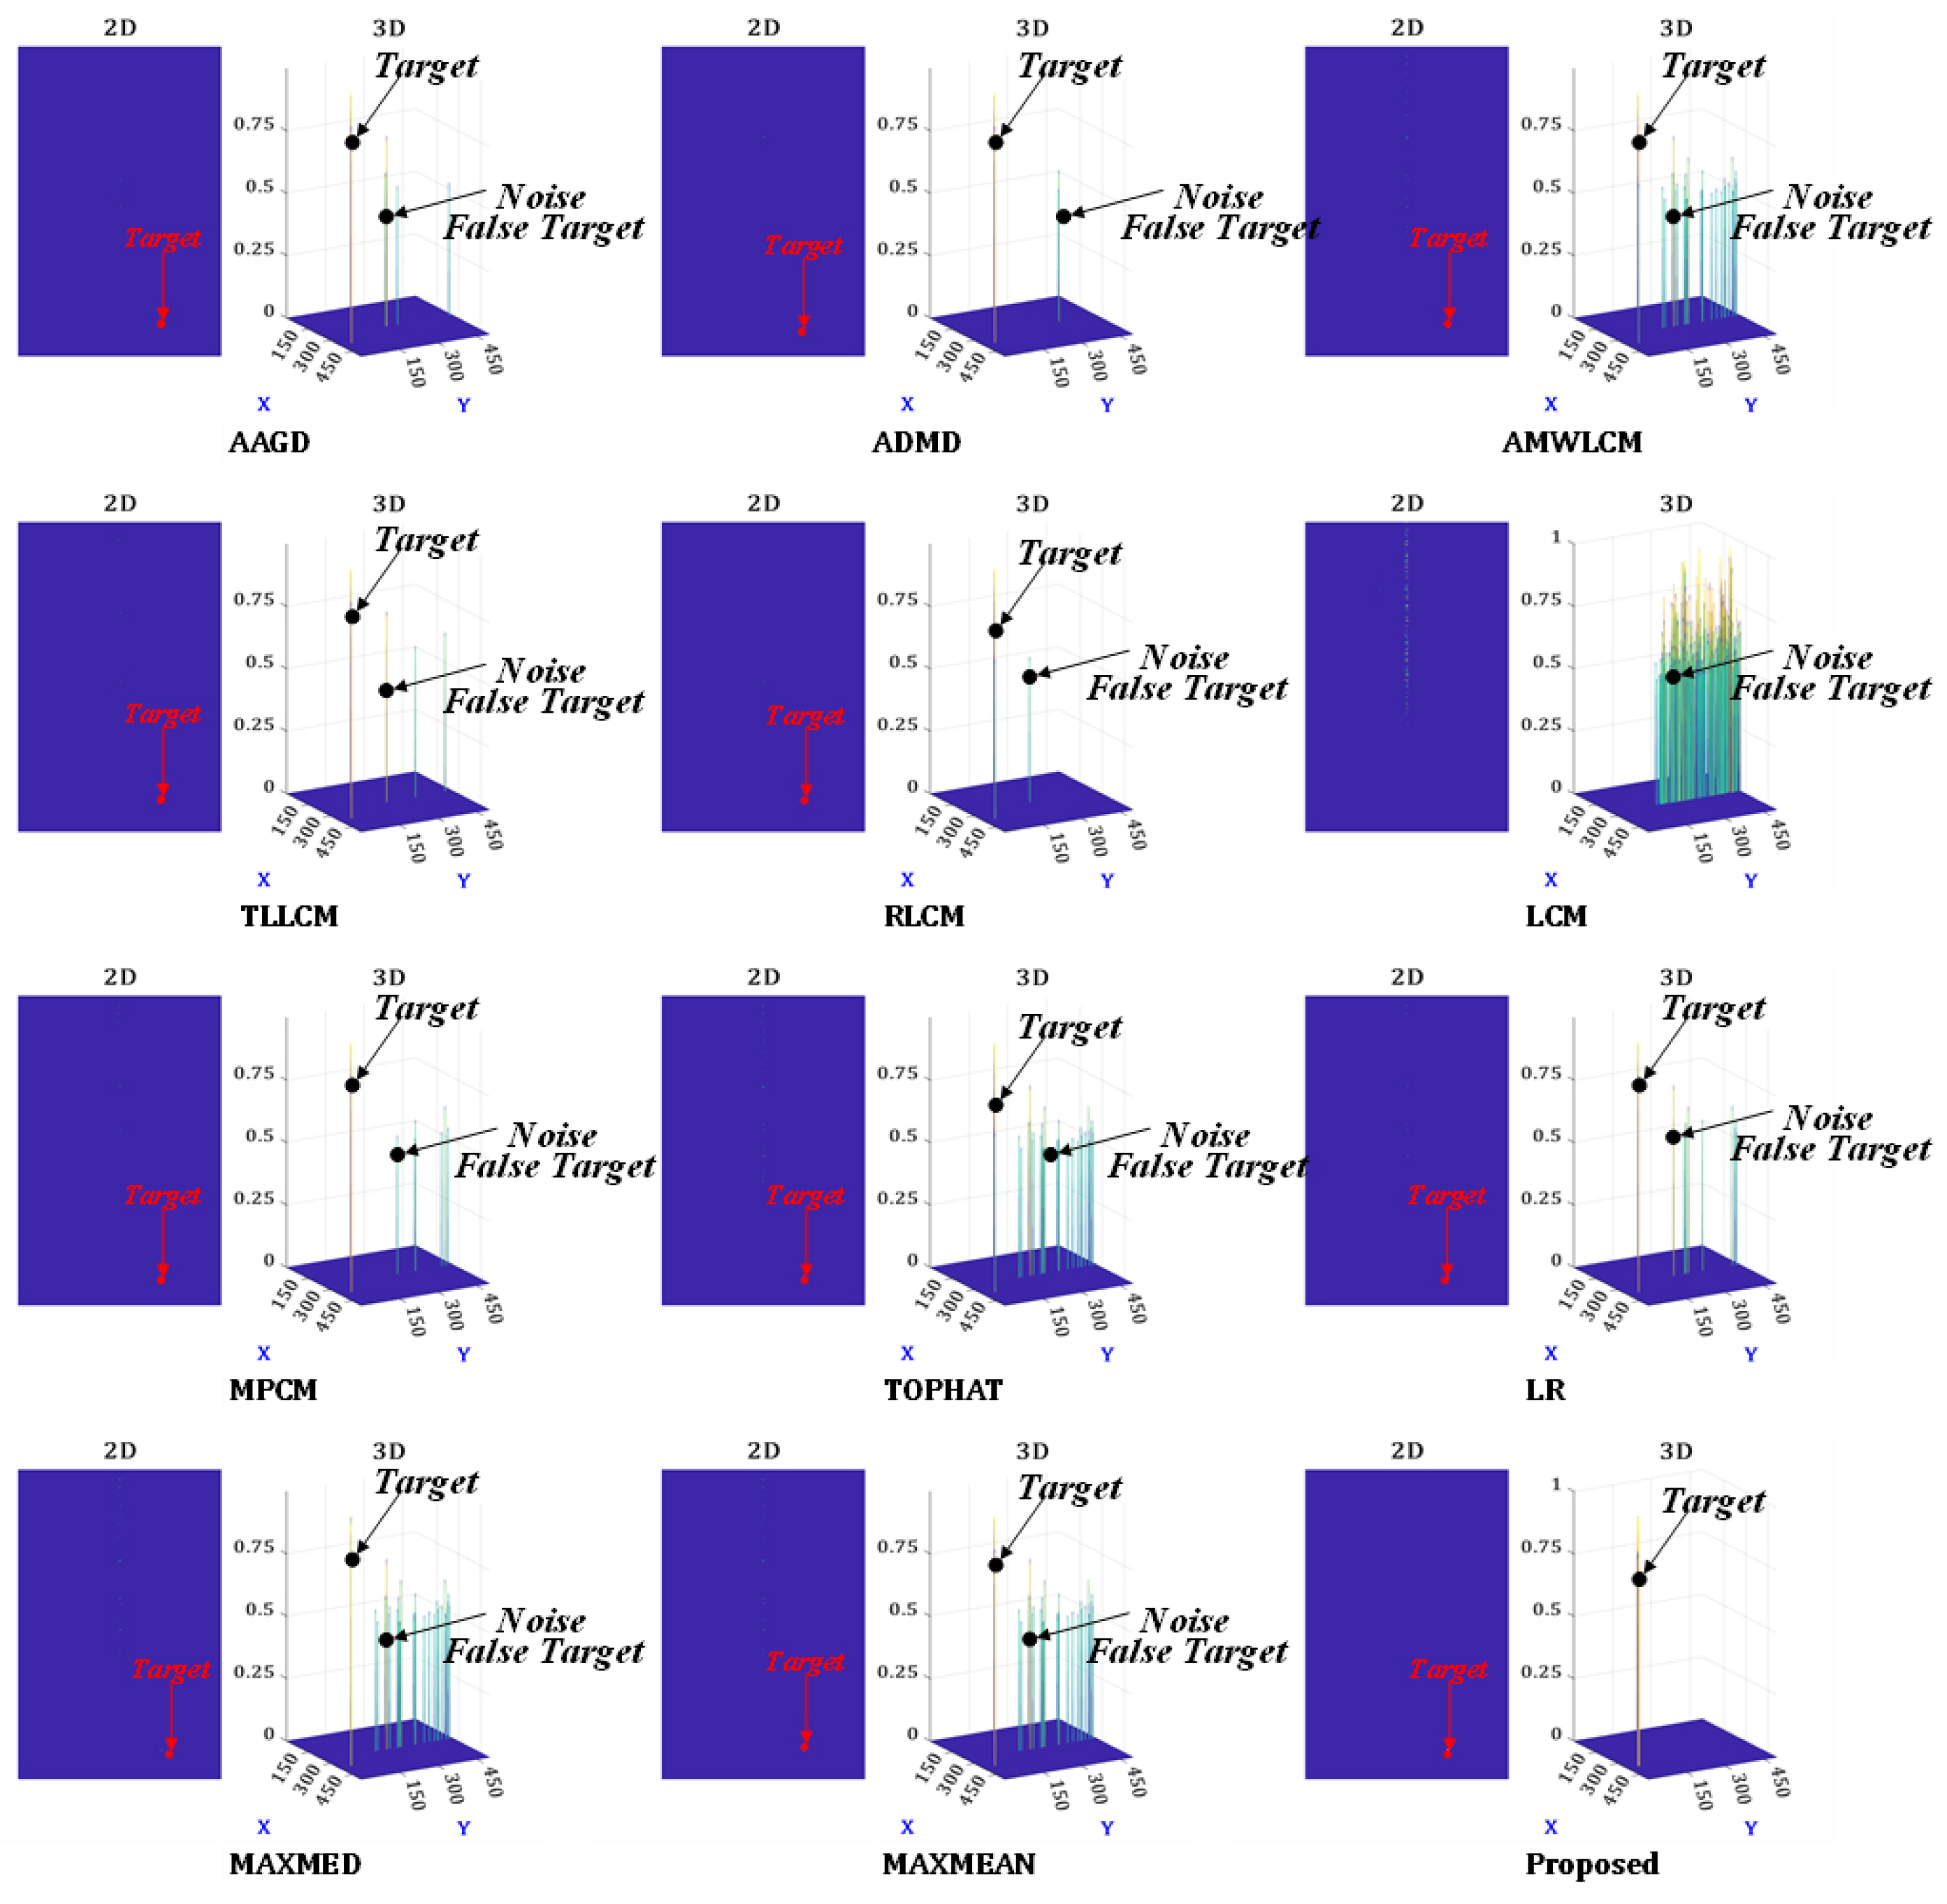
To evaluate the generalization performance of the proposed target detection method, a 200 kHz multi-beam sonar from the HT series was used, operating at a frequency distinct from that previously described. Detection was performed on the echo intensity image post-imaging, with results presented in Figure 15.
Figure 15 demonstrates that the proposed method performs effectively in detecting targets within complex backgrounds. Its 3D results accurately and clearly identify real targets while minimizing noise and false detections. Traditional methods like AMWLCM, TOPHAT, MAXMED, and MAXMEAN perform less reliably, often misidentifying noise as targets. While TLLCM, MPCM, and LR methods reduce most noise, AAGD, ADMD, and RLCM exhibit stronger noise suppression yet still occasionally misdetect noise as targets. The LCM method suffers from both false and missed detections. In contrast, the proposed method effectively mitigates these issues, achieving superior target detection performance.

4.4.2. Target Continuous Detection Performance Analysis

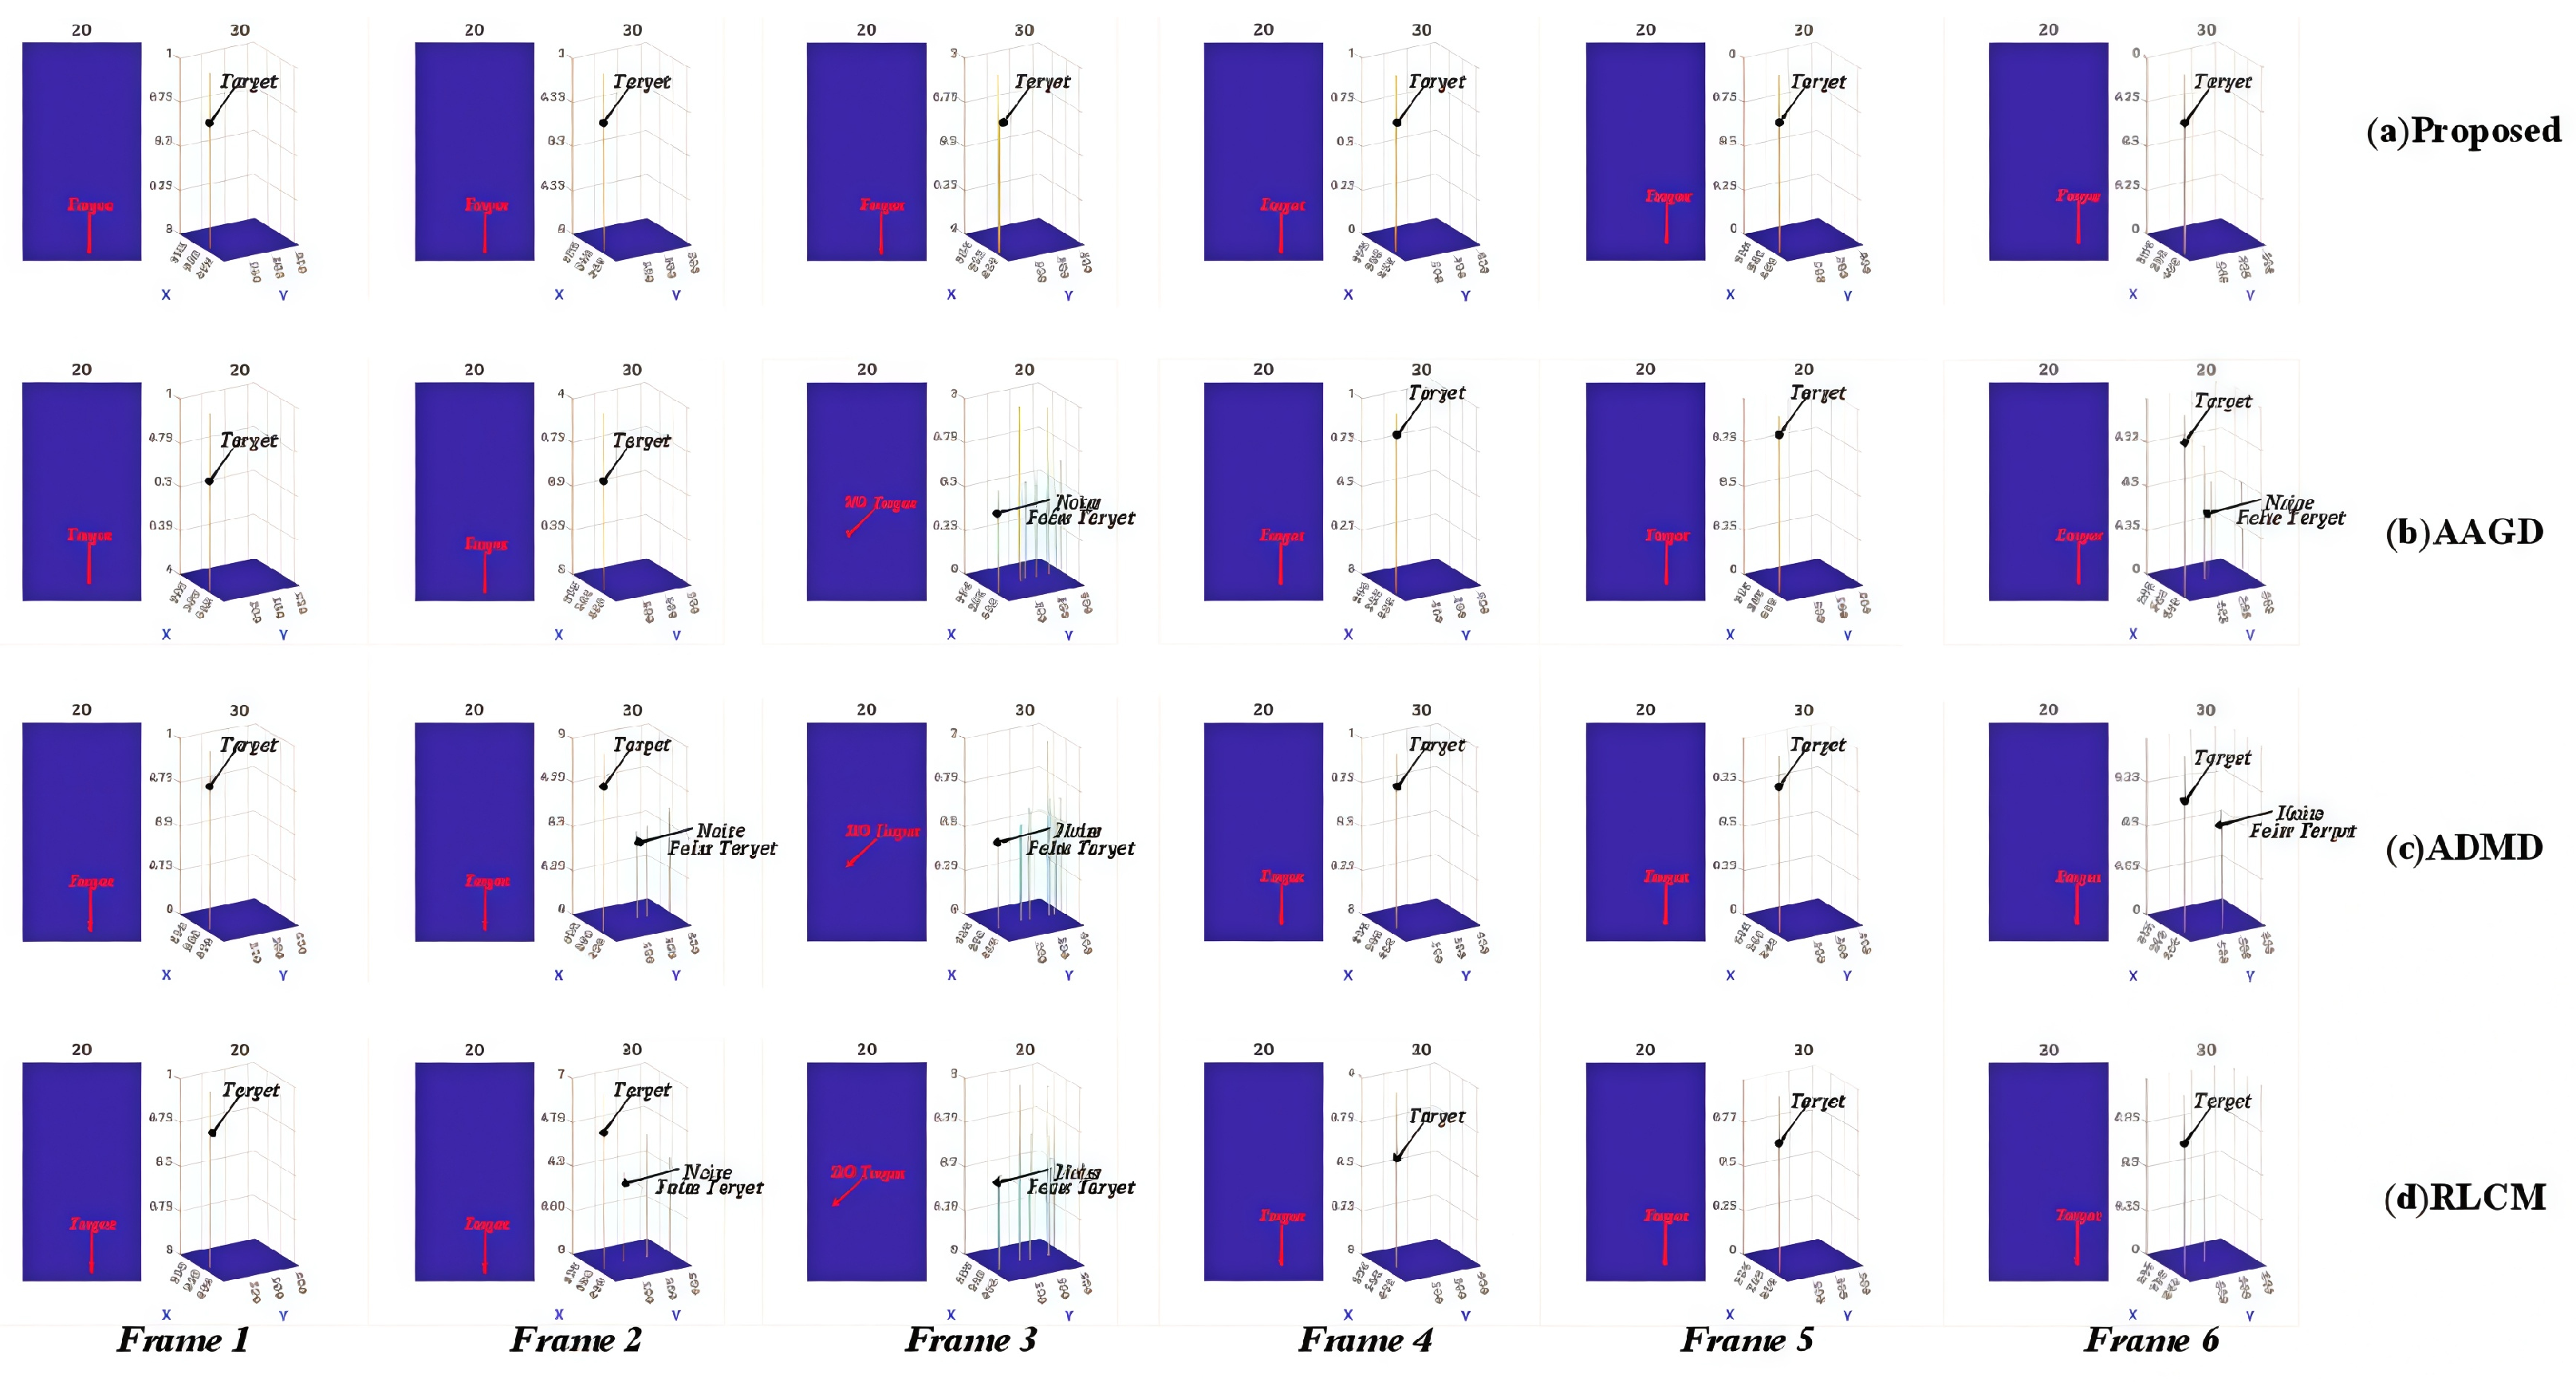
To further examine the quantitative analysis presented in Section 4.3, continuous moving targets were identified using a 200 kHz HT sonar. Six data frames were captured, and target detection was performed on each frame individually. The AAGD, ADMD, and RLCM methods, recognized for their strong detection performance in Section 4.3 and Section 4.4, were used for comparison. The detection results are presented in Figure 16.
Figure 16 illustrates the performance of the AAGD, ADMD, and RLCM methods for continuous moving target detection. The AAGD method shows detection errors in frames 3 and 6, including a missed detection in frame 3 and a false detection in frame 6. The ADMD and RLCM exhibit errors in frames 2, 3, and 6. Thus, the AAGD method surpasses the ADMD and RLCM methods in continuous motion detection. The proposed method successfully detects the target across all 6 consecutive frames.

4.4.3. SNR Performance Analysis

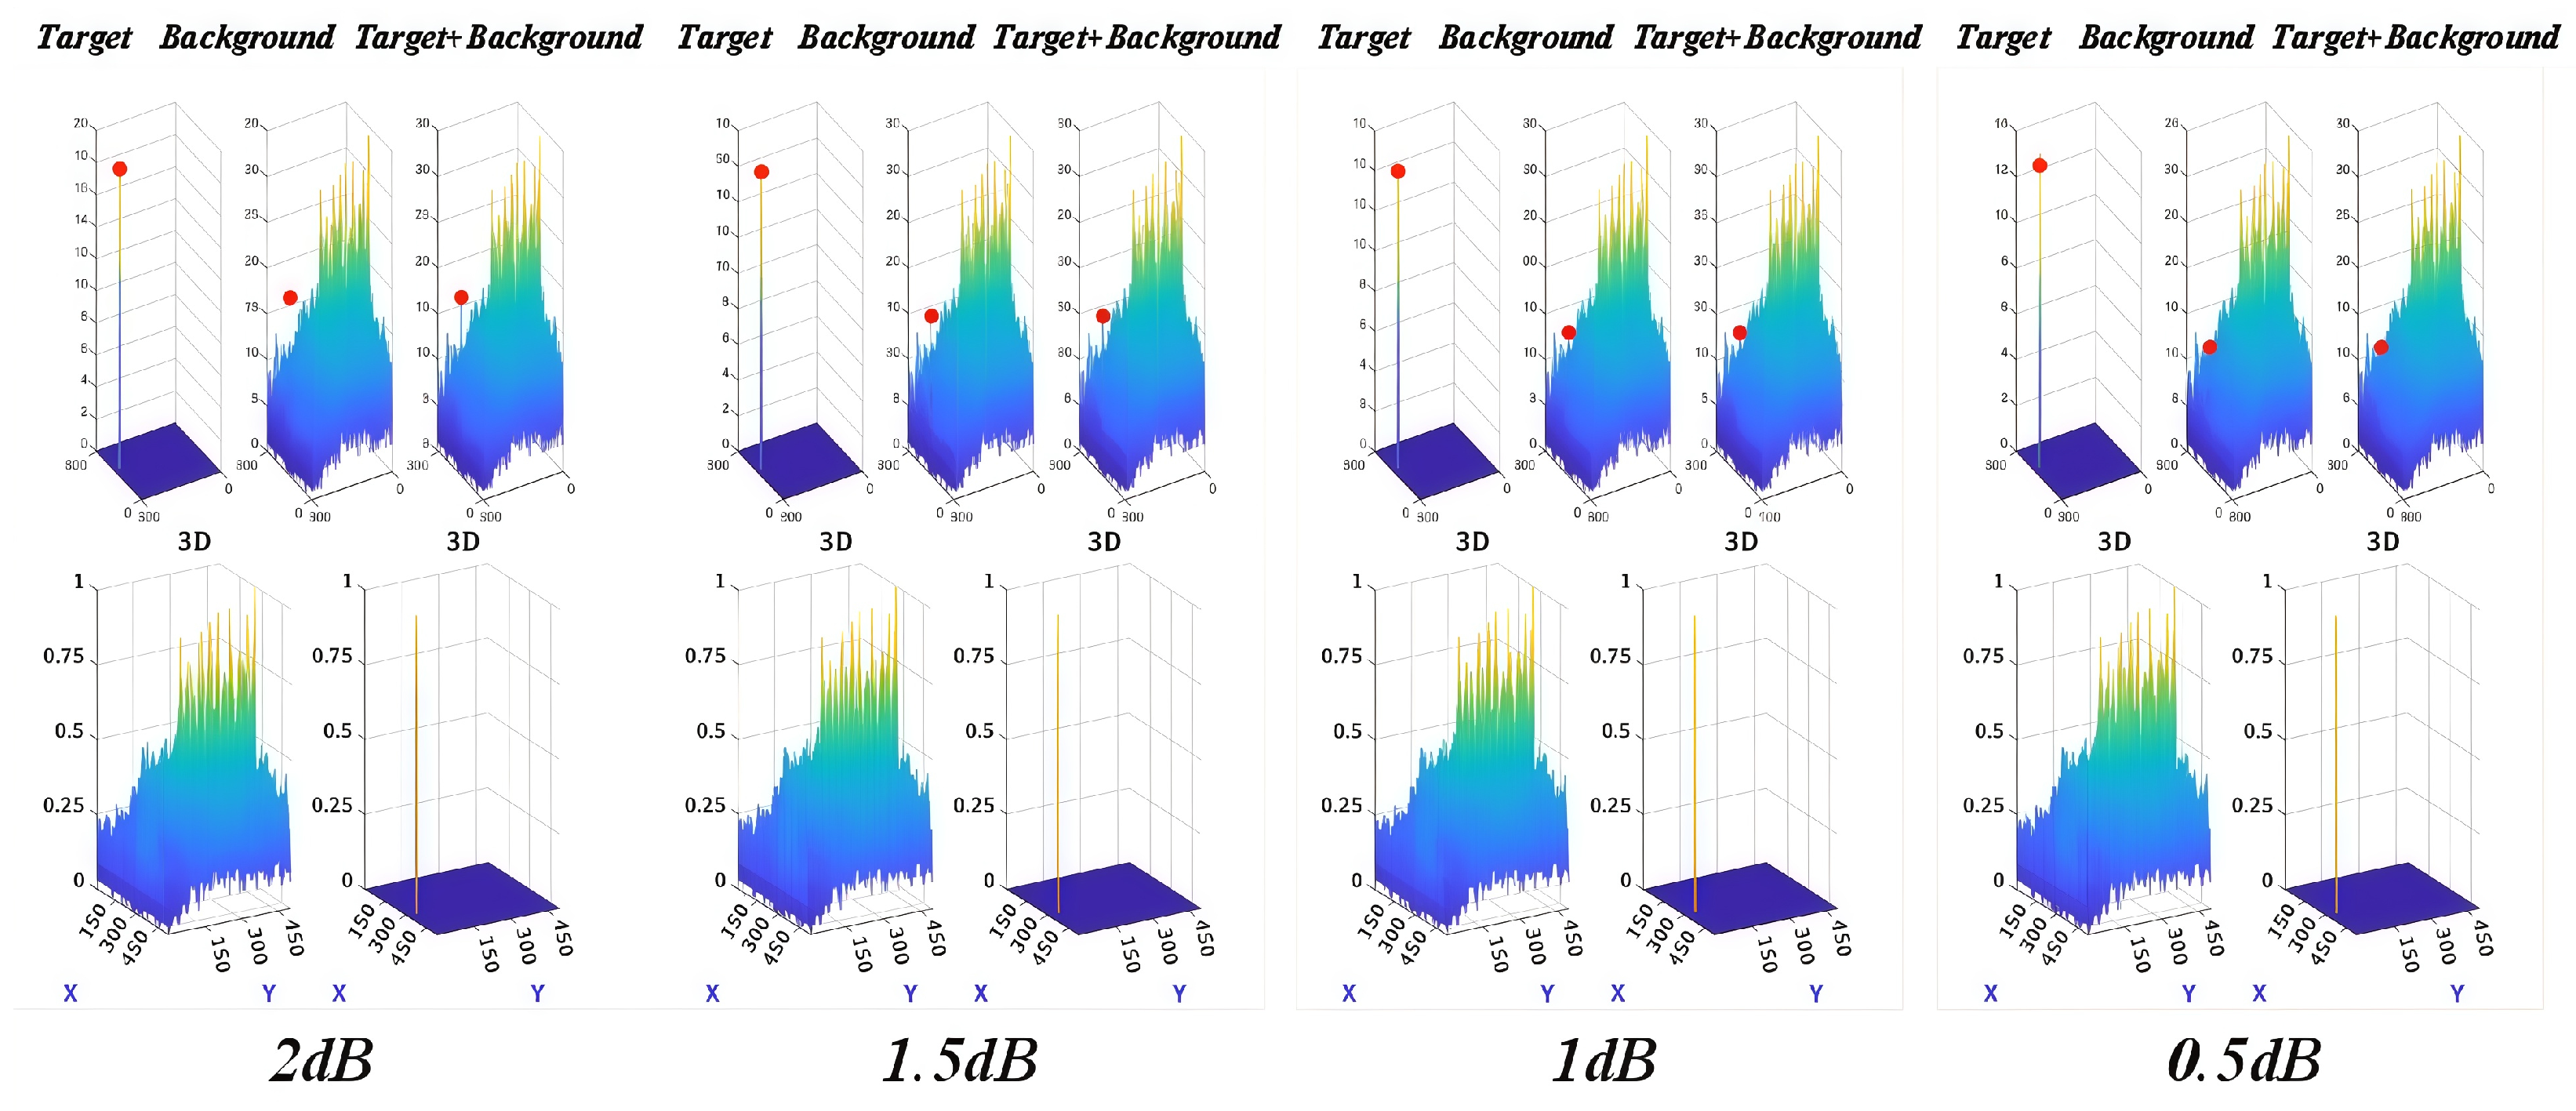
In Section 4.4.2, the continuous moving target detection method evaluates detection performance across various signal-to-noise ratios (SNRs) for the second data frame obtained by the 200 kHz HT sonar. Tests were conducted at SNR levels of 2 dB, 1.5 dB, 1 dB and 0.5 dB, with the results shown in Figure 17. To achieve these SNR levels, a semi-physical simulation approach was used in which target power was gradually reduced while maintaining constant background noise power. As illustrated in the figure, despite variations in SNR, detection performance remains consistently stable.

5. Conclusions

This paper presented a target detection method leveraging random walk-based local contrast, incorporating sonar information entropy and intensity cues. The main contributions are summarized as follows: First, in view of the low signal-to-noise ratio and variability of target intensity caused by environmental factors, the method calculates target intensity and information entropy to evaluate foreground and background distributions. By intersecting these two cues, it identifies an initial candidate region for targets. Second, a multi-scale local contrast descriptor (Description 1) was developed, using 3 × 3, 5 × 5, and 7 × 7 scales to effectively assess target saliency and suppress background noise. Third, a random walk fine local contrast descriptor (Description 2) was proposed to further distinguish targets from background clutter and precisely locate targets, enhancing local attention and detection accuracy. Finally, these descriptors were integrated through a nesting strategy to create a dual local contrast detection method that combines their strengths. The approach was validated using lake test data and evaluated through both qualitative and quantitative comparisons. The findings demonstrate that the proposed method effectively detects small targets in sonar intensity images, significantly outperforming existing HVS-based algorithms in terms of accuracy and robustness. However, a notable limitation is the high computational cost and the inability to process the entire sonar intensity image simultaneously, as each local region must be analyzed separately. Addressing this limitation will be a key focus of future research.

Author Contributions

Conceptualization, J.W. (Jian Wang) and H.L.; Data curation, R.L.; Formal analysis, J.W. (Jian Wang) and J.W. (Jing Wang); Funding acquisition, H.L.; Investigation, R.L. and J.W. (Jing Wang); Methodology, J.W. (Jian Wang); Project administration, H.L.; Resources, R.L. and J.W. (Jing Wang); Software, J.W. (Jian Wang) and R.L.; Supervision, H.L. and J.W. (Jing Wang); Validation, J.W. (Jian Wang) and J.W. (Jing Wang); Visualization, J.W. (Jian Wang) and J.W. (Jing Wang); Writing—original draft, J.W. (Jian Wang) and R.L.; Writing—review & editing, J.W. (Jian Wang), H.L. and J.W. (Jing Wang). All authors have read and agreed to the published version of the manuscript.

Funding

This research was funded by Marine Economy Development Special Project of 2024, grant number GDNRC[2024]43.

Data Availability Statement

The raw data supporting the conclusions of this article will be made available by the authors on request.

Conflicts of Interest

The authors declare no conflicts of interest.

References

  1. Gao, C.; Meng, D.; Yang, Y.; Wang, Y.; Zhou, X.; Hauptmann, A.G. Infrared patch-image model for small target detection in a single image. IEEE Trans. Image Process. 2013, 22, 4996–5009. [Google Scholar] [CrossRef] [PubMed]
  2. Ma, J.; Zhao, J.; Ma, Y.; Tian, J. Non-rigid visible and infrared face registration via regularized Gaussian fields criterion. Pattern Recognit. 2015, 48, 772–784. [Google Scholar] [CrossRef]
  3. Ma, J.; Zhao, J.; Tian, J.; Yuille, A.L.; Tu, Z. Robust point matching via vector field consensus. IEEE Trans. Image Process. 2014, 23, 1706–1721. [Google Scholar] [CrossRef]
  4. Ma, J.; Qiu, W.; Zhao, J.; Ma, Y.; Yuille, A.L.; Tu, Z. Robust L2E estimation of transformation for non-rigid registration. IEEE Trans. Signal Process. 2015, 63, 1115–1129. [Google Scholar] [CrossRef]
  5. Ma, J.; Zhao, J.; Yuille, A.L. Non-rigid point set registration by preserving global and local structures. IEEE Trans. Image Process. 2016, 25, 53–64. [Google Scholar] [PubMed]
  6. Ma, J.; Zhou, H.; Zhao, J.; Gao, Y.; Jiang, J.; Tian, J. Robust feature matching for remote sensing image registration via locally linear transforming. IEEE Trans. Geosci. Remote Sens. 2015, 53, 6469–6481. [Google Scholar] [CrossRef]
  7. Wei, Y.; You, X.; Li, H. Multiscale patch-based contrast measure for small infrared target detection. Pattern Recognit. 2016, 58, 216–226. [Google Scholar] [CrossRef]
  8. Yang, C.; Ma, J.; Qi, S.; Tian, J.; Zheng, S.; Tian, X. Directional support value of Gaussian transformation for infrared small target detection. Appl. Opt. 2015, 54, 2255–2265. [Google Scholar] [CrossRef]
  9. Bi, Y.; Bai, X.; Jin, T.; Guo, S. Multiple feature analysis for infrared small target detection. IEEE Geosci. Remote Sens. Lett. 2017, 14, 1333–1337. [Google Scholar] [CrossRef]
  10. Porat, B.; Friedlander, B. A frequency domain algorithm for multi-frame detection and estimation of dim targets. IEEE Trans. Pattern Anal. Mach. Intell. 1990, 12, 398–401. [Google Scholar] [CrossRef]
  11. Mao, H.; Peng, C.; Liu, Y.; Tang, J.; Peng, H.; Yi, W. Poisson Conjugate Prior for PHD Filtering based Track-Before-Detect Strategies in Radar Systems. In Proceedings of the 2023 IEEE Radar Conference (RadarConf23), San Antonio, TX, USA, 1–5 May 2023; IEEE: New York, NY, USA, 2023; pp. 1–6. [Google Scholar]
  12. Reed, I.S.; Gagliardi, R.M.; Stotts, L.B. Optical moving target detection with 3-D matched filtering. IEEE Trans. Aerosp. Electron. Syst. 1988, 24, 327–336. [Google Scholar] [CrossRef]
  13. Li, M.; Zhang, T.; Yang, W.; Sun, X. Moving weak point target detection and estimation with three-dimensional double directional filter in IR cluttered background. Opt. Eng. 2005, 44, 107007. [Google Scholar] [CrossRef]
  14. Liu, L.; Zuo, Z. A dim small infrared moving target detection algorithm based on improved three-dimensional directional filtering. In Advances in Image and Graphics Technologies; Springer: New York, NY, USA, 2013; Volume 363, Chapter 13; pp. 102–108. [Google Scholar]
  15. Bai, X.; Zhou, F. Analysis of new top-hat transformation and the application for infrared dim small target detection. Pattern Recognit. 2010, 43, 2145–2156. [Google Scholar] [CrossRef]
  16. Gu, J.-L.; Zhang, W.; Wan, M. Faint targets detection based on gray morphological filtering and neighborhood entropy method. High Power Laser Part. Beams 2004, 12, 008. [Google Scholar]
  17. Zeng, M.; Li, J.; Peng, Z. The design of top-hat morphological filter and application to infrared target detection. Infrared Phys. Technol. 2006, 48, 67–76. [Google Scholar] [CrossRef]
  18. Hou, W.; Lei, Z.; Yu, Q.; Liu, X. Small target detection Using Main Directional Suppression High Pass Filter. Optik 2014, 125, 3017–3022. [Google Scholar] [CrossRef]
  19. Li, L.; Tang, Y.Y. Wavelet-Hough transform with applications in edge and target detections. Int. J. Wavelets Multi-Resolut. Inf. Process. 2006, 4, 567–587. [Google Scholar] [CrossRef]
  20. Deshpande, S.D.; Meng, H.E.; Venkateswarlu, R.; Chan, P. Max-mean and max-median filters for detection of small targets. In Proceedings of the SPIE’s International Symposium on Optical Science, Engineering, and Instrumentation, Denver, CO, USA, 18–23 July 1999; pp. 74–83. [Google Scholar]
  21. Miao, Z.; Jiang, X. Interest point detection using rank order log filter. Pattern Recognit. 2013, 46, 2890–2901. [Google Scholar] [CrossRef]
  22. Kim, S. Min-local-log filter for detecting small targets in cluttered background. Electron. Lett. 2011, 47, 105. [Google Scholar] [CrossRef]
  23. Wang, G.D.; Chen, C.-Y.; Shen, X.-B. Facet-based infrared small target detection method. Electron. Lett. 2005, 41, 1244–1246. [Google Scholar] [CrossRef]
  24. Qi, S.; Ma, J.; Li, H.; Zhang, S.; Tian, J. Infrared small target enhancement via phase spectrum of quaternion fourier transform. Infrared Phys. Technol. 2014, 62, 50–58. [Google Scholar] [CrossRef]
  25. Liu, H.; Yan, L.; Chang, Y.; Fang, H.; Zhang, T. Spectral deconvolution and feature extraction with robust adaptive tikhonov regularization. IEEE Trans. Instrum. Meas. 2013, 62, 315–327. [Google Scholar] [CrossRef]
  26. Liu, H.; Zhang, Z.; Liu, S.; Liu, T.; Yan, L.; Zhang, T. Richardson-lucy blind deconvolution of spectroscopic data with wavelet regularization. Appl. Opt. 2015, 54, 1770–1775. [Google Scholar] [CrossRef]
  27. Meng, W.; Jin, T.; Zhao, X. Adaptive method of dim small object detection with heavy clutter. Appl. Opt. 2013, 52, D64–D74. [Google Scholar] [CrossRef]
  28. Li, W.; Du, Q.; Zhang, B. Combined sparse and collaborative representation for hyperspectral target detection. Pattern Recognit. 2015, 48, 3904–3916. [Google Scholar] [CrossRef]
  29. Zhao, J.; Tang, Z.; Yang, J.; Liu, E. Infrared small target detection using sparse representation. J. Syst. Eng. Electron. 2011, 22, 897–904. [Google Scholar] [CrossRef]
  30. Zhao, Y.; Pan, H.; Du, C.; Zheng, Y. Principal curvature for infrared small target detection. Infrared Phys. Technol. 2015, 69, 36–43. [Google Scholar] [CrossRef]
  31. Kim, S.; Lee, J. Scale invariant small target detection by optimizing signal-to-clutter ratio in heterogeneous background for infrared search and track. Pattern Recognit. 2012, 45, 393–406. [Google Scholar] [CrossRef]
  32. Chen, C.P.; Li, H.; Wei, Y.; Xia, T.; Tang, Y.Y. A local contrast method for small infrared target detection. IEEE Trans. Geosci. Remote Sens. 2014, 52, 574–581. [Google Scholar] [CrossRef]
  33. Qi, S.; Ma, J.; Tao, C.; Yang, C.; Tian, J. A robust directional saliency-based method for infrared small-target detection under various complex backgrounds. IEEE Geosci. Remote Sens. Lett. 2013, 10, 495–499. [Google Scholar]
  34. Kim, S.; Yang, Y.; Lee, J.; Park, Y. Small Target Detection Utilizing Robust Methods of the Human Visual System for IRST. J. Infrared Millim. Terahertz Waves 2009, 30, 994–1011. [Google Scholar] [CrossRef]
  35. Shao, X.; Fan, H.; Lu, G.; Xu, J. An improved infrared dim and small target detection algorithm based on the contrast mechanism of human visual system. Infrared Phys. Technol. 2012, 55, 403–408. [Google Scholar] [CrossRef]
  36. Han, J.; Ma, Y.; Zhou, B.; Fan, F.; Liang, K.; Fang, Y. A robust infrared small target detection algorithm based on human visual system. IEEE Geosci. Remote Sens. Lett. 2014, 11, 2168–2172. [Google Scholar]
  37. Xie, K.; Fu, K.; Zhou, T.; Zhang, J.; Yang, J.; Wu, Q. Small target detection based on accumulated center-surround difference measure. Infrared Phys. Technol. 2014, 67, 229–236. [Google Scholar] [CrossRef]
  38. Han, J.; Liang, K.; Zhou, B.; Zhu, X.; Zhao, J.; Zhao, L. Infrared small target detection utilizing the multiscale relative local contrast measure. IEEE Geosci. Remote Sens. Lett. 2018, 15, 612–616. [Google Scholar] [CrossRef]
  39. He, D.; Sun, X.; Liu, M.; Ye, C.; Zhou, X. Small infrared target detection based on weighted local difference measure. IEEE Trans. Geosci. Remote Sens. 2016, 54, 4204–4214. [Google Scholar]
  40. Zhang, H.; Zhang, L.; Yuan, D.; Chen, H. Infrared small target detection based on local intensity and gradient properties. Infrared Phys. Technol. 2018, 89, 88–96. [Google Scholar] [CrossRef]
  41. Han, J.; Moradi, S.; Faramarzi, I.; Liu, C.; Zhang, H.; Zhao, Q. A local contrast method for infrared small-target detection utilizing a tri-layer window. IEEE Geosci. Remote Sens. Lett. 2019, 17, 1822–1826. [Google Scholar] [CrossRef]
  42. Zhang, S.; Zhao, M.; An, B. Infrared Small Target Detection Based on Double-layer Local Contrast Measure. Acta Photonica Sin. 2020, 49, 184–192. [Google Scholar]
  43. Shi, Y.; Wei, Y.; Yao, H.; Pan, D.; Xiao, G. High-boost-based multiscale local contrast measure for infrared small target detection. IEEE Geosci. Remote Sens. Lett. 2017, 15, 33–37. [Google Scholar] [CrossRef]
  44. Moradi, S.; Moallem, P.; Sabahi, M.F. Fast and robust small infrared target detection using absolute directional mean difference algorithm. Signal Process. 2020, 177, 107727. [Google Scholar] [CrossRef]
  45. Aghaziyarati, S.; Moradi, S.; Talebi, H. Small infrared target detection using absolute average difference weighted by cumulative directional derivatives. Infrared Phys. Technol. 2019, 101, 78–87. [Google Scholar] [CrossRef]
  46. Wu, L.; Ma, Y.; Fan, F.; Wu, M.; Huang, J. A double-neighborhood gradient method for infrared small target detection. IEEE Geosci. Remote Sens. Lett. 2020, 18, 1476–1480. [Google Scholar] [CrossRef]
  47. Liu, J.; He, Z.; Chen, Z.; Shao, L. Tiny and dim infrared target detection based on weighted local contrast. IEEE Geosci. Remote Sens. Lett. 2018, 15, 1780–1784. [Google Scholar] [CrossRef]
  48. Shang, K.; Sun, X.; Tian, J.; Li, Y.; Ma, J. Infrared small target detection via line-based reconstruction and entropy-induced suppression. Infrared Phys. Technol. 2016, 76, 75–81. [Google Scholar] [CrossRef]
Figure 1. Overall structural diagram of the object detection method combining local information entropy and local contrast through random walk.
Remotesensing 17 03724 g001
Figure 2. Sonar data analysis. (a) Sonar imaging results; (b) 3D diagram of sonar data.
Remotesensing 17 03724 g002
Figure 3. Double-threshold candidate target extraction results.
Remotesensing 17 03724 g003
Figure 4. Illustration of target enhancement and background suppression. (a) Multi-window sliding over sonar intensity images. (b) Intensity image patch divided into 9 cells.
Remotesensing 17 03724 g004
Figure 5. Schematic diagram of the known label design strategy used in the random walk method.
Remotesensing 17 03724 g005
Figure 6. Reference window design in Dual-contrast Nested Object Detection.
Remotesensing 17 03724 g006
Figure 7. Structural diagram of the HT multi-beam echo sonar system. (a) System composition diagram. (b) Mill’s cross-array sonar architecture.
Remotesensing 17 03724 g007
Figure 8. Installation of the test equipment and layout of the target water. (a) Sonar equipment installation diagram. (b) Target water layout diagram.
Remotesensing 17 03724 g008
Figure 9. Comparison of Conventional Filtering Approaches. (a) TOPHAT. (b) MAXMED. (c) MAXMEAN. (d) Proposed Method.
Remotesensing 17 03724 g009
Figure 10. Comparison of Local Contrast Mechanism Approaches. (a) LCM. (b) TLLCM. (c) DLCM. (d) LIG.
Remotesensing 17 03724 g010
Figure 11. Comparison of Multi-scale Object Detection Methods. (a) MPCM. (b) RLCM. (c) HBMLCM. (d) Proposed Method.
Remotesensing 17 03724 g011
Figure 12. Comparison of absolute value contrast methods. (a) ADMD. (b) AAGD.
Remotesensing 17 03724 g012
Figure 13. Comparison of foreground–background separation methods. (a) DGRAD. (b) AMWLCM. (c) LR. (d) Proposed Method.
Remotesensing 17 03724 g013
Figure 14. Detection accuracy rates for moving targets in long- and short-distance sequences. (a) Pd of long-distance target detection. (b) Pd of close-distance target detection.
Remotesensing 17 03724 g014
Figure 15. 200 kHz HT Sonar Target Detection Performance Analysis.
Remotesensing 17 03724 g015
Figure 16. Target Continuous Detection Performance Analysis.
Remotesensing 17 03724 g016
Figure 17. Performance Analysis at Different SNR Levels.
Remotesensing 17 03724 g017
Table 1. Quantitative comparison of multiple target detection methods.
Method BSF Var BSF Mean SCR
LCM4.4445.06373.193
RLCM4.7265.1877.854
HBMLCM8.1086.442133.578
TLLCM3.9984.89765.844
MPCM8.636.496142.172
AAGD7.0075.984115.433
ADMD7.3956.164121.828
DLCM12.4387.121204.925
DGRAD11.3536.855187.036
AMWLCM2.8243.71646.474
TOPHAT1.8592.9130.553
LR9.1836.662151.284
MAXMED3.4224.15756.348
MAXMEAN2.7273.71344.877
LIG3.4214.55156.345
Proposed16.0547.696264.492
Table 2. Comparison of detection accuracy rates at different distances.
Method P d (%) Method P d (%)
Long-distance sequence of 110 framesClose-distance sequence of 30 frames
DGRAD62.72DGRAD66.67
DLCM60DLCM63.33
LIG43.63LIG80
Proposed95.45Proposed96.66
Disclaimer/Publisher’s Note: The statements, opinions and data contained in all publications are solely those of the individual author(s) and contributor(s) and not of MDPI and/or the editor(s). MDPI and/or the editor(s) disclaim responsibility for any injury to people or property resulting from any ideas, methods, instructions or products referred to in the content.