1. Introduction
Synthetic aperture radar (SAR) three-dimensional (3D) imaging is an essential tool for disaster monitoring, topographic mapping, and environmental surveillance due to its continuous, all-weather, and high-resolution capabilities [
1,
2,
3]. Conventional 3D SAR techniques, such as tomographic SAR (TomoSAR) and distributed SAR systems, typically rely on meticulously regulated flight configurations. These configurations, often employing vertical baselines, are designed to preserve phase coherence across multiple radar acquisitions [
4,
5,
6,
7,
8], enabling precise reconstruction of target scattering centers through coherent integration.
However, these stringent geometric requirements are difficult to satisfy in unmanned aerial vehicle (UAV) swarm implementations. The inter-platform navigation accuracy in UAV swarms is inherently limited by environmental disturbances, communication delays, antenna gain and hardware inconsistencies [
9,
10,
11]. The core challenge, therefore, lies in the geometric inaccuracies during multi-platform operations. Deviations from predefined flight trajectories result in misaligned interferometric baselines, which fundamentally compromise the spatial coherence of the received signals. This leads to a severe degradation in signal coherence, causing a systematic deterioration in 3D reconstruction quality and target localization accuracy [
12].
Conventional TomoSAR frameworks, which depend on dense vertical baseline sampling, are ill-suited for UAV swarms with unstable altitude distributions [
13,
14,
15,
16]. Similarly, distributed SAR systems experience substantial resolution degradation when baseline deviations exceed theoretical tolerances [
17,
18,
19]. In the field of horizontal cross 3D imaging, several studies have focused on multi-platform systems to enhance geometric flexibility. For instance, Liu et al. employed multi-aspect non-coplanar SAR acquisitions to relax strict inter-UAV altitude synchronization while enabling robust building detection [
20]. Kim et al. introduced a MIMO-video SAR concept for UAV swarms, where beat-frequency-division FMCW waveforms combined with non-coplanar trajectories significantly alleviate clock and height-synchrony demands [
21]. However, these methods often rely on empirical calibrations or assume near-ideal conditions, which may not fully address practical challenges in dynamic UAV environments. Although recent studies have sought to improve geometric flexibility—for instance, through compressed sensing-based sparse reconstruction and motion compensation algorithms [
22,
23]—these methods primarily adapt geometrically flawed data in post-processing. Crucially, they operate under the same fundamental constraint of stringent baseline configurations and do not address the root cause of geometric inaccuracy by redefining the acquisition geometry itself. Therefore, the fundamental limitation imposed by stringent baseline requirements remains largely unaddressed.
There is consequently an urgent need to develop more adaptable SAR imaging frameworks capable of handling these geometric uncertainties. Such frameworks should aim to relax the strict baseline precision requirements that limit conventional techniques.
In this context, the proposed horizontal-cross configuration shares a fundamental similarity with photogrammetry-based 3D reconstruction in that both leverage multi-perspective geometries for depth estimation. However, the underlying algorithms differ significantly: photogrammetry relies on feature matching and triangulation from optical imagery, which involves computationally intensive iterative optimization and is sensitive to texture and lighting variations [
24,
25,
26]. In contrast, our geometric inversion algorithm constructs 2D signal matrices from azimuth signals and is based on a vector outer product-based dimensional elevation analytic method for rapid reconstruction of scatterer positions. This approach offers advantages in computational efficiency but may achieve lower accuracy compared to photogrammetry under certain conditions. Additionally, in comparison to traditional multi-point target 3D localization methods, such as TomoSAR and distributed SAR systems, which rely on phase coherence and precisely controlled vertical baselines for high-accuracy scatterer positioning, our geometric inversion algorithm shares the fundamental objective of reconstructing multiple scatterers in 3D space from multi-aspect data. However, key distinctions arise in the geometric constraints and algorithmic principles: conventional methods emphasize dense vertical baseline sampling and interferometric coherence to achieve sub-wavelength accuracy through techniques like spectral estimation or compressive sensing [
27,
28], whereas our approach leverages horizontal cross configurations and a vector outer product-based analytic method, relaxing strict baseline precision requirements and offering enhanced computational efficiency. However, this method sacrifices some reconstruction accuracy, with quality degrading rapidly when targets exhibit significant geometric deviations from the scene center due to inherent limitations in phase stability. In contrast, traditional approaches are optimized for coherent integration under controlled geometries, enabling higher precision in such scenarios [
5,
7]. Consequently, our technique offers a pragmatic alternative for applications like UAV swarms, where geometric adaptability is valued over ultimate precision.
To address this need, a systematic framework for horizontal-cross configurations in UAV swarm SAR is introduced in this work. In contrast to conventional vertical-baseline approaches, the constraints on baselines are transformed into geometric degrees of freedom within the horizontal plane, such as the intersection angle between platform trajectories. A corresponding 3D imaging method is developed to exploit this observation geometry fully. For dual-UAV subsystems, a geometric inversion algorithm is devised to facilitate initial scattering center localization. Geometric inversion denotes the method of deducing the spatial positions of scatterers (including elevation and deformation) from phase and amplitude data, reliant on spatial and temporal baseline configurations. For multi-UAV systems, which are extended from the dual-UAV subsystem, a multi-aspect fusion technique based on basis transformation is proposed [
29], enabling coherent integration without requiring strict elevation alignment. In this context, “elevation alignment” refers to the registration of one-dimensional elevation profiles—obtained from the complex-valued SAR imagery generated by the dual-UAV platforms. It should be noted that each elevation profile corresponds to a one-dimensional signal slice extracted at a specific elevation level, and the elevation values themselves are inferred from the slant-range measurements.
Collectively, the proposed configuration and its associated algorithms effectively relax the stringent baseline precision requirements of conventional systems, significantly enhancing tolerance to trajectory deviations and collaborative navigation errors.
The effectiveness of the proposed framework is corroborated by numerical and Microwave simulations. The results demonstrate an 80% reduction in hardware cost compared to standard TomoSAR systems, alongside a 1.7-fold improvement in elevation resolution over conventional beamforming (CBF). These advantages are attributed to the effective utilization of the horizontal-cross configurations, which enhances spatial frequency coverage.
This paper makes four major contributions.
Horizontal-cross configurations for UAVs SAR 3D imaging are systematically formulated for the first time, offering a geometrically adaptive acquisition paradigm.
An integrated reconstruction architecture that combines geometric inversion and basis transformation theory has been constructed.
The proposed method attains a more advantageous equilibrium between cost and resolution compared to conventional TomoSAR systems.
This paper establishes a theoretical framework for SAR 3D reconstruction based on generalized coordinate transformations, which is well-suited for UAVs employing a horizontal-cross configurations.
The remainder of this paper is structured as follows. The signal model under the horizontal-cross configuration is detailed in
Section 2. The geometric inversion algorithm for dual-UAV subsystems is derived in
Section 3, followed by the presentation of the basis transformation-based multi-aspect fusion methodology in
Section 4. Comparative simulation results are provided in
Section 5 to validate the framework, while practical implementation challenges are discussed in
Section 6. Finally, concluding remarks are given in
Section 7.
2. Horizontal-Cross Configurations
The proposed method utilizes a horizontal-cross configurations, which provides greater freedom in flight path design. In this approach, platforms are allowed to operate at different altitudes, with trajectories designed to be parallel to the ground and non-coplanar to form a cross-angle. This results in high configuration flexibility, as precise co-planarity or altitude synchronization is not required. In contrast, traditional TomoSAR configurations typically require multiple flight tracks to be co-planar or highly synchronized, which limits the degrees of freedom. The proposed method’s design enables more adaptable flight paths, thereby reducing the demands on attitude and accuracy control through its inherent flexibility. To formalize this configuration, the imaging geometry and signal model of 3D SAR under the horizontal-cross configurations are established in this section.
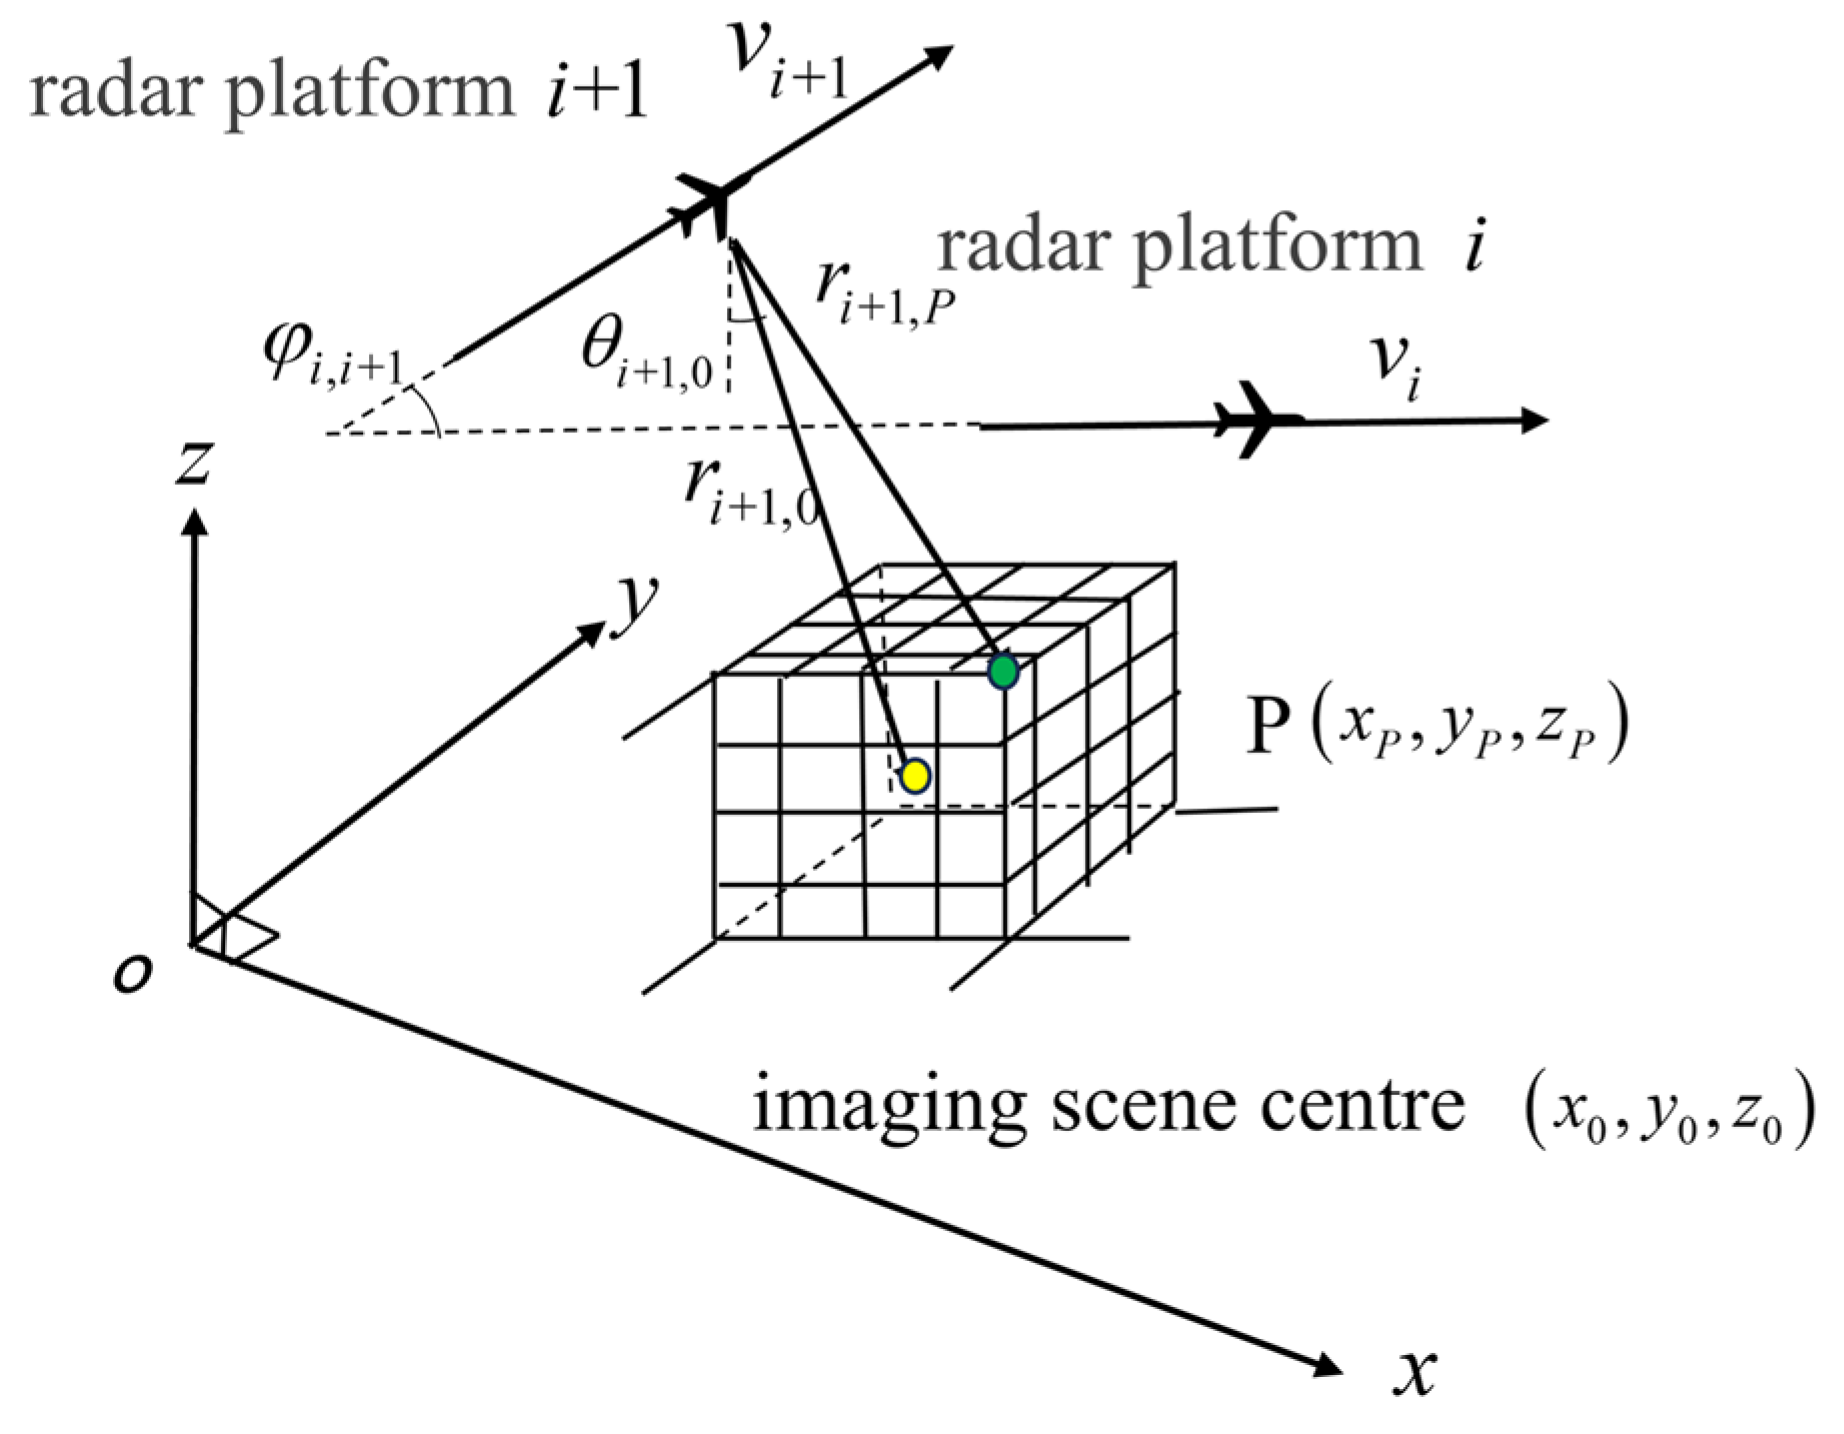
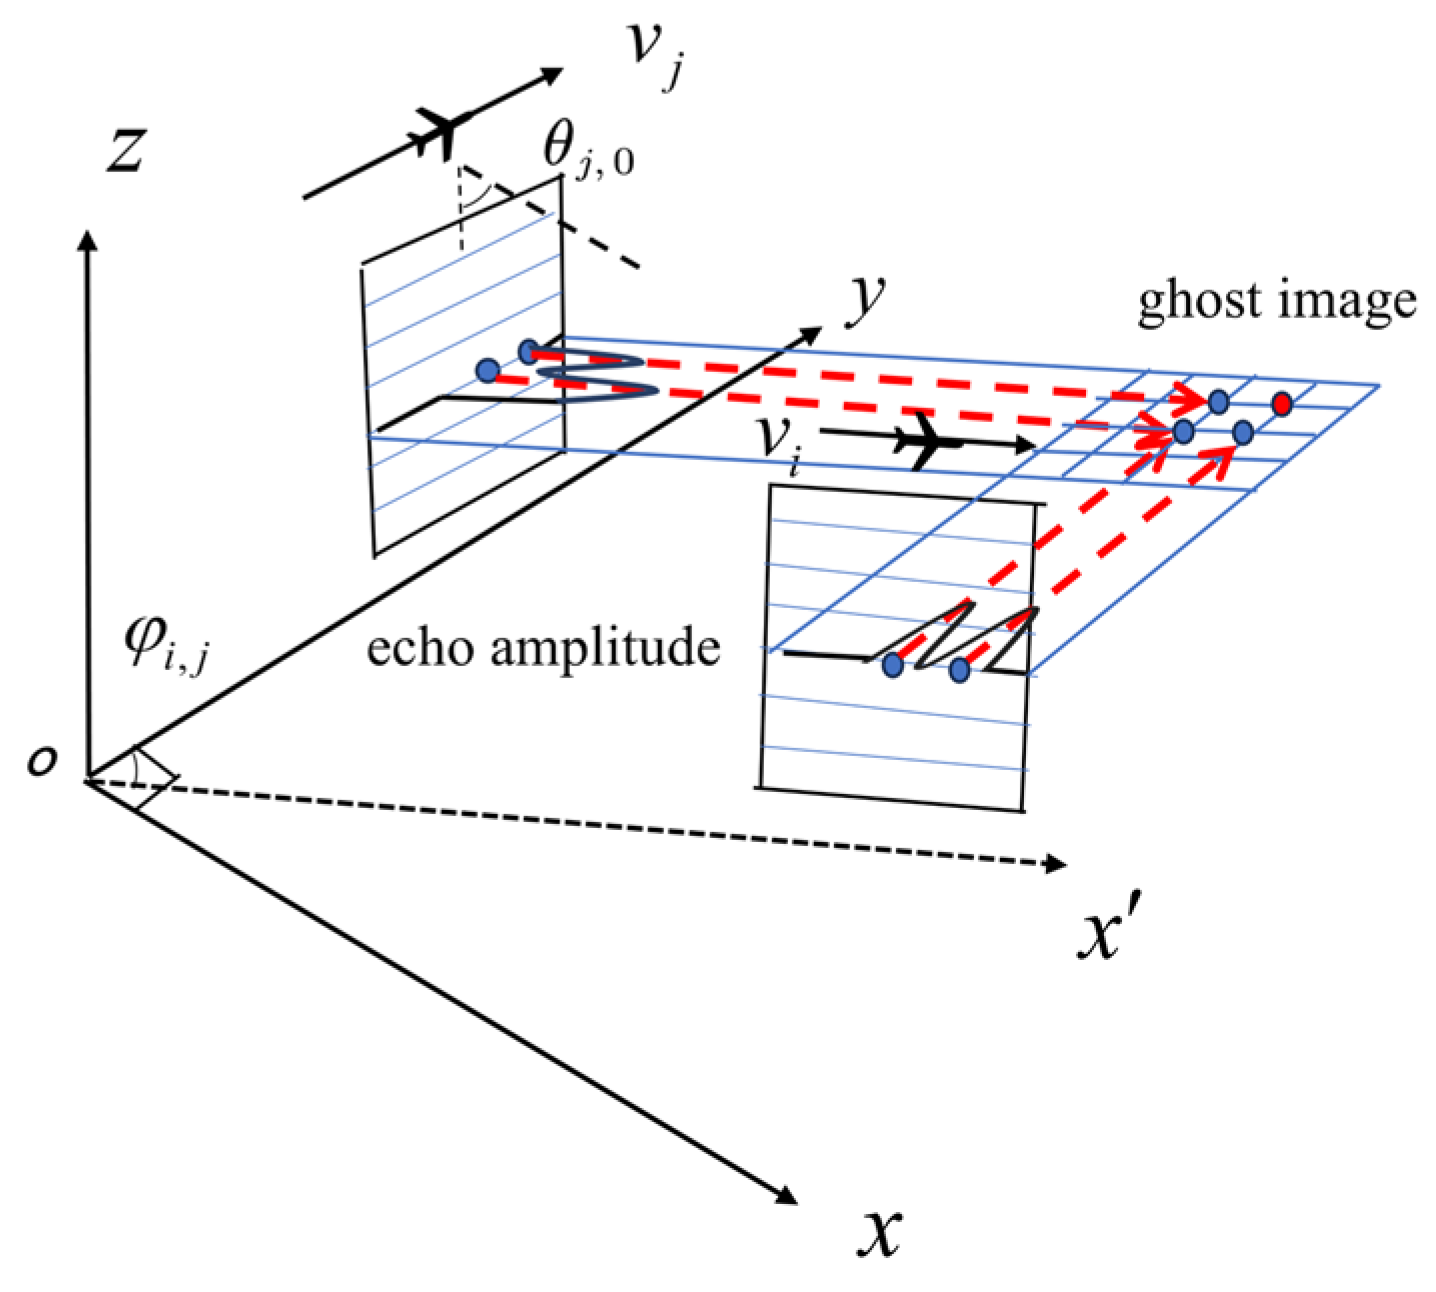
The imaging geometry and signal model of 3D SAR under the horizontal-cross configurations are established in this section. As illustrated in
Figure 1, a right-handed Cartesian coordinate system is established such that the
Z-axis aligns with the normal vector of the imaging plane, while the X-Y plane coincides with the imaging scene plane. Consider a swarm of
radar platforms
with coplanar trajectories parallel to the X-Y plane. Key geometric parameters include:
is defined as the angle between the trajectories of platform
and platform
, with
and
being assigned to denote the flight speeds of each platform along the trajectory. The look-down angle
for platform
relative to the scene center. The target point
and scene center are indicated by green and yellow dots, respectively. In the proposed observation model, all platforms are operated in an independent monostatic mode, ensuring no mutual interference among them.
For a point target
, the instantaneous slant range to the platform
at slow time
is:
where
denotes the spatial coordinates of the platform
.
Under the far-field condition
(where variable
denotes the azimuth coordinate of the platform
[
7]. The variable
denotes the synthetic aperture center, and the variable
denotes the reference slant-range), the effect of wavefront curvature can be ignored, and the signal model adopts the plane wave approximation model.
Each platform transmits a linear frequency-modulated (LFM) signal:
where variable
denotes the fast time,
denotes the pulse width,
denotes the chirp rate (Hz/s),
denotes the carrier frequency.
The dechirped received echo signal corresponding to target point P can be expressed as:
where variable
denotes the two-way delay,
denotes the speed of light,
denotes the wavelength of the platform
,
denotes beam center offset time.
After range compression, the processed signal becomes:
where variable
denotes the signal bandwidth of the platform
,
.
Based on the above parameters, the slant-range and azimuth resolutions of the platform
are expressed as:
where variable
denotes the synthetic aperture length for the platform
,
denotes the minimum slant-range from the platform
to target
.
3. Three-Dimensional Reconstruction Algorithm Based on Geometric Inversion
This section establishes a geometric inversion framework for effective 3D reconstruction of targets using multi-aspect SAR images. The limitations of conventional 3D imaging techniques are overcome by systematically employing horizontal cross-observation configurations. This strategy facilitates computationally efficient and cost-effective 3D target reconstruction via a two-pass SAR data acquisition configurations.
The back projection (BP) algorithm synthesizes two-dimensional (2D) imagery through coherent integration:
The imaging result of the BP algorithm exhibits a 2D sinc-function-like main lobe [
30]. For a point target P, the slant-range-azimuth response from the platform
is derived as:
where
is the slant-range impulse response of the platform
,
is the azimuth impulse response of the platform
.
3.1. Elevation Reconstruction Principle
In horizontal-cross configurations, the elevation resolution is defined as the projection of the slant-range resolution onto the elevation direction. Under the far-field assumption, where the illuminated scene can be approximated as a point target, a reference look-down angle is derived from the known scene center. Using this angle, the relationship between the slant-range and elevation resolutions is established as follows:
Through this relationship, the elevation resolution is determined by the projection of the slant-range resolution. As illustrated in
Figure 1, the elevation offset for targets displaced from the scene center is modeled as
where variable
denotes the actual look-down angle from the platform
to target
.
However, scatterers cannot be resolved using only multi-aspect 2D complex-valued images, as each image is formed from data acquired during individual voyages. The differing imaging geometries place the same scatterer in distinct slant-range-azimuth coordinate systems across images. This necessitates the identification of coherent scattering responses from the same physical scatterer across multiple aspects. The key to addressing is found in (8), which shows that the slant-range information inherently contains the target elevation component. Therefore, multiple 2D images can be leveraged to recover the scatterer distribution in elevation and reconstruct the target’s elevation information.
Consequently, this paper implements the BP algorithm in the slant-range-azimuth coordinate system, rather than the ground-plane coordinate system common in conventional SAR. This approach is critical because it preserves the original scatterer information without the loss associated with terrain projection. Crucially, retaining the unaltered slant-range geometry provides the fundamental constraints for accurate elevation inversion. Avoiding premature ground projection maintains essential 3D spatial relationships, thereby establishing the foundation for subsequent elevation alignment.
The scattering profile along the elevation dimension is then derived by simultaneously solving (7)–(9):
The elevation displacement of a target is typically considered acceptable if it remains within half of the system’s elevation resolution. Additionally, the difference in the elevation angle between the target and the scene center is constrained by:
Within this range, the elevation offset remains tolerable during reconstruction since it is smaller than half of the elevation resolution.
3.2. Multi-Aspect Profile Alignment
For the fusion of multi-aspect data, elevation alignment must first be performed between the 2D complex-valued images obtained from each platform. The effective elevation reconstruction range for each platform is then individually determined by the geometric projection model in (8), which relates the elevation and slant ranges to derive target elevation distributions via slant-range projections. The fundamental relationship between the elevation and slant range stems from the imaging geometry. For a fixed look-down angle , a differential change in target elevation (Δr) is approximately related by . Consequently, the achievable elevation resolution and the extent of the reconstructable elevation range are intrinsically constrained by the system’s slant-range resolution and bandwidth, respectively. To enable effective fusion, the elevation intervals reconstructed from all platforms must have a sufficient overlapping region, representing their common observation range.
Therefore, the constraint on the elevation range for each platform is formalized as
where
and
are the shortest and farthest slant-range between the platform
and the scene center, respectively. This constraint is applied to each platform (indexed by
) to ensure that the reconstructed elevation ranges
overlap across all platforms. This enables correspondence establishment between identical-elevation profiles across platforms without requiring phase matching. Within the above elevation limits, (10) can be rewritten as
where variable
N denotes the number of elevation profile.
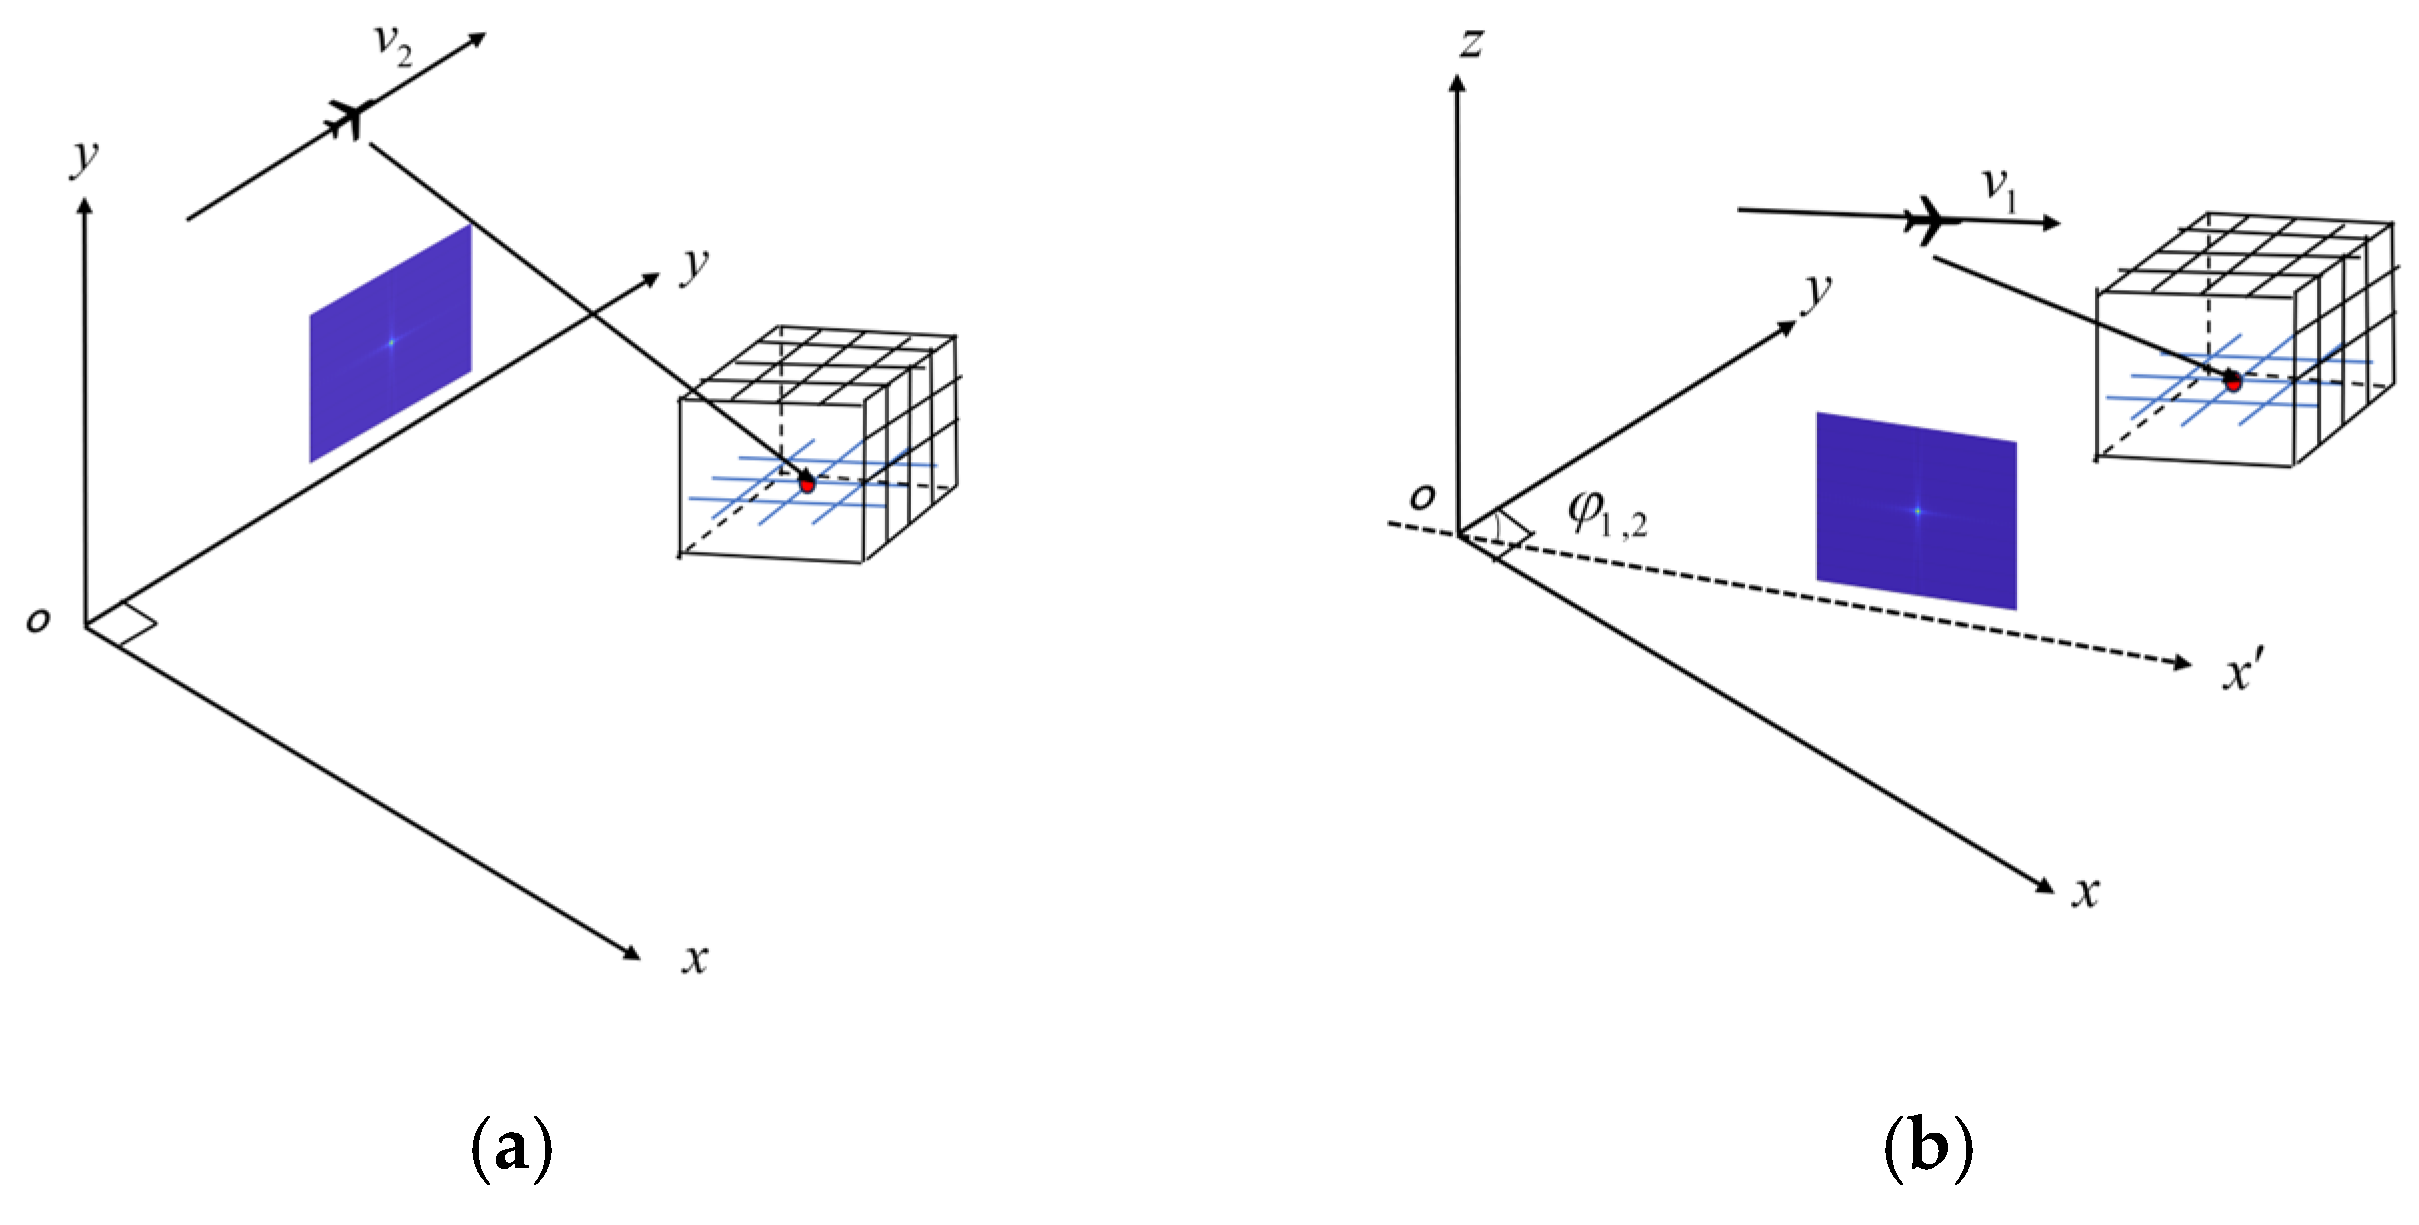
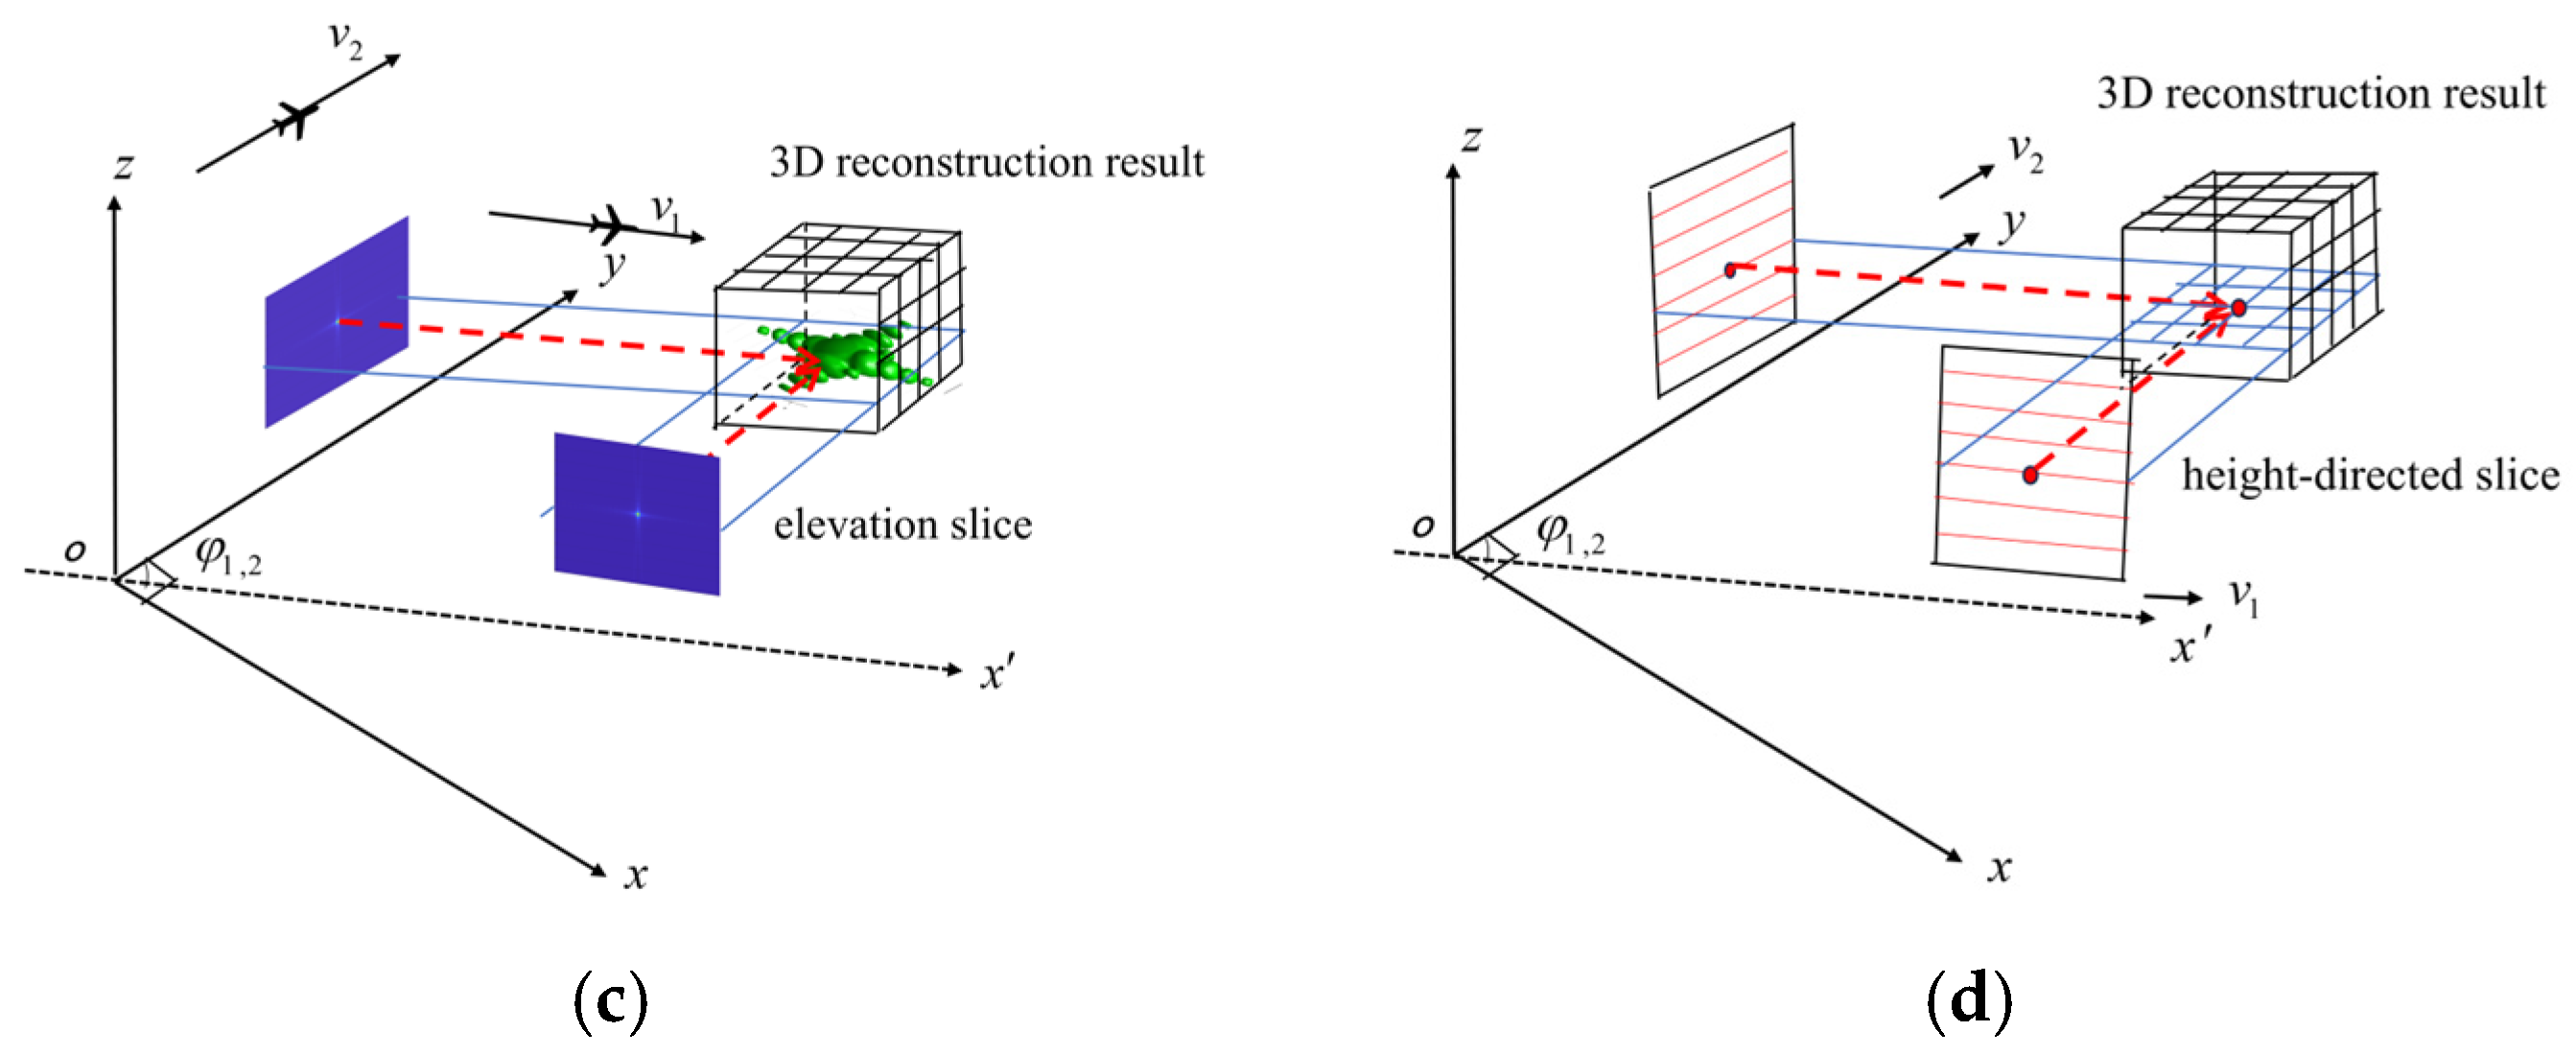
Figure 2 presents the core process of the proposed 3D reconstruction algorithm, which begins with the imaging of raw SAR echo data and culminates in the generation of a 3D scattering volume. Specifically,
Figure 2a,b display the 2D complex-valued SAR images obtained from Platforms 1 and 2, respectively, while
Figure 2c illustrates the final 3D reconstruction result.
Figure 2d offers a simplified geometric schematic to clarify the underlying principles.
The reconstruction method is based on the coherent processing of elevation profiles derived from SAR images. Each complex-valued SAR image, represented as a 2D matrix, is formed by coherently integrating signal returns along the aperture direction. Fundamentally, the image comprises elevation profiles, as expressed in (13), where each profile corresponds to a one-dimensional signal vector synthesized from the raw data.
The algorithm involves three key steps, as outlined below:
Two-Dimensional SAR Imaging from Raw Echo Data: The raw SAR echo data acquired from platforms 1 and 2 in a horizontal-cross configuration are processed using the BP algorithm to generate 2D complex-valued images. This step yields the images shown in
Figure 2a,b, which are initially represented in the slant-range–azimuth coordinate system.
Coordinate Transformation to Elevation–Azimuth System: Based on the far-field approximation, a linear mapping relationship is established to convert the slant-range dimension to the elevation dimension. This mapping enables the resampling of the original SAR images from both platforms from the slant-range–azimuth coordinates to the elevation–azimuth coordinate system, facilitating elevation-directed analysis.
Three-Dimensional Reconstruction via elevation alignment and outer product: The resampled images from platforms 1 and 2 are aligned in elevation. For each discrete elevation level, the corresponding azimuth-direction signal vectors (elevation profiles) are extracted. The core processing involves computing the outer product of these aligned profiles from the two platforms, generating a 2D matrix for each elevation level, as defined in (14). This matrix synthetically forms a 2D elevation plane, representing the joint projection signature of scatterers from distinct viewing angles. The full 3D reconstruction is synthesized by vertically stacking these matrices along the elevation dimension, resulting in the target’s 3D scattering volume depicted in
Figure 2c,d.
where
and
are defined as the aligned elevation profiles from platform 1 and platform 2, with dimensions
and
, respectively, as illustrated by the red solid lines in
Figure 2d. The corresponding elevation-plane representation at the given height is denoted as
, which has a dimension of
.
The geometric principle underlying this process is illustrated in
Figure 2d. Using platforms 1 and 2 as an example—where platform 2 flies parallel to the
Y-axis with a fixed inter-platform angle
relative to platform 1—the red solid lines represent the elevational profiles at a specified elevation level. Crucially, the red dotted lines depict the back-projection lines originating from these respective 2D image points. The intersection of these back-projection lines yields the precise 3D spatial location of target P, as annotated in the figure. This geometric relationship forms the foundation for the elevation alignment and subsequent 3D reconstruction process described in the algorithm.
The joint reconstruction formula is derived through the elevation alignment of elevation profiles from platform 1 and platform 2:
To avoid information loss, the profile spacing is set to be less than half of the resolution, thereby adhering to the following constraint:
Through the enforcement of this constraint, information loss caused by excessive profile spacing is effectively mitigated, thereby preserving the integrity of target signatures.
In dual-UAV subsystems, the geometric inversion algorithm is known to recover only the convex hull boundary of distributed targets. This boundary represents the maximum possible shape extent under such configurations. Moreover, ghost scatterers and true scatterers often exhibit similar backscatter magnitudes under this reconstruction framework. This fundamental constraint motivated the development of our two-stage reconstruction approach, with dual-UAV processing intentionally employed as the preliminary stage to establish initial spatial constraints. Building upon this foundation, the basis transformation-based multi-aspect fusion technique is applied using additional platforms to resolve ambiguities.
4. Multi-Platform Fusion Algorithm Based on Basis Transformation
A base transformation-driven fusion framework is proposed to resolve coordinate system inconsistencies between each dual-UAV subsystem in this section. Through this approach, coordinate alignment and data fusion are performed, which enhances geometric precision. The framework is particularly effective for horizontal-cross configurations operating in non-orthogonal observation scenarios.
4.1. Multi-Aspect Data Fusion
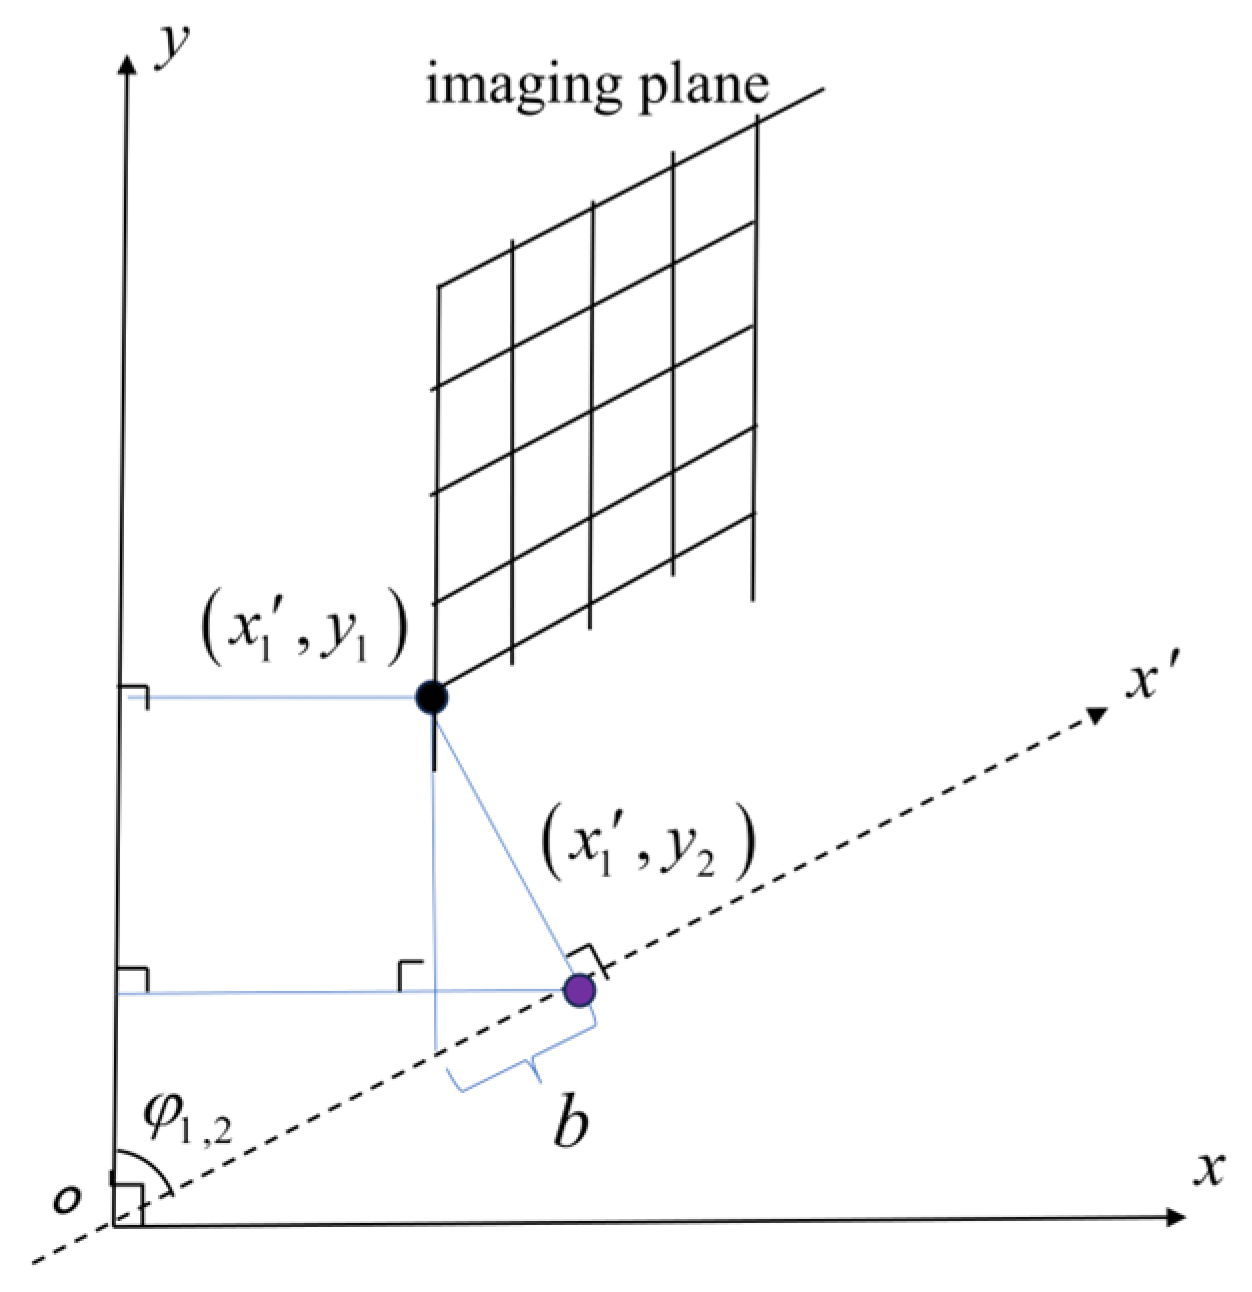
The point cloud data obtained from independent observations of each dual-UAV subsystem are located in a local oblique coordinate system (see
Figure 3). The oblique coordinate system is constructed using the trajectory of platform 1 as the X′-axis and the trajectory of platform 2 as the Y′-axis. The local coordinates of target P, denoted as
in this system, require mapping to the global Cartesian coordinate system
prior to data fusion.
The imaging plane is projected onto the
X-Y plane to facilitate visualization of the basis transformation principle, as illustrated in
Figure 3.
In the oblique coordinate system, the black dot represents the location of the complex-valued image origin . Its projection onto the X′-axis is indicated by the purple dot . The translation between coordinate systems is described by matrix , while is the position of the complex-valued image origin in the Y-axis of the Cartesian coordinate system.
The transformation matrix from the oblique to the Cartesian system is [
28]
The offset vector
b compensates for origin misalignment
where variable
denotes the projection of the oblique origin onto the global
Y-axis.
The global coordinate mapping is
Before fusion, it is necessary to unify the point cloud data of each dual-UAV subsystem to the global coordinate system. Taking the observation data of platforms 1 and 2 as an example, the reprojection formula for point P is
However, limited spatial sampling induces ghost targets in the azimuth dimension, leading to geometric distortion of targets. For scenarios involving multiple scattering centers
, denoted as
, this paper analyzes the reconstruction performance using platforms 1 and 2 as representative cases
4.2. Analysis and Suppression of Ghost Targets
The position of each scattering center,
, is defined in the global Cartesian coordinate system as
. In the dual-platform configuration (platforms 1 and 2), the reconstruction output is given by (22), which involves a double summation. When
, cross-terms arise from the product of the x-direction response from scattering center
and the y-direction response from scattering center
. These cross-terms are responsible for generating ghost targets, as illustrated by the red points in
Figure 4, in contrast to the true targets marked in blue. The ghosting effect is primarily caused by limited spatial sampling in the horizontal plane under limited observation perspectives.
Focus is placed on the cross-term-induced ambiguities arising from the double summation in (22). Consequently, the azimuthal magnitude component of (22) is isolated for analysis, which is reduced to:
To mitigate the ghost targets generated in dual-UAV subsystems, the incorporation of a third UAV is proposed. Ghost targets manifest at different spatial locations across various dual-UAV subsystems, whereas the positions of true targets remain consistent. By integrating measurements from multiple dual-UAV subsystems, the ghost targets can be suppressed. True targets maintain consistent backscatter across all pair configurations, while ghost responses—which may be prominent in only one pair—are significantly attenuated through multi-pair data fusion. The addition of a third UAV enhances this suppression by providing additional dual-UAV subsystems, further reducing the presence of ghost targets.
Introducing the third platform (platform 3, with the angle
φ2,3 with platform 2), whose reprojection data are:
When the multiplicative combination is conducted in a global Cartesian coordinate system, this operation preserves the high backscattering magnitude at true target locations. Simultaneously, ghost artifacts produced by different dual-UAV subsystems are effectively suppressed. Therefore, the global fusion result is a geometric mean of the data from each platform:
The proposed ghost target mitigation strategy is achieved through a multi-aspect data fusion framework, underpinned by basis transformation theory. As the number of observational aspects increases, ghost targets—exhibiting different position shifts across different dual-UAV subsystems—are suppressed during multiplicative fusion within a global Cartesian coordinate system. In contrast, true targets maintain both positional invariance and persistent backscattering magnitude across all dual-UAV subsystems. The suppression effect arises from the incoherent aggregation of magnitudes, where outliers (ghosts prominent in only a few dual-UAV subsystems) are attenuated by the consistent contributions across multiple baselines. Consequently, the reconstruction result asymptotically converges toward the true target with an increasing number of platforms and aspects.
This convergence behavior finds a conceptual parallel in the principle of shape reconstruction from projections in computer vision [
31]. Analogously, accurate reconstruction of the target can, in theory, be achieved using a minimum of three UAVs. To realize in practice and minimize informational redundancy, the trajectories must be optimized to ensure that the bistatic observations acquired by the dual-UAV subsystems are diverse and complementary.
4.3. Spatial-Domain Resolution Analysis
In remote sensing signal processing, the sinc function is widely used as the impulse response or interpolation kernel of an ideal band-limited system. When multiple sinc functions with different bandwidths are multiplied in combination, their combined resolution properties must be explicitly characterized through time-frequency analysis.
The multiplication of
I sinc terms along the z-direction results in the following expression:
Resolution is typically defined as the reciprocal of the time-domain mainlobe width (distance between the first zeros). For a single
, the first zeros occur at:
The zeros of
are determined jointly by the zeros of all constituent sinc functions. Due to the multiplicative nature, the first zero position occurs at the smallest zero position among all sinc functions:
The minimum major flap width of the joint function is the minimum major flap width of the single sinc signal, the resolution is directly related to the minimum major flap width, and the major flap energy within the joint function is more concentrated than that of the single sinc signal, so the following relationship can be obtained:
The theoretical framework achieves optimal accuracy at the scene center, with the imaging plane dimensions constrained by (11) to limit elevation estimation errors. Crucially, the constraint defined in (11) ensures that the maximum elevation displacement remains within half the elevation resolution cell (i.e., ). Consequently, any targets within this bounded area reside within the same elevation resolution cell, thereby preserving the validity of the subsequent simplified analysis for system evaluation.
The x- and y-direction functions are analyzed using platforms 1, 2, and 3 as representative cases. Without loss of generality, the following analysis focuses on the x-direction, as the system configuration exhibits symmetry in both directions. For dual-UAV subsystems, the x-direction function can be described as follows:
The corresponding x-resolution is determined by:
To facilitate analytical tractability, all platforms are assumed to be paired with platform 2. After K fusion operations, the joint function in the x-direction is formulated as
where K + 1 denotes the total number of platforms.
This analysis demonstrates that the resolution in horizontal-cross configurations of SAR is governed not only by signal bandwidth but also by variations in the trajectory intersection angles
. The x-direction function is expressed analogously to z-direction function, and its resolution is derived following the same procedure as z-direction function; consequently, the relationship between the x-resolution and the inter-platform configurations is given in
This formula shows that the single-platform resolution limit can be pushed by optimizing the distribution of viewing angles under the platform.
5. Simulation Experiments and Analysis
To validate the effectiveness and superiority of the proposed SAR 3D reconstruction algorithm under the horizontal-cross configurations, numerical simulations are conducted and comparative analyses with TomoSAR-based 3D imaging methods are systematically performed [
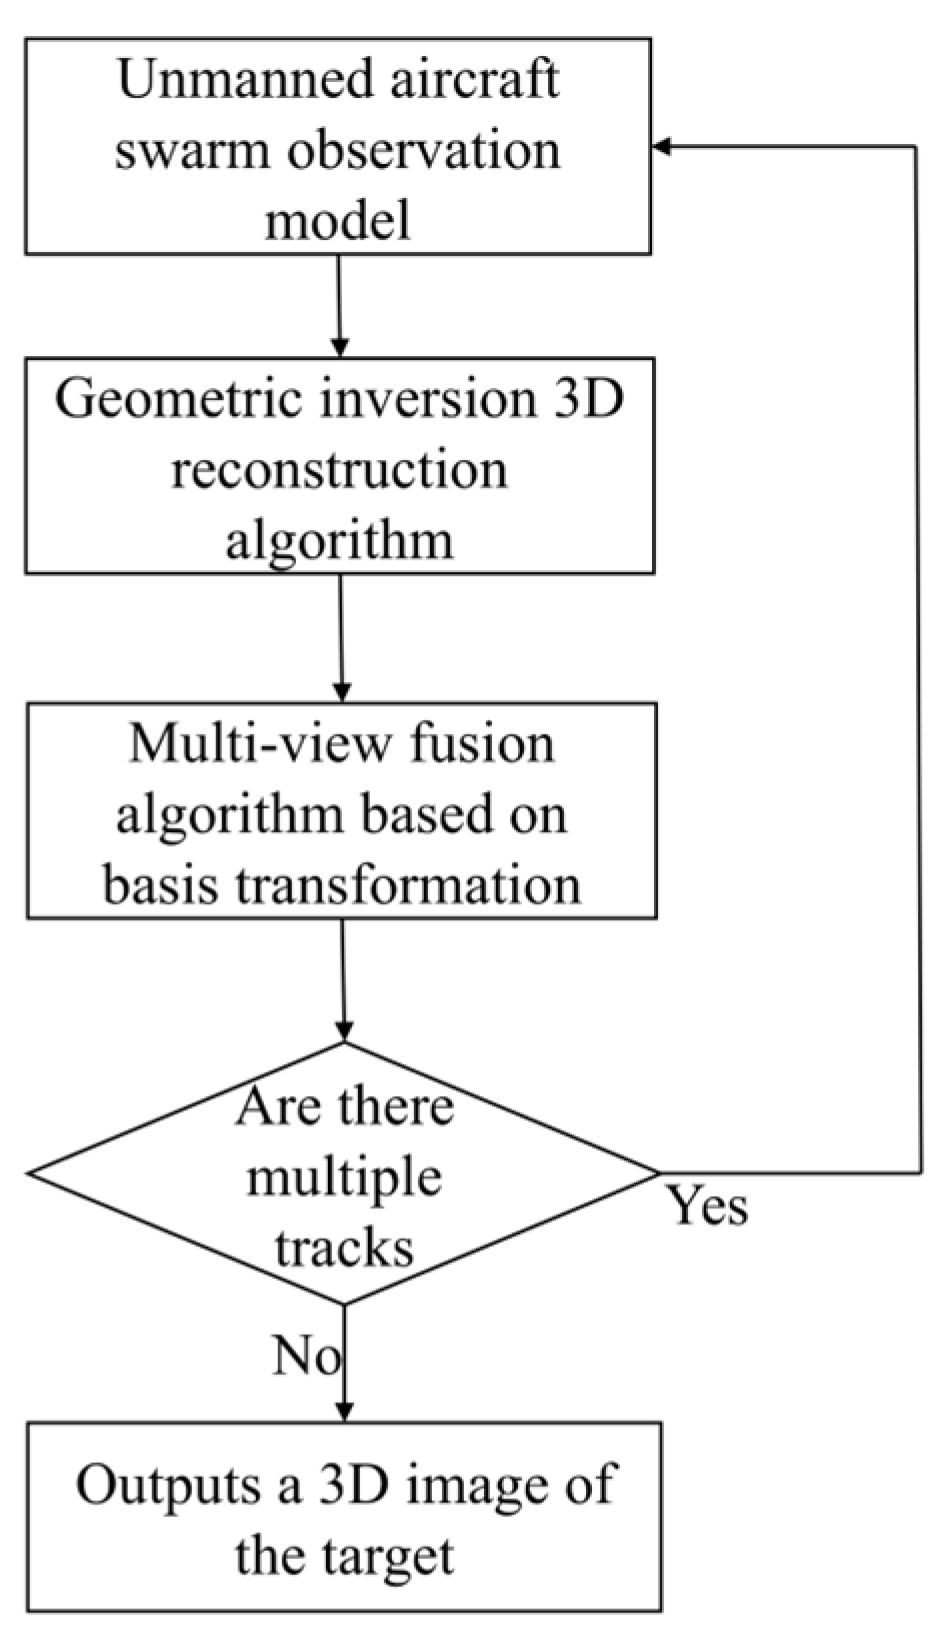
21]. These experimental results provide empirical evidence for the practical implementation potential of the proposed technique, and with the imaging workflow detailed in
Figure 5.
5.1. Experimental Verification of 3D Simulation
To validate the effectiveness of the horizontal-cross configuration-based distributed SAR 3D imaging algorithm, numerical simulation data verification is performed. In the simulation experiment, each UAV platform autonomously transmits and receives signals without interference from other UAVs, while all platforms follow linear trajectories. The experimental parameters are listed in
Table 1.
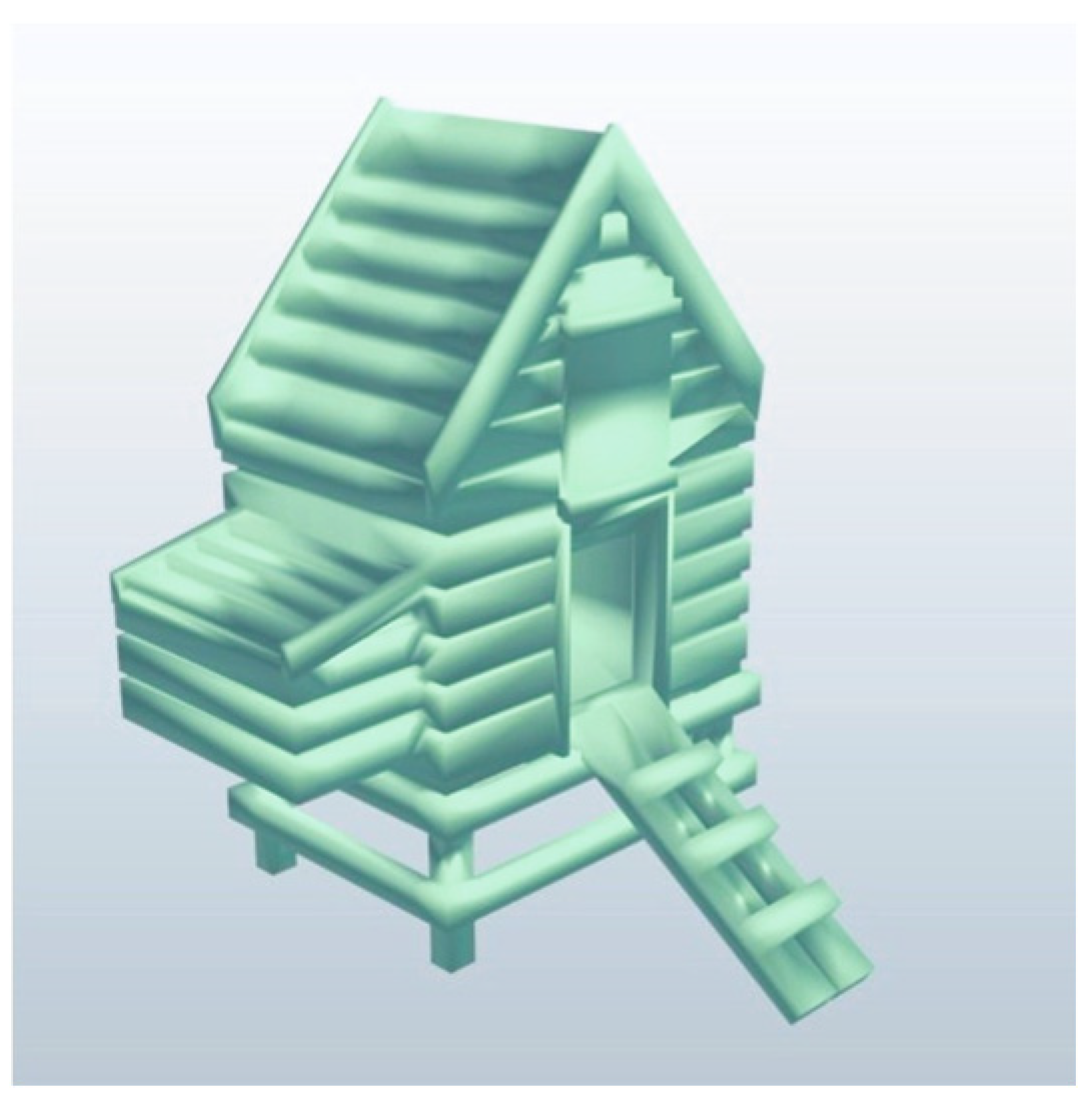
A small wooden house model was selected as the scattering target to emulate typical architectural structures and to evaluate the algorithm’s capability in reconstructing complex targets with multiple scattering centers, as illustrated in
Figure 6. To ensure consistent experimental conditions, each radar platform was configured with a look-down angle of 20°, a synthetic aperture length of 300 m, and a speed of 30 m/s. The radar 2D complex-valued images were generated using the BP algorithm, which were then processed by the proposed geometric inversion algorithm for 3D reconstruction.
The performance of the dual-platform (platform 1 and 2) subsystem is first presented in
Figure 7.
Figure 7a depicts the simulation geometry, including the platform’s flight trajectory as indicated in the legend, while
Figure 7b shows the equally spaced sampled scattering point model. The corresponding 2D SAR images obtained by platform 1 and platform 2 are presented in
Figure 7c and
Figure 7d, respectively. The resultant 3D reconstruction, achieved without base coordinate transformation due to the orthogonal baseline, is shown in
Figure 7e. This result successfully retrieves the target’s primary structure but reveals inherent limitations of the two-platform configurations.
To overcome these limitations, a third platform (platform 3) with a non-orthogonal trajectory was introduced. Its data required projection into the global Cartesian coordinate system prior to fusion with the result from
Figure 7e.
The integrated 3D imaging result from this multi-aspect fusion is presented in
Figure 8. This result demonstrates a significant enhancement, confirming that the proposed base transformation-driven fusion framework effectively overcomes the constraints of the two-platform system and the strict trajectory orthogonality requirement. This validates the robustness and applicability of the method for imaging complex targets.
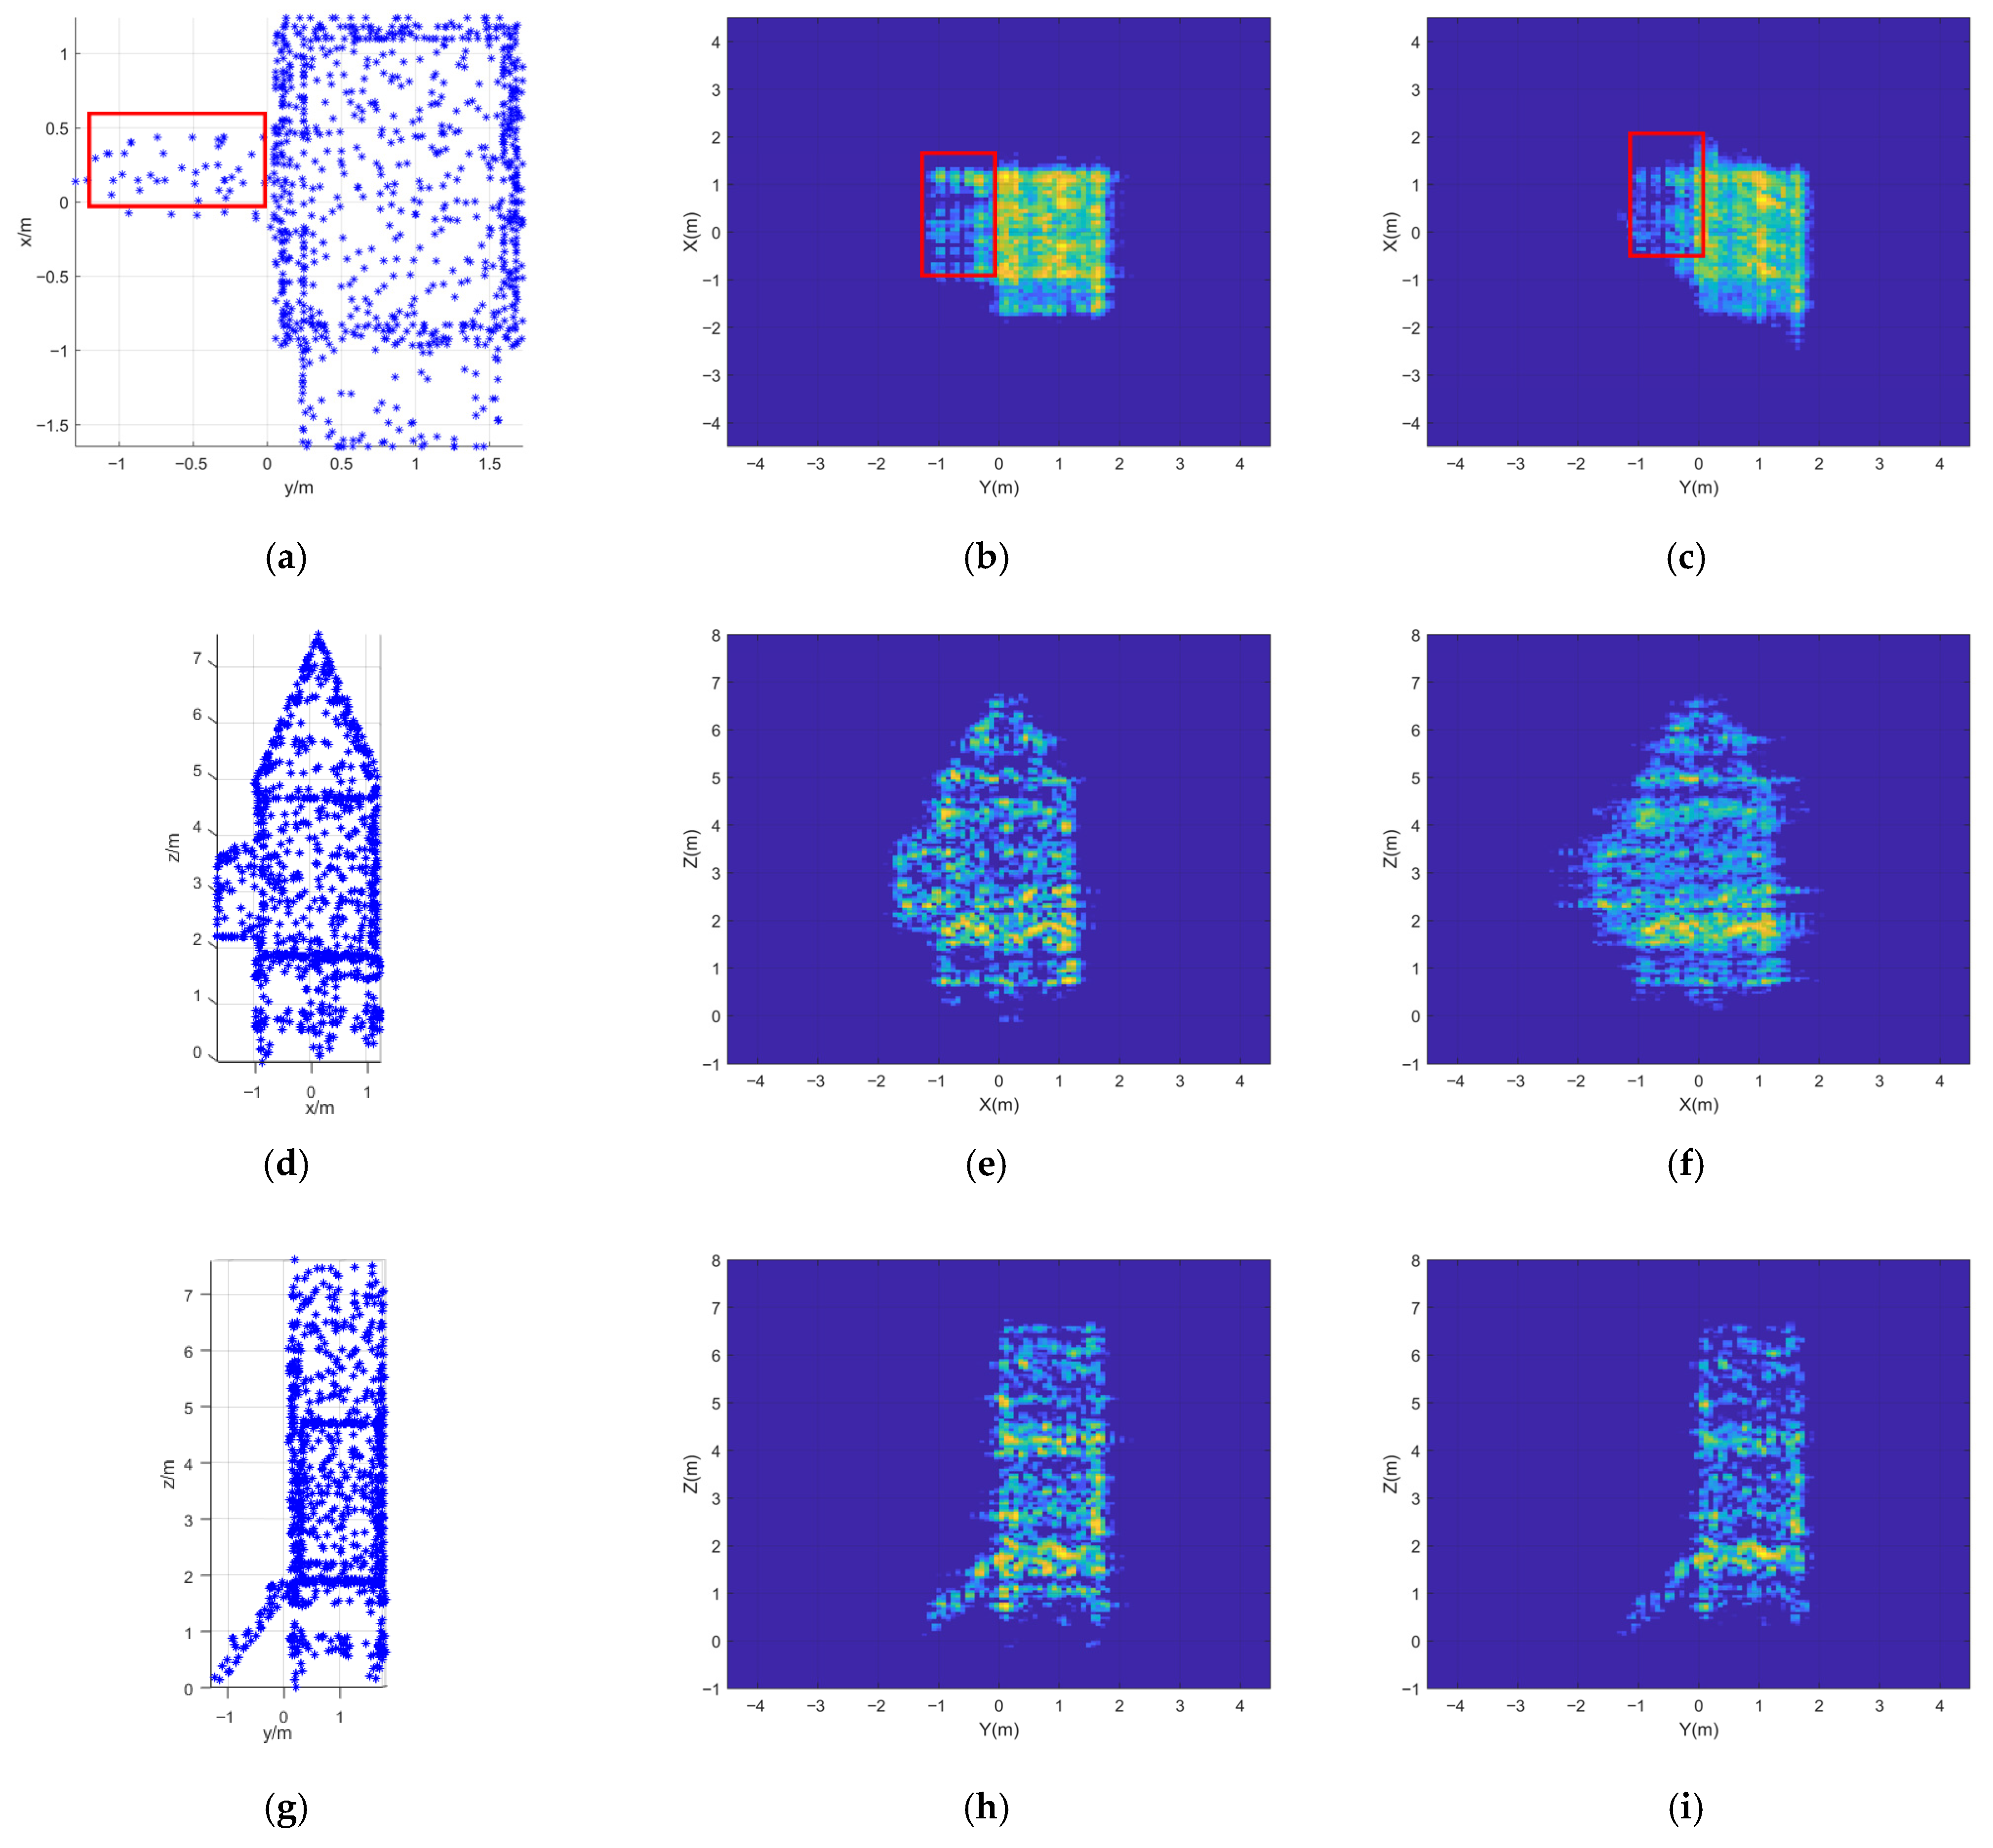
A comparative analysis of the reconstruction accuracy is quantitatively detailed in
Figure 9. The results clearly show that the three-platform reconstruction exhibits closer agreement with the ground truth compared to the two-platform result. This improvement is attributed to the acquisition of richer scattering center information from multiple aspects, which reduces geometric distortions. This is exemplified by the more accurate positioning of the staircase structure (marked by red boxes in the X-Y projection). In the two-platform result [
Figure 9b], the staircase is located between 2 m and 4.5 m along the
X-axis, while the three-platform result [
Figure 9c] narrows this range to 3 m–4.2 m, yielding a significant improvement in localization accuracy.
Furthermore, the enhancement in imaging quality was quantitatively assessed by calculating the complex-valued image entropy on each projection plane. The complex-valued image entropy calculation formula is as follows.
where a small value of eps, 10
−10, is added to calculate the entropy to avoid the calculation of log(0).
and
are the positions of the pixel points in the complex-valued image,
and
are the length and width of the complex-valued image, respectively, and
is the ratio of the energy of a single pixel point to the total energy of the complex-valued image, which is defined as:
where
is the individual pixel point energy.
The 3D reconstruction results from platform 1 and platform 2 are characterized by image entropy values of 3.0225, 3.4545, and 3.2068 in the [
31] projection planes, respectively. Improved entropy metrics of 3.0227, 3.3156, and 3.2575 are observed in the corresponding projection planes for the reconstruction results from platform 1, platform 2, and platform 3. Although the entropy values of the 3D reconstruction results from both sets of platforms are closely matched, superior reconstruction accuracy is exhibited by the latter in this context.
Microwave simulation data are further used to verify the reliability of the above imaging method. The microwave simulation parameters are shown in
Table 1 above, the platforms used are platform 1 and platform 2, and the point target positions are (0,2,0), (0,-2,0) and (0,0,1), and the results of the microwave simulation and numerical simulation are shown in
Figure 10 and
Figure 11.
The robustness of the algorithm is verified by microwave simulation data, and the results show that it is highly consistent with the numerical simulation results, which side by side confirms the effectiveness of the algorithm.
5.2. Performance Evaluation
TomoSAR is a well-established pivotal methodology for 3D reconstruction, utilizing multi-baseline observations to achieve superior elevation resolution. This section presents a rigorous comparative analysis between the proposed horizontal-cross SAR imaging technique and conventional TomoSAR. The comparison is conducted under identical system parameters (see
Table 2) to impartially evaluate their performance, algorithmic efficiency, and computational cost, providing critical insights for selecting optimal 3D imaging architectures in resource-constrained scenarios.
To rigorously compare the performance disparities between TomoSAR 3D imaging algorithms and horizontal-cross configuration-based SAR 3D reconstruction methods, key system parameters are maintained identically, with only the number of passes varied. In the numerical simulation, all point targets are positioned at (0,0,0), and both configurations adopt a side-looking geometry.
To enable systematic performance comparison of 3D reconstruction algorithms for horizontal-cross SAR configurations, the TomoSAR imaging framework was implemented with three distinct elevation dimension imaging approaches: the multiple signal classification (MUSIC) [
32], the CBF algorithm [
33], and the Iterative Adaptive Approach (IAA) [
34,
35].
The elevation reconstruction for the proposed framework is derived from the following equation, under the condition of a target at the scene center:
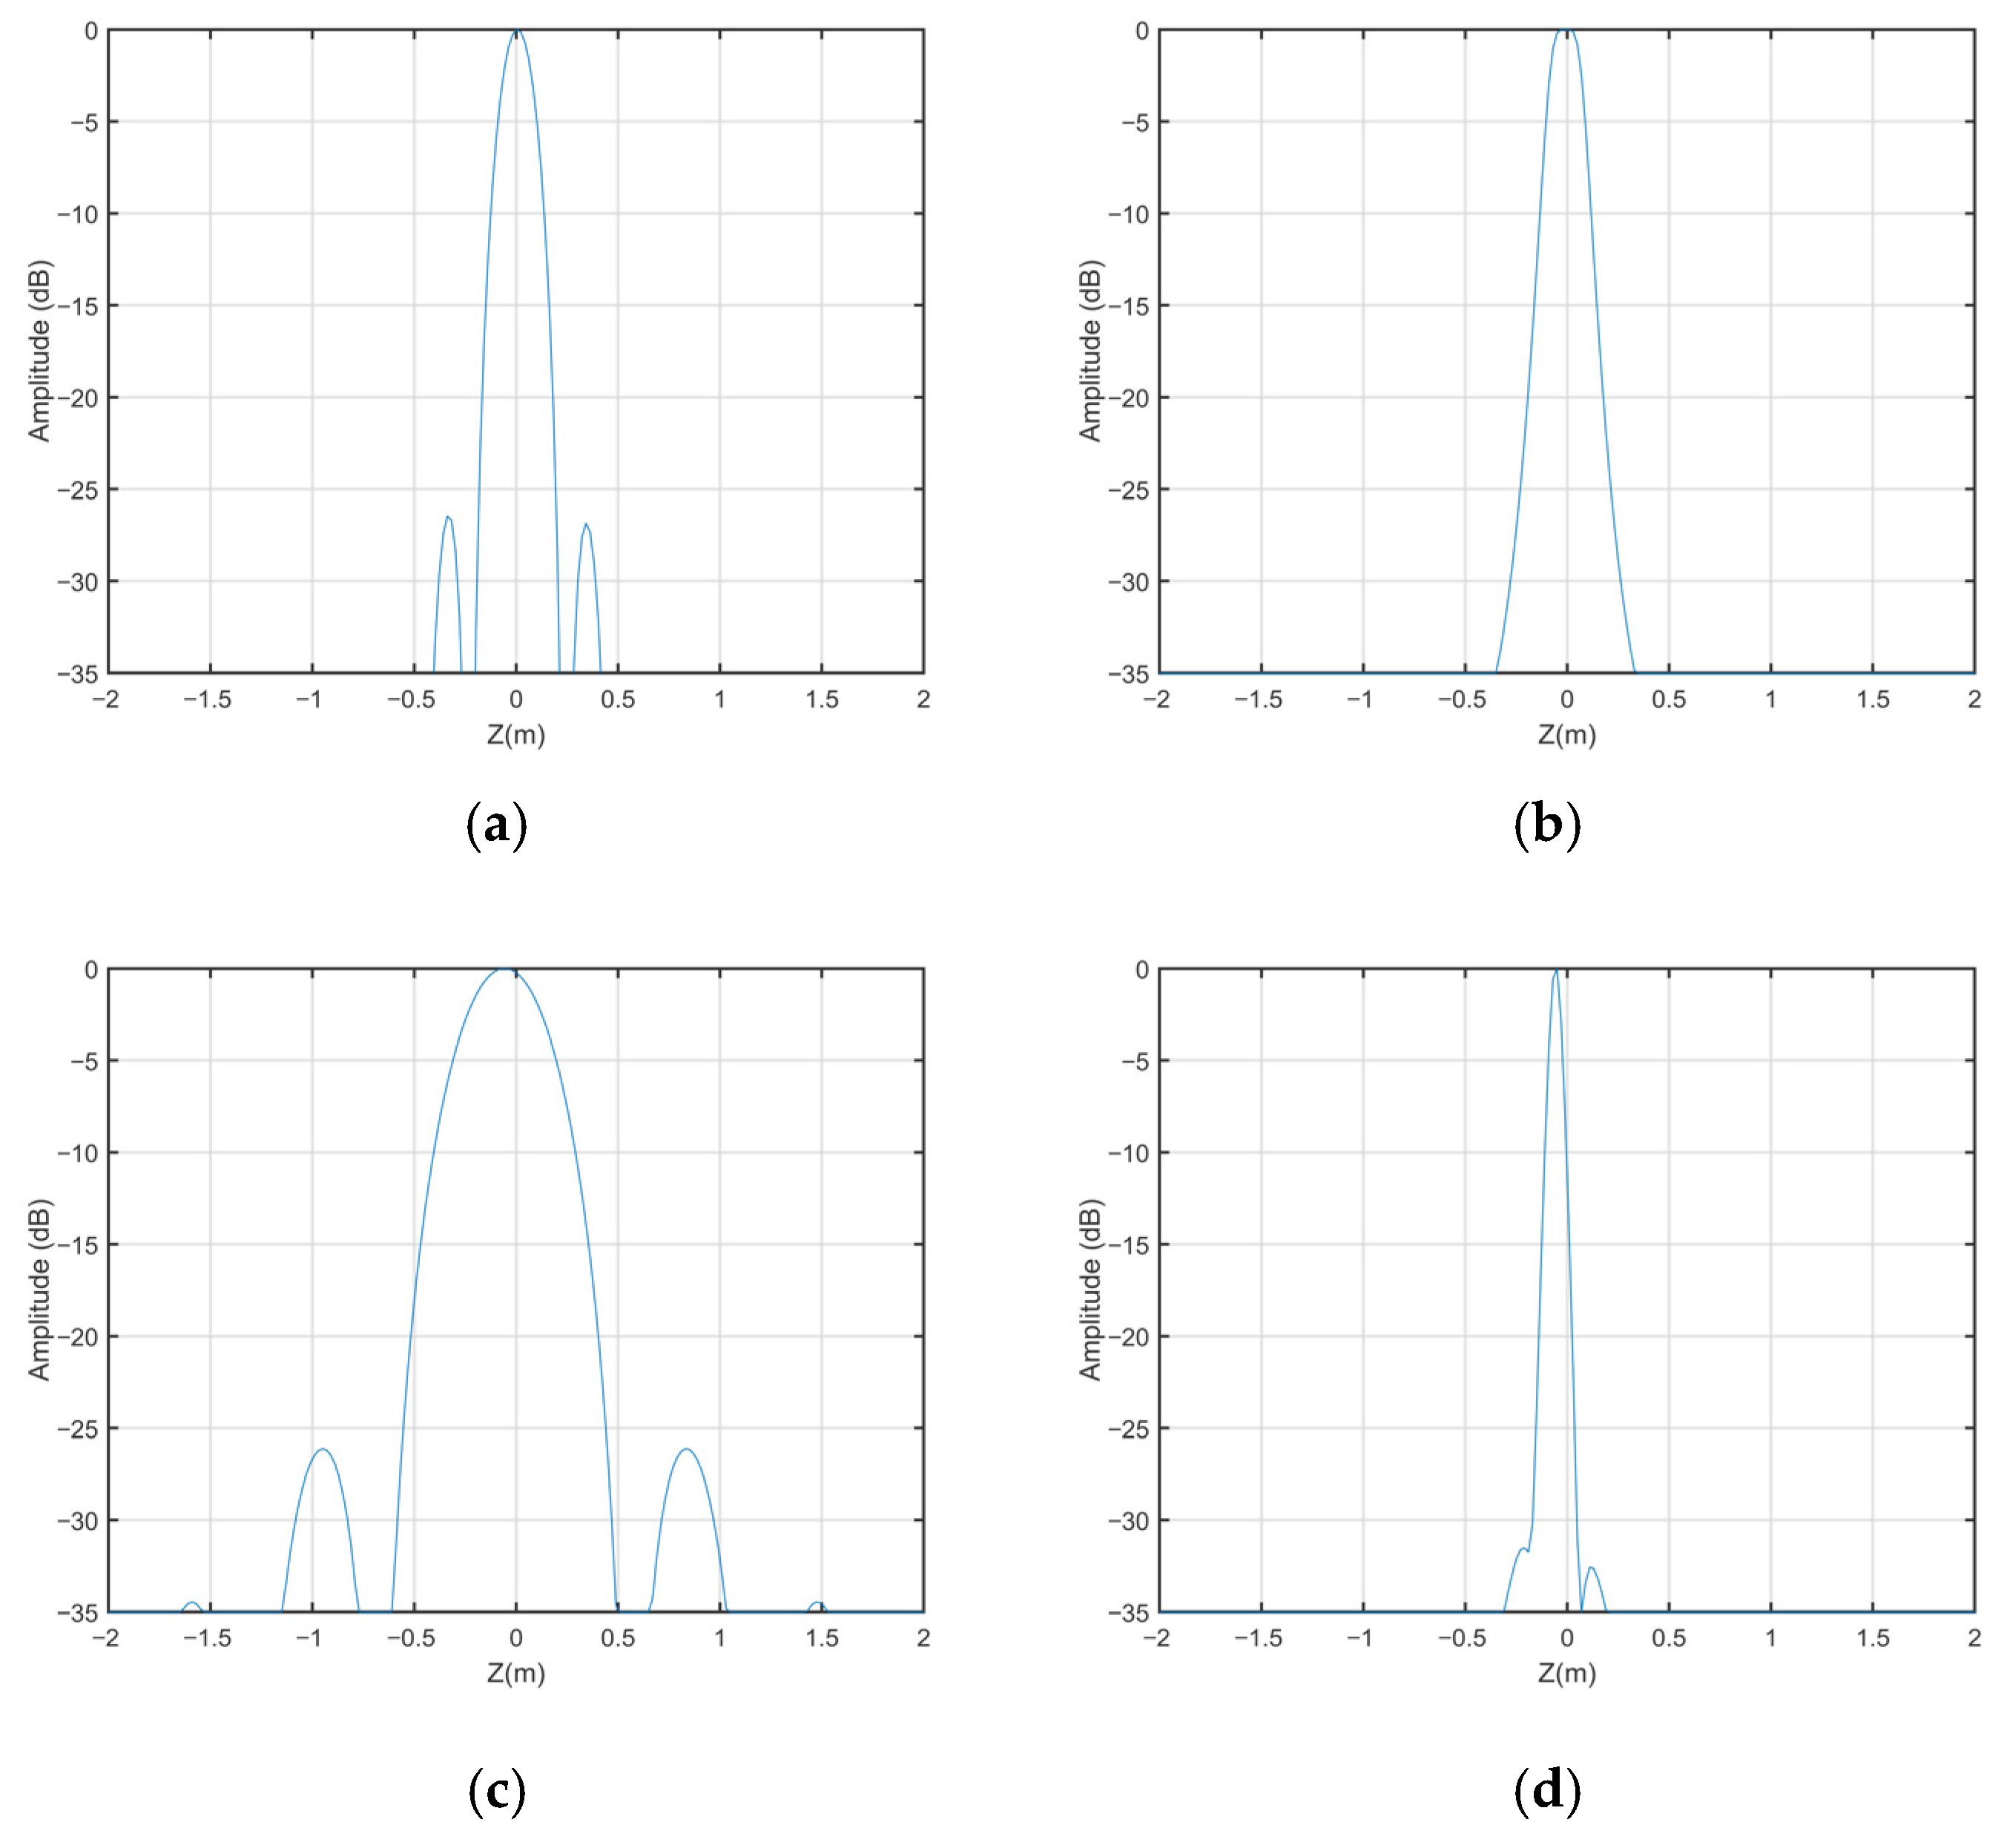
where the 3 dB width of 0.6368 in the elevation direction is obtained by solving the dual-sinc joint function using Newton’s method. Using the simulation parameters provided in
Table 2, the theoretical elevation resolution is calculated as 0.1500 m through substitution into (36). Quantitative results for both resolution and computational efficiency are summarized in
Table 3.
The experimental results provided in
Table 3 confirm that the proposed SAR 3D reconstruction algorithm, which is based on a horizontal–orthogonal baseline configurations, achieves a 1.7-fold improvement in elevation resolution (0.1498 m compared to 0.3972 m) and a 63% reduction in computational time (8.5918 s compared to 23.5841 s) relative to the conventional beamforming (CBF) method, while maintaining imaging fidelity. Although the IAA is measured at 0.0545 m resolution, this high precision is accompanied by prohibitive computational demands (643.4435 s), limiting its practical utility. Notably, the MUSIC algorithm yields elevation resolution of 0.1637 m–closest to the proposed method’s 0.1498 m–yet requires 9.2× longer processing time (87.5040 s vs. 8.5918 s). The reconstructed elevation profiles corresponding to these metrics are visualized in
Figure 12.
Theoretically, this enhanced accuracy stems from the unique geometric configuration of the horizontal-cross configurations, which improves target localization through multi-platform perspectives. This leads to a finer effective resolution, as the mainlobe width of the joint function is minimized, concentrating energy more effectively than individual sinc signals. A significant reduction in computational time is demonstrated by the proposed algorithm in terms of resource efficiency and processing requirements, compared to conventional methods. In traditional TomoSAR, multiple flight tracks are typically employed to achieve sufficient elevation resolution, which results in the generation of a large volume of redundant echo data and increased processing overhead. For instance, high computational complexity is exhibited by the MUSIC algorithm, dominated by O(N3) operations due to eigen-decomposition steps. In contrast, the proposed approach, based on a horizontal-cross configuration, utilizes only two flight tracks, thereby minimizing data redundancy and avoiding computationally intensive matrix operations. Efficient 2D processing and outer-product-based fusion are leveraged in this method, with a computational complexity of O(N2), and iterative solvers are avoided. This accounts for the observed 63% reduction in processing time relative to CBF (8.5918 s vs. 23.5841 s) and the 9.2-fold speedup over MUSIC (8.5918 s vs. 87.5040 s). The theoretical analysis is aligned with the empirical results, confirming the algorithm’s practicality for large-scale or real-time applications under resource constraints.
6. Discussion
The above derivation of the elevation-dimensional joint function is based on the assumption that the offset in the elevation direction is small. However, in practice, the elevation alignment contains certain errors due to factors such as a wider distribution of targets, which results in an excessively large imaging plane and causes blurring in elevation-directed imaging. These errors are influenced by multiple parameters, including the look-down angle, platform altitude, and the distance between the platform and the target. For analysis, the parameters from
Table 1 are utilized, and the error offset curves for elevation alignment between different points in the plane can be expressed as follows (37). When the platform parameters are consistent, as in this study, the error magnitude increases, with larger look-down angles. This error curve directly leads to degradation in imaging quality. Additionally, preliminary theoretical research is being conducted to mitigate these errors, with a focus on algorithmic optimization and calibration techniques.
where
denotes the elevation alignment, the variables
and
denote the altitudes of platform 1 and platform 2, respectively.
Through joint function analysis, it is demonstrated that imaging quality maintains consistency under identical elevation alignment error offset curves, which are intrinsically linked to spatial variations in the imaging geometry. This results in space-varying characteristics of the elevation resolution in the horizontal-cross configurations SAR 3D reconstruction algorithm. However, these offset curves can be exacerbated by UAV flight instability, leading to increased elevation measurement errors. When significant, such errors cause misalignment of scattering points within the same elevation layer and are further amplified in the 3D reconstruction results. This represents a key limitation of the proposed approach. For future work, strategies to mitigate these errors are planned to be investigated, such as the development of advanced image registration techniques or the incorporation of error compensation methods using the acquired SAR images to improve alignment accuracy and reconstruction reliability.
Ghost images are generated under limited spatial sampling conditions with a limited number of dual-UAV subsystems. As more subsystems are incorporated, data fusion is conducted via the multi-platform fusion algorithm based on basis transformation. The misalignment of ghost images resulting from different radar combinations leads to suppression of their magnitude after fusion. Consequently, the reconstructed imagery converges toward the true scene as the number of observation perspectives grows. Nonetheless, trajectory optimization remains an unresolved issue for attaining the highest 3D imaging accuracy with minimal cost in such configurations.
In this study, the small wooden house model was selected for simulation as a representative example of man-made structures commonly encountered in disaster scenarios, such as residential buildings in earthquake- or flood-prone areas. This choice allows us to validate the geometric reconstruction capabilities of the proposed method under controlled conditions, focusing on the flexibility of horizontal-cross configurations despite the simplification of scattering properties. For practical applications in topography and disaster monitoring, the method is recommended for objects including urban structures, where high-resolution 3D imaging is critical. Based on the geometric precision achieved in simulations, resolutions in the range of 0.1–0.5 m are suggested to capture essential details for tasks such as damage assessment and terrain change detection. While the current simulation does not account for variations in scattering characteristics, this approach provides a foundational framework for future work incorporating more complex RCS models to enhance realism.
