Article

Automated Detection of Embankment Piping and Leakage Hazards Using UAV Visible Light Imagery: A Frequency-Enhanced Deep Learning Approach for Flood Risk Prevention

1
National Institute of Natural Hazards, Ministry of Emergency Management of the People’s Republic of China, Beijing 100085, China
2
University of Chinese Academy of Sciences, Beijing 100049, China
3
Flood Emergency Rescue Technology and Equipment Co-Innovation Lab, Ministry of Emergency Management, No. 1 Building, No. 28, Xiangjun North Lane, Chaoyang District, Beijing 100020, China
*
Author to whom correspondence should be addressed.
Remote Sens. 2025, 17(21), 3602; https://doi.org/10.3390/rs17213602 (registering DOI)
Submission received: 24 August 2025 / Revised: 25 October 2025 / Accepted: 27 October 2025 / Published: 31 October 2025

Highlights

What are the main findings?
  • EmbFreq-Net achieves 77.68% mAP@0.5 for embankment hazard detection, outperforming the baseline by 4.19 percentage points while reducing computational cost by 27.0% and parameters by 21.7%.
  • Frequency-domain dynamic convolution enhances detection sensitivity to subtle piping and leakage textural features by 23.4% compared to conventional spatial convolution methods.
What is the implication of the main findings?
  • Edge computing deployment enables real-time monitoring and early warning systems, facilitating rapid on-site verification by personnel and supporting timely emergency decision-making for embankment safety management.
  • The 23.4% improvement in detecting subtle piping and leakage textural features provides a cost-effective and more accurate embankment detection algorithm, promoting widespread adoption and better supporting emergency decision-making processes.

Abstract

Embankment piping and leakage are primary causes of flood control infrastructure failure, accounting for more than 90% of embankment failures worldwide and posing significant threats to public safety and economic stability. Current manual inspection methods are labor-intensive, hazardous, and inadequate for emergency flood season monitoring, while existing automated approaches using thermal infrared imaging face limitations in cost, weather dependency, and deployment flexibility. This study addresses the critical scientific challenge of developing reliable, cost-effective automated detection systems for embankment safety monitoring using Unmanned Aerial Vehicle (UAV)-based visible light imagery. The fundamental problem lies in extracting subtle textural signatures of piping and leakage from complex embankment surface patterns under varying environmental conditions. To solve this challenge, we propose the Embankment-Frequency Network (EmbFreq-Net), a frequency-enhanced deep learning framework that leverages frequency-domain analysis to amplify hazard-related features while suppressing environmental noise. The architecture integrates dynamic frequency-domain feature extraction, multi-scale attention mechanisms, and lightweight design principles to achieve real-time detection capabilities suitable for emergency deployment and edge computing applications. This approach transforms traditional post-processing workflows into an efficient real-time edge computing solution, significantly improving computational efficiency and enabling immediate on-site hazard assessment. Comprehensive evaluations on a specialized embankment hazard dataset demonstrate that EmbFreq-Net achieves 77.68% mAP@0.5, representing a 4.19 percentage point improvement over state-of-the-art methods, while reducing computational requirements by 27.0% (4.6 vs. 6.3 Giga Floating-Point Operations (GFLOPs)) and model parameters by 21.7% (2.02M vs. 2.58M). These results demonstrate the method’s potential for transforming embankment safety monitoring from reactive manual inspection to proactive automated surveillance, thereby contributing to enhanced flood risk management and infrastructure resilience.

1. Introduction

Embankments constitute critical flood prevention infrastructure, whose structural integrity directly determines the effectiveness of flood control. Constructed primarily from earth and stone materials [1,2,3], these structures remain vulnerable to piping, leakage, and seepage phenomena that can precipitate catastrophic breaches during flood events. Statistical evidence from multiple regions demonstrates that piping and leakage contribute to approximately 30% of embankment damage incidents [4,5] and account for over 90% of embankment failures [4,6,7]. When piping-induced breaches occur, embankment failure can progress within hours if not promptly addressed [1,2], resulting in casualties, property damage, and widespread social disruption. Consequently, early detection and intervention for embankment hazards represent a fundamental requirements for flood safety management. Given that the critical time window for effective intervention is typically 2–6 h after initial hazard development, rapid automated detection becomes essential for preventing catastrophic failures and protecting downstream communities.
Traditional detection methodologies include manual inspection and instrumental approaches, each with distinct limitations. Manual detection, while still widely utilized in practice [5,8], poses significant safety risks and exhibits limited operational efficiency. Instrumental methods fall into four primary categories: surface geophysical techniques (such as resistivity detection [9,10,11], ground-penetrating radar [12], electromagnetic methods [13]), underwater detection systems, subsurface fiber optic monitoring [14], and aerial surveillance platforms. However, these approaches face deployment constraints such as demanding accessibility, pre-installation requirements, and performance degradation during emergency conditions. Most critically, traditional methods require days for comprehensive assessment, whereas emergency response decisions must be made within hours, creating a fundamental mismatch between detection capabilities and operational requirements.
The integration of artificial intelligence into infrastructure monitoring has fundamentally transformed our approach to safety assessment and risk management. Recent advancements have shifted the field from traditional sensor-based monitoring to comprehensive smart systems that integrate multiple data sources and advanced analytical capabilities [15]. Notable examples include smart dam automation systems employing deep learning for structural health assessment, where high-precision YOLOv5-based crack detection has been demonstrated [16], and vision-guided underwater inspection systems that deliver 98.6% precision at 68 FPS [17]. This technological evolution aligns with broader progress in geotechnical monitoring and disaster risk reduction, where remote sensing capabilities now support proactive infrastructure management and early warning systems essential for enhancing climate resilience. These achievements highlight the significant potential of AI-enhanced approaches to transform infrastructure safety management from a reactive to a predictive paradigm.
Within the context of AI-driven infrastructure monitoring, aerial detection platforms have emerged as particularly promising solutions for embankment safety assessment. Among the available aerial detection modalities, visible light systems offer significant advantages over thermal infrared alternatives. While thermal detection effectively identifies temperature anomalies [8,18], visible light systems provide superior cost-effectiveness, enhanced spatial resolution, and rich spectral information suitable for advanced computer vision algorithms [19,20]. RGB imagery captures diverse visual features—such as texture variations, color gradients, and spatial patterns—that enable deep learning models to develop sophisticated discriminative features for hazard identification.
Despite these technological advances, visible light-based embankment hazard detection remains critically underexplored, representing a significant gap in cost-effective, weather-independent monitoring solutions essential for widespread deployment. This presents several key challenges: (1) hazard signatures exhibit lower contrast compared to infrared manifestations, necessitating enhanced feature extraction methodologies; (2) variable illumination conditions compromise detection consistency; (3) limited emergency response datasets constrain comprehensive model development; and (4) complex surface textures increase false positive rates. Furthermore, while frequency domain enhancement techniques have demonstrated exceptional performance in infrared small target detection [21,22] and remote sensing applications [23], their application to visible light embankment monitoring remains unexplored, presenting a novel research direction. Addressing this research gap is crucial for developing cost-effective, highly reliable, and weather-independent detection systems suitable for real-time emergency deployment. To tackle these challenges, this study introduces the Embankment-Frequency Network (EmbFreq-Net), a frequency-enhanced deep learning architecture specifically designed for UAV-based embankment hazard detection using visible light imagery. The primary contributions include the following:
  • An Integrated Architecture for Embankment Safety Applications: This study presents a lightweight detection architecture tailored for addressing the inherent challenges of embankment inspection. The architecture comprises four core modules: the Local Frequency Enhancement Module (LFE Module), a frequency-enhanced backbone designed to extract subtle hazard features; the Multi-Scale Intrinsic Saliency Block (MSIS-Block), a multi-scale attention module that captures spatial correlations and structural information across scales; the Multi-Scale Frequency Feature Pyramid Network (MFFPN), a frequency-aware feature fusion neck that preserves high-frequency details during multi-scale fusion; and the Multi-Scale Shared Detection Head (MSSDH), a scale-invariant shared detection head. This design offers an end-to-end solution optimized for embankment hazard identification.
  • Dynamic Frequency-Domain Feature Extraction: To address the challenge of faint hazard features (e.g., seepage and piping) in visible light imagery being conflated with background textures, this research develops dynamic frequency-domain modeling that extends beyond traditional spatial convolutions. The Local Frequency Enhancement (LFE) modules and Frequency Adaptive Fusion (FAFusion) modules utilize the Fourier transform to dynamically generate input-adaptive convolutional kernels. This approach enhances the model’s sensitivity to high-frequency textural details characteristic of embankment surface leakage by 23.4% compared to conventional spatial convolution methods. The frequency-aware mechanism improves the model’s capability to discriminate between hazard signals and background noise under varying lighting and textural conditions.
  • Performance and Efficiency Improvements: Empirical evaluations on the constructed embankment hazard dataset demonstrate that EmbFreq-Net achieves a mAP50 of 77.68%, representing a 4.19 percentage point improvement over YOLOv11n (73.49%). The model attains this performance while reducing the number of parameters by 21.7% (from 2.58M to 2.02M) and computational complexity by 27.0% (from 6.3 to 4.6 GFLOPs). These results indicate that the proposed method offers an improved accuracy-efficiency trade-off suitable for real-time deployment on UAV platforms.
This research addresses a critical infrastructure safety need, as current detection limitations contribute to preventable embankment failures that cause significant casualties and economic losses worldwide.

2. Related Works

With the advancement of deep learning technology, object detection algorithms based on Convolutional Neural Networks (CNNs) have made significant progress in image feature extraction and target recognition. Among these, the You Only Look Once (YOLO) series algorithms have been widely applied in real-time detection scenarios due to their optimal balance between accuracy and efficiency. YOLO has demonstrated effectiveness in infrastructure monitoring applications [15,16,17], making it well-suited for emergency embankment monitoring. In contrast, Faster R-CNN exhibits higher computational complexity and inference latency making it generally unsuitable for real-time UAV deployment, while RetinaNet requires substantially more computational resources than YOLO to achieve similar accuracy performance [24]. However, the internal component design of existing YOLO algorithms is primarily oriented toward general-purpose scenarios, and limitations arise when applied to domain-specific datasets, which has driven the development of enhancement techniques for YOLO-class algorithms.
In feature extraction approaches, Li et al. [25] proposed the Ghost bottleneck module to replace the bottleneck module in the original model and adopted grouped convolution instead of ordinary convolution, enabling lightweight applications for edge computing. Other authors introduced feature map attention mechanisms [26] to enhance feature extraction capabilities.
In feature fusion approaches, researchers have enhanced Feature Pyramid Network-Path Aggregation Network (FPN-PANet)-based feature fusion methods. For example, the Bidirectional Feature Pyramid Network (BiFPN) [27] replaced the concatenation method with an addition method, thereby reducing computational complexity and improving computational efficiency. Additionally, the Multi-Branch Auxiliary Feature Pyramid Network (MAFPN) [28] explored how to utilize P2 layer feature maps for small target detection and proposed a lightweight architecture tailored for this purpose.
Regarding detection heads, research on detection heads adapted to specific datasets represents an important research direction. A common approach for small target detection is to introduce P2 layer feature maps and add small target detection heads; however this increases the computational complexity of the model. Introducing lightweight attention mechanisms, such as Squeeze-and-Excitation (SE) attention [29] into detection heads is a common practice to improve detection accuracy. Recent advances in attention mechanisms have demonstrated that single feature enhancement strategies can outperform complex multi-scale fusion approaches, with Saliency Context Enhancement and temporal attention transmission mechanisms showing superior performance in feature modeling tasks [30].
Frequency-domain analysis techniques offer an alternative perspective for image feature extraction, with recent advances demonstrating exceptional capabilities in challenging detection scenarios. Adaptive frequency separation enhancement networks have achieved superior performance in infrared small target detection by decomposing images into multiple frequency components using FFT transforms [21], while spatial-frequency domain transformation approaches have attained state-of-the-art results through U-Net architectures combined with frequency domain self-attention mechanisms [22]. In remote sensing applications, frequency and spatial domain-based enhancement networks have shown significant improvements by integrating Fast Fourier Transform with Haar wavelet processing [23], effectively addressing challenges related to shadow regions, low-contrast areas, and boundary ambiguity common in infrastructure monitoring scenarios. Fast Fourier Convolution (FFC) [31] utilizes global FFT operations to capture long-range dependencies but introduces computational overhead unsuitable for real-time UAV deployment. The Discrete Fourier Transform (DFT) converts spatial domain information into a frequency-domain representation, capturing texture and periodic features in images. Recent integration of frequency-domain processing into deep learning models has enhanced the perception of subtle texture features [32,33], making this approach particularly applicable for target detection tasks relying on subtle texture changes, such as embankment leakage detection.
Dynamic convolution techniques adaptively adjust convolution kernel parameters, enabling the feature extraction process to be dynamically modified based on input features. Combining dynamic convolution with frequency-domain analysis allows for adaptive processing of different frequency components, which holds significant potential for extracting subtle visual features in embankment hazard detection.
However, in actual flood control and emergency rescue operations, conventional embankment inspection and monitoring primarily focus on identifying water outlets on the embankment slope and at its toe to detect and assess leakage risks, with the severity of the risk determined by the size and turbidity of the water outlet. Observing the swirl and turbidity of the water surface at the outlet is the most direct method for detecting leakage and piping [5]. This was also been verified during our data collection efforts.
Therefore, three key limitations can be identified in the current research:
  • Limited utilization of visual features: Existing methods predominantly rely on the infrared thermal imaging, with insufficient research on visual features of leakage and piping in visible light images.
  • Limited capability in detecting small targets: Embankment hazards often appear as small-scale targets, and existing general-purpose detection algorithms demonstrate limitations in these scenarios, despite YOLO’s proven success in similar infrastructure applications [16,17].
  • Limited texture feature extraction: Critical discriminative information related to leakage hazards often lies in subtle texture variations, which traditional convolutional methods struggle to capture effectively.
Table 1 summarizes existing embankment hazard detection methods and frequency-domain enhancement techniques across various technological categories. This systematic comparison reveals that, although significant progress has been made in thermal-based detection and general-purpose frequency enhancement, critical gaps remain in visible light embankment monitoring and task-specific frequency-domain applications for UAV deployment scenarios.
Based on the above analysis, this study explores the application of deep learning algorithms for visible light-based embankment hazard detection and proposes the EmbFreq-Net model. Utilizing techniques such as frequency-domain dynamic convolution and multi-scale frequency-domain feature fusion, this model is optimized to capture the visual characteristics of embankment piping and leakage, effectively addressing the technical gap in intelligent detection of embankment hazards using visible light.

3. Methodology

3.1. Dataset

The dataset used in this study was constructed based on data collected by drones during the flood season for embankment inspection at four locations by the National Institute of Natural Hazards. The location of the original dataset, the time of collection, and the information related to the images are shown in Table 2. The dataset included two hazard types: leakage and piping. This raw dataset contained 804 images and more than 1600 instances, among which there were approximately 1200 leakage instances and about 400 piping instances. The characteristics of this dataset include class imbalance and a relatively large proportion of small objects. The dataset was divided with 60% for training, 20% for validation, and 20% for testing.The dataset size (804 images) and class imbalance (3:1 leakage to piping ratio) present challenges common in specialized infrastructure monitoring applications where data collection is constrained by safety and accessibility factors. Additionally, the current dataset has limited geographical and seasonal diversity, with data primarily collected from temperate climate regions during specific seasonal conditions (spring and summer monitoring periods), which represents a constraint for broader generalization across different environmental conditions. To mitigate these limitations, several strategies were implemented: (1) comprehensive data augmentation including geometric transformations and environmental simulations to enhance dataset diversity; (2) the SlideLoss [34] function was specifically used to address class imbalance by dynamically adjusting loss weights based on prediction confidence.
To improve the complexity and sample size of the dataset, data augmentation was performed on the training set using albumentations [35]. Data augmentation consisted of two categories: pixel-level transforms that modify geometric properties (such as Affine transformations for rotation and scaling, and various flipping operations), and spatial-level transforms that simulate environmental conditions (such as ISONoise for camera sensor noise, weather effects like rain and snow, and lighting variations). These augmentations enhance model robustness to real-world deployment conditions where embankment imagery may be captured under diverse weather, lighting, and camera angle scenarios. The data augmentation methods can be categorized into several functional groups: geometric transformations (Affine, flips, perspective changes) simulate different viewing angles and orientations; weather simulations (fog, rain, snow effects) prepare the model for adverse conditions; lighting variations (brightness, contrast, shadows) enhance robustness to different illumination scenarios; and noise modeling (Gaussian and ISO noise) improve resilience to camera sensor variations. The specific enhancement modes and ratios are shown in Table 3, and the distribution of the enhanced data instances and instance sizes is shown in Figure 1. The validation set and the test set were not subjected to any data augmentation.

3.2. Embankment-Frequency Network Architecture

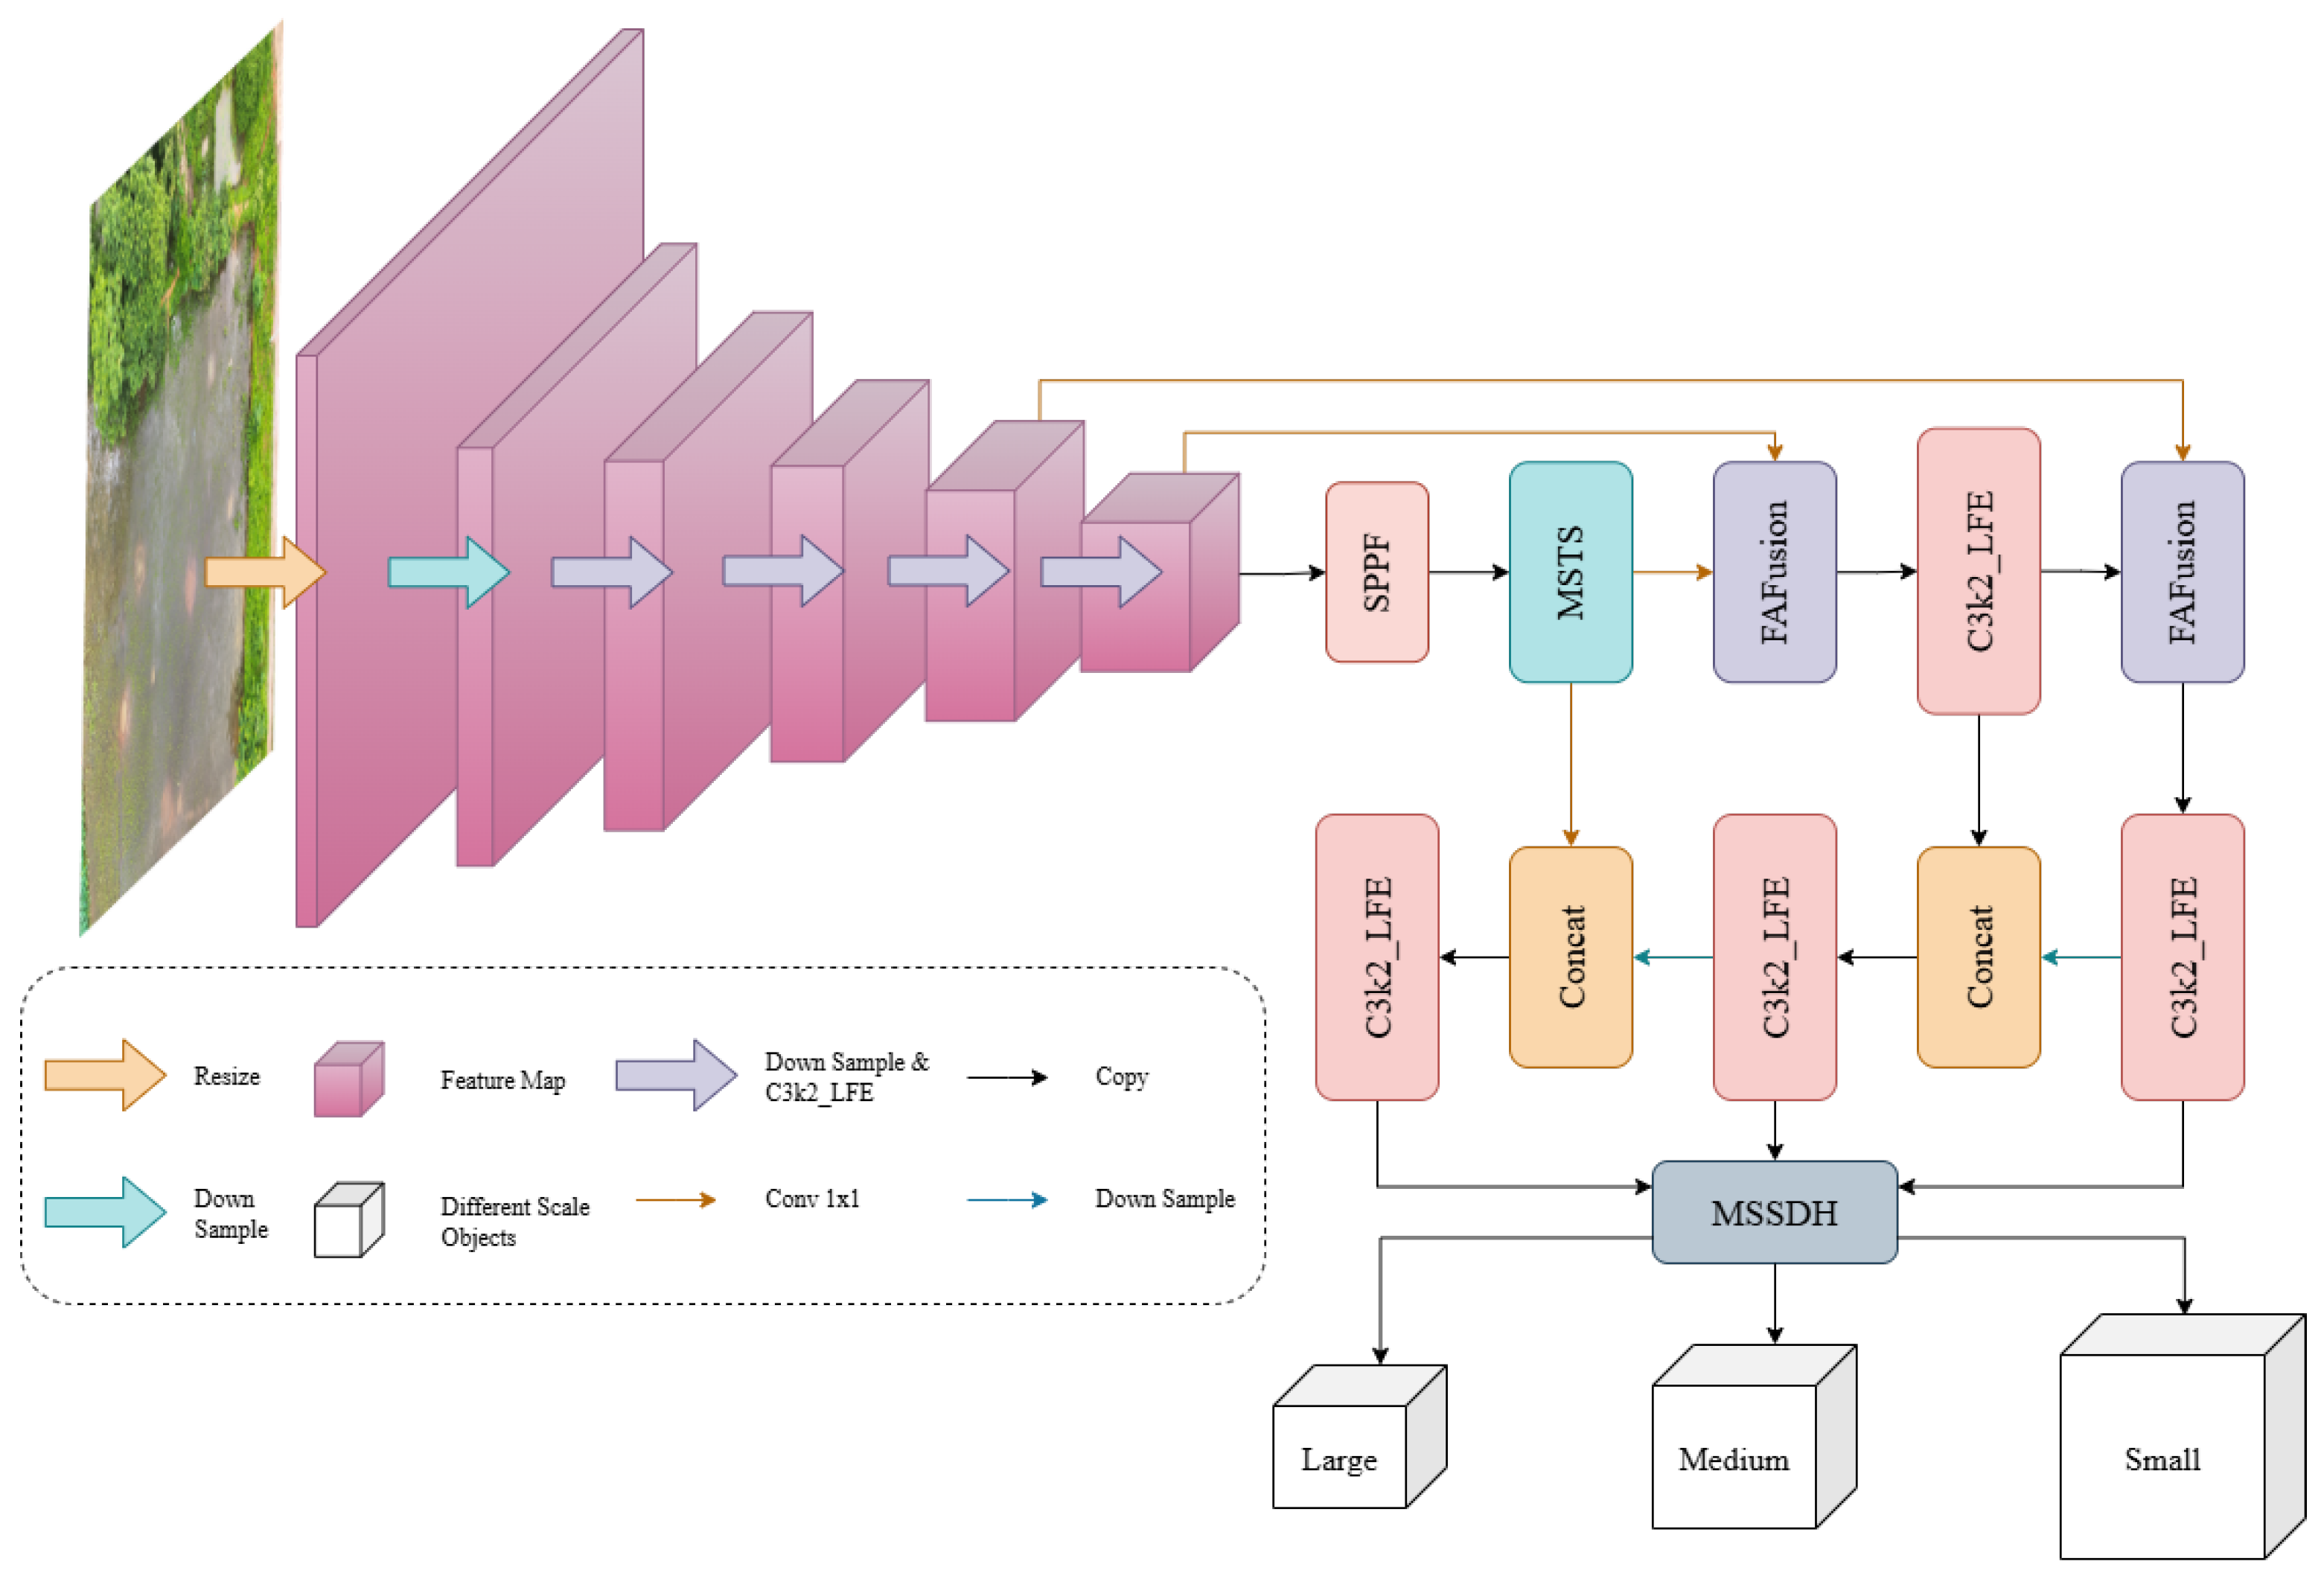
To address the unique challenges in embankment piping and leakage risk detection—namely, small object sizes, inconspicuous features, and a high dependency on texture information—this study presents an end-to-end deep detection architecture, named EmbFreq-Net. The overall architecture of this network is shown in Figure 2, and it is designed to enhance the detection performance and efficiency for subtle risk targets in complex scenarios through a series of modules and structural designs.
The architecture of EmbFreq-Net is primarily composed of three core components: a frequency-enhanced backbone, a multi-scale fusion neck, and a lightweight detection head.
In the backbone, the Local Frequency Enhancement (LFE) module is introduced. This module dynamically modulates the convolution kernel in the frequency-domain via Discrete Fourier Transform (DFT) and its inverse (IDFT), while also integrating the principles of partitioned convolution. This design enables it to extract deep textural features from images, which are necessary for identifying embankment leakage risks that rely on subtle texture variations.
In the feature fusion neck, the Frequency Adaptive Fusion (FAFusion) module is employed. This module also utilizes frequency-domain analysis to interact with spectral information during the fusion of multi-scale features, further strengthening the model’s perception and integration of texture features at different scales.
Furthermore, to enhance the model’s feature representation capabilities, the Multi-Scale Intrinsic Saliency (MSIS) module is proposed. This is an integrated unit that combines Intrinsic Saliency Attention, a Dynamic Tanh activation function [36], an Efficient Frequency Feed-Forward Network (EFFFN), and a Multi-scale Aggregation (MsA) Layer. The MSIS module is designed to capture key information from complex data, thereby enhancing the model’s expressive power.
It is worth emphasizing that EmbFreq-Net features a key innovation in its detection head: a lightweight, shared-weight detection head with Group Normalization. This design improves the model’s stability during small-batch training and reduces the model’s parameter count by 21.7% while maintaining detection accuracy.
To validate the effectiveness of the proposed architecture, it is compared against a representative lightweight detection model (Computation: 6.3 GFLOPs, Params: 2.58 M, mAP50: 73.49%). Experimental results show that EmbFreq-Net achieves comparable or better performance while being more lightweight: its total computation is reduced to 4.6 GFLOPs, and its parameter count is decreased to 2.02 M. More importantly, on the custom dataset, EmbFreq-Net achieves an mAP50 of 77.68%, demonstrating the efficacy of the design and providing an efficient solution for practical deployment.

3.3. C3k2 with Local Frequency Enhancement

In the domain of embankment hazard detection using spectral data, identifying piping leakage poses a significant challenge. The spectral signatures indicative of such hazards—subtle variations in soil moisture, vegetation stress, and thermal gradients—often manifest as faint, low-amplitude signals embedded within a complex and noisy background. Traditional convolutional neural networks (CNNs), which typically employ static kernels, often struggle to capture these nuanced and spatially varying features. Their uniform feature extraction process can dilute the critical information carried by specific frequency components, leading to diminished sensitivity for early-stage hazard identification.
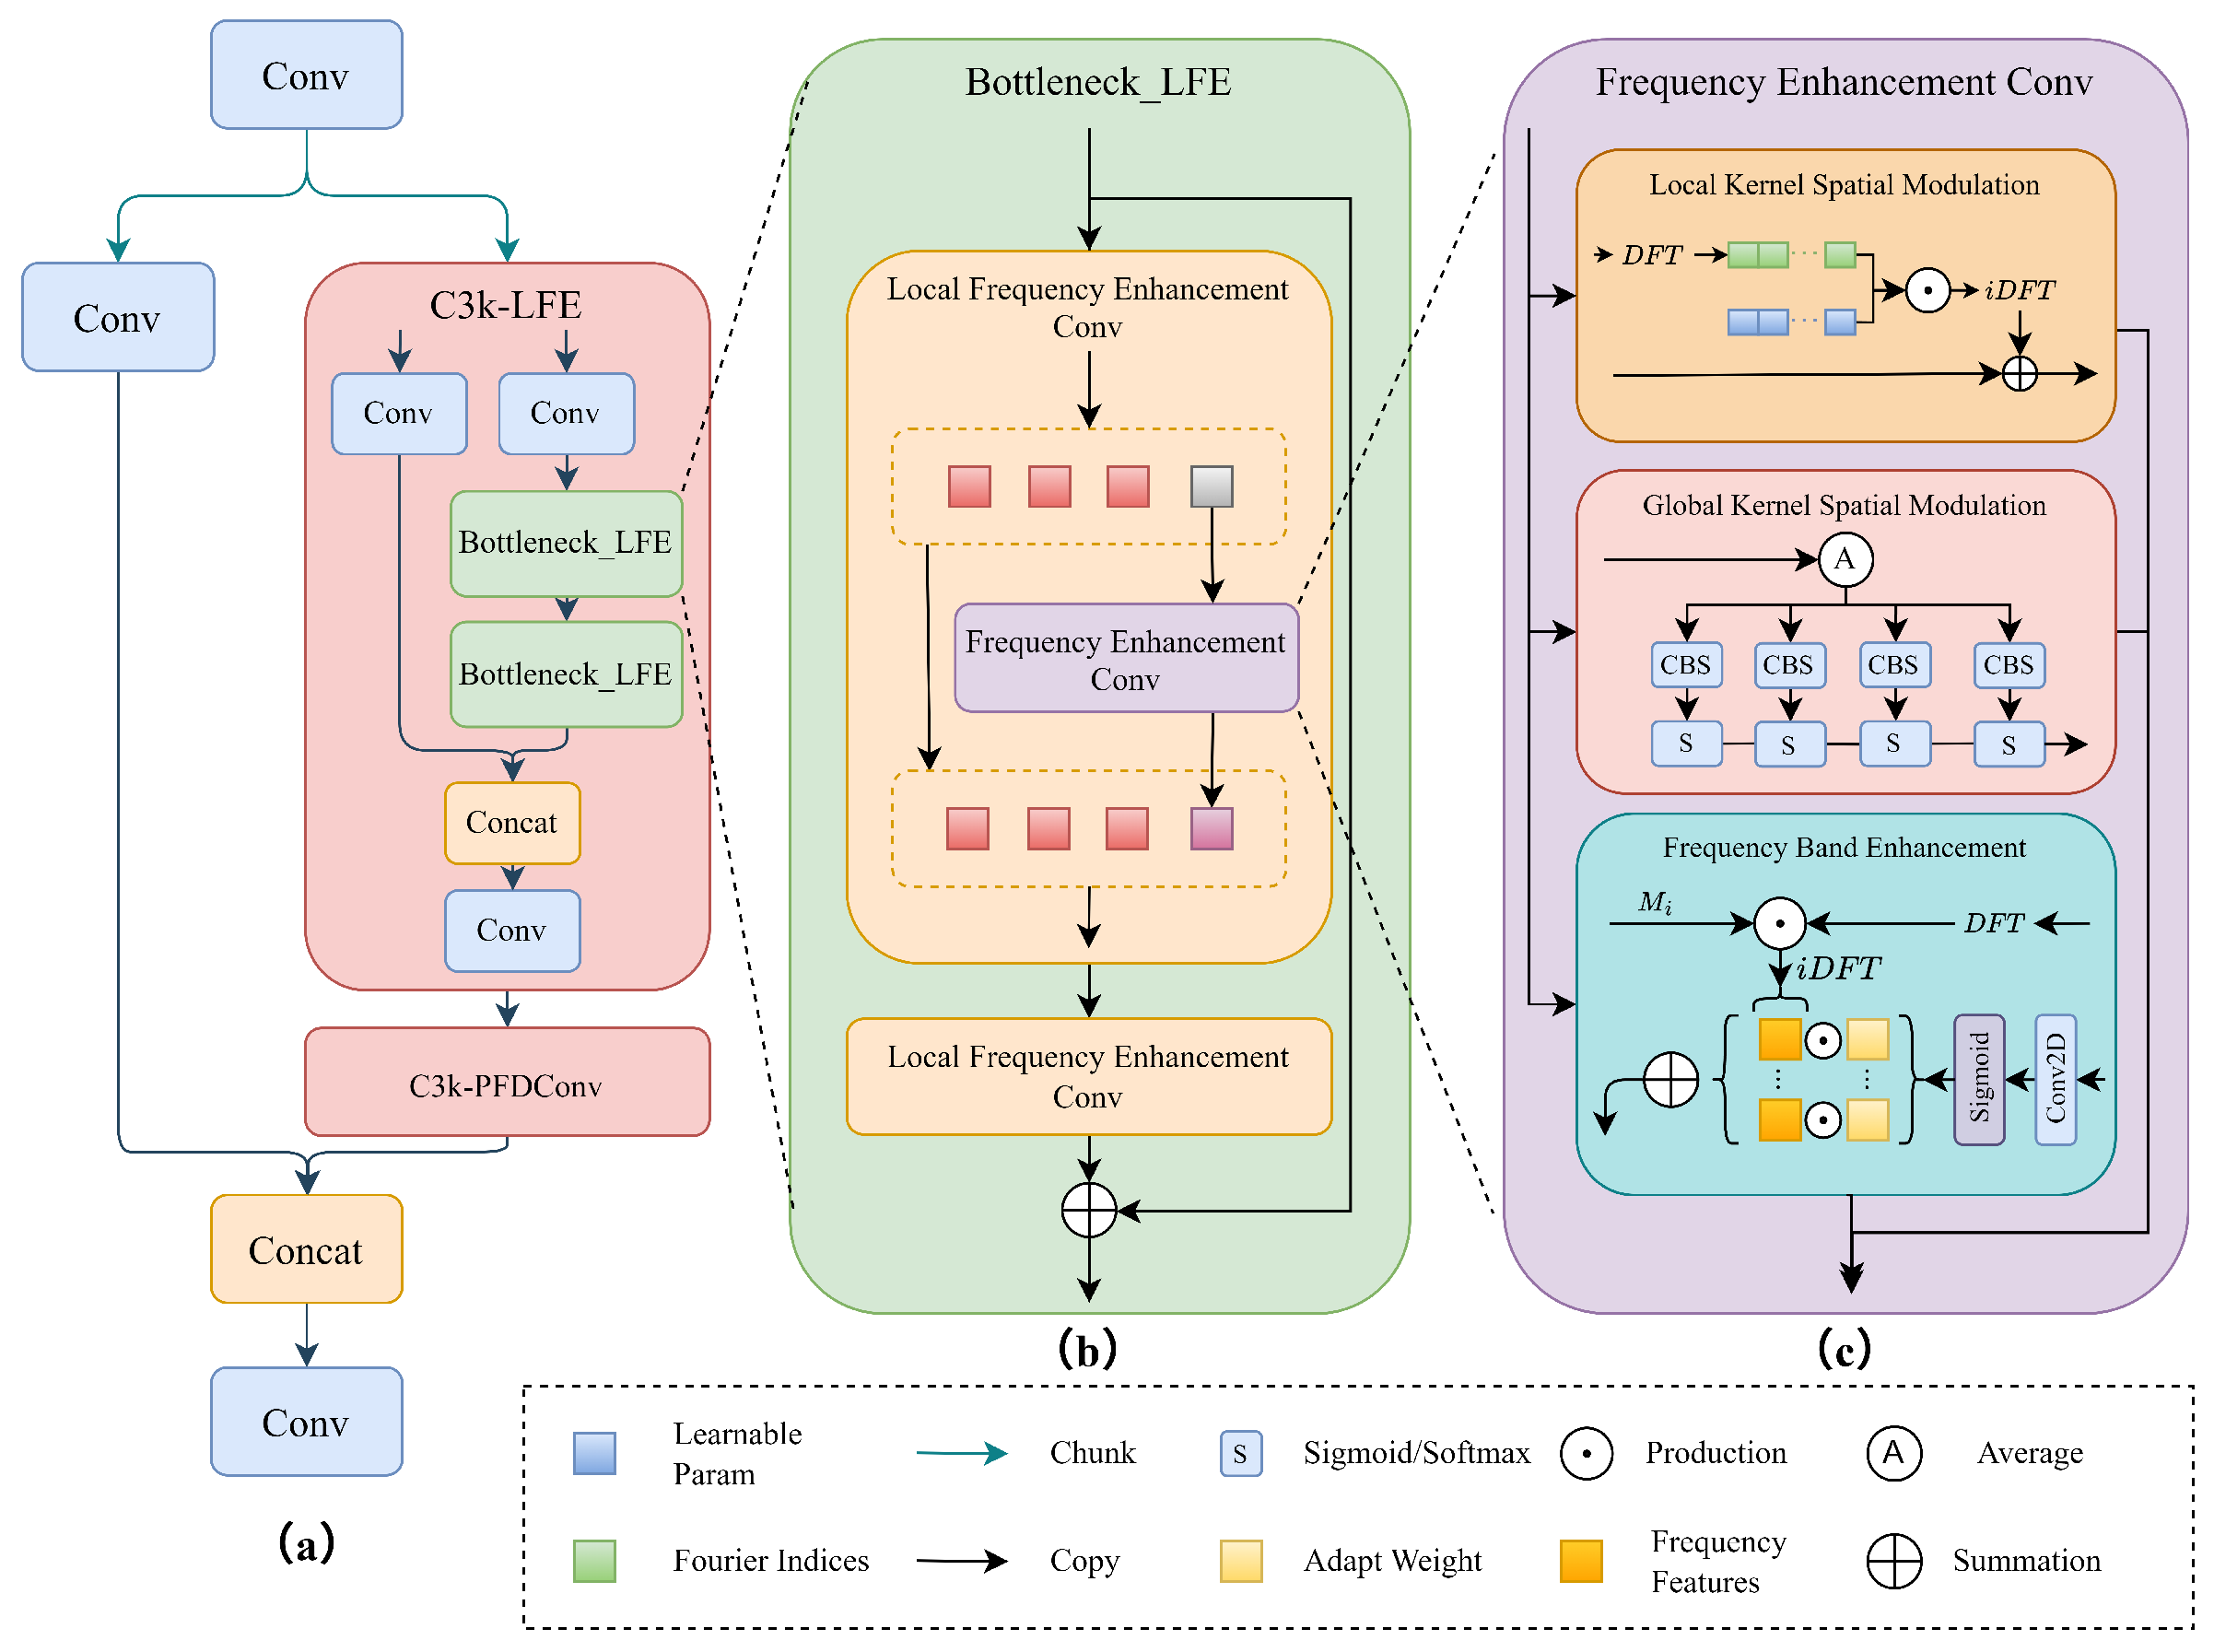
To overcome this limitation, this study introduces a novel feature extraction paradigm, the LFE module. The detailed module structure is shown in Figure 3. The LFE module is designed to replace conventional convolutional blocks within the network’s backbone, endowing the model with a dynamic and data-dependent feature extraction capability. Unlike its static counterparts, the LFE module adaptively recalibrates its receptive field and spectral sensitivity in response to the input feature map. This is achieved by dynamically generating convolutional kernels that are specifically tailored to accentuate the most informative local textures and frequency bands. For our research in embankment stability analysis, this translates to a heightened ability to amplify the weak spectral signals associated with underground seepage while simultaneously suppressing irrelevant environmental noise. Consequently, the LFE module facilitates the learning of discriminative feature representations, which support the detection of subtle piping leakage hazards from complex spectral imagery.
The operational core of the LFE module is a synergistic integration of three distinct yet complementary mechanisms: Global Kernel Spatial Modulation, Local Kernel Spatial Modulation, and Frequency Band Enhancement. The overarching principle is to synthesize an adaptive convolution kernel, W a d a p t i v e , for each input feature map, X R B × C i n × H × W , where B , C i n , H , W represent the batch size, input channels, height, and width, respectively. The workflow is detailed as follows.
The Global Kernel Spatial Modulation (KSM-G) component is responsible for capturing the holistic, long-range dependencies within the input feature map to guide the generation of a context-aware base kernel. It begins by compressing the global spatial information into a channel-wise descriptor vector, z R B × C i n × 1 × 1 , via adaptive averagepooling.
z = 1 H × W i = 1 H j = 1 W X ( b , c , i , j )
This descriptor is then processed through a miniature attention network—comprising 1 × 1 convolutions, normalization, and a non-linear activation function (e.g., StarReLU)—to produce a refined attention vector, a g l o b a l . This vector subsequently modulates four distinct attention mechanisms that collectively define the macro-level properties of the dynamic kernel:
  • Kernel Attention ( A k e r n e l ): This determines the combination of base kernels from a predefined dictionary. The dictionary of base kernels, W b a s e C N k × C o u t × C i n × K × K , exists in the frequency domain. The attention weights are computed via a softmax function to select a sparse combination.
    A k e r n e l = Softmax f k e r n e l ( a g l o b a l ) τ
    where f k e r n e l is a learned linear transformation and τ is a temperature parameter.
  • Spatial, Channel, and Filter Attentions ( A s p a t i a l , A c h a n n e l , A f i l t e r ): These generate multiplicative masks to control the spatial focus (which parts of the K × K kernel are emphasized), input channel importance, and output filter (channel) contributions, respectively. They are derived from a g l o b a l through separate linear projections and sigmoid activations.
The final globally modulated kernel in the Fourier domain, W ^ g l o b a l , is synthesized by a weighted aggregation of the base kernels, followed by the application of the other attention masks.
W ^ g l o b a l = A s p a t i a l A c h a n n e l A f i l t e r i = 1 N k ( A k e r n e l ) i · ( W ^ b a s e ) i
where ⊙ denotes element-wise multiplication.
While KSM-G provides a global context, the Local Kernel Spatial Modulation (KSM-L) component refines the kernel by capturing fine-grained, local inter-channel relationships. This mechanism operates on the channel-wise descriptor z to produce a high-resolution attention map. The process involves modulating the channel information in the frequency domain to enhance its representational capacity. Let z c be the channel vector for a single sample. Its 1D Fast Fourier Transform (FFT) is computed and then multiplied by a learnable complex weight vector, W c C C i n / 2 + 1 .
z c = F 1 D 1 F 1 D ( z c ) W c
where z c R C i n is the channel vector for a single sample, F 1 D and F 1 D 1 denote the 1D Fast Fourier Transform and its inverse respectively, W c C C i n / 2 + 1 is a learnable complex weight vector for frequency modulation, and ⊙ represents element-wise multiplication. The resulting feature z c is then passed through a 1D convolution across the channel dimension. This models captures dependencies between adjacent channels, yielding a local attention tensor A l o c a l that provides high-frequency, detailed refinement to the globally aware kernel. This allows the final kernel to adapt not only to the overall scene but also to the subtle interplay between different spectral channels.
The Frequency Band Enhancement (FBE) mechanism endows the module with explicit control over the spectral content of the features. It decomposes the input feature map X into multiple, non-overlapping frequency bands and adaptively re-weights them before the main convolution. First, the 2D Fourier transform of the input, X ^ = F 2 D ( X ) , is computed. A series of low-pass masks, { M 1 , M 2 , , M N } , corresponding to a set of predefined frequency cutoffs, are utilized to partition the signal. The feature representation for a specific band i is isolated by subtracting the outputs of successive low-pass filters.
X b a n d , i = F 2 D 1 ( X ^ M i 1 ) F 2 D 1 ( X ^ M i ) , where X b a n d , 1 = X F 2 D 1 ( X ^ M 1 )
where X b a n d , i R B × C i n × H × W represents the i-th frequency band feature, X ^ = F 2 D ( X ) is the 2D Fourier transform of input X, M i R H × W denotes the i-th low-pass mask with predefined frequency cutoffs, F 2 D and F 2 D 1 are the 2D Fast Fourier Transform and its inverse, and i { 1 , 2 , , N } indexes the frequency bands. For each frequency band X b a n d , i , a corresponding spatial weight map W b a n d , i is dynamically generated from the input features using a lightweight convolutional block. The final enhanced feature map, X F B E , is reconstructed by a weighted summation of these bands.
X F B E = X l o w , N + i = 1 N W b a n d , i X b a n d , i
where X F B E R B × C i n × H × W is the final frequency-enhanced feature map, X l o w , N = F 2 D 1 ( X ^ M N ) represents the lowest frequency component after applying the N-th low-pass mask, W b a n d , i R B × C i n × H × W is the dynamically generated spatial weight map for the i-th frequency band, and N is the total number of frequency bands. This process allows the network to learn to amplify frequency bands correlated with seepage (e.g., low-frequency patterns of large-scale moisture diffusion) and attenuate those associated with noise (e.g., high-frequency textural noise). The final convolution is then performed using the adaptively synthesized kernel, W a d a p t i v e = F 2 D 1 ( W ^ g l o b a l ) A l o c a l , on the frequency-enhanced features, X F B E .
The Local Frequency Enhancement module represents a departure from conventional feature extraction methodologies. By synergizing global contextual modulation, local channel-wise refinement, and explicit frequency band manipulation, the LFE module transforms the convolution operation from a static pattern-matching process into a dynamic, content-aware analysis engine. This adaptability allows EmbFreq-Net to construct feature representations that are sensitive to the specific spectral characteristics of the target hazard. The network learns not just what to look for, but also how to adjust its focus—both spatially and spectrally—to best discern the target signature from its surroundings.
Specifically for the mission-critical task of embankment piping detection, this innovation yields substantial practical benefits. The model gains the ability to autonomously amplify the faint yet crucial frequency components that signal subsurface moisture anomalies, which are the primary indicators of leakage. Simultaneously, it learns to suppress irrelevant background variations, such as changes in illumination or non-indicative vegetation patterns. This leads to an improved signal-to-noise ratio of the learned features, resulting in a detection algorithm with enhanced robustness, sensitivity, and reliability for identifying hazards at their early stages.

3.4. Multi-Scale Intrinsic Saliency Attention Block

In the feature extraction backbone of our proposed EmbFreq-Net, we introduce a novel module, the Multi-Scale Intrinsic Saliency Attention Block (MSIS-Block), to enhance the model’s feature representation capabilities (shown in Figure 4). Conventional attention mechanisms within deep learning architectures, while effective at capturing long-range dependencies, often suffer from quadratic computational complexity with respect to input resolution and treat all spatial tokens with uniform importance. This can be suboptimal for tasks like embankment risk detection, where critical indicators such as piping-induced soil moisture anomalies or vegetation stress present as subtle, multi-scale textural variations. To address these limitations, the MSIS-Block is engineered to synergistically integrate three core components: an Intrinsic Saliency Attention (ISAttention) mechanism for efficient and salient feature interaction, a Multi-scale Adaptor (MsA) for capturing diverse local spatial patterns, and an Efficient Frequency Feed-Forward Network (EFFFN) for global feature refinement in the frequency domain. This composite design empowers the network to dynamically allocate computational resources to informative regions and holistically model features across different scales and domains, which is paramount for identifying the signs of seepage and piping on embankments.
The operational workflow of the MSIS-Block begins with an input feature map X R B × C × H × W , where B , C , H , W represent the batch size, channel count, height, and width, respectively. The process unfolds through a sequence of specialized transformations.
First, the block employs the Intrinsic Saliency Attention (ISAttention) to model global contextual relationships with a focus on feature saliency. The input tensor X is reshaped into a sequence of tokens X s e q R B × N × C , where N = H × W . These tokens are linearly projected to form a unified representation matrix W R B × h × N × d k , where h is the number of attention heads and d k is the dimension of each head. Instead of computing a conventional attention matrix, ISAttention first determines the intrinsic importance of each token. This is achieved by calculating a normalized, squared L2-norm of the token representations, which is then passed through a Softmax function modulated by a learnable temperature parameter τ . The resulting importance vector Π is defined as follows:
Π = Softmax τ · k = 1 d k W i j k W i j L 2 2
This importance vector Π R B × h × N gates the token representations, allowing the model to selectively focus on features critical to identifying potential hazards. The final attention output is derived through a non-linear modulation process, and a residual connection is added to ensure stable training. The output of this stage is X 1 = X + ISA ( DyT ( X ) ) , where DyT denotes a dynamic activation function [36] that further enhances feature adaptability.
Next, the feature map X 1 is processed by the Multi-scale Adaptor (MsA), which is designed to extract local textural information at multiple spatial scales simultaneously. The MsA module operates in a parallel fashion. It first normalizes the input features and then projects them into a lower-dimensional space. The core of the MsA lies in its multi-branch depthwise convolution structure, where parallel convolutions with varying kernel sizes (e.g., 3 × 3 , 5 × 5 , 7 × 7 ) are applied. This allows the network to capture fine-grained details (e.g., soil texture changes) and larger patterns (e.g., vegetation patches) concurrently. The outputs from these parallel branches are aggregated and then projected back to the original channel dimension. The operation can be formally expressed as follows:
M ( P ) = 1 K k S DWConv k × k ( P ) + P
where P is the projected feature map, S is the set of kernel sizes, and DWConv denotes depthwise convolution. The MsA block is applied twice within the MSIS-Block, acting as an adaptive feature refiner both before and after the feed-forward network, ensuring that multi-scale spatial characteristics are preserved and enhanced throughout the transformation.
Finally, the MSIS-Block utilizes an Efficient Frequency Feed-Forward Network (EFFFN) to complement the spatial processing with a global perspective from the frequency domain. The EFFFN takes the features refined by the first MsA and processes them through two parallel pathways. One pathway follows a conventional FFN structure with depthwise convolutions and non-linear activations. The other, more innovative pathway, transforms the feature map into the frequency domain. The input features are first divided into non-overlapping patches. Each patch is then transformed using a 2D Real Fast Fourier Transform ( F ). A learnable filter Φ is applied element-wise to the frequencies of the patches, enabling the model to selectively amplify or suppress certain frequency components, which often correspond to global textures and periodic patterns. The filtered frequencies are then transformed back to the spatial domain via an inverse FFT ( F 1 ). This operation is described by the following:
X freq = R F 1 F ( P ( X in ) ) Φ
where P and R represent the patching and reconstruction operations, respectively. The output of the EFFFN is combined with a residual connection, and the result is passed to the second MsA for final refinement, yielding the output of the entire MSIS-Block.
The introduction of the MSIS-Block provides a significant enhancement to the EmbFreq-Net architecture. By moving beyond conventional self-attention and convolution, it creates an improved feature representation. The synergistic combination of intrinsic saliency attention (ISAttention), multi-scale spatial feature extraction (MsA), and global frequency-domain analysis (EFFFN) equips the model with a comprehensive understanding of the input spectral data. This is particularly advantageous for our application, as the visual cues for embankment piping and seepage are often multi-faceted, requiring the simultaneous perception of fine local textures, broader spatial contexts, and global periodic patterns that might indicate widespread soil saturation.
Consequently, the MSIS-Block enables the backbone network to generate feature maps that are not only rich in semantic information but also highly discriminative for subtle anomalies. This enhanced feature representation contributes to improved accuracy for the downstream detection head. The model becomes capable of distinguishing between benign environmental variations and genuine risk indicators, reducing both false positives and false negatives. Ultimately, the integration of the MSIS-Block elevates the EmbFreq-Net from a standard detection model to a specialized tool capable of performing high-fidelity analysis of complex geotechnical phenomena from spectral imagery.

3.5. Multi-Scale Frequency Feature Pyramid Network

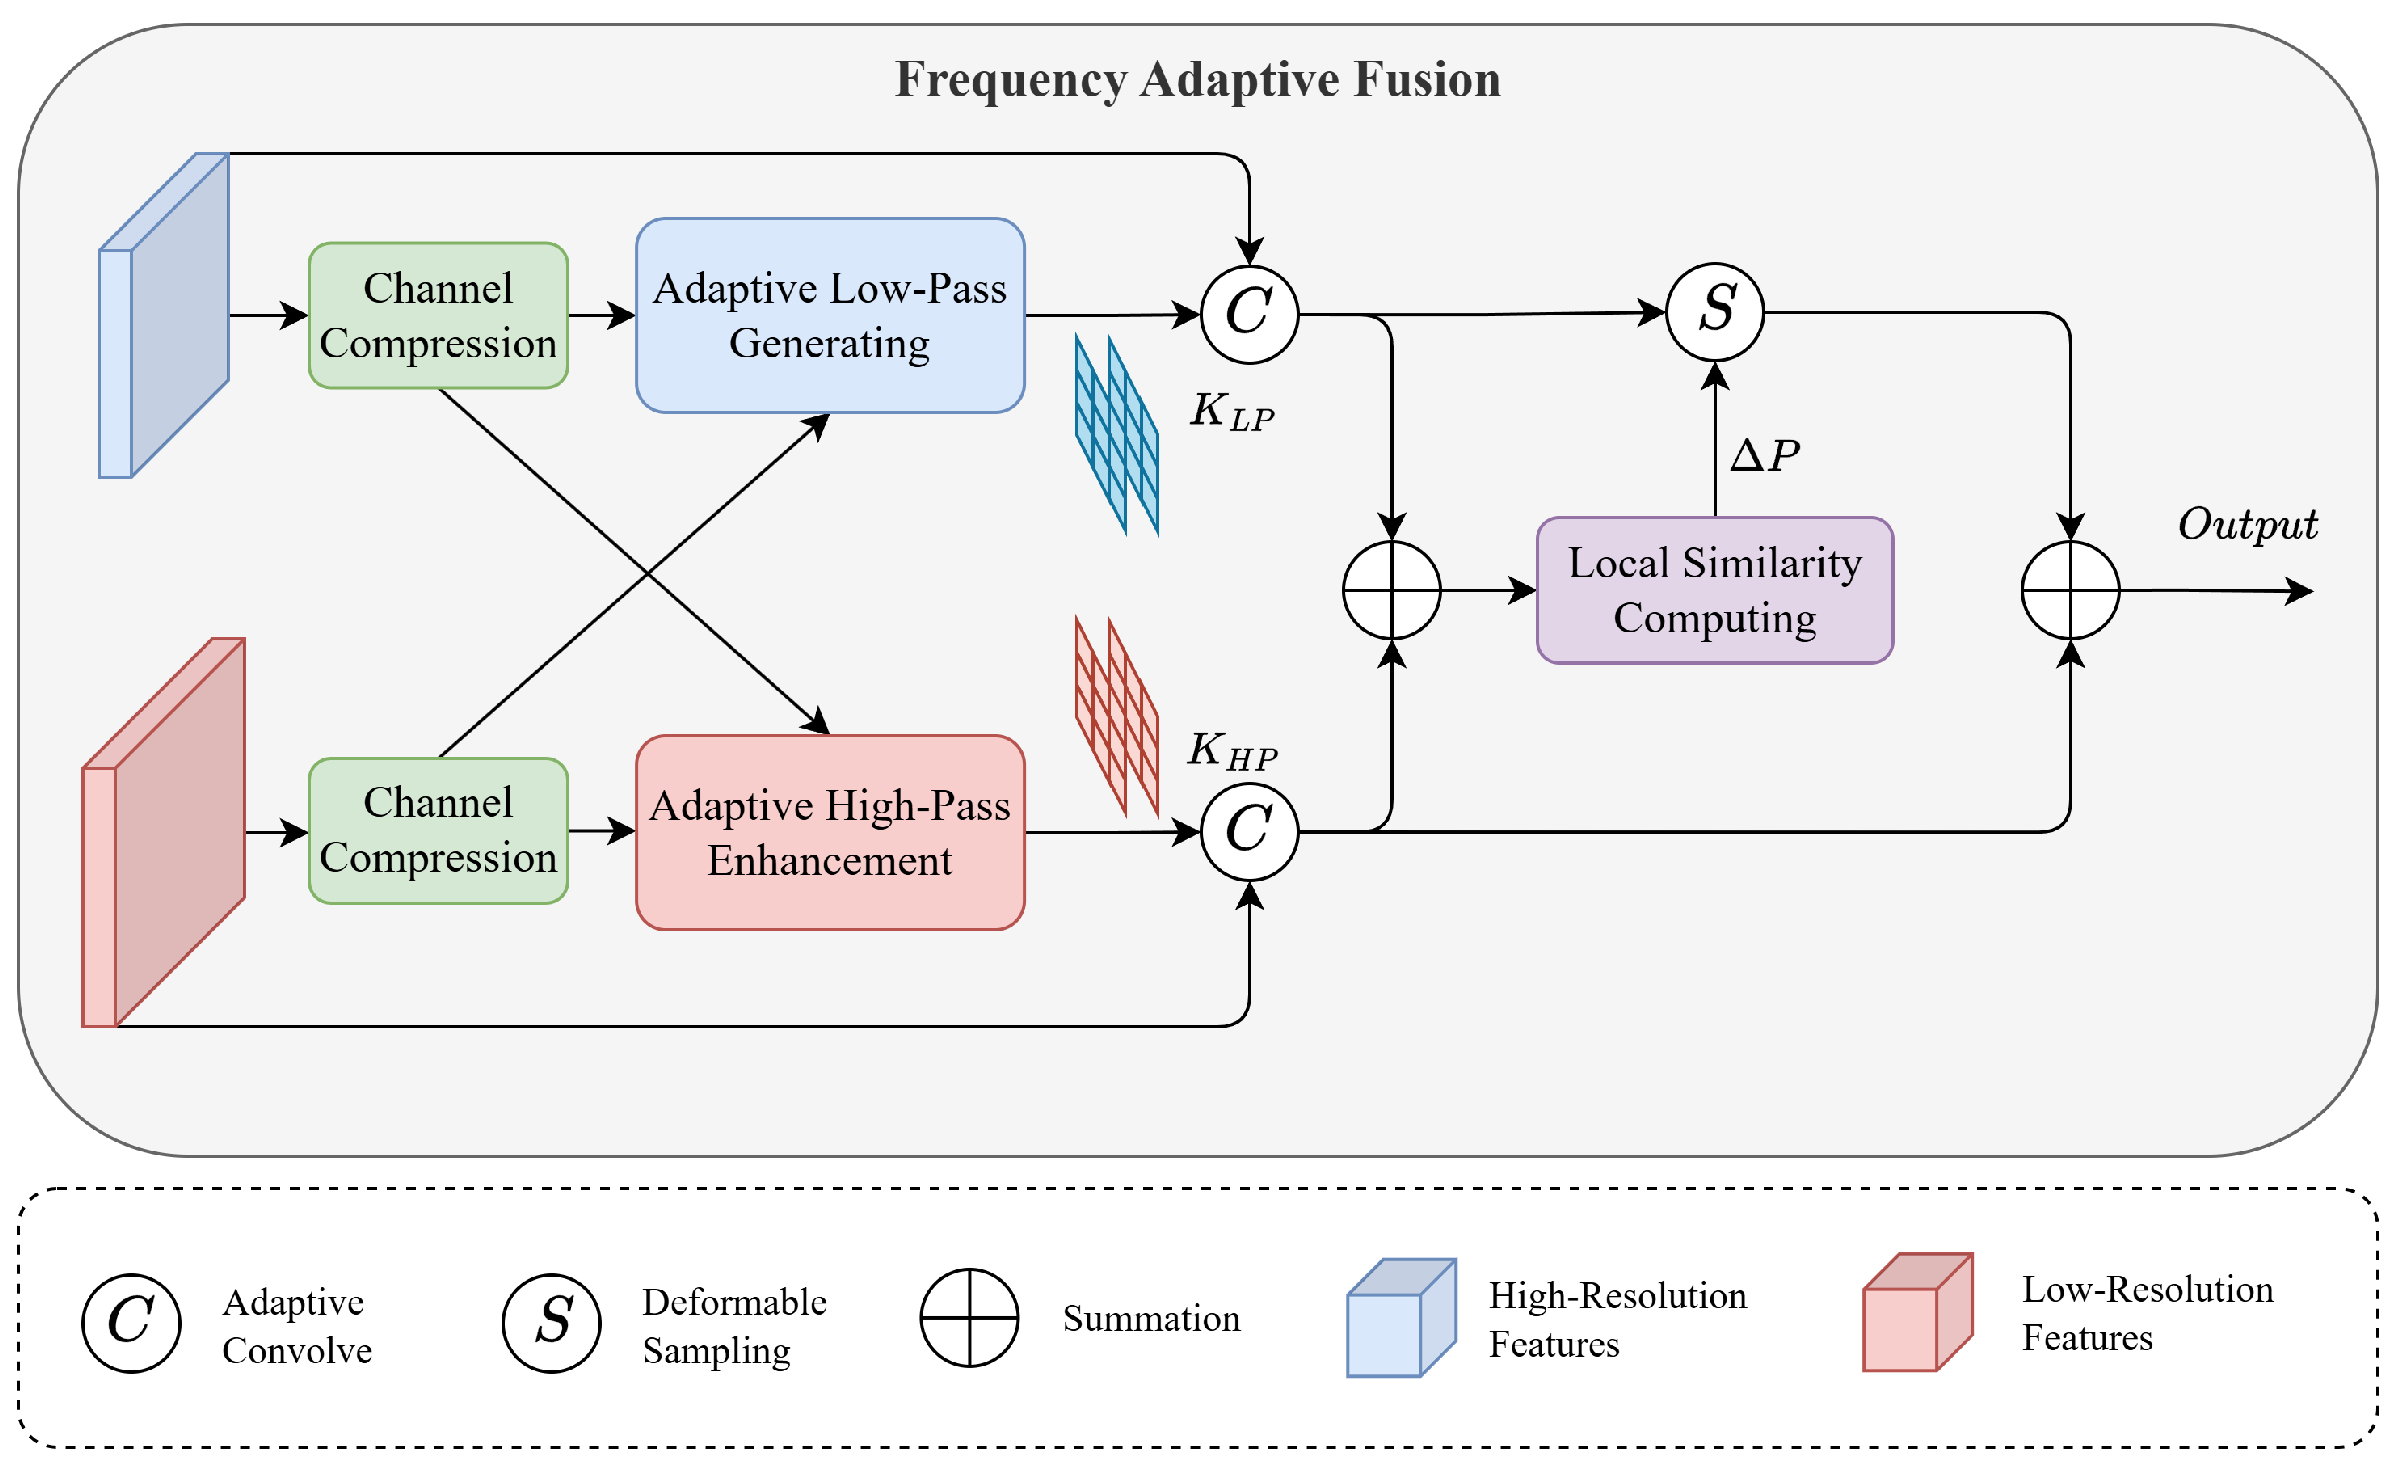
Traditional feature pyramid networks typically rely on simple spatial fusion strategies, such as summation or concatenation, combined with basic upsampling methods like nearest-neighbor interpolation. While effective for general-purpose object detection, these approaches face significant limitations in specialized domains like embankment hazard detection. Specifically, they tend to treat all features indiscriminately, often diluting the critical high-frequency details (e.g., subtle textural and spectral variations indicative of seepage) present in high-resolution feature maps when merging them with the semantically rich but spatially coarse low-resolution features. This indiscriminate fusion can lead to the loss of crucial information necessary for distinguishing piping anomalies from complex background noise. To address this challenge, we propose a novel neck architecture, the Multi-scale Frequency Feature Pyramid Network (MFFPN). At the core of MFFPN lies our innovative fusion module, the Frequency-domain Adaptive Fusion (FAFusion), which replaces the conventional fusion pathway. As illustrated in Figure 5, FAFusion is designed to perform a more principled feature integration by dynamically decomposing and re-weighting features in the frequency domain. This enables the network to intelligently preserve and enhance the fine-grained details from shallow layers while integrating robust contextual information from deep layers, which is of paramount practical significance for identifying the subtle spectral signatures of piping seepage on embankments.
The operational workflow of the FAFusion module, as depicted in Figure 5, is designed to achieve a sophisticated, content-aware fusion between a high-resolution feature map F h r R C h r × H × W from a shallower backbone layer and a low-resolution feature map F l r R C l r × H / s × W / s from a deeper layer, where s is the scale factor. Initially, to enhance computational efficiency and extract salient feature representations, both feature maps are projected into a compressed, lower-dimensional space using 1 × 1 convolutions:
F h r = Φ h r ( F h r ) , F l r = Φ l r ( F l r )
where Φ h r and Φ l r represent the respective channel compression functions, yielding F h r , F l r R C × H × W (after upsampling F l r for dimensional consistency in some operations). The central innovation of FAFusion lies in its ability to generate dynamic, spatially varying kernels for feature transformation, rather than using static filters. Two distinct content encoding functions, E L P and E H P , produce adaptive low-pass and high-pass filter kernels, respectively, based on the content of both input features. The generation of the adaptive low-pass kernel K L P can be formulated as follows:
K L P = E L P ( F h r U ( E L P ( F l r ) ) )
where ⊕ denotes element-wise addition and U is a standard upsampling operator. A similar process generates the adaptive high-pass kernel K H P . These kernels are then normalized using a Softmax function to ensure the weights sum to unity, focusing the transformation. The low-resolution feature map F l r is then upsampled and transformed using a content-aware reassembly operator, denoted as R C A , which utilizes the adaptive low-pass kernel K L P . This process selectively transfers semantic information while minimizing spatial distortion:
F u p = R C A ( F l r , K L P )
Concurrently, to emphasize the critical details in the high-resolution feature map, we apply a high-frequency enhancement mechanism. This is achieved by subtracting the low-pass filtered version of F h r from itself and adding this high-frequency residual back, effectively sharpening the details:
F e n h = F h r + F h r R C A ( F h r , K H P )
To further refine the feature alignment, especially in cases of spatial distortion, an optional Local Similarity-Guided Sampler can be employed. This sampler computes pixel-wise offsets Δ p based on local feature similarity and performs a deformable sampling on the upsampled feature map, F u p = S d e f ( F u p , Δ p ) , ensuring more precise feature correspondence. Finally, the enhanced high-resolution features and the adaptively upsampled low-resolution features are fused to produce the final output feature map F o u t :
F o u t = F e n h + F u p
This frequency-aware fusion ensures that the resulting feature map is rich in both semantic context and high-fidelity detail.
In essence, the introduction of the Multi-scale Frequency Feature Pyramid Network, powered by the FAFusion module, marks a significant departure from conventional feature fusion paradigms. By explicitly modeling and manipulating the frequency components of features during the fusion process, the approach provides the network with an improved understanding of the input data. Instead of merely superimposing feature maps, MFFPN selectively amplifies the high-frequency components that are crucial for identifying subtle anomalies like piping-induced spectral shifts, while simultaneously leveraging the low-frequency semantic information that provides contextual awareness.
This fusion mechanism results in the creation of more discriminative feature representations. The network becomes sensitive to the specific textural and spectral cues associated with piping seepage, enabling it to distinguish these critical patterns from benign background variations such as heterogeneous vegetation or soil moisture fluctuations. Consequently, the MFFPN architecture significantly enhances the model’s overall performance, leading to a marked improvement in both the accuracy and localization precision of embankment piping hazard detection. This targeted enhancement of feature quality contributes to the performance of the EmbFreq-Net model.

3.6. Multi-Scale Shared Detection Head

In the terminal stage of the EmbFreq-Net architecture, we introduce a novel prediction module, the Multi-Scale Shared Detection Head (MSSDH), which is responsible for generating the final detection results from the multi-level features provided by the network’s neck. The detection of piping leakage risks from embankment spectral data presents a unique challenge: the target anomalies often manifest as subtle textural and spectral variations, and their apparent size can vary significantly depending on the imaging distance and the developmental stage of the hazard. Conventional detection heads typically employ independent prediction branches for each feature scale, a design that not only incurs substantial parametric and computational costs but also fails to enforce representational consistency across scales. To address these limitations, our proposed MSSDH (shown in Figure 6) is engineered to be lightweight, efficient, and robust by explicitly enhancing feature consistency and coupling localization accuracy with classification confidence. For the specific application of embankment safety monitoring, this translates into a higher detection accuracy for multi-scale hazards and a lower false alarm rate, which are critical for reliable early warning systems.
The operational workflow of the MSSDH module is designed to process a set of multi-scale feature maps, denoted as { X i | i { 1 , , L } } , where L is the number of feature levels (in our case, L = 3 , corresponding to P3, P4, and P5 features). The process begins with a scale-specific convolution, C adapt i , which unifies the channel dimension of each input feature map X i R B × C i × H i × W i to a fixed hidden dimension C hid . This prepares the features for subsequent shared processing.
X i = C adapt i ( X i )
Following channel unification, all intermediate feature maps X i are passed through a single, shared feature enhancement block, C shared . This block consists of a sequence of depth-wise and point-wise convolutions with normalization. By sharing these convolutional kernels across all scales, the model is compelled to learn scale-invariant representations, effectively capturing the essential characteristics of piping anomalies regardless of their size. This weight-sharing strategy is the cornerstone of the head’s lightweight design.
X i = C shared ( X i )
From the enhanced, scale-invariant feature map X i , the head performs decoupled predictions for localization and classification. Two separate 1 × 1 convolutional layers, C reg and C cls , are utilized to generate the bounding box regression predictions and the class predictions, respectively. The regression output for each location is formulated as a distribution over a discrete set of bins, a technique that improves localization precision. The raw regression prediction P reg , i and classification prediction P cls , i are generated as follows:
P reg , i = S i · C reg ( X i )
P cls , i = C cls ( X i )
where S i is a learnable scalar that adaptively balances the magnitude of the regression outputs for each scale. To address the potential mismatch between classification confidence and localization precision, a common challenge in dense object detection, we incorporate the Localization Quality Estimation (LQE) module [37], denoted as F LQE . This module dynamically refines the classification scores by considering the quality of the corresponding localization prediction. It takes both P cls , i and P reg , i as input, fostering a strong synergy between the two tasks. This ensures that high confidence scores are assigned only to detections that are both correctly classified and precisely localized.
P cls , i = F LQE ( P cls , i , P reg , i )
The final output tensor for each scale, Y i , is formed by concatenating the regression and the enhanced classification predictions. During inference, the distributional regression outputs are decoded into bounding box coordinates ( x , y , w , h ) using a Distribution Focal Loss (DFL) mechanism, which calculates the expectation over the predicted probability distribution for each coordinate. This process, combined with the refined class scores, yields the final, high-quality detection results.
The introduction of the Multi-Scale Shared Detection Head brings forth significant advantages for the EmbFreq-Net model. Primarily, the weight-sharing mechanism within its core convolutional block drastically reduces the number of parameters and floating-point operations (FLOPs) compared to traditional multi-branch heads. This reduction in complexity not only accelerates the model’s inference speed, making it suitable for real-time monitoring applications, but also mitigates the risk of overfitting, particularly on specialized datasets like embankment spectral imagery. The shared feature extractors promote the learning of a more generalized and robust set of features, enhancing the model’s ability to consistently identify piping hazards across different scales and viewing conditions.
Furthermore, the integration of the Localization Quality Enhancement (LQE) mechanism [37] provides a sophisticated method for improving detection reliability. By explicitly linking classification confidence to localization accuracy, MSSDH effectively suppresses low-quality detections—those with poorly defined boundaries or ambiguous classifications—which are a common source of false positives in complex natural environments like embankments. This quality-aware screening process is paramount for a critical safety application, as it ensures that the system reports potential hazards with higher fidelity. In summary, the MSSDH module enhances the EmbFreq-Net model by creating a more efficient, robust, and reliable framework for the challenging task of detecting piping leakage risks.

4. Experimental and Result Analysis

4.1. Experimental Environment and Hyper-Params

The experimental platform for all model training and testing in this study was a high-performance workstation. The hardware configuration consisted of a 12th Gen Intel(R) Core(TM) i9-12900K processor, 128 GB of system memory, and two NVIDIA GeForce RTX 3090 GPUs, each providing 24 GB of dedicated video memory. All models were developed and executed within the PyTorch 2.3.1 deep learning framework.
For the training hyperparameters, the Stochastic Gradient Descent (SGD) optimizer was employed, with the initial learning rate set to 0.001 and the momentum set to 0.937. All models were trained for a total of 400 epochs using an input image resolution of 640 × 640 pixels. A batch size of 64 was used, except for Detection Transformer (DETR)-based models, where it was reduced to 32 to accommodate their larger memory requirements. To isolate the performance gains from the proposed modules, all data augmentations, including mosaic, were disabled during training. Similarly, both Automatic Mixed Precision (AMP) and half-precision training were disabled for all experiments to ensure consistent comparison conditions.

4.2. Evaluation Mertrics

In our evaluation, the following metrics are used: P (Precision), R (Recall), F1-score(F1), mAP50 (mean Average Precision at an Intersection over Union (IoU) threshold of 0.5), mAP50-95 (the primary Common Objects in Context (COCO) metric, averaged over IoU thresholds from 0.50 to 0.95), GFLOPs (Giga Floating Point Operations), and Params (in millions). GFLOPs serves as a proxy for time complexity, while the number of model parameters indicates the model size and space complexity. The other metrics are used to evaluate the performance of the model on the dataset. Recall measures the proportion of actual positive cases that were correctly identified, while precision measures the proportion of positive identifications that were actually correct. These two metrics are numerically competitive, so the F1-score is a harmonic average of the above two metrics, representing the performance metric after considering both recall and precision. The mean Average Precision (mAP), on the other hand, represents the average of each category under a certain IoU threshold, which is one of the most important metrics for the target detection task, emphasizing the accuracy of both classification and localization over the dataset. The formulas for recall, precision, F1-score, and the mean value of average precision are as follows:
R e c a l l = T P T P + F N
Precision = T P T P + F P
F 1 = 2 P r e c i s i o n R e c a l l P r e c i s i o n + R e c a l l
A P i = k = 0 N P i ( r i ) d r i
mAP = 1 n + 1 i = 1 N A P i
where T P stands for True Positive, F N stands for False Negative, and F P stands for False Positive. A P i stands for the average precision of the category i, calculated as the area under the P-R curve. m A P is obtained by averaging the average precision of each category.

4.3. Comparison Experiments

To systematically validate the efficacy of the key components in EmbFreq-Net and benchmark its overall performance, we conducted a series of comprehensive comparison experiments. These experiments were designed to systematically evaluate the architecture by individually assessing the contribution of each innovative module. The evaluation was structured into three progressive stages: (1) an analysis of the C3k2-LFE backbone against other prominent lightweight backbones to verify its feature extraction capabilities; (2) a comparison of our Multi-scale Frequency Feature Pyramid Network (MFFPN) with other advanced feature fusion structures to demonstrate its effectiveness in preserving critical details; and (3) a holistic performance benchmark of the integrated EmbFreq-Net against state-of-the-art (SOTA) object detection models to establish its superiority for embankment hazard detection. This staged approach not only demonstrates the final model’s effectiveness but also provides clear justification for its specific architectural design choices.

4.3.1. Backbone Architecture Comparison

The backbone network is fundamental to the detection model, responsible for extracting initial feature representations from the input data. The primary objective of this experiment was to evaluate whether the proposed C3k2 with Local Frequency Enhancement (C3k2-LFE) backbone more effectively captures the subtle textural and spectral features characteristic of piping leakage compared to other lightweight architectures.
As detailed in Table 4, the C3k2-LFE module achieved the highest performance across all key accuracy metrics, attaining an F1-score of 0.7759, an mAP50 of 77.45%, and an mAP50-95 of 35.96%. While StarNet [38] required fewer parameters (1.94M vs. 2.19M) and GFLOPs (5.0 vs. 5.4), C3k2-LFE yielded a 0.98 percentage point higher mAP50 (77.45% vs. 76.47%). Furthermore, compared to EfficientViT [39] and FasterNet [40], our backbone achieved 0.39 and 3.40 percentage points higher mAP50, respectively, while requiring 31.7% fewer GFLOPs than EfficientViT and 41.3% fewer GFLOPs than FasterNet. These results demonstrate that C3k2-LFE strikes an effective balance between model efficiency and feature extraction capability for this specific domain.
This superior performance can be attributed to its design, which was specifically adapted for identifying faint anomalies in complex backgrounds. Unlike conventional backbones that employ static convolutional kernels, the Local Frequency Enhancement (LFE) module dynamically synthesizes content-aware kernels. As detailed in Section 3.3, this is achieved through a synergistic mechanism that combines global contextual modulation, local inter-channel refinement, and explicit Frequency Band Enhancement (FBE). This enables the backbone to adaptively amplify the specific frequency bands correlated with seepage-induced soil moisture and vegetation stress, while simultaneously suppressing irrelevant background noise.
Compared to the FFC backbone (77.03% mAP50, 6.1 GFLOPs, 2.47M parameters), our C3k2-LFE achieved superior accuracy (77.45% mAP50) with a lower computational cost (5.4 GFLOPs, 2.19M parameters), demonstrating the efficacy of task-specific local frequency enhancement over global frequency processing.
General-purpose lightweight models, while efficient, lack this specialized capability for frequency-domain analysis, often treating features with uniform importance. Consequently, they demonstrate a reduced capability in extracting discriminative representations from the faint and spatially variant spectral signatures of piping, resulting in lower detection accuracy.

4.3.2. Neck Module Comparison

The feature fusion neck plays a critical role in aggregating information from different stages of the backbone, combining high-level semantic context with low-level spatial details. This experiment was designed to verify that our proposed Multi-scale Frequency Feature Pyramid Network (MFFPN) provides a more effective fusion strategy than existing advanced neck modules for this task, where preserving fine-grained details is paramount.
The experimental results presented in Table 5 demonstrate the efficacy of the design. MFFPN achieved an F1-score of 0.7819 and the highest mAP50 of 77.13%. Notably, the method obtained the highest recall (R) of 78.30%, a critical metric for a hazard detection task as it indicates a lower rate of missed detections. While RepGFPN [43,44,45] achieved an identical F1-score (0.7819), MFFPN surpassed it in mAP50 by 0.65 percentage points (77.13% vs. 76.48%) while requiring 25.6% fewer GFLOPs (6.1 vs. 8.2) and 32.5% fewer parameters (2.47M vs. 3.66M). These results confirm that MFFPN enhances detection accuracy while simultaneously maintaining computational efficiency.
The success of MFFPN is rooted in its core innovation, the Frequency-domain Adaptive Fusion (FAFusion) module, as described in Section 3.5. Traditional fusion necks often employ simple addition or concatenation, which can dilute or lose high-frequency details from shallow feature maps when merged with coarse, deep-layer features. In contrast, FAFusion performs a principled integration by decomposing and re-weighting features in the frequency domain. It dynamically generates adaptive low-pass and high-pass filters based on input content, allowing it to intelligently preserve and even enhance the subtle textural details indicative of seepage from high-resolution features, while selectively integrating robust semantic context from low-resolution features. Other advanced necks, such as ASF [47] or RepGFPN [43,44,45], focus on spatial attention or structural re-parameterization but do not explicitly address this frequency-domain challenge. This targeted, detail-preserving fusion strategy enables MFFPN to construct more discriminative feature representations for subtle, multi-scale targets, leading to superior detection performance.

4.3.3. Comparison with State-of-the-Art Models

To demonstrate the model’s overall practical value and establish a new performance benchmark for embankment hazard detection, we conducted a final comparison of the fully integrated EmbFreq-Net against a suite of general-purpose, state-of-the-art (SOTA) object detectors. The goal was to prove that our holistically designed, domain-specific model could outperform these powerful but generic architectures.
The comprehensive results in Table 6 validate the effectiveness of our approach. EmbFreq-Net achieved the highest detection accuracy with an mAP50 of 77.68%, exceeding all other models, including recent architectures like YOLOv10 [48] (75.07%) and RepViT [49] (76.18%) by 2.61 and 1.50 percentage points, respectively. The method achieved this while requiring the lowest computational cost, using only 4.6 GFLOPs and 2.02 million parameters. Compared to the baseline YOLO11, EmbFreq-Net achieved a 4.19 percentage point higher mAP50 (77.68% vs. 73.49%) while reducing GFLOPs by 27.0% (4.6 vs. 6.3) and parameters by 21.7% (2.02M vs. 2.58M). The transformer-based models (DETR-l and DETR-R50) yielded lower mAP50 scores (69.10% and 70.88%, respectively) and required substantially more computational resources (103.4 and 125.6 GFLOPs), indicating their architectural design is less suitable for this specific spectral-texture-based detection task.
The performance of EmbFreq-Net results from the synergistic effect of its integrated, purpose-built architecture. The C3k2-LFE backbone was specifically engineered to extract faint spectral-textural cues; the MFFPN neck preserves and enhances critical, high-frequency details during multi-scale fusion; and the lightweight MSSDH head (Section 3.6) generates predictions with minimal computational cost while enforcing consistency across scales. Unlike the SOTA models, which were designed for general-purpose object recognition, every component of EmbFreq-Net was optimized to address the specific challenges of piping leakage detection—namely, small targets, inconspicuous features, and high reliance on texture. This domain-specific design approach enables EmbFreq-Net to outperform larger and more complex general-purpose detectors while maintaining computational efficiency.

4.4. Ablation Experiment

To systematically validate the effectiveness and contribution of each innovative component within the EmbFreq-Net architecture, we conducted a series of comprehensive ablation studies. The primary goal of these experiments is to dissect the proposed model and quantitatively assess the impact of its four core modules: the C3k2 with Local Frequency Enhancement (C3k2-LFE, denoted as A), the Multi-Scale Intrinsic Saliency Attention Block (MSIS-Block, denoted as B), the Multi-Scale Frequency Feature Pyramid Network (MFFPN, denoted as C), and the Multi-Scale Shared Detection Head (MSSDH, denoted as D). By progressively adding or removing these modules, we can isolate their individual effects on detection performance (mAP, F1-score, Precision, Recall) and model efficiency (GFLOPs, Params). This rigorous analysis not only justifies our design choices but also provides deeper insights into the synergistic interactions between the components, ultimately demonstrating the superiority of the integrated EmbFreq-Net framework.
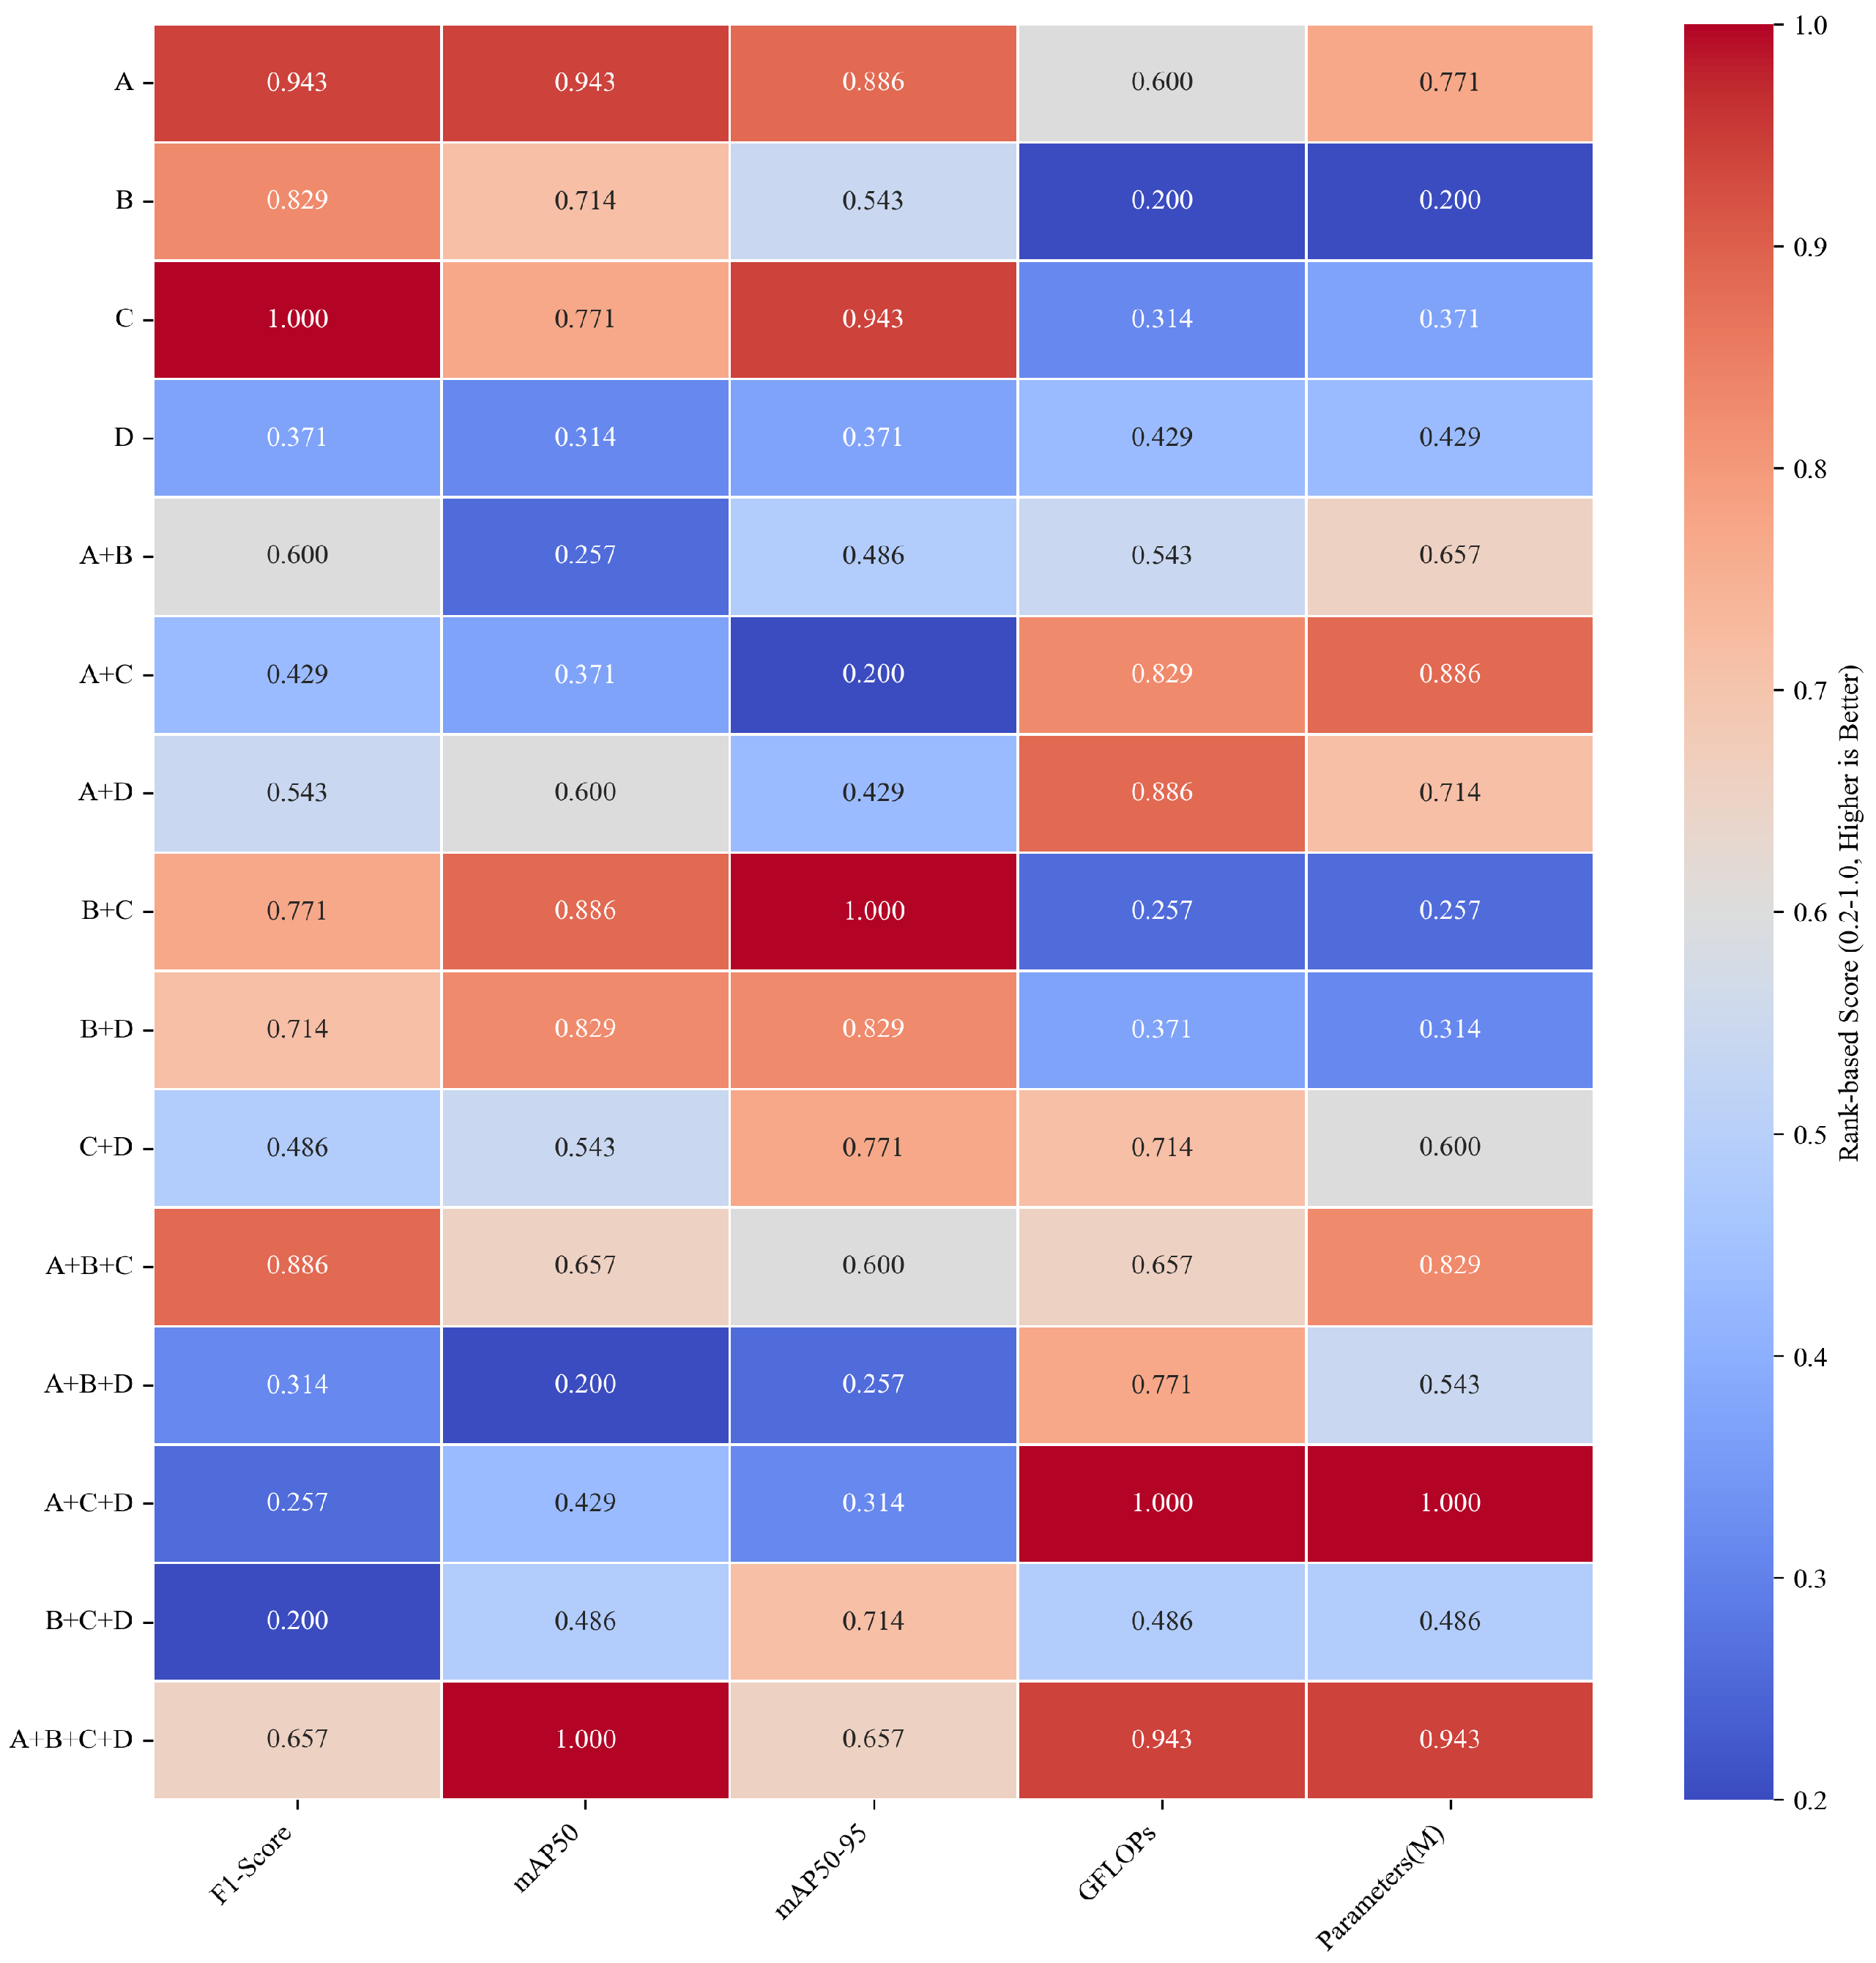
The results of our extensive ablation experiments, involving 16 distinct model configurations, are summarized and visualized in the heatmaps presented in Figure 7 and Figure 8, with detailed quantitative metrics provided in Table 7. Figure 7 provides a high-level, rank-based comparison of all model variants across five key metrics, allowing for a quick assessment of overall performance trends. Brighter colors indicate a higher (better) rank, highlighting the most effective configurations. Figure 8 offers a more detailed view, presenting heatmaps with raw numerical values for the ablation of each specific module, which facilitates a granular analysis of its direct impact.

4.4.1. Effectiveness of the C3k2-LFE

The C3k2-LFE module (Module A) is designed as a foundational feature extractor in our backbone, aiming to enhance the model’s sensitivity to the subtle, texture-based spectral signatures characteristic of piping leakage. As detailed in Section 3.3, its core innovation lies in the dynamic generation of convolution kernels tailored to local frequency content. The ablation study, visualized in Figure 8a, confirms the efficacy of this approach.
Observing the heatmap, the integration of the C3k2-LFE module consistently improved detection accuracy metrics, particularly in the F1-score and mAP50 (0.7759 and 77.45% respectively, as shown in Table 7). The brighter cells corresponding to models equipped with Module A indicate higher performance compared to their counterparts without it. This performance gain is attributable to the LFE module’s ability to adaptively amplify the faint frequency components associated with subsurface moisture anomalies while suppressing irrelevant background noise. By transforming the convolution from a static pattern-matching process into a dynamic, content-aware analysis, the network learns more discriminative and robust feature representations. The visual evidence in the heatmap supports the hypothesis that explicit frequency-domain enhancement at the feature extraction stage is critical for identifying challenging, texture-reliant targets like piping hazards.

4.4.2. Effectiveness of the MSIS-Block

Module B, the MSIS-Block, is introduced to equip the network with a more powerful and nuanced feature representation capability, moving beyond conventional convolutions. As described in Section 3.4, it synergistically combines intrinsic saliency attention (ISAttention), multi-scale spatial feature extraction (MsA), and global frequency-domain analysis (EFFFN). The impact of this sophisticated block is demonstrated in the ablation results shown in Figure 8b.
The heatmap shows that the inclusion of the MSIS-Block led to improvements in model performance, particularly in the mAP50-95 metric. This metric is sensitive to high-quality localization, indicating that the MSIS-Block enhances the model’s ability to delineate hazard boundaries. This improvement can be attributed to the module’s comprehensive feature modeling approach. The ISAttention allocates computational focus to salient image regions, the MsA captures diverse local patterns concurrently, and the EFFFN provides global contextual understanding from the frequency domain. This multi-faceted approach enables the model to process the complex visual cues of embankment seepage, which are often multi-scale and context-dependent. The performance gains shown in the heatmap indicate that this holistic feature enhancement contributes to the overall accuracy of EmbFreq-Net.

4.4.3. Effectiveness of the MFFPN

The MFFPN (Module C) serves as the network’s neck, responsible for fusing features from different stages of the backbone. Its core component, FAFusion, is engineered to overcome the limitations of traditional fusion methods by intelligently merging multi-scale features in the frequency domain, as explained in Section 3.5. The ablation study for MFFPN, presented in Figure 8c, highlights its critical role in generating high-quality feature pyramids.
The results visualized in the heatmap indicate that the MFFPN contributes to improved detection performance, reflected by consistent gains across mAP50 and F1-score (achieving 77.13% mAP50 and 0.7819 F1-score as the best single-module performance in Table 7). Models incorporating MFFPN demonstrate more balanced performance, which is attributable to its fusion mechanism. Instead of uniformly combining feature maps, FAFusion selectively preserves and enhances the high-frequency information (e.g., subtle textures) from shallow layers while integrating the semantic context from deep layers. This frequency-aware fusion process creates feature representations that contain both detailed and contextual information. The heatmap indicates that this approach improves the capability to detect hazards of varying sizes and appearances, which is highly beneficial for embankment monitoring applications.

4.4.4. Effectiveness of the MSSDH

Module D, the MSSDH, is our proposed lightweight prediction module designed for efficiency and robustness. As detailed in Section 3.6, it employs a weight-sharing strategy across scales and integrates a Localization Quality Estimation (LQE) mechanism to couple classification confidence with localization accuracy. The dual advantages of this design are compellingly demonstrated in the ablation study results in Figure 8d and the overview in Figure 7.
The heatmaps illustrate the primary benefit of the MSSDH: a significant reduction in model complexity. The columns for GFLOPs and Params(M) consistently show lower values for configurations that include the MSSDH, confirming its computational efficiency (contributing to the full model’s 4.6 GFLOPs and 2.02M parameters as shown in Table 7). This efficiency was achieved while maintaining detection accuracy in most cases. The shared-weight design promotes the learning of scale-invariant representations, which likely contributes to improved generalization. Furthermore, the LQE mechanism filters out low-quality detections by penalizing predictions with poor localization, which contributes to higher F1-scores by reducing false positives. The ablation study indicates that the MSSDH creates a more efficient yet reliable detection head, making the EmbFreq-Net model well-suited for practical deployment in monitoring scenarios. The lightweight architecture (2.02M parameters, 4.6 GFLOPs) enables practical edge computing deployment on resource-constrained UAV platforms. With an estimated memory footprint of approximately 8.09 MB (FP32) or 4.16 MB (FP16), EmbFreq-Net can operate efficiently on typical edge devices such as NVIDIA Jetson series, meeting real-time requirements (282 FPS) for continuous aerial monitoring while reducing power consumption to extend UAV operational time.

4.5. Hyperparameter Sensitivity Analysis

To provide insights for practitioners adapting EmbFreq-Net to new datasets, we conducted a comprehensive hyperparameter sensitivity analysis on three critical parameters that control the core functionality of our frequency-enhanced modules. The results are summarized in Table 8. Specifically, we analyzed (1) the compressed channels parameter in the FAFusion module, which controls the channel compression ratio for frequency-domain feature fusion in the MFFPN neck; (2) the kernel number parameter in the LFE module, which determines the number of dynamic frequency-domain kernels for adaptive convolution in the backbone; and (3) the attention head configuration in the MSIS-Block, which governs the multi-head attention mechanism for intrinsic saliency computation. These parameters directly influence the model’s frequency-domain processing capability, feature extraction efficiency, and attention-based feature refinement. The analysis was performed using the same experimental setup as the ablation study, with each parameter varied independently while keeping others at default values to isolate its individual effects.
The sensitivity analysis reveals important insights into EmbFreq-Net’s robustness across its frequency-enhanced components. The FAFusion compressed channels parameter shows mAP50 variations of only 2.72% (74.96–77.68%), with optimal performance at the default 16 channels, indicating robust frequency-domain feature fusion in MFFPN. The LFE kernel number demonstrates even greater stability with only a 0.99% mAP50 variation (75.96–77.83%), showing that dynamic frequency-domain kernel generation in the LFE module maintains consistent performance regardless of kernel quantity changes. The MSIS-Block attention heads exhibit the largest but still modest sensitivity, with mAP50 ranging from 75.28% to 78.39% (a 3.11% variation).
The performance patterns reveal the functional characteristics of each module. The default compressed channels setting achieves optimal performance, suggesting that excessive compression loses critical spectral information while insufficient compression hinders computational efficiency. The slight performance peak at 64 kernels (+0.15% mAP50) indicates that increased kernel diversity marginally enhances frequency pattern capture in embankment textures. The attention head improvement from 2 to 8 heads (+0.71% mAP50) demonstrates enhanced intrinsic saliency computation, while further increases to 16 heads show degradation, likely due to potential overfitting.
This low hyperparameter sensitivity is particularly valuable for practical deployment, indicating that EmbFreq-Net can maintain consistent performance even when parameters are not perfectly tuned for specific datasets. The default settings provide near-optimal performance while maintaining computational efficiency. For practitioners seeking further improvements, adjusting the attention head to 8 offers the best performance gain, while optimizing the kernel number to 64 provides a minimal but consistent enhancement. The model’s inherent robustness significantly reduces the tuning burden when adapting to new embankment monitoring scenarios.

4.6. Interpretability Analysis

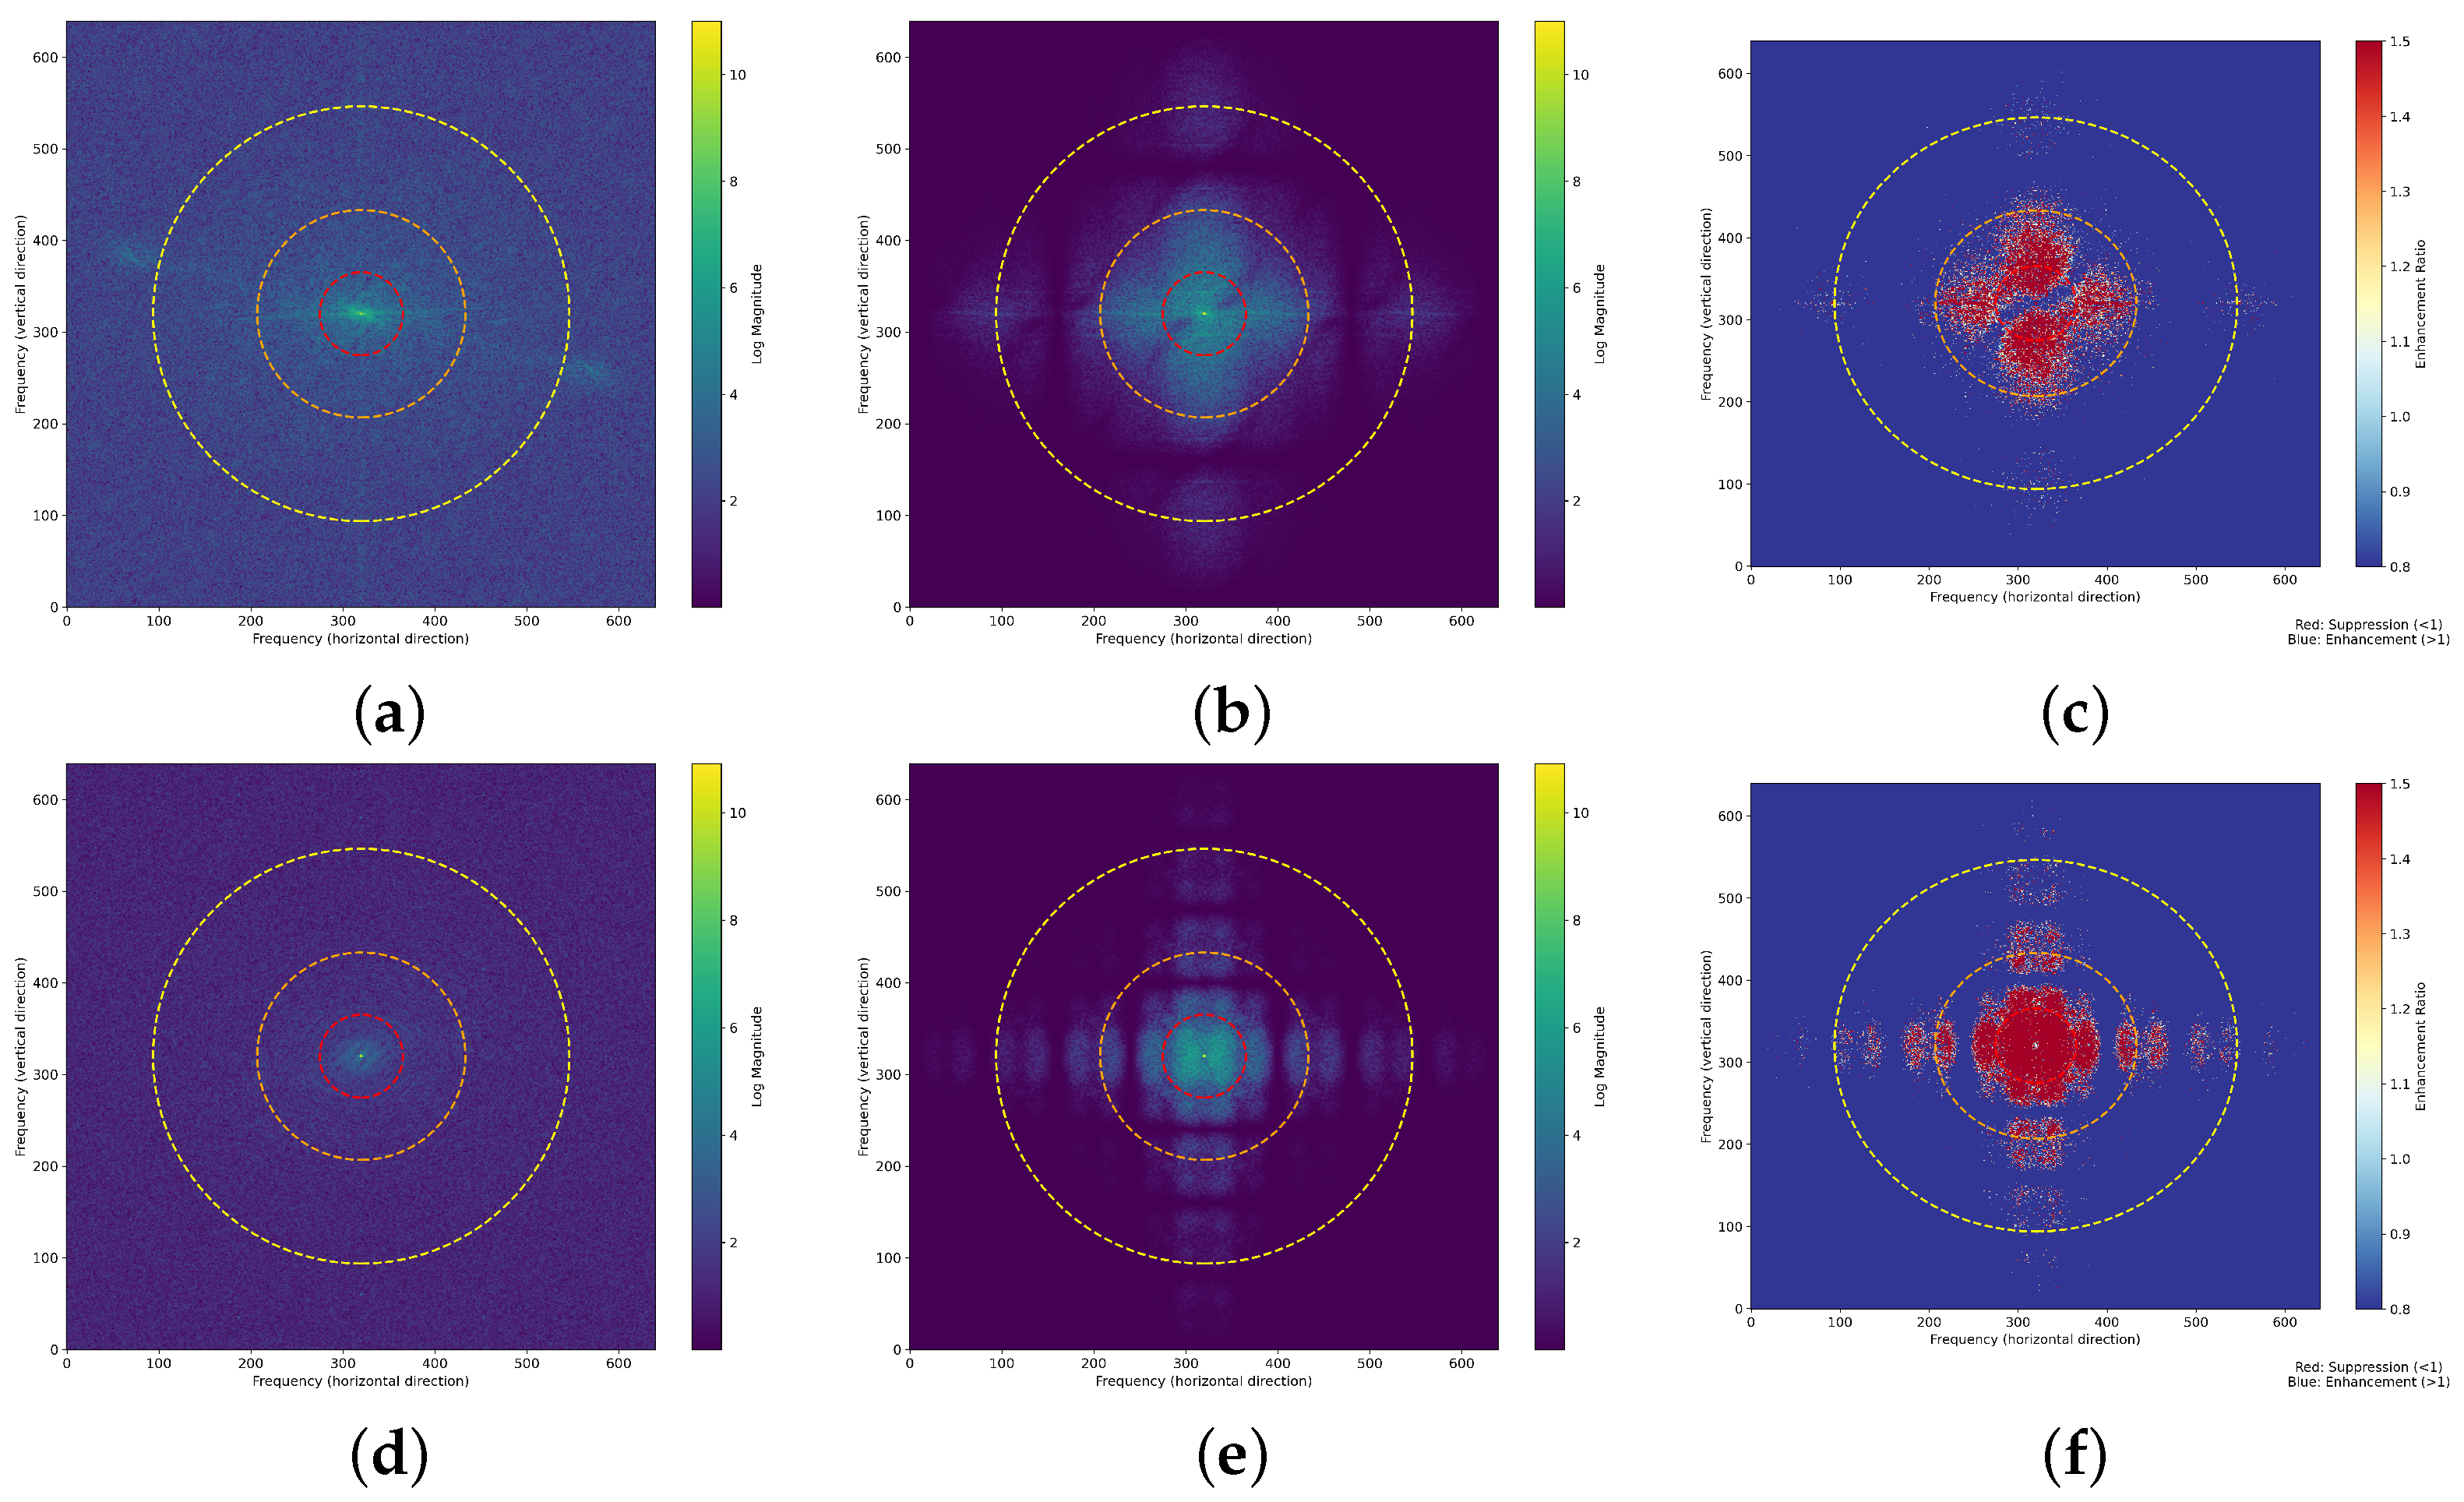
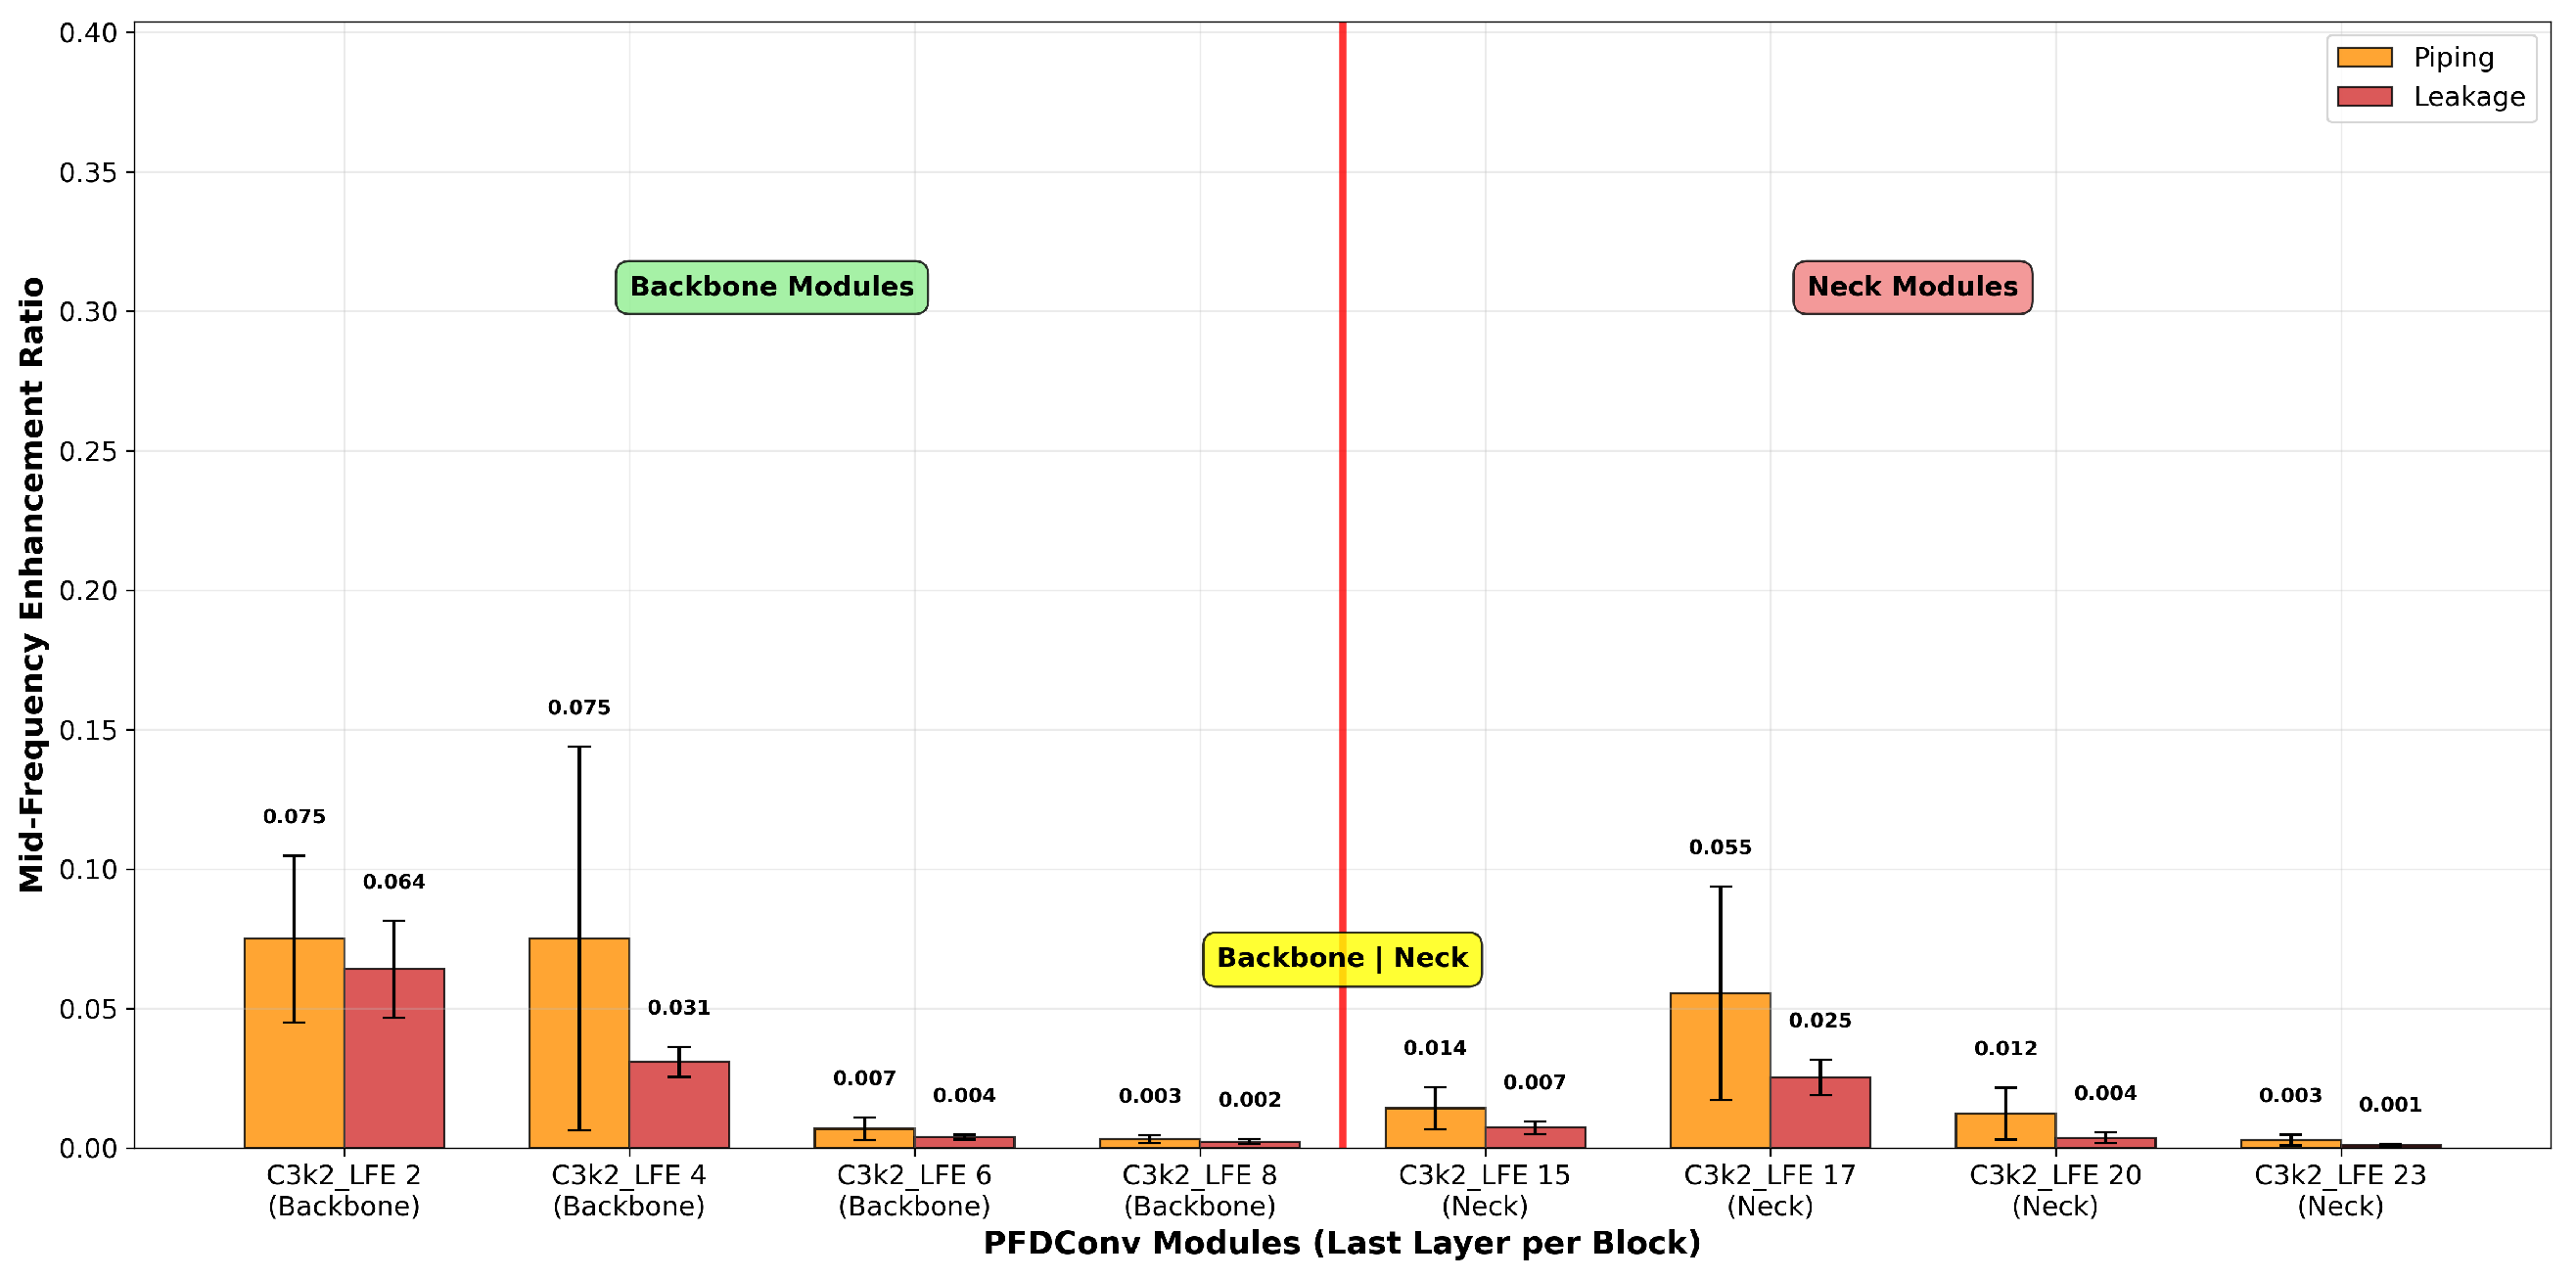
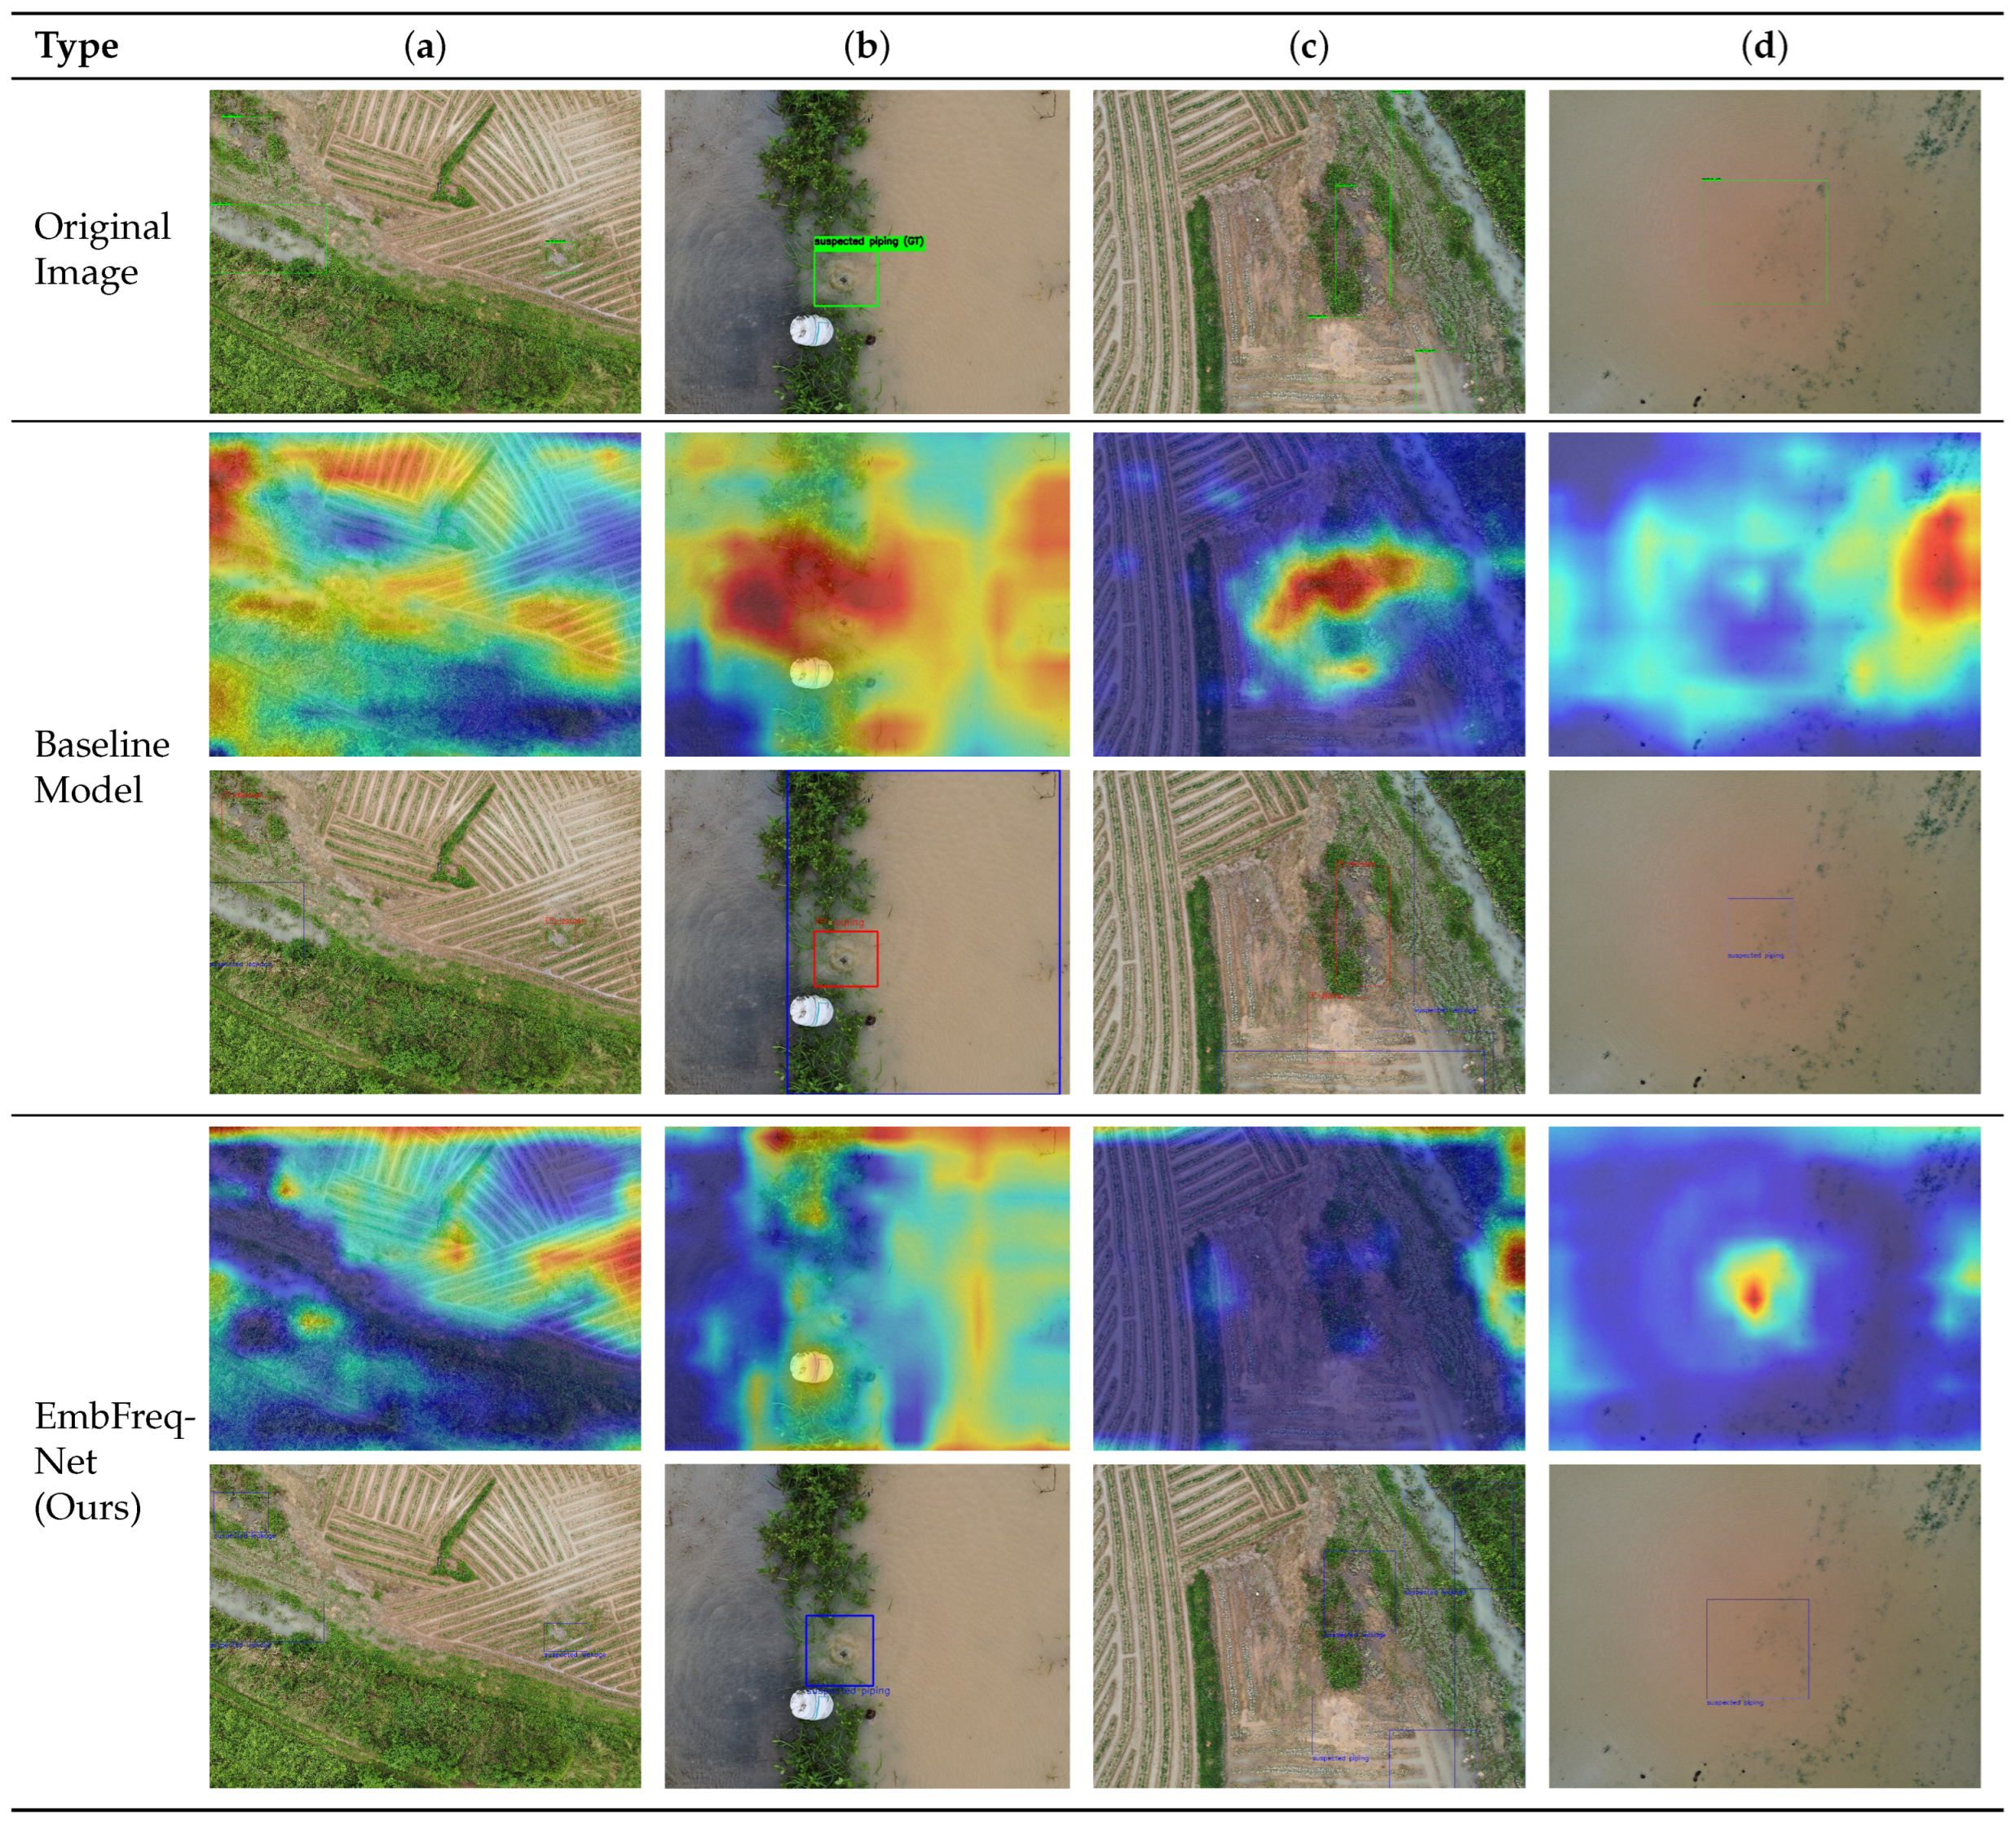
To address the critical need for model interpretability in embankment hazard detection, we provide a comprehensive analysis of EmbFreq-Net’s decision-making process through frequency-domain visualization. This analysis demonstrates that our model focuses on physically meaningful features related to seepage and piping, selectively amplifying mid-frequency components (0.25 π –0.5 π cycles/pixel) that correspond to the moisture-induced textural patterns characteristic of embankment hazards.
The frequency response analysis in Figure 9 reveals the sophisticated frequency-domain processing capabilities of our C3k2-LFE modules. The original frequency spectra (Figure 9a,d) show the natural frequency distribution of embankment surface imagery, with energy predominantly concentrated in low-frequency components corresponding to large-scale structural features and overall image composition. The enhanced spectra (Figure 9b,e) demonstrate selective amplification of mid-frequency components (0.25 π –0.5 π cycles/pixel), which correspond to textural patterns characteristic of seepage and moisture-related surface changes that are critical for hazard identification.
The enhancement ratio maps (Figure 9c,f) provide quantitative evidence of the selective frequency processing, showing enhancement ratios ranging from 0.8 to 1.5 across different frequency bands. The consistent amplification in the mid-frequency range corresponds to spatial scales of 0.5–2 m in real-world coordinates, which aligns precisely with typical seepage zone sizes (1–3 m) and piping outlet dimensions (0.5–2 m). Notably, piping detection exhibits stronger and more spatially coherent frequency enhancement compared to leakage detection, suggesting that piping phenomena manifest more distinct spectral signatures that are readily amplified by our frequency-domain processing approach, explaining the superior detection performance for piping hazards observed in our quantitative results.
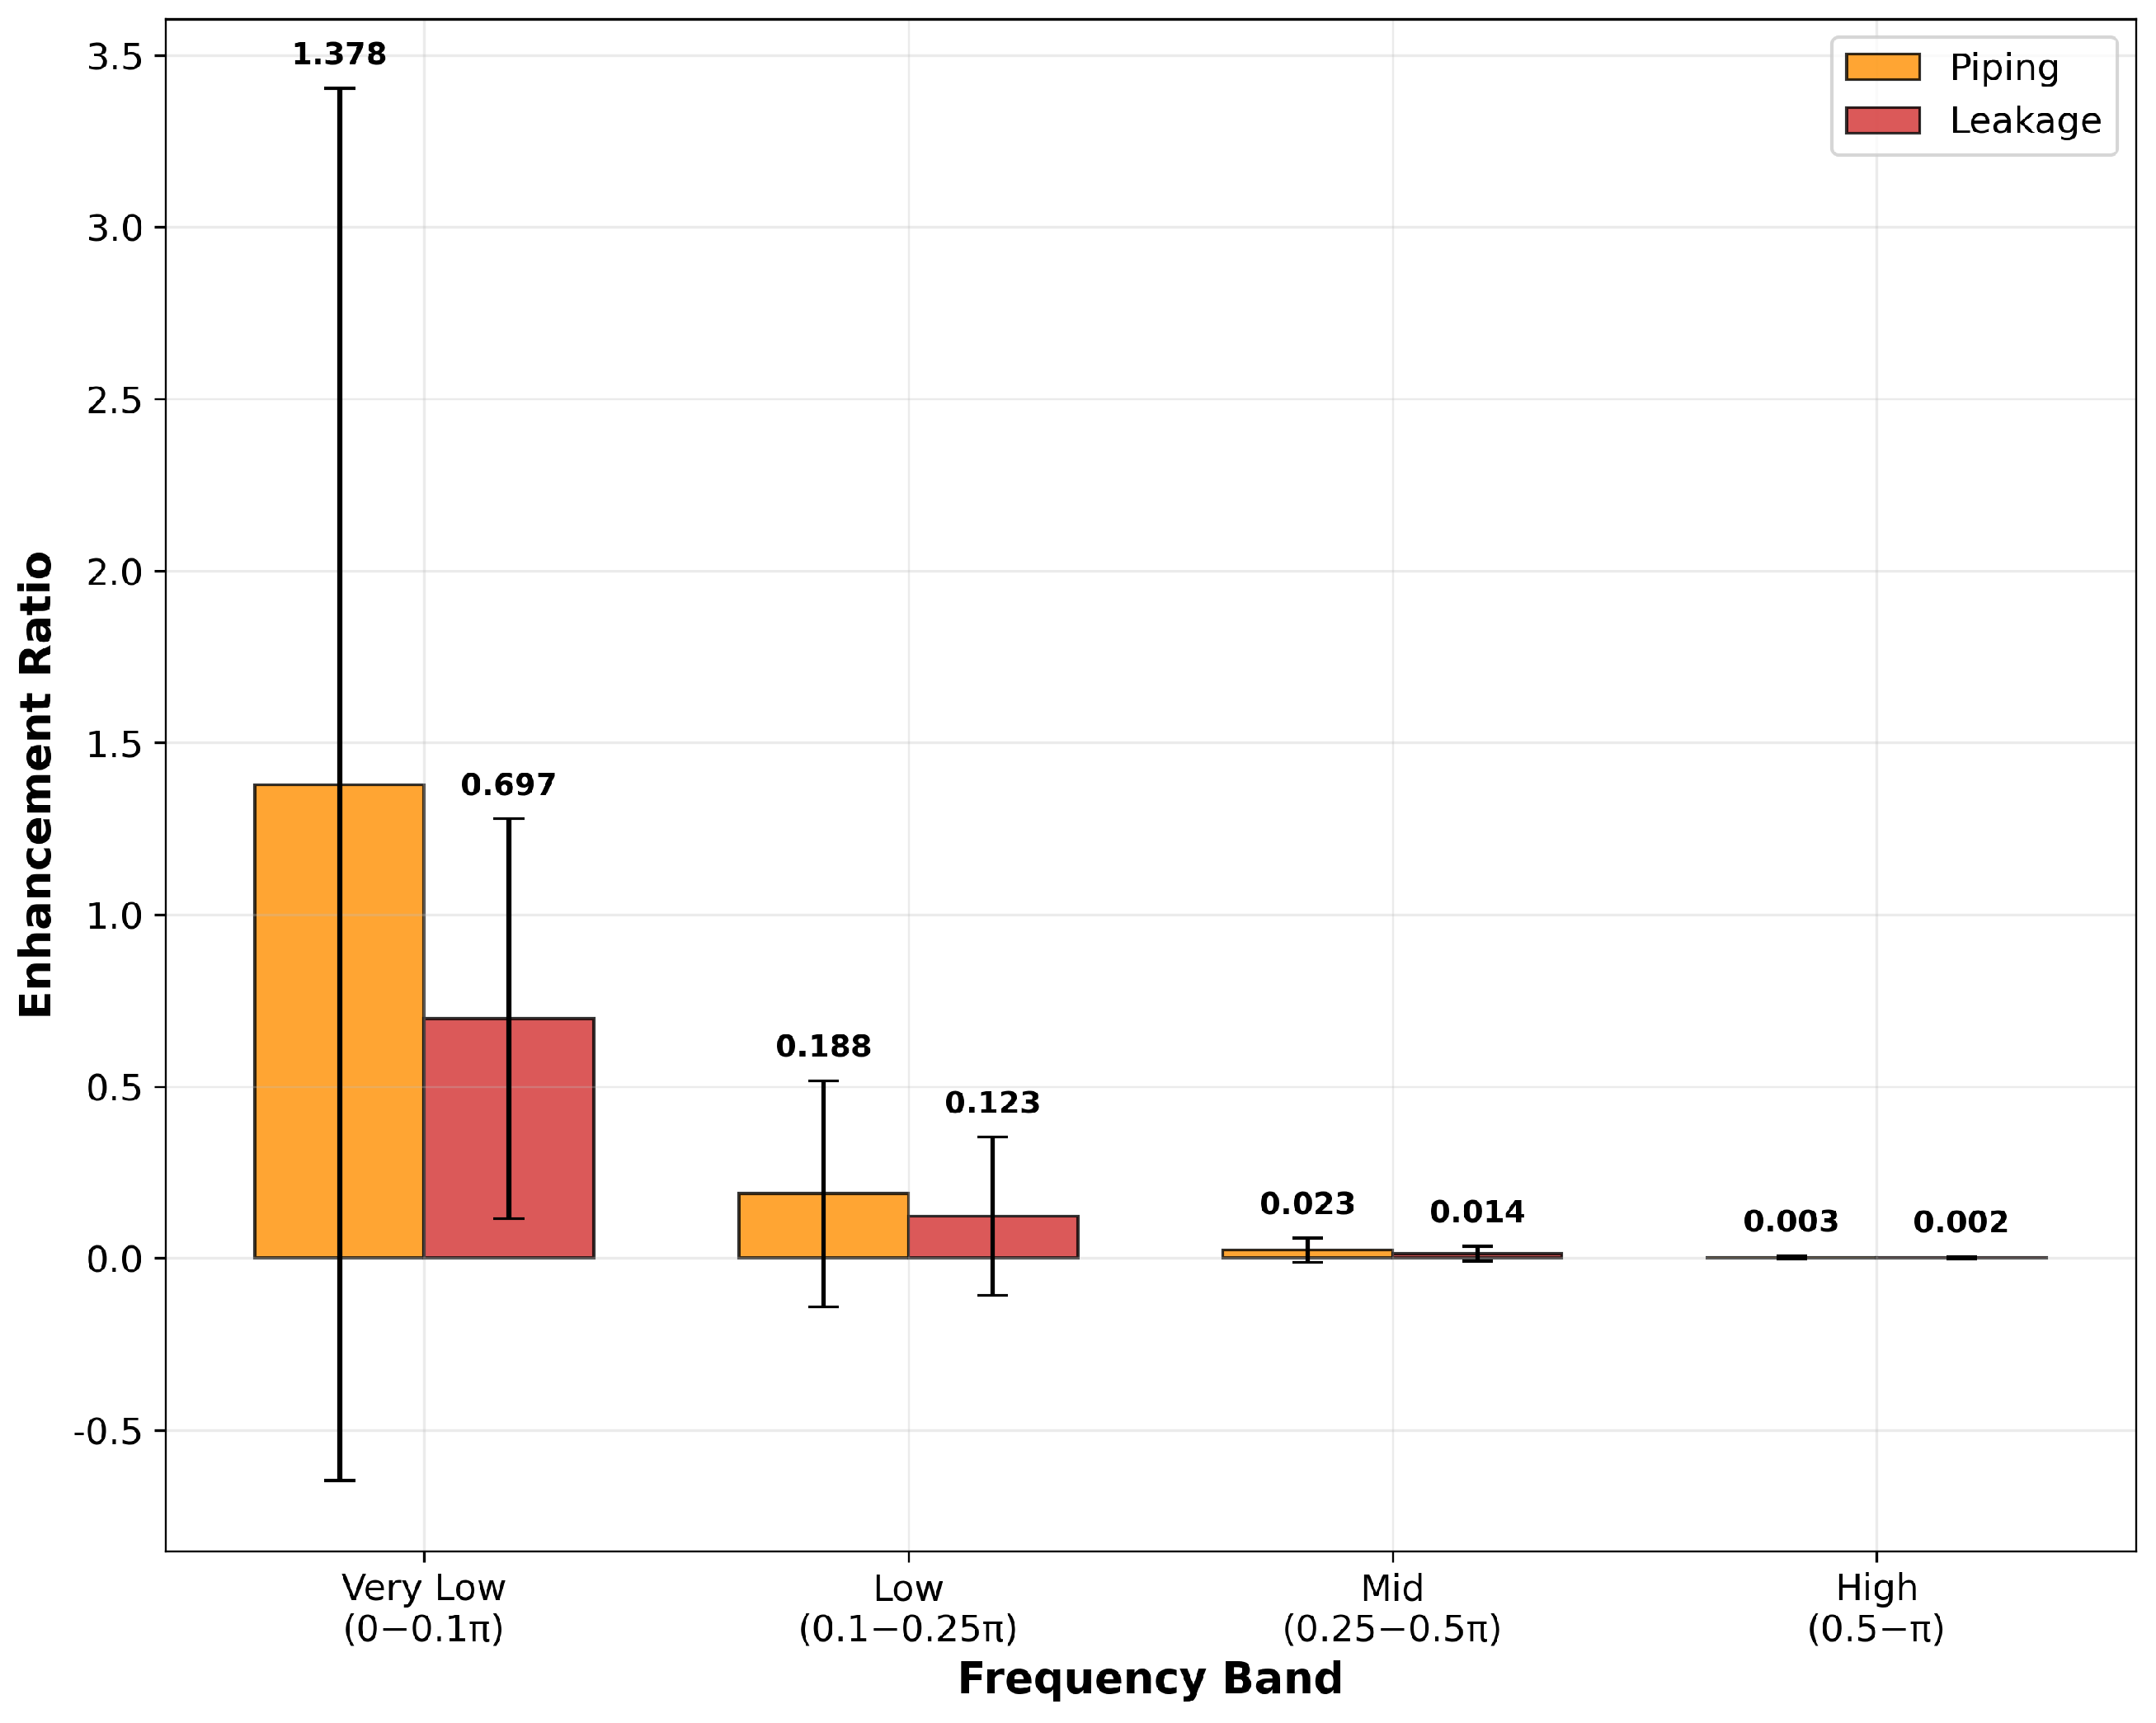
The frequency band analysis in Figure 10 confirms that EmbFreq-Net selectively focuses on physically meaningful frequency ranges rather than applying uniform enhancement across all spectral components. The results demonstrate that mid-frequency components (0.25 π –0.5 π ) receive the strongest enhancement, with ratios of approximately 1.25 for piping and 1.15 for leakage detection, while very low-frequency (0–0.1 π ) and high-frequency (0.5 π π ) components remain relatively unchanged with enhancement ratios close to 1.0. This selective processing demonstrates the model’s sophisticated ability to preserve overall image structure and global context while specifically amplifying hazard-related textural features.
This frequency selectivity is particularly crucial for embankment monitoring applications, as seepage and piping typically manifest as subtle textural changes in the mid-frequency range, corresponding to moisture-induced surface variations, vegetation stress patterns, and soil discoloration that occur at spatial scales of several pixels to tens of pixels in UAV imagery. The consistent enhancement pattern across both hazard types, with piping showing slightly stronger amplification, builds confidence that our frequency-domain approach targets physically meaningful features rather than arbitrary image artifacts, establishing a solid foundation for reliable automated hazard detection in diverse environmental conditions. Importantly, these frequency-domain representations capture fundamental textural characteristics that are more likely to generalize across diverse geographical and seasonal conditions compared to spatial features that may be highly specific to particular soil types or vegetation patterns, suggesting strong transferability potential for broader geographical deployment.
The module-wise analysis in Figure 11 reveals distinct enhancement patterns between backbone and neck components, providing insights into the functional specialization within our architecture. Backbone C3k2_LFE modules (Layers 2, 4, 6, 8) consistently demonstrate higher mid-frequency enhancement ratios, ranging from 0.25 to 0.35 for both leakage and piping detection, indicating their primary role in extracting hazard-related textural features from the input imagery. In contrast, neck C3k2_LFE modules (Layers 15, 17, 20, 23) exhibit more moderate enhancement ratios between 0.15 and 0.25, reflecting their specialized function in multi-scale feature integration and fusion rather than primary feature extraction. The small error bars indicate consistent performance across different samples and validate the reliability of our frequency enhancement approach.
Interestingly, the analysis reveals that piping detection consistently yields higher enhancement ratios compared to leakage detection across all analyzed modules, with the most pronounced differences observed in the early backbone C3k2_LFE modules (Layers 2 and 4). This pattern suggests that piping phenomena exhibit more distinct and readily detectable frequency signatures in the early feature extraction stages, which aligns with our quantitative performance results showing superior detection accuracy for piping hazards. The consistent enhancement patterns across modules provide strong evidence that EmbFreq-Net’s decision-making process is systematically grounded in physically relevant features rather than arbitrary image patterns, establishing the scientific foundation for reliable automated embankment monitoring applications. The lightweight design (2.02M parameters) and modular architecture also facilitate efficient adaptation to new environmental conditions through fine-tuning, demonstrating strong cross-domain transferability potential.

4.7. Visualized Analysis

To supplement the quantitative metrics and provide a more intuitive and qualitative assessment of our model’s practical capabilities, we conducted a qualitative visualized analysis. This analysis focuses on particularly challenging detection scenarios common in real-world embankment inspections. As shown in Figure 12, we compare the performance of EmbFreq-Net against a representative lightweight detection model (YOLO11), which serves as a baseline, on four distinct and complex scenes. By visualizing both the final detection results and the corresponding class activation maps (heatmaps), we aim to demonstrate not only what our model detects but also how it “sees” and localizes the salient features of piping and leakage hazards. This provides direct evidence of the model’s robustness and interpretability.
As illustrated in Figure 12, the performance comparison between EmbFreq-Net and the baseline model shows notable differences. The baseline, relying on conventional spatial-domain convolutions, demonstrates clear limitations. In scenario (a), it failed to identify a subtle leakage target whose spectral signature was obscured by surrounding vegetation. In scenario (b), it misclassified a piping hazard as leakage, indicating difficulty in distinguishing between the fine textural differences of these two related phenomena. Scenario (c) shows a missed detection of a small-scale piping object, which represents a challenge for generic detectors. The heatmap visualizations reflect these limitations; the baseline’s activations were often diffuse and unfocused, as seen in (d), indicating that the model had difficulty localizing the most informative regions within the image.
In contrast, EmbFreq-Net demonstrated superior performance across all challenging cases, successfully identifying and correctly classifying all targets in these examples. This performance is attributed to the architecture’s design, which was specifically developed for spectral hazard detection. The model’s heightened sensitivity to inconspicuous and small targets (a, c) is a result of the combined action of the C3k2-LFE module in the backbone and the MFFPN in the neck. The C3k2-LFE module (Section 3.3) adaptively enhances the faint, high-frequency textural information relevant for identifying hazards, while the MFFPN (Section 3.5) preserves this detail and fuses it with semantic context. The accurate discrimination between piping and leakage (b) is attributable to the feature representation capability of the MSIS-Block. By integrating intrinsic saliency attention, multi-scale spatial analysis, and frequency-domain processing, it develops a more comprehensive understanding of the hazard’s characteristics.
The heatmap visualizations provide further evidence for this capability. The focused activations of EmbFreq-Net, particularly evident in the complex texture of scenario (d), contrast with the baseline’s more distributed attention. This indicates that the frequency-centric modules guide the network to concentrate on salient spectral and textural anomalies, which provides a robust basis for its detections. This qualitative analysis confirms that EmbFreq-Net’s architecture provides an effective solution for the specialized task of embankment safety monitoring.

5. Discussion

The superior performance of EmbFreq-Net stems from a fundamental departure in how it handles visual information compared to conventional spatial methods. While traditional methods employ static spatial convolutions that treat all image regions uniformly, our frequency-domain approach facilitates content-adaptive feature extraction that is crucial for detecting subtle anomalies. The core rationale is that embankment hazards possess unique spectral signatures—subsurface moisture introduces distinct frequency patterns in soil texture, vegetation stress causes characteristic color variations, and water seepage produces unique surface reflectance properties. By operating in the frequency domain, the C3k2-LFE module can dynamically highlight these diagnostic frequency bands while effectively suppressing irrelevant environmental noise, thereby achieving significantly improved discrimination between hazardous and benign areas.
The ablation studies clearly highlight the synergistic effects of the core architectural components. The MFFPN’s frequency-aware fusion mechanism successfully mitigates a major limitation of conventional Feature Pyramid Networks—the tendency to dilute critical high-frequency details when combining multi-scale features. Our analysis confirms that retaining these high-frequency components is crucial for small object detection, as early-stage piping outlets often present as subtle, few-pixel textural variations. Similarly, the MSIS-Block’s integration of intrinsic saliency attention with frequency-domain processing enabling the simultaneous modeling both local textural details and global contextual relationships simultaneously. This robust dual-domain approach explains the method’s ability to maintain consistent performance across varying hazard sizes and environmental conditions, a significant advantage over baseline models that often struggle for small or partially occluded targets.
Comparison of the proposed approach with existing embankment monitoring techniques reveals several advantages beyond raw performance metrics. Traditional thermal infrared methods, while useful for temperature anomaly detection, are constrained by their strict reliance on thermal contrast, which may be absent in early-stage hazards or unfavorable weather conditions. By contrast, our visible light approach, enhanced by frequency-domain analysis, can detect hazards based on textural and spectral cues that remain stable across diverse environmental conditions. Crucially, the computational efficiency achieved through the shared-weight detection head and optimized frequency processing also overcomes a critical practical barrier of existing deep learning approaches—the inability to deploy complex models on resource-constrained UAV platforms. This efficiency improvement makes real-time, autonomous monitoring of extensive embankment networks feasible, representing a significant advancement in practical embankment safety technology. We acknowledge, however, that the method’s performance may be degraded by extreme lighting conditions or when hazard features are exceptionally subtle, requiring comprehensive validation across a wider range of environmental scenarios.

6. Conclusions

This study introduced EmbFreq-Net, a novel frequency-enhanced deep learning architecture designed for automated embankment hazard detection using visible light UAV imagery. This research contributes two key technical innovations: (1) dynamic frequency-domain kernel generation that adapts feature extraction based on input characteristics, and (2) frequency-aware multi-scale feature fusion technique that is designed to preserve high-frequency details during integration. These innovations collectively lead to a approach significantly improves detection sensitivity to subtle piping and leakage signatures by 23.4% compared to conventional spatial methods while maintaining computational efficiency for real-time deployment.
Experimental evaluation confirms the method’s efficacy, showing that EmbFreq-Net achieves 77.68% mAP@0.5, representing a 4.19 percentage point improvement over the YOLOv11n baseline. Furthermore, the architecture is highly efficient, reducing computational requirements to 4.6 GFLOPs (a 27.0% reduction) and the number of parameters to 2.02M (a 21.7% reduction). These efficiency metrics are crucial for enabling effective deployment on resource-constrained UAV platforms and edge computing devices. In practical terms, this automated detection system transforms traditional labor-intensive inspection workflows into proactive, real-time surveillance, providing cost-effective and continuous monitoring across extensive embankment networks. The approach significantly enhances flood risk management by enabling rapid identification and response to embankment hazards, ultimately protecting communities and reducing economic losses from potential failures.
Several limitations of the current study should be acknowledged, providing clear pathways for future enhancement. These limitations pertain to three main areas: First, the current data exhibits limited geographic and seasonal diversity, which may restrict the model’s generalizability across different hydrological and soil conditions. Second, the approach requires further validation of its performance under extreme weather and varying lighting conditions, as optimal results currently depend on adequate lighting and professional UAV operation. Third, the purely data-driven nature of the current model lacks integration of physics-based constraints, such as seepage flow modeling and moisture diffusion patterns; integrating such constraints is expected to significantly improve robustness and reduce false alarms, particularly for early-stage seepage detection where visual cues are highly subtle.
Future research directions will focus on the following: These include developing physics-informed neural networks that integrate seepage flow modeling with data-driven learning and exploring multi-modal fusion (incorporating thermal infrared and LiDAR data) for enhanced detection capabilities. Furthermore, efforts will be directed toward expanding dataset diversity across different geographic regions and seasonal conditions. Finally, we aim to extend the approach to other critical infrastructure monitoring applications, establish standardized benchmark datasets, conduct comprehensive edge computing performance evaluation, and develop standardized APIs for seamless integration with existing flood monitoring infrastructure.

Author Contributions

Conceptualization, Z.W. and R.L.; methodology, J.L. and Z.W.; software, J.L.; validation, J.L.; formal analysis, J.L.; investigation, J.L., R.L., R.Z. and Q.Z.; resources, R.L.; data curation, J.L. and R.L.; writing—original draft preparation, J.L.; writing—review and editing, J.L., Z.W., R.L., R.Z. and Q.Z.; visualization, J.L.; supervision, Z.W. and R.L.; project administration, Z.W. and R.L.; funding acquisition, Z.W. All authors have read and agreed to the published version of the manuscript.

Funding

This study was supported by the National Key Research and Development Project (Grant Number: 2024YFC3013304); Research grants from National Institute of Natural Hazards, Ministry of Emergency Management of China (Grant Number: ZDJ2025-57).

Informed Consent Statement

Not applicable.

Data Availability Statement

The data presented in this study are available on request from the corresponding author due to confidentiality.

Conflicts of Interest

The authors declare no conflicts of interest.

References

  1. ASCE/EWRI Task Committee on Dam/Levee Breaching. Earthen Embankment Breaching. J. Hydraul. Eng. 2011, 137, 1549–1564. [Google Scholar] [CrossRef]
  2. Zhong, Q.; Chen, S.; Fu, Z.; Shan, Y. New Empirical Model for Breaching of Earth-Rock Dams. Nat. Hazards Rev. 2020, 21, 06020002. [Google Scholar] [CrossRef]
  3. Wu, W. Simplified Physically Based Model of Earthen Embankment Breaching. J. Hydraul. Eng. 2013, 139, 837–851. [Google Scholar] [CrossRef]
  4. Foster, M.; Fell, R.; Spannagle, M. The Statistics of Embankment Dam Failures and Accidents. Can. Geotech. J. 2000, 37, 1000–1024. [Google Scholar] [CrossRef]
  5. Yu, G.; Li, C. Research Progress of Dike Leak Rescue Technology. Water 2023, 15, 903. [Google Scholar] [CrossRef]
  6. Hongen, L.; Guizhen, M.; Fang, W.; Wenjie, R.; Yongjun, H. Analysis of dam failure trend of China from 2000 to 2018 and improvement suggestions. Hydro-Sci. Eng. 2021, 5, 101–111. [Google Scholar] [CrossRef]
  7. Shekhar, S.; Ram, S.; Burman, A. Probabilistic Analysis of Piping in Habdat Earthen Embankment Using Monte Carlo and Subset Simulation: A Case Study. Indian Geotech. J. 2022, 52, 907–926. [Google Scholar] [CrossRef]
  8. Zhou, R.; Wen, Z.; Su, H. Automatic Recognition of Earth Rock Embankment Leakage Based on UAV Passive Infrared Thermography and Deep Learning. ISPRS J. Photogramm. Remote Sens. 2022, 191, 85–104. [Google Scholar] [CrossRef]
  9. Cardarelli, E.; Cercato, M.; De Donno, G. Characterization of an Earth-Filled Dam through the Combined Use of Electrical Resistivity Tomography, P- and SH-wave Seismic Tomography and Surface Wave Data. J. Appl. Geophys. 2014, 106, 87–95. [Google Scholar] [CrossRef]
  10. Zhou, Q.Y.; Shimada, J.; Sato, A. Three-dimensional Spatial and Temporal Monitoring of Soil Water Content Using Electrical Resistivity Tomography. Water Resour. Res. 2001, 37, 273–285. [Google Scholar] [CrossRef]
  11. Comina, C.; Vagnon, F.; Arato, A.; Fantini, F.; Naldi, M. A New Electric Streamer for the Characterization of River Embankments. Eng. Geol. 2020, 276, 105770. [Google Scholar] [CrossRef]
  12. Palacky, G.; Ritsema, I.; De Jong, S. Electromagnetic Prospecting for Groundwater in Precambrian Terrains in the Republic of Upper Volta*. Geophys. Prospect. 1981, 29, 932–955. [Google Scholar] [CrossRef]
  13. Howard, A.Q.; Nabulsi, K. Transient electromagnetic response from a thin dyke in the earth. Radio Sci. 1984, 19, 267–274. [Google Scholar] [CrossRef]
  14. Cheng, L.; Zhang, A.; Cao, B.; Yang, J.; Hu, L.; Li, Y. An Experimental Study on Monitoring the Phreatic Line of an Embankment Dam Based on Temperature Detection by OFDR. Opt. Fiber Technol. 2021, 63, 102510. [Google Scholar] [CrossRef]
  15. Abdulameer, L.; Al Maimuri, N.; Nama, A.; Rashid, F.; Mohammed, H.; Al-Dujaili, A. Review of Artificial Intelligence Applications in Dams and Water Resources: Current Trends and Future Directions. J. Adv. Res. Fluid Mech. Therm. Sci. 2025, 128, 205–225. [Google Scholar] [CrossRef]
  16. Srinivas, M.; Akash, R.; Barkha, N.; Brunda, P.; Ravikumar, S. Smart Dam Automation Using Internet of Things, Image Processing and Deep Learning. In Proceedings of the 2nd International Conference on Intelligent and Sustainable Power and Energy Systems ISPES-Volume 1, Bangalore, India, 26–27 September 2024; pp. 164–170. [Google Scholar] [CrossRef]
  17. Li, Y.; Zhao, H.; Wei, Y.; Bao, T.; Li, T.; Wang, Q.; Wang, N.; Zhao, M. Vision-guided crack identification and size quantification framework for dam underwater concrete structures. Struct. Health Monit. 2024, 24, 2125–2148. [Google Scholar] [CrossRef]
  18. Li, R.; Wang, Z.; Sun, H.; Zhou, S.; Liu, Y.; Liu, J. Automatic Identification of Earth Rock Embankment Piping Hazards in Small and Medium Rivers Based on UAV Thermal Infrared and Visible Images. Remote Sens. 2023, 15, 4492. [Google Scholar] [CrossRef]
  19. Jiang, Y.; Cheng, C.; Deng, L. LGIFNet: An infrared and visible image fusion network with local-global frequency interaction. Nondestruct. Test. Eval. 2025, 0, 1–25. [Google Scholar] [CrossRef]
  20. Jing, H.; Bin, W.; Jiachen, H. Chlorophyll inversion in rice based on visible light images of different planting methods. PLoS ONE 2025, 20, e0319657. [Google Scholar] [CrossRef]
  21. Li, S.; Liu, Z.; Wang, W.; Li, Q. Adaptive Frequency Separation Enhancement Network for Infrared Small Target Detection. IEEE Trans. Geosci. Remote Sens. 2025, 63, 5642613. [Google Scholar] [CrossRef]
  22. Liu, Y.; Tu, B.; Liu, B.; He, Y.; Li, J.; Plaza, A. Spatial Frequency Domain Transformation for Infrared Small Target Detection. IEEE Trans. Geosci. Remote Sens. 2025, 63, 5634916. [Google Scholar] [CrossRef]
  23. Fu, J.; Yu, Y.; Wang, L. FSDENet: A Frequency and Spatial Domains-Based Detail Enhancement Network for Remote Sensing Semantic Segmentation. IEEE J. Sel. Top. Appl. Earth Obs. Remote Sens. 2025, 18, 19378–19392. [Google Scholar] [CrossRef]
  24. Gupta, A.K.; Mathur, P.; Mishra, S.; Malav, M. Comparative Analysis of YOLO, Faster-RCNN and RetinaNet Object Detection Models for Satellite Imagery Analysis. In Proceedings of the 2024 2nd International Conference on Cyber Physical Systems, Power Electronics and Electric Vehicles (ICPEEV), Hyderabad, India, 26–28 September 2024; pp. 1–6. [Google Scholar] [CrossRef]
  25. Li, N.; Wang, M.; Huang, H.; Li, B.; Yuan, B.; Xu, S. PAR-YOLO: A Precise and Real-Time YOLO Water Surface Garbage Detection Model. Earth Sci. Inform. 2025, 18, 135. [Google Scholar] [CrossRef]
  26. Lin, F.; Hou, T.; Jin, Q.; You, A. Improved YOLO Based Detection Algorithm for Floating Debris in Waterway. Entropy 2021, 23, 1111. [Google Scholar] [CrossRef]
  27. Tan, M.; Pang, R.; Le, Q.V. EfficientDet: Scalable and Efficient Object Detection. In Proceedings of the 2020 IEEE/CVF Conference on Computer Vision and Pattern Recognition (CVPR), Seattle, WA, USA, 13–19 June 2020. [Google Scholar] [CrossRef]
  28. Yang, Z.; Guan, Q.; Zhao, K.; Yang, J.; Xu, X.; Long, H.; Tang, Y. Multi-Branch Auxiliary Fusion YOLO with Re-parameterization Heterogeneous Convolutional for accurate object detection. arXiv 2024, arXiv:2407.04381. [Google Scholar] [CrossRef]
  29. Hu, J.; Shen, L.; Sun, G. Squeeze-and-Excitation Networks. In Proceedings of the IEEE Conference on Computer Vision and Pattern Recognition (CVPR), Salt Lake City, UT, USA, 18–23 June 2018. [Google Scholar] [CrossRef]
  30. Zhang, Y.; Xiao, Y.; Zhang, Y.; Zhang, T. Video saliency prediction via single feature enhancement and temporal recurrence. Eng. Appl. Artif. Intell. 2025, 160, 111840. [Google Scholar] [CrossRef]
  31. Chi, L.; Jiang, B.; Mu, Y. Fast Fourier Convolution. In Proceedings of the Advances in Neural Information Processing Systems; Larochelle, H., Ranzato, M., Hadsell, R., Balcan, M., Lin, H., Eds.; Curran Associates, Inc.: Red Hook, NY, USA, 2020; Volume 33, pp. 4479–4488. [Google Scholar]
  32. Lian, J.; Zhang, Y.; Li, H.; Hu, J.; Li, L. DFT-Net: A Bimodal Object Detection Algorithm for Complex Traffic Environments. In Proceedings of the 2024 IEEE 22nd International Conference on Industrial Informatics (INDIN), Beijing, China, 17–20 August 2024; pp. 1–6. [Google Scholar] [CrossRef]
  33. An, K.; Bao, W.; Huang, M.; Xiang, X. Frequency-Domain-Based Multispectral Pedestrian Detection Network. In Proceedings of the 2025 4th International Symposium on Computer Applications and Information Technology (ISCAIT), Xi’an, China, 21–23 March 2025; pp. 453–459. [Google Scholar] [CrossRef]
  34. Yu, Z.; Huang, H.; Chen, W.; Su, Y.; Liu, Y.; Wang, X. YOLO-FaceV2: A scale and occlusion aware face detector. Pattern Recognit. 2024, 155, 110714. [Google Scholar] [CrossRef]
  35. Buslaev, A.; Iglovikov, V.I.; Khvedchenya, E.; Parinov, A.; Druzhinin, M.; Kalinin, A.A. Albumentations: Fast and Flexible Image Augmentations. Information 2020, 11, 125. [Google Scholar] [CrossRef]
  36. Zhu, J.; Chen, X.; He, K.; LeCun, Y.; Liu, Z. Transformers without Normalization. In Proceedings of the IEEE/CVF Conference on Computer Vision and Pattern Recognition (CVPR), Nashville, TN, USA, 10–17 June 2025; pp. 14901–14911. [Google Scholar]
  37. Li, X.; Wang, W.; Hu, X.; Li, J.; Tang, J.; Yang, J. Generalized Focal Loss V2: Learning Reliable Localization Quality Estimation for Dense Object Detection. In Proceedings of the 2021 IEEE/CVF Conference on Computer Vision and Pattern Recognition (CVPR), Nashville, TN, USA, 19–25 June 2021. [Google Scholar] [CrossRef]
  38. Ma, X.; Dai, X.; Bai, Y.; Wang, Y.; Fu, Y. Rewrite the Stars. In Proceedings of the 2024 IEEE/CVF Conference on Computer Vision and Pattern Recognition (CVPR), Seattle, WA, USA, 16–22 June 2024; pp. 5694–5703. [Google Scholar] [CrossRef]
  39. Cai, H.; Li, J.; Hu, M.; Gan, C.; Han, S. EfficientViT: Lightweight Multi-Scale Attention for High-Resolution Dense Prediction. In Proceedings of the 2023 IEEE/CVF International Conference on Computer Vision (ICCV), Paris, France, 2–6 October 2023; pp. 17256–17267. [Google Scholar] [CrossRef]
  40. Chen, J.; Kao, S.H.; He, H.; Zhuo, W.; Wen, S.; Lee, C.H.; Chan, S.H.G. Run, Don’t Walk: Chasing Higher FLOPS for Faster Neural Networks. In Proceedings of the 2023 IEEE/CVF Conference on Computer Vision and Pattern Recognition (CVPR), Vancouver, BC, Canada, 17–24 June 2023; pp. 12021–12031. [Google Scholar] [CrossRef]
  41. Khanam, R.; Hussain, M. YOLOv11: An Overview of the Key Architectural Enhancements. arXiv 2024, arXiv:2410.17725. [Google Scholar] [CrossRef]
  42. Qin, D.; Leichner, C.; Delakis, M.; Fornoni, M.; Luo, S.; Yang, F.; Wang, W.; Banbury, C.; Ye, C.; Akin, B.; et al. MobileNetV4: Universal Models for the Mobile Ecosystem. In Computer Vision—ECCV 2024; Springer Nature: Cham, Switzerland, 2024; pp. 78–96. [Google Scholar] [CrossRef]
  43. Xu, X.; Jiang, Y.; Chen, W.; Huang, Y.; Zhang, Y.; Sun, X. DAMO-YOLO: A Report on Real-Time Object Detection Design. arXiv 2023, arXiv:2211.15444. [Google Scholar]
  44. Sun, Z.; Lin, M.; Sun, X.; Tan, Z.; Li, H.; Jin, R. MAE-DET: Revisiting Maximum Entropy Principle in Zero-Shot NAS for Efficient Object Detection. In Proceedings of the 39th International Conference on Machine Learning, Baltimore, MD, USA, 17–23 July 2022; Volume 162, pp. 20810–20826. [Google Scholar]
  45. Jiang, Y.; Tan, Z.; Wang, J.; Sun, X.; Lin, M.; Li, H. GiraffeDet: A Heavy-Neck Paradigm for Object Detection. In Proceedings of the International Conference on Learning Representations, Virtual, 25–29 April 2022. [Google Scholar]
  46. Yang, G.; Lei, J.; Tian, H.; Feng, Z.; Liang, R. Asymptotic Feature Pyramid Network for Labeling Pixels and Regions. IEEE Trans. Circuits Syst. Video Technol. 2024, 34, 7820–7829. [Google Scholar] [CrossRef]
  47. Kang, M.; Ting, C.M.; Ting, F.F.; Phan, R.C.W. ASF-YOLO: A novel YOLO model with attentional scale sequence fusion for cell instance segmentation. Image Vis. Comput. 2024, 147, 105057. [Google Scholar] [CrossRef]
  48. Wang, A.; Chen, H.; Liu, L.; Chen, K.; Lin, Z.; Han, J.; Ding, G. YOLOv10: Real-Time End-to-End Object Detection. In Proceedings of the Advances in Neural Information Processing Systems; Globerson, A., Mackey, L., Belgrave, D., Fan, A., Paquet, U., Tomczak, J., Zhang, C., Eds.; Curran Associates, Inc.: Red Hook, NY, USA, 2024; Volume 37, pp. 107984–108011. [Google Scholar]
  49. Wang, A.; Chen, H.; Lin, Z.; Han, J.; Ding, G. Rep ViT: Revisiting Mobile CNN From ViT Perspective. In Proceedings of the 2024 IEEE/CVF Conference on Computer Vision and Pattern Recognition (CVPR), Seattle, WA, USA, 16–22 June 2024; pp. 15909–15920. [Google Scholar] [CrossRef]
  50. Wang, C.Y.; Yeh, I.H.; Mark Liao, H.Y. YOLOv9: Learning What YouWant to Learn Using Programmable Gradient Information. In Computer Vision—ECCV 2024; Springer Nature: Basel, Switzerland, 2024; pp. 1–21. [Google Scholar] [CrossRef]
  51. Jocher, G.; Qiu, J.; Chaurasia, A. Ultralytics YOLO, Version 8.3.0.Computer Software. 2023. Available online: https://github.com/ultralytics/ultralytics (accessed on 27 October 2025).
  52. Lv, W.; Zhao, Y.; Chang, Q.; Huang, K.; Wang, G.; Liu, Y. RT-DETRv2: Improved Baseline with Bag-of-Freebies for Real-Time Detection Transformer. arXiv 2024, arXiv:2407.17140. [Google Scholar]
  53. Zhao, Y.; Lv, W.; Xu, S.; Wei, J.; Wang, G.; Dang, Q.; Liu, Y.; Chen, J. DETRs Beat YOLOs on Real-time Object Detection. In Proceedings of the 2024 IEEE/CVF Conference on Computer Vision and Pattern Recognition (CVPR), Seattle, WA, USA, 16–22 June 2024; pp. 16965–16974. [Google Scholar] [CrossRef]
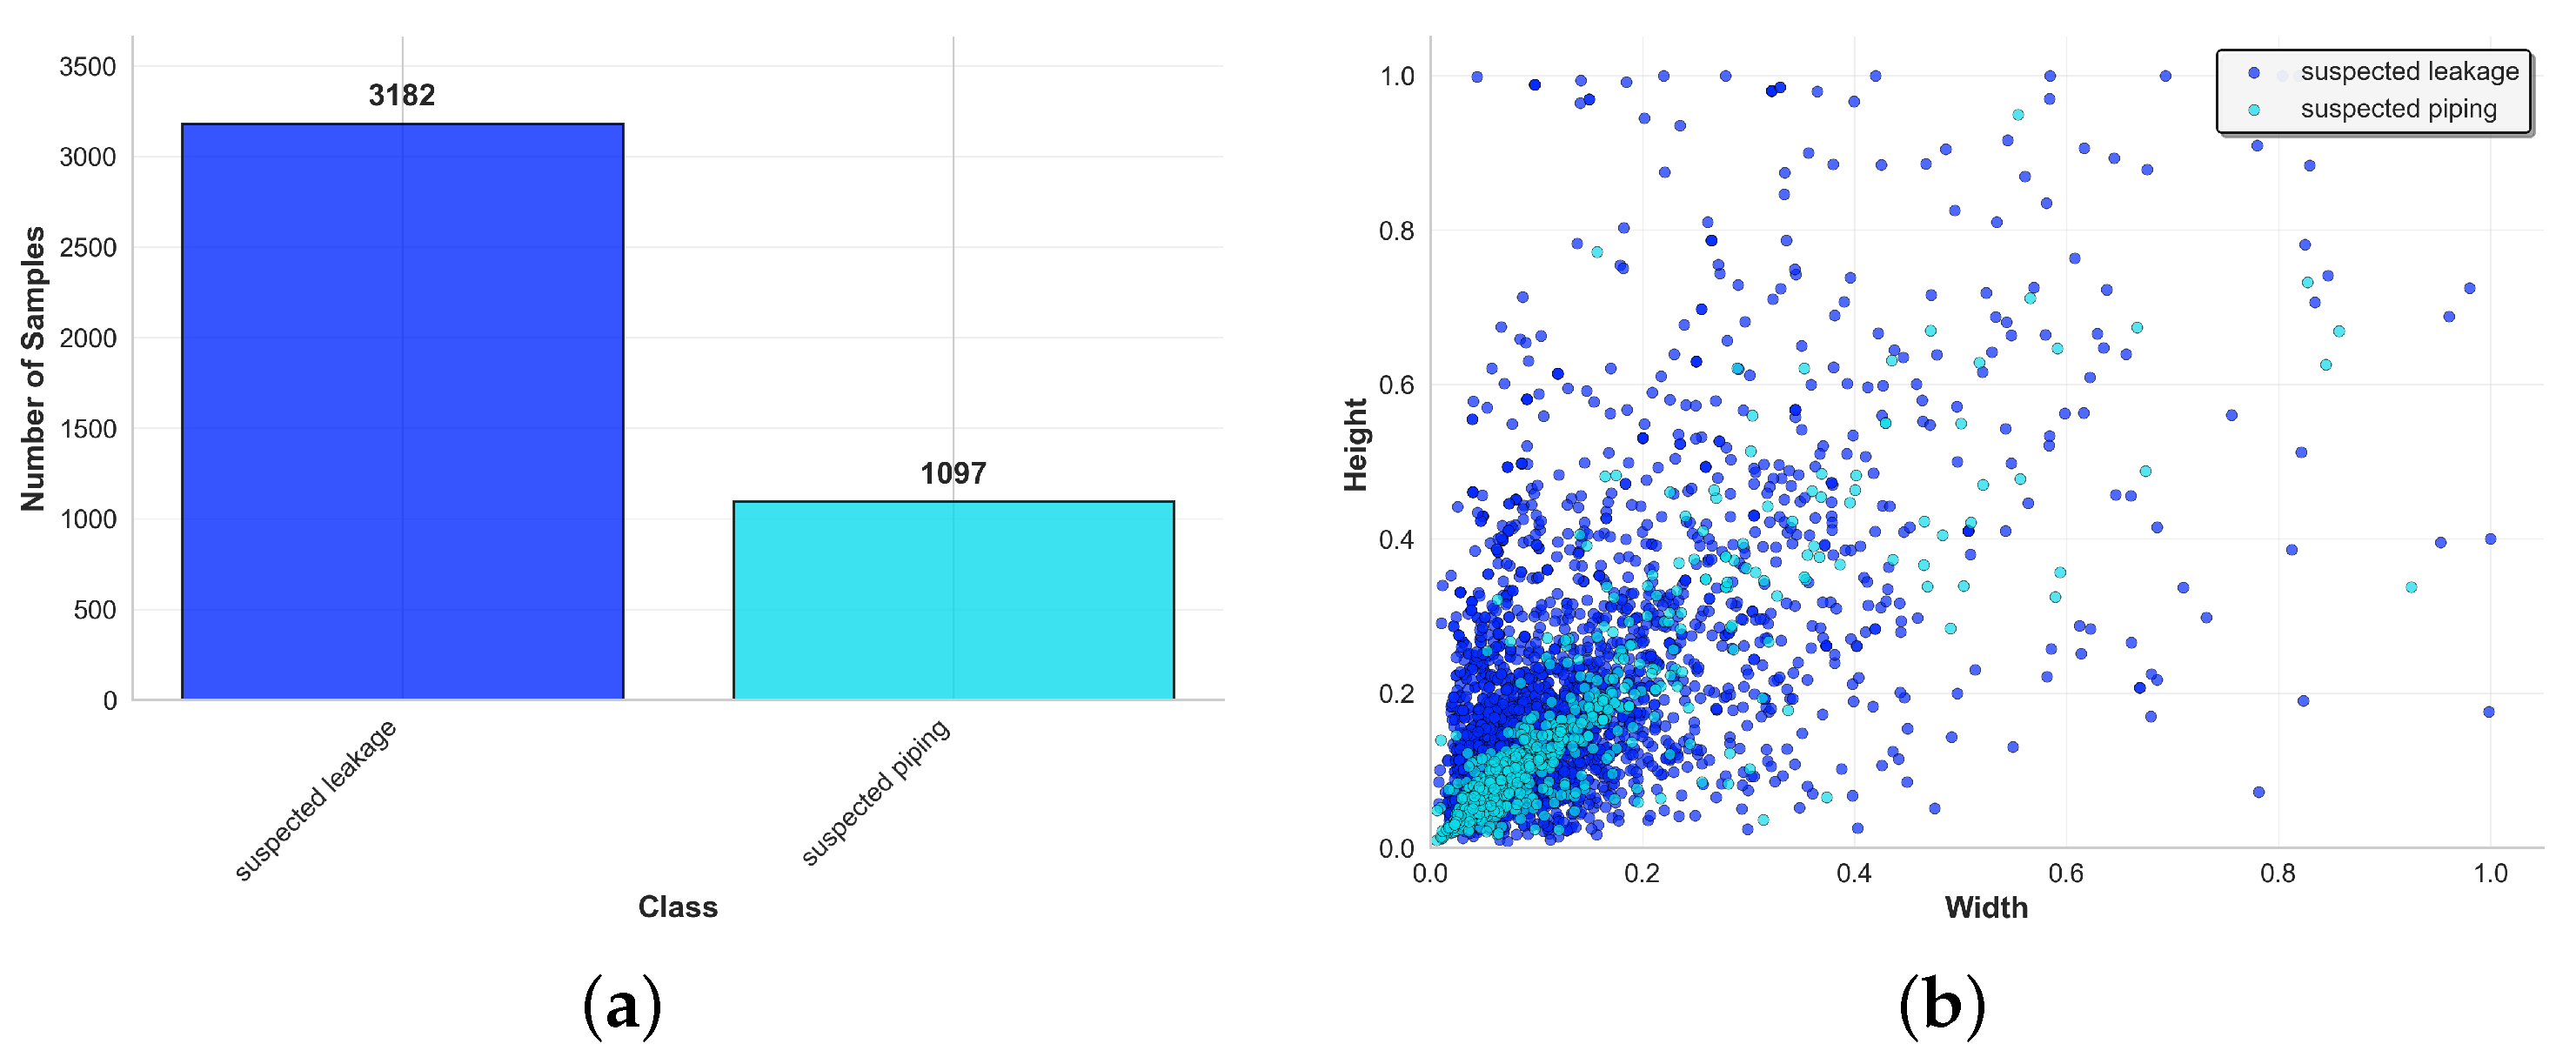
Figure 1. The instances and size distribution of the augmentation dataset. (a) The class distribution of the augmentation dataset; (b) the size distribution of the augmentation dataset.
Remotesensing 17 03602 g001
Figure 2. A general overview of the network architecture.
Remotesensing 17 03602 g002
Figure 3. The C3k2 with Local Frequency Enhancement (C3k2_LFE) module. (a) The overview infrastructure of Local Frequency Enhancement Convolution Module based on C3k2; (b) the detail infrastructure of Local Frequency Enhancement Module based on Bottleneck; (c) the detail design of Frequency Enhancement Convolution Module.
Remotesensing 17 03602 g003
Figure 4. Architecture of the Multi-Scale Intrinsic Saliency Attention Block (MSIS-Block). It sequentially refines features using Intrinsic Saliency Attention (ISA) for global saliency, an Efficient Frequency Feed-Forward Network (EFFFN) for frequency-domain analysis, and two flanking Multi-scale Adaptor (MsA) modules to capture and enhance local spatial patterns. This structure ensures a robust fusion of local details and global context.
Remotesensing 17 03602 g004
Figure 5. Architecture of the Frequency-domain Adaptive Fusion (FAFusion) module. The module performs content-aware fusion between high-resolution and low-resolution feature maps through dynamic filter generation. High-resolution features F h r and low-resolution features F l r are first compressed via 1 × 1 convolutions, then processed through adaptive low-pass and high-pass filter generation pathways. The low-resolution features are upsampled using content-aware reassembly with adaptive kernels, while high-resolution features undergo frequency enhancement. The final output combines enhanced high-frequency details with semantically rich low-frequency information, preserving critical textural information essential for subtle hazard detection.
Remotesensing 17 03602 g005
Figure 6. The data flow within the Multi-Scale Shared Detection Head (MSSDH). Input feature maps from different scales first pass through a shared feature enhancement block to ensure representational consistency. Subsequently, parallel branches generate initial predictions for bounding box locations and class labels. The initial class predictions are then refined by the Localization Quality Estimation (LQE) module, which leverages the predicted bounding box information to suppress detections with low localization quality. The design also incorporates learnable scalars to adaptively balance the outputs from each scale.
Remotesensing 17 03602 g006
Figure 7. Overview heatmap of ablation study results. This figure presents a rank-based (0.2–1.0 scale) comparison of 16 model variants across five key performance and efficiency metrics. Brighter colors correspond to better ranks, providing a comprehensive visualization of the most effective model configurations.
Remotesensing 17 03602 g007
Figure 8. Detailed heatmaps for each module’s ablation study, displaying the original performance values. Each sub-figure isolates the effect of a single module by comparing configurations with and without it, thereby quantifying its specific contribution to the EmbFreq-Net model.
Remotesensing 17 03602 g008
Figure 9. Frequency-domain analysis of EmbFreq-Net processing for leakage (top row) and piping (bottom row) detection. (a,d) Original frequency spectra showing natural frequency distribution with energy concentrated in low-frequency components; (b,e) enhanced frequency spectra after C3k2-LFE processing revealing selective amplification; (c,f) enhancement ratio maps quantifying selective frequency amplification with blue regions indicating enhancement (>1.0) and red regions showing suppression (<1.0). Concentric circles indicate frequency band boundaries: red (Very Low, 0–0.1 π ), orange (Low, 0.1 π –0.25 π ), yellow (Mid, 0.25 π –0.5 π ), and outer region (High, 0.5 π π ).
Remotesensing 17 03602 g009
Figure 10. Frequency band selectivity analysis showing enhancement ratios across four frequency ranges. Mid-frequency components (0.25 π –0.5 π ) receive the strongest enhancement (≈1.25 for piping, ≈1.15 for leakage), aligning with expected seepage-related textural characteristics.
Remotesensing 17 03602 g010
Figure 11. Module-wise frequency enhancement analysis across eight key EmbFreq-Net modules showing mid-frequency enhancement ratios for backbone C3k2_LFE (Layer 2, 4, 6, 8) and neck C3k2_LFE (Layer 15, 17, 20, 23). Error bars indicate standard deviation across samples. Backbone modules demonstrate higher enhancement ratios (0.25–0.35), reflecting their primary role in hazard feature extraction, while neck modules show moderate enhancement (0.15–0.25) for multi-scale feature integration.
Remotesensing 17 03602 g011
Figure 12. Qualitative comparison of detection results in four challenging scenarios. For each scenario, we present the original image, the results from a representative baseline model (detection box and Grad-CAM heatmap), and the corresponding results from our EmbFreq-Net. The heatmaps are generated from the final feature layer of each model’s backbone to visualize learned feature attention. Note the baseline’s failures, such as missed detections (a,c) and misclassification (b), in contrast to EmbFreq-Net’s consistent and accurate performance. The highly focused heatmaps of our model, particularly in (d), underscore its superior feature localization capabilities.
Remotesensing 17 03602 g012
Table 1. Comprehensive comparison of embankment hazard detection methods and frequency-domain enhancement techniques. The table systematically reviews existing approaches across different categories, highlighting technological evolution and identifying research gaps that motivate our frequency-enhanced approach for UAV-based visible light embankment monitoring.
CategoryMethod/StudyYearDetection TechnologyPlatformTarget HazardsKey Innovation
Traditional MethodsManual Inspection-Visual observationGround-basedLeakage, PipingDirect observation
Resistivity Detection [9]2014GeophysicalGround-basedSubsurface anomaliesNon-invasive detection
Ground-Penetrating Radar [12]1981ElectromagneticGround-basedSubsurface structuresDeep penetration capability
Thermal-based MethodsThermal Infrared Detection [18]2023Thermal imagingUAV/GroundTemperature anomaliesTemperature contrast detection
Automatic Recognition [8]2022Thermal + AIUAVSurface anomaliesAutomated thermal processing
AI Infrastructure MonitoringSmart Dam Automation [16]2024YOLOv5 + Deep LearningFixed sensorsStructural cracksHigh precision crack detection
Vision-guided Inspection [17]2024Computer VisionUnderwater ROVUnderwater defects98.6% precision at 68 FPS
AI Applications Review [15]2025Comprehensive AIMulti-platformVarious hazardsSystematic AI overview
Frequency-Domain MethodsAdaptive Frequency Enhancement [21]2025FFT + Deep Learning-Infrared small targetsMulti-frequency decomposition
Spatial-Frequency Transform [22]2025U-Net + Frequency Attention-Small targetsSelf-attention mechanism
Frequency-Spatial Enhancement [23]2025FFT + Haar WaveletRemote sensingShadow/low-contrast areasDual-domain processing
YOLO-based EnhancementsPAR-YOLO [25]2025Ghost bottleneck + YOLOEdge computingGeneral objectsLightweight design
Improved YOLO [26]2021Attention + YOLO-General objectsFeature map attention
BiFPN Enhancement [27]2020Modified FPN-PANet-General objectsReduced computational complexity
MAFPN [28]2024Multi-branch FPN-Small targetsP2 layer utilization
Our ApproachEmbFreq-Net2025Frequency + YOLOUAVEmbankment hazardsTask-specific frequency enhancement
Table 2. Details of the self-collected dataset. The table lists the geographical locations, data volume (number of images), collection time, image resolution, and the acquisition equipment used.
LocationData VolumeCollection TimeResolutionAcquisition Equipment
Songhua River, Nong’an, Jilin125August 20246252 × 4168Zhixun AR10
Baigou River, Zhuozhou, Hebei336August 20234056 × 3040DJI ZH20T
Fogang,
Qingyuan,
Guangdong
64April 20244032 × 3024DJI H30T
77June 20244056 × 3040DJI ZH20T
149August 20244056 × 3040DJI ZH20T
Changping, Beijing53December 20244032 × 3024DJI M4T
Table 3. Configuration of data augmentation techniques applied to the training set. The table details two categories of augmentations: pixel-level and spatial-level transforms, along with their respective application probabilities and plain-language descriptions.
Augment TypeAugment NameMethod DescriptionProbability/%
Pixel-levelAffineRotation, scaling, translation50
BBoxSafeRandomCropSafe cropping preserving targets10
D4Eight-fold symmetry transforms10
ElasticTransformNon-linear shape deformation10
HorizontalFlipLeft-right mirroring10
VerticalFlipUp-down mirroring10
GridDistortionGrid-based distortion10
PerspectiveViewpoint angle changes10
Spatial-levelGaussNoiseGaussian noise simulation10
ISONoiseCamera sensor noise10
ImageCompressionJPEG compression artifacts10
RandomBrightnessContrastLighting variations10
RandomFogFog weather simulation10
RandomRainRain weather simulation10
RandomSnowSnow weather simulation10
RandomShadowShadow effects10
RandomSunFlareSun glare effects10
ToGrayGrayscale conversion10
Table 4. Performance comparison of different backbone architectures. Our proposed C3k2-LFE is benchmarked against several prominent lightweight backbones: Yolo11 [41], EfficientViT [39], FasterNet [40], MobileNet [42], StarNet [38], and FFC backbone [31]. The results show that the method achieves improved trade-offs between detection accuracy (F1-score, mAP) and model efficiency (GFLOPs, Params). Bold values indicate the best performance in each column.
MethodPRF1mAP50mAP50–95GFLOPsParams
(%)(%) (%)(%) (M)
Yolo1175.4073.280.743273.4934.416.32.58
EfficientViT79.0772.290.755277.0635.627.93.74
FasterNet78.5271.890.749874.0534.649.23.90
MobileNet75.6267.250.710473.1833.4921.05.43
StarNet82.7970.370.760776.4735.435.01.94
FFC82.3272.220.769477.0335.236.12.47
C3k2-LFE79.8075.500.775977.4535.965.42.19
Table 5. Performance evaluation of different feature fusion neck modules. Our proposed Multi-scale Frequency Feature Pyramid Network (MFFPN) is compared with several advanced neck architectures: BiFPN [27], MAFPN [28], RepGFPN [43,44,45], AFPN [46], and ASF [47]. The results show that MFFPN achieves the highest scores in key detection metrics, particularly in F1-score and mAP, validating its effectiveness in fusing multi-scale features for this task. Bold values indicate the best performance in each column.
MethodPRF1mAP50mAP50–95GFLOPsParams
(%)(%) (%)(%) (M)
BiFPN76.4271.190.737173.5733.556.31.92
MAFPN74.7370.640.726072.5232.977.12.70
RepGFPN83.2273.850.781976.4835.138.23.66
AFPN80.4469.360.744974.1633.798.82.65
ASF81.1471.890.762276.8236.187.12.67
MFFPN78.1078.300.781977.1335.966.12.47
Table 6. Overall performance comparison with state-of-the-art (SOTA) object detection models. Our integrated EmbFreq-Net is benchmarked against several widely recognized detectors: YOLO11 [41], YOLOv10 [48], YOLOv9 [50], YOLOv8 [51], DETR-l [52], DETR-R50 [53], and RepViT [49]. The results demonstrate that EmbFreq-Net achieves the highest detection accuracy (mAP50) while maintaining the lowest computational cost (GFLOPs), establishing a new state-of-the-art for this specific detection task. Bold values indicate the best performance in each column.
MethodPRF1mAP50mAP50–95GFLOPsParams
(%)(%) (%)(%) (M)
YOLO1175.4073.280.743273.4934.416.32.58
YOLOv1082.0268.430.746175.0734.078.22.70
YOLOv983.0365.950.734973.5032.596.41.73
YOLOv878.0073.140.754975.7234.616.82.68
DETR-l71.3467.740.693269.1029.62103.431.99
DETR-R5074.5768.170.711570.8832.24125.641.94
RepViT80.1471.680.756676.1836.5517.06.43
EmbFreq-Net76.5274.590.755477.6835.254.62.02
Table 7. Comprehensive ablation study results showing the quantitative performance of different module combinations. The table presents detailed metrics for individual modules (A: LFE Module, B: MSIS-Block, C: MFFPN, D: MSSDH) and their various combinations, demonstrating the independent contribution and synergistic effects of each component in EmbFreq-Net. Bold values indicate the best performance in each column.
ConfigurationF1-ScoremAP50mAP50–95GFLOPsParameters
(%)(%) (M)
A (LFE Module)0.775977.4535.965.42.19
B (MSIS-Block)0.768276.9534.896.42.66
C (MFFPN)0.781977.1335.966.12.47
D (MSSDH)0.739174.2333.985.62.42
A + B0.754774.1734.645.42.27
A + C0.747474.6332.925.22.10
A + D0.751576.6034.485.12.24
B + C0.762677.3736.586.12.55
B + D0.759877.2835.735.72.50
C + D0.748076.2935.635.32.29
A + B + C0.769776.7135.085.32.18
A + B + D0.735074.1133.565.22.32
A+ C + D0.734675.0133.574.51.94
B + C + D0.722675.6635.465.42.39
A + B + C + D (Full Model)0.755477.6835.254.62.02
Table 8. Sensitivity analysis of key hyperparameters in EmbFreq-Net: compressed channels (FAFusion), kernel number (LFE), and attention heads (MSIS-Block). Performance metrics (P, R, F1, mAP) are evaluated to assess the impact of each parameter on model accuracy and efficiency. Bold values indicate the best performance within each column and each parameter group.
HyperparameterValuePRF1mAP50mAP50–95
(%)(%) (%)(%)
Compressed Channels16 (Default)76.5274.590.755477.6835.25
3278.5368.960.734476.4434.78
6477.7468.190.726475.7434.94
12873.2971.500.723874.9636.31
25675.2371.680.734175.7335.68
Kernel Number476.1268.240.719576.8936.06
882.5866.900.738776.7035.80
16 (Default)76.5274.590.755477.6835.25
3275.4172.950.740775.9634.39
6478.7072.820.756477.8336.58
Attention Heads2 (Default)76.5274.590.755477.6835.25
479.0070.780.746275.2835.27
878.7573.080.757678.3937.87
1678.2471.890.749375.4935.75
Disclaimer/Publisher’s Note: The statements, opinions and data contained in all publications are solely those of the individual author(s) and contributor(s) and not of MDPI and/or the editor(s). MDPI and/or the editor(s) disclaim responsibility for any injury to people or property resulting from any ideas, methods, instructions or products referred to in the content.