Article

Probabilistic Forecasting Model for Tropical Cyclone Intensity Based on Diffusion Model

1
State Key Laboratory of Climate System Prediction and Risk Management (CPRM), Nanjing University of Information Science and Technology, Nanjing 210044, China
2
School of Artificial Intelligence, Nanjing University of Information Science and Technology, Nanjing 210044, China
*
Author to whom correspondence should be addressed.
Remote Sens. 2025, 17(21), 3600; https://doi.org/10.3390/rs17213600
Submission received: 5 September 2025 / Revised: 23 October 2025 / Accepted: 27 October 2025 / Published: 31 October 2025

Highlights

What are the main findings?
  • This study proposes a novel conditional diffusion model (TCDM), representing the first probabilistic generative framework for tropical cyclone (TC) intensity forecasting capable of integrating multimodal data to generate the full future intensity probability distribution.
  • Compared with mainstream baseline models, TCDM demonstrates a substantial improvement in forecasting rapid intensification (RI) events, achieving the highest hit rate (30.7%) and precision (43.2%) and the lowest false alarm rate (2.7%) in the testing experiments.
What is the implication of the main finding?
  • The TCDM framework is capable of generating high-quality and highly reliable probabilistic forecasts, providing more effective decision support for meteorological agencies in tropical cyclone risk assessment and disaster preparedness.
  • This study demonstrates the strong potential of diffusion models in simulating and forecasting the uncertainty of extreme weather events, opening new avenues for developing more intelligent and reliable meteorological disaster forecasting systems.

Abstract

Reliable forecasting of tropical cyclone (TC) intensity—particularly rapid intensification (RI) events—remains a major challenge in meteorology, largely due to the inherent difficulty of accurately quantifying predictive uncertainty. Traditional numerical approaches are computationally expensive, while statistical models often fail to capture the highly nonlinear relationships involved. Mainstream machine learning models typically provide only deterministic point forecasts and lack the ability to represent uncertainty. To address this limitation, we propose Tropical Cyclone Diffusion Model (TCDM), the first conditional diffusion-based probabilistic forecasting framework for TC intensity. TCDM integrates multimodal meteorological data, including satellite imagery, re-analysis fields, and environmental predictors, to directly generate the full probability distribution of future intensities. Experimental results show that TCDM not only achieves highly competitive deterministic accuracy (low MAE and RMSE; high R 2 ), but also delivers high-quality probabilistic forecasts (low CRPS; high PICP). Moreover, it substantially improves RI detection by achieving higher hit rates with fewer false alarms. Compared with traditional ensemble-based methods, TCDM provides a more efficient and flexible approach to probabilistic forecasting, offering valuable support for TC risk assessment and disaster preparedness.

1. Introduction

Tropical cyclones represent one of the most destructive natural hazards worldwide. They pose severe threats to human life, infrastructure, and socio-economic systems along coastal regions through extreme winds, storm surges, and heavy rainfall. Over the past five decades, TCs have been responsible for the largest economic losses among all weather-related hazards [1], with catastrophic events such as Typhoon Haiyan (2013) and Hurricane Katrina (2005) vividly demonstrating their immense destructive potential [2,3]. Accurate forecasting of TC intensity, particularly rapid intensification (RI) events characterized by abrupt and substantial strengthening [4,5], is therefore critical for disaster preparedness, early warning, and risk mitigation. Despite significant advancements in numerical weather prediction (NWP) models [6] and statistical forecasting methods [7,8], predicting TC intensity—especially RI events and medium- to long-term trends—remains a challenging problem. Dynamical models are heavily dependent on high-resolution simulations and precise initial conditions, yet they often fail to fully capture small-scale physical processes that are crucial for accurate representation of TC structure and evolution [9]. In contrast, statistical models, such as the Statistical Hurricane Intensity Prediction Scheme (SHIPS) [10,11], offer computational efficiency but are limited in representing the complex nonlinear interactions between TC dynamics and the surrounding environmental conditions [12]. These intrinsic limitations contribute to substantial forecast uncertainty [13], which in turn constrains the practical utility of operational predictions. In recent years, numerical weather prediction (NWP) models have achieved remarkable progress in rapid intensification (RI) forecasting. This advancement has been driven by continuous improvements in computational resources and a deeper understanding of tropical cyclone (TC) dynamics and physical processes. For instance, the new generation of high-resolution dynamical models—such as the Hurricane Analysis and Forecast System (HAFS) and the updated version of the Hurricane Weather Research and Forecasting model (HWRF)—have demonstrated stronger competitiveness in RI forecasting skills by incorporating more advanced data assimilation schemes and physical process parameterizations [14,15]. However, due to the highly nonlinear dynamical characteristics of TC systems and their extreme sensitivity to initial conditions and model physics, NWP models still face great challenges in accurately quantifying the probability and uncertainty of RI events. Moreover, the computational cost of high-resolution ensemble forecasting systems remains extremely expensive.
In recent years, the rapid growth of machine learning (ML), particularly deep learning (DL), has demonstrated substantial potential in geoscientific applications [16,17]. In many complex meteorological tasks—such as El Niño prediction [18] and short-term precipitation forecasting [19]—deep learning models have outperformed conventional methods. Within the context of TC intensity forecasting, deep learning architectures, including convolutional neural networks (CNNs), recurrent neural networks (RNNs), and their variants such as ConvLSTM [20], have been widely adopted [21,22]. These models leverage large-scale spatiotemporal datasets, encompassing both satellite imagery [23] and re-analysis products, to extract meaningful patterns and improve prediction accuracy [24,25,26]. However, most existing ML approaches remain deterministic, providing point estimates [27,28] and failing to capture the inherent uncertainties in TC intensity evolution. Such uncertainties arise from chaotic atmospheric dynamics, observational noise, and intrinsic model limitations [29].
Probabilistic forecasting, which offers confidence intervals and full probability density estimates [30], is essential for comprehensive risk assessment, informed decision-making, and adaptive emergency management [31]. Operational centers frequently use ensemble-based approaches to quantify forecast uncertainty [13], generating multiple realizations by perturbing initial conditions or combining different model outputs. Nonetheless, ensemble approaches demand significant computational resources, and limited ensemble sizes may result in incomplete or biased representation of probabilistic outcomes. Alternative statistical techniques, such as Bayesian frameworks or quantile regression [32], provide probabilistic information but often rely on simplified distributional assumptions or extensive prior knowledge, limiting their effectiveness for complex, multimodal TC datasets.
Diffusion models, as an emerging class of generative machine learning techniques, iteratively denoise data through a Markov chain process to learn high-dimensional distributions. Recently, they have achieved remarkable success in modeling complex probabilistic structures and generating realistic, diverse samples [33,34,35,36]. Compared with Generative Adversarial Networks (GANs) [37], diffusion models exhibit more stable training and greater diversity in generated samples; relative to Variational Autoencoders (VAEs) [38], they demonstrate a significant advantage in preserving data fidelity. By capturing the intrinsic spatiotemporal patterns present in meteorological data, diffusion models offer a promising avenue for probabilistic TC forecasting, particularly in scenarios characterized by high uncertainty and nonlinear interactions.
In this study, we introduce Tropical Cyclone Diffusion Model, a novel conditional diffusion framework designed specifically for probabilistic TC intensity prediction. The proposed model integrates multimodal meteorological information—including re-analysis fields, satellite observations, and best-track records—to jointly forecast future intensity trajectories and quantify associated uncertainties. The core architecture employs a conditional diffusion-generation process, allowing for effective feature extraction and fusion across heterogeneous data sources. This integration enhances both the robustness and interpretability of the predictions, providing a unified framework for high-fidelity probabilistic forecasting of tropical cyclone intensity.

2. Data and Methodology

2.1. Data

2.1.1. Satellite Imagery Data

The satellite observational data used in this study were obtained from the Tropical Cyclone Integrated Reanalysis (TCIR) dataset [39], which is publicly available through the Intelligent Systems Laboratory at National Taiwan University. This dataset establishes a comprehensive tropical cyclone feature archive by integrating multi-source satellite remote sensing observations. Its core data sources include the GridSat global infrared dataset and the CMORPH precipitation dataset. Specifically, GridSat has continuously archived observations from global geostationary satellites at a 3-h interval since 1981, providing brightness temperature data in the infrared window channel (IR1, 11.2 µm), water vapor channel (WV, 6.7 µm), and visible channel (VIS, 0.6 µm), with a spatial resolution of 0.07° × 0.07°. CMORPH, on the other hand, generates global precipitation rate fields from 2003 to 2017 by combining low-Earth-orbit microwave satellite measurements with geostationary infrared data through a morphing technique, with a spatial resolution of 0.25° × 0.25° and a temporal resolution of 3 h.
For the validation of tropical cyclone tracks and intensities, the best-track data from the Joint Typhoon Warning Center (JTWC) are used for the western North Pacific, while the revised Atlantic Hurricane Database (HURDAT2) provides re-analysis records for the eastern North Pacific and Atlantic basins from 2003 to 2017. By integrating these multi-source datasets, TCIR provides key tropical cyclone parameters, including storm center location, intensity measured as maximum sustained wind speed (knots), storm size expressed as the quadrant-averaged radius of 35 kt winds (nautical miles, NMI), and minimum sea-level pressure (Figure 1). These parameters form a complete feature vector set that serves as a benchmark for training and validating machine learning models.

2.1.2. SHIPS Development Database

To enhance the model’s ability to capture the environmental context of tropical cyclones, this study incorporates the Statistical Hurricane Intensity Prediction Scheme (SHIPS) developmental database, which was jointly developed by the National Hurricane Center (NHC) and Colorado State University. The SHIPS database integrates a broad set of environmental predictors that influence the evolution of tropical cyclone intensity, and it has been widely employed in both operational forecasting and model training. Specifically, it includes key physical variables such as sea surface temperature (SST), vertical wind shear at upper and mid-levels, relative humidity (RH), ocean heat content (OHC), latent heat flux, wind field symmetry, pressure gradients, and geopotential height.
The SHIPS dataset covers historical tropical cyclone processes across multiple ocean basins, with environmental predictors derived from NCEP global re-analysis products (e.g., GFS and CFSR). Its primary advantages lie in the standardized data structure and strong physical interpretability, making it highly suitable for constructing statistical or machine learning models based on environmental fields. In this study, SHIPS samples from 2003 to 2017, temporally aligned with TCIR satellite imagery, were employed. Furthermore, the key variables were standardized to ensure seamless fusion with remote sensing image features within the proposed model.
By introducing SHIPS predictors, the model is able to more comprehensively capture the thermodynamic and dynamic mechanisms underlying cyclone development. This integration effectively enhances the physical consistency and generalization ability of intensity forecasts, while providing critical prior information in rapid intensification scenarios.

2.1.3. Data Preprocessing and Alignment

The raw dataset, which includes both satellite imagery and tabular information, was first processed to remove any observations lacking SHIPS environmental records and to handle NaN or anomalous values, such as truncating visible (VIS) channel intensities to the range [0, 1]. Subsequently, the data were partitioned into training, validation, and test sets according to cyclone ID in temporal order, ensuring that the complete historical sequence of a single cyclone did not leak across datasets and thereby preventing information leakage and distribution bias. For each tropical cyclone case, a time series was constructed consisting of synchronized satellite images and SHIPS forecast factors, ensuring spatiotemporal consistency and completeness of the input data for reliable model training.
During model training, specific image channels were selected according to the experimental configuration, and all images were standardized to uniform dimensions and value ranges to ensure stable and efficient training. To enhance rotational invariance and generalization capability, multiple image augmentation strategies were employed, including random-angle rotation and physics-based rotations aligned with the vertical wind shear direction (SHTD) at 0°, 90°, 180°, or 270°. These augmentations allow the model to effectively learn the relative spatial relationships between cyclone structures and environmental wind fields while preserving the accuracy of the physical information.

2.2. TCDM Model for Probabilistic Forecasting of Tropical Cyclone Intensity

The TCDM architecture, depicted in Figure 2, is designed to effectively fuse information from different sources and leverage the generative power of diffusion models for probabilistic forecasting. The core components are the feature encoder, the Condition Fusion module, and the conditional diffusion process itself.

2.2.1. Feature Encoder

The feature encoder processes two primary data streams: multi-channel satellite imagery and SHIPS environmental predictors.
For the four-channel satellite images, the model employs a series of attention blocks. To ensure the robustness of feature extraction, each attention block employed in this study consists of a Multi-Head Self-Attention (MHSA) module and a position-wise feed-forward network (FFN). Each module incorporates residual connections and layer normalization to stabilize training and facilitate gradient flow. In total, four such attention blocks are stacked, each utilizing eight attention heads, enabling the model to capture complex spatial dependencies within satellite imagery, such as convective organization and eyewall structures. The extracted features are subsequently downsampled to produce a compact yet information-rich image feature vector, denoted as F img .
For the SHIPS data, a Transformer block is adopted. The self-attention mechanism within the Transformer is particularly effective at capturing dependencies among environmental predictors and identifying the most influential factors. The Transformer block adopted in this study was implemented as a standard Transformer encoder layer. It consists of a Multi-Head Self-Attention module and a feed-forward network, both equipped with residual connections and layer normalization to enhance training stability. Two encoder layers are stacked, each employing eight attention heads and a 512-dimensional feed-forward network. Prior to feeding the SHIPS variable vectors into the encoder, a learnable positional encoding is introduced to help the model capture the sequential dependencies and relative importance among different environmental predictors, such as vertical wind shear (VWS), sea surface temperature (SST), and relative humidity (RH). This process yields a robust textual feature vector, denoted as F text .

2.2.2. Condition Fusion

The fusion of multimodal information is accomplished through a cross-attention mechanism. Specifically, the image feature vector F img and the textual feature vector F text attend to each other, enabling the model to learn conditional relationships between structural features of TCs and environmental constraints. For example, given a specific vertical wind shear condition derived from SHIPS predictors, the model is able to infer potential evolutions in the cloud organization observed in satellite imagery.
The fused representation is subsequently passed through a multilayer perceptron (MLP), producing the final condition vector C. This vector encapsulates a comprehensive meteorological context and is used to guide the denoising process of the diffusion model, thereby enhancing the accuracy and reliability of probabilistic TC intensity forecasts.

2.2.3. Diffusion Model Framework

Diffusion models [33] are a class of models that use forward and reverse processes to reconstruct target data, aiming to recover the original information from noisy inputs. In our task, the objective is to restore the tropical cyclone intensity after 24 h from noisy data. The core of the diffusion process comprises the following two components:
  • Forward diffusion process: In the forward process, the model gradually adds noise to the true intensity information until it becomes pure noise. Assuming the initial true intensity, noise is added at each time step to obtain the noisy intensity, and this process can be represented as
    q ( x t x 0 ) = N ( x t ; a ¯ t x 0 , ( 1 a ¯ t ) I )
    In this context, N ( · ) denotes the Gaussian distribution, a ¯ t serves as the noise attenuation factor that evolves with the time step t, and I denotes the identity matrix, which characterizes the variance of the noise.
  • Reverse process: The reverse denoising process aims to recover the true signal intensity from noise by progressively removing noise through the prediction of the noise component at each step, ultimately resulting in the final intensity estimate. This reverse denoising procedure can be mathematically described by the following formula:
    p θ ( x t 1 x t ) = N ( x t 1 ; μ θ ( x t , t ) , Σ θ ( x t , t ) I )
    Here, μ θ ( x t , t ) represents the denoised estimate predicted based on the current noisy state x t and the time step t, while Σ θ ( x t , t ) denotes the variance of the noise, characterizing the uncertainty in the denoising process.

2.2.4. Conditional Diffusion Mechanism

To enhance the model’s adaptability to environmental variations, we incorporate four-channel satellite remote sensing images and SHIPS data as the conditional information C [40]. During the denoising process at each time step, the conditional information C interacts with the current noisy intensity x t , ensuring that the model can perform intensity predictions under diverse meteorological conditions. The conditional diffusion mechanism of the model can be formulated as follows:
p θ ( x t 1 x t , C ) = N ( x t 1 ; μ θ ( x t , t , C ) , Σ θ ( x t , t ) I )
Here, c denotes the fused multimodal conditional information, which includes both image and textual features, while μ θ ( x t , t , C ) explicitly indicates that the denoising mean is conditioned on C.

2.2.5. Probabilistic Forecast Generation via Diffusion Sampling

A key capability of the proposed TCDM framework lies in its ability to generate probabilistic (ensemble) forecasts. This is achieved by exploiting the inherent stochasticity of the reverse diffusion process. To produce an ensemble of N forecasts, the model begins with N distinct initial noise samples, { x T 1 , x T 2 , , x T N } , independently drawn from the prior distribution N ( 0 , I ) .
While keeping the conditional information C—derived from the input satellite imagery and SHIPS environmental predictors—fixed, the model performs the reverse denoising process N times, once for each initial noise sample. This procedure generates N distinct denoised realizations, { V 24 1 , V 24 2 , , V 24 N } , as illustrated in Figure 2. These realizations collectively form the predictive distribution of the 24-h tropical cyclone (TC) intensity. Consequently, this ensemble provides a natural means of quantifying forecast uncertainty.

2.2.6. Loss Function

For the specific and critical forecasting issue of the rapid intensification (RI) of tropical cyclones, the rarity of RI events within the cyclone lifecycle results in a significantly smaller number of RI samples compared to non-RI samples in the training dataset. This constitutes a typical class imbalance problem. Using the standard mean squared error (MSE) as the loss function may cause the model to favor minimizing errors for the majority class (non-RI events) during optimization while insufficiently addressing prediction biases for the minority class (RI events), thereby hindering the model’s ability to effectively identify and forecast actual RI occurrences.
To address this challenge, this study employs a weighted mean squared error loss function [4]. Its mechanism involves assigning differentiated weights to samples of different classes, thereby amplifying the contribution of errors from specific sample types during the calculation of the total loss. The reconstructed loss function is
w = e x p ( δ V m a x 20 10 ) + 1
L = E t , x 0 , ϵ N ( 0 , I ) [ w · ϵ ϵ θ ( x t , t , C ) 2 ]
Here, δ V max denotes the wind speed increment, t is the time step, x 0 represents the true wind speed, ϵ is the ground truth noise sampled from N ( 0 , I ) , which was added during the forward diffusion process to generate the noisy wind speed x t . Moreover, ϵ θ represents the noise predicted by the denoising network ϵ θ ( x t , t , C ) , which is trained to approximate ϵ , and C denotes the fused conditional vector.

2.2.7. Training Details

All experiments were conducted using Visual Studio Code (https://code.visualstudio.com/), Python 3, and TensorFlow (https://www.tensorflow.org/). We employed a batch size of 50 and a learning rate of 10 4 . To evaluate the model’s generalization ability and mitigate overfitting, the dataset was split into training, validation, and test sets corresponding to the periods 2003–2014, 2015–2016, and 2017, respectively. The data from 2003 to 2014 were used as the training set, those from 2015 to 2016 as the validation set, and those from 2017 as the test set. The models used in the experiments were trained on a single NVIDIA A800 GPU for a total of 300 epochs. Regarding the specific parameters of the diffusion model, we set the total number of time steps to T = 1000 . A linear noise schedule was adopted, where β increases linearly from β 1 = 10 4 to β T = 0.02 . During the sampling phase, the standard DDPM sampling algorithm was employed to generate predictive samples from pure Gaussian noise x T through an iterative denoising process.

2.3. Evaluation Methods

To quantitatively assess the performance of the proposed TCDM model, we employed both deterministic and probabilistic metrics. Deterministic accuracy was evaluated using the mean absolute error (MAE), root mean square error (RMSE), and the coefficient of determination ( R 2 ), all computed based on the predicted wind speed mean ( μ ^ ) of the 24-h forecast. MAE measures the average magnitude of the prediction errors, RMSE gives higher weight to larger errors, and R 2 quantifies the proportion of variance in the observed values explained by the predicted mean. The formulas are defined as follows:
MAE = 1 N i = 1 N | μ ^ i y i | ,
RMSE = 1 N i = 1 N ( μ ^ i y i ) 2 ,
R 2 = 1 i = 1 N ( μ ^ i y i ) 2 i = 1 N ( y i y ¯ ) 2 ,
where y i denotes the observed wind speed, μ ^ i denotes the predicted mean, y ¯ is the mean of observations, and N is the number of samples.
Probabilistic performance was assessed using the continuous ranked probability score (CRPS) and the prediction interval coverage probability (PICP). CRPS measures the difference between the predicted cumulative distribution and the observed value, providing a sharpness and calibration evaluation of the probabilistic forecast. Normally distributed predictions are computed as
CRPS ( μ ^ i , σ ^ i ; y i ) = σ ^ i z i 2 Φ ( z i ) 1 + 2 ϕ ( z i ) 1 π , z i = y i μ ^ i σ ^ i ,
where σ ^ i is the predicted standard deviation, and Φ and ϕ are the cumulative distribution function and probability density function of the standard normal distribution, respectively.
PICP evaluates the proportion of observations falling within a nominal ( 1 α ) × 100 % prediction interval:
PICP α = 1 N i = 1 N 1 y i [ μ ^ i z 1 α / 2 σ ^ i , μ ^ i + z 1 α / 2 σ ^ i ] ,
where α denotes the significance level, and z 1 α / 2 is the corresponding quantile of the standard normal distribution. In this study, we set α = 0.05 , corresponding to a 95% prediction interval ( PICP 95 % ). A PICP value closer to 0.95 indicates more reliable interval coverage.

3. Results

3.1. Model Performance

To systematically quantify the contribution of distinct input features, we performed an extensive evaluation of multiple channel configurations, encompassing IR, VIS, PMW, and WV imagery. The comprehensive results of this comparison are presented in Table 1. Among all tested configurations, the integration of IR, PMW, and WV consistently demonstrated the highest performance across both deterministic metrics and probabilistic forecast quality indicators. This enhanced performance can be largely attributed to the complementary physical information inherently captured by these channels. Specifically, IR imagery provides continuous global coverage of convective cloud-top structures and thermal patterns, allowing for the monitoring of large-scale convective organization and intensity variations. PMW observations, on the other hand, can penetrate cloud layers to reveal precipitation intensity, inner-core dynamics, and latent heat release processes, which are critical for capturing the structural evolution of tropical cyclones. Meanwhile, WV imagery characterizes the surrounding atmospheric moisture environment, offering valuable context for understanding cyclonic intensification and potential rapid development. In contrast, VIS imagery, despite its high spatial resolution and ability to capture fine-scale structural details during daylight, is constrained by diurnal availability and shows reduced sensitivity to deep convective processes, which can introduce additional uncertainty when integrated into predictive models. Collectively, these findings highlight the importance of leveraging complementary multi-channel information to improve both the accuracy and reliability of tropical cyclone intensity forecasts.
Further incorporation of environmental predictors derived from the SHIPS (Statistical Hurricane Intensity Prediction Scheme) dataset led to systematic and consistent improvements across all evaluation metrics. Specifically, deterministic errors, such as MAE and RMSE, were significantly reduced, while the predictive distributions exhibited enhanced sharpness and improved calibration, as evidenced by PICP values closely approaching the nominal confidence levels. These improvements can be largely attributed to the complementary nature of the SHIPS variables, which include key environmental factors such as vertical wind shear, sea surface temperature (SST), mid-level humidity, and ocean heat content. Collectively, these variables provide an essential large-scale environmental context that is often inadequately captured by satellite observations alone, thereby enabling the model to better represent the physical mechanisms governing tropical cyclone evolution. The inclusion of these environmental constraints is particularly critical in RI events, where favorable or adverse large-scale conditions can exert decisive influence on storm development. For instance, low vertical wind shear and elevated ocean heat content can create conditions conducive to rapid intensification, whereas dry, mid-level air or high shear can suppress cyclone strengthening. By explicitly incorporating these environmental factors, the model is able to adjust its probabilistic forecasts in accordance with the surrounding atmospheric and oceanic conditions, leading to more physically consistent predictions. Overall, these results underscore the importance of multimodal data fusion, whereby high-resolution satellite imagery is integrated with physically meaningful environmental predictors to enhance forecast skill. This approach not only improves deterministic and probabilistic performance but also increases the robustness and reliability of tropical cyclone intensity predictions, highlighting the substantial operational value of combining multiple complementary observational sources in contemporary forecasting frameworks.
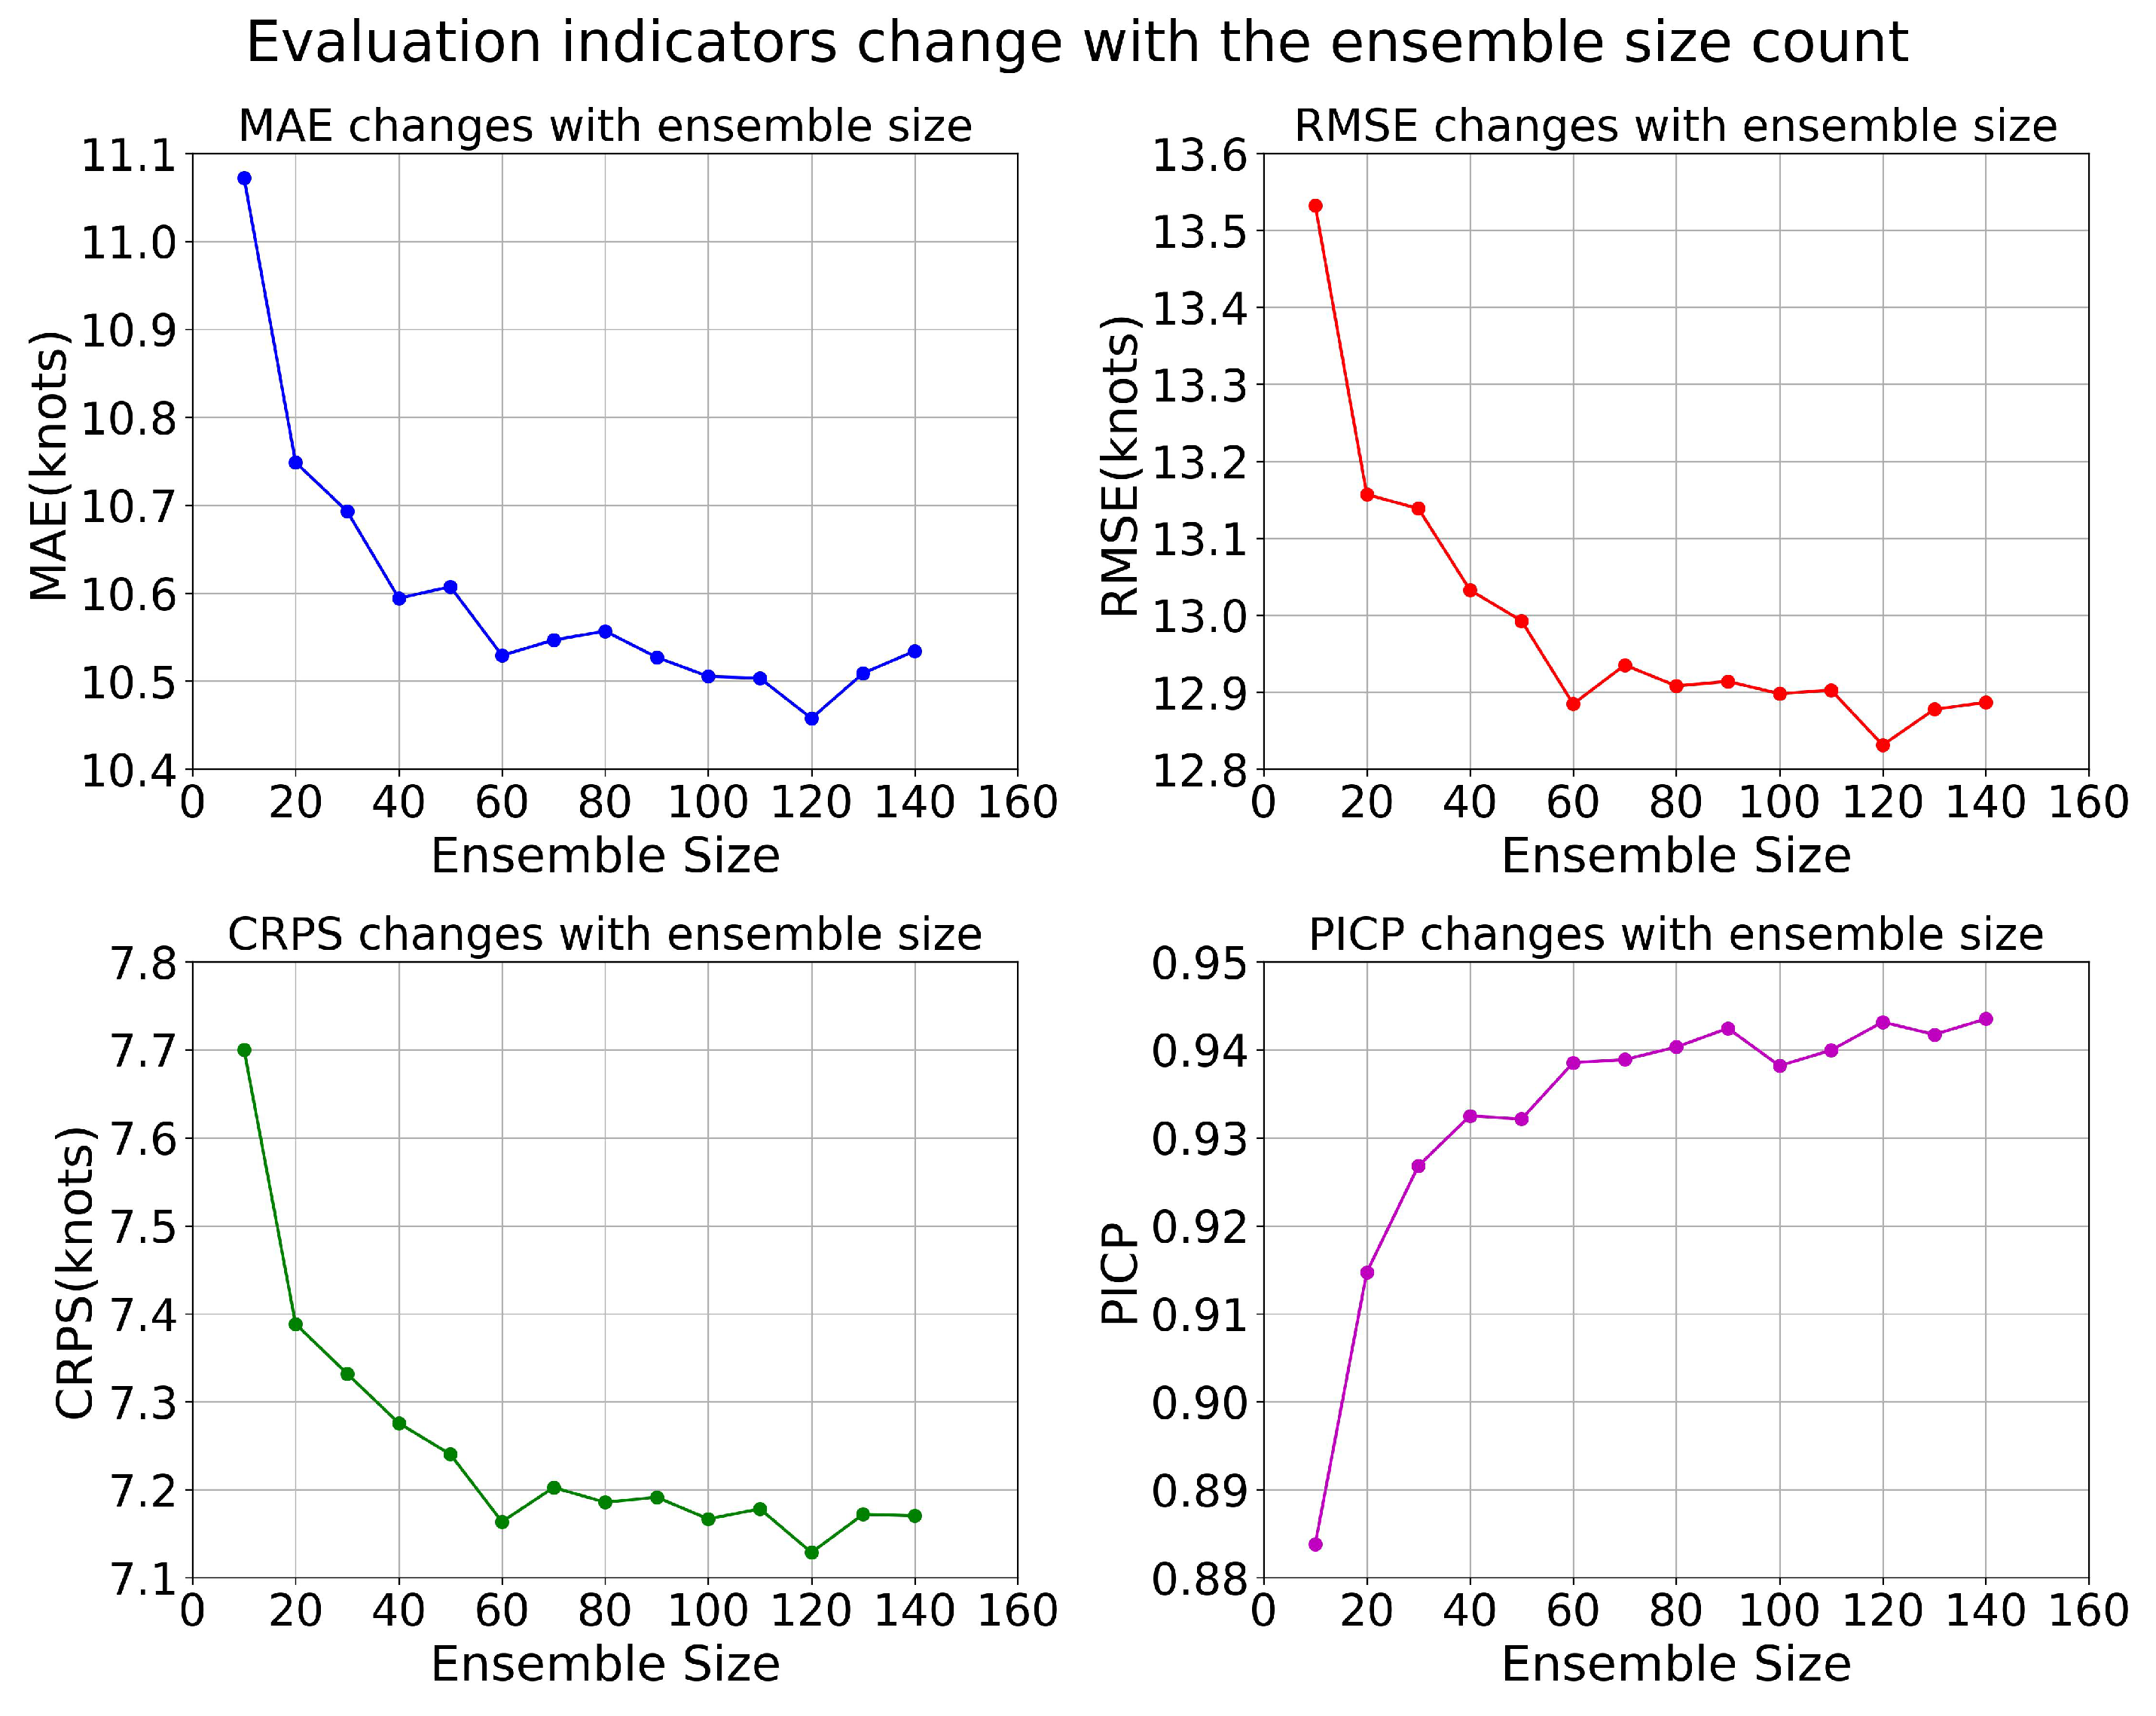
In addition, we systematically investigated the influence of ensemble member size on probabilistic forecasting skill, evaluating performance using MAE, RMSE, CRPS, and PICP metrics. As shown in Figure 3, increasing the number of ensemble members progressively enhanced model skill, with improvements gradually plateauing when the ensemble reached approximately 120 members. At this configuration, deterministic errors were minimized, the CRPS achieved its optimal value, and PICP values most closely aligned with the nominal confidence levels, indicating well-calibrated predictive distributions. These results suggest that a moderate ensemble size provides an effective balance between adequately capturing forecast uncertainty and avoiding redundancy-induced noise that may degrade probabilistic accuracy. Moreover, maintaining this balance is crucial for computational efficiency, particularly in operational forecasting systems where timely predictions are essential. Overall, the findings highlight that careful selection of ensemble size is a key factor in achieving both reliable and computationally feasible probabilistic tropical cyclone intensity forecasts.
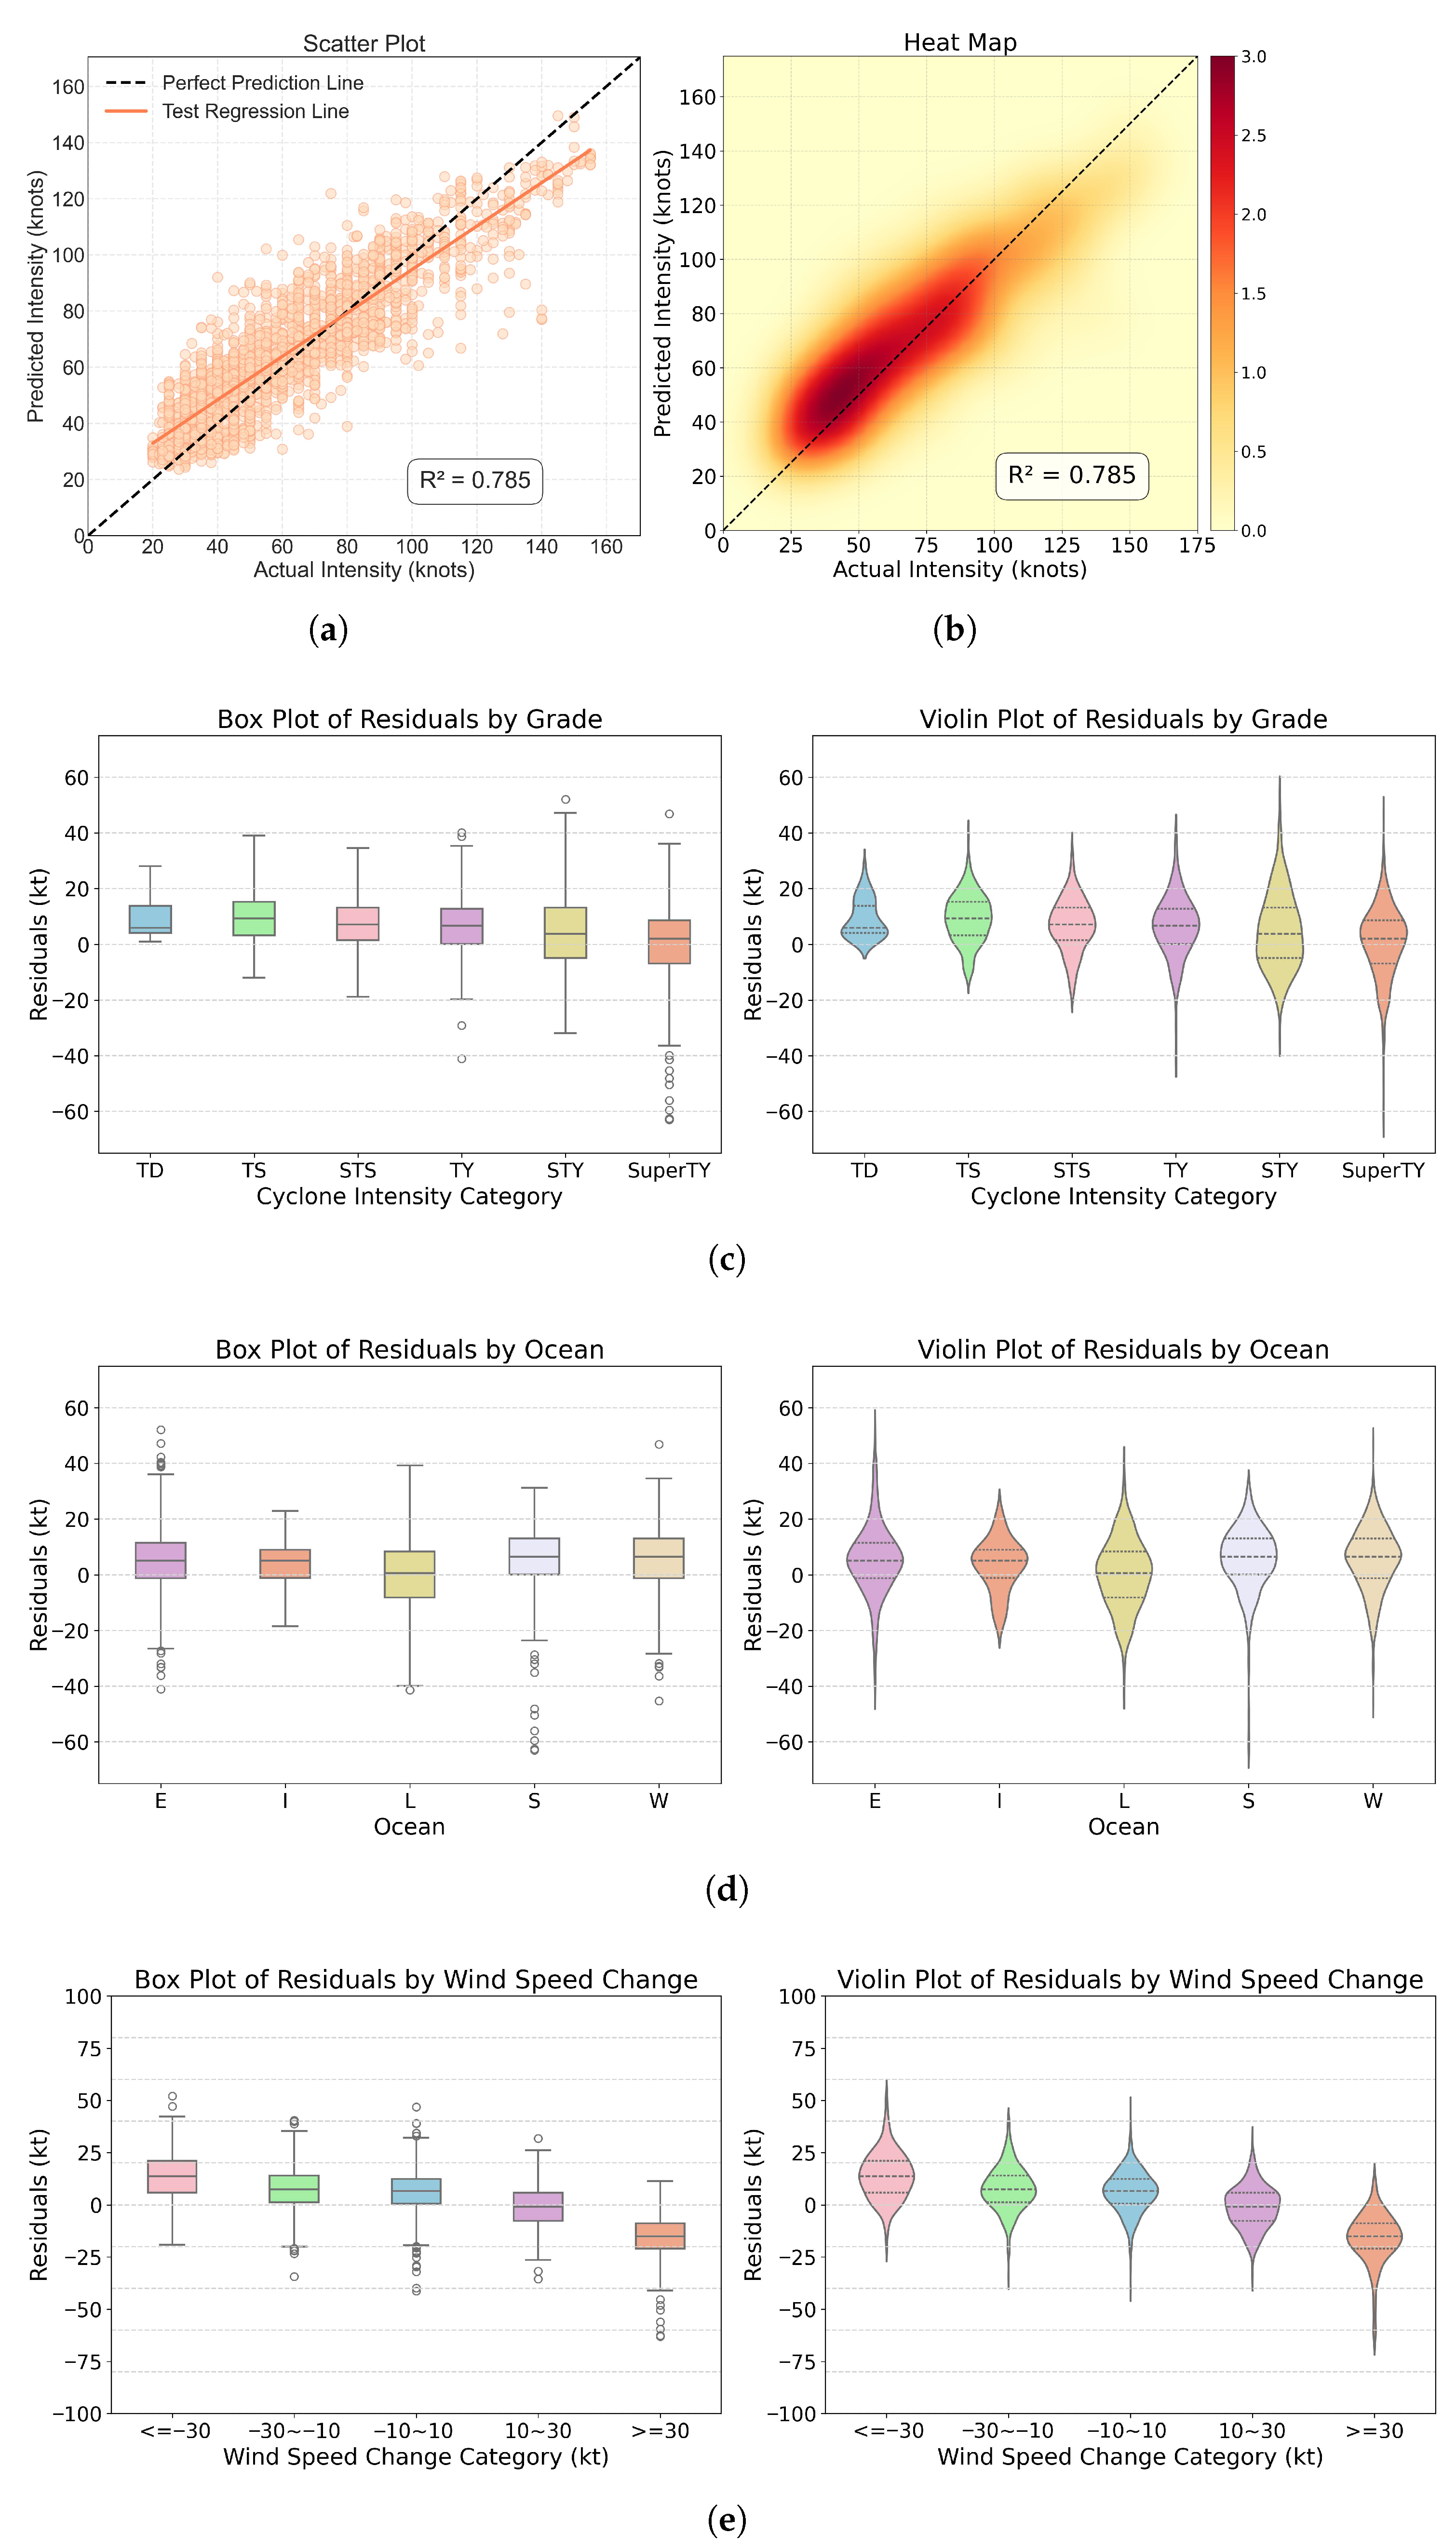
The model’s predictive performance was comprehensively evaluated through multiple complementary analyses (Figure 4). The predicted–observed scatter closely follows the 1:1 line, with an overall coefficient of determination of R2 = 0.78, indicating robust explanatory power and stable performance across the test set, while residuals remain largely centered near zero. Similarly, the density heatmap shows that forecast probabilities are tightly concentrated along the diagonal, confirming well-calibrated central estimates and demonstrating that the agreement is driven by the bulk of cases rather than isolated outliers.
Based on the tropical cyclone (TC) intensity classification system of the China Meteorological Administration (CMA), we performed a boxplot visualization of the absolute error distributions across different intensity categories, as shown in Figure 4c. The absolute error values were calculated as the algebraic differences between model outputs and observed values. Quantitative analysis indicates a pronounced negative correlation between TC intensity category and model accuracy: as the intensity increases from tropical depression (TD) and tropical storm (TS) to severe typhoon (STY) and super typhoon (SuperTY), the median absolute error exhibits a monotonic upward trend. The boxplots for TD and TS reveal compact distributions with a relatively low occurrence of outliers, suggesting that the model maintains higher predictive stability for low- to moderate-intensity cyclones, which account for 55% of the total samples. In sharp contrast, the error distribution for SuperTY demonstrates substantial divergence, highlighting greater uncertainty and error magnitude in the parameterization of dynamical processes for high-intensity TCs. It is noteworthy that discrete outlier points (gray dots outside the boxes) are detected across all intensity categories. Complementary violin plots further illustrate not only the range of values along the vertical axis, but also their distribution. Most intensity values cluster around 0 kt, while the distributions for TY, STY, and SuperTY span a wider range, indicating larger estimation variability within these categories. Conversely, the narrower distributions for TD, TS, and severe tropical storm (STS) suggest the smaller error dispersion and relatively stronger predictive capability of the model for these lower-intensity categories.
In addition, we analyzed the model’s forecast errors for tropical cyclones occurring in different ocean basins, namely the Eastern Pacific (E), Indian Ocean (I), North Atlantic (L), Southern Hemisphere (S), and Western Pacific (W). As shown in Figure 4d, the absolute forecast errors of TC intensity in 2017 exhibit pronounced regional differences. Forecast errors over the Southern Hemisphere are generally lower, demonstrating better accuracy and stability, whereas both the North Atlantic and Western Pacific show higher medians and wider dispersions, with a larger number of extreme deviations. Several factors may contribute to these differences. First, the coverage and quality of observational data directly affect forecast performance. Although the North Atlantic benefits from a relatively mature observing system, its complex land–ocean boundaries and the frequent occurrence of rapid intensification events make it difficult for the model to accurately characterize TC intensity evolution. In contrast, the Southern Hemisphere, despite its more limited observational data, experiences lower cyclone activity and a relatively stable environmental background, which allows the model to better capture the intensity patterns and achieve lower forecast errors. Furthermore, geographical conditions, air–sea interaction characteristics, structural differences among cyclones, the accumulation of historical data, and the regional adaptability of the model also influence forecast accuracy. For example, the frequent occurrence of structurally complex and rapidly evolving super typhoons or hurricanes in the Western Pacific and North Atlantic increases the difficulty of intensity forecasting.
To further examine forecast performance under varying intensity change scenarios, samples were stratified according to the 24 h change in maximum sustained wind speed into five categories: strong weakening ( Δ V < 30 kt), moderate weakening ( 30 Δ V < 10 kt), near-stationary ( 10 Δ V 10 kt), moderate strengthening ( 10 < Δ V 30 kt), and rapid intensification ( Δ V > 30 kt). As illustrated in Figure 4e, the absolute forecast errors vary systematically across these categories. The near-stationary group shows the lowest median error and the narrowest distribution, indicating that the model performs most reliably when cyclone intensity remains nearly unchanged. In contrast, both strong weakening and rapid intensification bins display substantially larger medians, broader dispersions, and more frequent extreme outliers, with the most pronounced errors occurring during rapid intensification events. These results reveal a clear dependence of error magnitude on the rate of intensity change. The elevated errors in the extreme-change categories are mainly attributable to two factors. First, the physical processes governing rapid weakening or intensification—such as convective bursts, eyewall replacement cycles, ocean heat content anomalies, and abrupt air–sea feedbacks—are inherently nonlinear and difficult to resolve within the current model framework. Second, the scarcity of extreme-change cases in the training dataset reduces statistical robustness, leading to inflated variance and unstable estimation. Together, these factors explain the heteroscedastic error pattern, where forecast uncertainty grows with the absolute value of Δ V .
Collectively, these results indicate that while central predictions remain well calibrated, uncertainty bands should widen adaptively with intensity—a property naturally captured by TCDM’s probabilistic formulation.

3.2. Comparison Model

Table 2 presents the performance of TCDM and the baseline models in cyclone intensity forecasting. To ensure a fair comparison across baseline models, all probabilistic approaches were evaluated under comparable computational resources. Specifically, the proposed TCDM used 120 ensemble members, a configuration identified as the performance saturation point according to the analysis presented in Figure 3. For comparison, the MC Dropout model performed 120 stochastic forward passes during inference, while the Deep Ensemble model consisted of 10 independently trained networks, each generating 12 samples, resulting in the same total of 120 ensemble members, and the GAN model was configured with 120 ensemble members. A comparison with baseline models indicates that TCDM achieves a balanced performance in both deterministic and probabilistic predictions. Our proposed model outperforms other machine learning approaches in the testing phase. To verify the significance of TCDM’s performance improvements, we conducted the Diebold–Mariano statistical significance test. The results indicate that, compared with all other probabilistic benchmark models (MC Dropout, Deep Ensemble, and GAN), the improvements achieved by TCDM in terms of MAE, RMSE, and CRPS are statistically significant ( p < 0.05 ).
As shown in Table 2, the proposed TCDM model yields stable results for the CRPS metric in probabilistic forecasting. Notably, during independent testing, the 95% confidence interval of our model’s PICP covers 93% of the test data, indicating superior interval prediction performance. The intervals nearly encompass the full range of TC intensity variations.
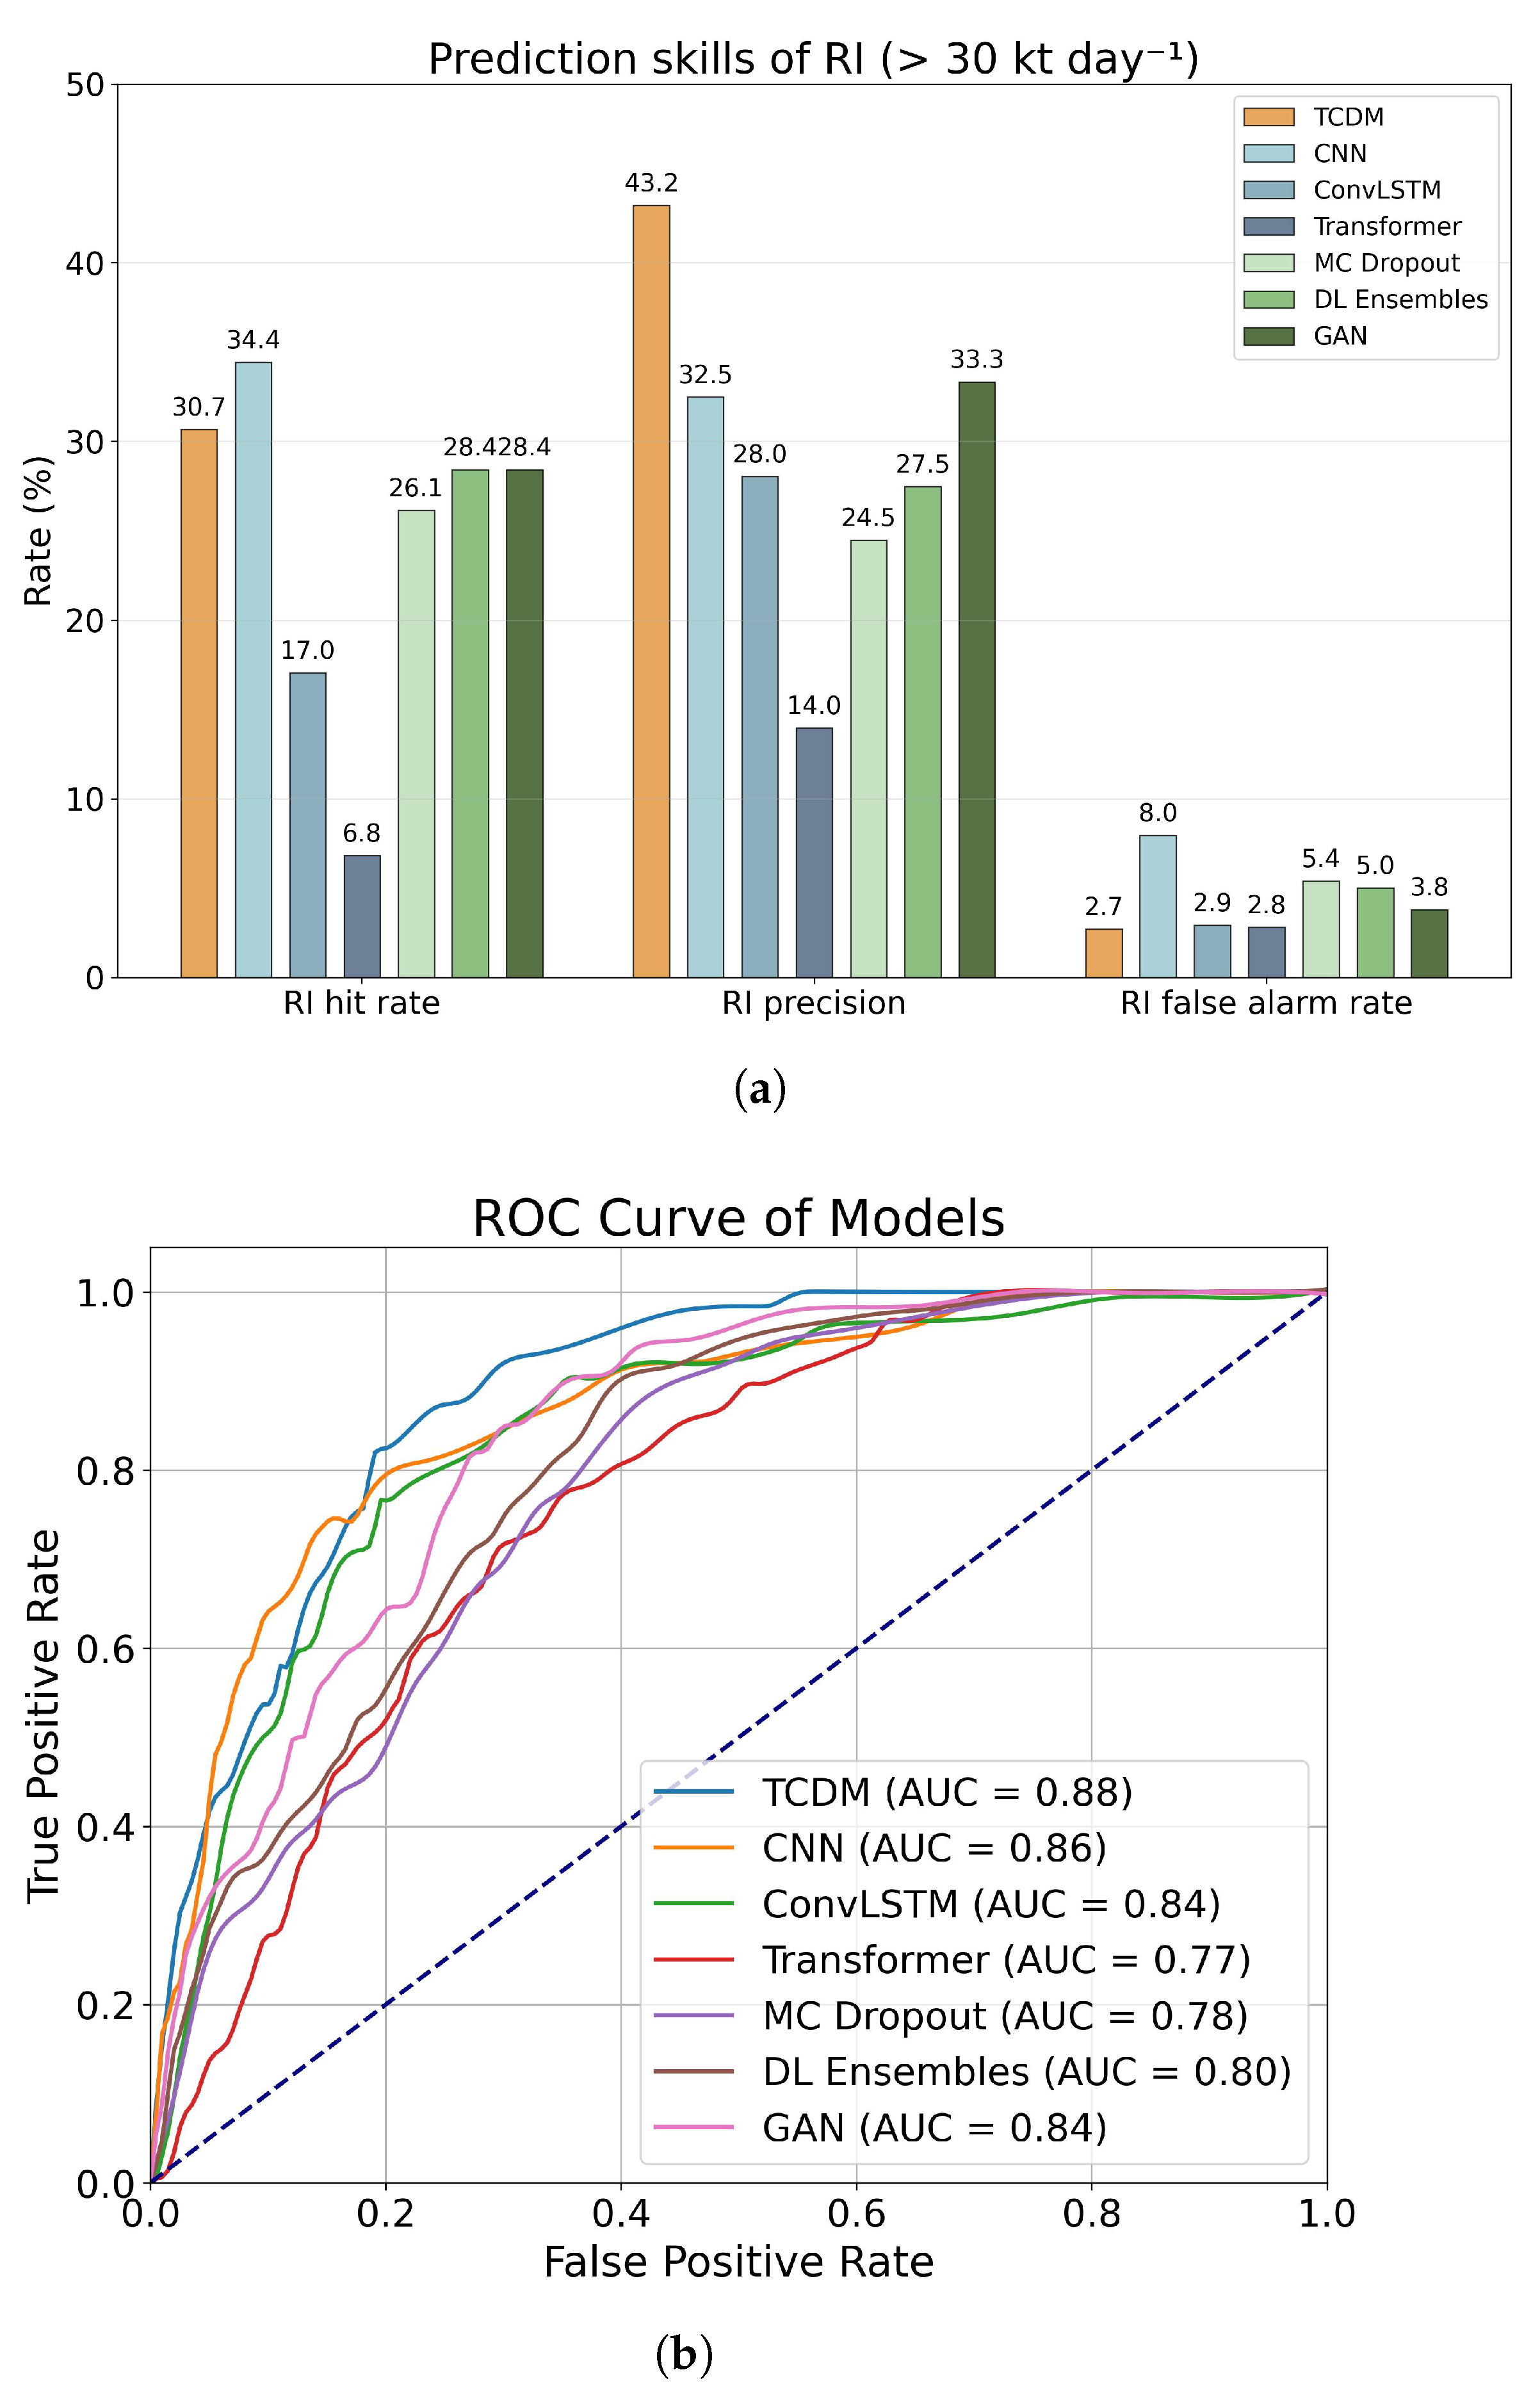
To evaluate the performance of the model in predicting rapid intensification (RI) phenomena, this study employed three commonly used classification metrics: precision (Precision = TP/(TP + FP)), hit rate (Hit Rate = TP/(TP + FN)), and false alarm rate (False Alarm Rate = FP/(FP + TN). Additionally, ROC curves for each model were plotted. The results shown in Figure 5a indicate that, at the set threshold, the TCDM model outperforms other models in both hit rate and precision, demonstrating its enhanced capability in RI event recognition. Further analysis reveals that the proposed method effectively suppresses false alarms, maintaining the false alarm rate below 5%, the lowest among all models. The ROC curve and AUC values in Figure 5b further confirm the superiority of the TCDM model in rapid intensification prediction, with the curve closest to the top-left corner and the highest AUC, indicating its optimal overall performance in distinguishing rapid intensification events from non-rapid intensification events.

3.3. Case Study

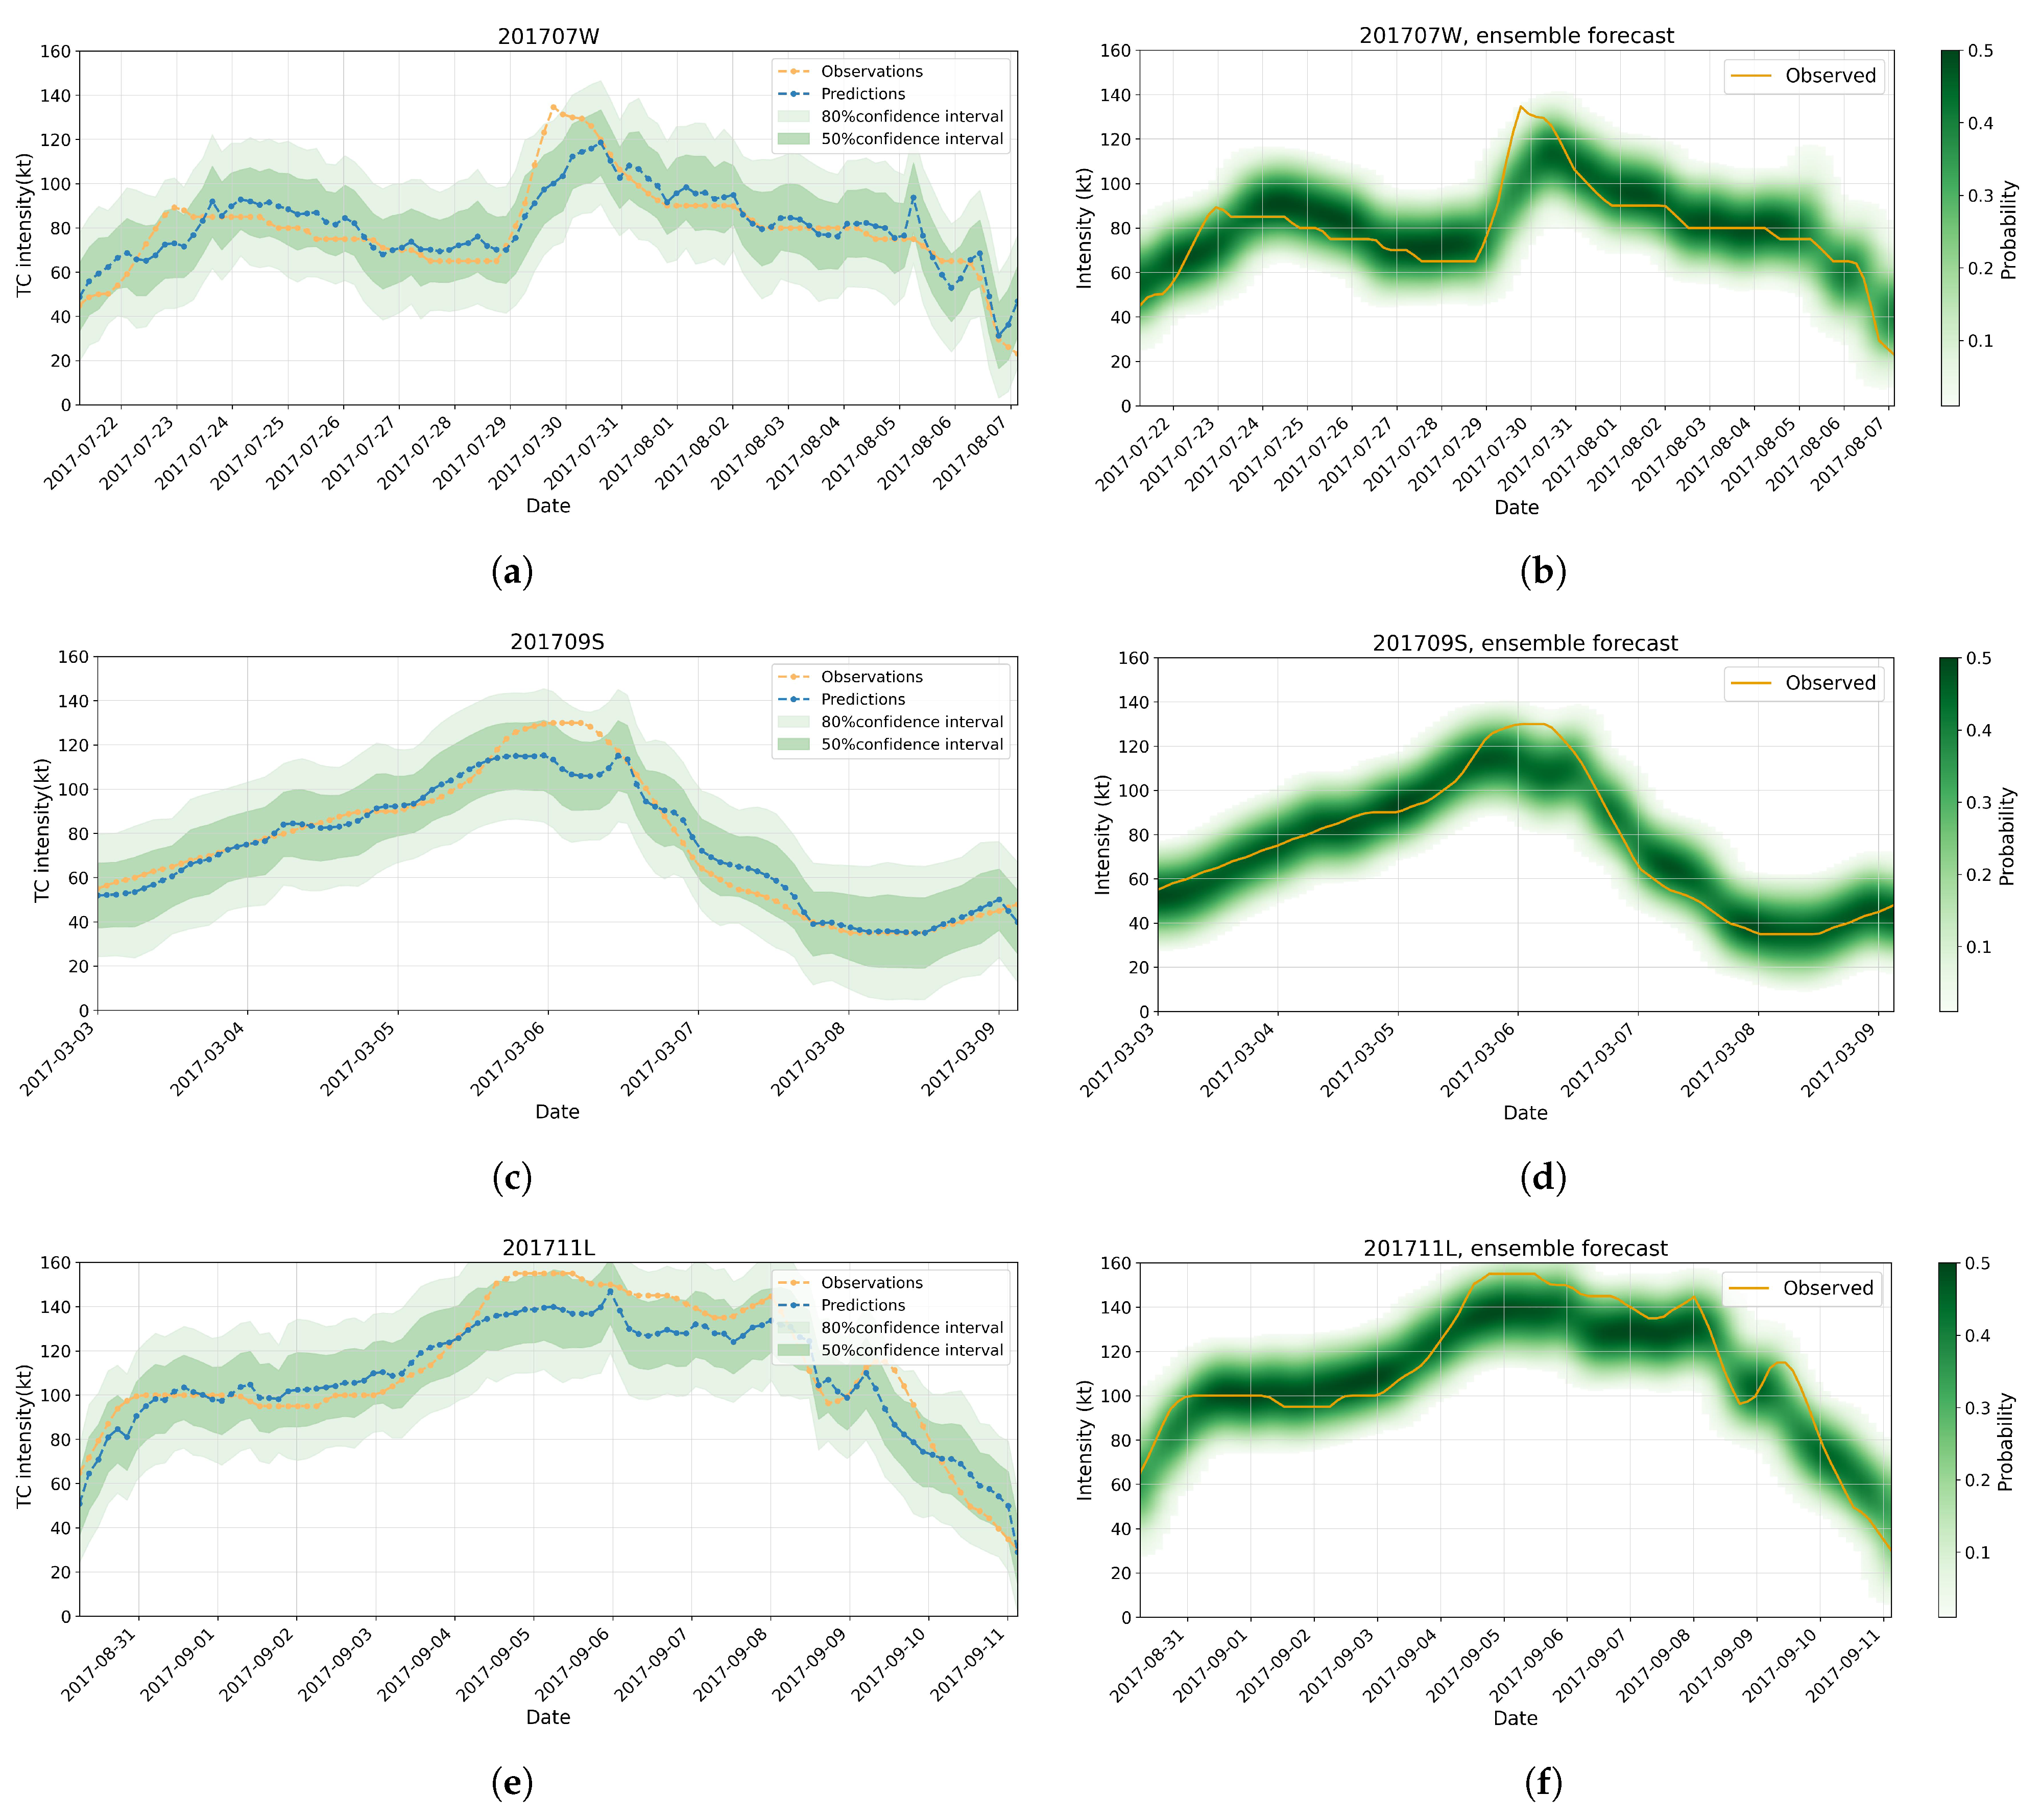
To further examine model behavior, Figure 6 presents probabilistic intensity forecasts for selected TCs. Overall, TCDM successfully captured the general evolution of cyclone intensity and provided uncertainty estimates that closely matched observed variability. The predictive distributions were generally compact and smooth, reflecting stable and reliable performance.
However, in some RI cases, while the model correctly signaled intensification trends, it tended to underestimate the upper bounds of extreme wind speeds. This bias likely stems from the relatively limited number of RI samples in the training set, which restricts the model’s ability to fully learn the abrupt dynamics of such events. Despite this limitation, the 50% and 80% confidence intervals encompassed most of the observed intensities, underscoring the model’s capacity to express forecast uncertainty.
From a scientific perspective, these findings highlight both the promise and challenges of probabilistic TC forecasting. The strong performance in baseline scenarios underscores the value of diffusion-based probabilistic modeling, while the underestimation of extreme RI cases suggests a need for enhanced sample balancing or physics-guided constraints in future work.

4. Discussion

The TCDM model demonstrates significant advantages for the probabilistic forecasting of tropical cyclone intensity. Its core contribution lies in the successful introduction of diffusion generative models into the prediction of extreme meteorological events, enabling explicit modeling of uncertainty. Compared with traditional deterministic forecasting methods, TCDM not only provides point predictions but also generates full posterior probability distributions, thereby offering a more comprehensive reflection of forecast risks and richer information for decision-making. The results indicate that TCDM achieves high hit rates and low false alarm rates in identifying RI events, suggesting strong capability in capturing nonlinear behaviors such as rapid intensity changes. This performance is primarily attributed to the diffusion model’s strength in fitting complex conditional distributions and the effectiveness of the multimodal feature fusion mechanism.
Nevertheless, the TCDM model still has certain limitations. First, in cases of extreme rapid intensification, the model slightly underestimates the upper bound of intensity. This may be partially due to the insufficient proportion of RI samples in the training data and also reflects a limited sensitivity of the model to abrupt atmospheric thermodynamic processes. Second, the current model mainly relies on re-analysis data and remote sensing images as input, but it does not incorporate high-temporal-resolution and high-spatial-resolution in situ observations (e.g., surface heat fluxes or ocean mixed-layer temperatures), which may limit the representation of certain key physical processes. In addition, we conducted an exploratory experiment to evaluate the model’s performance at longer forecast lead times. The results indicate a gradual degradation in both deterministic and probabilistic skill as lead time increases. Specifically, MAE and RMSE exhibit a near-linear growth with forecast horizon, while CRPS values increase more markedly beyond 96 h, suggesting a widening of predictive uncertainty. This performance decline is consistent with the general loss of predictive skill observed in both numerical and machine learning-based intensity forecasts at extended lead times, primarily due to the accumulation of environmental uncertainty and the increasingly stochastic nature of cyclone–ocean–atmosphere interactions. Nonetheless, even at 120 h, TCDM maintains lower error magnitudes and better-calibrated probabilistic intervals compared with baseline ensemble methods, highlighting its robustness and the benefits of diffusion-based uncertainty modeling for medium-range tropical cyclone forecasts. Furthermore, in terms of computational cost, the training of TCDM takes approximately 12 h on an A800 GPU. Generating 120 probabilistic forecast samples requires an average of 3.5 s, whereas the Deep Ensemble model takes only 0.4 s. This confirms the challenge of sampling efficiency inherent in diffusion models, which represents a key issue to be addressed in future work through model compression or accelerated sampling techniques.
These findings are consistent with recent studies that leverage deep generative models to improve meteorological forecasting [41], particularly demonstrating that probabilistic generative approaches offer more stable statistical performance than traditional ensemble methods when dealing with high-uncertainty events. However, compared with fully numerical model-based forecasting systems, purely data-driven methods still exhibit limitations in explaining certain abrupt weather processes due to the lack of explicit physical constraints [42]. Future work may focus on several directions: (1) incorporating learnable physical constraints (e.g., thermodynamic equations or energy balance conditions) into the model to enhance process plausibility; (2) integrating higher spatiotemporal resolution remote sensing retrieval parameters (e.g., sea surface temperature and liquid water path) to improve the perception of tropical cyclone microphysics and environmental features; (3) exploring model compression and accelerated inference techniques, such as knowledge distillation or sparse diffusion sampling, to enhance feasibility for operational applications.
The TCDM framework also demonstrates strong generalization and transfer potential and can be extended to probabilistic forecasting of additional meteorological variables, such as typhoon track ensemble prediction, heavy rainfall probability forecasting, and extreme weather diagnostics. In cross-disciplinary applications, including regional climate modeling and hydrometeorological coupled forecasting, the model shows promising applicability. From an operational forecasting perspective, it can provide more scientific probabilistic support for meteorological disaster emergency management, particularly in early identification of rapid intensification events and quantification of associated uncertainties.
Finally, regarding the physical mechanisms learned by the model, we hypothesize that the cross-attention fusion module in TCDM can dynamically adjust its focus on satellite image features (e.g., convective organization structures) according to the environmental fields represented by SHIPS variables. For example, when the SHIPS data indicate the presence of strong vertical wind shear, the model may place greater emphasis on asymmetric structures in satellite cloud imagery. However, to bridge the gap between the “black-box” nature of the model and the meteorological understanding of underlying physical processes, future research should incorporate more in-depth interpretability analyses to explicitly identify the key multimodal features upon which the model relies during forecasting.

5. Conclusions

The TCDM model proposed in this study demonstrates strong accuracy and uncertainty quantification capabilities in probabilistic intensity forecasting of tropical cyclones. By incorporating diffusion modeling mechanisms and conditional information fusion, the model effectively captures complex relationships among meteorological variables, outperforming existing methods across multiple regions and intensity categories. In the rapid intensification detection task, TCDM achieves a well-balanced trade-off among accuracy, hit rate, and false alarm control, confirming its robustness in extreme weather scenarios. Furthermore, experiments reveal the distribution characteristics of model errors across different intensity levels and oceanic regions, further validating its generalization ability and practical application potential. Future work will focus on enhancing the model’s capacity to learn from rare rapid intensification cases, improving predictions of moderate changes, and exploring the integration of additional physical priors with generative modeling strategies to advance the intelligence and reliability of disaster forecasting.

Supplementary Materials

The following supporting information can be downloaded at: https://www.mdpi.com/article/10.3390/rs17213600/s1, Supporting Information for “Probabilistic Forecasting Model for Tropical Cyclone Intensity Based on Diffusion Model”.

Author Contributions

Conceptualization, J.L. and F.M.; methodology, P.Y.; software, P.Y.; validation, J.L., P.Y., and F.M.; formal analysis, J.L.; investigation, P.Y.; resources, F.M.; data curation, P.Y.; writing—original draft preparation, P.Y.; writing—review and editing, J.L. and F.M.; visualization, P.Y.; supervision, F.M.; project administration, J.L.; funding acquisition, J.L. All authors have read and agreed to the published version of the manuscript.

Funding

This work was funded by the State Key Laboratory of Climate System Prediction and Risk Management (CPRM) initiative project (Grant No. CPRM-2025-NUIST-012), Climate System Prediction Research Center, the National Natural Science Foundation of China (Grant No. 62502219) and the Natural Science Foundation of Jiangsu Province (Grant No. BK20240700).

Data Availability Statement

The original contributions presented in the study are included in the article/Supplementary Material, further inquiries can be directed to the corresponding author.

Conflicts of Interest

The authors declare no conflicts of interest.

References

  1. World Meteorological Organization. Rising Risks. 2022. Available online: https://public.wmo.int/en/resources/world-meteorological-day/world-meteorological-day-2022-early-warning-early-action/risking-risks (accessed on 4 September 2025).
  2. Emanuel, K. Increasing destructiveness of tropical cyclones over the past 30 years. Nature 2005, 436, 686–688. [Google Scholar] [CrossRef]
  3. Patricola, C.M.; Wehner, M.F. Anthropogenic increase in Atlantic hurricane intensities. Science 2018, 359, eaao6757. [Google Scholar]
  4. Chen, B.-F.; Kuo, Y.-T.; Huang, T.-S. A deep learning ensemble approach for predicting tropical cyclone rapid intensification. Atmos. Sci. Lett. 2023, 24, e1151. [Google Scholar] [CrossRef]
  5. Kaplan, J.; DeMaria, M. Large-scale characteristics of rapidly intensifying tropical cyclones in the North Atlantic basin. Weather Forecast. 2003, 18, 1033–1046. [Google Scholar] [CrossRef]
  6. DeMaria, M.; Mainelli, M.; Shay, L.K.; Knaff, J.A.; Kaplan, J. The Hurricane Weather Research and Forecasting (HWRF) model. Mon. Weather Rev. 2005, 133, 1801–1816. [Google Scholar]
  7. Cangialosi, J.P.; Blake, E.; DeMaria, M.; Penny, A.; Latto, A.; Rappaport, E.; Tallapragada, V. Recent progress in tropical cyclone intensity forecasting at the national hurricane center. Weather Forecast. 2020, 35, 1913–1922. [Google Scholar] [CrossRef]
  8. DeMaria, M.; Knaff, J.A.; Sampson, C.R.; Musgrave, K.D.; Kaplan, J. Advances in tropical cyclone intensity forecasting. Weather Forecast. 2014, 29, 523–549. [Google Scholar]
  9. Rogers, R.; Aberson, S.; Aksoy, A.; Annane, B.; Black, M.; Cione, J.; Dorst, N.; Dunion, J.; Gamache, J.; Goldenberg, S.; et al. NOAA’s hurricane intensity forecasting experiment: A progress report. Bull. Am. Meteorol. Soc. 2013, 94, 859–882. [Google Scholar] [CrossRef]
  10. DeMaria, M.; Kaplan, J. A statistical hurricane intensity prediction scheme (SHIPS) for the Atlantic basin. Weather Forecast. 1994, 9, 209–220. [Google Scholar] [CrossRef]
  11. DeMaria, M.; Kaplan, J. An updated statistical hurricane intensity prediction scheme (SHIPS) for the Atlantic and eastern North Pacific basins. Weather Forecast. 1999, 14, 326–337. [Google Scholar] [CrossRef]
  12. Roy, C.; Kovordanyi, R. Tropical cyclone track forecasting techniques—A review. Atmos. Res. 2012, 104, 40–69. [Google Scholar] [CrossRef]
  13. Gneiting, T.; Raftery, A.E. Weather forecasting with ensemble methods. Science 2005, 310, 248–249. [Google Scholar] [CrossRef]
  14. Hazelton, A.T. Improved Tropical Cyclone Rapid Intensification Forecasts in the Operational HAFS. Weather Forecast. 2023, 38, 1335–1354. [Google Scholar]
  15. Zhang, J.A.; Marks, F.D. Progress and challenges in understanding and forecasting tropical cyclone rapid intensification. Trop. Cyclone Res. Rev. 2021, 10, 1–13. [Google Scholar]
  16. Haupt, S.E.; Pasini, A. (Eds.) Artificial Intelligence Methods in the Environmental Sciences; Elsevier: Amsterdam, The Netherlands, 2020. [Google Scholar]
  17. Reichstein, M.; Camps-Valls, G.; Stevens, B.; Jung, M.; Denzler, J.; Carvalhais, N.; Prabhat. Deep learning and process understanding for self-explaining earth system science. Nature 2019, 566, 195–204. [Google Scholar] [CrossRef]
  18. Ham, Y.-G.; Kim, J.-H.; Luo, J.-J. Deep learning for multi-year ENSO forecasts. Nature 2019, 573, 568–572. [Google Scholar] [CrossRef]
  19. Espeholt, L.; Agrawal, S.; Sønderby, C.; Kumar, M.; Heek, J.; Bromberg, C.; Gazen, C.; Hickey, J.; Bell, A.; Kalchbrenner, N. Skillful twelve hour precipitation forecasts using large context neural networks. Nature 2022, 609, 503–508. [Google Scholar]
  20. Shi, X.; Chen, Z.; Wang, H.; Yeung, D.-Y.; Wong, W.-K.; Woo, W.-C. Convolutional LSTM network: A machine learning approach for precipitation nowcasting. In Proceedings of the NIPS’15: Proceedings of the 29th International Conference on Neural Information Processing Systems, Montreal, QC, Canada, 7–12 December 2015; pp. 802–810. [Google Scholar]
  21. Chen, R.; Zhang, W.; Wang, X. Machine learning in tropical cyclone forecast modeling: A review. Atmosphere 2020, 11, 676. [Google Scholar] [CrossRef]
  22. Xu, W.; Balaguru, K.; August, A.; Lalo, N.; Hodas, N.; DeMaria, M.; Judi, D. Deep learning experiments for tropical cyclone intensity forecasts. Weather Forecast. 2021, 36, 1453–1470. [Google Scholar] [CrossRef]
  23. Wimmers, A.; Velden, C.; Cossuth, J.H. Using deep learning to estimate tropical cyclone intensity from satellite passive microwave imagery. Mon. Weather Rev. 2019, 147, 2261–2282. [Google Scholar] [CrossRef]
  24. Cloud, K.; Rozoff, C.; Lewis, W.; Wimmers, A.; Velden, C.; Kossin, J. A deep learning model for rapid intensification of Atlantic hurricanes. Weather Forecast. 2019, 34, 1745–1761. [Google Scholar]
  25. Su, H.; Wu, L.; Jiang, J.H.; Pai, C.-W.; Zhai, A.; Fovell, R.G. Applying satellite observations of tropical cyclone internal structures to rapid intensification forecast with machine learning. Geophys. Res. Lett. 2020, 47, e2020GL089102. [Google Scholar] [CrossRef]
  26. Yang, Q.; Lee, C.Y.; Tippett, M.K. A long short-term memory model for global rapid intensification prediction. Weather Forecast. 2020, 35, 1203–1220. [Google Scholar] [CrossRef]
  27. Meng, F.; Yang, K.; Yao, Y.; Wang, Z.; Song, T. Tropical Cyclone Intensity Probabilistic Forecasting System Based on Deep Learning. Int. J. Intell. Syst. 2023, 3569538. [Google Scholar] [CrossRef]
  28. Meng, F.; Yao, Y.; Wang, Z.; Peng, S.; Xu, D.; Song, T. Probabilistic forecasting of tropical cyclones intensity using machine learning model. Environ. Res. Lett. 2023, 18, 044042. [Google Scholar] [CrossRef]
  29. Berner, J.; Achatz, U.; Batté, L.; De La Cámara, A.; Christensen, H.M.; Colangeli, M.; Colangeli, M.; Coleman, D.R.B.; Crommelin, D.; Dolaptchiev, S.I.; et al. Stochastic parameterization: Toward a new view of weather and climate models. Bull. Am. Meteorol. Soc. 2017, 98, 565–588. [Google Scholar] [CrossRef]
  30. Gneiting, T.; Raftery, A.E. Probabilistic forecasts, calibration and sharpness. J. R. Stat. Soc. Ser. Stat. Methodol. 2007, 69, 243–268. [Google Scholar] [CrossRef]
  31. Price, I.; Sanchez-Gonzalez, A.; Alet, F.; Andersson, T.R.; El-Kadi, A.; Masters, D.; Ewalds, T.; Stott, J.; Mohamed, S.; Battaglia, P.; et al. Probabilistic weather forecasting with machine learning. Nature 2025, 637, 84–90. [Google Scholar] [CrossRef] [PubMed]
  32. Taillardat, M.; Mestre, O.; Zamo, M.; Naveau, P. Calibrated ensemble forecasts using quantile regression forests and ensemble model output statistics. Mon. Weather Rev. 2016, 144, 2375–2393. [Google Scholar] [CrossRef]
  33. Ho, J.; Jain, A.; Abbeel, P. Denoising diffusion probabilistic models. In Proceedings of the NIPS’20: Proceedings of the 34th International Conference on Neural Information Processing Systems, Vancouver, BC, Canada, 6–12 December 2020; pp. 6840–6851. [Google Scholar]
  34. Sohl-Dickstein, J.; Weiss, E.; Maheswaranathan, N.; Ganguli, S. Deep unsupervised learning using nonequilibrium thermodynamics. In Proceedings of the International Conference on Machine Learning, Lille, France, 6–11 July 2015; pp. 2256–2265. [Google Scholar]
  35. Song, Y.; Ermon, S. Improved techniques for training score-based generative models. In Proceedings of the NIPS’20: Proceedings of the 34th International Conference on Neural Information Processing Systems, Vancouver, BC, Canada, 6–12 December 2020; pp. 12438–12448. [Google Scholar]
  36. Rombach, R.; Blattmann, A.; Lorenz, D.; Esser, P.; Ommer, B. High-resolution image synthesis with latent diffusion models. In Proceedings of the IEEE/CVF Conference on Computer Vision and Pattern Recognition, New Orleans, LA, USA, 21–24 June 2022; pp. 10684–10695. [Google Scholar]
  37. Goodfellow, I.; Pouget-Abadie, J.; Mirza, M.; Xu, B.; Warde-Farley, D.; Ozair, S.; Courville, A.; Bengio, Y. Generative adversarial nets. In Proceedings of the Advances in Neural Information Processing Systems 27 (NIPS 2014), Montreal, QC, Canada, 8–13 December 2014; pp. 2672–2680. [Google Scholar]
  38. Kingma, D.P.; Welling, M. Auto-encoding variational Bayes. In Proceedings of the 2nd International Conference on Learning Representations (ICLR), Banff, AB, Canada, 14–16 April 2014. [Google Scholar]
  39. Chen, B.; Chen, B.-F.; Lin, H.-T. Rotation-blended CNNs on a new open dataset for tropical cyclone image-to-intensity regression. In Proceedings of the 24th ACM SIGKDD International Conference on Knowledge Discovery and Data Mining (KDD), London, UK, 19–23 August 2018. [Google Scholar]
  40. hariwal, P.; Nichol, A. Diffusion models beat GANs on image synthesis. In NIPS’21: Proceedings of the 35th International Conference on Neural Information Processing System, Virtual, 6–14 December 2021. [Google Scholar]
  41. Ravuri, S.; Lenc, K.; Willson, M.; Kangin, D.; Lam, R.; Mirowski, P.; Fitzsimons, M.; Athanassiadou, M.; Kashem, S.; Madge, S.; et al. Skilful precipitation nowcasting using deep generative models of radar. Nature 2021, 597, 672–677. [Google Scholar] [CrossRef] [PubMed]
  42. Beusch, L.; Rasp, S.; Dueben, P.D. Physics-constrained deep learning postprocessing of temperature and humidity. Geophys. Res. Lett. 2023, 50, e2023GL103582. [Google Scholar]
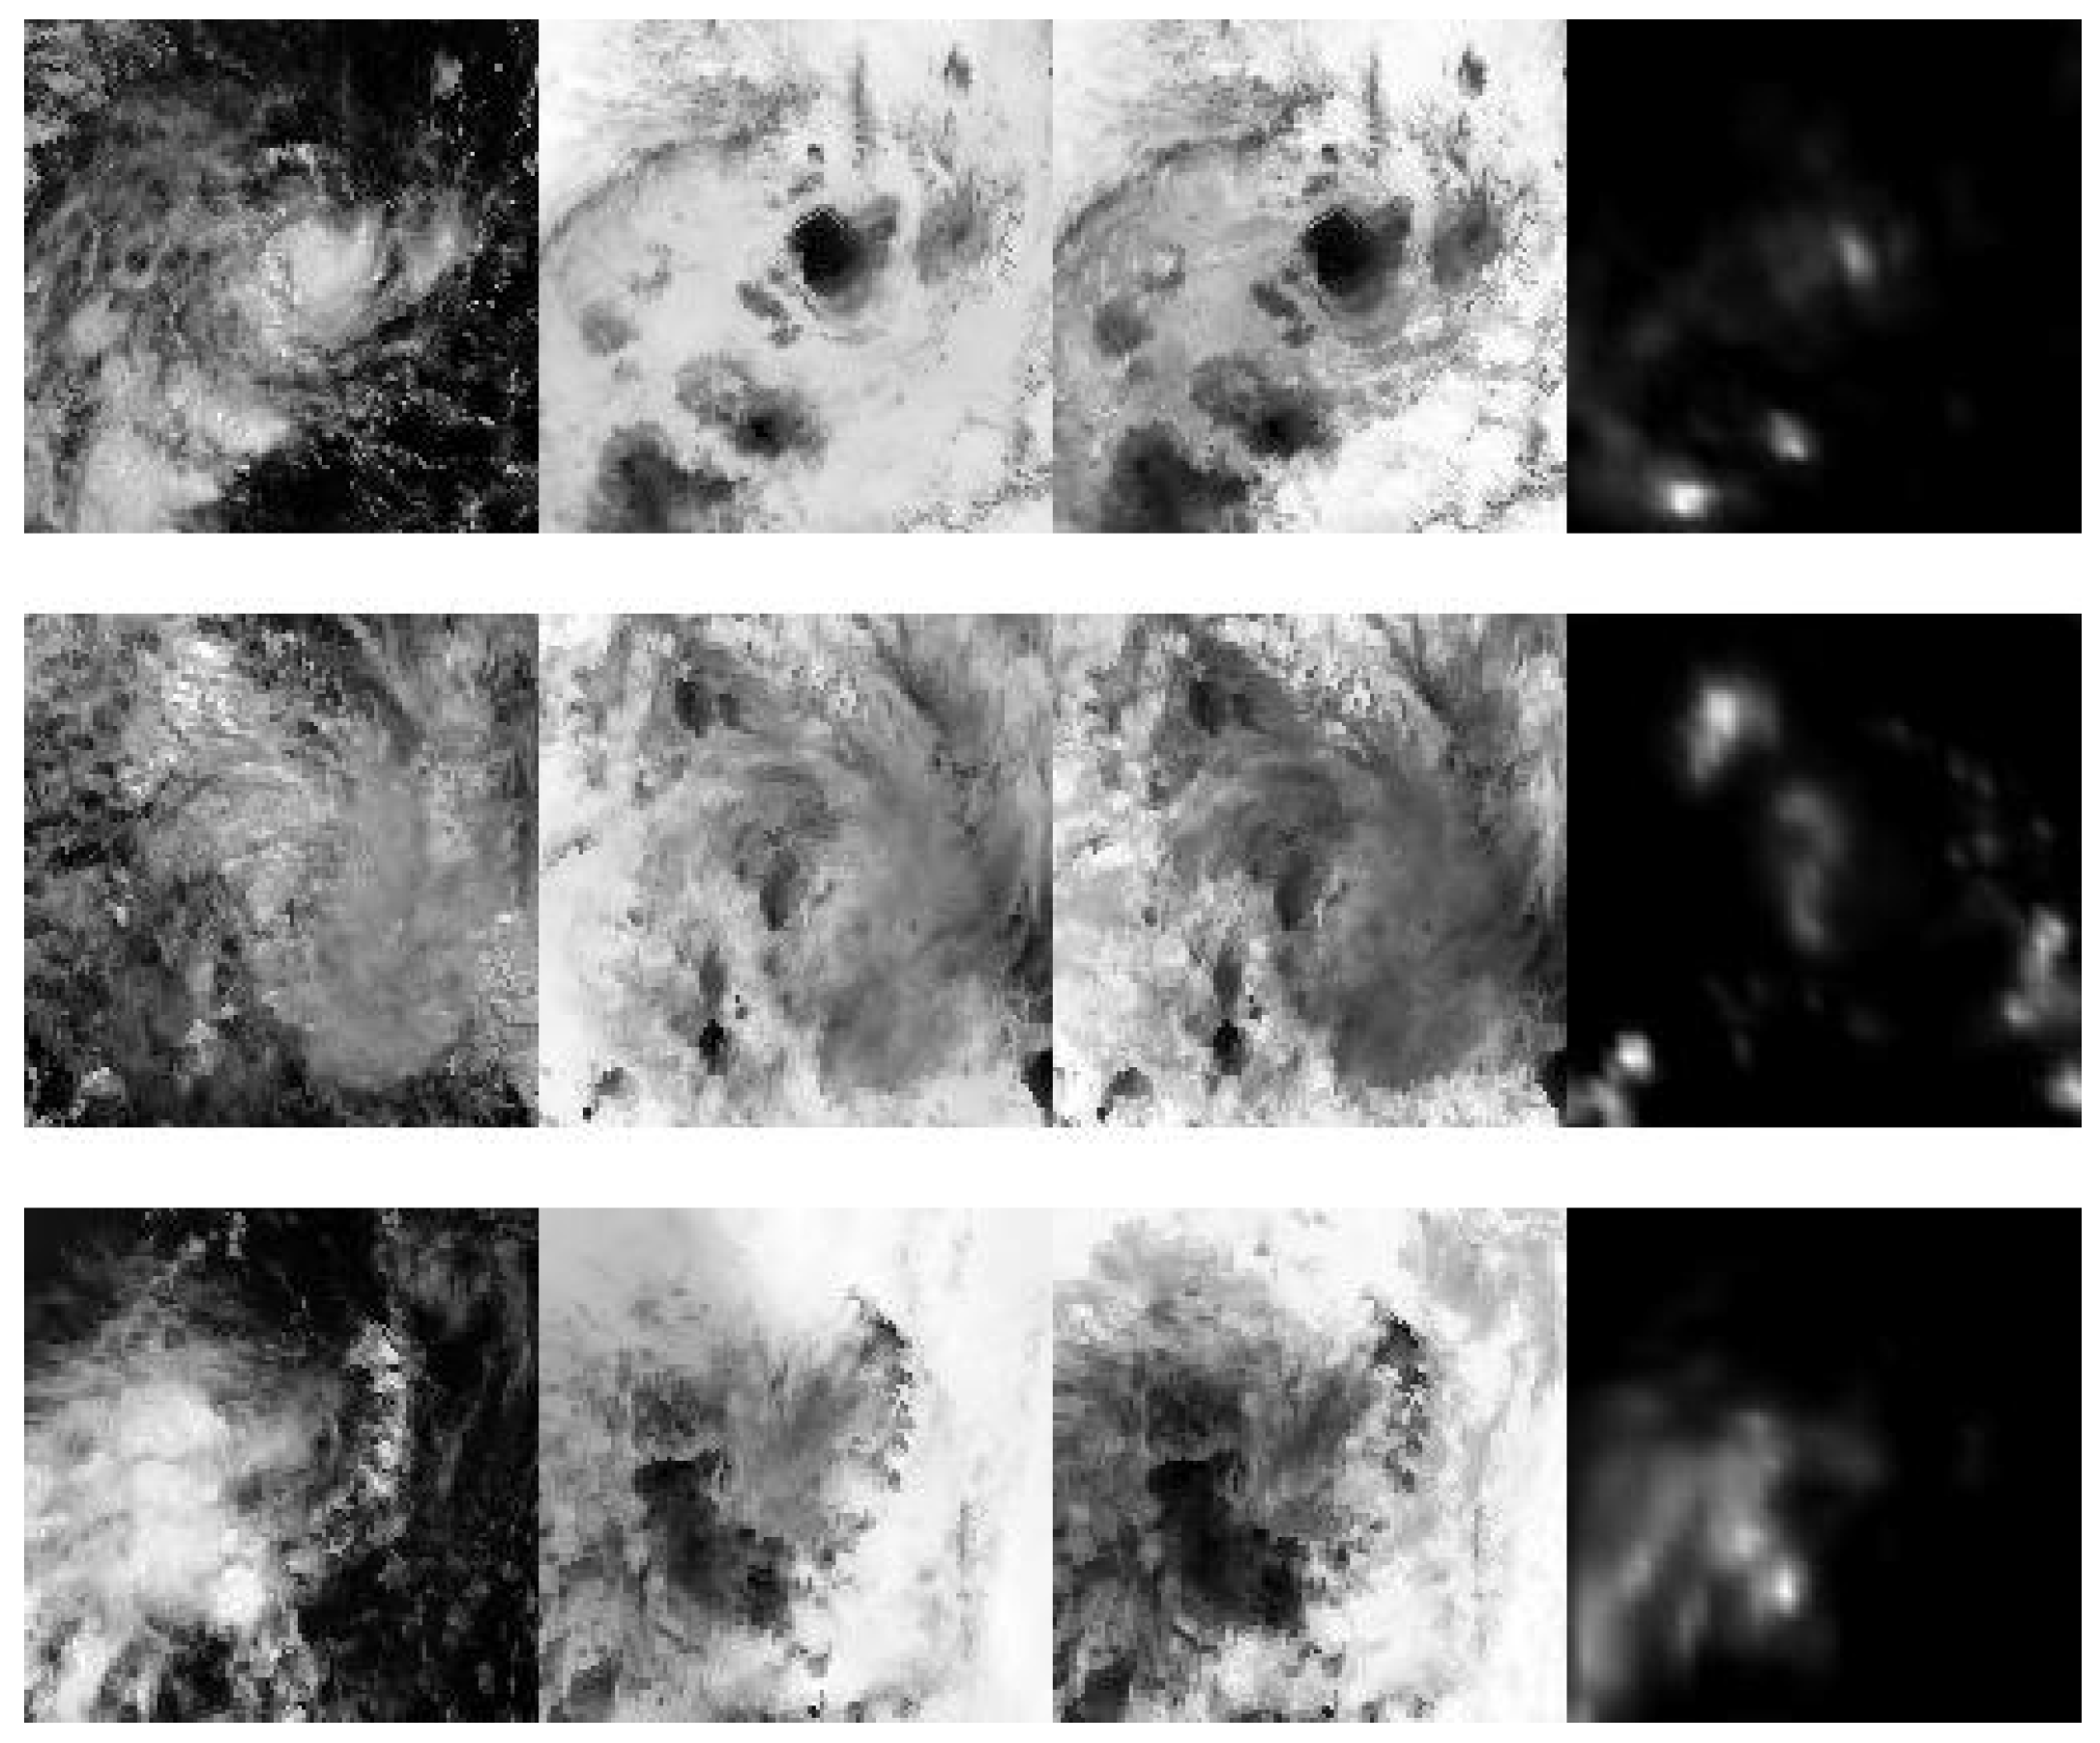
Figure 1. TCRI schematic diagram; from left to right: IR, PMW, VIS, and WV.
Remotesensing 17 03600 g001
Figure 2. Schematic diagram of the proposed TCDM framework.
Remotesensing 17 03600 g002
Figure 3. Performance of the model using different ensemble sizes.
Remotesensing 17 03600 g003
Figure 4. Comprehensive analysis of the prediction performance and uncertainty of the TCDM model. (a) Scatter plot of predicted versus observed TC intensity values. (b) Density heatmap of predictions. (c) Distribution of forecast residuals across different TC intensity grades. (d) Distribution of forecast residuals across ocean basins. (e) Distribution of forecast residuals across wind speed change.
Remotesensing 17 03600 g004
Figure 5. Comparative evaluation of rapid intensification (RI) prediction performance. (a) Model comparison based on precision, hit rate, and false alarm rate for RI events. (b) Receiver operating characteristic (ROC) curves and corresponding area under the curve (AUC) values.
Remotesensing 17 03600 g005
Figure 6. Probabilistic forecasts and confidence intervals for TCs 201707W, 201709S, and 201711L, generated by TCDM. (a,c,e): Time series of 24-h intensity forecasts for TC 201707W, TC 201709S, and TC 201711L, respectively. The plots show the observed intensity (“Observations”), the TCDM-predicted median intensity (“Predictions”), and the 50% (light green shaded area) and 80% (light blue shaded area) confidence intervals. (b,d,f): Corresponding full ensemble probabilistic forecasts for the three TCs. These plots visualize the probability density (heatmap) of the ensemble predictions at each time step, illustrating the evolution of the full predicted distribution and its uncertainty. The observed intensity (“Observed”) is overlaid as a yellow line for comparison against the predicted probability distribution.
Remotesensing 17 03600 g006
Table 1. Performance of the model using different input feature combinations.
CombinationMAERMSER2CRPSPICP
IR15.2019.500.6014.500.60
VIS16.5020.500.5016.000.55
PMW13.9017.500.6612.600.68
WV14.8018.000.5714.800.61
IR + VIS13.5017.200.6713.500.66
IR + PMW11.8015.000.758.800.82
IR + WV13.2016.700.6811.900.70
VIS + PMW14.2017.800.6412.200.69
VIS + WV15.2018.800.5913.600.64
PMW + WV13.6017.200.709.800.75
IR + VIS + PMW11.1013.700.777.900.84
IR + VIS + WV12.9016.000.6811.000.72
IR + PMW + WV10.2012.900.777.100.91
VIS + PMW + WV11.2014.200.728.500.86
IR + VIS + PMW + WV10.5012.800.767.400.90
IR + PMW + WV + SHIPS10.0412.730.787.170.93
Table 2. Performance comparison between the TCDM model and baseline models.
MAERMSER2CRPSPICP
CNN13.1717.330.62\\
ConvLSTM11.8715.690.68\\
Transformer11.7114.930.71\\
MC Dropout12.4615.820.6411.930.78
Deep Ensemble12.1115.780.669.340.81
GAN11.2114.240.737.980.86
TCDM10.0412.730.787.170.93
Disclaimer/Publisher’s Note: The statements, opinions and data contained in all publications are solely those of the individual author(s) and contributor(s) and not of MDPI and/or the editor(s). MDPI and/or the editor(s) disclaim responsibility for any injury to people or property resulting from any ideas, methods, instructions or products referred to in the content.