Article

RMCMamba: A Multi-Factor High-Speed Railway Bridge Pier Settlement Prediction Method Based on RevIN and MARSHead

1
School of Surveying and Geoinformation Engineering, East China University of Technology, Nanchang 330013, China
2
The National Key Laboratory of Uranium Resources Exploration-Mining and Nuclear Remote Sensing, East China University of Technology, Nanchang 330013, China
3
State-Province Joint Engineering Laboratory in Spatial Information Technology for High-Speed Railway Safety, Southwest Jiaotong University, Chengdu 611756, China
*
Author to whom correspondence should be addressed.
Remote Sens. 2025, 17(21), 3596; https://doi.org/10.3390/rs17213596
Submission received: 19 August 2025 / Revised: 1 October 2025 / Accepted: 28 October 2025 / Published: 30 October 2025

Highlights

What are the main findings?
  • We propose the RMCMamba model, which innovatively integrates RevIN and MARSHead modules. It effectively captures long-range dependencies in settlement time series and mitigates distribution shift issues.
  • RMCMamba significantly outperforms comparative methods in multi-factor scenarios, attaining an MAE of 0.049 mm and an RMSE of 0.077 mm, which corresponds to a 4.8% reduction in MAE compared to the second-best performing method.
What is the implication of the main finding?
  • The study provides a reliable technical framework (from E-PS-InSAR monitoring to multi-source data fusion and prediction) for high-precision health monitoring of critical transportation infrastructure like high-speed railways.
  • The open-sourced dataset and code serve as a valuable benchmark for future research in settlement prediction and relevant time series forecasting domains, promoting reproducibility and further development.

Abstract

The precise prediction of high-speed railway bridge pier settlement plays a crucial role in construction, maintenance, and long-term operation; however, current mainstream prediction methods mostly rely on independent analyses based on traditional or hybrid models, neglecting the impact of geological and environmental factors on subsidence. To address this issue, this paper proposes a multi-factor settlement prediction model for high-speed railway bridge piers named the Reversible Instance Normalization Multi-Scale Adaptive Resolution Stream CMamba, abbreviated as RMCMamba. During the data preprocessing process, the Enhanced PS-InSAR technology is adopted to obtain the time series data of land settlement in the study region. Utilizing the cubic improved Hermite interpolation method to fill the missing values of monitoring and considering the environmental parameters such as groundwater level, temperature, precipitation, etc., a multi-factor high-speed railway bridge pier settlement dataset is constructed. RMCMamba fuses the reversible instance normalization (RevIN) and the multiresolution forecasting head (MARSHead), enhancing the model’s long-range dependence capture capability and solving the time series data distribution drift problem. Experimental results demonstrate that in the multi-factor prediction scenario, RMCMamba achieves an MAE of 0.049 mm and an RMSE of 0.077 mm; in the single-factor prediction scenario, the proposed method reduces errors compared to traditional prediction approaches and other deep learning-based methods, with MAE values improving by 4.8% and 4.4% over the suboptimal method in multi-factor and single-factor scenarios, respectively. Ablation experiments further verify the collaborative advantages of combining reversible instance normalization and the multi-resolution forecasting head, as RMCMamba’s MAE values improve by 5.8% and 4.4% compared to the original model in multi-factor and single-factor scenarios. Hence, the proposed method effectively enhances the prediction accuracy of high-speed railway bridge pier settlement, and the constructed multi-source data fusion framework, along with the model improvement strategy, provides technological and experiential references for relevant fields.

1. Introduction

As an important part of the modern comprehensive transportation system, the continuous expansion of High-Speed Railway (HSR) calls for higher requirements for the safe and efficient operation of infrastructure [1]. The High-Speed Railway Bridge Pier (HSR-BP) is the core supporting structure of high-speed railway lines, whose stability directly determines track geometry accuracy and train operation safety [2]. Pier settlement will not only lead to the aggravation of track irregularity but also cause structural stress concentration, fatigue damage to connecting components, and other problems, which seriously threaten the operational safety of high-speed railway. However, pier settlement results from the coupling of multiple factors, for instance, the geological conditions (such as land subsidence, groundwater change), environmental factors (temperature gradient, rainfall erosion), etc. [3,4]. It is difficult for a traditional single-factor linear prediction model to accurately describe its complex evolution law [5]. Therefore, by studying the prediction methods for pier settlement in high-speed railways that take multiple factors into account, and constructing a nonlinear coupled prediction model based on machine learning—one that integrates multi-source information such as ground measurement data, environmental sensor data, and remote-sensing image technology—it is possible to more accurately enhance the long-term prediction capability [6,7,8].
For one thing, as an important part of geological conditions, the settlement of high-speed rail piers is significantly affected by land subsidence. Traditional measurement methods such as RTK and total station have limitations, so radar interferometry technology (InSAR) has been widely studied due to its advantages such as the wide range, easy operation, and high sensitivity. Derived technologies such as PS-InSAR and DS-InSAR [9,10,11] have been derived and have secured numerous achievements in the realms of landslides, earthquakes, urban risk assessment, land reclamation, etc. [12,13,14]. Related explorations have also been made in traffic roads, groundwater, and other scenarios [15,16,17,18]. In railway monitoring, InSAR technology has been used to monitor settlement along high-speed railways, for instance, utilizing TerraSAR-X satellite data to build a spatiotemporal feature database of settlement rates to assist track anomaly detection, or combining MT-InSAR technology to reveal subgrade deformation laws [19,20]. For another thing, in the field of high-speed railway pier settlement monitoring, traditional methods rely on physical models or statistical experience, which makes it difficult to fully capture the nonlinear dynamic characteristics under complex geological conditions. However, in the specific subfield of pier settlement time series prediction, the existing algorithm system is still dominated by single prediction models and hybrid models. Single prediction models are represented by the hyperbolic method, three-point method, exponential curve method, grey theory, and neural network [21]. Their basis is mostly from physical models, statistics, or empirical formulas, which are suitable for scenarios with limited data volume or high stability. It is worth noting that existing work has improved traditional methods, such as solving parameters by using the robust weighted total least squares method to reduce outlier interference, thereby improving model accuracy [22]. The hybrid model combines multiple machine learning models to predict settlement, which has been applied in land subsidence prediction and landslide monitoring and identification [23,24]. In the research of high-speed railway settlement prediction, the method based on the Long Short-Term Memory (LSTM) model has shown significant progress: by combining the variational mode decomposition (VMD) and adaptive enhancement algorithm (AdaBoost) optimization model, or introducing the general progressive decomposition long-term prediction network (GPDLPnet), it effectively improves the long-term prediction accuracy for low-frequency complex settlement models [25,26]. There is also an exploration of combining the autoregressive model of robust weighted total least-squares autoregression (RWTLS-AR) with the adaptive dynamic cubic exponential smoothing model (ADCES) for prediction [27]. However, traditional methods still have limitations in the settlement prediction of high-speed railway piers: a single model struggles to accurately describe the nonlinear settlement law under complex conditions, whose adaptability is insufficient. Although the hybrid model has applications, its fusion strategy (such as weight allocation) relies on empirical design and can experience difficulties achieving dynamic optimization. What is more important is that neither of the two kinds of methods can effectively integrate spatiotemporal information and fully capture the spatiotemporal cooperative transmission mechanism of pier settlement.
While these traditional methods face limitations in capturing complex spatiotemporal mechanisms, the recent leap in GPU computing power has dramatically accelerated the training efficiency of deep learning models, whose powerful automatic feature extraction and nonlinear fitting capabilities are now fundamentally reshaping the technical paradigm of time series prediction. The long-sequence modeling architecture represented by Transformer dynamically captures the spatiotemporal correlations between multiple measurement points through the self-attention mechanism, effectively overcoming the limitations of single-point independent analysis [28]. Against this backdrop, multi-factor prediction algorithms have developed rapidly, giving rise to representative models such as Reformer and Informer [29,30]. Aiming at the problem that traditional methods struggle to effectively capture cross-variable dependencies in multivariate time series, iTransformer innovatively inverts dimensions, embedding time points as variable identifiers, and adopts attention mechanisms to enhance cross-variable correlation modeling [31]; Crossformer introduces a cross-dimensional dependency analysis mechanism, significantly improving the modeling capability for complex interactions and overcoming the shortcoming of traditional time series models which often ignore inter-variable relationships [32]. To address the inefficiency of the Transformer in long-sequence prediction caused by its quadratic complexity, the S-Mamba model integrates selective state space models with hardware-aware optimization, reducing computational complexity to near-linear levels while enabling efficient inference. Its unique architecture, combining bidirectional Mamba layers and feedforward networks, demonstrates significant performance improvements across 13 public datasets [33]. The Convolutional Mamba model, on the other hand, focuses on enhancing the ability to capture cross-channel dependencies and alleviating the overfitting problem. It utilizes an improved Mamba module fused with a multilayer perceptron that captures global data dependencies, effectively proving its advantages in modeling complex cross-channel dependencies and its mitigating effect on overfitting problems across seven real-world datasets [34]. However, the CMamba model still has obvious limitations: on one hand, its prediction head uses single-scale processing and has weak multi-scale feature fusion capability—it cannot adaptively fuse multi-scale features and loses details due to fixed pooling, and due to the lack of a dynamic weighting mechanism, it can only statically superimpose features of different temporal granularities, reducing prediction robustness; on the other hand, faced with the situation where high-speed railway bridge pier settlement is affected by the complex coupling of multiple factors, the conventional normalization method relied upon by CMamba cannot dynamically adapt to data distribution shifts, leading to cumulative amplification of prediction errors. These shortcomings jointly constrain the model’s generalization ability and reliability in complex engineering scenarios.
To solve the above problems, this paper firstly uses E-PS-InSAR technology to obtain the land subsidence data along the high-speed railway, then employs the improved cubic Hermite algorithm to interpolate data and combines the local groundwater, temperature, precipitation, and other data to construct a multi-source dataset of HSR-BP settlement. Finally, the Reversible Instance Normalization Multi-Scale Adaptive Resolution Stream CMamba (RMCMamba) model is proposed for predicting the settlement change of HSR-BPs.
The main contributions of this paper are as follows:
  • A machine learning framework for HSR-BP settlement prediction: Firstly, sub-centimeter-level monitoring accuracy of land subsidence along the high-speed railway is realized using E-PS-InSAR technology. Secondly, the improved cubic Hermite interpolation algorithm is utilized to solve the problem of missing time series data. Then, the geological and environmental parameters are integrated with pier settlement data, and a multi-source time series dataset is constructed. Finally, the RMCMamba model proposed in this paper realizes high-precision prediction of pier settlement.
  • Multi-Scale Adaptive Resolution Stream Head (MARSHead): Construct a three-branch parallel convolution architecture, unify the sequence length through the adaptive pooling layer, introduce learnable branch weight parameters to achieve dynamic weighting across time granularity, and finally perform timing alignment to complete feature dimensions unification.
  • RevIN-based distribution calibration enhancement mechanism: The reversible instance normalization module is used to integrate into the time series prediction framework and combined with the state space modeling capability of the CMamba encoder, which alleviates the distribution shift of multi-factor sequences. This module can significantly alleviate the distribution shift of multi-factor time series and improve the robustness of CMamba’s state space modeling.
The rest of the paper is organized as follows: Section 2 introduces the experimental methods, which recommend the overall technical route, the structure of RMCMamba, and the principle of each component in detail. Section 3 describes the experimental settings, which mainly introduces the experimental scheme, including dataset construction, comparison methods, quantification indexes, and training environment. Section 4 presents the experimental results to validate the improvement of the RMCMamba model. Section 5 discusses the ablation experiment to prove the effectiveness of the improvement to the MARSHead and RevIN modules. Section 6 provides the conclusion of the paper.

2. Methodology

The demand for high-precision prediction in HSR-BP settlement monitoring requires the construction of a “monitoring-enhancement-modeling” full-process prediction scheme, which is a method based on RMCMamba HSR-BP settlement prediction, which is implemented by the following four steps (as shown in Figure 1):
  • Land subsidence monitoring: This paper uses E-PS-InSAR (Enhanced PS-InSAR) technology to obtain high-quality land subsidence data along high-speed railways.
  • Data enhancement: The improved cubic Hermite interpolation method is used for timing sequence interpolation of the land subsidence and HSR-BP settlement. The traditional cubic Hermite interpolation method is an approximate curve interpolation method. In this paper, the cubic fitting polynomial is obtained by weighted least squares fitting, and the derivative is obtained by deriving the cubic fitting polynomial. The derivative replaces the original slope estimation method. The specific formula is:
    H ^ i ( t ) = i 1 i y i α i ( t ) + n i β i ( t )
    In the formula, α i ( t ) and β i ( t ) are interpolation basis functions, t 0 < < t i < < t n , y i is the interpolation node. n i are the new parameters obtained by using the least squares method.
  • Dataset establishment: The time series dataset is established by five kinds of data of HSR-BP settlement, land subsidence, groundwater, temperature, and precipitation.
  • HSR-BP settlement prediction: The RMCMamba model is used to complete the settlement prediction of HSR-BPs.

2.1. The Enhanced PS-InSAR Technology

To improve the density and quality of land subsidence monitoring results, this paper uses E-PS-InSAR technology to monitor land subsidence along high-speed railways. This technology combines Persistent Scatterer (PS) and Distributed Scatterer (DS) InSAR technology [9,10,11]. Currently, the Amplitude Dispersion Index (ADI) calculation is commonly used to complete the selection of persistent scatterers, and the maximum Principal Component Analysis (PCA) of the covariance matrix is used to complete the selection of distributed scatterers. The specific formula is as follows:
D   = σ a a ¯ C = n = 1 N λ n x n x n H
where D 0 , 1 , σ a , and a ¯ represent the amplitude standard deviation and mean value of the target ground object, respectively. The stronger the backscattering of the target ground object, the more stable it is in time series, and the persistent scatterers are selected on the basis of it. C is the covariance matrix of interference phase; λ n represents the n -th eigenvalue; x n and x n H represent the eigenvectors corresponding to the eigenvalues and the conjugate transposed eigenvectors, respectively, wherein the component with the largest eigenvalue is used as the amplitude and phase data vector for monitoring the distributed scatterer.
After finishing the scatterer selection, the linear and nonlinear settlement phases are gained by phase unwrapping, linear settlement calculation, and atmospheric effect calculation. Finally, the monitoring outcomes of land settlement around HSR-BPs are generated by geocoding.

2.2. CMamba Encoder

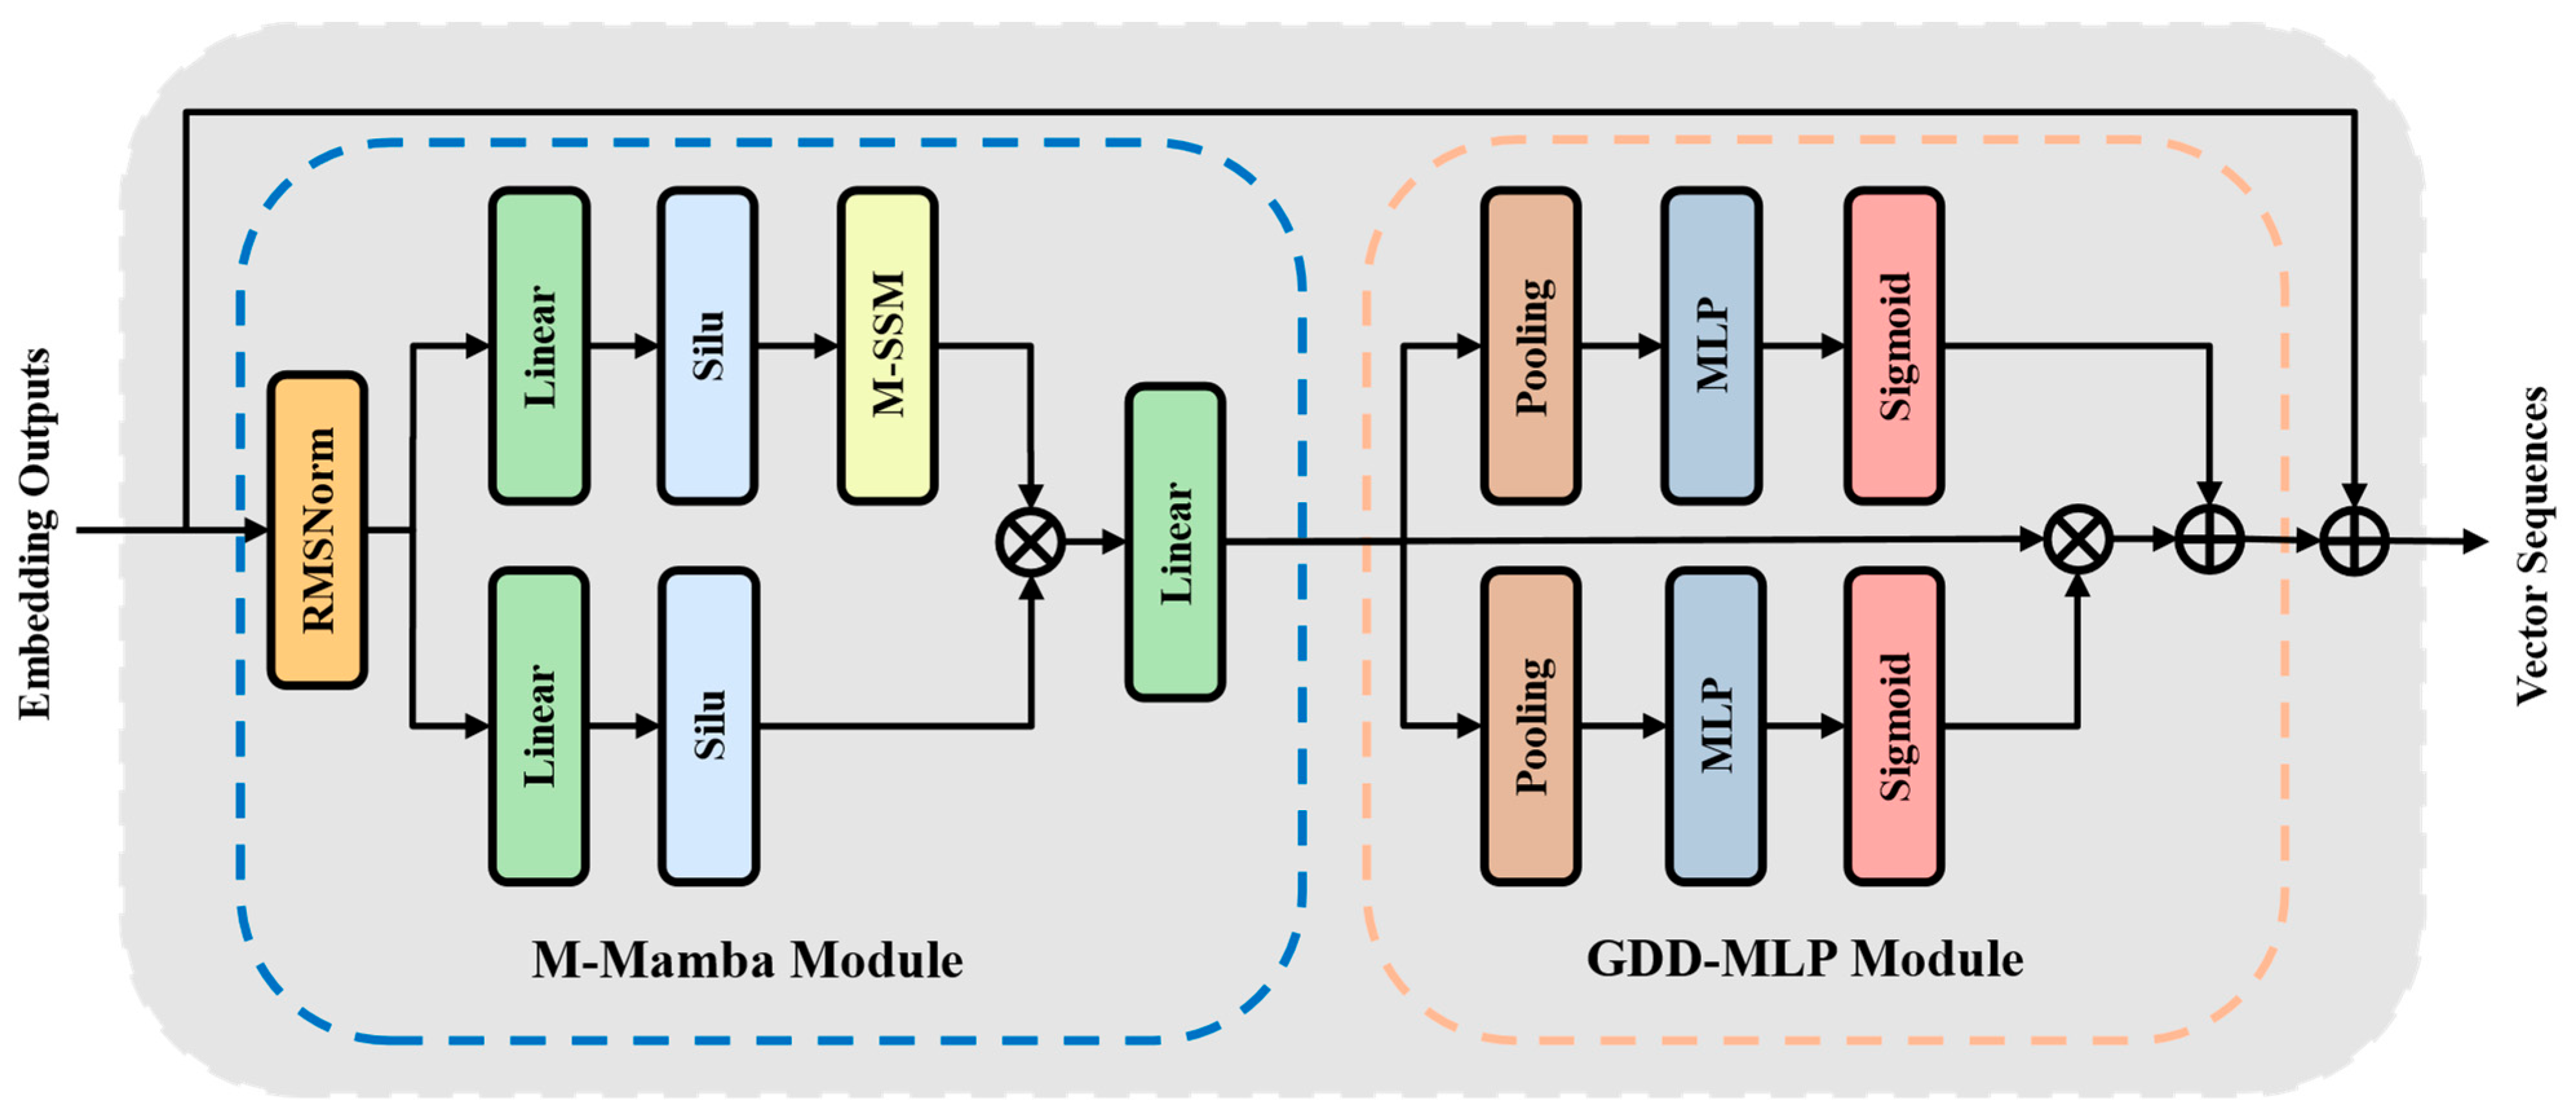
The CMamba encoder serves as the core module for time series modeling, comprising two main components: the M-Mamba module and the Gated Depthwise Dynamic Multi-Layer Perceptron (GDD-MLP). The structure integrates normalization, sequence modeling, optional feature enhancement, and residual connections, as shown in Figure 2.
First, Root Mean Square Normalization (RMSNorm) is adopted instead of LayerNorm to reduce computational cost while maintaining convergence. It eliminates mean centralization and scales inputs using learnable parameters. Second, the Mamba sequence modeler is built upon a structured state space model (S4). It incorporates a selective mechanism that dynamically generates parameters, enabling adaptive state transitions for long-sequence dependency modeling. Finally, the GDD-MLP enhances local feature extraction through average and max pooling, achieving multi-scale feature fusion. It employs dynamic channel calibration to retain feature distribution and suppress noise, while pooling reduces spatial dimensions for efficient integration into architectures like CNN or Transformer.
In summary, the CMamba encoder maintains Mamba’s efficiency while strengthening local feature extraction, making it suitable for complex multivariate time series prediction tasks.

2.3. The Proposed Multi-Scale Adaptive Resolution Stream Head

MARSHead is a time series prediction head module on the foundation of multi-scale feature fusion, as shown in Figure 3. Firstly, it first performs adaptive multi-scale processing and constructs parallel branches through three scale factors. Each branch includes an adaptive average pooling layer and a point convolution layer. The former dynamically compresses sequences of arbitrary length to the target window size to eliminate the information loss of fixed step size pooling; the latter completes channel dimension transformation. Secondly, the dynamic feature fusion mechanism is set up, supplemented with the learnable branch weight. The importance of each scale is dynamically optimized through back propagation, and multi-scale features are compressed into a single output. Lastly, the dimension alignment operation is completed. The dimension of the input tensor is reconstructed, and redundant dimension stacks are removed to finally restore the original variable results. A dropout layer is placed to prevent overfitting of the prediction head.
The overall core innovation of MARSHead is mainly reflected in the following aspects. The first is a multi-scale feature extractor, which builds parallel branches through three pooling scales, and each branch includes adaptive average pooling and point convolution. The adaptive pooling layer replaces the traditional fixed-step pooling operation, which can uniformly down-sample sequences of any length to the target window length, eliminating the information loss of fixed-step pooling, while the point convolution layer is set to complete channel dimension transformation. The second is adaptive weighted fusion, which introduces learnable branch weight parameters to generate the attention weight of each branch. Through back propagation, the importance of each scale is dynamically optimized, so that the model can dynamically adapt to different time granularity scenarios. Through cross-resolution fusion, multi-scale features are output by compressing into a single-point convolution. The third is the resolution alignment mechanism, which uses the permute and reshape function operations to unify feature dimensions, adopts the squeeze and stack functions to achieve cross-scale feature alignment, and finally completes cross-resolution fusion through convolutional layers.
In a comprehensive view, compared with the original flattened prediction head module, MARSHead realizes spatiotemporal feature mixing through the multi-branch convolution architecture. Each branch contains an independent nonlinear transformation (point convolution) to achieve feature decoupling. This module maintains computational efficiency through tensor operations, cooperating with Dropout regularization to improve the adaptability and expression ability of the prediction model.

2.4. Reversible Instance Normalization Module

RevIN, i.e., Reversible Instance Normalization, is a dynamic normalization module specially designed for time series applications [35]. Its implementation is through a two-stage process: normalization and anti-normalization. Firstly, the samples in the batch are counted, calculating the mean μ and standard deviation σ along the time dimension. Then the normalization process is carried out, and the calculation formula of the normalized output y is:
y = γ x μ σ + β
In the formula, γ and β are the learnable affine parameters that are initialized as tensors with all elements of 1 and all elements of 0, respectively. The parameter dimensions match the number of features, so that the model can dynamically adapt to the non-stationary characteristics of different time series. After completing the normalization work, the sequence is passed to the encoder, decoder, and other modules for processing. After that, the distribution of the original data is restored by an inverse transformation. The calculation formula of the output anti-normalization result x ^ is:
x ^ = ( y β ) γ σ + μ
This transformation ensures that the normalized data is restored to the original scaling and offset, maintaining consistency with the input space. In a comprehensive view, the introduction of γ and β enables the model to dynamically adapt to the statistical characteristics of input data in different time periods. Compared with traditional Z-Score normalization, it significantly improves the robustness and generalization capabilities in multi-factor timing tasks. To sum up, by introducing learnable parameters and modular design, RevIN can better solve the problem of distribution shift and integrate it into the model architecture to improve the overall prediction performance and generalization capability.

3. Experimental Design

3.1. Study Area and Data

The study area is located in Changde City, Hunan Province, China. Its climate belongs to the subtropical humid monsoon, with four distinct seasons, abundant precipitation, and the rainy season in summer. It has frequent flood disasters, complex landforms, abundant underground caves, and underground rivers. The adopted settlement data of the HSR-BP is the field monitoring data of the HSR-BPs of the Changde–Yiyang–Changsha section. It is crucial to clarify that the prediction target of this study is the absolute settlement of the piers, whose ground truth (labels) is derived from the periodic, precise leveling of the pier itself, strictly following the Observation and Evaluation Specification for Settlement Deformation of Railway Engineering [21]. This high-precision data serves as the benchmark for supervised model training and performance validation. The image for calculating the land subsidence is the SLC data of the Sentinel-1 satellite. Both the SLC data and the orbital data are gained from ESA. The groundwater data are acquired from the National Groundwater Monitoring Network of China Institute of Geo-Environment Monitoring (https://geocloud.cgs.gov.cn (accessed on 20 January 2024)), and the local historical temperature and precipitation data are obtained from 2345 Weather (https://tianqi.2345.com/wea_history/57662.htm (accessed on 13 April 2024)). This study utilizes a dataset comprising ten monitoring points, each containing time-series data for multiple factors. The overview of measuring points is displayed in Table 1. Because the completion time of each area of the high-speed railway bridge is different during the construction process, the number of periods and the start and end times of each multi-factor dataset are diverse. Specifically, the monitoring intervals across the datasets range from a minimum of 1 day to a maximum of 30 days. Furthermore, each monitoring point maintains considerable spacing from others, with distinct coordinate positions.

3.2. Experimental Settings

Firstly, the feasibility of land subsidence monitoring results is verified by statistical analysis and referring to local literature. Secondly, to demonstrate the predictive capability of RMCMamba, the experimental design is structured as follows. To comprehensively evaluate the model’s capability, the experimental design is divided into two scenarios: the multi-factor prediction and single-factor prediction. The former is to predict the HSR-BP settlement by integrating four factors: groundwater, land subsidence, temperature, and precipitation. The latter is only to predict the single factor of the HSR-BP settlement by autoregressive prediction. In the multi-factor prediction scenario, RMCMamba is compared with 9 deep learning models, including Transformer [28], Informer [29], Mamba [36], PatchTST [37], TimeXer [38], CMamba [29], iTransformer [31], S-Mamba [33], and WPMixer [39]. In the single-factor prediction scenario of bridge piers, in addition to comparing with deep learning models, it also needs to be compared with three traditional benchmarks: the Autoregressive Model, Grey Model and Back Propagation Neural Network. All deep learning models are implemented based on the PyTorch 2.5.1+ CUDA11.8 framework, while traditional methods run through MATLAB R2023a.
In the experiment, the improved cubic Hermite difference method is employed to deal with the problem of missing values, guaranteeing the time series equidistant data in training samples. The dataset was partitioned into training, validation, and test sets at a 7:1:2 ratio. The hardware configurations are the AMD R9 7900X processor and NVIDIA RTX 4090 24G graphics card. The prediction model parameter settings include an initial learning rate of 10−4, a training round (epoch) of 50, and a patience value for early stopping (patience) of 5. Finally, ablation experiments are performed to analyze the effectiveness of the single replacement component. The experiments strictly follow the standard implementation process of the comparison methods to ensure the consistency of parameter settings, and analyze the advantages of RMCMamba in the task of HSR-BP settlement prediction through multi-dimensional comparison.

3.3. Evaluation Metrics

To comprehensively quantify the prediction quality of each model, this paper selects three evaluation indicators for comparative analysis, namely, the mean absolute error (MAE), root mean square error (RMSE), and mean absolute percentage error (MAPE). MAE directly reflects the error between the predicted value and the actual value; RMSE is easily affected by predicted values with large bias and can be used to measure the stability of the model; MAPE considers the proportion between the error and the actual value, and can compare the prediction results at different scales. The specific calculation formula is as follows:
M A E = 1 n n i = 1 | y i y i ^ | R M S E = 1 n n i = 1 ( y i y ^ i ) 2 M A P E = 1 n n i = 1 y i y ^ i y i × 100 %
where n is the total data amount of the test; y i is the true value; y ^ i is the predicted value.

4. Experimental Results and Analysis

4.1. E-PS-InSAR Land Subsidence Monitoring Result

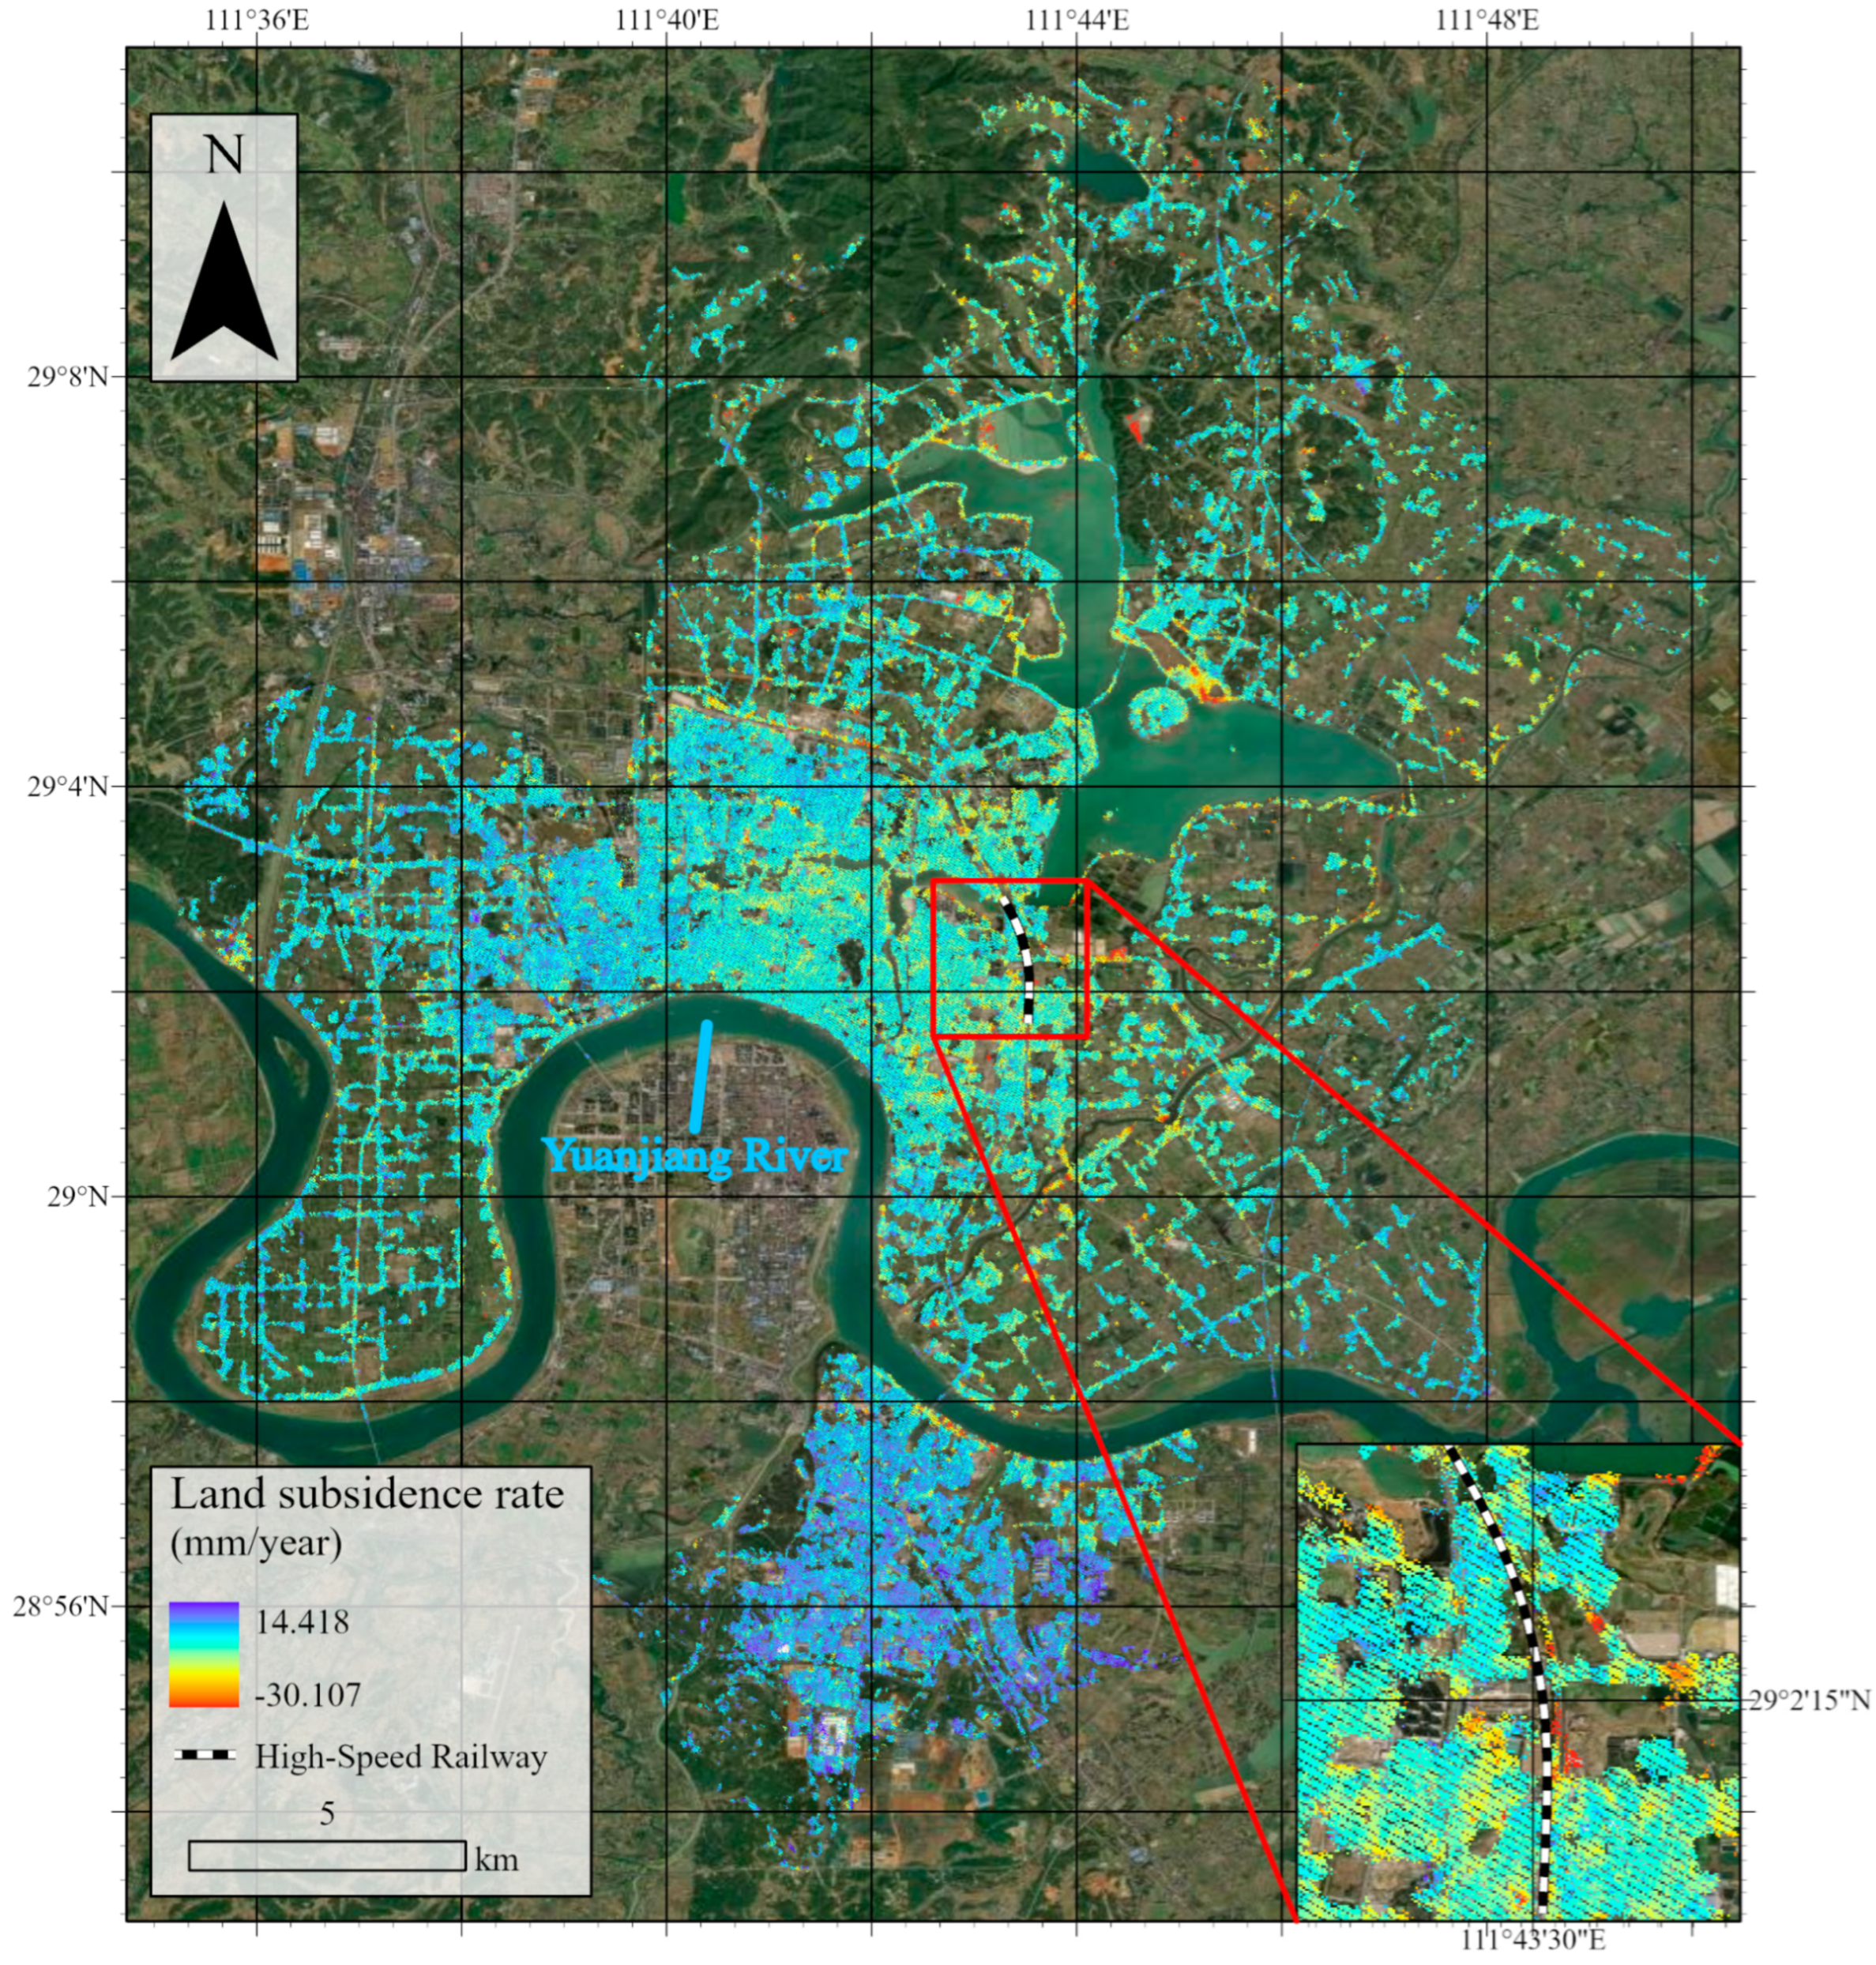
The monitoring results of land subsidence in the Wuling District of Changde City, China, are presented in Figure 4. It can be seen that the measuring points of land subsidence are mainly concentrated in dense building groups, roads, and other ground stability features. The qualitative results show a gentle subsidence in the north of the Yuanjiang River, and there is an uplift in the south of the Yuanjiang River. The statistical outcomes are displayed in Table 2. A total of 1,828,795 target scatterers is obtained, including 85,249 persistent scatterers and 1,743,546 distributed scatterers. The average settlement rate is −0.005 mm/year, the median is 0.056 mm/year, and the standard deviation is 1.113 mm/year. Overall, the statistics show a normal distribution, and the settlement rate is primarily distributed between −2.000 mm/year and 2.000 mm/year. Cross-validating with the results of subsidence areas in the literature [40,41] shows that the study area of the HSR-BPs is located in the Taiyangshan Fault Zone. The north of the Yuanjiang River in Wuling District is located between fault zones, with no significant crustal movement observed. The subsidence trends are consistent with each other. Additionally, the results were cross-validated with our own SBAS monitoring results. On the whole, it is considered that this land subsidence has a good monitoring result, which can be used as the land subsidence factor to construct a multi-factor HSR-BP settlement dataset.

4.2. Prediction Results and Analysis of HSR-BP Settlement

4.2.1. Statistical Results and Analysis of Multi-Factor HSR-BP Settlement

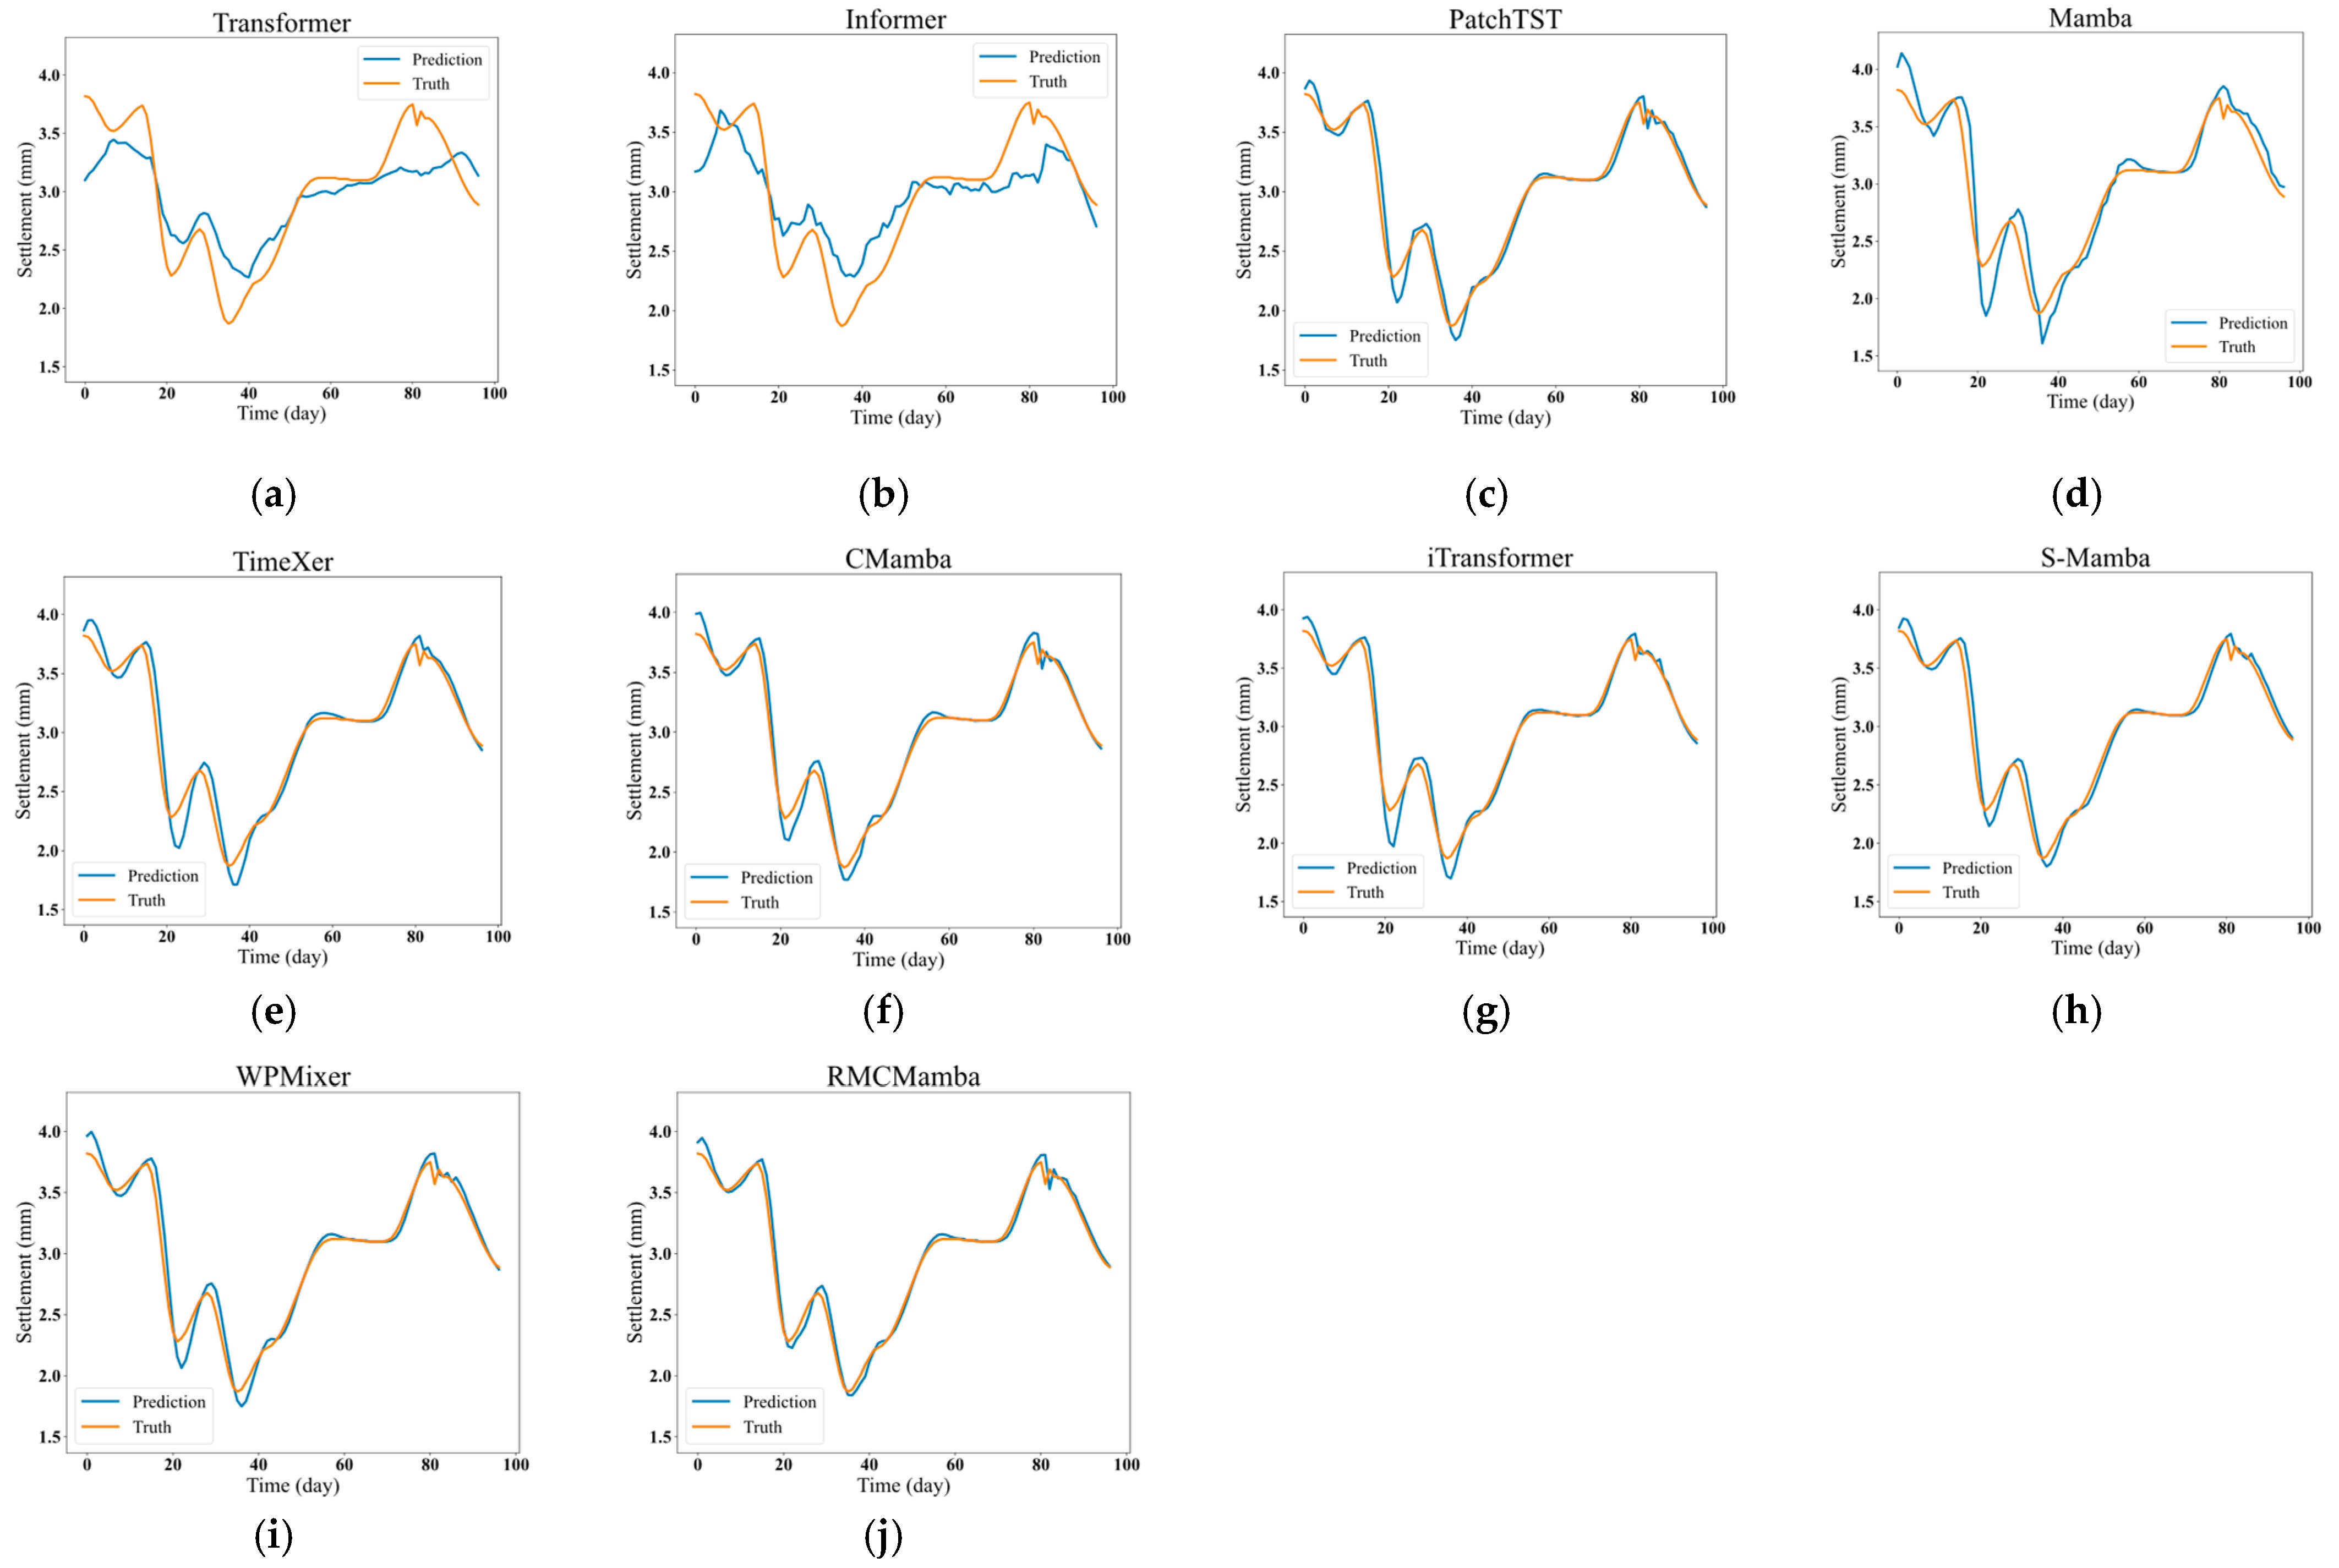
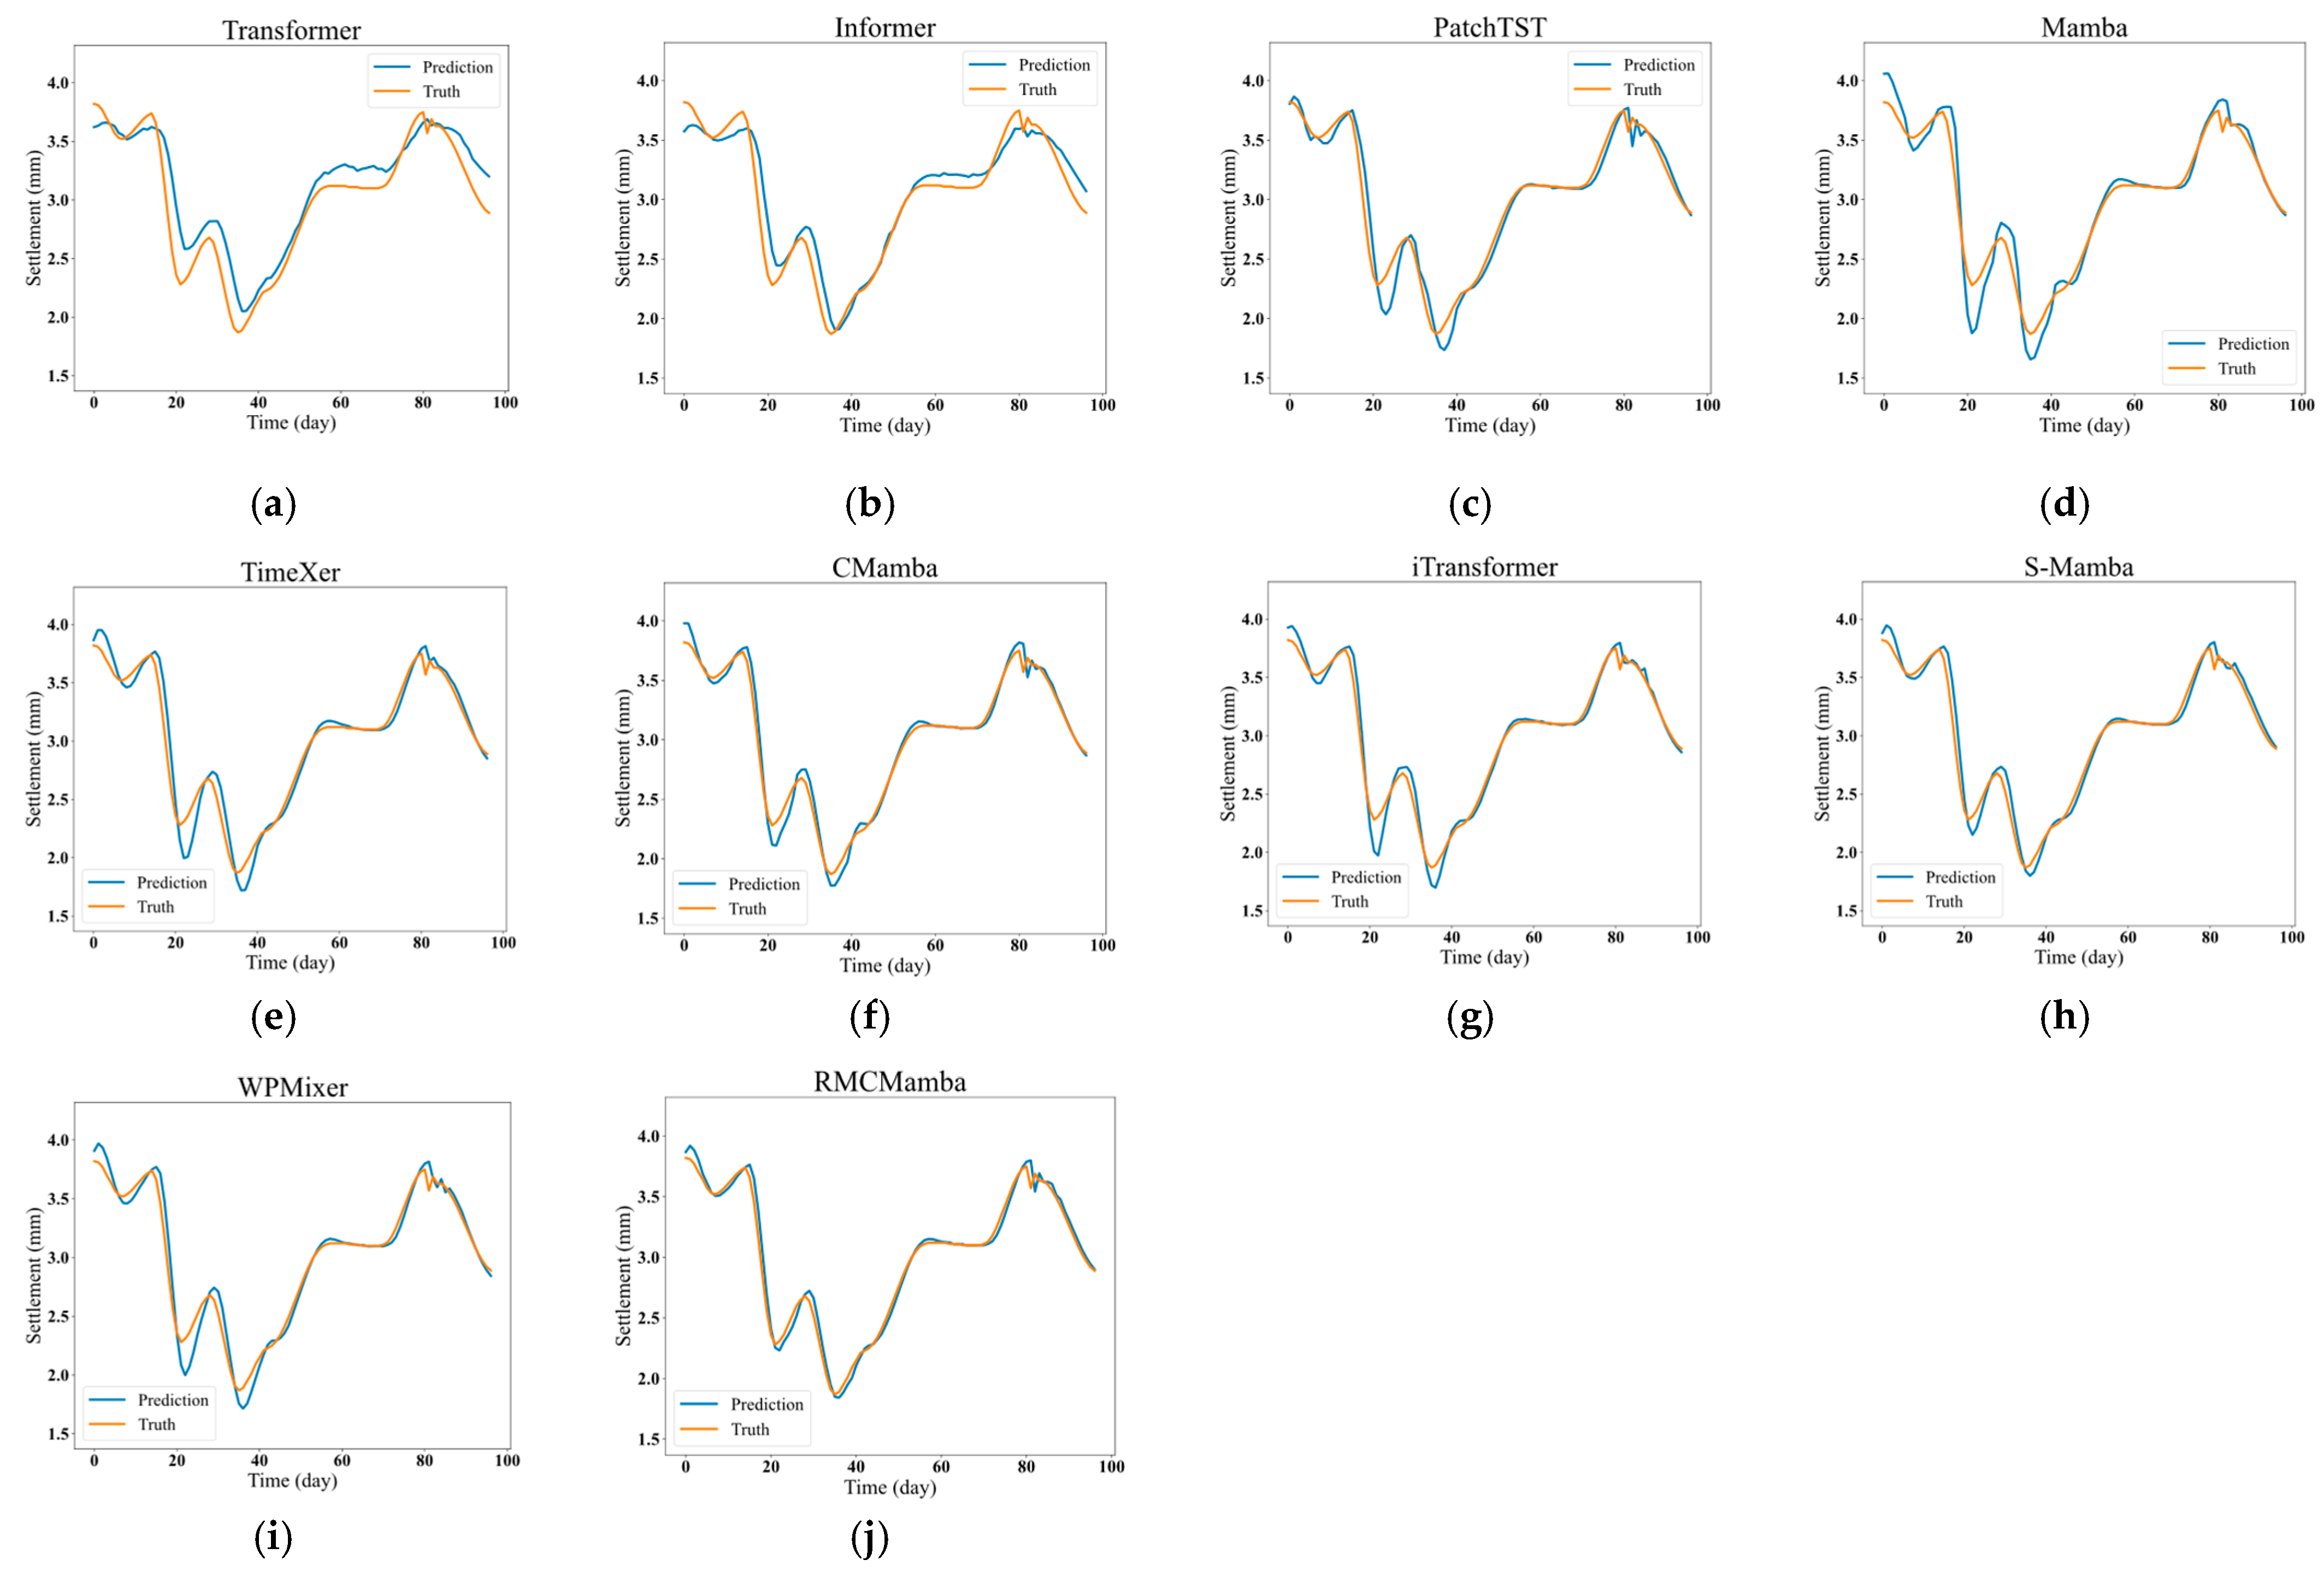
In this experimental study, an evaluation is conducted on the performance of diverse machine learning models for time series prediction under two scenarios: multi-factor prediction and single-factor prediction. Figure 5 presents the qualitative partial comparison results of the predicted curve with the actual curve in the multi-factor prediction scenario (blue represents the predicted value and orange represents the true value). It can be seen that the predicted results of Transformer and Informer have a significant difference from the actual value, while the predicted values of the other methods are not much different from the real value, among which the RMCMamba prediction curve proposed in this paper is the closest to the real curve. For making a more accurate analysis, quantitative indicators are chosen to further evaluate the model’s performance.
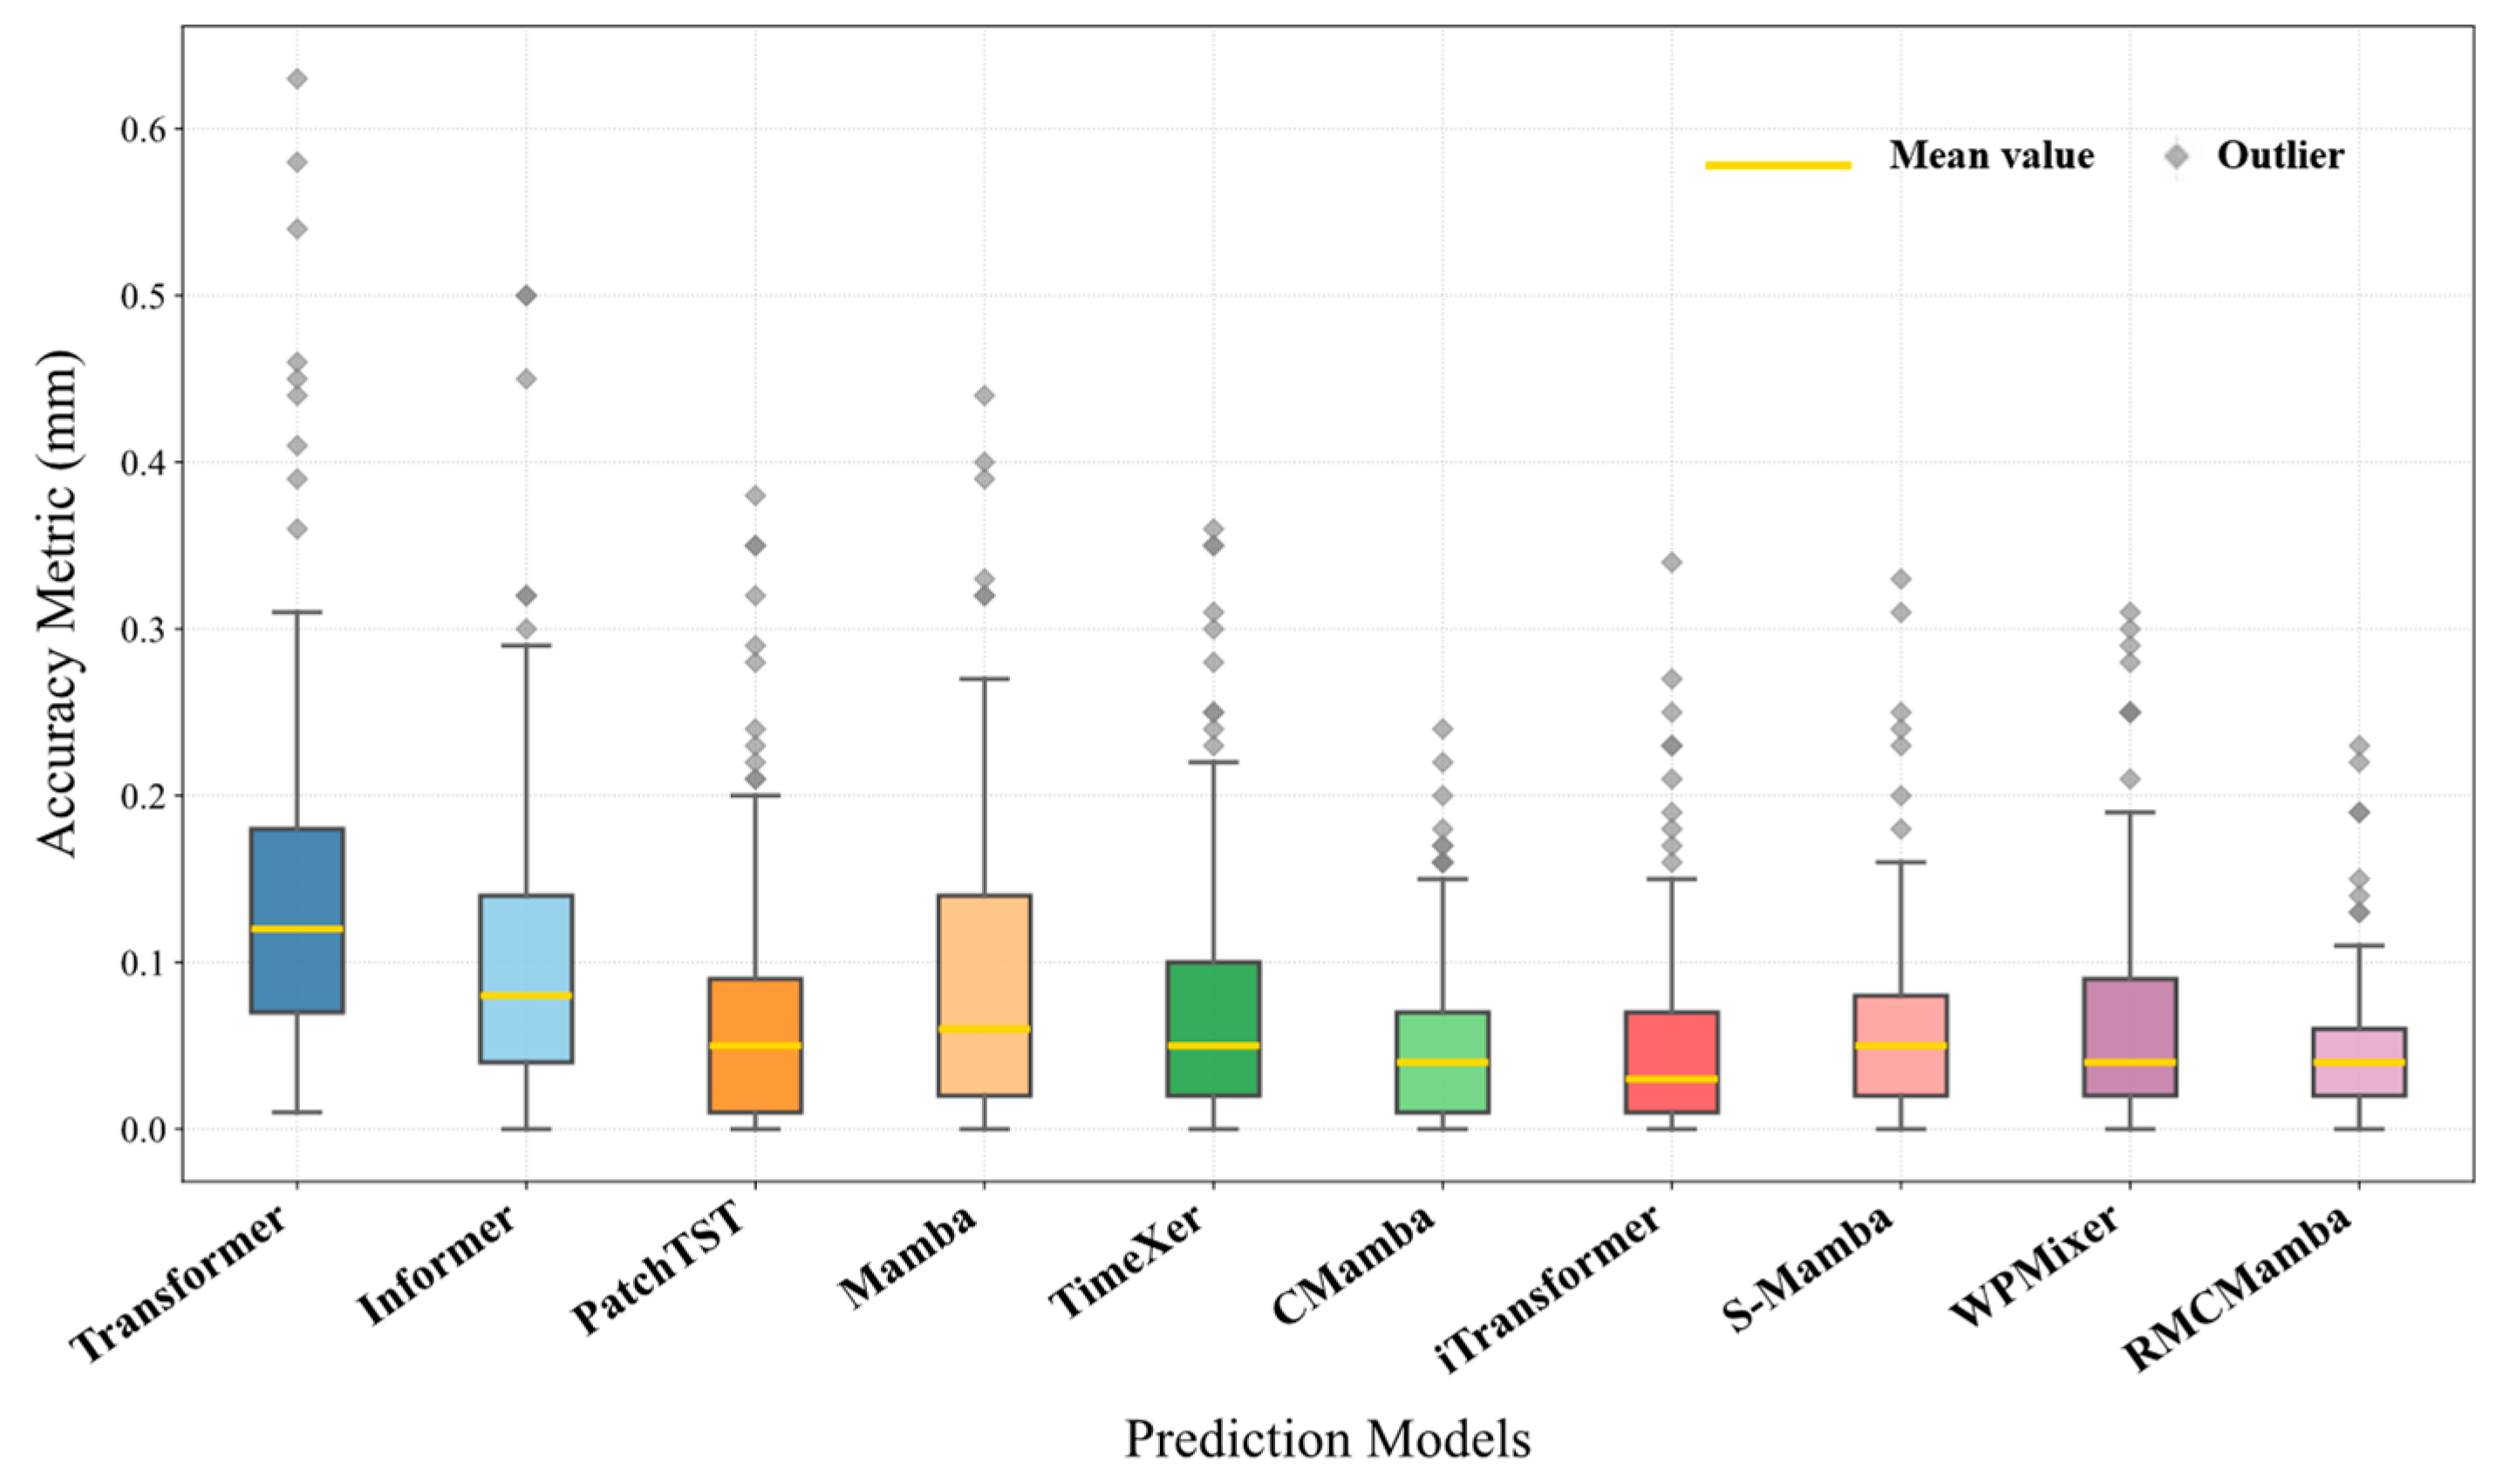
Figure 6 is the multi-factor prediction error box plot of each method. Compared with other methods, the prediction residual data distribution of RMCMamba is closest to scale 0, indicating that it has the highest accuracy. Table 3 shows the performance comparison quantitative results of different time series prediction models under multiple factors. The bold items represent the optimal indicator, and the underlined items are suboptimal. The results reveal that in the single-factor task scenario with multi-factor prediction, the Mamba-like model possesses significant advantages, while the traditional Transformer architecture has obvious limitations. Specifically, the Transformer benchmark model performs the weakest. The complexity of its attention mechanism leads to insufficient long sequence modeling capability. The improved Informer is only slightly improved, indicating that location coding optimization fails to fundamentally solve the computational efficiency bottleneck. In contrast, the Mamba architecture achieves breakthroughs through the state space model: although the Mamba model is better than the Transformer, it is not as good as the advanced time series model. CMamba and RMCMamba, which are designed based on this model, surpass Transformer variants such as TimeXer and iTransformer, respectively. Among them, the three indicators of RMCMamba all reach the current optimum, which verifies the efficiency of the selective scanning mechanism in extracting long-range dependencies. The linear complexity of this model significantly improves its modeling ability, reducing MAE by 89.9% compared with Transformer and 47.9% compared with Mamba. Compared with the suboptimal model PatchTST, the three indicators reduce by 4.7%, 2.5%, and 7.5%, respectively.

4.2.2. Statistical Results and Analysis of HSR-BP Single-Factor Prediction

The qualitative outcomes of single-factor prediction results are shown in Figure 7. There still exists an obvious gap between the monitored results of Transformer and Informer and the actual results. But compared with the gap between the predicted values and the real values of multi-factor prediction results in Figure 5, a significant decreasing trend emerges. The differences between other methods are not that obvious. The RMCMamba prediction curve is still the closest to the real curve, so further quantitative evaluation of the model is warranted.
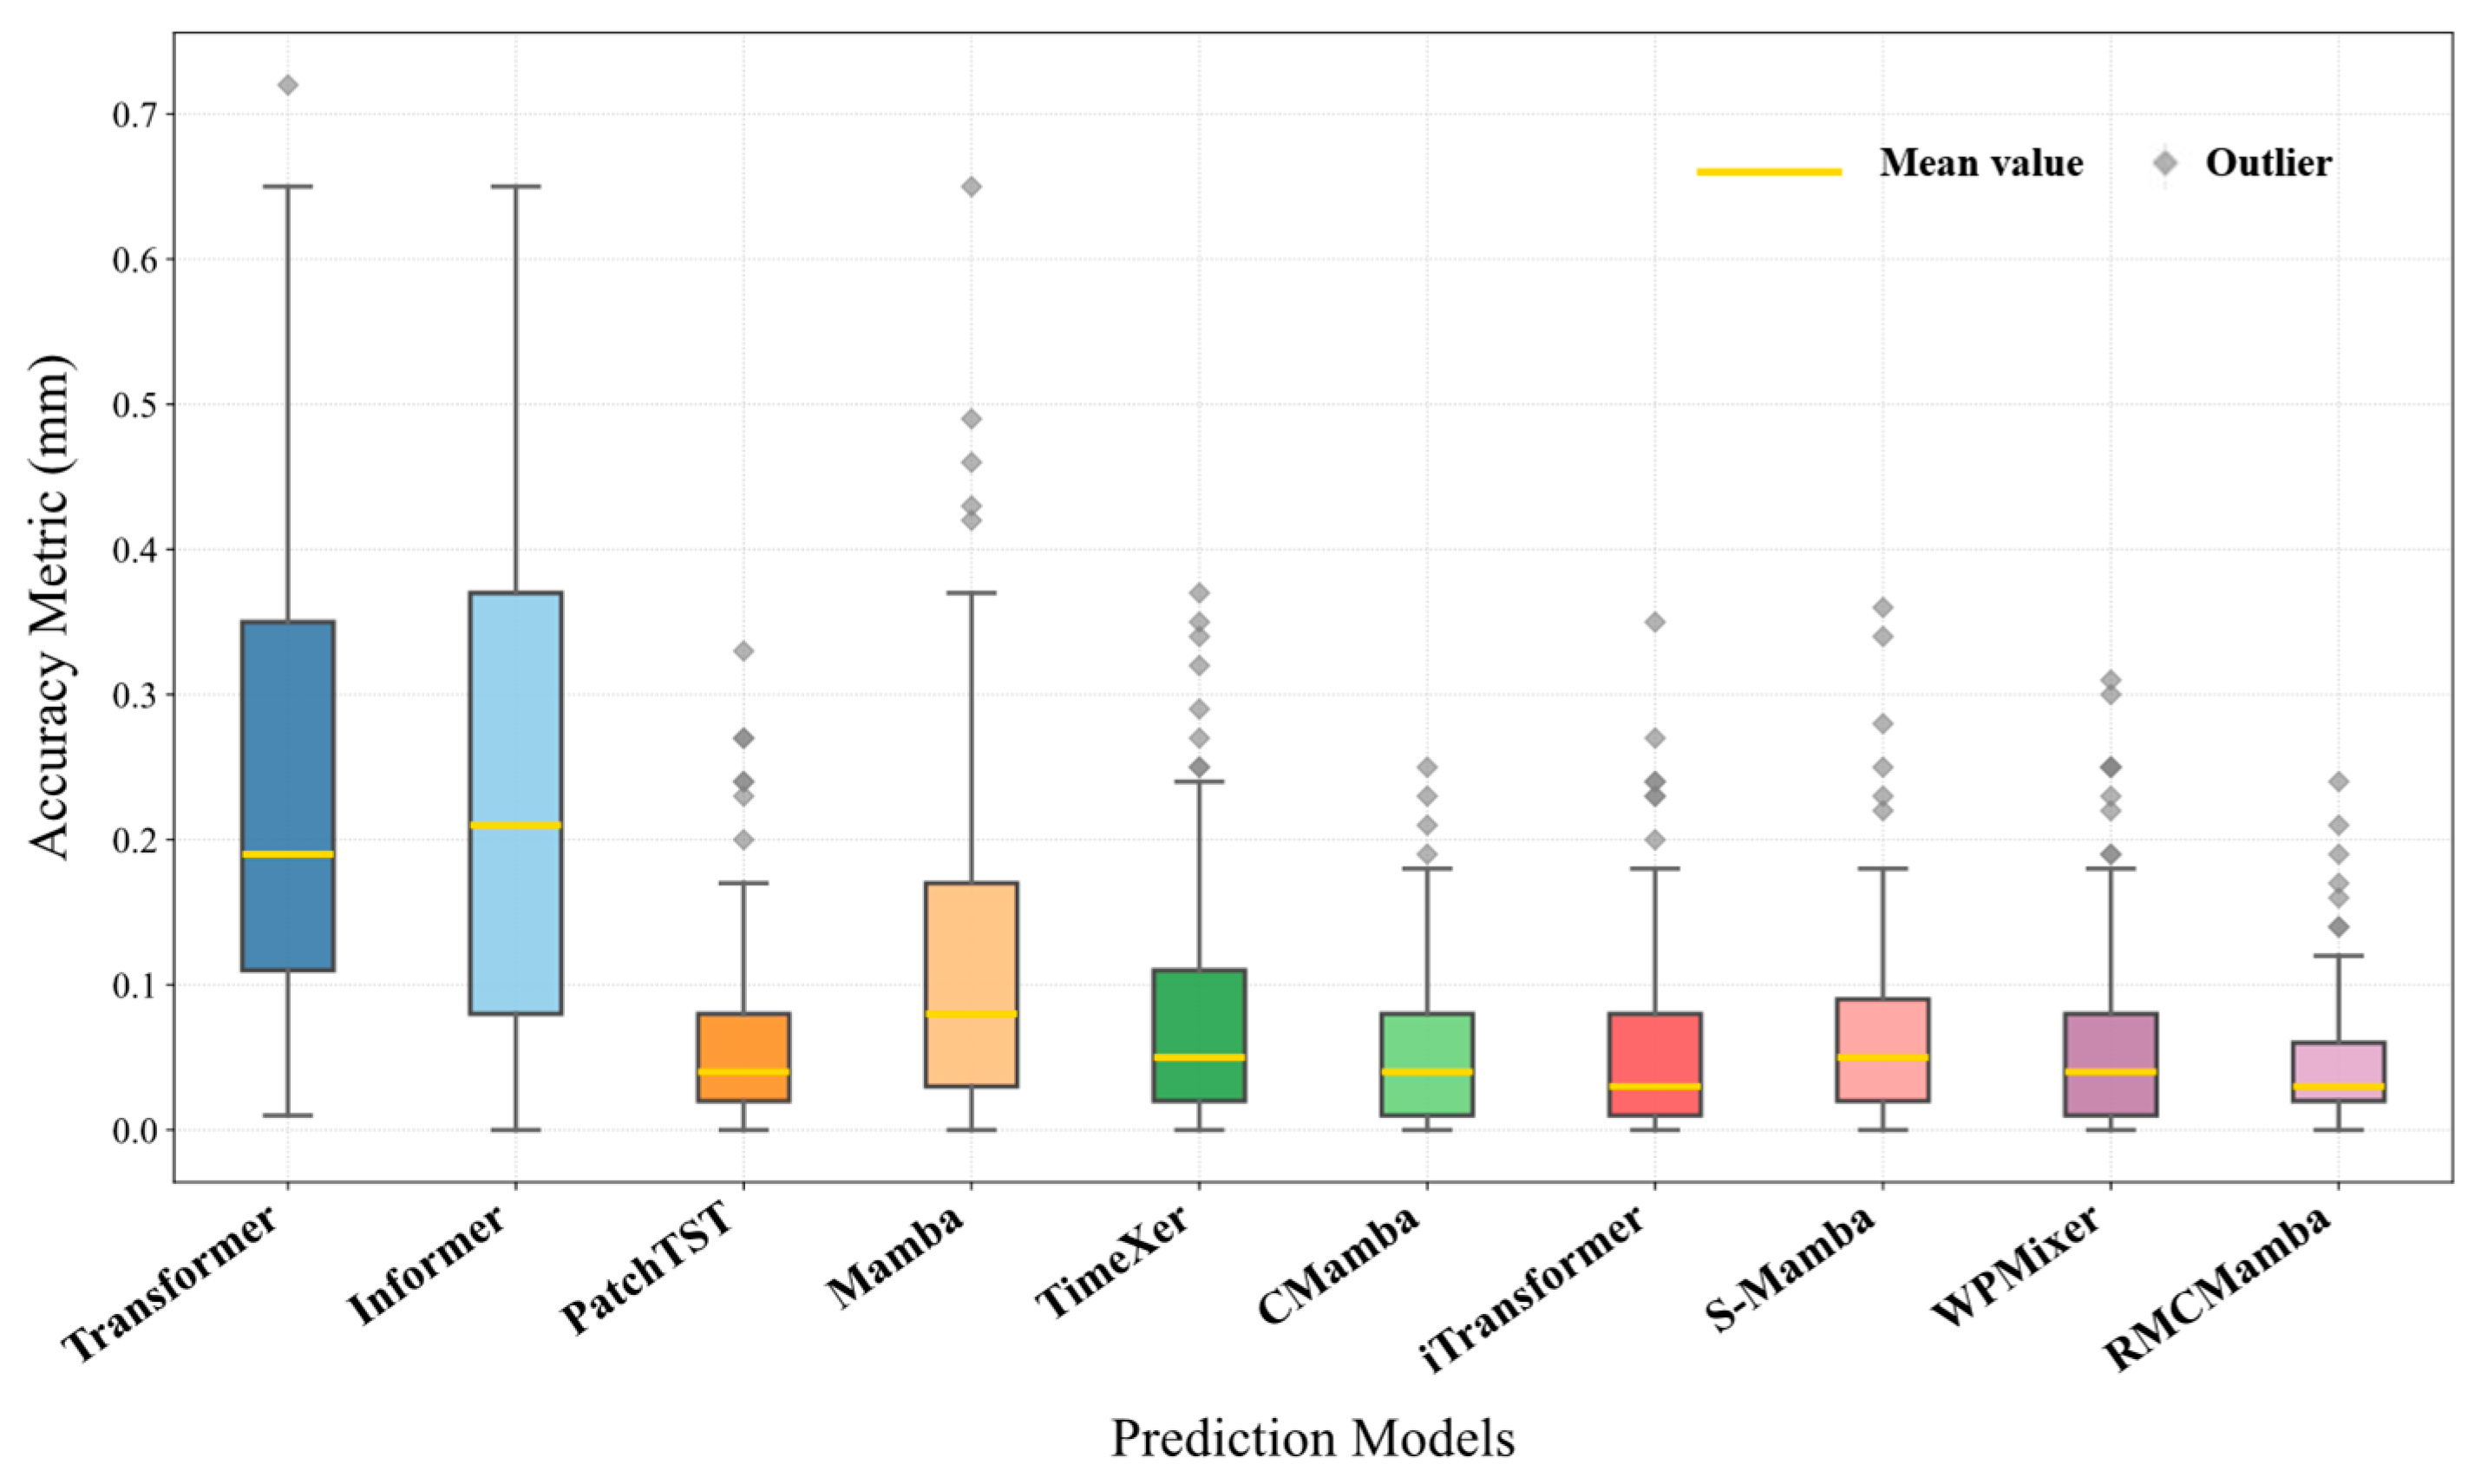
From the box plot of Figure 8, it can be more intuitively understood that early models such as Transformer and Informer perform significantly better in the single-factor prediction task than in the multi-factor prediction task. This demonstrates that their architecture (such as the standard attention mechanism) experiences difficulties effectively capturing and utilizing the complex nonlinear relationship among multiple factors. The noise or invalid correlation introduced by multi-factor input interferes with the prediction, resulting in a further decline in performance compared with the single-factor scenario. At the same time, the prediction residual distribution of the proposed RMCMamba is overall closer to zero compared with other models, indicating ideal performance.
Table 4 displays the performance comparison quantitative results of different time series prediction models under a single factor. The bold items represent the optimal index, and the underlined items are suboptimal. In the single-factor prediction task, the performance of various models shows obvious gradient differences. Firstly, the three traditional methods of the Autoregressive Model, Grey Model, and Back Propagation have poor prediction accuracy under this data. Compared with the machine learning method, the errors are not of the same magnitude, which proves that traditional statistical methods experience difficulties capturing the complex time series information feature of HSR-BPs. Secondly, the improvement of the Transformer and its variant models is limited. Due to the efficiency bottleneck of the attention mechanism, the errors of the Transformer and Informer are still significant. Improved algorithms, such as TimeXer and iTransformer, have improved but are still inferior to the Mamba architecture. Lastly, the Mamba-like model presents algorithm advantages due to the linear complexity of the state space model. The Mamba noumenon has surpassed most Transformer algorithms. Based on it, the improved CMamba and S-Mamba further boost their advantages. The proposed RMCMamba achieves the best performance across all three metrics among the algorithms, with reductions of 4.4%, 4.3%, and 11.0% in MAE, RMSE, and MAPE, respectively, compared to the suboptimal model CMamba.

4.2.3. Comparative Analysis of the Performance of Multi-Factor and Single-Factor HSR-BP Prediction

Comparing the quantitative results of multi-factor and single-factor predictions (Table 1 and Table 2), in an overall view, multi-factor prediction models hold better performance. This is mainly reflected in two aspects: first, at the optimal model level, in multi-factor tasks, RMCMamba’s core indicators are superior to its performance in single-factor tasks; and second, this advantage is universal. Observing the suboptimal model, it can be seen that compared with the single-factor prediction scenario, the MAE values of iTransformer and the suboptimal model PatchTST increase by 2.7% and 18.8% in the multi-factor prediction scenario. This confirms that the introduction of multi-source heterogeneous information (multiple factors) can provide richer context and correlation clues for the model, with effective capture of a complex coupling mechanism that affects the prediction target (such as settlement), thus obtaining more accurate and stable results than single-factor prediction. Furthermore, the performance of early models such as Transformer and Informer in the multi-factor prediction task is significantly inferior to their performance in the single-factor prediction task. This indicates that their architectures (such as the standard attention mechanism) struggle to effectively capture and utilize the complex nonlinear relationships among multiple factors. The noise or spurious correlations introduced by multi-factor input interfere with prediction, leading to a further decline in performance compared to the single-factor prediction.
As known from the experimental results, RMCMamba possesses obvious superiorities in both multi-factor and single-factor prediction tasks, whose three core indicators are comprehensively ahead of those of similar advanced models. In the multi-factor scenario, compared with the suboptimal model PatchTST, RMCMamba’s MAE, RMSE, and MAPE increased by 4.8%, 2.5%, and 7.5%, respectively. Through state space architecture optimization and dynamic weight allocation mechanism, this model not only breaks through the linear limitations of traditional models but also surpasses the recently proposed new models, such as S-Mamba and WPMixer. Its index stability in dual scenariosverifies the universality of the methodology, providing innovative solutions for high-precision time series prediction tasks such as high-speed railway project settlement monitoring.

5. Discussion

To confirm the effectiveness of this model in the two improvements of normalization and prediction module, and the improvement of RMCMamba’s prediction quality in two scenarios, this paper carries out ablation experiments. The specific design is shown in Figure 9. Variant 1 is the original model, whose normalization module is Z-Score and prediction module is the Flatten Head module. Compared with Variant 1, Variant 2 and Variant 3 separately replace the prediction module MARSHead and the normalization module RevIN. In contrast to Variant 1, Variant 4 replaces the normalization module RevIN and the prediction module MARSHead, i.e., the RMCMamba.
The results of ablation experiments are displayed in Table 5. The effects of each component of the improved model on the prediction performance show significant differences. Variant 4 (the complete improved model) reaches optimal values in the three indicators of MAE, RMSE, and MAPE under the multi-factor scenario, whose achieved performance improvements of 5.8%, 6.5%, and 7.5%, respectively, compared to Variant 1. Under the single-factor prediction scenarioof HSR-BPs, the three indicators also reach the optimal value. The performance is respectively improved by 4.4%, 4.3%, and 11.0% compared with Variant 1. In the single-component replacement variant, the performance improvement achieved by replacing the prediction head (Variant 2) was significantly greater than that achieved by replacing the normalization module (Variant 3). The MAE value decreased by 1.5% and 1.6% in the two scenariosfor Variant 2 (compared to Variant 1), which indicates that the multi-scale feature fusion mechanism plays a decisive role in time series modeling. As for the latter normalization improvement, although the single-component replacement Variant 3 even experiences negative optimization (the MAE result of the pier single-factor prediction scenariosdecreases by 12.3%), Variant 4 achieved reductions in MAE of 5.8% and 4.4% in the two types of tasks, greatly exceeding the improvement achieved by Variant 2. It shows that the normalization module (RevIN) prominently boosts the model’s adaptability to non-stationary sequences through the collaboration with the prediction head (especially multi-step prediction scenarioswith violent fluctuations). Finally, in both prediction scenarios, Variant 4 achieves higher accuracy for multi-factor prediction compared to single-factor prediction, while the benchmark model, Variant 1, shows the opposite result, indicating that these improvements are more effective in the multi-factor prediction scenario. To sum up, MARSHead’s multi-resolution analysis and RevIN’s distribution calibration have complementary advantages, with more obvious improved prediction accuracy in multi-factor scenarios.
This experiment reveals the deep synergistic mechanism between the two improvements. MARSHead effectively captures local and global temporal patterns through multi-scale feature fusion, while RevIN mitigates distribution shift through reversible normalization. These two components address the challenges of time series prediction from the perspectives of feature extraction and data distribution, respectively. Furthermore, the negative optimization observed in Variant 3 suggests that RevIN’s effectiveness depends on the structure of the prediction head; its distribution calibration function needs to be combined with multi-scale analysis capabilities to fully realize its potential.

6. Conclusions

This study utilized E-PS-InSAR technology to acquire ground settlement data and integrated it with high-speed railway bridge pier (HSR-BP) deformation data through spatial interpolation using the cubic improved Hermite method. The processed dataset was further combined with multi-source environmental parameters including regional groundwater levels, temperature, and precipitation to establish a comprehensive dataset for HSR-BP settlement prediction. An RMCMamba model integrating RevIN normalization and MARSHead prediction head was proposed, systematically validating the applicability of deep learning in high-speed railway infrastructure settlement prediction. Experimental results demonstrate that in the multi-factor high-speed railway bridge pier prediction task, the RMCMamba model achieved MAE, RMSE, and MAPE values of 0.04918 mm, 0.07718 mm, and 5.022%, respectively, representing improvements of 4.8%, 2.5%, and 7.5% over the suboptimal model PatchTST. This verifies the analytical capability of multi-source data coupling for complex nonlinear settlement mechanisms. In the single-factor prediction task, RMCMamba maintained optimal performance with MAE (0.04945 mm), RMSE (0.07796 mm), and MAPE (5.015%), reducing errors by an order of magnitude compared to traditional time series models (such as the Autoregressive Model), confirming the universal advantages of its state space architecture in long-sequence dependency extraction. Ablation experiments further prove that the collaborative design of RevIN normalization and the MARSHead prediction head effectively enhances the model’s adaptability in non-stationary sequence modeling. The complete RMCMamba model improved MAE, RMSE, and MAPE by 5.8%, 6.5%, and 7.5%, respectively, compared to the benchmark Variant 1 in multi-factor scenarios. The multi-resolution prediction head contributed a precision improvement of 1.5–1.6%, while the combined effect of RevIN normalization and the prediction head enabled the model to achieve a 5.8% increase in mean square error reduction in the experimental scenarios, confirming the complementarity between distribution calibration and feature fusion mechanisms.
The multi-source data fusion framework and model improvement strategy developed in this study provide a high-precision technical solution. In practical applications, this solution can assist in early warning of settlement trends and support differentiated maintenance decision-making, offering a data-driven scientific basis for reducing infrastructure maintenance costs. Future research will focus on exploring dynamic modeling of multi-factor coupling relationships, and, by incorporating multi-source geophysical monitoring data and advanced artificial intelligence models, extend the model’s predictive capability to sudden deformation events such as earthquakes.

Author Contributions

Conceptualization, J.L. and X.G.; methodology, J.L. and X.G.; software, J.L.; validation, Q.L., Z.C. and T.L.; formal analysis, J.L.; investigation, J.L. and X.G.; supervision, X.G.; writing—original draft preparation, J.L. and X.G.; writing—review and editing, T.L., R.Z. and W.M. All authors have read and agreed to the published version of the manuscript.

Funding

This research was funded by the National Natural Science Foundation of China (Grant No. 42101457), the Jiangxi Provincial Natural Science Foundation (Grant No. 20252BAC240247), and the Funding of National Key Laboratory of Uranium Resources Exploration-Mining and Nuclear Remote Sensing (Grant No. 2025QZ-YZZ-08).

Data Availability Statement

The source code and datasets generated and analyzed during this study are available in the GitHub repository: https://github.com/RSIDEA-ECUT/RMCMamba (accessed on 10 August 2025). The experiments were performed using the following software versions: ENVI 5.6, ArcGIS Pro 2023, PyCharm 2023.1, and Python 3.10.11.

Acknowledgments

The authors gratefully acknowledge the China Geological Environmental Monitoring Institute for providing access to the National Groundwater Monitoring Network data and the European Space Agency (ESA) for free access to Sentinel-1 satellite data used in this study.

Conflicts of Interest

The authors declare no conflicts of interest. The funders had no role in the design of the study; in the collection, analyses, or interpretation of data; in the writing of the manuscript; or in the decision to publish the results.

References

  1. Xu, X.; Chen, X.; Hu, H.; Zhou, X.; Cheng, M.; Sun, L.; Li, X. Energy Dissipation and Seismic Response Reduction System for High-Speed Railway Bridges Based on Multiple Performance Requirements. Eng. Struct. 2024, 307, 117919. [Google Scholar] [CrossRef]
  2. Chen, Z.; Fang, H. Influence of Pier Settlement on Contact Behavior between CRTS II Track and Bridge in High-Speed Railways. Eng. Struct. 2021, 235, 112007. [Google Scholar] [CrossRef]
  3. He, Y.; Li, Y.; Xu, L. An Integrated Multisource and Multiscale Monitoring Technique for Assessing the Health Status of High-Speed Railway Subgrade. Remote Sens. 2024, 16, 1972. [Google Scholar] [CrossRef]
  4. Wei, B.; Zheng, X.; Jiang, L.; Lai, Z.; Zhang, R.; Chen, J.; Yang, Z. Seismic response prediction and fragility assessment of high-speed railway bridges using machine learning technology. Structures 2024, 66, 106845. [Google Scholar] [CrossRef]
  5. Yao, J.; Lan, H.; Li, L.; Cao, Y.; Wu, Y.; Zhang, Y.; Zhou, C. Characteristics of a Rapid Landsliding Area along Jinsha River Revealed by Multi-Temporal Remote Sensing and Its Risks to Sichuan-Tibet Railway. Landslides 2022, 19, 703–718. [Google Scholar] [CrossRef]
  6. Chen, B.; Gong, H.; Chen, Y.; Lei, K.; Zhou, C.; Si, Y.; Li, X.; Pan, Y.; Gao, M. Investigating Land Subsidence and Its Causes along Beijing High-Speed Railway Using Multi-Platform InSAR and a Maximum Entropy Model. Int. J. Appl. Earth Obs. Geoinf. 2021, 96, 102284. [Google Scholar] [CrossRef]
  7. Gong, X.; Li, Z. Robust Weighted Total Least Squares Based on IGG Weighting Function. Acta Geod. Cartogr. Sin. 2014, 43, 888–894. [Google Scholar] [CrossRef]
  8. Zhao, H.; Wei, B.; Zhang, P.; Guo, P.; Shao, Z.; Xu, S.; Jiang, L.; Hu, H.; Zeng, Y.; Xiang, P. Safety analysis of high-speed trains on bridges under earthquakes using a LSTM-RNN-based surrogate model. Comput. Struct. 2024, 294, 107274. [Google Scholar] [CrossRef]
  9. Ferretti, A.; Prati, C.; Rocca, F. Permanent Scatterers in SAR Interferometry. IEEE Trans. Geosci. Remote Sens. 2001, 39, 8–20. [Google Scholar] [CrossRef]
  10. Ferretti, A.; Fumagalli, A.; Novali, F.; Prati, C.; Rocca, F.; Rucci, A. A New Algorithm for Processing Interferometric Data-Stacks: SqueeSAR. IEEE Trans. Geosci. Remote Sens. 2011, 49, 3460–3470. [Google Scholar] [CrossRef]
  11. Dănişor, C.; Pauciullo, A.; Reale, D.; Fornaro, G. Detection of Distributed Scatterers in Multitemporal SAR Interferometry: A Comparison Between CAESAR and SqueeSAR Detectors. IEEE Trans. Geosci. Remote Sens. 2023, 61, 5220415. [Google Scholar] [CrossRef]
  12. Zhou, C.; Cao, Y.; Gan, L.; Wang, Y.; Motagh, M.; Roessner, S.; Hu, X.; Yin, K. A Novel Framework for Landslide Displacement Prediction Using MT-InSAR and Machine Learning Techniques. Eng. Geol. 2024, 334, 107497. [Google Scholar] [CrossRef]
  13. Li, Y.; Zuo, X.; Yang, F.; Bu, J.; Wu, W.; Liu, X. Effectiveness Evaluation of DS-InSAR Method Fused PS Points in Surface Deformation Monitoring: A Case Study of Hongta District, Yuxi City, China. Geomat. Nat. Hazards Risk 2023, 14, 2176011. [Google Scholar] [CrossRef]
  14. Liu, X.; Zhang, Y.; Shan, X.; Wang, Z.; Gong, W.; Zhang, G. Deep Learning for Automatic Detection of Volcanic and Earthquake-Related InSAR Deformation. Remote Sens. 2025, 17, 686. [Google Scholar] [CrossRef]
  15. Cheng, Y.; Pang, H.; Li, Y.; Fan, L.; Wei, S.; Yuan, Z.; Fang, Y. Applications and Advancements of Spaceborne InSAR in Landslide Monitoring and Susceptibility Mapping: A Systematic Review. Remote Sens. 2025, 17, 999. [Google Scholar] [CrossRef]
  16. Du, Y.-N.; Feng, D.-C.; Wu, G. InSAR-Based Rapid Damage Assessment of Urban Building Portfolios Following the 2023 Turkey Earthquake. Int. J. Disaster Risk Reduct. 2024, 103, 104317. [Google Scholar] [CrossRef]
  17. Hu, J.; Motagh, M.; Guo, J.; Haghighi, M.H.; Li, T.; Qin, F.; Wu, W. Inferring Subsidence Characteristics in Wuhan (China) through Multitemporal InSAR and Hydrogeological Analysis. Eng. Geol. 2022, 297, 106530. [Google Scholar] [CrossRef]
  18. Zhang, B.; Liao, X.; Zhang, J.; Xiong, S.; Wang, C.; Wu, S.; Zhu, C.; Zhu, J.; Qin, X.; Li, Q. Megalopolitan-Scale Ground Deformation along Metro Lines in the Guangdong-Hong Kong-Macao Greater Bay Area, China, Revealed by MT-InSAR. Int. J. Appl. Earth Obs. Geoinf. 2023, 122, 103432. [Google Scholar] [CrossRef]
  19. Luo, Q.; Li, J.; Zhang, Y. Monitoring Subsidence over the Planned Jakarta–Bandung (Indonesia) High-Speed Railway Using Sentinel-1 Multi-Temporal InSAR Data. Remote Sens. 2022, 14, 4138. [Google Scholar] [CrossRef]
  20. Zhang, J.; Zhu, W.; Cheng, Y.; Li, Z. Landslide Detection in the Linzhi–Ya’an Section along the Sichuan–Tibet Railway Based on InSAR and Hot Spot Analysis Methods. Remote Sens. 2021, 13, 3566. [Google Scholar] [CrossRef]
  21. China Railway Corporation. Observation and Evaluation Specification for Settlement Deformation of Railway Engineering; Q/CR 9230-2016; China Railway Corporation: Beijing, China, 2016. [Google Scholar]
  22. Gong, X.; Li, Z. Bridge Pier Settlement Prediction in High-Speed Railway via Autoregressive Model Based on Robust Weighted Total Least-Squares. Surv. Rev. 2018, 50, 147–154. [Google Scholar] [CrossRef]
  23. Wang, Y.; Tang, H.; Huang, J.; Wen, T.; Ma, J.; Zhang, J. A Comparative Study of Different Machine Learning Methods for Reservoir Landslide Displacement Prediction. Eng. Geol. 2022, 298, 106544. [Google Scholar] [CrossRef]
  24. Huang, W.; Liao, W.; Li, J.; Qiao, X.; Yusan, S.; Yasen, A.; Li, X.; Zhang, S. The Long-Term Surface Deformation Monitoring and Prediction of Hutubi Gas Storage Reservoir in Xinjiang Based on InSAR and the GWO-VMD-GRU Model. Remote Sens. 2025, 17, 2480. [Google Scholar] [CrossRef]
  25. Xue, Y.-A.; Zou, Y.-F.; Li, H.-Y.; Zhang, W.-Z. Regional Subsidence Monitoring and Prediction along High-Speed Railways Based on PS-InSAR and LSTM. Sci. Rep. 2024, 14, 24622. [Google Scholar] [CrossRef] [PubMed]
  26. Gong, X.; Wang, H.; Lu, T.; You, W. A General Progressive Decomposition Long-Term Prediction Network Model for High-Speed Railway Bridge Pier Settlement. Acta Geod. Cartogr. Sin. 2024, 53, 1113. [Google Scholar] [CrossRef]
  27. Gong, X.; Wang, H.; Lu, T.; You, W.; Zhang, R. Combined Prediction Model for High-Speed Railway Bridge Pier Settlement Based on Robust Weighted Total Least-Squares Autoregression and Adaptive Dynamic Cubic Exponential Smoothing. J. Surv. Eng. 2023, 149, 04023001. [Google Scholar] [CrossRef]
  28. Vaswani, A.; Shazeer, N.; Parmar, N.; Uszkoreit, J.; Jones, L.; Gomez, A.N.; Kaiser, Ł.; Polosukhin, I. Attention Is All You Need. In Proceedings of the 31st International Conference on Neural Information Processing Systems, Long Beach, CA, USA, 4 December 2017; Curran Associates Inc.: Red Hook, NY, USA, 2017; pp. 6000–6010. [Google Scholar]
  29. Zhou, H.; Zhang, S.; Peng, J.; Zhang, S.; Li, J.; Xiong, H.; Zhang, W. Informer: Beyond Efficient Transformer for Long Sequence Time-Series Forecasting. Proc. AAAI Conf. Artif. Intell. 2021, 35, 11106–11115. [Google Scholar] [CrossRef]
  30. Kitaev, N.; Kaiser, L.; Levskaya, A. Reformer: The Efficient Transformer. In Proceedings of the 8th International Conference on Learning Representations, ICLR 2020, Addis Ababa, Ethiopia, 26–30 April 2020. [Google Scholar]
  31. Liu, Y.; Hu, T.; Zhang, H.; Wu, H.; Wang, S.; Ma, L.; Long, M. iTransformer: Inverted Transformers Are Effective for Time Series Forecasting. In Proceedings of the Twelfth International Conference on Learning Representations, ICLR 2024, Vienna, Austria, 7–11 May 2024. [Google Scholar]
  32. Zhang, Y.; Yan, J. Crossformer: Transformer Utilizing Cross-Dimension Dependency for Multivariate Time Series Forecasting. In Proceedings of the Eleventh International Conference on Learning Representations, Windsor Great Park, UK, 29 September 2022. [Google Scholar]
  33. Wang, Z.; Kong, F.; Feng, S.; Wang, M.; Yang, X.; Zhao, H.; Wang, D.; Zhang, Y. Is Mamba Effective for Time Series Forecasting? Neurocomputing 2025, 619, 129178. [Google Scholar] [CrossRef]
  34. Zeng, C.; Liu, Z.; Zheng, G.; Kong, L. CMamba: Channel Correlation Enhanced State Space Models for Multivariate Time Series Forecasting. 2024. Available online: https://arxiv.org/abs/2406.05316 (accessed on 12 January 2025).
  35. Kim, T.; Kim, J.; Tae, Y.; Park, C.; Choi, J.-H.; Choo, J. Reversible Instance Normalization for Accurate Time-Series Forecasting against Distribution Shift. In Proceedings of the International Conference on Learning Representations, Virtually, 6 October 2021. [Google Scholar]
  36. Gu, A.; Dao, T. Mamba: Linear-Time Sequence Modeling with Selective State Spaces. In Proceedings of the First Conference on Language Modeling, Philadelphia, PA, USA, 26 August 2024. [Google Scholar]
  37. Nie, Y.; Nguyen, N.H.; Sinthong, P.; Kalagnanam, J. A Time Series Is Worth 64 Words: Long-Term Forecasting with Transformers. In Proceedings of the Eleventh International Conference on Learning Representations, ICLR 2023, Kigali, Rwanda, 1–5 May 2023. [Google Scholar]
  38. Wang, Y.; Wu, H.; Dong, J.; Qin, G.; Zhang, H.; Liu, Y.; Qiu, Y.; Wang, J.; Long, M. TimeXer: Empowering Transformers for Time Series Forecasting with Exogenous Variables. In Proceedings of the Advances in Neural Information Processing Systems 38: Annual Conference on Neural Information Processing Systems 2024, NeurIPS 2024, Vancouver, BC, Canada, 10–15 December 2024. [Google Scholar]
  39. Murad, M.M.N.; Aktukmak, M.; Yilmaz, Y. WPMixer: Efficient Multi-Resolution Mixing for Long-Term Time Series Forecasting. In Proceedings of the AAAI-25, Sponsored by the Association for the Advancement of Artificial Intelligence, Philadelphia, PA, USA, 25 February–4 March 2025; Walsh, T., Shah, J., Kolter, Z., Eds.; AAAI Press: Palo Alto, CA, USA, 2025; pp. 19581–19588. [Google Scholar]
  40. Pan, G.; Wang, X.; Zhang, J.; Liu, G.; Wang, J.; Hou, Z.; Li, B. Interpretation and Analysis of Multi-Source Remote Sensing Fault Structure in Taiyangshan Fault Zone and Surrounding Areas. J. Geod. Geodyn. 2021, 41, 754–758. [Google Scholar]
  41. Liu, X.; Xing, X.; Wen, D.; Chen, L.; Yuan, Z.; Liu, B.; Tan, J. Mining-Induced Time-Series Deformation Investigation Based on SBAS-InSAR Technique: A Case Study of Drilling Water Solution Rock Salt Mine. Sensors 2019, 19, 5511. [Google Scholar] [CrossRef]
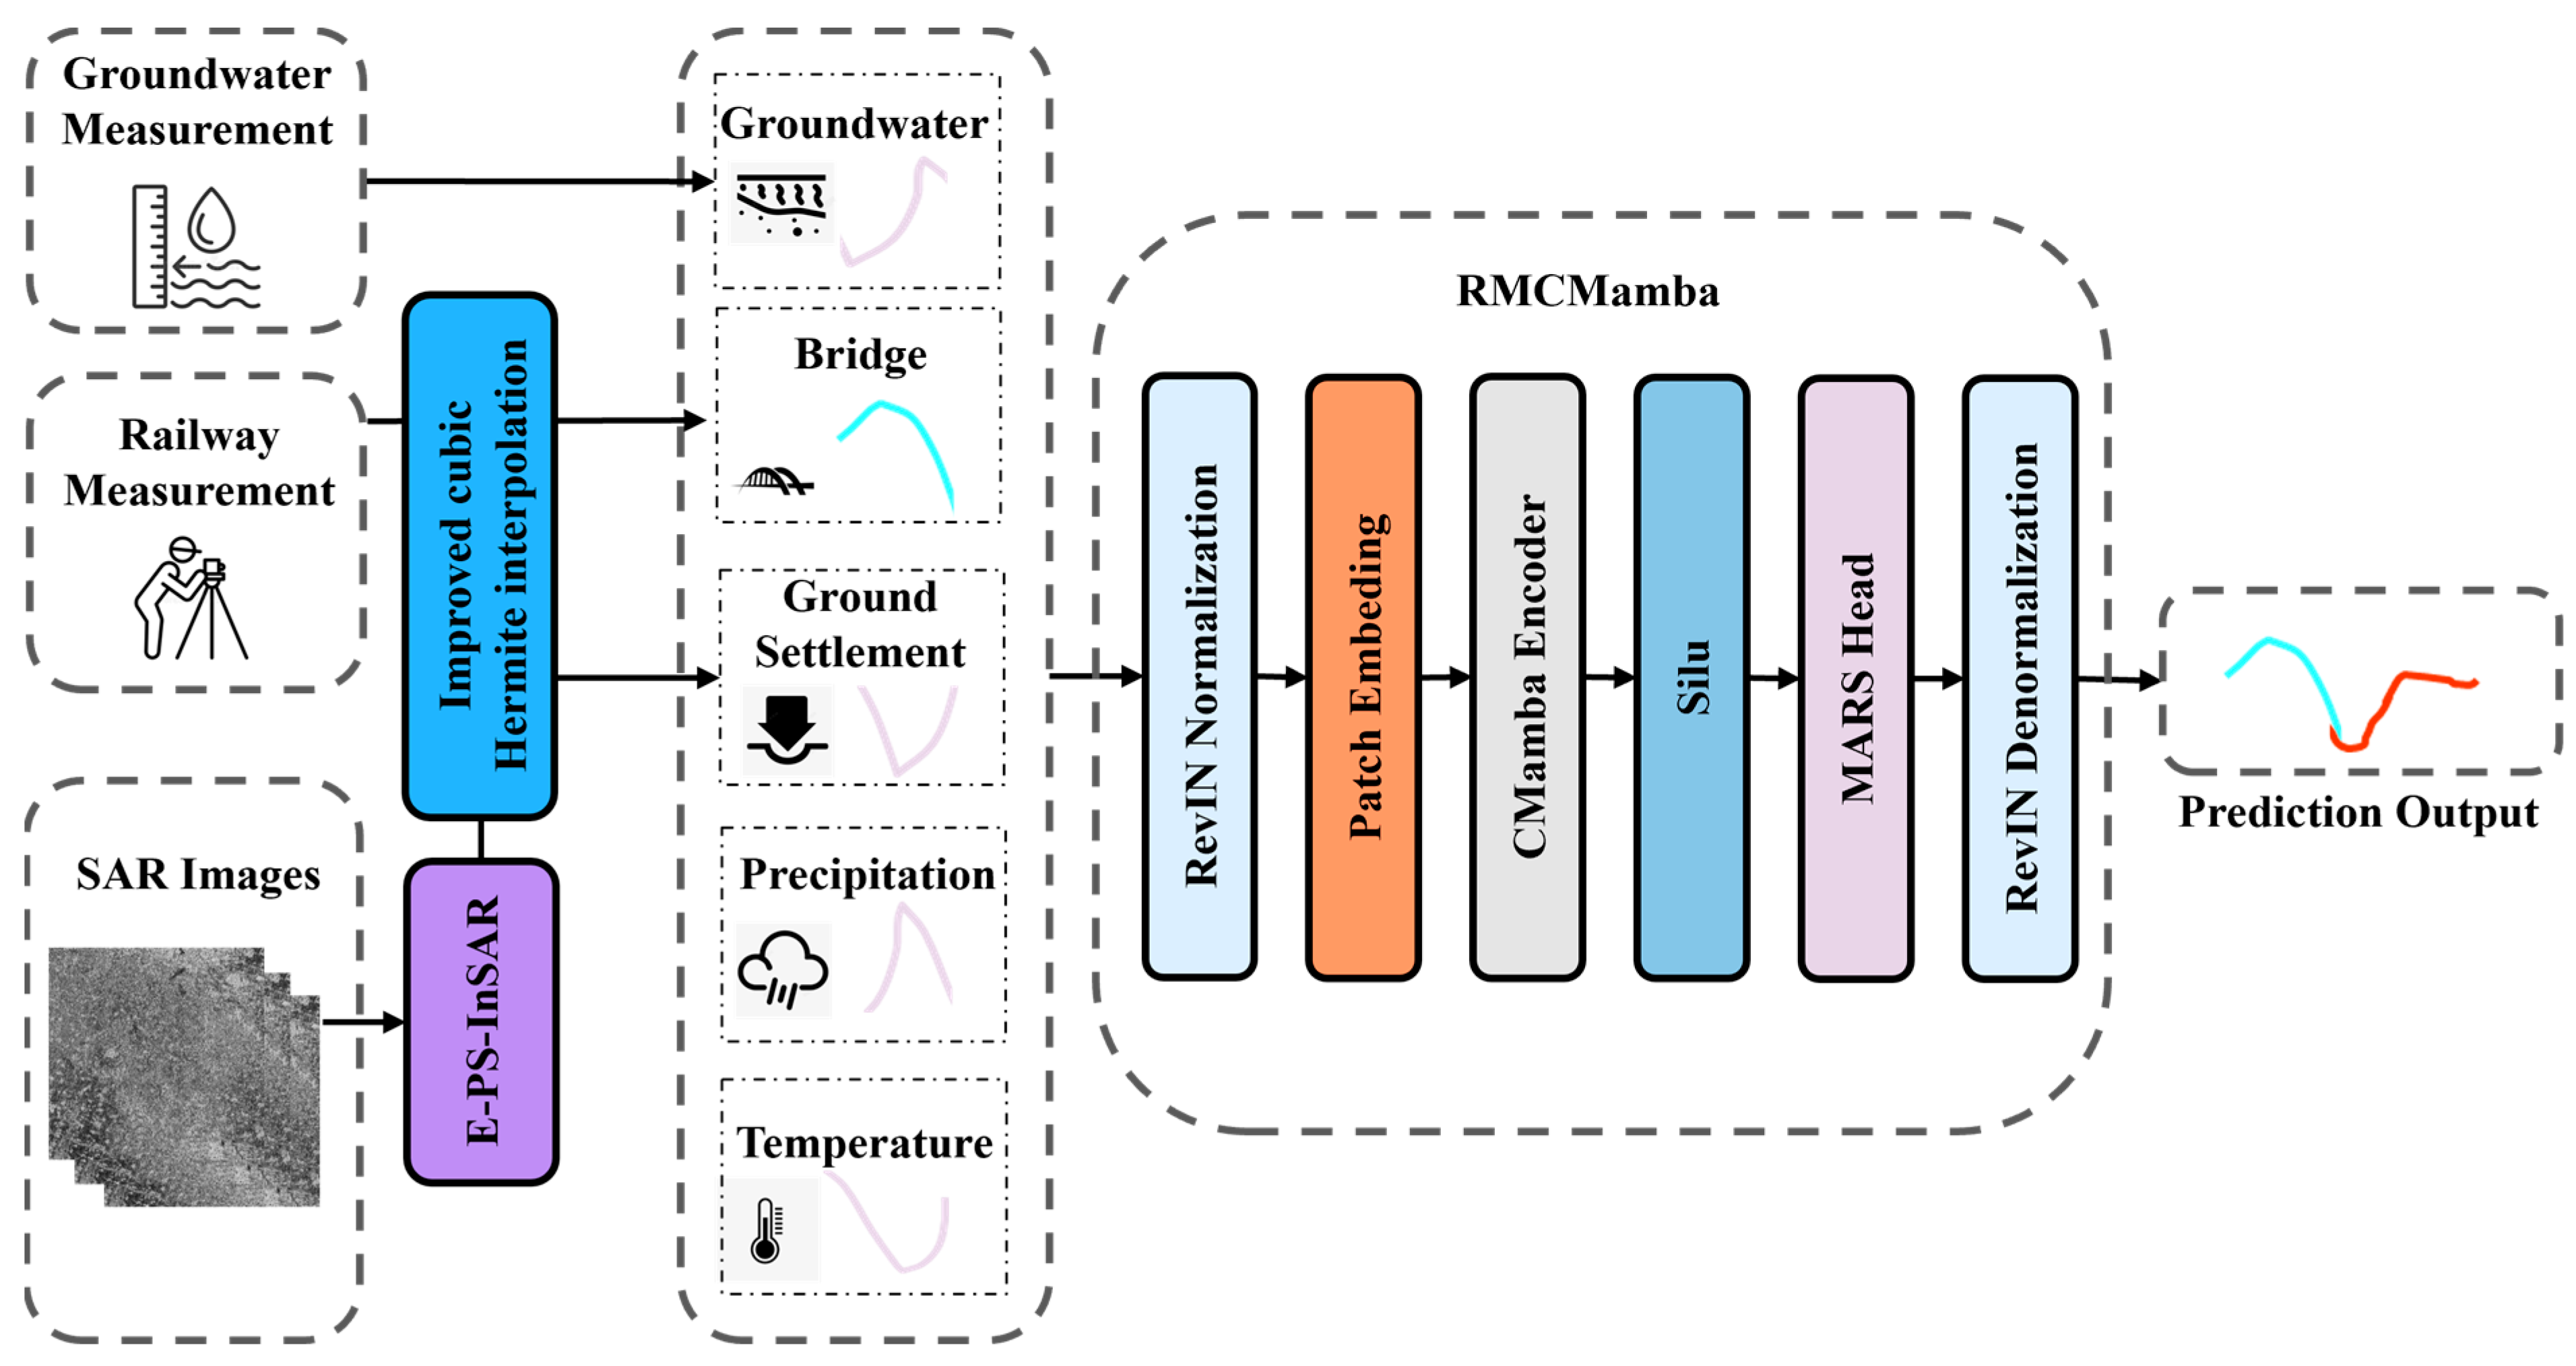
Figure 1. Technical route for HSR-BP multi-factor settlement prediction based on RMCMamba.
Remotesensing 17 03596 g001
Figure 2. Structure diagram of CMamba Encoder module.
Remotesensing 17 03596 g002
Figure 3. Structure diagram of Multi-Scale Adaptive Resolution Stream Head Module.
Remotesensing 17 03596 g003
Figure 4. Overview of land subsidence monitoring results in Wuling District, Changde City.
Remotesensing 17 03596 g004
Figure 5. Multi-factor HSR-BP prediction qualitative results of different methods. (a) Transformer; (b) Informer; (c) PatchTST; (d) Mamba; (e) TimeXer; (f) CMamba; (g) iTransformer; (h) S-Mamba; (i) WPMixer; (j) RMCMamba.
Remotesensing 17 03596 g005
Figure 6. Box plot of prediction errors for various methods using multi-factor HSR-BP prediction.
Remotesensing 17 03596 g006
Figure 7. Qualitative comparison of HSR-BP single-factor prediction of different methods. (a) Transformer; (b) Informer; (c) PatchTST; (d) Mamba; (e) TimeXer; (f) CMamba; (g) iTransformer; (h) S-Mamba; (i) WPMixer; (j) RMCMamba.
Remotesensing 17 03596 g007
Figure 8. Box plots of prediction errors for HSR-BP single factor prediction of different methods.
Remotesensing 17 03596 g008
Figure 9. Ablation experiment replacement module setup.
Remotesensing 17 03596 g009
Table 1. High-speed railway bridge pier (HSR-BP) measurement point overview.
Monitoring PointStart Date (yyyy/mm/dd)End Date
(yyyy/mm/dd)
Total Measurement DaysAverage Settlement Rate (mm/year)Number of Measurement Periods
12020/07/152021/12/275302.06637
22020/09/302021/12/274532.26432
32021/02/282021/12/192943.017136
42020/10/242021/12/194212.21184
52020/10/242021/12/194211.54332
62020/09/092021/12/204871.43234
72020/08/182021/12/204892.15736
82020/10/022021/12/064302.122109
92020/07/162021/12/205220.76236
102020/08/132021/12/054791.67669
Table 2. Statistical overview of land subsidence distribution in Wuling District, Changde City.
Settlement Rate (mm/year)Number of Monitoring PointsProportion of Total
x < −5.0049400.270%
−5.00 ≤ x < −2.0064,6563.535%
−2.00 ≤ x < −1.00183,08410.011%
−1.00 ≤ x < −0.50238,33013.032%
−0.50 ≤ x < 0.50774,83142.368%
0.50 ≤ x < 1.00290,43915.881%
1.00 ≤ x < 2.00235,76712.892%
2.00 ≤ x < 5.0036,5972.001%
≥5.001510.008%
Table 3. Multi-factor HSR-BP prediction performance results.
ModelMulti-Factor
MAE/mmRMSE/mmMAPE
Transformer [22]0.485860.5452528.398%
Informer [23]0.471140.5307725.430%
PatchTST [31]0.051650.079195.427%
Mamba [30]0.094380.139179.497%
TimeXer [32]0.058810.091265.996%
CMamba [28]0.052220.082535.429%
iTransformer [25]0.056970.089306.604%
S-Mamba [27]0.058560.089366.569%
WPMixer [33]0.060060.091756.251%
RMCMamba0.049180.077185.022%
Bold numbers indicate the optimal values. Underlined numbers indicate the secondary values.
Table 4. Single-factor HSR-BP prediction performance results.
ModelSingle-Factor
MAE/mmRMSE/mmMAPE
Autoregressive Model0.993261.1522350.677%
Grey Models46.2007050.537721933.847%
Back Propagation1.573581.70844175.677%
Transformer [22]0.291140.3557816.737%
Informer [23]0.303610.3686416.685%
PatchTST [31]0.063570.096396.189%
Mamba [30]0.058890.089496.396%
TimeXer [32]0.060110.086276.087%
CMamba [28]0.051720.081495.635%
iTransformer [25]0.058530.091276.472%
S-Mamba [27]0.056250.084206.431%
WPMixer [33]0.060460.092026.043%
RMCMamba0.049450.077965.015%
Bold numbers indicate the optimal values. Underlined numbers indicate the secondary values.
Table 5. Evaluation of the ablation experiment prediction accuracy of different methods.
MethodMulti-FactorSingle-Factor
MAE/mmRMSE/mmMAPEMAE/mmRMSE/mmMAPE
Variant 10.052220.082535.429%0.051720.081495.635%
Variant 20.051420.080275.276%0.050890.079785.304%
Variant 30.052230.082535.416%0.051710.081485.635%
Variant 40.049180.077185.022%0.049450.077965.015%
Bold numbers indicate the optimal values. Underlined numbers indicate the secondary values.
Disclaimer/Publisher’s Note: The statements, opinions and data contained in all publications are solely those of the individual author(s) and contributor(s) and not of MDPI and/or the editor(s). MDPI and/or the editor(s) disclaim responsibility for any injury to people or property resulting from any ideas, methods, instructions or products referred to in the content.