Highlights
What are the main findings?
- We proposed the SLA-Net guided by the SLA Hierarchical Attention Mechanism which is the first attention mechanism guided by sea-land prior in SAR ship detection.
- We proposed SL-SSDD, a sea-land segmentation dataset based on SSDD, which is the first synergistic dataset for SAR ship detection.
What is the implication of the main finding?
- SLA-Net exhibits high-precision detection performance, highlighting the potential for enhanced ship detection accuracy through the integration of sea-land priors.
- SL-SSDD opens up a novel perspective that is expected to inspire future research in the community working on exploring the synergies between SAR ship detection and sea-land segmentation.
Abstract
In recent years, deep learning (DL)-based synthetic aperture radar (SAR) ship detection has made significant strides. However, many existing DL-based SAR ship detection methods treat sea regions and land regions equally, failing to be fully aware of the differences between the two regions during training and testing. This oversight may prevent the network’s attention from fully concentrating on valuable regions (i.e., sea regions and ship regions), thereby adversely affecting overall detection accuracy. To address these issues, we propose the Sea–Land Aware Net (SLA-Net), which introduces a novel SLA Hierarchical Attention mechanism to gradually focus the network’s attention on sea and ship regions across different stages. Specifically, SLA-Net instantiates the SLA Hierarchical Attention mechanism through three components: the SLA Sea-Attention Backbone, which incorporates sea attention in the feature extraction stage; the SLA Ship-Attention FPN, which implements ship attention in the feature fusion stage; and the SLA Ship-Attention Detection Heads, which enforce ship attention in the detection refinement stage. Moreover, to tackle the lack of sea–land priors in the community working on DL-based SAR ship detection, we introduce the sea–land segmentation dataset for SSDD (SL-SSDD). Built upon the well-established SAR ship detection dataset (SSDD), it serves as a synergistic dataset for ship detection when used in conjunction with SSDD. Quantitative experimental results on SSDD and generalization results on HRSID and LS-SSDD demonstrate that SLA-Net achieves superior SAR ship detection performance compared to other methods. Furthermore, SL-SSDD, which contains sea–land segmentation information, can provide a new perspective for the community working on DL-based SAR ship detection.
1. Introduction
Synthetic aperture radar (SAR) is an advanced active microwave sensor that uses microwave imaging to generate high-resolution images for monitoring Earth’s surface. It is capable of all-day and all-weather operating, making it widely used in a variety of marine missions, such as marine pollution management [1], marine disaster investigation [2], and other fields [3]. As an essential marine mission, SAR ship detection holds significant values in many fields [4], such as marine traffic control [5], fishery management [6] and safe navigation [7]. Hence, a growing number of scholars [8,9,10,11,12,13] have conducted research on SAR ship detection.
In the early period, most SAR ship detection methods were based on traditional detectors. The standard solution involves methods such as CFAR [14], saliency [15], super-pixel [16], and transformation [17]. However, it faces some problems, such as high computational complexity, complex parameter tuning, limited generalization, and lacking multiscale detection capability.
Nowadays, with the development of studies in deep learning (DL), many DL-based SAR ship detection algorithms [18,19,20,21,22,23,24,25,26,27,28,29,30,31] have addressed the above problems. For instance, based on Faster R-CNN, Zhang et al. [10] proposed a novel Quad Feature Pyramid Network (Quad-FPN). This network consists of four distinct feature pyramid networks arranged in sequence, forming a detection pipeline with progressive optimization to enhance detection performance. Song et al. [32] pioneered the systematic investigation of the application of Generalized Compact Polarimetry (GCP) mode in SAR ship detection, proposing an “information source optimization” strategy to enhance detection accuracy by optimizing polarization modes rather than relying solely on algorithmic improvements. Zhang et al. [33] proposed a lightweight and high-speed SAR ship detection framework based on the Depthwise Separable Convolutional Neural Network (DS-CNN), which balances the accuracy and speed of SAR ship detection. Ke et al. [34] proposed a global context boundary-aware network (GCBANet). This network adopts a cascade structure and gradually optimizes box prediction and mask prediction through three stages, ultimately achieving more accurate ship instance segmentation (providing both box-level location and pixel-level contour). Qian et al. [35] proposed a cross-level adaptive feature aggregation network (CLAFANet) for achieving arbitrary-oriented multiscale SAR ship detection. Ke et al. [36] proposed a SAR ship detection method based on Swin Transformer and Feature Enhancement Feature Pyramid Network (FEFPN), which improves issues of insufficient ability to model long-range dependencies and lack of semantic information in shallow features. Ma et al. [37] proposed the neighborhood removal-and-emphasis network (NRE-Net), which addresses the challenge of detecting small-sized ships in complex backgrounds in SAR images and improves detection accuracy through two core strategies: neighborhood screening and feature enhancement. Ren et al. [38] proposed the Lightweight Prior Feature Fusion Network (LPFFNet), which improves detection accuracy and efficiency through lightweight design and feature enhancement strategies. Bai et al. [39] proposed the Feature Enhancement Pyramid and Shallow Feature Reconstruction Network (FEPS-Net), which includes the Feature Enhancement Pyramid (FEP, containing the Spatial Enhancement Module (SEM) and the Feature Alignment Module (FAM)) and the Shallow Feature Reconstruction Module (SFR), addressing the problems of complex background interference, feature fusion misalignment, and difficulties in detecting small ships in SAR images. Chen et al. [40] proposed the Adaptive Joint Attention Network (AJANet), which uses the method of integrating Adaptive Channel Attention (ACA) and Adaptive Large Separable Kernel Attention (ALKA) to improve the accuracy of SAR ship detection in complex backgrounds. Gao et al. [41] proposed a dualistic cascade convolutional neural network (DCCNN) driven by polarization characteristics for ship detection in fully polarimetric synthetic aperture radar (PolSAR) images, aiming to improve the accuracy and efficiency of ship detection in complex backgrounds.
Additionally, with the advancement of deep learning-based SAR ship detection, oriented bounding boxes have become an important development direction, as they can precisely enclose ship targets and reduce interference from redundant background. Hence, some scholars have conducted research on it [42,43]. For example, Pan et al. [44] proposed the Multi-Stage Rotational Region-Based Network (MSR2N), which integrates Feature Pyramid Networks (FPN) with Rotated Region Proposal Networks (RRPN). This architecture employs a multi-stage rotational detection process to effectively reduce redundant candidate regions and accommodate the arbitrary orientations and multiscale characteristics of ships in SAR images. Chen et al. [45] proposed the multiscale adaptive recalibration network (MSARN) to detect multiscale and arbitrarily oriented ships in complex scenarios. Yang et al. [46] proposed the R-RetinaNet based on the RetinaNet framework. It adopts a “scale calibration method” to align the scale distribution of ships, designs a “Task-Wise Attention Feature Pyramid Network (Task-Wise Attention FPN)” to alleviate the conflict between classification and localization tasks, and corrects the imbalance between positive and negative samples through adaptive IoU threshold training. Zhang et al. [47] proposed an oriented ship detection network for synthetic aperture radar (SAR) images based on soft threshold and contextual information, which improves the ability to detect inshore small ships in SAR images. Gao et al. [27] proposed a YOLOV5-based oriented ship detection method integrated with contextual global attention mechanism and lightweight task-specific context decoupling, which addresses the challenge of fast and accurate detection of ships with multiscale, arbitrary orientation, and dense arrangement features in high-resolution remote sensing images.
While these methods have achieved certain results by optimizing network designs to improve the accuracy of SAR ship detection, these SAR ship detection methods mostly treat sea regions and land regions equally and fail to be aware of the differences between the two regions during training and testing. As shown in Figure 1, in both optical and SAR images, the features of sea regions exhibit differences from those of land areas. For example, the onshore area contains many ship-like interferences, while vessels moored offshore may be confused with the shoreline boundary.
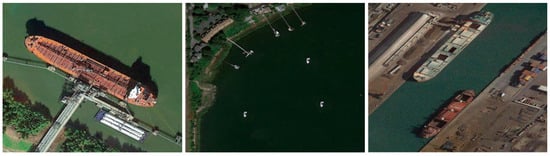
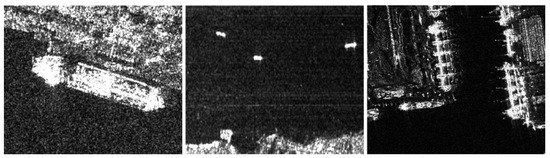
Figure 1.
Comparison of optical images and SAR images.
In a word, this oversight may lead to false alarms from land-based interference (e.g., containers and coastal structures) and missed detections of inshore ships caused by insufficient attention on valuable regions (sea region and ship region), thereby reducing overall detection accuracy. The potential reason for this oversight lies in the fact that public deep learning-based SAR ship detection datasets lack sea–land segmentation information usable as auxiliary data—information that researchers could otherwise leverage to guide ship detection. On the contrary, most SAR imaging products [48,49] could match sea–land division information (usually through shoreline datasets [50]), which is widely used in engineering to assist in ship detection (for example, when the SNAP software processes Sentinel-1 SAR imaging products, it uses a shoreline database to generate land mask as sea–land segmentation information to assist ship detection). Therefore, there is a need for a sea–land segmentation dataset that functions as a synergistic resource for ship detection in the deep learning community. Furthermore, a method capable of being fully aware of the difference between sea regions and land regions is urgently required to achieve more accurate ship detection performance.
Therefore, to address the above issues, this paper proposes a novel Sea–Land Aware Network (SLA-Net). This network follows a novel Hierarchical Attention mechanism which gradually focuses the network’s attention on sea and ship regions across different stages and is instantiated by three core components: SLA Sea-Attention Backbone, SLA Ship-Attention FPN, and SLA Ship-Attention Detection Heads. These three modules leveraging sea–land segmentation information to guide the network to be aware of the differences between sea regions and land regions in feature extraction stage, feature fusion stage, and detection refinement stage, respectively, and gradually enhance the network’s attention of value regions (sea region and ship region) in a coarse-to-fine-grained manner. Since most representative methods based on SSDD adopt horizontal bounding boxes, and the primary focus of this work is on sea–land awareness rather than improvements in detection paradigms, we also employ horizontal boxes to ensure a more consistent comparison of method performance in the experiments. Furthermore, given that SLA-Net relies on sea–land segmentation information and considering the current scarcity of reliable sea–land segmentation information in the SAR ship detection community [4,51,52,53,54,55], we introduce the sea–land segmentation dataset for SSDD (SL-SSDD). SL-SSDD addresses the lack of sea–land segmentation information in deep learning-based ship detection datasets, providing a synergistic dataset for ship detection when used in conjunction with SSDD [4] and a novel perspective that is expected to inspire future research in the community working on DL-based SAR ship detection to further leverage sea–land segmentation information for enhancing SAR ship detection accuracy and exploring the synergies between SAR ship detection and sea–land segmentation.
The main contributions of this paper are as follows:
Aiming to address the problems that most existing SAR ship detection methods are not fully aware of differences between sea region and land region, we propose Sea–Land Aware Net (SLA-Net), which could be aware of the differences between the two regions and focus on valuable regions.
To direct the network’s attention to valuable regions, we propose the SLA Hierarchical Attention mechanism that gradually focuses the network’s attention on sea and ship regions in a coarse-to-fine-grained manner. As far as we know, it is the first attention mechanism guided by sea–land priors in SAR ship detection. To instantiate the mechanism, SLA Sea-Attention Backbone, SLA Ship-Attention FPN, and SLA Ship-Attention Detection Heads are proposed, collectively constituting SLA-Net, enabling a Hierarchical Attention process that progresses from coarse sea attention to fine-grained ship attention.
SL-SSDD is introduced to serve as a synergistic sea–land segmentation dataset for ship detection based on classic SSDD and tackle the lack of sea–land priors in the community working on DL-based SAR ship detection. As far as we know, it is the first synergistic sea–land segmentation dataset for SAR ship detection.
The rest of paper is arranged as follows. Section 2 introduces sea–land segmentation in both traditional and DL-based SAR ship detection. Section 3 presents SLA-Net and Hierarchical Attention mechanism. Section 4 shows the SL-SSDD. Section 5 shows the Experiments. Section 6 shows the Discussion. Finally, Section 7 summarizes the paper. An Abbreviations table is included at the end.
2. Related Work
2.1. Sea–Land Segmentation in Traditional SAR Ship Detection
Before the rise of deep learning, sea–land segmentation was widely employed for SAR ship detection [50]. Figure 2 illustrates the typical processing steps commonly employed in traditional SAR ship detection methods. It mainly consists of four steps [56]: (a) pre-processing, (b) sea–land masking, (c) pre-screening and (d) discrimination. Specifically, pre-processing is used to calibrate the source image to make further pre-screening more accurate; sea–land masking aims to generate sea–land segmentation mask, ensuring that detection targets focus solely on the sea region. Pre-screening adapts Constant False Alarm Rate (CFAR) detector to detect ships; discrimination is used to further refine the detection results and reject possible false alarms. In sea–land masking, there are two kinds of mainstream methods. The first type of method derives sea–land information directly from images, utilizing algorithms such as adaptive threshold segmentation, region growing, and morphological processing [55] to create coarse sea–land segmentation mask. The second type of method leverages data such as coastline database and geometrically aligns it with the SAR image, to extract the precise boundary between sea and land, ultimately generating sea–land segmentation mask which facilitates the following pre-screening to prevent false alarms. This kind of method is adopted and integrated in most mature software [49,50] in real applications.

Figure 2.
Major processing steps of traditional SAR ship detection methods.
In a word, it can be seen that the utilization of sea–land segmentation information is a very basic step in traditional SAR ship detection methods, but currently most of the deep learning-based SAR ship detection methods have ignored it [18,19,20,21,22,23,24,32,33,34,35,36,37,38,39,40]. The possible reason is that the SAR ship detection community lacks a synergistic sea–land segmentation dataset for ship detection, which hinders the research of utilizing sea–land segmentation information to facilitate ship detection. This paper aims to provide a public sea–land segmentation dataset (SL-SSDD) based on classic SSDD dataset and proposes a novel Sea–land Aware Network (SLA-Net) to use the sea–land segmentation information as priors and be fully aware of the difference between sea regions and land regions to achieve more accurate ship detection performance.
2.2. Sea–Land Segmentation in DL-Based SAR Ship Detection
Even though most DL-based methods ignore utilizing sea–land information in SAR ship detection, we have found that there are a small number of DL-based SAR ship detection methods that utilize sea–land segmentation information. For instance, Liu et al. [57] proposed a Sea–Land Segmentation-Based Convolutional Neural Network (SLS-CNN), which combines saliency computation and corner features. This method generates a heat map (i.e., sea–land segmentation map) using spectral residual saliency and the probability distribution of corners. This sea–land segmentation map then guides the network to detect ships exclusively in the sea regions. Yu et al. [58] proposed a saliency method based on sea–land segmentation preference. Firstly, they adopt OTSU method to generate a binary image. By the image and the gray level differences between land regions and sea regions, they classify the image by whether it includes land regions. Then, the image including land regions will conduct sea–land segmentation using morphological processing and connected component labeling. They use the original image to subject land mask to get a final image which only contains sea regions to conduct SAR ship detection. Finally, a saliency enhancement method based on SR is employed at the final images. Zhou et al. [59] proposed a method based on adaptive dual-polarimetric feature fusion and sea–land segmentation for small SAR ship targets. This method employs a neural network to generate a sea–land segmentation map, reducing land false alarms through the segmentation map. Notably, it introduces an innovative approach where the sea–land segmentation network and the ship detection network share a joint loss during the training process. Guo et al. [60] proposed a mask efficient adaptive network (MEA-Net) for imbalanced dataset. MEA-Net utilizes a sea–land segmentation-like approach to identify inshore data within the input SAR images. This inshore data, being less abundant than offshore data, is then subjected to data augmentation for enhancement.
Although a few existing methods [57,58,59,60] have attempted to introduce sea–land segmentation information into SAR ship detection, these methods still face limitations. First, some of the methods adopt supervised learning to train a sea–land segmentation network through private sea–land segmentation dataset, which may hinder the reproducibility of results and the following research. Second, the methods above did not leverage sea–land segmentation information properly to make the network fully aware of differences between sea regions and land regions, which may cause suboptimal ship detection performance. To address these gaps, we introduce SL-SSDD (the public sea–land segmentation dataset for SSDD) and SLA-Net, which leverages this dataset to enable the network to be fully aware of sea–land differences through Hierarchical Attention. Notably, we noticed that almost all the methods above assume that the sea–land segmentation information is unknown and needs to be predicted through supervised or unsupervised learning, while sea–land segmentation information can already be acquired though data such as shore-line database to guide more accurate ship detection in traditional methods [49,50]. Therefore, considering the fact that sea–land segmentation information can be acquired in certain scenarios, SLA-Net assume that the sea–land segmentation information is known.
3. SLA-Net
SLA-Net (Sea–Land Aware Net) is based on the traditional two-stage detector [61]. Figure 3 shows the overall framework of SLA-Net. SLA-Net follows SLA Hierarchical Attention mechanism and is instantiated mainly through three components: SLA Sea-Attention Backbone which conducts sea attention at the feature level, SLA Ship-Attention FPN, which conducts ship attention at the feature level, and SLA Ship-Attention Detection Heads, which conducts ship attention at the feature and object level. Specifically, SLA Sea-Attention Backbone aims to amplify feature of sea and suppress land features at the feature level; SLA Ship-Attention FPN aims to amplify feature of more important regions (i.e., ship regions) in a fine-grained manner; SLA Ship-Attention Detection Heads aim to further finetune ship features and filter land false alarms in testing. Unlike conventional deep learning-based SAR ship detectors, SLA-Net receives two types of data as inputs, i.e., original raw SAR images and their corresponding sea–land segmentation masks. Details of SLA-Net are as follows:
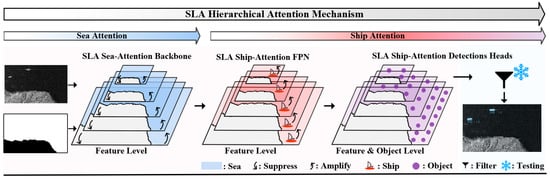
Figure 3.
Overall framework of SLA-Net.
- (1)
- SLA Hierarchical Attention Mechanism: Unlike conventional spatial and channel attention mechanisms, our SLA Hierarchical Attention mechanism is specifically tailored for SAR ship detection, leveraging sea–land priors to guide the network’s attention. Specifically, SLA Hierarchical Attention mechanism aims to focus the network’s attention on sea and ship regions in a coarse-to-fine-grained manner (i.e., from sea attention to ship attention, progressively). Specifically, by leveraging the priors of sea–land segmentation, sea-attention, which is instantiated by SLA Sea-Attention Backbone, will be conducted first to realize a coarse spatial attention, then, ship-attention, which is instantiated by SLA Ship-Attention FPN and SLA Ship-Attention Detection Heads, will be conducted to further realize a fine-grained spatial attention. Through the coarse-to-fine-grained Hierarchical Attention process, the features of valuable regions (sea regions and ship regions) will be amplified explicitly and we will be aware of the difference between sea regions and land regions through the network, implicitly, for more accurate ship detection performance.
- (2)
- SLA Sea-Attention Backbone: To instantiate sea-attention, we propose SLA Sea-Attention Backbone that makes the network fully aware of ships’ potential location (i.e., sea regions) by utilizing sea–land segmentation information. Specifically, SLA Sea-Attention Backbone guides the neural network to focus more on sea regions (where ships are potentially located) while suppressing attention to land regions through attention maps generated from the sea–land segmentation masks. This guides the network’s attention to sea regions, reducing the network’s training difficulty by incorporating prior knowledge (i.e., sea–land segmentation information) and achieves better detection performance by directly and adaptively enhancing sea features in the feature maps while suppressing land features.
- (3)
- SLA Ship-Attention FPN: To instantiate ship attention, we propose SLA Ship-Attention FPN which further guides the network’s attention to ship regions. Using sea–land information to mask land areas and conducting the CFAR algorithm on masked images to get coarse results of ship location, SLA Ship-Attention FPN can sense the coarse location of ships and use the location map to generate ship attention maps for fine-grained ship attention through Ship Attention Pathway (SA Pathway). Moreover, considering that small ships dominate the dataset [4], we further strengthened the bottom-level feature layers through Small Ship Attention Pathway (SSA Pathway). Specifically, we construct more successive top-down pathways in adjacent feature layers to enhance the semantic information and receptive fields of bottom-level feature layers. Thus, the attention of ships, particularly small-sized ships, are further enhanced.
- (4)
- SLA Ship-Attention Detection Heads: To further instantiate ship-attention, we propose SLA Ship-Attention Detection Heads to refine ship features. SLA Ship-Attention Detection Heads follows a classic two-stage detection framework [61] with Double Attention Block (DA-Block) to enhance ships’ ROI features. Moreover, to exclude land false alarms in the object level through sea–land segmentation information, the Sea–Land Aware Filtering strategy is proposed and used in testing. Specifically, the Double Attention Block (DA-Block) enhances the important features of SAR ships and suppresses irrelevant or adverse ones through channel and spatial attention mechanisms, which can resisting interference in SAR images. Sea–Land Aware Filtering strategy uses sea–land segmentation masks to calculate the land ratio of candidate boxes. Hence, false positives such as onshore facilities that do not conform to scene semantics are filtered out, ultimately achieving high-precision SAR ship detection.
3.1. SLA Sea-Attention Backbone
The core idea of SLA Sea-Attention Backbone is to instantiate sea attention and enable the neural network to be fully aware of sea regions by leveraging the sea–land segmentation masks (SLS masks). Specifically, SLA Sea-Attention Backbone uses SLS masks to enhance the spatial attention of the network to sea regions (where ships are probably situated) while reducing the attention to land regions. Figure 4 illustrates the implementation process of SLA Sea-Attention Backbone. On the left side of Figure 4 is a flowchart showing the input of SLS masks into the network, while the right side presents a flowchart of raw SAR images being fed into the network. The results of their respective processing (i.e., feature map Bi and feature map mask Ai) are then fed into the corresponding Mask Attention Block (MA-Block). Specifically, after both SAR images and SLS masks are input into the network, the SAR images undergo feature extraction via ResNet50 [62], generating the corresponding four feature maps (B1 to B4) of different resolution. Meanwhile, the SLS masks are processed through four pooling layers, with each layer employing bilinear interpolation-based down-sampling to dynamically resize SLS masks, which ensures precise spatial alignment between feature map Bi and corresponding feature map mask Ai.
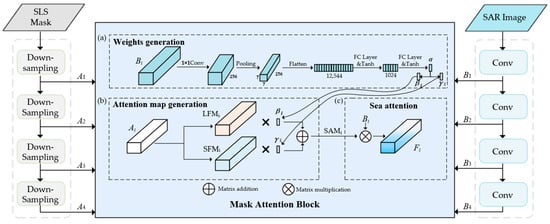
Figure 4.
The illustration of SLA Sea-Attention Backbone.
Subsequently, feature map Bi and feature map mask Ai are fed into the MA-Block in pairs. The MA-Block leverages these paired features and masks to adaptively adjust feature weights in the feature map based on different spatial regions (i.e., sea regions or land regions), thereby enhancing the network’s spatial attention to sea regions (where ships are located) while reducing attention to land regions. As a result, the network’s attention to sea regions is enhanced, which in turn strengthens its focus on ships. Meanwhile, its attention to land regions is weakened, leading to less focus on land-based interferences (e.g., containers, workstations, and small islands).
Specifically, as shown in Figure 4, there are three basic steps in MA-block: (a) weights generation, (b) attention map generation, and (c) sea attention.
Step 1: Weights Generation
In step 1, the adaptive weight in the ith layer is generated, and based on , the land attention weight in the ith layer and sea attention weight in the ith layer are generated. Figure 4a illustrates the implementation process of weights generation. In Figure 4a, the adaptive attention weight , following a self-attention style, is generated from the feature map Bi. We use a 1 × 1 convolution layer to resize the channel dimension of Bi to 256. This channel alignment ensures dimensional consistency with the input requirements of the subsequent average pooling layer. To reduce the computational load of subsequent options, we decreased the dimension size of the feature map to 7 × 7 × 256 by applying average pooling. The feature map is then flattened into a 1D vector with a size of 12,544. This vector is passed through two fully connected layers with tanh activation to gradually refine features into the attention weight adaptively. Using the tanh activation function, we introduce non-linearity and constrain the output α values between −1 and 1, which helps facilitate gradient flow during backpropagation [63]. The process of generating attention weights is defined as follows:
where represents two consecutive, fully connected layers with tanh activation; denotes the operation that flattens the feature tensor into a 1D vector, AP denotes average pooling which reduces spatial dimensions to 7 × 7; and indicates the 1 × 1 convolution layer that adjusts channel dimensions to 256. The process for generating the land attention weight and the sea attention weight is as follows:
Step 2: Attention Map Generation
In the second step, the attention map will be generated. As illustrated in Figure 4b, the attention map generation process employs feature map mask Ai where pixel values of 0 correspond to land regions and 255 to sea regions. Normalization is performed on Ai, where pixel values of 255 are converted to 1 and those of 0 remain unchanged. Then, this result is used to guide the generation of the sea feature mask and the land feature mask . Specifically, in the sea feature mask, the pixel value of the sea regions is 1 and that of the land regions is 0, while the pixel values of the land mask are set to the opposite. The process of sea attention map is generated as follows:
Step 3: Sea Attention
Figure 4c illustrates the implementation of ship location attention. Specifically, the sea attention map is subjected to matrix multiplication with the original feature map Bi to get the refined feature map Fi for the following SLA Ship-Attention FPN, which enhances the network’s attention to sea regions while suppressing its attention to land regions. This makes the network fully aware of a ship’s possible location, thereby strengthening its focus on ships over the ocean and diminishing its attention to onshore interferences. Moreover, by incorporating prior information (i.e., sea regions) into the network, SLA Sea-Attention Backbone reduces the difficulty of network learning and improves the performance of ship detection. The process of sea attention is defined as follows:
Notably, we have explored another strategy in which SLS masks are concatenated directly with original SAR images to guide ship detection, but the improvement in accuracy from this approach is rather limited. Moreover, some methods [57,58] utilizing segmentation information to directly exclude onshore backgrounds in original SAR images before detection may compromise the network’s capability to detect ships in complex contexts [55] due to the loss of global context. Therefore, we did not adopt the above approach.
In conclusion, the SLA Sea-Attention Backbone makes the network fully aware of sea regions by utilizing sea–land segmentation masks and Mask Attention Block. This reduces the network’s training difficulty by introducing prior knowledge (i.e., ship location) to the network and achieves coarse attention for SLA Hierarchical Attention mechanism, leading to better detection accuracy by directly and adaptively enhancing sea features in the feature maps while suppressing land features.
3.2. SLA Ship-Attention FPN
The core idea of SLA Ship-Attention FPN is to instantiate ship attention in SLA Hierarchical Attention mechanism and make the neural network be aware of ship regions. Moreover, considering that small ships dominate in the dataset [4]. Specifically, SLA Ship-Attention FPN follows the basic framework of classical Path Aggregation Feature Pyramid Network [64] and is enhanced by several successive top-down pathways from adjacent feature layers and CFAR results. As shown in Figure 5, the top-down pathways can be grouped into two categories: Ship Attention Pathway (SA Path, denoted as blue row) and Small Ship Attention Pathway (SSA Path, denoted as orange row).
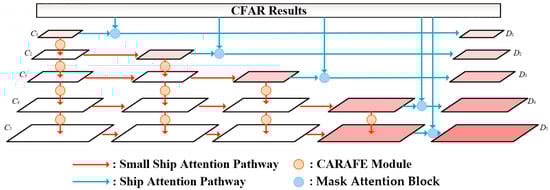
Figure 5.
The illustration of SLA Ship-Attention FPN.
In the SA Path, we used SLS masks to exclude land area in original SAR images and conduct the CFAR algorithm on the masked images. Like the SLS mask used in Mask Attention Block in Section 3.1, CFAR results are treated as the inherent source of ship attention map, where 0 in CFAR results denote background and 255 denotes ship. By simply down-sampling CFAR results to align with the size of the feature map in FPN and sending the resized results to Mask Attention Block which is also used in Backbone to conduct spatial attention, SLA Ship-Attention Backbone leads to fine-grained spatial attention of ship location for the network. Notably, in this paper, we simply choose classic CA-CFAR [65] as the CFAR algorithm. Moreover, it is worth noting that sea–land segmentation information serves as the cornerstone of ship attention—this is because CFAR only needs to be performed over maritime regions for preventing unnecessary land false alarms, as previously noted in Section 2.1.
In the SSA Path, the top-down pathways consisting of the CARAFE [66] module enhance both semantic information and receptive fields to bottom-level feature layers. As shown in the left of Figure 5, the feature map C1 does not undergo any additional feature fusion when transitioning to D1, whereas C5 undergoes four iterations of feature fusion to become D5. Through the iterations in structure level, the bottom-level feature layers undergo more frequent feature fusion processes compared with upper feature layers, enabling effective integration of higher-level semantic information while preserving spatial resolution advantages through multi-stage refinement.
There are two basic steps in CARAFE: (1) kernel prediction, and (2) content-aware feature reassembly.
Step 1: Kernel Prediction:
Figure 6a illustrates the implementation of kernel prediction. The dimension of feature map X is H × W × C. To reduce computational cost, the feature map X is first fed into the channel compressor which consists of a convolutional operation and the performance of channel compression (i.e., from C to Cmid).
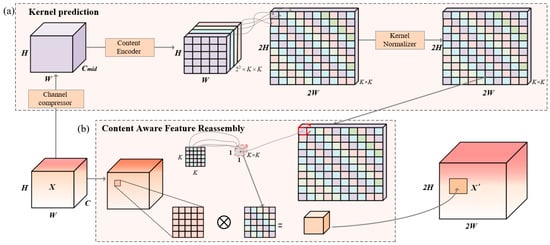
Figure 6.
Implementation process of the CARAFE module.
Then, the feature map passes through the Content Encoder, which consists of a stack of convolutional layers (supplemented by ReLU and normalization) to encode the content of input features. This process generates a position-specific reassembly kernel for adaptive up-sampling at each spatial location. In this context, we set the kernel channel width to 22 × k × k, where the factor of 22 corresponds to the 2× up-sampling operation. The parameter k determines the range of neighborhoods considered at each up-sampling position. Then, the reassembly kernels are reshaped to a 2L × 2L × (k × k) dimension. Finally, each reassembly kernel is normalized with the Kernel Normalizer.
In conclusion, the above operation can be described as
where denotes a location-wise kernel for each location ,
denotes the operation of kernel prediction, and denotes the k × k sub-region of centered at the location , i.e., the neighbor of .
Step 2: Content-Aware Feature Reassembly:
Figure 6b illustrates the implementation of content-aware feature reassembly. For each reassembly kernel , the content-aware reassembly module reassembles features within a local region. The process is described by
where denotes the content-aware reassembly operation (essentially a weighted sum, as defined later), denotes the feature at the “source position” on the input feature map, denotes the square region of size k × k centered at on the input feature map, and denotes the feature after up-sampling. Here, k is the “reassembly kernel size” (i.e., we set k = 5 means 5 × 5 region). Specifically, for each location in the output feature map, we map it back to the input feature map, extract the centered k × k region around it, and compute the dot product with the predicted up-sampling kernel at that point to obtain the output value. The process is described by
where n and m enumerate the points in the k × k region around .
3.3. SLA Ship-Attention Detection Heads
The core idea of SLA Ship-Attention Detection Heads is to further instantiate ship attention in SLA Hierarchical Attention mechanism. Figure 7 illustrates the cascaded detection framework [61] of SLA Ship-Attention Detection Heads, which integrates two key innovations: the Double Attention Block (DA-Block) and the Sea–Land Aware Filtering strategy. From left to right, the data flow starts with the feature map F from SLA Ship-Attention FPN, where the Region Proposal Network (RPN) generates candidate ship regions. These regions undergo ROI Pooling to extract normalized features, which are then fed into the DA-Block, inserted before the cascaded classification heads (C1–C3) and bounding box regression heads (B1–B3) to enhance ship-specific features. After cascade refinement, predicted bounding boxes pass through the Sea–Land Aware Filtering (represented by the funnel symbol) to eliminate land-based false positives using sea–land segmentation information. Finally, Non-Maximum Suppression (NMS) removes redundant boxes, with the snowflake symbol marking the filtering strategy that is only used in the testing phase. This design ensures that ship features are enhanced at the feature level (DA-Block) and false positives are suppressed at the post-processing stage (Sea–Land Filtering), improving both detection accuracy and efficiency.
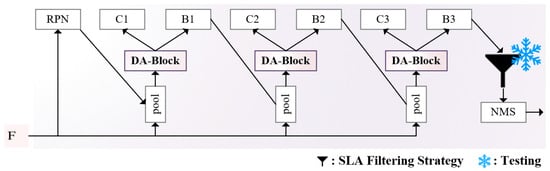
Figure 7.
The illustration of SLA Ship-Attention Detection Heads.
- DA-Block
The concept of DA-Block is to utilize both spatial and channel attention twice over to enhance the essential features crucial for SAR ship detection, while effectively suppressing irrelevant ones. Figure 8 illustrates the implementation process of the Double Attention Block (DA-block). Each ROI feature, with dimensions of 7 × 7 × 256, is forwarded to two sub-blocks, namely the Channel Attention block and the Spatial Attention block [67], repeatedly. These sequential sub-blocks generate attention weights to guide the network, reinforcing attention to essential features while suppressing irrelevant or adverse ones. In summary, the above process is described by
where represents each ROI feature input, represents the output, and represents the middle variables, and denote corresponding 1D channel attention maps from the Channel Attention block, and and denote corresponding 2D spatial attention maps from Spatial Attention Block. The symbol indicates element-wise multiplication.
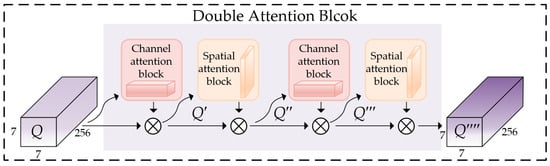
Figure 8.
Implementation process of Double Attention Block (DA-block).
Channel Attention Block:
Figure 9 shows the implementation process of Channel Attention Block. The input feature is firstly sent forward to both max-pooling and average-pooling to generate two different spatial context descriptors: and , respectively. Then, these descriptors are sent to a shared network, i.e., multi-layer perceptron (MLP) with a hidden layer to produce our channel attention map . Finally, we fuse the outputs of the MLP by element-wise summation. The channel attention weight map is generated as follows:
where denotes the sigmoid function. Notably, the MLP weights and are shared by two pooled inputs (average-pooled and max-pooled features), and the ReLU activation is followed by .
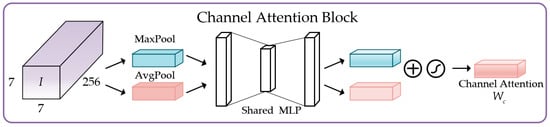
Figure 9.
Implementation process of Channel Attention Block.
Spatial Attention Block:
Figure 10 shows the implementation process of Spatial Attention Block. The inter-spatial relationship of features is used for generating a spatial attention map. The input feature map with dimensions of 7 × 7 × 256 is forwarded to pooling operation to generate two 1 × 7 × 7 2D maps: and . Finally, those features are concatenated and convolved by a standard convolution layer to generate a 2D spatial attention weight map . Briefly, the computation process of is as outline below:
where S denotes the sigmoid function and represents a convolution operation with the filter size of 7 × 7.
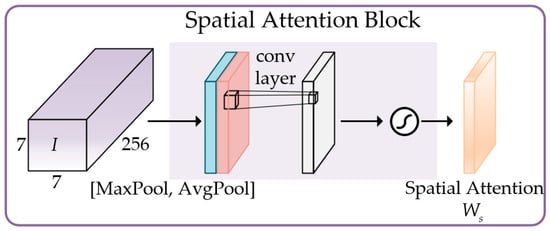
Figure 10.
Implementation process of Spatial Attention Block.
- SLA Filtering Strategy
The SLA Filtering Strategy is a scene-semantic-driven spatial filtering method designed to suppress land false positive. Its core idea is to leverage the sea–land segmentation mask as a prior semantic constraint by quantifying the spatial overlap between ship candidate boxes and land regions, and it eliminates candidates that do not conform to “ship-at-sea” scene semantics (e.g., land structures, or half-land–half-sea false targets). Specifically, the strategy is implemented through three key steps: first, it generates a binary land mask Mland from SLS mask, where each pixel is labeled as
with denoting the spatial coordinates in the SAR image. The second step focuses on calculating the land ratio of candidate boxes: for each ship candidate box B, defined by its top-left and bottom-right corners, the corresponding region is cropped from Mland. The number of land pixels in this region is counted as
while the total number of pixels in the box is
From these, the land ratio—serving as a quantitative indicator of “semantic validity” (i.e., whether the candidate aligns with the “ship-at-sea” logic)—is calculated as
where reflects the proportion of land pixels within the candidate box B. Finally, the candidate box with land ratio exceeding threshold is filtered out. In this paper, we empirically set the threshold to 0.2.
4. SL-SSDD
To address the scarcity of sea–land priors in the deep learning-based SAR ship detection community, we introduce the sea–land segmentation dataset for SSDD (SL-SSDD). Unlike the original SSDD [4], SL-SSDD extends SSDD by providing pixel-wise sea–land segmentation masks, serving as a complementary dataset to enhance ship detection when used in conjunction with SSDD. Following the annotation protocol in [52], SL-SSDD encodes sea–land segmentation information into PNG images that share the same filenames as the original SAR images in SSDD. In these masks, pixel value 0 represents land, while 255 (visually rendered as white) denotes the sea regions. During annotation, SAR interpretation experts referenced expert experience and the official SSDD ground truths (including BBox-SSDD, RBox-SSDD, and PSeg-SSDD [4]) to determine pixel categories. As shown in Figure 11, LableMe [68] is used in the annotation.
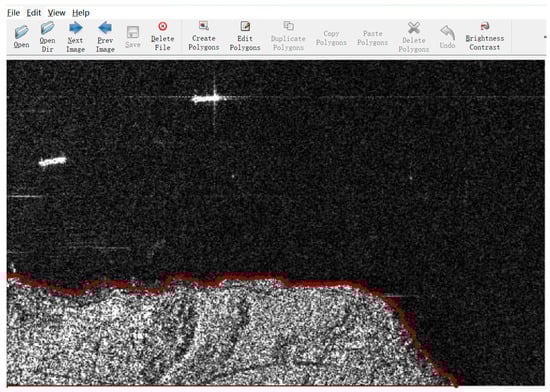
Figure 11.
The illustration of labelling for SL-SSDD.
Experts manually placed points along the sea-land boundaries in raw SAR images; these points were then connected to form closed polygons representing land areas, which were subsequently saved as intermediate format files and visualized as single-channel PNG masks.
Figure 12 illustrates the sea–land segmentation in SL-SSDD: in the mask (b), white pixels (value 255) indicate the sea, while black pixels (value 0) delineate the land. This precise segmentation captures coastal contours and offshore topographies, supplying critical semantic priors for models like SLA-Net.
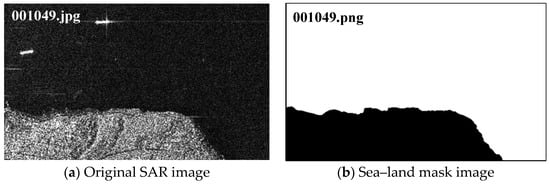
Figure 12.
The illustration of sea–land segmentation in SL-SSDD.
Specifically, SL-SSDD supports two distinct application paradigms for the deep learning-based SAR ship detection community. As mentioned in Section 2, some ship detection methods assume that sea–land segmentation information is readily available prior to detection, while others do not. For the first research scenario—where sea–land segmentation resources (e.g., shoreline databases) are accessible—researchers can treat both original SAR images and sea–land masks as inputs to their proposed methods, with the goal of predicting ship detection results. For the second scenario—where sea–land segmentation information is difficult to obtain—researchers may use only original SAR images as inputs, while leveraging the sea–land masks in SL-SSDD as auxiliary labels. This enables networks to learn sea–land segmentation capabilities via supervised or unsupervised learning with reproducibility and evaluability, thereby guiding subsequent ship detection with more accurate performance in future research. SL-SSDD can be acquired publicly through https://github.com/Han-Ke/SL-SSDD (accessed on 15 October 2025).
5. Experiments
In this section, we show the dataset, experiment details, ablation results, and comparative results.
5.1. Dataset
Proposed by Li et al., the SAR ship detection dataset (SSDD) is the first publicly available dataset for SAR ship detection and has been widely adopted by scholars [4,5,8,19,34]. SSDD comprises 1160 SAR images, each with around a 480 × 330 pixel2 image size, sourced from TerraSAR-X, RadarSat 2, and Sentinel 1. Overall, it contains approximately 2456 ship targets, which is roughly two per image, capturing a diverse range of scenes from vast open sea areas to complex inshore environments. Additionally, the dataset involves HH, VV, VH, and HV polarization modes with resolutions ranging from 1 to 10 m. Following the methodology outlined in [4], we partitioned the dataset into training and testing sets in an 8:2 ratio, yielding 928 training images and 232 testing images. In this paper, we use SSDD and SL-SSDD together as the dataset in experiments.
5.2. Experiment Details
In this paper, the experiments were conducted on a personal computer (PC) equipped with an RTX3060 GPU (NVIDIA, Santa Clara, CA, USA) and an R9-6900hx CPU (AMD, Santa Clara, CA, USA). We employed MMDetection 3.30 and PyTorch 2.0.1 within a Python 3.8 environment as our deep learning framework, and CUDA 11.7 was used to accelerate the model training. The images from the SSDD dataset were resized to 512 × 512 pixels for training. Due to limited GPU memory, SLA-Net was trained for 12 epochs with a batch size of 2. Stochastic gradient descent (SGD) was adopted as the optimizer with a learning rate of 0.01, momentum of 0.9, and a weight decay of 0.0001. Additionally, from the 8th to the 11th epoch, the learning rate was reduced by a factor of 10 at each milestone to ensure sufficient loss reduction. Finally, duplicate detections were suppressed using the classical Non-Maximum Suppression (NMS) algorithm with an intersection-over-union (IoU) threshold of 0.5.
To comprehensively assess the detection performance of various methods, we use the standard COCO-style metric. The recall and precision is defined as follows:
where denotes the number of true positives (i.e., ships that were correctly detected), while represents the number of false negatives (i.e., ships present in the ground truth that were not detected) and denotes the number of false positives (i.e., other objects misclassified as ships).
The AP is a comprehensive metric that quantifies the balance between precision and recall by computing the area under the precision–recall curve, i.e.,
where represents the precision–recall curve.
In this paper, AP50 and AP75 denote the average precision computed at fixed Intersection over Union (IoU) thresholds of 0.5 and 0.75, respectively. In contrast, mAP represents the average precision computed over ten IoU thresholds ranging from 0.5 to 0.95 in increments of 0.05. Hence, mAP was adopted as the final metric for ship detection accuracy in this paper because it comprehensively reflects performance under both lenient and strict IoU criteria. Additionally, APS, APM, and APL denote the average precision for objects of varying sizes, defined as follows: small objects are those with an area of less than 1024 square pixels, medium objects occupy areas between 1024 and 9216 square pixels, and large objects refer to those with an area exceeding 9216 square pixels.
Following Zhang et al. [10], we serve the cross entropy (CE) as the classification loss :
where represents the ground-truth class label, denotes the predictive class probability, and denotes the number of predictions. The regression loss is
where represents the predicted bounding box, while denotes the ground-truth box.
5.3. Ablation Results
In this section, we present thorough ablation studies based on the SSDD dataset, evaluating the effectiveness of each component of SLA-Net, i.e., SLA Sea-Attention Backbone, SLA Ship-Attention FPN, and SLA Ship-Attention Detection Heads. The feature map in the bottom layer of Backbone and FPN are visualized to show the attention of the network.
5.3.1. Ablation Results on SLA Sea-Attention Backbone
To verify the effectiveness of the SLA Sea-Attention Backbone in instantiating sea attention in SLA Hierarchical Attention mechanism, we conduct ablation experiments, analyzing both visual feature maps and quantitative detection metrics. Figure 13 illustrates a comparative analysis of feature maps with and without the SLA Sea-Attention Backbone, alongside original SAR images with ground-truth ship annotations: subfigure (a) shows original SAR images with ground-truth bounding boxes, providing a reference for ship locations and scene context; subfigure (b) presents feature maps generated without the SLA Sea-Attention Backbone, which exhibit obscure sea–land boundaries and weak semantic distinction between land and sea regions (especially the areas where ship are docked near the shore). Subfigure (c) displays feature maps generated with the SLA Sea-Attention Backbone. Here, sea–land transitions are clearer, ship targets exhibit stronger saliency, and the distinctions between land and sea regions are more prominent. This demonstrates the Backbone’s capability to effectively enhance sea-related features and conduct sea attention.
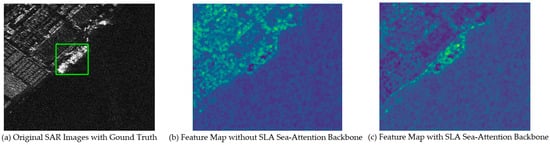
Figure 13.
Feature map comparison for SLA Sea-Attention Backbone.
Table 1 quantifies detection performance with and without the SLA Sea-Attention Backbone. When SLA Sea-Attention Backbone is enabled, the mAP increases from 0.686 to 0.708, representing a 2.2% relative improvement. Additionally, the APS rises from 0.685 to 0.703 (a 1.8% relative increase), the APM rises from 0.699 to 0.739 (a 1.8% relative increase), and the AP75 improves from 0.807 to 0.843 (a 3.6% relative gain). This performance enhancement attributed to SLA Sea-Attention Backbone makes the network fully aware of ships’ potential location (i.e., sea regions) by utilizing sea–land segmentation information. The decrease in APL may be caused by fluctuations considering that the number of large ships in the dataset is relatively small.

Table 1.
The ablation study of SLA Sea-Attention Backbone. Bold indicates the best performance. ‘✘’ represents the absence of SLA Sea-Attention Backbone, and ‘✓’ represents the presence of SLA Sea-Attention Backbone.
5.3.2. Ablation Results on SLA Ship-Attention FPN
To validate the effectiveness of SLA Ship-Attention FPN in instantiating ship attention within the SLA Hierarchical Attention mechanism, we conducted ablation experiments by evaluating three configurations: without Ship Attention Pathway (SA Path) and Small Ship Attention Pathway (SSA Path), with only SA Path, and with both SA Path and SSA Path. The results are visualized in Figure 14 and quantified in Table 2.
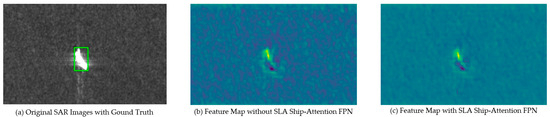
Figure 14.
Feature map comparison for SLA Ship-Attention FPN.
Table 2.
The ablation study of SLA Ship-Attention FPN. Bold indicates the best performance. ‘✘’ represents the absence of the corresponding module (Small SA Path or SA Path), and ‘✓’ represents the presence of the corresponding module.
Figure 14 presents a comparative visualization of feature maps under the three configurations, overlaid with ground-truth ship annotations: subfigure (a) shows an original SAR image with ground-truth bounding boxes, providing a reference for ship locations and scene context; subfigure (b) presents a feature map generated without the SLA Ship-Attention FPN, which exhibits considerable maritime clutter and noise, and the details of the vessels are unclear; subfigure (c) displays a feature map generated with the SLA Ship-Attention FPN. Here, sea surface clutter and noise have been suppressed, and the details of the vessels have been enhanced. This demonstrates the FPN’s capability to effectively enhance sea-related features through ship attention and small ship attention.
Table 2 presents the detection performance of SLA-Net under three configuration schemes of the SLA Ship-Attention FPN, designed to evaluate the independent and combined effects of its two core components: the Small Ship Attention Pathway (SSA Path) and the Ship Attention Pathway (SA Path).
When only the SSA Path is enabled, the mAP increases from 0.675 to 0.688, representing a 1.9% relative improvement. Additionally, the APS rises from 0.669 to 0.685 (a 2.4% relative increase), and the AP75 improves from 0.795 to 0.821 (a 3.3% relative gain). This performance enhancement is attributed to the SSA Path’s multi-stage top-down feature fusion across adjacent feature layers, which strengthens the bottom-level feature representations—crucial for detecting relatively small SAR ship targets which dominate the dataset.
When both submodules (SSA Path + SA Path) are enabled, compared with using the SSA Path alone, the model performance is further improved as follows: the mAP increases to 0.708 (a 3% relative improvement), the AP75 rises to 0.843 (a 2.2% relative gain), and the APS reaches 0.703 (a 1.8% relative increase). This improvement benefits from the SA Path: the SA Path utilizes Constant False Alarm Rate (CFAR) detection results to guide the network to be aware of the ship locations in FPN. Through the ship attention, the model’s feature learning is focused on ship candidate regions, effectively reducing interference from non-ship backgrounds in the sea area, such as waves and clutter. The decrease in APL may be caused by fluctuations considering that the number of large ships in the dataset is relatively small.
5.3.3. Ablation Results on SLA Ship-Attention Detection Heads
To validate the effectiveness of SLA Ship-Attention Detection Heads in instantiating ship attention within the SLA Hierarchical Attention mechanism, we conducted ablation experiments by evaluating three configurations: without Double Attention Block (DA-Block) and SLA Filtering Strategy, with only DA-Block, and with both DA-Block and SLA Filtering Strategy. The results are quantified in Table 3.
Table 3.
The ablation study of SLA Ship-Attention Detection Heads. Bold indicates the best performance. ‘✘’ represents the absence of the corresponding module (DA-Block or SLA Filtering Strategy), and ‘✓’ represents the presence of the corresponding module.
From Table 3, when DA-Block is enabled, the model’s detection performance exhibits significant improvements: specifically, mAP increases from 0.685 to 0.708 (a 3.4% relative improvement), AP75 rises from 0.819 to 0.843 (a 2.9% relative improvement), APS improves from 0.683 to 0.703 (a 2.9% relative improvement), and APM (average precision for medium ships) advances from 0.712 to 0.739. This improvement indicates that DA-Block effectively enhances the important features of SAR ships (such as edge textures) while suppressing irrelevant or interfering features (such as sea clutter and land noise), thereby strengthening the model’s ability to distinguish ship targets from complex backgrounds.
Notably, the SLA Filtering Strategy does not yield observable performance gains in this ablation experiment. We find this is primarily attributed to three factors: first, the baseline model (with SLA Sea-Attention Backbone and SLA Ship-Attention FPN) already demonstrates strong onshore false alarm suppression capabilities, resulting in almost no land-based false positives in the test results—leaving little room for further optimization via filtering. Second, the SSDD test set contains a low proportion of inshore scene samples, which limits the opportunity to observe the strategy’s enhancement effect. Third, as offshore scene samples dominate the dataset, small improvements in inshore scenes may be neglected in the metric. Therefore, we conducted a further ablation study just on inshore-scene samples in test set.
Table 4 shows the results of the ablation study on inshore scenes. From Table 4, it can be seen that mAP increases from 0.570 to 0.571, AP50 rises from 0.885 to 0.887, AP75 rises from 0.631 to 0.632, APS improves from 0.580 to 0.581, and APM improves from 0.571 to 0.572. Even though the improvement is relatively small, we highlight that the SLA Filtering Strategy, conducting a hard filtering based on sea–land segmentation masks, could offer high interpretability and remains indispensable for practical engineering applications where the data is not manually selected for experiments and contains a lot of inshore scenes in inference.
Table 4.
The ablation study of SLA Ship-Attention Detection Heads on inshore scenes. Bold indicates the best performance. ‘✘’ represents the absence of the SLA Filtering Strategy, and ‘✓’ represents the presence of the SLA Filtering Strategy.
5.4. Comparative Results
5.4.1. Quantitative Comparative Results
Table 5 and Figure 15 display the quantitative results of our proposed SLA-Net alongside 11 other competitive models. These models include 3 well-known object detection models i.e., Faster R-CNN [69], Dynamic R-CNN [70], and Cascade R-CNN [61], as well as 8 SAR ship detection models, i.e., EFCNet, SD-YOLO, FBUA-Net [71], LFer-Net [72], HRSDNet [53], ELLK-Net [73], FEPS-Net [39], and Quad-FPN [10]. From Table 5 and Figure 15, the conclusion can be drawn as follows:
Table 5.
Quantitative comparison results of our SLA-Net and 11 other state-of-the-art modules on SSDD. The “-” symbol indicates that the corresponding metric was not reported in the original paper. Bold indicates the best performance.
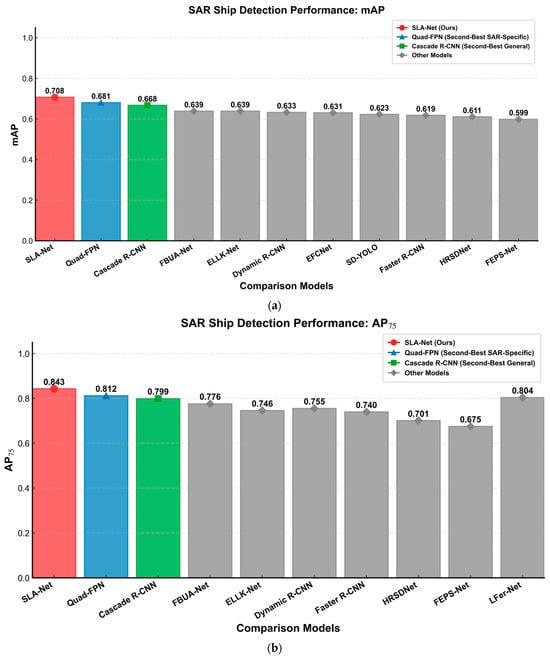
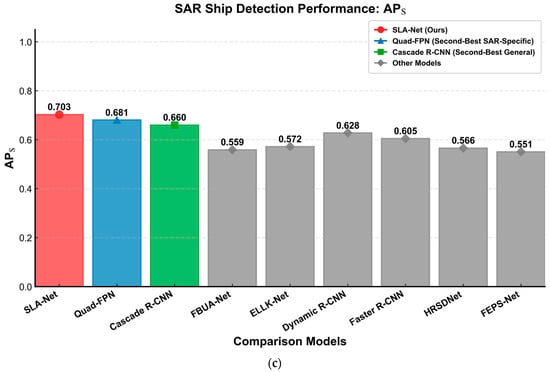
Figure 15.
Detection performance comparison of different models on the SSDD. (a) mAP; (b) AP75; (c) APS.
- SLA-Net achieved a mAP score of 0.708, ranking first among all comparison models. Compared to the SAR-specific model Quad-FPN (mAP 0.681), it shows an improvement of 2.7 percentage points, and compared to the best-performing general object detection model Cascade R-CNN (mAP 0.668), it improves by 4 percentage points. This indicates that SLA-Net achieves the best overall performance across a range of IoU thresholds, which can be attributed to the SLA Hierarchical Attention mechanism which injects prior knowledge (i.e., sea–land segmentation information) and effectively forces the network’s attention on valuable regions (i.e., sea regions and ship regions).
- SLA-Net maintains the highest score of 0.843 on the AP75 metric, which reflects strict localization requirements, outperforming the SAR-specific model Quad-FPN (AP75 0.812) by 3.1 percentage points and the general-purpose detection model Cascade R-CNN (AP75 0.799) by 4.4 percentage points. This advantage holds substantial practical significance: due to the spatial resolution characteristics of SAR imaging (ranging from 1 to 10 m), even minor pixel-level deviations (e.g., 3–5 pixels) can translate into several to tens of meters of localization errors in real-world scenarios. Notably, in comparison with AP50, AP75 (IoU = 0.75) imposes more stringent overlap requirements between predicted and ground-truth bounding boxes, making it a more accurate indicator of a model’s localization precision in practical applications. In critical scenarios such as maritime rescue (requiring precise localization of distressed vessels), marine traffic monitoring (to prevent misjudged collision risks), and smuggling vessel inspection (accurate identification of target routes), SLA-Net’s superior AP75 performance can significantly reduce task failures caused by localization errors.
- In the SSDD dataset, small-sized ships account for over 70% [4], and in SAR images, ships typically occupy only a few dozen to several hundred pixels. Therefore, the ability to detect small objects is a critical evaluation metric for SAR ship detection models. SLA-Net exhibits notable superiority in addressing this challenge, achieving an APS score of 0.703. This performance surpasses the SAR-specific model Quad-FPN (APS 0.681) by 2.2 percentage points and the general-purpose detection model Cascade R-CNN (APS 0.660) by 4.3 percentage points. This advantage arises from the SLA Hierarchical Attention mechanism, which progressively guides the network’s focus across successive stages—from broader sea areas to ship regions, and ultimately to small-scale vessels. This hierarchical guidance enhances the semantic richness and receptive field of lower-level features, effectively mitigating issues such as feature blurring and insufficient information in small object detection.
Additionally, Figure 16 illustrates the precision–recall (P-R) curves of our SLA-Net, the second-best SAR-specific detector (Quad FPN), and the second-best general detector (Cascade) on the SSDD dataset under an IoU threshold of 75%. It is evident that the curve of SLA-Net consistently stays at the upper-rightmost position in the graph, visually indicating that SLA-Net achieves the largest P-R integral and the highest AP75.
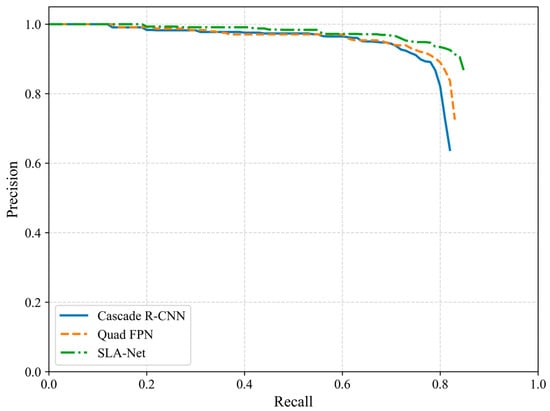
Figure 16.
P-R curves on SSDD under IoU threshold of 75%.
To fully illustrate the excellent network convergence of our method, Figure 17 shows the training loss curve of SLA-Net during the training process. It can be observed that on the SSDD dataset, as the number of training epochs increases, the loss curve continuously decreases and eventually stabilizes—notably, our SLA-Net converges after approximately 11 epochs. Thus, Figure 17 clearly verifies the good network convergence performance of SLA-Net.
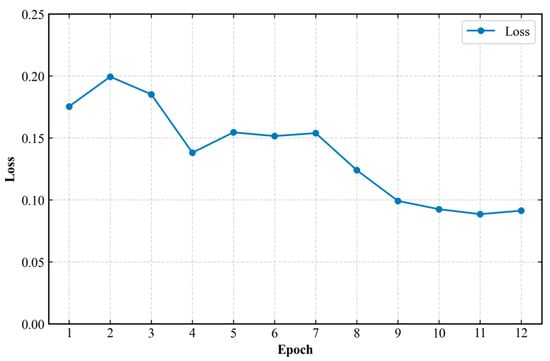
Figure 17.
Loss curve of SLA-Net on SSDD.
Furthermore, Table 6 quantifies and compares the differences in model complexity (i.e., parameter scale and GFLOPs) and inference efficiency (i.e., FPS) among various detection methods. The parameters and FPS of [53,74,75] are not listed since they are not provided in the original paper. The detailed analysis is as follows:
Table 6.
Comparison of parameter scale, computational complexity, and inference speed among various detection methods. Bold indicates the best performance.
Within the category of general detectors, Dynamic R-CNN is relatively lightweight, with 43.6 million parameters and 51.7 GFLOPs, achieving the highest FPS of 23.1. However, its detection accuracy is limited. In contrast, Cascade R-CNN, with 76.1 million parameters and 79.5 GFLOPs, runs at 14.4 FPS. Despite its increased model size and reduced speed, it delivers better detection accuracy. Among SAR-specific detectors, LFer-Net stands out as a lightweight model, with only 0.6 million parameters and 1.9 GFLOPs, while achieving the highest FPS of 144. Nevertheless, its detection performance is limited under high-precision evaluation metrics (i.e., AP75). Quad-FPN is ranked as the second-best SAR-specific detector in overall detection performance and has the largest number of parameters.
Admittedly, due to the CFAR-based mechanism in SLA Ship-Attention FPN, SLA-Net sacrifices speed. Additionally, as it is based on the Cascade R-CNN framework, it carries a considerable parameter load. Nevertheless, SLA-Net achieves significant improvements under strict evaluation conditions (i.e., AP75). This capability is especially vital for tasks requiring precise localization, such as maritime rescue, traffic management, and the inspection of smuggling vessels. Importantly, FPS performance is not a primary concern in this context—since detection time accounts for only a small fraction compared to SAR image formation and data transmission, a slight increase in detection time is acceptable. In future work, we will focus on reducing its parameter count and inference time.
5.4.2. Qualitative Comparative Results
Due to limited pages, we present qualitative visual comparison results between our SLA-Net and its two closest competitors: the second-best object detection model (Cascade R-CNN) and the second-best SAR ship detection model (Quad-FPN). Due to ship detection on inshore scenes being more challenging [4], we selected three representative inshore image slices. Furthermore, since detecting small ships is more difficult than large ships due to limited spatial information [76], we also selected an image slice containing a high density of small ships and an image slice containing two close small ships. From Figure 18, key conclusions can be drawn as follows:

Figure 18.
Qualitative results on SSDD. (a) Ground truth; (b) Cascade R-CNN; (c) Quad-FPN; (d) SLA-Net. In this figure, a red ellipse indicates a false alarm and a white ellipse signals a missed detection. The colored bounding boxes represent the detection results of different models—green in the first row denotes the ground truth, yellow in the second row shows the Cascade R-CNN detection results, purple in the third row reflects the Quad-FPN detection results, and blue in the fourth row corresponds to the SLA-Net detection results. A score threshold of 0.5 is applied for display. For the best visualization, please zoom in.
- In inshore scenes (Columns 1, 2 and 4 of Figure 18), SLA-Net exhibits superior detection performance compared to the second-best general object detection model (Cascade R-CNN) and the second-best SAR ship detection model (Quad-FPN). For instance, in a typical port scene shown in the first column, land-based facilities such as container cranes and forklifts introduce significant interference in SAR ship detection. Despite this, SLA-Net maintains excellent detection capability, whereas other methods generate additional false alarms in land regions. SLA-Net also demonstrates superior detection performance in the other inshore scenes. For instance, as shown in the second and fourth columns, the presence of inshore buildings and ship-like reefs significantly challenges the false alarm suppression capability of detectors. In fact, all other models except our SLA-Net generate additional false alarms. The excellent inshore detection performance is primarily attributed to the SLA Sea-Attention Backbone and SLA Ship-Attention Detection Heads, which enhance the network’s attention to maritime regions, strengthen features relevant to ship detection, suppress attention to land areas, and reduce the irrelevant features.
- In offshore scenes (Columns 3 and 5 of Figure 18), SLA-Net exhibits superior detection performance compared to the second-best general object detection model (Cascade R-CNN) and the second-best SAR ship detection model (Quad-FPN). Although the offshore background is relatively simpler than the inshore environment (with no complex land-based interference such as coastal buildings or container facilities). The detection of high-density small offshore ships still poses a major challenge to detectors—these small ships occupy only a few dozen pixels in SAR images, resulting in extremely sparse feature information and weak feature responses, which easily lead to missed detections. For instance, in the offshore scene shown in the third column, where a high density of small ships is distributed, Cascade R-CNN and Quad-FPN both fail to fully capture the feature information of small targets: Cascade R-CNN misses 3 small ships due to insufficient enhancement of low-level features, while Quad-FPN, despite its improved performance on multiscale targets, still results in 1 missed detection. In contrast, SLA-Net achieves complete detection of all small offshore ships without any missing cases. In the other offshore scene as shown in the 5th column, where two close small ships exhibit a geometric shape similar to that of a single large ship, this challenges the model’s ability to achieve clear localization of small ships. In fact, except for SLA-Net, both Quad-FPN and Cascade R-CNN generate a false alarm—specifically, they incorrectly detected the two adjacent small ships as a single large vessel. SLA-Net’s outstanding offshore detection performance is primarily attributed to the SLA Ship-Attention FPN, which guides the network’s attention to ship regions via the SA Path and enhances bottom-level features via the SSA Path.
5.4.3. Qualitative Generalization Results
To further demonstrate the persuasiveness of our method, we conducted a generalization test using the HRSID [53] and LS-SSDD [55] datasets. It should be noted that since SLA-Net relies on land–sea segmentation prior, we performed informal land–sea segmentation annotation on the involved data. Moreover, considering the substantial workload of annotation, only a small portion of representative samples was annotated in this experiment to verify the adaptability of the method in unseen scenarios and its advantages.
Figure 19 presents the qualitative generalization results. Among them, the first three rows of data belong to the HRSID dataset, while the last two rows belong to the LS-SSDD dataset. It can be observed that driven by scene priors and Hierarchical Attention, SLA-Net can function effectively in various SAR ship scenarios. For instance, in the results of the first row, SLA-Net has no false alarms on land, whereas the second-best general detector (Cascade R-CNN) and the second-best SAR ship detector (Quad FPN) have two false alarms. In addition, all detectors have one missed detection in the upper-right region of this sample, which may be attributed to the differences in ship sample features between the SSDD dataset and HRSID. In the second row of data, both Cascade R-CNN and Quad FPN have false alarms near the shore, while SLA-Net does not. In the third row of data, Cascade R-CNN and Quad FPN both have numerous false alarms on land and one missed detection of a near-shore ship. In contrast, SLA-Net has no false alarms and can detect the near-shore ship, which benefits from the SLA Hierarchical Attention mechanism of SLA-Net that guides the network to focus on valuable regions.
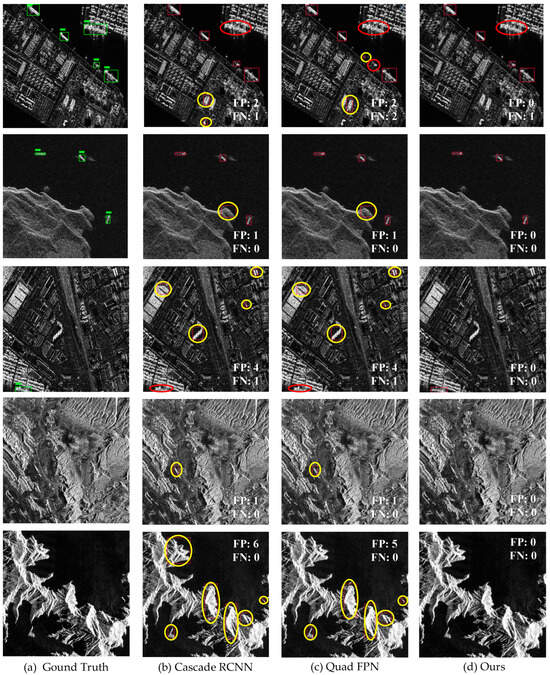
Figure 19.
Qualitative generalization results on HRSID and LS-SSDD. (a) Ground truth; (b) Cascade R-CNN; (c) Quad-FPN; (d) SLA-Net. In this figure, a yellow ellipse indicates a false alarm and a red ellipse signals a missed detection. The colored bounding boxes represent the detection results of different models—green in the first column denotes the ground truth, and red in the other column shows the detection result.
In the fourth and fifth rows of data, Cascade R-CNN and Quad FPN both have many false alarms, while SLA-Net does not. This is due to the SLA Filtering Strategy employed by SLA-Net during inference, which avoids meaningless false alarms on land. Furthermore, this experiment also reveals that in the real scenarios of SAR ship detections, there are often many false alarms on land, especially in pure background images [55]. Such false alarms can be well eliminated when land–sea segmentation information is available, and they should be regarded as easy negative samples under the assumption that sea–land segmentation information is known. However, most methods neglected the assumption or treat negative samples [77] in land and sea regions equally, which may limit the further improvement of SAR ship detection accuracy. A possible reason is the lack of auxiliary sea–land segmentation information in SAR ship detection datasets. Therefore, the SL-SSDD proposed in this paper is necessary and can be used to assist future research in SAR ship detection.
6. Discussion
Most of the existing DL-based SAR ship detection methods do not fully become aware of the differences between sea region and land region. To address this, we propose SLA-Net, which can be aware of the differences between the two regions and focus on valuable regions. Unlike conventional spatial and channel attention mechanisms, our SLA Hierarchical Attention mechanism is specifically tailored for SAR ship detection, leveraging sea–land priors to guide network’s attention. The quantitative experiment results in Table 5 demonstrate that SLA-Net achieved superior detection performance on SSDD. Specifically, SLA-Net achieves the highest mAP score of 0.708, the highest AP75 score of 0.843, and the highest APS score of 0.703, representing a substantial improvement compared with other methods. In addition, we conducted ablation studies to assess the contribution of each module, completed some data annotations for the HRSID and LS-SSDD datasets, and conducted generalization experiments. These results not only confirmed the effectiveness of each component in SLA-Net but also demonstrated its outstanding object detection performance.
These above improvements are primarily attributed to the SLA Hierarchical Attention mechanism within SLA-Net. This mechanism is designed to progressively guide the network’s focus from sea regions to ship regions in a coarse-to-fine manner. By leveraging sea–land segmentation priors, the process begins with sea attention, implemented via the SLA Sea-Attention Backbone, to establish coarse spatial focus. Subsequently, ship attention is applied through the SLA Ship-Attention FPN and SLA Ship-Attention Detection Heads to achieve fine-grained spatial refinement. This Hierarchical Attention strategy explicitly enhances features in valuable regions (i.e., sea and ship areas) while implicitly enabling the network to distinguish between sea and land regions, thereby improving the accuracy of ship detection. Moreover, this paper introduces SL-SSDD as a synergistic sea–land segmentation dataset for ship detection, built upon the classic SSDD, to address the lack of sea–land priors within the DL-based SAR ship detection community.
Notably, the SSDD dataset contains very few inshore scenes, which limits its capacity to fully showcase the advantages of the SLA Filtering Strategy. To address this, we conducted generalization experiments on the HRSID and LS-SSDD datasets. The results demonstrate that our SLA Filter effectively suppresses a substantial number of false alarms in land.
In our future work, we will focus on the following aspects:
- We will focus on further reducing SLA-Net’s parameter count and inference time.
- We will explore the instantiation of the SLA Hierarchical Attention mechanism based on the oriented bounding boxes paradigm.
- In our experiments, we found that most SAR ship detection datasets lack sea–land segmentation annotations, which may hinder further improvements in ship detection and related research. Hence, we will complete the sea–land segmentation annotations for the LS-SSDD dataset to provide more data for the DL-based SAR ship detection community, facilitating method comparison and further research.
7. Conclusions
In this paper, we propose SLA-Net to fully distinguish between sea and land regions, thereby achieving more accurate ship detection performance. Guided by the introduced SLA Hierarchical Attention mechanism, SLA-Net incorporates three key components (i.e., SLA Sea-Attention Backbone, SLA Ship-Attention FPN, and SLA Ship-Attention Detection Heads) to materialize this mechanism. It is capable of gradually guiding attention from sea regions to ship regions in a hierarchical, coarse-to-fine-grained manner. Furthermore, to address the lack of sea–land priors in the community focused on deep learning-based SAR ship detection, we introduced SL-SSDD. Built upon the well-established SAR ship detection dataset (SSDD), SL-SSDD serves as a synergistic dataset for ship detection by providing sea–land segmentation information to guide the detection process. Experimental results on SSDD and generalization results on HRSID and LS-SSDD demonstrate that SLA-Net achieves superior SAR ship detection performance compared with other competitive methods. Additionally, SL-SSDD is expected to offer a new perspective for the community working on DL-based SAR ship detection.
Author Contributions
Conceptualization, X.K. and H.K.; methodology, H.K. and X.K.; software, H.K.; validation, H.K.; formal analysis, H.K., Z.Z. and X.C.; investigation, H.K.; resources, H.K.; data curation, Z.Z. and X.C.; writing—original draft preparation, H.K. and X.K.; writing—review and editing, X.K., H.K. and T.Z.; visualization, H.K.; supervision, X.K. and X.X.; project administration, X.K.; funding acquisition, T.Z. All authors have read and agreed to the published version of the manuscript.
Funding
This research received no external funding.
Data Availability Statement
The original contributions presented in this study are included in the article. Further inquiries can be directed to the corresponding author(s).
Acknowledgments
The authors would like to thank the editors and anonymous reviewers for their valuable comments that greatly improved our manuscript.
Conflicts of Interest
The authors declare no conflicts of interest.
Abbreviations
The following abbreviations are used in this manuscript:
| AP | Average precision |
| CFAR | Constant false alarm rate |
| CNN | Convolutional neural network |
| DA | Double attention |
| DL | Deep learning |
| FPN | Feature pyramid network |
| IoU | Intersection over union |
| MA | Mask attention |
| MLP | Multi-layer perceptron |
| NMS | Non-maximum suppression |
| RPN | Region proposal network |
| PC | Personal computer |
| SA | Ship attention |
| SLA | Sea–land aware |
| SLS | Sea–land segmentation |
| SOTA | State-of-the-art |
| SSDD | Synthetic aperture radar ship detection dataset |
| SSA | Small ship attention |
References
- Asiyabi, R.M.; Ghorbanian, A.; Tameh, S.N.; Amani, M.; Jin, S.; Mohammadzadeh, A. Synthetic aperture radar (SAR) for ocean: A review. IEEE J. Sel. Top. Appl. Earth Obs. Remote Sens. 2023, 16, 9106–9138. [Google Scholar] [CrossRef]
- Arii, M.; Koiwa, M.; Aoki, Y. Applicability of SAR to marine debris surveillance after the Great East Japan Earthquake. IEEE J. Sel. Top. Appl. Earth Obs. Remote Sens. 2014, 7, 1729–1744. [Google Scholar] [CrossRef]
- Tomiyasu, K. Tutorial review of synthetic-aperture radar (SAR) with applications to imaging of the ocean surface. Proc. IEEE 2005, 66, 563–583. [Google Scholar] [CrossRef]
- Zhang, T.; Zhang, X.; Li, J.; Xu, X.; Wang, B.; Zhan, X.; Xu, Y.; Ke, X.; Zeng, T.; Su, H. SAR ship detection dataset (SSDD): Official release and comprehensive data analysis. Remote Sens. 2021, 13, 3690. [Google Scholar] [CrossRef]
- Zhang, T.; Zhang, X. High-speed ship detection in SAR images based on a grid convolutional neural network. Remote Sens. 2019, 11, 1206. [Google Scholar] [CrossRef]
- Galdelli, A.; Mancini, A.; Ferrà, C.; Tassetti, A.N. A synergic integration of AIS data and SAR imagery to monitor fisheries and detect suspicious activities. Sensors 2021, 21, 2756. [Google Scholar] [CrossRef]
- Chen, Z.; Chen, D.; Zhang, Y.; Cheng, X.; Zhang, M.; Wu, C. Deep learning for autonomous ship-oriented small ship detection. Saf. Sci. 2020, 130, 104812. [Google Scholar] [CrossRef]
- Li, J.; Xu, C.; Su, H.; Gao, L.; Wang, T. Deep learning for SAR ship detection: Past, present and future. Remote Sens. 2022, 14, 2712. [Google Scholar] [CrossRef]
- Chang, Y.-L.; Anagaw, A.; Chang, L.; Wang, Y.C.; Hsiao, C.-Y.; Lee, W.-H. Ship detection based on YOLOv2 for SAR imagery. Remote Sens. 2019, 11, 786. [Google Scholar] [CrossRef]
- Zhang, T.; Zhang, X.; Ke, X. Quad-FPN: A novel quad feature pyramid network for SAR ship detection. Remote Sens. 2021, 13, 2771. [Google Scholar] [CrossRef]
- Du, Y.; Du, L.; Guo, Y.; Shi, Y. Semisupervised SAR ship detection network via scene characteristic learning. IEEE Trans. Geosci. Remote Sens. 2023, 61, 5201517. [Google Scholar] [CrossRef]
- Guan, T.; Chang, S.; Wang, C.; Jia, X. SAR Small Ship Detection Based on Enhanced YOLO Network. Remote Sens. 2025, 17, 839. [Google Scholar] [CrossRef]
- Chen, J.; Chen, K.; Chen, H.; Zou, Z.; Shi, Z. A degraded reconstruction enhancement-based method for tiny ship detection in remote sensing images with a new large-scale dataset. IEEE Trans. Geosci. Remote Sens. 2022, 60, 5625014. [Google Scholar] [CrossRef]
- Bezerra, D.X.; Lorenzzetti, J.A.; Paes, R.L. Marine environmental impact on CFAR ship detection as measured by wave age in SAR images. Remote Sens. 2023, 15, 3441. [Google Scholar] [CrossRef]
- Yang, M.; Guo, C.; Zhong, H.; Yin, H. A curvature-based saliency method for ship detection in SAR images. IEEE Geosci. Remote Sens. Lett. 2020, 18, 1590–1594. [Google Scholar] [CrossRef]
- Lin, H.; Chen, H.; Jin, K.; Zeng, L.; Yang, J. Ship detection with superpixel-level Fisher vector in high-resolution SAR images. IEEE Geosci. Remote Sens. Lett. 2019, 17, 247–251. [Google Scholar] [CrossRef]
- Schwegmann, C.P.; Kleynhans, W.; Salmon, B.P. Synthetic aperture radar ship detection using Haar-like features. IEEE Geosci. Remote Sens. Lett. 2016, 14, 154–158. [Google Scholar] [CrossRef]
- Zhang, T.; Zhang, X.; Ke, X.; Liu, C.; Xu, X.; Zhan, X.; Wang, C.; Ahmad, I.; Zhou, Y.; Pan, D. HOG-ShipCLSNet: A novel deep learning network with hog feature fusion for SAR ship classification. IEEE Trans. Geosci. Remote Sens. 2021, 60, 5210322. [Google Scholar] [CrossRef]
- Ke, X.; Zhang, X.; Zhang, T.; Shi, J.; Wei, S. SAR ship detection based on an improved faster R-CNN using deformable convolution. In Proceedings of the 2021 IEEE International Geoscience and Remote Sensing Symposium IGARSS, Brussels, Belgium, 11–16 July 2021. [Google Scholar]
- Qin, C.; Zhang, L.; Wang, X.; Li, G.; He, Y.; Liu, Y. RDB-DINO: An Improved End-to-End Transformer With Refined De-Noising and Boxes for Small-Scale Ship Detection in SAR Images. IEEE Trans. Geosci. Remote Sens. 2024, 63, 5200517. [Google Scholar] [CrossRef]
- Sun, Z.; Leng, X.; Zhang, X.; Zhou, Z.; Xiong, B.; Ji, K.; Kuang, G. Arbitrary-direction SAR ship detection method for multi-scale imbalance. IEEE Trans. Geosci. Remote Sens. 2025, 63, 5208921. [Google Scholar] [CrossRef]
- Fang, M.; Gu, Y.; Peng, D. FEVT-SAR: Multi-category Oriented SAR Ship Detection Based on Feature Enhancement Vision Transformer. IEEE J. Sel. Top. Appl. Earth Obs. Remote Sens. 2024, 18, 2704–2717. [Google Scholar] [CrossRef]
- Yasir, M.; Liu, S.; Mingming, X.; Wan, J.; Pirasteh, S.; Dang, K.B. ShipGeoNet: SAR image-based geometric feature extraction of ships using convolutional neural networks. IEEE Trans. Geosci. Remote Sens. 2024, 62, 5202613. [Google Scholar] [CrossRef]
- Tang, X.; Zhang, J.; Xia, Y.; Xiao, H. DBW-YOLO: A high-precision SAR ship detection method for complex environments. IEEE J. Sel. Top. Appl. Earth Obs. Remote Sens. 2024, 17, 7029–7039. [Google Scholar] [CrossRef]
- Xu, C.; Zheng, X.; Lu, X. Multi-level alignment network for cross-domain ship detection. Remote Sens. 2022, 14, 2389. [Google Scholar] [CrossRef]
- Gao, G.; Wang, M.; Zhou, P.; Yao, L.; Zhang, X.; Li, H.; Li, G. A multi-branch embedding network with Bi-classifier for few-shot ship classification of SAR images. IEEE Trans. Geosci. Remote Sens. 2024, 63, 5201515. [Google Scholar]
- Gao, G.; Wang, Y.; Chen, Y.; Yang, G.; Yao, L.; Zhang, X.; Li, H.; Li, G. An oriented ship detection method of remote sensing image with contextual global attention mechanism and lightweight task-specific context decoupling. IEEE Trans. Geosci. Remote Sens. 2024, 63, 4200918. [Google Scholar] [CrossRef]
- Gao, G.; He, Y.; Zhao, J.; Li, S.; Wang, M.; Yang, G.; Zhang, X. FDC-TA-DSN ship classification model and dataset construction based on complex-valued SAR. IEEE J. Sel. Top. Appl. Earth Obs. Remote Sens. 2025, 18, 7034–7047. [Google Scholar] [CrossRef]
- Zhang, T.; Zhang, X.; Shi, J.; Wei, S. HyperLi-Net: A hyper-light deep learning network for high-accurate and high-speed ship detection from synthetic aperture radar imagery. ISPRS J. Photogramm. Remote Sens. 2020, 167, 123–153. [Google Scholar] [CrossRef]
- Zhang, T.; Zhang, X.; Liu, C.; Shi, J.; Wei, S.; Ahmad, I.; Zhan, X.; Zhou, Y.; Pan, D.; Li, J. Balance learning for ship detection from synthetic aperture radar remote sensing imagery. ISPRS J. Photogramm. Remote Sens. 2021, 182, 190–207. [Google Scholar] [CrossRef]
- Zhang, T.; Zhang, X. A polarization fusion network with geometric feature embedding for SAR ship classification. Pattern Recognit. 2022, 123, 108365. [Google Scholar] [CrossRef]
- Song, G.; Deng, Y.; Zhang, H.; Liu, X.; Chang, S. Improving SAR Ship Detection Accuracy by Optimizing Polarization Modes: A Study of Generalized Compact Polarimetry (GCP) Performance. Remote Sens. 2025, 17, 1951. [Google Scholar] [CrossRef]
- Zhang, T.; Zhang, X.; Shi, J.; Wei, S. Depthwise separable convolution neural network for high-speed SAR ship detection. Remote Sens. 2019, 11, 2483. [Google Scholar] [CrossRef]
- Ke, X.; Zhang, X.; Zhang, T. GCBANET: A global context boundary-aware network for SAR ship instance segmentation. Remote Sens. 2022, 14, 2165. [Google Scholar] [CrossRef]
- Qian, L.; Hu, J.; Ren, H.; Lin, J.; Luo, X.; Zou, L.; Zhou, Y. Cross-Level Adaptive Feature Aggregation Network for Arbitrary-Oriented SAR Ship Detection. Remote Sens. 2025, 17, 1770. [Google Scholar] [CrossRef]
- Ke, X.; Zhang, X.; Zhang, T.; Shi, J.; Wei, S. Sar ship detection based on swin transformer and feature enhancement feature pyramid network. In Proceedings of the IGARSS 2022-2022 IEEE International Geoscience and Remote Sensing Symposium, Kuala Lumpur, Malaysia, 17–22 July 2022. [Google Scholar]
- Ma, W.; Yang, X.; Zhu, H.; Wang, X.; Yi, X.; Wu, Y.; Hou, B.; Jiao, L. NRENet: Neighborhood removal-and-emphasis network for ship detection in SAR Images. Int. J. Appl. Earth Obs. Geoinf. 2024, 131, 103927. [Google Scholar] [CrossRef]
- Ren, X.; Zhou, P.; Fan, X.; Feng, C.; Li, P. LPFFNet: Lightweight Prior Feature Fusion Network for SAR Ship Detection. Remote Sens. 2025, 17, 1698. [Google Scholar] [CrossRef]
- Bai, L.; Yao, C.; Ye, Z.; Xue, D.; Lin, X.; Hui, M. Feature enhancement pyramid and shallow feature reconstruction network for SAR ship detection. IEEE J. Sel. Top. Appl. Earth Obs. Remote Sens. 2023, 16, 1042–1056. [Google Scholar] [CrossRef]
- Chen, Y.; Chen, J.; Sun, L.; Wu, B.; Xu, H. AJANet: SAR Ship Detection Network Based on Adaptive Channel Attention and Large Separable Kernel Adaptation. Remote Sens. 2025, 17, 1745. [Google Scholar] [CrossRef]
- Gao, G.; Bai, Q.; Zhang, C.; Zhang, L.; Yao, L. Dualistic cascade convolutional neural network dedicated to fully PolSAR image ship detection. ISPRS J. Photogramm. Remote Sens. 2023, 202, 663–681. [Google Scholar] [CrossRef]
- Cai, P.; Liu, B.; Wang, P.; Liu, P.; Yuan, Y.; Li, X.; Chen, P.; Li, Y. SDFSD-v1. 0: A Sub-Meter SAR Dataset for Fine-Grained Ship Detection. Remote Sens. 2024, 16, 3952. [Google Scholar] [CrossRef]
- Lei, S.; Lu, D.; Qiu, X.; Ding, C. SRSDD-v1. 0: A high-resolution SAR rotation ship detection dataset. Remote Sens. 2021, 13, 5104. [Google Scholar] [CrossRef]
- Pan, Z.; Yang, R.; Zhang, Z. MSR2N: Multi-stage rotational region based network for arbitrary-oriented ship detection in SAR images. Sensors 2020, 20, 2340. [Google Scholar] [CrossRef]
- Chen, C.; He, C.; Hu, C.; Pei, H.; Jiao, L. MSARN: A deep neural network based on an adaptive recalibration mechanism for multiscale and arbitrary-oriented SAR ship detection. IEEE Access 2019, 7, 159262–159283. [Google Scholar] [CrossRef]
- Yang, R.; Pan, Z.; Jia, X.; Zhang, L.; Deng, Y. A novel CNN-based detector for ship detection based on rotatable bounding box in SAR images. IEEE J. Sel. Top. Appl. Earth Obs. Remote Sens. 2021, 14, 1938–1958. [Google Scholar] [CrossRef]
- Zhang, C.; Gao, G.; Liu, J.; Duan, D. Oriented ship detection based on soft thresholding and context information in SAR images of complex scenes. IEEE Trans. Geosci. Remote Sens. 2023, 62, 5200615. [Google Scholar] [CrossRef]
- Torres, R.; Snoeij, P.; Geudtner, D.; Bibby, D.; Davidson, M.; Attema, E.; Potin, P.; Rommen, B.; Floury, N.; Brown, M. GMES Sentinel-1 mission. Remote Sens. Environ. 2012, 120, 9–24. [Google Scholar] [CrossRef]
- Filipponi, F. Sentinel-1 GRD preprocessing workflow. Proceedings 2019, 18, 11. [Google Scholar] [CrossRef]
- Grover, A.; Kumar, S.; Kumar, A. Ship detection using Sentinel-1 SAR data. ISPRS Ann. Photogramm. Remote Sens. Spat. Inf. Sci. 2018, 4, 317–324. [Google Scholar] [CrossRef]
- Sun, X.; Wang, Z.; Sun, Y.; Dia, W.; Zhang, Y.; Fu, K. AIR-SARShip-1.0: High-resolution SAR ship detection dataset. J. Radars 2019, 8, 852–863. [Google Scholar]
- Wang, Y.; Wang, C.; Zhang, H.; Dong, Y.; Wei, S. A SAR dataset of ship detection for deep learning under complex backgrounds. Remote Sens. 2019, 11, 765. [Google Scholar] [CrossRef]
- Wei, S.; Zeng, X.; Qu, Q.; Wang, M.; Su, H.; Shi, J. HRSID: A high-resolution SAR images dataset for ship detection and instance segmentation. IEEE Access 2020, 8, 120234–120254. [Google Scholar] [CrossRef]
- Tan, X.; Leng, X.; Ji, K.; Kuang, G. RCShip: A dataset dedicated to ship detection in range-compressed SAR data. IEEE Geosci. Remote Sens. Lett. 2024, 21, 4004805. [Google Scholar] [CrossRef]
- Zhang, T.; Zhang, X.; Ke, X.; Zhan, X.; Shi, J.; Wei, S.; Pan, D.; Li, J.; Su, H.; Zhou, Y. LS-SSDD-v1. 0: A deep learning dataset dedicated to small ship detection from large-scale Sentinel-1 SAR images. Remote Sens. 2020, 12, 2997. [Google Scholar] [CrossRef]
- The European Space Agency. Object Detection. Available online: https://step.esa.int/main/wp-content/help/versions/9.0.0/snap-toolboxes/org.esa.s1tbx.s1tbx.op.feature.extraction.ui/operators/ObjectDetection.html (accessed on 15 October 2025).
- Liu, Y.; Zhang, M.-h.; Xu, P.; Guo, Z.-w. SAR ship detection using sea-land segmentation-based convolutional neural network. In Proceedings of the 2017 International Workshop on Remote Sensing with Intelligent Processing (RSIP), Shanghai, China, 18–21 May 2017. [Google Scholar]
- Yu, H.; Yan, K.; Li, C.; Wang, L.; Li, T. Light-Weight Synthetic Aperture Radar Image Saliency Enhancement Method Based on Sea–Land Segmentation Preference. Remote Sens. 2025, 17, 795. [Google Scholar] [CrossRef]
- Zhou, Y.; Zhang, F.; Ma, F.; Xiang, D.; Zhang, F. Small vessel detection based on adaptive dual-polarimetric feature fusion and sea–land segmentation in SAR images. IEEE J. Sel. Top. Appl. Earth Obs. Remote Sens. 2022, 15, 2519–2534. [Google Scholar] [CrossRef]
- Guo, Y.; Zhou, L. MEA-Net: A lightweight SAR ship detection model for imbalanced datasets. Remote Sens. 2022, 14, 4438. [Google Scholar] [CrossRef]
- Cai, Z.; Vasconcelos, N. Cascade r-cnn: Delving into high quality object detection. In Proceedings of the IEEE Conference on Computer Vision and Pattern Recognition, Salt Lake City, UT, USA, 18–23 June 2018. [Google Scholar]
- He, K.; Zhang, X.; Ren, S.; Sun, J. Deep residual learning for image recognition. In Proceedings of the IEEE Conference on Computer Vision and Pattern Recognition, Las Vegas, NV, USA, 27–30 June 2016. [Google Scholar]
- Glorot, X.; Bengio, Y. Understanding the difficulty of training deep feedforward neural networks. In Proceedings of the Thirteenth International Conference on Artificial Intelligence and Statistics, Sardinia, Italy, 13–15 May 2010. JMLR Workshop and Conference Proceedings. [Google Scholar]
- Liu, S.; Qi, L.; Qin, H.; Shi, J.; Jia, J. Path aggregation network for instance segmentation. In Proceedings of the IEEE Conference on Computer Vision and Pattern Recognition, Salt Lake City, UT, USA, 18–23 June 2018. [Google Scholar]
- Li, J.; Dong, Y.; Liu, N.; Huang, Y.; Jiang, X.; Sun, J. A Novel Copula-Based Multi-Feature CFAR Framework for Radar Target Detection. Remote Sens. 2025, 17, 2299. [Google Scholar] [CrossRef]
- Wang, J.; Chen, K.; Xu, R.; Liu, Z.; Loy, C.C.; Lin, D. Carafe: Content-aware reassembly of features. In Proceedings of the IEEE/CVF International Conference on Computer Vision, Seoul, Korea, 27 October–2 November 2019. [Google Scholar]
- Woo, S.; Park, J.; Lee, J.-Y.; Kweon, I.S. Cbam: Convolutional block attention module. In Proceedings of the European Conference on Computer Vision (ECCV), Munich, Germany, 8–14 September 2018. [Google Scholar]
- Russell, B.C.; Torralba, A.; Murphy, K.P.; Freeman, W.T. LabelMe: A database and web-based tool for image annotation. Int. J. Comput. Vis. 2008, 77, 157–173. [Google Scholar] [CrossRef]
- Ren, S.; He, K.; Girshick, R.; Sun, J. Faster R-CNN: Towards real-time object detection with region proposal networks. IEEE Trans. Pattern Anal. Mach. Intell. 2016, 39, 1137–1149. [Google Scholar] [CrossRef] [PubMed]
- Zhang, H.; Chang, H.; Ma, B.; Wang, N.; Chen, X. Dynamic R-CNN: Towards high quality object detection via dynamic training. In Proceedings of the European Conference on Computer Vision, Glasgow, UK, 23–28 August 2020. [Google Scholar]
- Bai, L.; Yao, C.; Ye, Z.; Xue, D.; Lin, X.; Hui, M. A novel anchor-free detector using global context-guide feature balance pyramid and united attention for SAR ship detection. IEEE Geosci. Remote Sens. Lett. 2023, 20, 4003005. [Google Scholar] [CrossRef]
- Tian, C.; Liu, D.; Xue, F.; Lv, Z.; Wu, X. Faster and lighter: A novel ship detector for SAR images. IEEE Geosci. Remote Sens. Lett. 2024, 21, 4002005. [Google Scholar] [CrossRef]
- Shen, J.; Bai, L.; Zhang, Y.; Momi, M.C.; Quan, S.; Ye, Z. ELLK-Net: An efficient lightweight large kernel network for SAR ship detection. IEEE Trans. Geosci. Remote Sens. 2024, 62, 5221514. [Google Scholar] [CrossRef]
- Chen, L.; Dou, X.; Peng, J.; Li, W.; Sun, B.; Li, H. EFCNet: Ensemble full convolutional network for semantic segmentation of high-resolution remote sensing images. IEEE Geosci. Remote Sens. Lett. 2021, 19, 8011705. [Google Scholar] [CrossRef]
- Zhang, Y.; Hao, L.-Y.; Li, Y. SD-YOLO: An Attention Mechanism Guided YOLO Network for Ship Detection. In Proceedings of the 2024 14th International Conference on Information Science and Technology (ICIST), Kopaonik, Serbia, 10–13 March 2024. [Google Scholar]
- Ke, X.; Zhang, T.; Shao, Z. Scale-aware dimension-wise attention network for small ship instance segmentation in synthetic aperture radar images. J. Appl. Remote Sens. 2023, 17, 046504. [Google Scholar] [CrossRef]
- Shrivastava, A.; Gupta, A.; Girshick, R. Training region-based object detectors with online hard example mining. In Proceedings of the IEEE Conference on Computer Vision and Pattern Recognition, Las Vegas, NV, USA, 27–30 June 2016. [Google Scholar]
Disclaimer/Publisher’s Note: The statements, opinions and data contained in all publications are solely those of the individual author(s) and contributor(s) and not of MDPI and/or the editor(s). MDPI and/or the editor(s) disclaim responsibility for any injury to people or property resulting from any ideas, methods, instructions or products referred to in the content. |
© 2025 by the authors. Licensee MDPI, Basel, Switzerland. This article is an open access article distributed under the terms and conditions of the Creative Commons Attribution (CC BY) license (https://creativecommons.org/licenses/by/4.0/).