Article

Developing Computer Vision-Based Digital Twin for Vegetation Management near Power Distribution Networks

1
Concordia Institute for Information Systems Engineering, Concordia University, Montréal, QC H3G 1M8, Canada
2
Department of Building, Civil and Environmental Engineering, Concordia University, Montréal, QC H3G 1M8, Canada
*
Author to whom correspondence should be addressed.
Remote Sens. 2025, 17(21), 3565; https://doi.org/10.3390/rs17213565
Submission received: 20 August 2025 / Revised: 15 October 2025 / Accepted: 24 October 2025 / Published: 28 October 2025
(This article belongs to the Section Environmental Remote Sensing)

Highlights

What are the main findings?
  • An optimized RandLA-Net model, refined through comprehensive sensitivity analysis on the Toronto-3D dataset, achieved 96.90% overall accuracy and IoU scores of 97.05% for vegetation, 88.09% for power lines, and 82.33% for poles in the full 9-class configuration, with an auxiliary 4-class model improving IoUs to 99.55% for vegetation, 88.79% for poles, and 87.18% for power lines.
  • The integrated framework, combining DBSCAN clustering, KDTree-based proximity detection, and digital twin development, enables precise vegetation encroachment risk assessment and a semantically enriched digital twin for power distribution networks.
What are the implications of the main findings?
  • The automated framework provides power utilities with an efficient alternative to manual inspections, enhancing proactive vegetation management to improve grid reliability and mitigate outage risks.
  • Integration of the digital twin into City Information Modeling systems supports data-driven urban infrastructure planning, predictive analytics for environmental changes, and collaborative decision-making across stakeholders.

Abstract

The maintenance of power distribution lines is critically challenged by vegetation encroachment, posing significant risks to the reliability and safety of power utilities. Traditional manual inspection methods are resource-intensive and lack the precision required for effective and proactive maintenance. This paper presents an automated, accurate, and efficient approach to vegetation management near power lines by leveraging advancements in LiDAR as a remote sensing technology and deep learning algorithms. The RandLA-Net model is employed for semantic segmentation of large-scale point clouds to accurately identify vegetation, poles, and power lines. A comprehensive sensitivity analysis is conducted to optimize the model’s hyperparameters, enhancing segmentation accuracy. Post-processing techniques, including clustering and rule-based thresholding, are applied to refine the semantic segmentation results. Proximity detection is applied using spatial queries based on a KDTree structure to assess potential risks of vegetation near power lines. Furthermore, a digital twin of the power distribution network and surrounding trees is developed by integrating 3D object registration and surface generation, enriching it with semantic attributes and incorporating it into City Information Modeling (CIM) systems. This framework demonstrates the potential of remote sensing data integration for efficient environmental monitoring in urban infrastructure. The results of the case study on the Toronto-3D dataset demonstrate the computational efficiency and accuracy of the proposed method, presenting a promising solution for power utilities in proactive vegetation management and infrastructure planning. The optimized full 9-class model achieved an overall accuracy of 96.90% and IoU scores of 97.05% for vegetation, 88.09% for power lines, and 82.33% for poles, supporting comprehensive digital twin creation. An auxiliary 4-class model further improved targeted performance, with IoUs of 99.55% for vegetation, 88.79% for poles, and 87.18% for power lines.

1. Introduction

Effective vegetation management plays a vital role in maintaining the safety and reliability of electrical power distribution networks. Overgrowth of vegetation in proximity to power lines can introduce substantial threats, including service disruptions, wildfires, and various safety concerns. Conventional approaches, which depend on manual surveys, are resource-heavy, inefficient in terms of time, and constrained by inconsistencies in precision and scheduling. Such methods often fail to address the escalating requirements for reliable energy supply and the imperative to reduce hazards from unchecked plant growth. As a result, there is an increasing demand for streamlined, automated strategies to enhance vegetation oversight.
Recent progress in sensing technologies, notably Light Detection and Ranging (LiDAR) systems, integrated with Machine Learning (ML) and Deep Learning (DL) techniques, has facilitated the emergence of Automated Vegetation Management (AVM) frameworks. These innovations enable more regular and precise surveillance, with the potential to transform practices in this domain [1]. Nevertheless, a key obstacle involves handling the extensive quantities of 3D point cloud data produced by LiDAR [2], particularly in the precise segmentation and classification of individual points to detect vegetation-induced hazards effectively. In contrast to traditional techniques that rely on visual assessments or two-dimensional imagery, point cloud datasets offer three-dimensional representations that support distance estimation and the identification of structural and environmental features. For instance, while photogrammetry may offer cost advantages for broad-area mapping, LiDAR’s superior penetration and precision make it preferable for vegetation management near power lines [3]. This capability provides a structured and trustworthy method for monitoring power lines, as evidenced by contemporary research on automated vegetation management systems and infrastructure inspections [4].
Unlike segmentation models, which provide valuable but static insights, a digital twin offers a dynamic and continuously updated virtual model of the physical network. This model integrates multiple data sources, including point clouds, satellite imagery, GIS data, and real-time weather information, to reflect current conditions with high fidelity [5,6]. One of the key advantages of the digital twin lies in its ability to simulate various scenarios that impact the power grid. While real-time proximity detection from images and point clouds effectively identifies immediate risks, it does not provide foresight into how those risks may evolve. The digital twin addresses this gap by predicting vegetation growth patterns using advanced machine learning and deep learning algorithms. It can forecast how environmental factors, such as seasonal changes and weather events, influence vegetation dynamics and, consequently, the proximity to power lines.
In contrast, digital twin technology offers an innovative paradigm for tackling these issues through the development of responsive virtual models that mirror vegetation and power distribution networks in real time. By merging real time data with sophisticated simulation and analysis tools, digital twins deliver multiple advantages, such as simulating the evolving characteristics of trees including their growth trajectories, structural shifts under stress, and reactions to external influences like wind [7,8]. This functionality is augmented by incorporating supplementary details, such as species and maturity level, which support forward looking and flexible management approaches. Furthermore, digital twins enhance the oversight of infrastructure assets, including utility poles and power lines, by embedding factors like material composition, lifespan, and operational status, thereby promoting thorough, evidence-based strategies for preservation.
Moreover, the digital twin enhances risk management by integrating predictive analytics with environmental modeling. It allows for the assessment of how adverse weather conditions, like storms or high winds, could exacerbate the risk of outages due to vegetation interference. By simulating the impact of different vegetation management strategies, such as varying pruning schedules or the application of growth inhibitors, the digital twin provides data-driven recommendations for preventive actions. This proactive approach enables maintenance teams to prioritize high-risk areas, optimize resource allocation, and reduce operational costs by minimizing unnecessary inspections.
In addition to operational efficiencies, the digital twin fosters improved collaboration across various departments within an organization. By serving as a centralized platform that offers an up-to-date representation of the network’s status, it ensures that teams involved in outage management, vegetation management, and maintenance planning are working with consistent information. This unified model enhances communication, facilitates coordinated decision-making, and aligns efforts toward common goals of reliability and resilience.
While creating and continuously updating a digital twin requires additional effort compared to existing tools, the benefits it offers justify the investment. Unlike static visualization platforms such as Google Earth, which cannot dynamically represent environmental changes or predict future states, the digital twin provides a comprehensive and interactive environment. It moves beyond visualization to become an essential tool for strategic planning and risk mitigation, offering capabilities that are not achievable with detection methods alone. This paper is an extension of our previous works [9,10], where we focused on accurately detecting vegetation and power lines from LiDAR data using deep learning and conducting detailed post-processing analysis to detect the proximity of trees and power lines. In this work, we further enhance the approach by conducting a comprehensive sensitivity analysis of the semantic segmentation model to optimize its performance. This sensitivity analysis was performed on the full 9-class model (with labels unclassified, road, road marking, natural, building, utility line, pole, car, and fence) to ensure comprehensive optimization for digital twin creation. In addition, a 4-class model (with labels unclassified, vegetation, poles, and power lines) was trained to compare and improve the performance of the model. Additionally, we develop a digital twin of the power distribution network by integrating 3D object registration and surface generation techniques, enriching it with semantic attributes, and incorporating it into City Information Modeling (CIM) systems. This integration supports more effective infrastructure management and proactive vegetation control strategies.
These enhancements introduce several technical and methodological challenges, including accurate semantic segmentation of dense urban point clouds hindered by class imbalance, overlapping features, and noise; balancing accuracy with computational efficiency across varied elements; transforming raw results into actionable insights via robust post-processing and spatial reasoning; and constructing a dynamic digital twin through complex 3D modeling, surface reconstruction, and semantic enrichment. This study addresses these challenges through targeted model optimization, a novel multi-step post-processing pipeline, and structured CIM-compatible digital twin development. The objectives of this paper are: (1) To accurately detect vegetation, poles, and power lines from LiDAR data using deep learning, specifically the Random Sampling in Large-scale Point Cloud Analysis Network (RandLA-Net) [11] model and conduct a sensitivity analysis to optimize the model’s hyperparameters. This includes sensitivity analysis on the full 9-class model and training an auxiliary 4-class model for targeted improvements. (2) To conduct detailed post-processing analysis, including clustering and rule-based thresholding, to refine the identification of vegetation risks near power lines using spatial queries based on a KDTree structure. (3) To develop a digital twin of the power distribution network by integrating the segmented and processed point cloud data, creating detailed 3D models of vegetation, poles, and power lines. (4) To integrate the semantic attributes into CIM systems, enhancing decision-making for urban infrastructure and vegetation management.
The primary contributions are threefold: (1) A comprehensive sensitivity analysis of RandLA-Net’s hyperparameters, optimized for urban point cloud semantic segmentation; (2) An integrated post-processing framework combining clustering with rule-based thresholding and proximity detection, enabling precise vegetation encroachment risk identification with improved efficiency and accuracy over traditional methods; and (3) A digital twin for power distribution networks that incorporates 3D object registration, surface generation, and semantic attribution such as tree height and canopy spread, integrated into CIM systems for dynamic, interactive predictive analytics and collaborative decision making, representing a significant advancement over static models. The structure of this paper is organized as follows. Section 2 provides a review of related work. Section 3 describes the proposed framework. Section 4 presents the implementation of the framework. Section 5 discusses findings and future directions, while Section 6 concludes the paper and outlines potential areas for further research.

2. Literature Review

This section offers a focused literature review tied to the study’s four key objectives. It covers: (1) semantic segmentation of LiDAR point clouds and proximity detection via traditional and deep learning techniques; (2) clustering and spatial analysis methods for urban objects to enable rule-based thresholding and spatial querying; and (3) digital twin development and semantic attribution from point cloud data to guide modeling and CIM (City Information Modeling) integration in the framework.

2.1. Traditional ML Approaches

To contextualize the first research objective, this subsection reviews traditional machine learning techniques for classifying vegetation and power infrastructure in LiDAR and multispectral data. While deep learning has advanced object detection, traditional ML remains vital for limited-resource or hybrid systems, enabling fast data processing in automated vegetation management (AVM). Kyuroson et al. [12] developed an autonomous point cloud segmentation system for power line inspections in smart grids. Li et al. [13] used ML to classify tree species along transmission corridors for management planning. Mohd Rapheal et al. [14] evaluated ML-based geospatial techniques for classifying electrical infrastructure from dense mobile laser scanning data, achieving 65% accuracy for overhead power lines and 63% for utility poles. Mahoney et al. [15] classified and mapped low-statured shrubland in post-agricultural landscapes. Abongo et al. [16] proposed a framework combining ML (XGBoost) and geometric techniques for power line identification. Wang et al. [17] studied machine vision for vegetation detection, while Liakos et al. [18] reviewed ML applications in crop vegetation.

2.2. Deep Learning Approaches

In line with the first objective, this subsection examines deep learning-based semantic segmentation models for vegetation and utility structure detection in urban and rural environments, enhancing reliability in power systems. Haroun et al. [19] assessed ML and DL for vegetation encroachment detection. Park et al. [20] used enhanced CNNs (AlexNet, ResNet18, VGG11) on Google Street View (v2021) images for utility and vegetation classification to prioritize management. Oehmcke et al. [21] applied DL models (MSENet14, KPConv, PointNet) for wood volume and biomass estimation, outperforming traditional methods. Bahreini et al. [9] integrated RandLA-Net for LiDAR semantic segmentation and post-processing in urban vegetation management, improving accuracy and efficiency for tree-power line proximity detection. Ozcanli et al. [22] discussed DL applications in power systems, including tree proximity detection. Singh et al. [23] reviewed AI and DL for tree detection from UAV imagery, applicable to power line management. Khodayar et al. [24] explored DL impacts on vegetation management and obstacle detection. Nguyen et al. [25] emphasized DL in vision-based power line inspections for proximity risks. Zhao et al. [26] introduced a multi-task network for LiDAR preprocessing, enhancing denoising and feature extraction. Rahman et al. [27] explored 3D object detection advancements. Wang et al. [28] overviewed DL for vegetation detection and classification. Koirala et al. [29] reviewed DL for agricultural fruit detection. Pu et al. [30] explored the use of DL for UAV-LiDAR-based power line corridor inspection and vegetation risk detection. Mantach et al. [31] presented DL in high-voltage engineering, including monitoring. Diez et al. [32] focused on reviewing methods using UAV-acquired RGB data for vegetation applications through deep learning, useful for monitoring and managing vegetation around power lines. Kattenborn et al. [33] highlighted CNNs for vegetation properties from remote sensing. Alimi et al. [34] reviewed ML for power system security, mentioning DL but not tree proximity. Datta et al. [35] analyzed DL in urban UAV remote sensing, without specific vegetation-power line focus. To contextualize the choice of RandLA-Net [11], Table 1 compares its performance with other DL-based semantic segmentation methods on the Toronto-3D dataset [36]. Existing models’ numerical results are adopted from [36], while their strengths and limitations are discussed here. Our optimized RandLA-Net [11] outperforms models such as PointNet++ [37], which suffers from high computational cost on large datasets, and KPConv [38], which, despite its accuracy, requires excessive resources unsuitable for sensitivity analysis. DCTNet [39] shows inconsistent performance across classes, while LACV-Net (RGB) [40], although achieving high IoUs (e.g., 97.3% for vegetation), introduces significant computational overhead due to complex local attention mechanisms. In contrast, RandLA-Net [11] employs efficient random sampling, enabling processing of million-point clouds up to 200× faster while preserving geometric details. These characteristics make it more suitable for scalable urban LiDAR data, integration with proximity detection, and sensitivity analysis. Overall, the optimized RandLA-Net [11] demonstrates strong adaptability for specialized tasks such as vegetation risk assessment.

2.3. Image-Based vs. Point Cloud-Based Methods

This part of the review contributes to the first and second research objectives by comparing image-based and point cloud-based methods, highlighting the advantages of 3D data in proximity detection and semantic labeling tasks. LiDAR technology has emerged as a key tool in automated vegetation monitoring (AVM) for power distribution lines, providing high-resolution 3D data for detecting and analyzing vegetation. This section compares image-based and point cloud technologies for assessing tree proximity to power lines, both vital for utility management. Technological advancements, including LiDAR scanners, have improved safety and efficiency in detection. While image processing via computer vision has advanced significantly, machine learning for point cloud semantic segmentation remains in its early stages [42,43]. LiDAR excels in delivering detailed 3D data for corridor management. Gollob et al. [44] assessed tree variable estimates using mobile laser scanning, noting scan variability’s impact. Gaha et al. [45] introduced a LiDAR-based clustering technique for pole and power line detection, showing improved accuracy and efficiency, though primarily effective for single-phase lines and less so in occluded areas. Hernández-López et al. [3] showed how high-resolution drone LiDAR enhances vegetation encroachment detection for proactive management. Liu et al. [46] proposed a content-based transformer using feature-space clustering to boost point cloud classification, leveraging attention mechanisms. Gribov and Duri [47] developed a method for generating line features from point collections to represent catenary curves, applicable to power line identification in LiDAR data. Amado et al. [48] presented an approach to isolate power lines from LiDAR point clouds for precise automation. Awrangjeb [49] proposed a LiDAR-based strategy for extracting and modeling power lines, addressing extraction challenges reliably. Li and Guo [50] highlighted LiDAR’s role in power line assessments, providing detailed 3D spatial and corridor information for evaluation and maintenance. Horning et al. [51] examined challenges and advances in delineating land cover via ultra-high resolution (sub-decimeter, i.e., <10 cm) aerial imagery, integrating ML algorithms for enhanced analysis. Table 2 provides a comprehensive comparison of recent research on vegetation and power line detection. The order is based on publication year, highlighting objectives, investigated networks or techniques, data sources, and main applications.

2.4. Clustering Methods for Proximity Detection

Addressing the second research objective, this subsection explores clustering algorithms and spatial analysis methods for proximity detection, emphasizing risk zones near power lines. In detecting tree proximity to power lines via machine learning and deep learning, clustering analyzes vegetation’s spatial distribution, segmenting risk-prone tree clusters to enhance maintenance and prevent outages. Sankaran et al. [69] discussed how clustering algorithms can help understand spatial patterns and their implications for ecosystem resilience. Ahmad and Khan [70] discussed the latest clustering algorithms for mixed data types, incorporating various types of sensors and data formats. Tchórzewski and Kania [71] applied cluster analysis to the operation data of the national power system. Gao [72] explored spatial clustering techniques in agriculture, which can be adapted for analyzing spatial distributions of trees relative to power lines. Chen et al. [73] developed a local tangent plane distance-based clustering approach for 3D point cloud segmentation. By incorporating local geometric constraints, their method achieves improved separation of adjacent structures. Table 3 presents a summary comparison of the primary relevant studies, detailing essential elements including methodology, employed dataset, core research objectives, and key evaluation metrics from various investigations.

2.5. Digital Twin Based on Point Cloud Data

To support the third and fourth research objectives, this section reviews recent advancements in digital twin modeling and semantic information integration using point cloud data, focusing on urban-scale applications. The concept of a digital twin involves creating a virtual model that mirrors the physical attributes and behaviors of real-world objects. In the context of monitoring the proximity of trees to power distribution lines, digital twins offer a dynamic and precise means of assessing and managing potential risks. Digital twins based on point cloud data enable the construction of 3D models of trees and their surrounding environments with centimeter-level positional fidelity, which are crucial for assessing the spatial relationships between vegetation and infrastructure.
Surface reconstruction is critical in converting point cloud data into detailed 3D models. Glumova and Filinskih [74] explored algorithms for generating surfaces from unstructured point clouds, emphasizing depth maps from stereo-matching combined with Delaunay triangulation and KD-tree indexing for efficient, high-quality meshes. Ismail et al. [75] investigated techniques like Poisson Reconstruction, Ball Pivoting Algorithm, and Alpha Shape Algorithm for simplicity and robustness in building reconstruction for digital twins. Tagarakis et al. [76] focused on mesh conversion from point clouds, emphasizing geometric accuracy for tree structures like branches and leaves in power distribution proximity detection. Chen et al. [77] enhanced mesh fidelity by incorporating dynamic simulations for tree growth and environmental interactions in predictive risk assessment.
A critical component is matching algorithms, which align point clouds with models or real-time data. Zhang and Li [78] proposed plant growth simulation using Blender and The Grove plugin, responsive to environmental factors, with matching algorithms aligning point clouds to 3D vegetation models verified against LiDAR scans. However, their approach did not address continuous updates for changes over time. Gobeawan et al. [79] implemented species-specific growth models in digital twins, using matching algorithms to fit within point cloud constraints for accurate physical and biological representation.
In power distribution line management, digital twins enable continuous vegetation monitoring and risk assessment. Buonocore et al. [80] demonstrated dynamic simulations for predicting tree growth and impacts under scenarios like extreme weather. Kim et al. [81] introduced PinSout, a deep learning framework using PointNet, PCL (v2011), and 3DCityDB (v5) for automated 3D model generation from point clouds, aiding indoor digital twins with semantic integration. La Guardia and Koeva [82] presented a 3D web navigation model fusing geospatial datasets via JavaScript and WebGL for unified visualization in urban planning. Wu et al. [83] proposed RegARD for registering colorful point clouds with CAD drawings via architectural reflection detection and nonlinear optimization for industrial modeling. Agapaki and Brilakis [84] developed a deep learning-based shape retrieval method matching point clouds to CAD models for industrial facility management. Li et al. [85] introduced GRNet for 3D object detection from point clouds, using intra- and inter-object features for indoor applications like mapping and reconstruction.
Table 4 provides a detailed analysis of studies relevant to digital twin technology, particularly in infrastructures contexts including the contexts of vegetation management and power distribution line monitoring. It categorizes research into two primary areas: those that directly focus on the creation and application of digital twins, and those that contribute essential methodologies and algorithms crucial for developing digital twins. The studies focused on digital twin creation explore the integration of digital twins for monitoring and managing vegetation proximity to power lines, utilizing advanced simulations and predictive modeling. The research contributing methodologies addresses critical aspects such as surface reconstruction, 3D object detection, and point cloud data processing, each of which plays a vital role in supporting the broader framework of digital twin technology. This categorization, organized by year, highlights the specific contributions of each study toward advancing digital twin technology and its applications in specialized fields.

3. Proposed Framework

This paper proposes a comprehensive framework for vegetation-related risk assessment in AVM using the RandLA-Net model [11], which is designed for the semantic segmentation of large 3D point clouds. As explained in Section 2.2, the model is selected for its high accuracy in semantic segmentation, as demonstrated on the Toronto-3D [36]. The method integrates point intensity information and focuses on three key classes: vegetation, poles, and power lines. This approach addresses the challenges posed by handling extensive 3D point cloud datasets, enabling accurate segmentation and classification of each point to efficiently identify vegetation-related risks in AVM. The proposed framework, shown in Figure 1, builds on the segmentation process as the foundational step and extends into several critical stages: sensitivity analysis, post-processing analysis, and digital twin creation, concluding with the integration of semantic attributes into CIM.
The semantic segmentation stage leverages the RandLA-Net model [11] to classify 3D point clouds into vegetation, poles, and power lines. RandLA-Net [11] is a deep learning architecture specifically designed for efficient semantic segmentation of large-scale point clouds. It operates by first using random sampling to downsample the input points, which reduces computational load while preserving geometric details. The core of the model involves local feature aggregation through modules like Local Spatial Encoding (which captures geometric relationships among neighboring points using relative positions and distances) and Attentive Pooling (which adaptively weights important features during pooling). These are combined with shared Multi-Layer Perceptrons (MLPs) and dilated residual blocks to process up to one million points efficiently in a single pass, outputting per-point class labels. The segmentation process was refined through a detailed sensitivity analysis, which systematically evaluated the effect of varying hyperparameters such as subsampling ratios, input point density, feature dimensions, and neighborhood sizes on the model’s performance. This analysis ensured that the best-performing configuration was selected for subsequent processing.
The next stage, post-processing analysis, refines the segmentation results by employing Density-Based Spatial Clustering of Applications with Noise (DBSCAN) [88] to cluster objects and remove noise. DBSCAN is a density-based clustering algorithm that groups points into clusters based on their spatial density. It works by defining a neighborhood radius (epsilon) around each point and requiring a minimum number of points within that radius to form a core point; clusters are then expanded by connecting nearby core points, while isolated points are labeled as noise. This makes DBSCAN particularly suitable for irregularly shaped clusters in point cloud data, as it does not assume a fixed number of clusters. Rule-based thresholding is then applied to isolate objects that meet specific criteria, such as dimensions and proximity. This is followed by proximity detection using the KDTree method, which is a space partitioning data structure for organizing points in k-dimensional space to enable efficient nearest neighbor searches. It constructs a binary tree by recursively splitting the point set along alternating dimensions (for example x, y, z), allowing queries to traverse the tree and find the closest points efficiently. On average, the time complexity scales logarithmically with the number of points, meaning that only a small fraction of points is checked even in very large datasets. This makes the method well-suited for large-scale spatial queries in 3D environments. This step evaluates spatial relationships between trees and power lines to assess vegetation-related risks.
The framework further incorporates digital twin creation, which transforms the segmented and processed 3D point clouds into detailed virtual representations of the urban environment. Digital twin creation is achieved through 3D object registration for trees and poles, which aligns segmented objects in a global coordinate system using transformation, scaling, and alignment techniques. This registration relies on the Iterative Closest Point (ICP) algorithm, which iteratively minimizes the distance between two point sets by estimating optimal rotation and translation transformations. Starting with an initial alignment (e.g., based on bounding box centers), ICP alternates between finding closest-point correspondences and updating the transformation matrix until convergence, ensuring precise matching despite variations in scale or orientation. The 3D surface generation process for power line completes this stage by reconstructing surfaces through gap filling, interpolation, subsampling, and meshing. Gap filling and interpolation are performed using Radial Basis Function (RBF) interpolation, a scattered data interpolation technique that fits a smooth surface by summing weighted radial basis functions (e.g., Gaussian or multiquadric) centered at known points, effectively reconstructing missing data in sparse regions while maintaining continuity. These digital twins provide a dynamic, interactive representation of real-world assets.
Finally, the framework integrates semantic attribution into the digital twin by linking each element with meaningful labels and contextual data, which is then incorporated into CIM. Semantic attributes are derived using the Minimum Bounding Box (MBB) algorithm, which computes the smallest axis-aligned box enclosing a point cluster by finding the minimum and maximum coordinates along each dimension (x, y, z), enabling efficient extraction of metrics like height and canopy spread for risk assessment. This integration enriches the digital twin with actionable metadata, supporting decision-making for urban infrastructure and vegetation management. Each step is discussed in detail in the following subsections, demonstrating the framework’s holistic approach to addressing vegetation risks in AVM.

3.1. Semantic Segmentation

The RandLA-Net model [11], efficient in processing high-density point clouds, was used for semantic segmentation, focusing on vegetation, poles, and power lines. The model used for training considered all 9 classes from the Toronto-3D dataset. However, as the main points of interest in this study are vegetation, poles, and power lines, we focused on these classes in our analysis, ignoring the rest. Nevertheless, the results for the other classes can be utilized for creating a more comprehensive digital twin of the environment. RandLA-Net distinguishes itself through its distinctive methodology, which utilizes random point sampling to perform downsampling. This technique substantially lowers computational demands while preserving the geometric integrity of point cloud details. The framework includes a local feature aggregation component that encompasses Local Spatial Encoding and Attentive Pooling, enabling the effective capture of complex local configurations [11]. With an architecture that incorporates shared Multilayer Perceptrons (MLPs) and dilated residual blocks, the network achieves accelerated processing capabilities, making it possible to manage up to one million points in one iteration. Such an efficient and creative design positions RandLA-Net as especially well-suited for extensive point cloud evaluations, where it exhibits enhanced efficiency and accuracy relative to alternatives like PointNet++ [37].
For evaluating the RandLA-Net model’s effectiveness in this application, we applied the Intersection over Union (IoU) metric. As a widely recognized measure for assessing segmentation models, IoU quantifies the precision of point classifications by calculating the degree of overlap between the model’s predictions and the corresponding ground truth labels. This metric delivers a holistic assessment of the model’s capabilities across multiple categories, revealing details about its reliability and proficiency in distinguishing various urban components. Elevated IoU scores reflect superior model outcomes and a closer alignment with actual environmental conditions. Additionally, to compare and improve performance on the target classes, we trained an auxiliary 4-class model, where only vegetation, poles, and power lines were treated as distinct classes, with all other points labeled as unclassified. This was done to demonstrate how reducing class complexity can enhance accuracy for specific safety-critical applications, such as vegetation risk assessment near power infrastructure.

Sensitivity Analysis

The sensitivity analysis aims to evaluate the impact of various hyperparameter configurations on the performance of RandLA-Net using the Toronto-3D dataset. By systematically modifying key parameters, their influence on the model’s ability to accurately classify and segment large-scale point clouds were investigated. The main sensitivity analysis was based on the full 9-class model to ensure a comprehensive and reproducible approach for digital twin creation, capturing all urban elements for broad applicability. This allowed us to optimize the model globally, addressing challenges like class imbalances and feature confusion across diverse classes. Eight distinct cases were designed to assess critical aspects of the network’s performance:
(1) 
Baseline Configuration (Case 1): Utilizes both RGB and intensity features alongside XYZ spatial coordinates. This serves as the control configuration, representing typical hyperparameters of RandLA-Net, including subsampling ratios, feature dimensions, and neighborhood sizes.
(2) 
Exclude RGB and Intensity (Case 2): Evaluates the model’s reliance on XYZ spatial coordinates by removing RGB and intensity features.
(3) 
Increased Number of Input Points (Case 3): Examines whether higher-resolution point clouds lead to improved classification, particularly in complex urban regions.
(4) 
Adjusted Subsampling Ratio (Case 4): Reduces the subsampling ratio to retain more spatial information in early network layers, aiding in feature extraction in dense environments.
(5) 
Increased Feature Dimensions (Case 5): Explores the effect of increased feature capacity on the network’s ability to distinguish between objects with subtle spatial differences.
(6) 
Increased K-Nearest Neighbors (KNN) (Case 6): Tests the impact of a broader neighborhood context during local feature aggregation on segmentation accuracy in densely packed urban scenes.
(7) 
Aggressive Learning Rate Decay (Case 7): Investigates the effect of faster learning rate reduction to enhance model generalization and prevent overfitting.
(8) 
Combined Increased Points and Feature Dimensions (Case 8): Simultaneously increases input resolution and feature dimensions to assess their cumulative impact on model performance.
The primary evaluation metric for segmentation quality was IoU, supported by precision, recall, and F1 scores for comprehensive analysis. IoU was chosen due to its critical role in quantifying spatial accuracy, especially in detecting hazardous trees, where alignment between predicted zones and actual risk areas is essential.

3.2. Post-Processing Analysis

3.2.1. Clustering and Rule-Based Thresholding

To improve the segmented point cloud data during the early phase of post processing, the DBSCAN algorithm was chosen for clustering, owing to its capacity to detect groups of diverse forms and densities in the data without requiring a predetermined cluster count. This characteristic makes DBSCAN appropriate for managing the intricate and diverse composition of the urban dataset. Beyond DBSCAN, rule-based thresholding was applied, establishing particular height and point count limits for each category of urban features, such as trees and poles. This method successfully distinguished prominent urban entities in every group while minimizing interference and extraneous information, thus elevating the overall precision and reliability of the clustering outcomes.

3.2.2. Proximity Detection Between Trees and Power Lines

For evaluating the hazards posed by trees in proximity to power lines, a K-dimensional Tree (KDTree) framework was employed to facilitate efficient spatial querying, with the goal of accurately determining potential risks. Recognized for its proficiency in quickly searching points across multi-dimensional spaces, the KDTree emerged as an optimal tool for examining spatial connections in the point cloud data. The procedure entailed leveraging the KDTree framework to promptly locate the closest power line relative to each tree. Following these distance computations, the results were evaluated against a predefined safety threshold. Regions involving trees that breached this threshold were flagged as possible risks. Given the extensive scope of the dataset, prioritizing computational efficiency became a vital consideration. This strategy enhances operational performance and resource efficiency during complex, large-scale data handling.

3.3. Digital Twin Creation

3.3.1. Utility Lines

The methodology employed a structured approach to create a continuous and connected representation of utility lines from segmented point cloud data. A k-nearest neighbor (KNN) search algorithm employing the covariance analysis-based method for local surface approximation and multi-scale feature extraction was applied [89] to estimate the normal vector and curvature at each point. For a point p i , KNN identifies the set of k nearest neighbors N ( p i ) based on Euclidean distance, where k is chosen to balance accuracy and efficiency. Normals were computed by fitting a plane to the neighboring points using principal component analysis (PCA). The normal vector n i is the eigenvector corresponding to the smallest eigenvalue of the covariance matrix (Equation (1) [89]).
C = 1 k j     N ( p i ) (   p j p ¯   ) (   p j p ¯   ) T
with p ¯ as the centroid of the neighbors.
Curvature estimation was conducted by quantifying the deviation of neighboring points from the fitted plane, approximated as Equation (2) [89].
κ i = λ 3 λ 1   +   λ 2   +   λ 3
where λ 1 λ 2 λ 3 are the eigenvalues of C .
To address gaps and missing points within the segmented point cloud, a Radial Basis Function (RBF) interpolation method was employed (Equation (3) [90]). This method was selected for its proven effectiveness in handling scattered data while producing smooth, continuous results. RBF interpolation facilitated the reconstruction of missing data points, essential for creating a seamless and connected representation of the utility lines.
f x = j   =   1 n w j φ x x j + p x
where φ is a radial basis function, w j are weights, and p ( x ) is a low-degree polynomial [90].
Finally, an upsampling technique was incorporated to ensure uniform point density across the utility lines (Equation (4) [91]). This step was vital in regions with lower point density, contributing to a high-resolution and accurate geometric representation.
d = | P | V
where | P | is the number of points and V is the voxel volume. This step enhanced geometric resolution, particularly in sparse regions.

3.3.2. Poles and Trees

The methodology employed aimed to accurately represent poles and trees within segmented point cloud data by aligning them with reference 3D models. The alignment of segmented pole and tree objects with their real-world counterparts was achieved using the Iterative Closest Point (ICP) algorithm. This algorithm iteratively refined transformation parameters, specifically rotation and translation, to minimize the distance between the segmented object and its corresponding reference model (Equation (5) [92]).
E ( R , t ) = i = 1 m   q i ( R   p i + t )   2
Here, p i are points from the segmented cloud, q i are corresponding points in the reference model, R is the rotation matrix, and t is the translation vector. Singular value decomposition (SVD) was applied at each iteration until convergence.
The ICP process was designed to account for variations in type, location, and size, ensuring accurate alignment of the segmented point cloud to its reference. Three critical steps defined the methodology for the alignment process: (1) initialization of alignment parameters: parameters for initial transformation (e.g., approximate position, rotation) were defined. (2) Application of the transformation matrix: the segmented points were transformed using the initialized parameters, setting a baseline for alignment. (3) Iterative refinement: the ICP algorithm was executed to minimize alignment error by updating transformation parameters iteratively. Additionally, bounding box centers of segmented objects and reference models were aligned by translating the segmented object so that its center c s coincided with the reference center c r (Equations (6)–(9) [93]). Each center is the midpoint between the coordinate-wise minima and maxima of the corresponding point set; after computing the two centers, we applied the translation t 0 to all segmented points p i . To ensure size consistency, a scaling factor was computed as Equation (10) [93], where the ratio of the bounding box dimensions of segmented objects to reference models was computed and used to apply the appropriate scaling factor.
c s b b = 1 2 x m a x y m a x z m a x + x m i n y m i n z m i n
c r b b = 1 2 x m a x y m a x z m a x + x m i n y m i n z m i n
t 0 = c r b b c s b b
p i = p i + t 0
Here, c s b b and c r b b denote the bounding-box centers of the segmented object S and the reference model r respectively; ( x m i n , y m i n , z m i n ) and ( x m a x , y m a x , z m a x ) are the coordinate-wise minima and maxima of points in S ; primed quantities ( x m i n , y m i n , z m i n ) and ( x m a x , y m a x , z m a x ) are those for r ; and t 0 is the initial translation applied.
s = d r d s
where d r and d s are the diagonal lengths of the reference and segmented bounding boxes, respectively, applied uniformly to normalize scales.

3.4. Semantic Attribution of Trees

The semantic attribution of trees within the CIM focuses on integrating key attributes derived from point cloud data to enhance the management of power distribution networks. Following semantic segmentation of trees, poles, and power lines, the digital twin is augmented with semantic information to improve its utility in network management and risk assessment. This integration enables the identification and mitigation of risks posed by vegetation near power lines. Essential tree attributes incorporated into the CIM include height, canopy spread, and species type. Tree height is a critical parameter for evaluating threats to overhead power lines, as trees that are as tall as or taller than nearby poles may require trimming or removal to prevent safety hazards or outages. Canopy spread, which represents the horizontal reach of branches, is another vital factor; even if a tree trunk is positioned away from power lines, its canopy might encroach on electrical infrastructure, necessitating preventive maintenance. Trees identified as potential risks through post-processing are marked as hazardous within the CIM.
To quantify tree height and canopy spread, the Minimum Bounding Box (MBB) algorithm is applied to segmented clusters of point cloud data. This algorithm determines the smallest bounding box that encompasses a tree cluster, providing precise geometric representations of its vertical and horizontal extents. Ground level is determined using points classified as road or ground from the RandLA-Net semantic segmentation output, and tree height is computed as the vertical distance from this local ground level to the top of the tree cluster. The resulting attributes are integrated into the CIM for accurate modeling. The semantic information added includes tree ID, tree image, height, canopy spread, and species type, thereby supporting effective risk mitigation in power distribution networks.

4. Implementation, Results, and Case Study

In the implementation phase, post-processing techniques including clustering, rule-based thresholding, and proximity detection were deployed using Python.

4.1. Data Acquisition and Preparation

The Toronto-3D dataset, created by Tan et al. [2], was employed for the case study. This collection encompasses data gathered from a 1 km stretch of Avenue Road in Toronto, Canada. It represents an extensive compilation with approximately 78.3 million data points. The dataset is distinguished by its elevated point density, averaging 1000 points per square meter on the surface, which plays an essential role in documenting intricate aspects of the urban setting, a factor critical to this investigation. Acquisition occurred via a LiDAR sensor mounted on a Mobile Laser Scanning (MLS) system. The LiDAR sensor recorded up to 700,000 points per second, featuring a vertical field of view spanning from negative 10 to positive 30 degrees. Toronto-3D coordinates are provided in UTM (Zone 17N) with a reported positional accuracy better than 3 cm (horizontal and vertical). Every point within the dataset includes multiple attributes, such as position in meters (XYZ coordinates), color reflectance (RGB), LiDAR intensity, GPS time of acquisition, scan angle, and labels for nine object classes. These object class labels encompass various urban elements, rendering the dataset valuable for semantic segmentation tasks. The categories consist of unclassified (label 0), road (label 1), road marking (label 2), natural (label 3), building (label 4), utility line (label 5), pole (label 6), car (label 7), and fence (label 8).
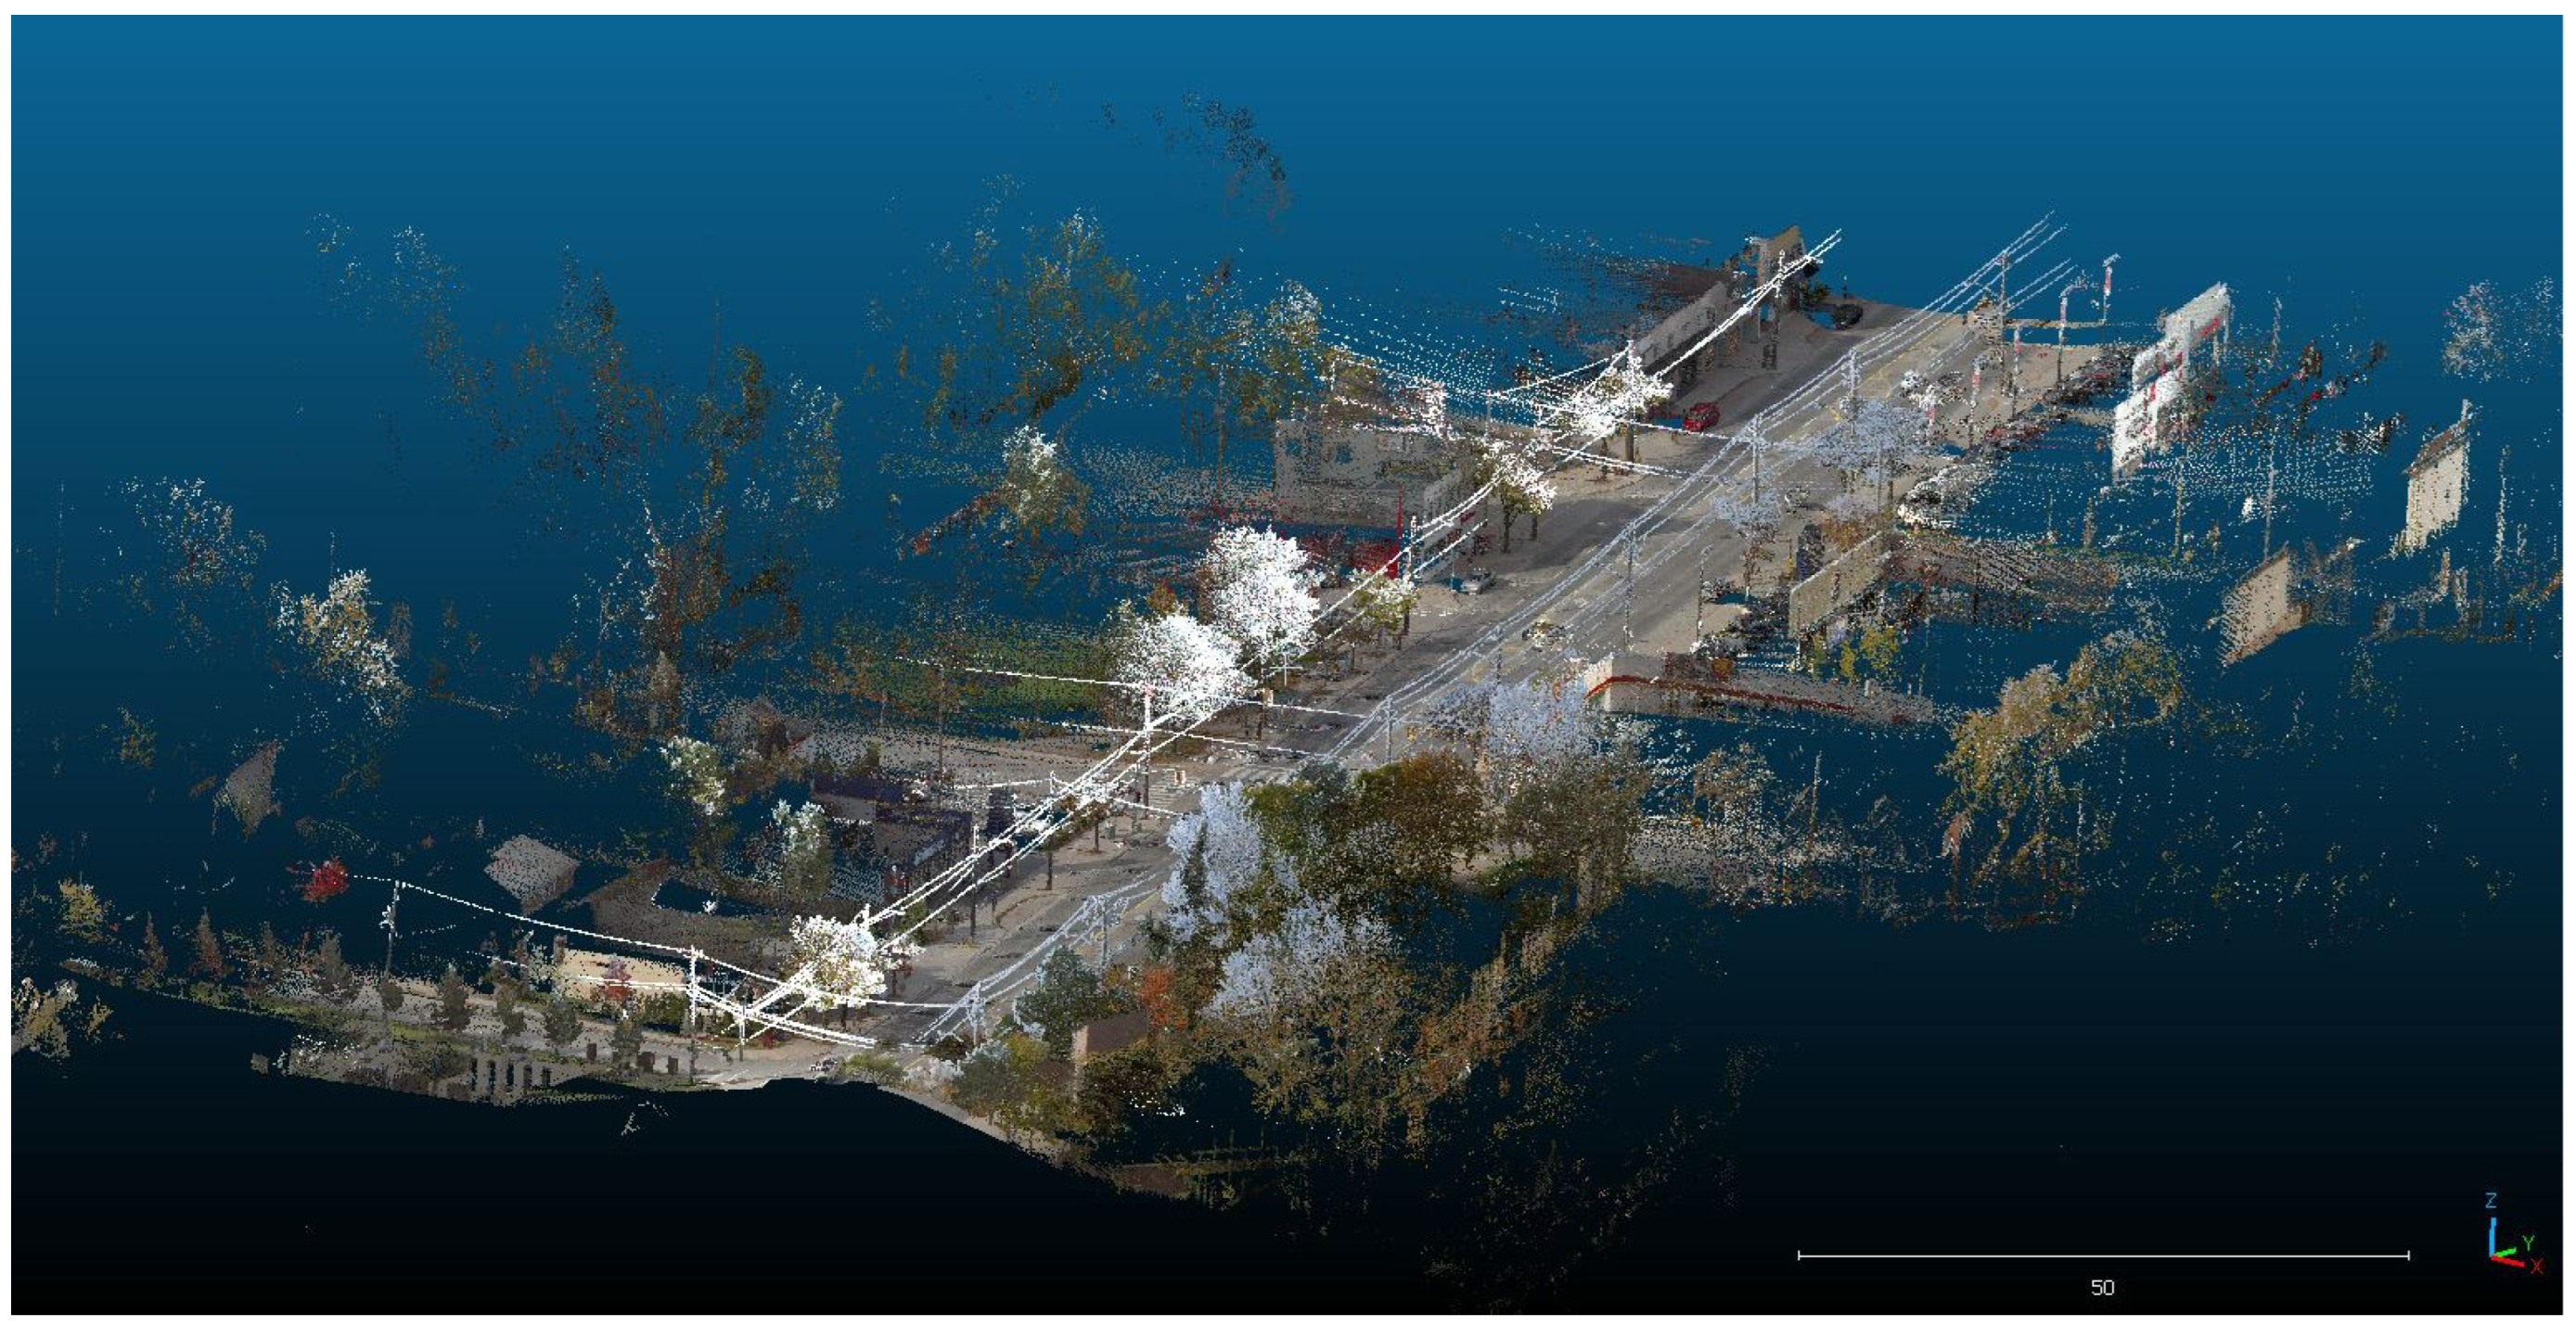
Preparation of the data entailed importing the point cloud data and applying grid subsampling at a grid size of 0.06 m to decrease the overall volume while retaining important characteristics. For the validation subsets, projection indexes were generated to link model outputs back to the initial dataset, facilitating an organized and streamlined setup suitable for semantic segmentation and subsequent examination. A projection index serves as a mapping tool that connects each point in a subsampled point cloud to its corresponding position in the complete dense point cloud, guaranteeing that any evaluations or alterations made to the simplified version can be precisely transferred to the original, more comprehensive dataset. The unprocessed data from this collection experienced preprocessing to transform the .ply files into an appropriate text format compatible with the semantic segmentation workflow. Figure 2 illustrates a sample area of point cloud data.

4.2. Semantic Segmentation Results

The Toronto-3D dataset was split into four segments, with each one spanning roughly 250 m along the road. Segments 1, 3, and 4 served as the training data, while segment 2 was designated for testing purposes. The dataset experienced two distinct training procedures. First, training occurred without incorporating RGB or intensity values, emphasizing solely the geometric attributes (X, Y, Z). Subsequently, a second training round included the RGB and intensity details (X, Y, Z, R, G, B, intensity) from the LiDAR point cloud attributes to evaluate how these elements influenced the model’s overall effectiveness. With this dataset, the RandLA-Net model completed 100 epochs of training to boost its precision in point cloud data segmentation. The Adam optimizer, valued for its suitability with extensive datasets, was applied. A starting learning rate of 0.01 was established, with a progressive decrease of 5% after each epoch to optimize model refinements and facilitate convergence. A batch size of 4 was sustained to achieve an equilibrium between resource demands and productive learning in the training cycles. During this segmentation workflow, the model precisely allocated a class label to every point, allowing for the clear separation of diverse urban components. The model used for training considered all 9 classes from the Toronto-3D dataset. However, as the main points of interest in this study are vegetation, poles, and power lines, we focused on these classes in our analysis, ignoring the rest. Nevertheless, the results for the other classes can be utilized for creating a more comprehensive digital twin of the environment.
The duration for training the baseline model reached 124 h and 33 min on a LAMBDA workstation (Lambda Labs, San Francisco, CA, USA) equipped with one NVIDIA RTX A6000 GPU, 48 GB RAM per GPU, and an AMD Ryzen Threadripper 3960x 48-core CPU.
In the testing stage, each epoch consisted of 25 steps, where each step handled a batch of test data. Within the testing context, a step refers to one iteration across a data batch, and an epoch denotes a complete traversal of the full test dataset.

4.2.1. Sensitivity Analysis for the Full 9-Class Model

The sensitivity analysis was conducted using various hyperparameter configurations presented in Table 5, with the full 9-class model used for training in all cases. The model’s performance was evaluated based on a confusion matrix that provided values for precision, recall, F1 score, and Intersection over Union (IoU) for each class, trees, power lines, and poles, as shown in Table 6. These metrics were used to thoroughly understand the impact of each hyperparameter modification.
The baseline configuration (Case 1) served as the control, utilizing both RGB and intensity features along with XYZ spatial coordinates. This configuration included 65,536 input points, a subsampling ratio of [4, 4, 4, 4, 2], feature dimensions of [16, 64, 128, 256, 512], a KNN value of 16, and a learning rate decay of 0.95. All other cases were compared against this baseline by modifying specific hyperparameters to assess their impact on segmentation performance, with the full 9-class model used for training throughout. In Case 2, RGB and intensity features were excluded while retaining the baseline’s spatial and structural features, allowing the evaluation of the model’s reliance on auxiliary data. Case 3 increased the number of input points to 131,072, providing a denser resolution of the point cloud to analyze whether additional spatial data improves segmentation accuracy. Case 4 reduced the subsampling ratio to [2, 2, 2, 2, 2], preserving more points in earlier layers to retain finer spatial details. Case 5 increased feature dimensions to [32, 128, 256, 512, 1024], aiming to improve the model’s ability to learn richer representations for objects with subtle differences. Case 6 expanded the KNN value to 32 to include a broader spatial context during local feature aggregation. In Case 7, the learning rate decay was increased to 0.90, testing whether a faster reduction in the learning rate improves generalization by mitigating overfitting. Finally, Case 8 combined increased input points and feature dimensions to evaluate the cumulative effect of these enhancements on segmentation accuracy.
The confusion matrix for each case provided the basis for calculating four key metrics: precision, recall, F1 score, and IoU. These metrics were chosen to offer a comprehensive understanding of the model’s performance. For individual classes in the full 9-class model used for training, the model without considering RGB and intensity achieved IoU scores of 95.97%, 85.97%, and 76.14% for trees, power distribution lines, and poles, respectively. In contrast, the baseline model that integrated RGB and intensity data exhibited enhanced outcomes, with IoU scores for trees, power lines, and poles reaching 96.93%, 86.28%, and 79.90%, respectively. The notable gain exceeding 3% in the poles category for the model incorporating RGB and intensity could stem from the distinct and characteristic hues associated with poles. Nevertheless, the relatively reduced precision in detecting poles across both models might result from the challenging nature of urban settings where these structures are positioned. Elements like occlusion from surrounding items, fluctuating illumination levels, and resemblances to other upright features could complicate their reliable identification.
For trees, Case 8 achieved the highest IoU (97.05%), along with strong precision (98.47%) and recall (98.54%). This demonstrates that the combination of increased input points and feature dimensions allowed the model to capture fine-grained details in high spatial complexity areas. The F1 score (98.50%) further confirms the model’s ability to balance precision and recall effectively. For power lines, Case 5 recorded the highest IoU (88.09%), indicating that increasing feature dimensions improved the model’s ability to distinguish power lines from surrounding objects. The precision (95.04%) and recall (92.34%) highlight the benefit of richer feature representations. The F1 score (93.67%) confirms the overall reliability of this configuration. For poles, Case 8 again performed best with an IoU of 82.33%, surpassing the baseline (79.90%). Precision (91.55%) and recall (89.02%) indicate the model’s improved capacity to identify poles, which often share spatial characteristics with other objects. The F1 score (90.27%) reflects the effective balance between identifying true positives and minimizing false positives for this challenging class.
The results showed that configurations enhancing the model’s ability to process richer spatial information, such as increased input points (Case 3) and enhanced feature dimensions (Case 5), consistently improved segmentation accuracy across all classes. Case 8, which combined both strategies, delivered the highest IoU for trees and poles, demonstrating the additive benefit of these enhancements. Reducing the subsampling ratio in Case 4 also showed positive effects by retaining more spatial data in earlier network layers, leading to improved IoU for power lines (87.57%) and poles (80.90%). However, increasing the KNN value in Case 6 provided limited benefit, particularly for poles (79.67%), suggesting that overly broad neighborhoods may dilute meaningful local information. Similarly, the aggressive learning rate decay in Case 7 reduced IoU for poles (77.76%), likely due to insufficient exploration of the parameter space during early training.
Overall, the sensitivity analysis reveals that Case 8 is the best configuration for improving segmentation accuracy for trees and poles, while Case 5 demonstrates the highest IoU for power lines. In comparison with the study by Abongo et al. [16], which concentrated solely on power line detection and attained an IoU of 82.49%, our approach substantially exceeds this level, reaching an IoU of 88.09% (Case 5) for power distribution lines. The outcomes from Case 8, which delivered the peak overall accuracy of 96.90% indicating the proportion of accurately classified points relative to the total points in all categories within the full 9-class model employed for training, were chosen for subsequent phases, such as post processing and digital twin development. The training duration for Case 8 amounted to 224 h and 58 min on a LAMBDA workstation (Lambda Labs, San Francisco, CA, USA) featuring one NVIDIA RTX A6000 GPU, 48 GB RAM per GPU, and an AMD Ryzen Threadripper 3960x 48-core CPU.

4.2.2. Focused 4-Class Model on Vegetation, Pole, and Utility Line Classes

Our primary objective in this study is to enhance semantic segmentation accuracy across all urban object classes in the Toronto-3D dataset, thereby supporting the development of comprehensive digital twins for urban environments. This requires a reproducible method capable of capturing the full spectrum of elements, such as roads, buildings, vehicles, and natural features, to enable broad applicability in environmental modeling and infrastructure management. Accordingly, we conducted extensive sensitivity analyses on the full configuration with nine classes of the RandLA-Net model to systematically explore hyperparameter effects and optimize global performance. These analyses were essential for refining a versatile model that addresses class imbalances, feature confusion, and other challenges inherent in diverse urban point clouds, ensuring its utility for holistic digital twin creation.
However, the inclusion of all classes in the full model can introduce noise and learning complexities, such as confusion between similar structures (for example, poles and fences) or imbalances favoring dominant classes like vegetation, which may limit the maximum achievable Intersection over Union (IoU) for specific target classes. To investigate whether targeted refinements could yield superior results for our focused classes of interest, vegetation, poles, and power lines, we developed an auxiliary model with four classes as a comparative experiment. This model treats only these three classes as distinct, with all other points labeled as unclassified (class 0), thereby demonstrating potential performance gains in a simplified setting. Importantly, this auxiliary approach is not intended to replace the full model with nine classes but to highlight how class reduction can enhance precision for safety critical applications, such as vegetation risk assessment near power infrastructure, while underscoring the necessity of the comprehensive model for digital twin reproducibility.
To implement this focused model, we restructured the preprocessing pipeline for RandLA-Net. Specifically, the original Toronto-3D labels were remapped in the following way. Vegetation (original class 3) was mapped to class 1, utility lines (original class 5) to class 2, and poles (original class 6) to class 3. All remaining classes were assigned to class 0 (unclassified) and excluded from both training and evaluation, creating a cleaner learning objective that minimizes interference from extraneous features. The data preparation phase was further adapted to filter ground truth and predicted labels, retaining only points from the three target classes for performance assessment. To mitigate biases in the reduced class distribution, particularly the dominance of vegetation, we recalculated class weights and adjusted the loss function accordingly, promoting balanced learning across vegetation, poles, and power lines.
The training and testing pipelines were similarly modified to align with this setup with four classes, incorporating label remapping and filtering mechanisms in the evaluation module to ensure accurate matching between predictions and the reduced label space. For traceability, the pipeline generated intermediate outputs, including filtered ply files and per class prediction logs, facilitating transparency in model decisions.
The results of this reconfiguration were substantial, with the model with four classes achieving IoUs of 99.55% for vegetation, 88.79% for poles, and 87.18% for utility lines.
These results represent improvements of up to 6.46% in IoU for poles and 2.50% for vegetation compared to the full 9-class model, demonstrating reduced confusion with similar vertical structures. Notably, the performance ranking shifted in this setting, with poles outperforming utility lines, illustrating how focused learning can yield class specific gains. The model’s performance is shown in Table 7.
These findings provide a key insight. While broad segmentation with nine classes is indispensable for generating comprehensive digital twins that encompass the entire urban context, a targeted model with four classes can deliver refined accuracy for specialized tasks in utility asset management. The two approaches are complementary, with the full model prioritizing reproducibility and generalizability, hence our emphasis on sensitivity analyses in that configuration, and the focused model offering enhanced precision for critical subsets of classes. This dual perspective reinforces the adaptability of our methodology for diverse digital twin applications.

4.3. Post-Processing Results

During the following phase of our examination, we applied a blend of DBSCAN, height, and point count thresholding methods to detect and separate objects that aligned with our established criteria. This procedure required modifications to DBSCAN parameters, including epsilon (that is, maximum distance between samples) and the minimum number of samples, to accommodate the specific characteristics of the Toronto-3D dataset. After completing the clustering process, we preserved clusters that exceeded the specified height threshold (for instance, 8 m for poles) and met the minimum point count threshold (for instance, 500 points for poles). This action yielded an optimized dataset that clearly distinguished and highlighted important urban elements from those of lesser importance. Table 8 displays the clustering parameters and thresholds for every class. Figure 3 illustrates the segmentation outcomes prior to and following clustering and rule-based thresholding.

4.4. Proximity Detection Results

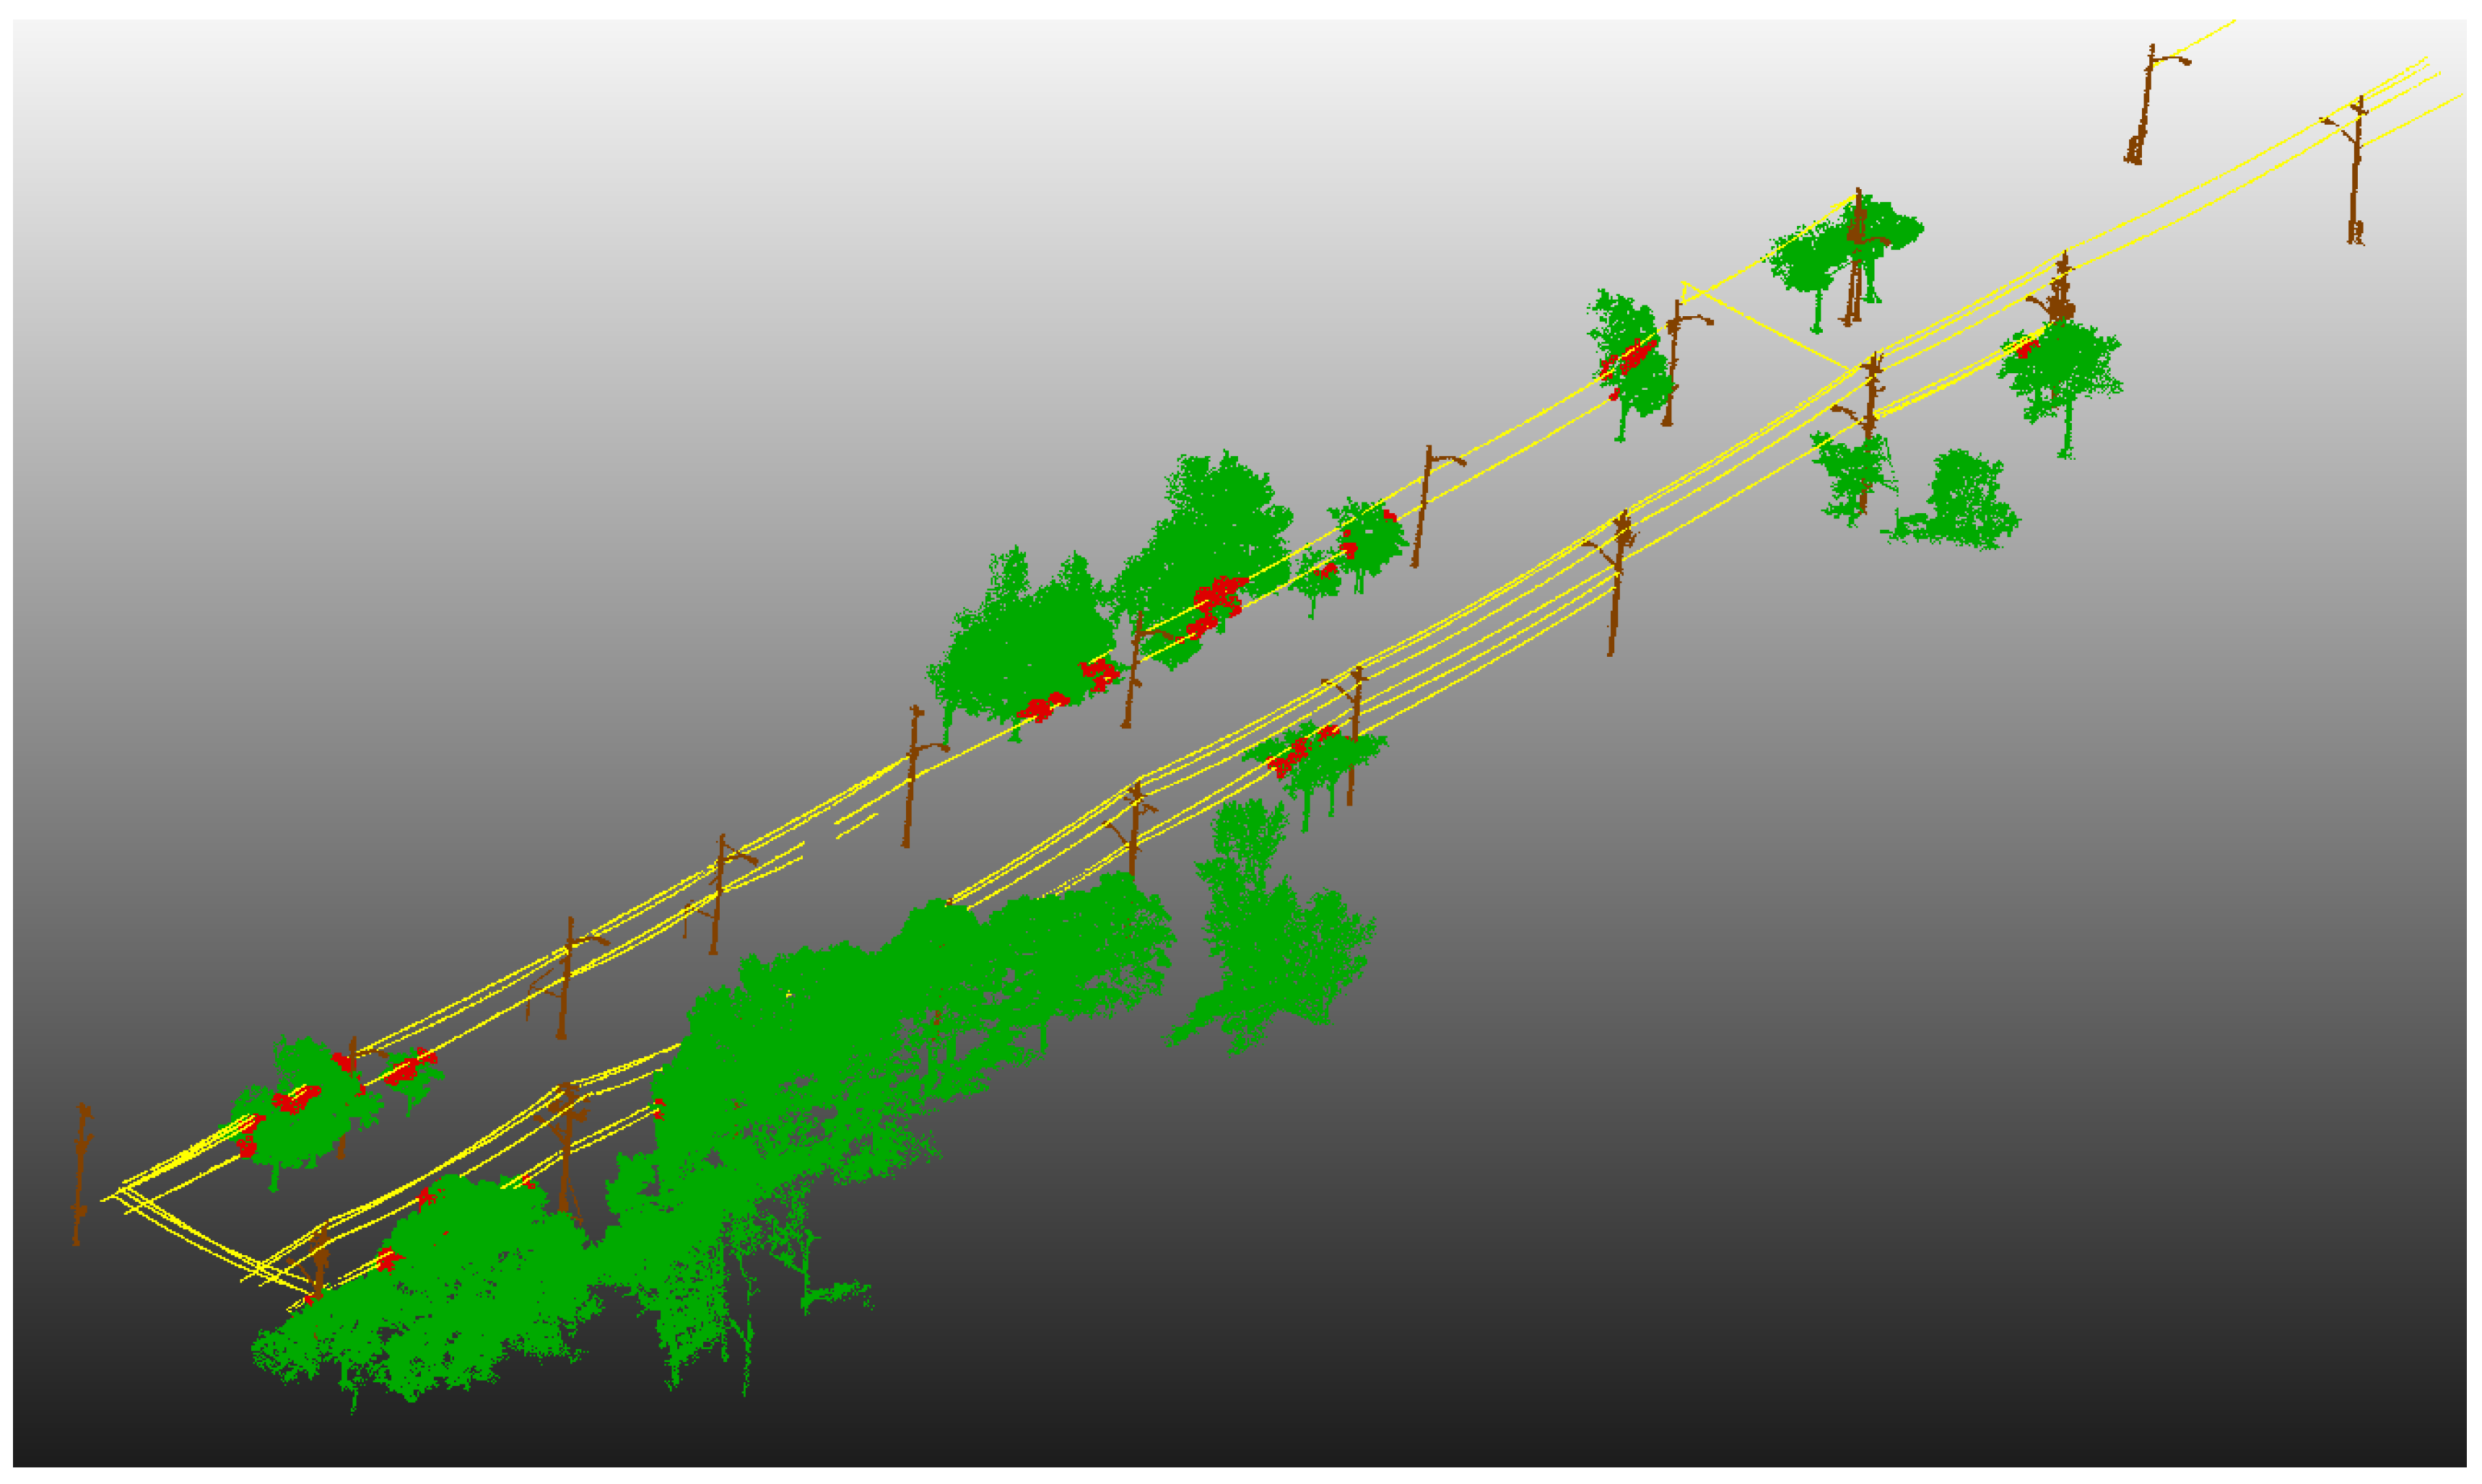
The following stage seeks to evaluate the spatial data between trees and power lines in order to support proximity detection and facilitate risk assessment. By utilizing KDTree’s queries, we promptly identified the nearest power line point relative to every tree point within a multidimensional space. Comparing these findings to an established safety threshold of 1 m enabled the recognition of tree sections that presented risks because of their closeness to power lines, marking them as possible threats. Figure 4 depicts the post-processed semantic segmentation outcome, emphasizing hazardous tree areas (red points) inside the safety perimeter surrounding power distribution lines.

4.5. Digital Twin Creation for Utility Lines

The described methodology was implemented using Python and its specialized libraries for point cloud processing. Initially, the segmented point cloud data was imported into the Python environment. A KNN algorithm was applied to determine the 10 nearest neighbors for each point in the cloud. The normal vectors were computed by fitting a plane to these neighbors, with curvature estimated by measuring deviations from the plane.
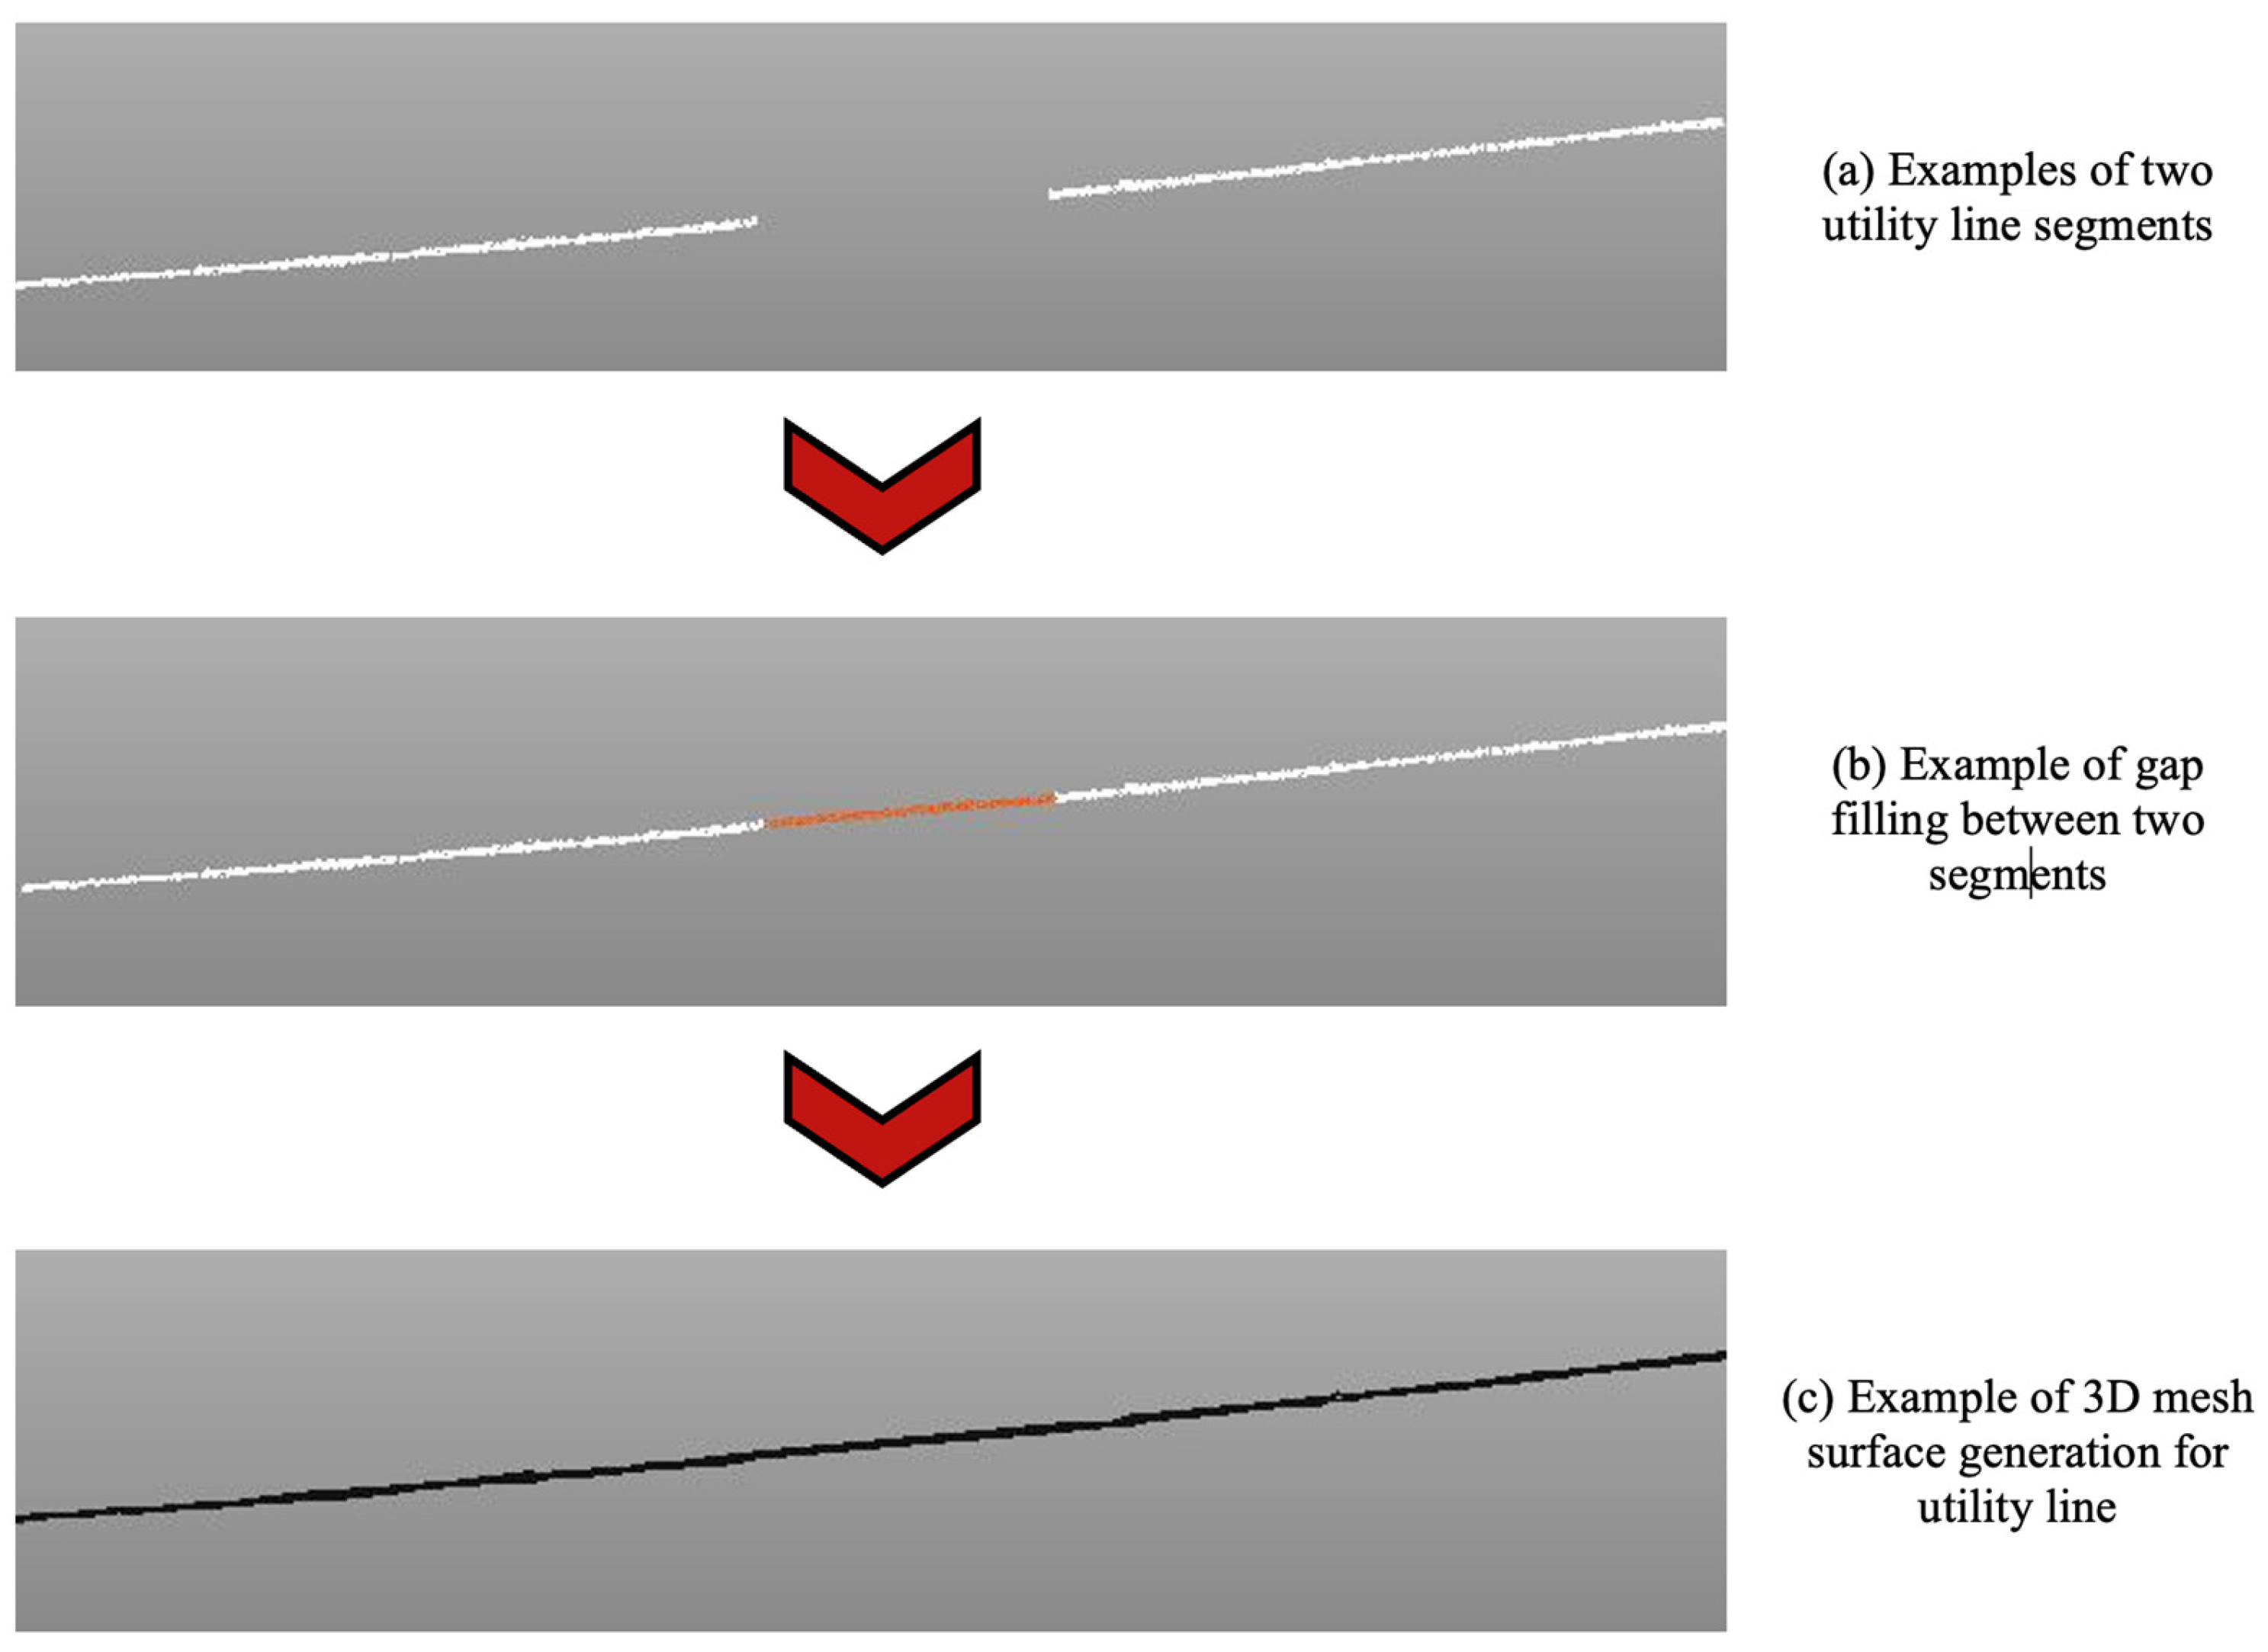
To address data discontinuities, the RBF interpolation was executed using Python libraries optimized for 3D data manipulation. The interpolation process seamlessly filled gaps in the point cloud, ensuring a continuous structure of the utility lines. The upsampling phase followed, employing algorithms to increase the density of points in sparse areas. This technique enhanced the fidelity of the utility line model and ensured uniform resolution. Finally, the segmented sections of the point cloud were merged into a unified structure. The integration process focused on maintaining geometric continuity, producing a cohesive and accurate 3D representation of the utility lines. Figure 5 shows an example of gap filling and 3D mesh generation for utility line segments.

4.6. Digital Twin Creation for Poles and Trees

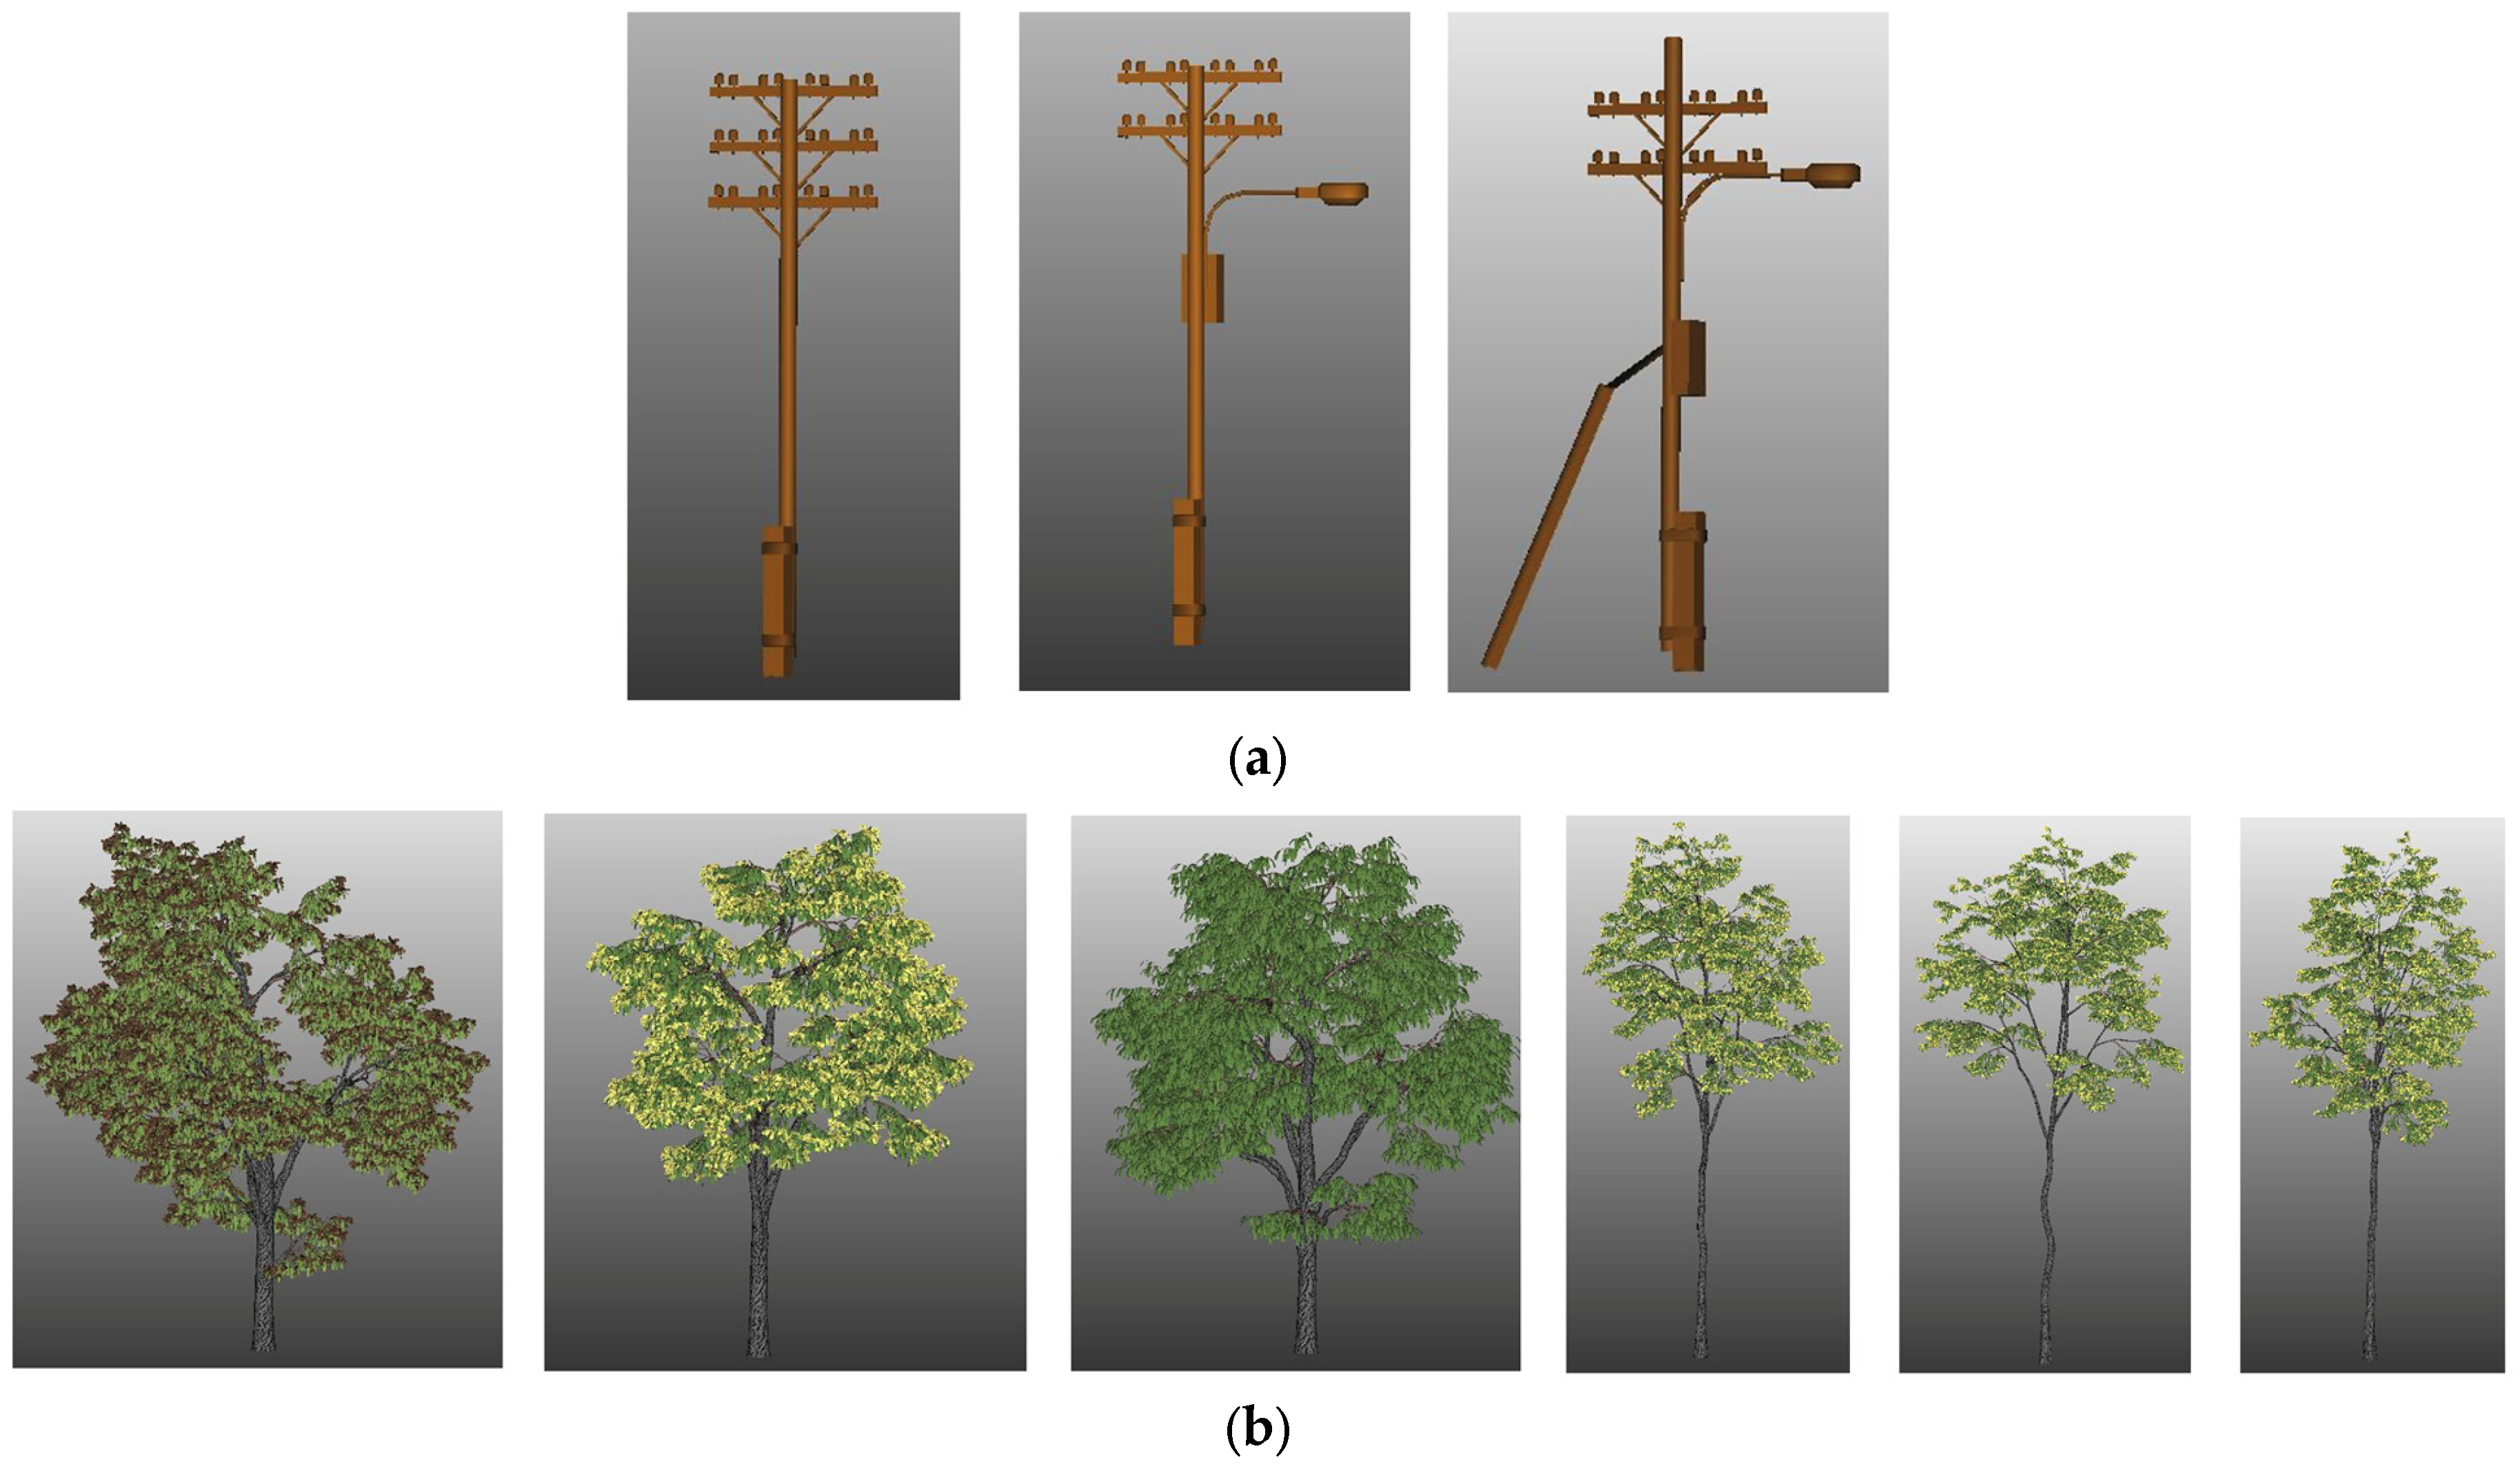
The outlined methodology was implemented using Python. The reference 3D models for poles and trees were imported. To maintain consistency in modeling, all trees were assumed to belong to the Honey Locust species. A detailed library of 3D models for poles and trees was sourced from Sketchfab [94] and CGTrader [95], serving as references for comparison and alignment. Figure 6a and Figure 6b show the poles and trees libraries, respectively.
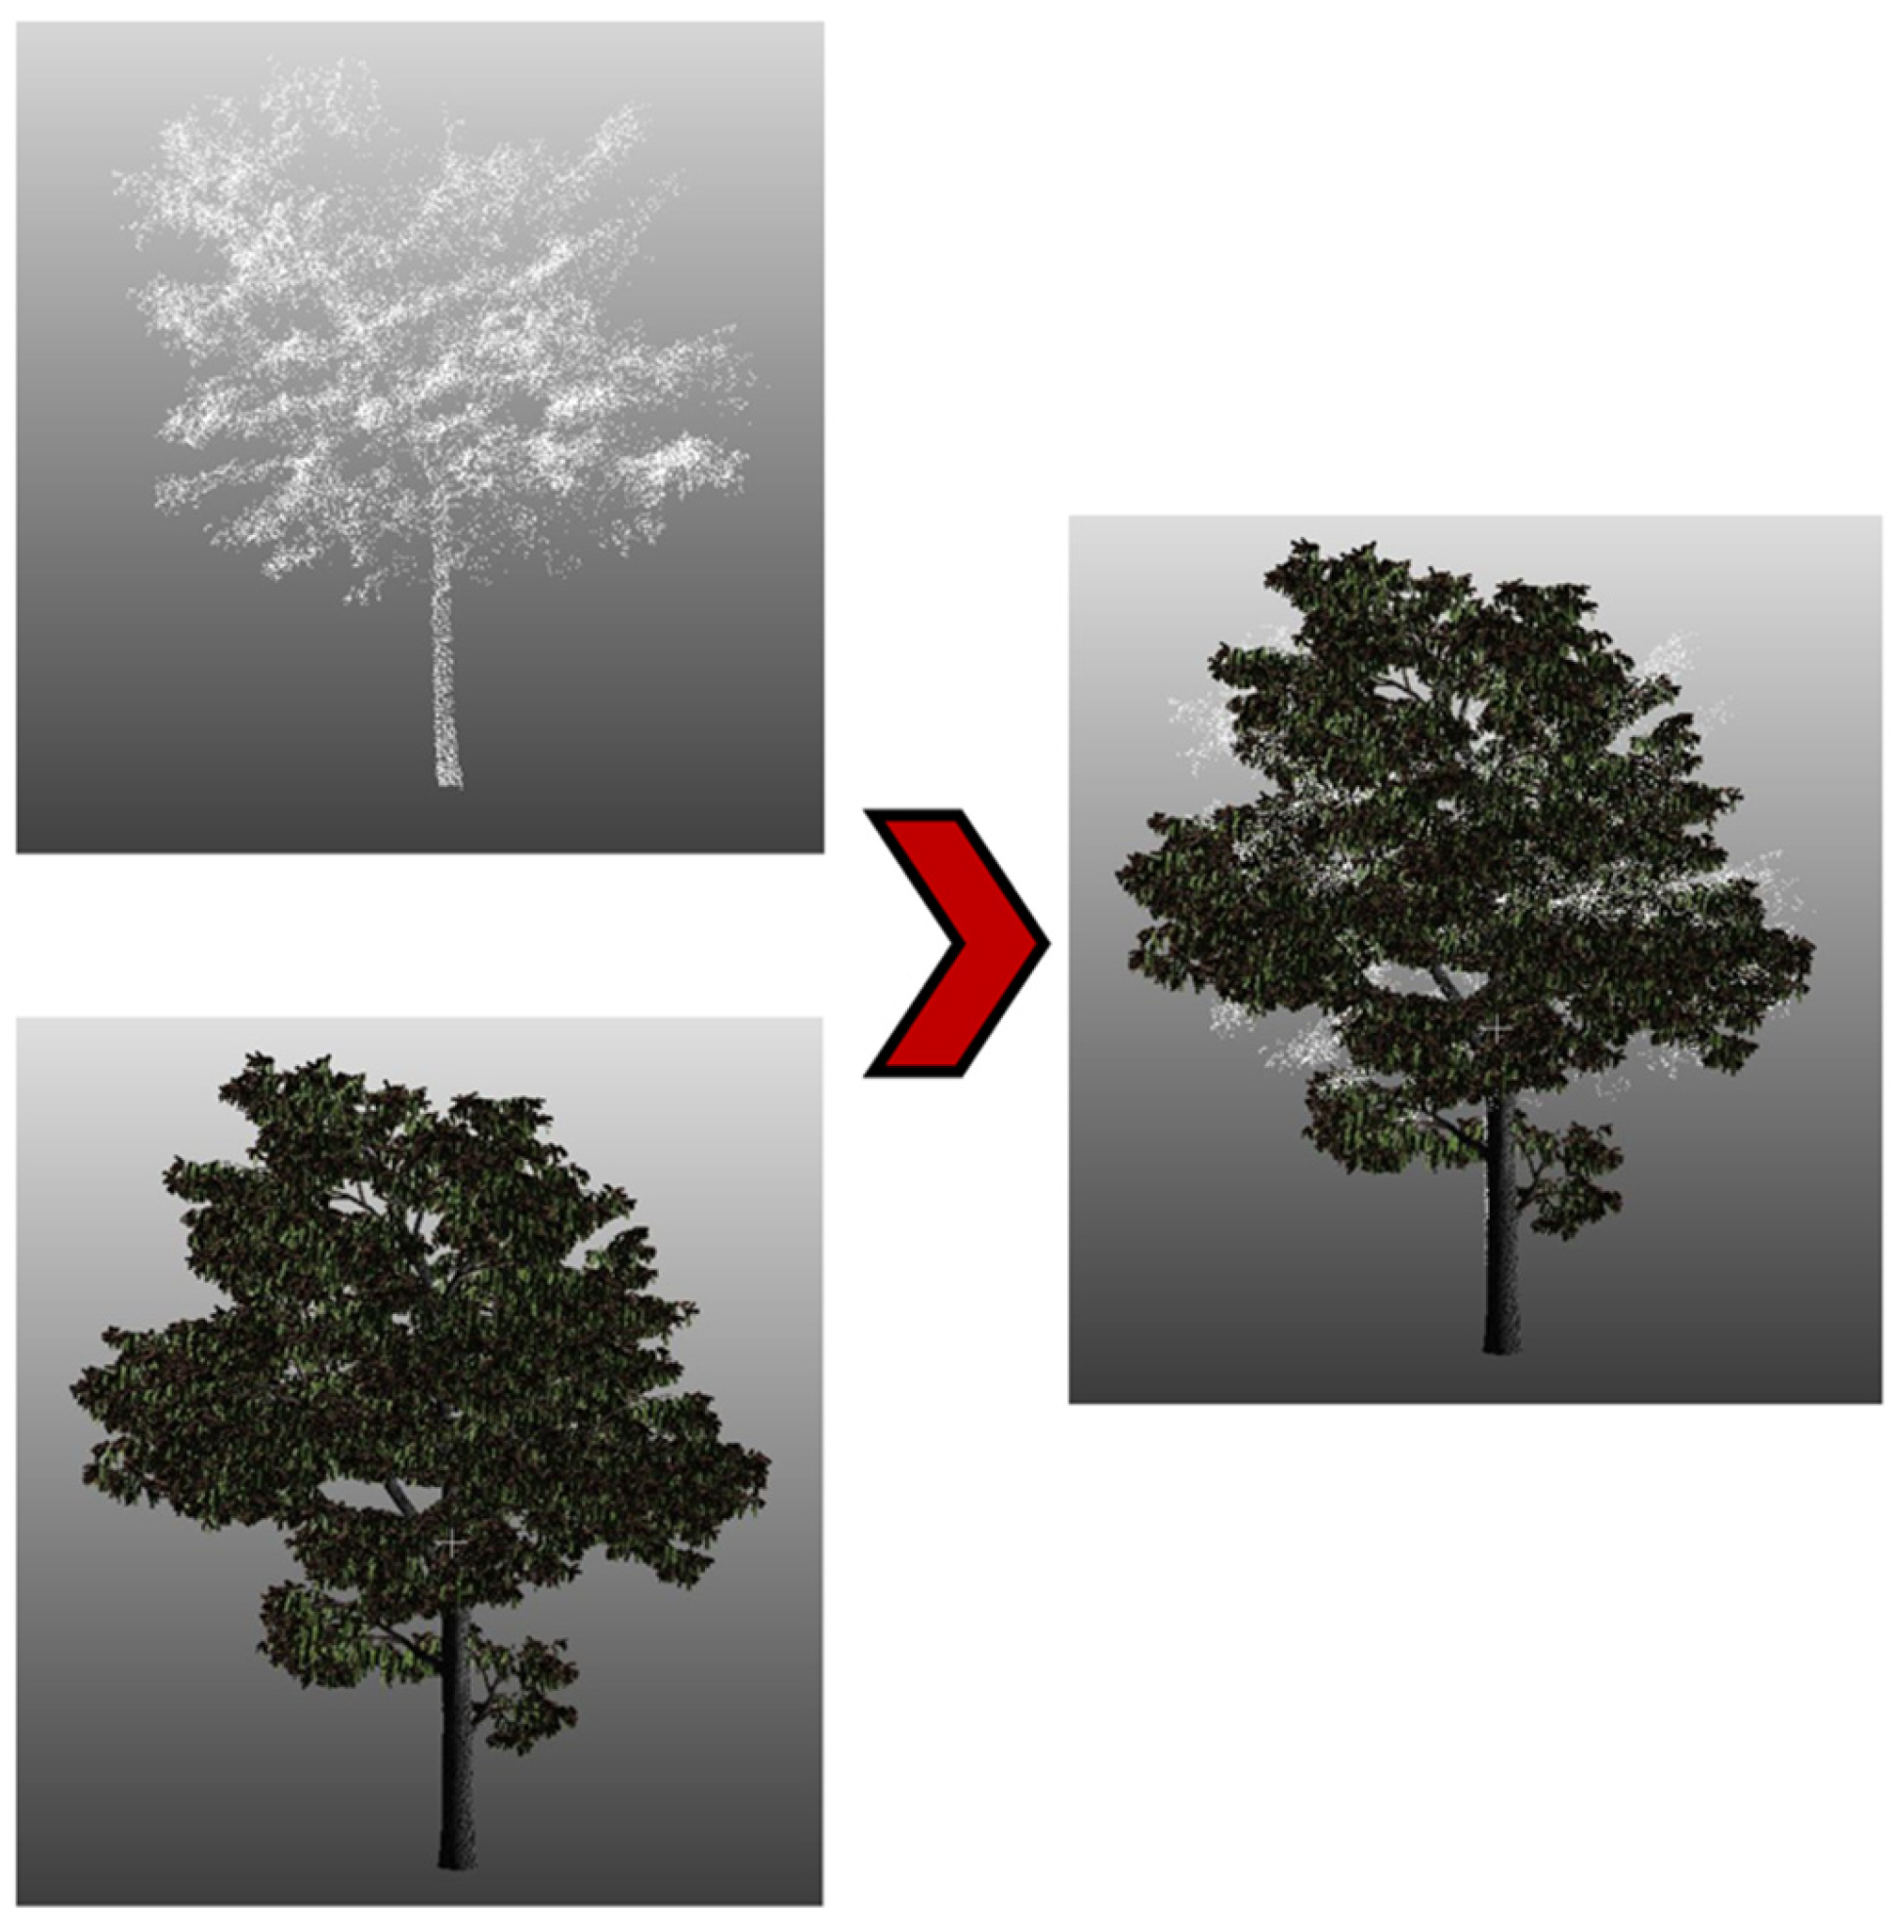
The ICP algorithm was utilized to align the segmented point cloud data of poles and trees with their corresponding reference models. The implementation began with initializing the alignment parameters based on approximate geometric and spatial data. A transformation matrix, comprising rotation, translation, and scaling components, was applied to the segmented points to achieve preliminary alignment. Subsequently, the ICP algorithm refined these transformation parameters iteratively to reduce alignment error and optimize the fit between the segmented objects and the reference models. Location matching was achieved by aligning the centers of the bounding boxes of the segmented objects with those of their reference models. To ensure scale accuracy, the bounding box dimensions of the segmented objects were compared to those of the reference models, and the calculated scaling factor was applied to normalize their sizes. Figure 7 and Figure 8 illustrate examples of 3D surface registration for a pole and a tree, respectively. Figure 9 shows 3D model of trees, poles and power lines based on point cloud data.

4.7. Semantic Attribution Results

This step was implemented using Autodesk Revit to integrate detailed semantic information of 3D model into CIM. After performing the semantic segmentation, the resulting point cloud data was processed to extract the relevant geometric attributes of the trees, including tree height and canopy spread.
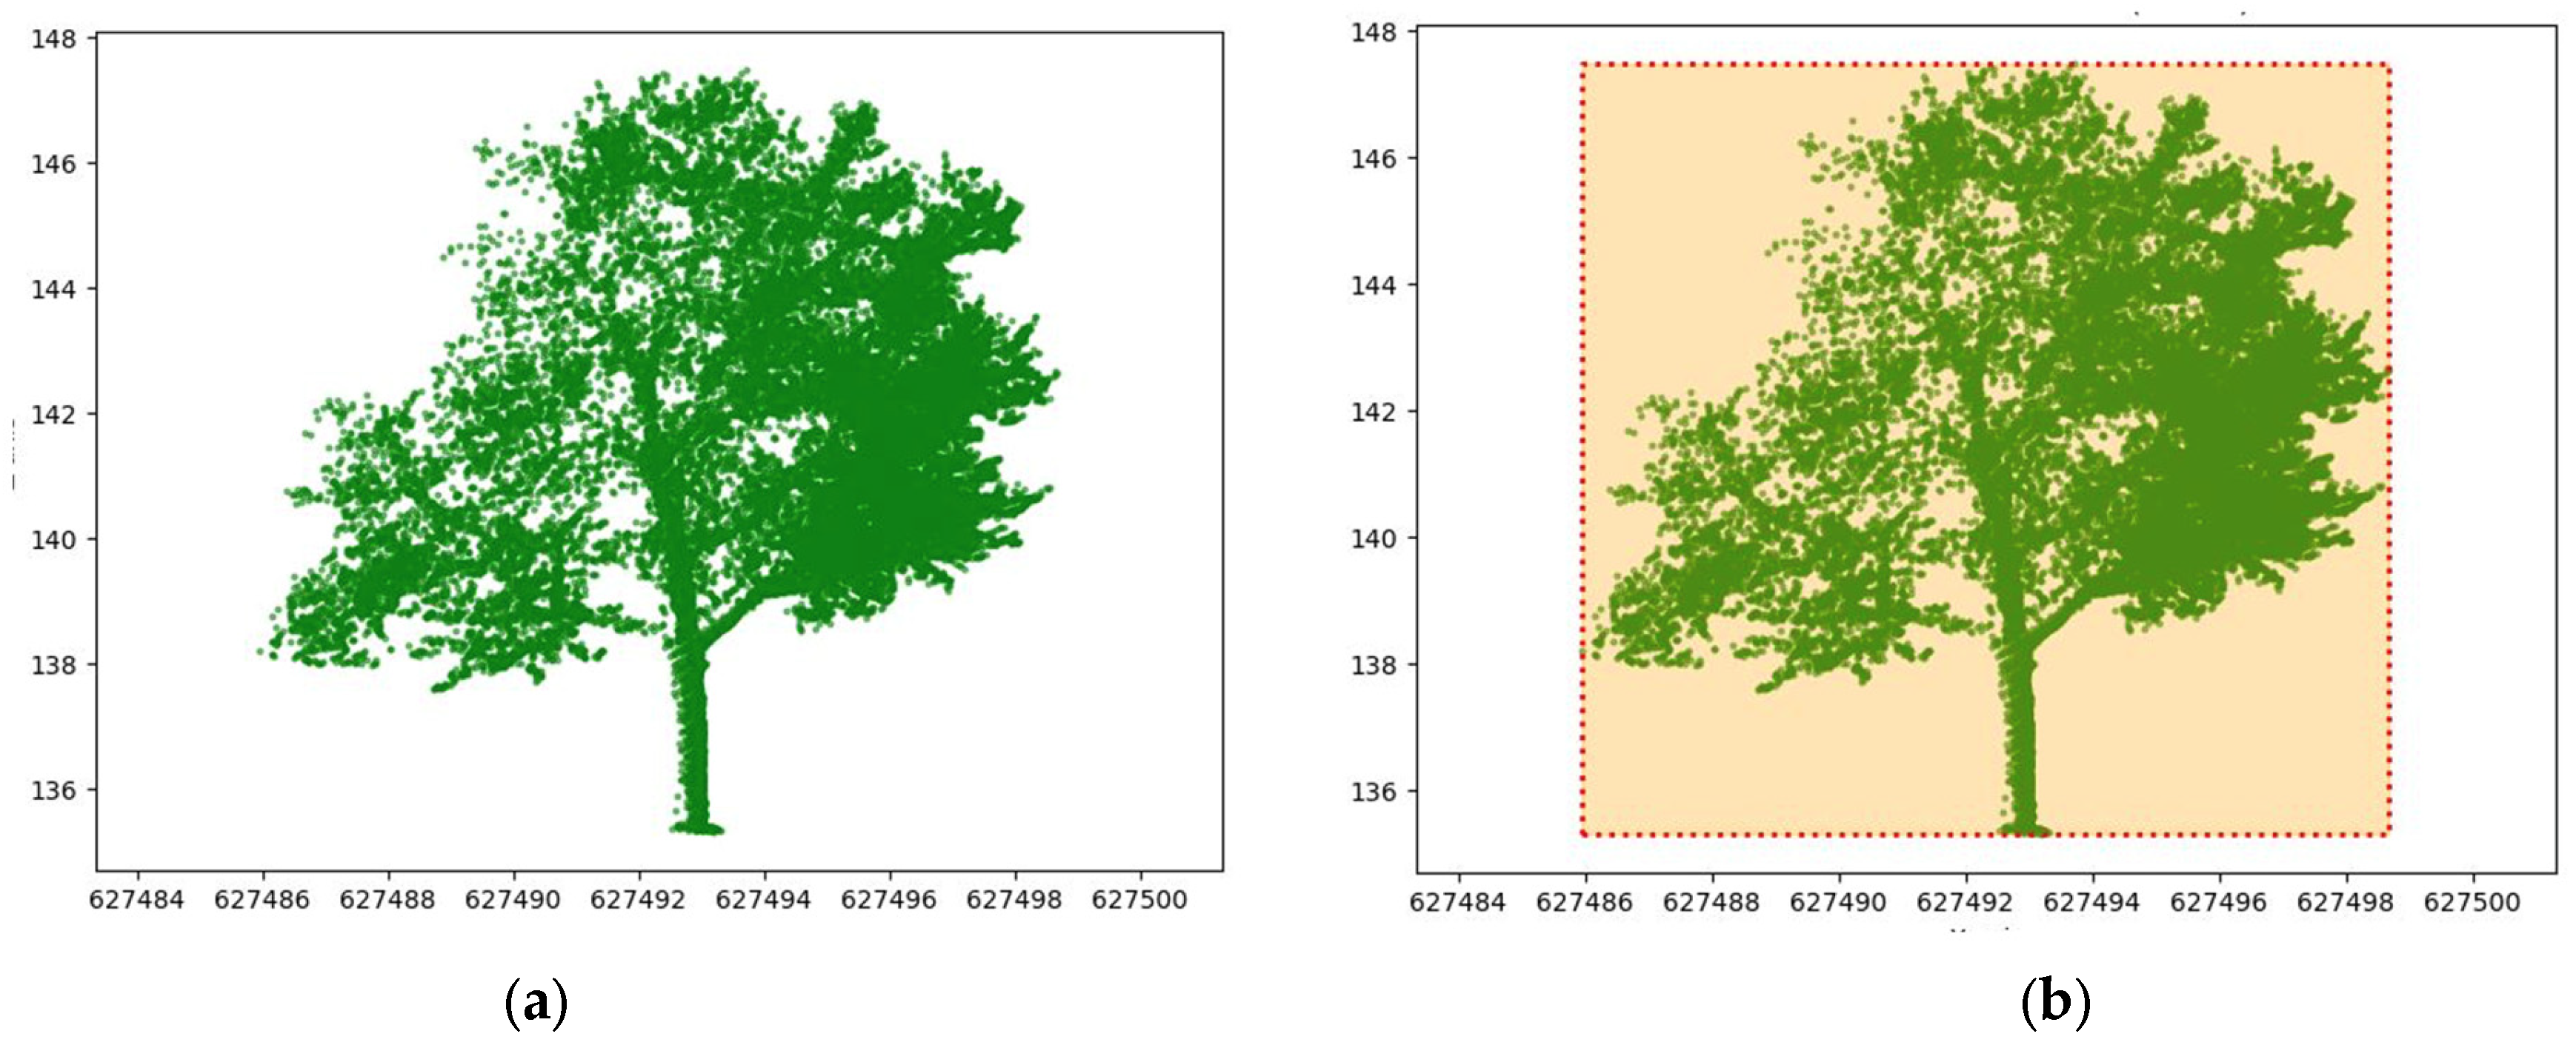
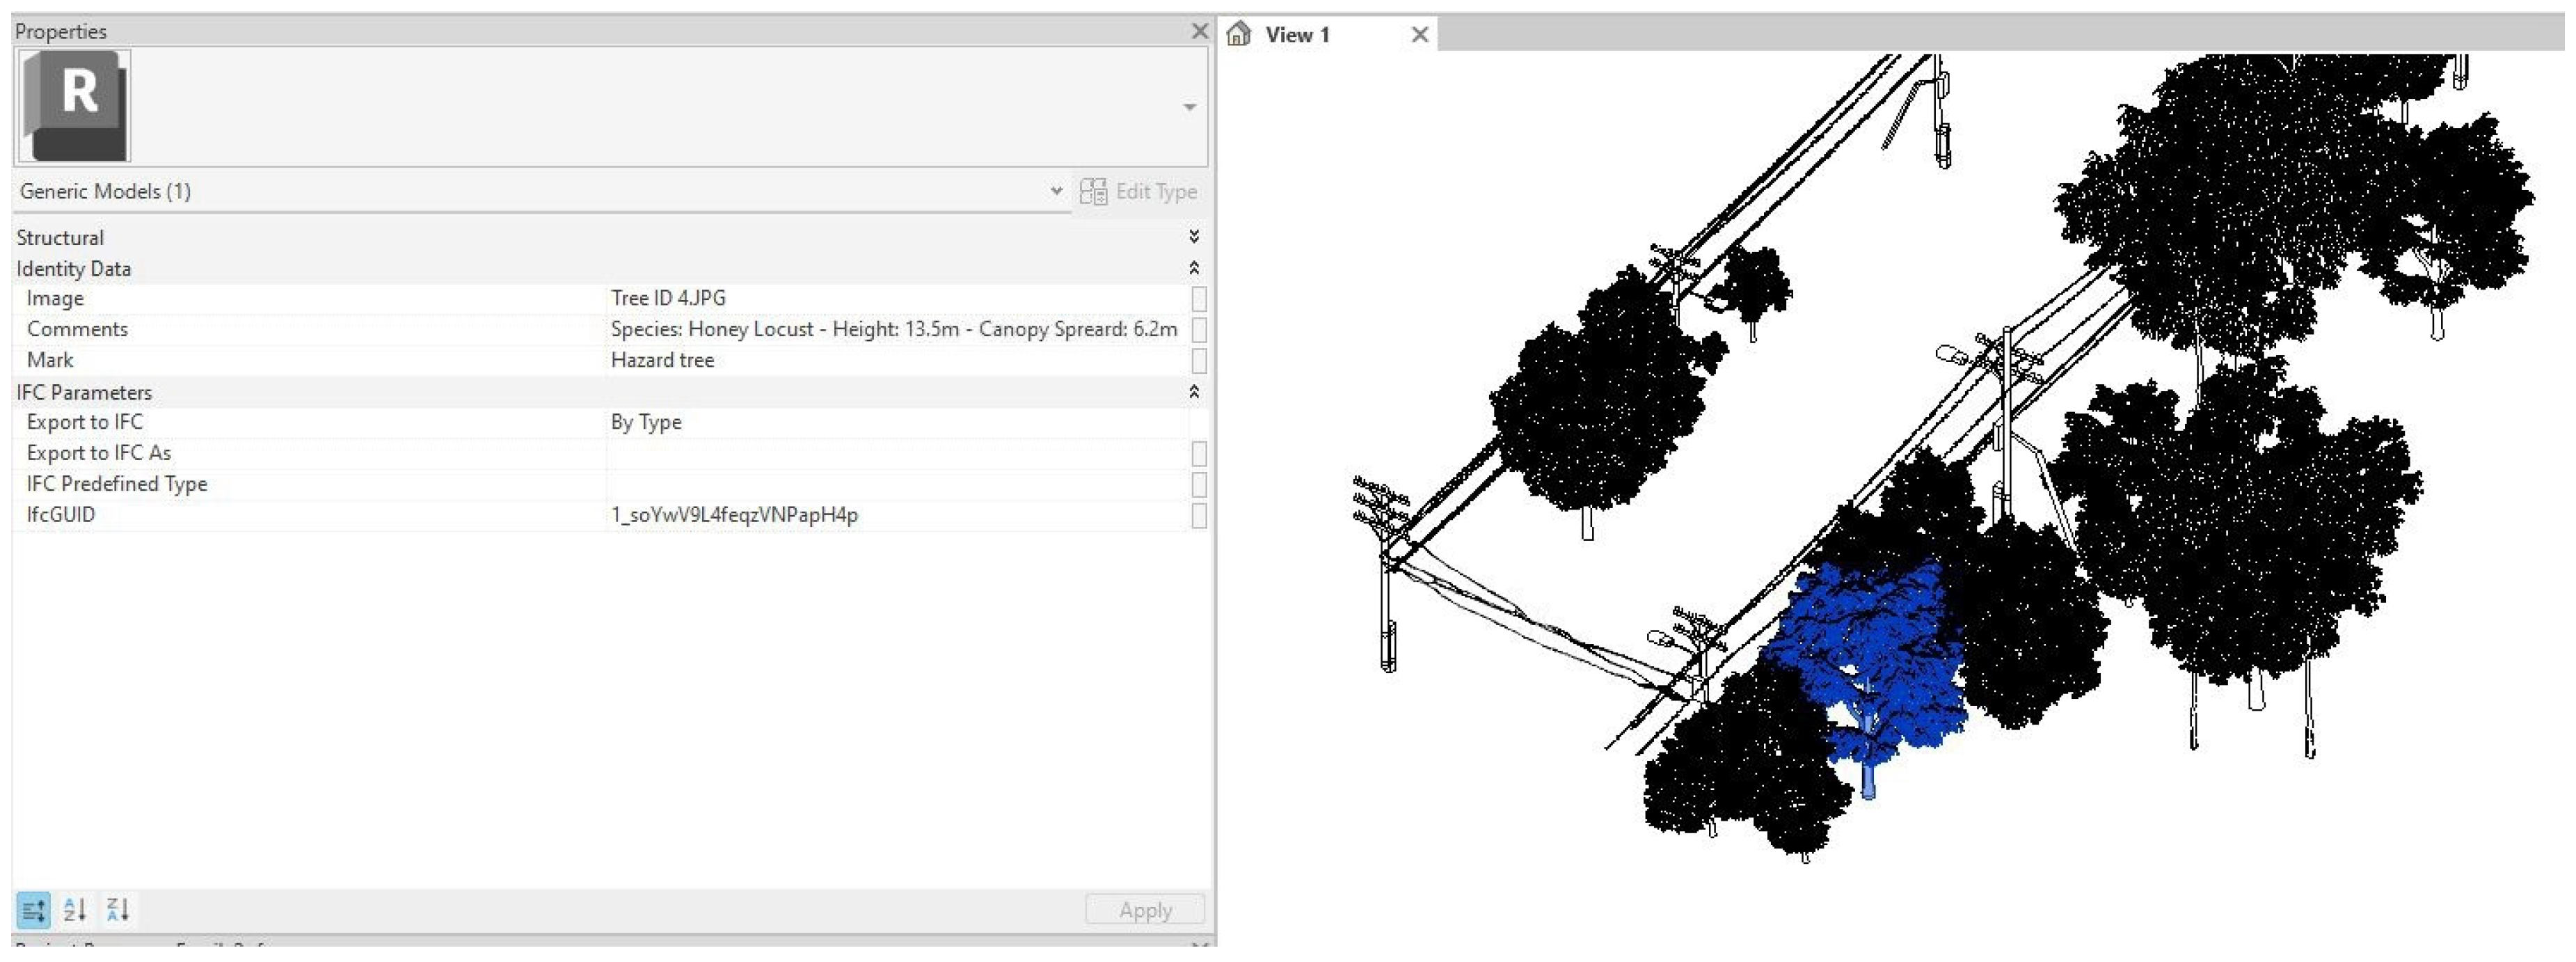
The MBB algorithm was applied to determine the bounding boxes for the trees, and these values were used to calculate the height and canopy spread for each tree. Once calculated, these attributes were incorporated into the digital twin in Autodesk Revit. The tree models were assigned attributes such as tree ID, tree image, tree type, tree height, and canopy spread. The trees identified as posing potential hazards based on the results from the post-processing step are marked as ‘hazard trees’ within the model. Figure 10a,b illustrates the visualization of a tree cluster and an example application of the MBB algorithm, respectively. Table 9 presents the geometric information derived from the MBB for a sample cluster. The visualization of these attributes in Autodesk Revit, as demonstrated in Figure 11 shows an example of a tree model integrated with semantic information in Revit.
Future implementations of the digital twin model could incorporate additional attributes such as root structure, health and condition, growth rate, and branch density and brittleness, further enhancing the model’s utility for power distribution management.

5. Discussion

Digital twins deliver a responsive, regularly updated virtual depiction of power lines, poles, and vegetation, capable of integration into a federated digital twin at the city scale. The research outlined in this paper is constrained by the current static nature of the developed digital twin. Nevertheless, through the incorporation of multiple data streams, such as point clouds, GIS data, satellite imagery, and real time weather updates, the digital twin can evolve into a precise, adaptive model tailored for managing vegetation around power line networks. An essential benefit of this digital twin stems from its potential to model and anticipate the impacts of elements like vegetation growth and severe weather on overhead power lines. This forecasting function can be strengthened via deep learning (DL) algorithms, which support reliable predictions of vegetation dynamics and yield practical guidance for proactive management [5,6]. Vital characteristics, including tree height, canopy spread, and species types, prove essential for analyzing threats to power systems. Tree height assists in spotting dangers from plants that match or exceed pole elevations, whereas canopy spread reveals lateral intrusions even from distant trunks. Species type supplies additional details, facilitating estimates of expansion trends and tailored maintenance plans. Embedding these features within the digital twin improves risk assessment, equipping utility operators with a solid structure for addressing vegetation induced threats.
In addition, this digital twin can incorporate weather simulation to examine and mitigate compound risks, such as the combination of strong winds and dense tree canopies, which heighten the likelihood of service interruptions. Through the review of past weather records and the inclusion of current predictions, this digital twin can actively revise risk profiles, supporting prompt actions like anticipatory trimming or functional modifications to reduce outages. Such immediate flexibility shifts network oversight from responsive to anticipatory, thereby improving resource allocation [7,8]. Furthermore, this digital twin promotes teamwork across organizations by functioning as a unified hub that consolidates information among units. This collective view of system states strengthens communication and coordinates groups toward shared goals, including reliability and resilience. The ability to model results from different vegetation management tactics, such as adjusted trimming timelines or the introduction of low maintenance species, encourages eco-friendly methods that harmonize functional needs with ecological priorities.
Although establishing and sustaining digital twins demands upfront resources, their exceptional advantages validate the commitment. In contrast to static models, they supply not just visual displays but also practical knowledge for tactical decision making. For instance, predictive growth models guided by species specific data and environmental conditions (for example, climate, soil) enable accurate projections of tree intrusions on power lines. Embracing digital twins also creates opportunities for enduring vegetation management. By refining pruning timetables and utilizing targeted cutting approaches, they decrease carbon emissions linked to vegetation care. Whereas conventional techniques emphasize eliminating imminent risks, digital twins support extended planning that safeguards mature trees while upholding network security. This strategy synchronizes utility oversight objectives with ecological responsibility, boosting biodiversity and urban air quality [96,97].
Existing production software for powerline corridor analysis often provides basic classification of power poles, conductors, vegetation, and ground surfaces using predefined rules or heuristic algorithms. However, these tools are generally limited in their ability to handle dense urban contexts, support semantic enrichment, or perform proximity detection at fine spatial resolution. Additionally, most commercial platforms do not support integration with city-scale digital twins or adaptive vegetation modeling. The proposed framework addresses these limitations by incorporating deep learning-based segmentation, post-processing for risk interpretation, and 3D semantic modeling, enabling more flexible and intelligent vegetation management strategies. While the initial training phase of the deep learning model requires substantial computational resources, this investment is offset by the framework’s scalability and automation capabilities. Once trained, the model can be deployed efficiently across large-scale LiDAR datasets without further manual intervention. In contrast, manual inspection of dense urban point clouds is time-consuming, resource-intensive, and unsuitable for widespread deployment. Consequently, the proposed approach presents a practical trade-off, favoring higher upfront processing in exchange for long-term operational efficiency, consistency, and adaptability in utility-scale vegetation monitoring.

6. Conclusions and Future Work

This paper presented a comprehensive approach for urban vegetation management in proximity to power distribution lines using LiDAR point cloud data and advanced deep learning techniques. By employing the RandLA-Net model for semantic segmentation, we achieved high accuracy in classifying trees, power lines, and poles. A thorough sensitivity analysis was conducted to optimize the model’s hyperparameters, enhancing its performance and providing insights into the impact of different configurations on segmentation accuracy. The model with an increased number of points and feature dimensions showed the best performance, achieving an overall accuracy of 96.90% and IoU scores of 97.05% for trees, 87.44% for power distribution lines, and 82.33% for poles. Additionally, an auxiliary 4-class model was trained to focus on vegetation, poles, and power lines, demonstrating improved IoUs of 99.55% for vegetation, 88.79% for poles, and 87.18% for utility lines. This targeted model highlights potential enhancements for safety-critical applications by reducing noise from extraneous classes, while the sensitivity analysis on the full 9-class model ensures a reproducible, comprehensive approach for holistic digital twin creation that captures all urban elements.
Post-processing techniques, including DBSCAN clustering and rule-based thresholding, were applied to refine the segmentation results, isolating significant urban features and reducing noise. Proximity detection using KDTree structures enabled efficient assessment of vegetation-related risks by identifying hazardous tree areas in close proximity to power lines.
A key contribution of this work is the development of a digital twin of the power distribution network. By creating detailed 3D models of vegetation, poles, and power lines through 3D object registration and surface generation, we provided a dynamic and interactive representation of the physical infrastructure. Semantic attributes, such as tree height and canopy spread, were integrated into the digital twin and incorporated into CIM using Autodesk Revit. This integration enhances decision-making for urban infrastructure planning and proactive vegetation management, supporting maintenance teams in prioritizing high-risk areas and optimizing resource allocation.
Despite the promising results, there are limitations to this study. The findings rely on the Toronto-3D dataset, which may not fully represent diverse urban and suburban landscapes. This dataset, collected in a specific geographic area with limited vegetation types and seasonal variations (e.g., captured at a couple of dates in the year), provides a valid initial test for urban settings but restricts broader applicability. The performance of the RandLA-Net model and the proposed framework in different or more complex environments requires further exploration. Additionally, the computational demands of processing large-scale point cloud data and generating digital twins may limit the feasibility of these methods in resource-constrained settings.
Future work should focus on testing the proposed framework across a variety of environments to assess its generalizability. This includes validation on multi-geographic datasets (e.g., incorporating tropical, rural, or seasonally diverse vegetation from UAV-LiDAR collections or similar sources) to evaluate robustness against varying vegetation types, climates, and temporal changes. Refining the algorithms for broader applicability and computational efficiency is essential. Integrating additional data sources, such as real-time environmental data, and incorporating predictive analytics to forecast vegetation growth patterns could further enhance the digital twin’s utility. Furthermore, exploring the integration of the digital twin with other infrastructure management systems could provide a more holistic approach to urban planning and risk mitigation.

Author Contributions

Conceptualization, F.B. and A.H.; methodology, F.B.; software, F.B.; validation, F.B., M.N.-B. and A.H.; formal analysis, F.B. and A.H.; investigation, F.B.; resources, F.B. and A.H.; data curation, F.B.; writing—original draft preparation, F.B.; writing—review and editing, F.B. and A.H.; visualization, F.B.; supervision, M.N.-B. and A.H.; project administration, M.N.-B. and A.H.; funding acquisition, M.N.-B. and A.H. All authors have read and agreed to the published version of the manuscript.

Funding

This research received funding from the Volt-Age initiative at Concordia University with supplementary funding from Hydro-Quebec.

Data Availability Statement

The original data presented in the study are openly available in [Toronto-3D] at [https://github.com/WeikaiTan/Toronto-3D] (accessed on 18 August 2025).

Conflicts of Interest

The authors declare no conflicts of interest.

References

  1. Cao, W.; Wu, J.; Shi, Y.; Chen, D. Restoration of Individual Tree Missing Point Cloud Based on Local Features of Point Cloud. Remote Sens. 2022, 14, 1346. [Google Scholar] [CrossRef]
  2. Tan, W.; Qin, N.; Ma, L.; Li, Y.; Du, J.; Cai, G.; Yang, K.; Li, J. Toronto-3D: A large-scale mobile LiDAR dataset for semantic segmentation of urban roadways. In Proceedings of the 2020 IEEE/CVF Conference on Computer Vision and Pattern Recognition Workshops, Seattle, WA, USA, 14–19 June 2020. [Google Scholar]
  3. Hernández-López, D.; López-Rebollo, J.; Moreno, M.A.; Gonzalez-Aguilera, D. Automatic Processing for Identi-fication of Forest Fire Risk Areas along High-Voltage Power Lines Using Coarse-to-Fine LiDAR Data. Forests 2023, 14, 662. [Google Scholar] [CrossRef]
  4. Mongus, D.; Brumen, M.; Žlaus, D.; Kohek, Š.; Tomažič, R.; Kerin, U.; Kolmanič, S. A Complete Environmental Intelligence System for LiDAR-Based Vegetation Management in Power-Line Corridors. Remote Sens. 2021, 24, 5159. [Google Scholar] [CrossRef]
  5. Heluany, J.B.; Gkioulos, V. A review on digital twins for power generation and distribution. Int. J. Inf. Secur. 2024, 23, 1171–1195. [Google Scholar] [CrossRef]
  6. Qi, D.; Xi, X.; Tang, Y.; Zheng, Y.; Guo, Z. Real-time scheduling of power grid digital twin tasks in cloud via deep reinforcement learning. J. Cloud Comput. 2024, 13, 121. [Google Scholar] [CrossRef]
  7. Gao, P.; Du, W.; Lei, Q.; Li, J.; Zhang, S.; Li, N. NDVI Forecasting Model Based on the Combination of Time Series Decomposition and CNN—LSTM. Water Resour. Manag. 2023, 37, 1481–1497. [Google Scholar] [CrossRef]
  8. Dehghanian, P.; Zhang, B.; Dokic, T.; Kezunovic, M. Predictive risk analytics for weather-resilient operation of electric power systems. IEEE Trans. Sustain. Energy 2018, 10, 3–15. [Google Scholar] [CrossRef]
  9. Bahreini, F.; Hammad, A.; Nick-Bakht, M. Point Cloud-based Computer Vision Framework for Detecting Proximity of Trees to Power Distribution Lines. In Proceedings of the 41st International Symposium on Automation and Robotics in Construction, IAARC Publications, Lille, France, 3–5 June 2024; pp. 730–737. [Google Scholar] [CrossRef]
  10. Bahreini, F.; Nik-Bakht, M.; Hammad, A.; Gaha, M. Developing Computer Vison-based Digital Twin for Vegetation Management Near Power Distribution Networks. In Proceedings of the 42nd International Symposium on Automation and Robotics in Construction, IAARC Publications, Montreal, QC, Canada, 28–31 July 2025; pp. 1174–1181. [Google Scholar] [CrossRef]
  11. Hu, Q.; Yang, B.; Xie, L.; Rosa, S.; Guo, Y.; Wang, Z.; Trigoni, N.; Markham, A. Randla-net: Efficient semantic segmentation of large-scale point clouds. In Proceedings of the 2020 IEEE/CVF Conference on Computer Vision and Pattern Recognition, Seattle, WA, USA, 13–19 June 2020. [Google Scholar] [CrossRef]
  12. Kyuroson, A.; Koval, A.; Nikolakopoulos, G. Autonomous Point Cloud Segmentation for Power Lines Inspection in Smart Grid. IFAC-Pap. 2023, 56, 11754–11761. [Google Scholar] [CrossRef]
  13. Li, X.; Wang, R.; Chen, X.; Li, Y.; Duan, Y. Classification of Transmission Line Corridor Tree Species Based on Drone Data and Machine Learning. Sustainability 2022, 14, 8273. [Google Scholar] [CrossRef]
  14. Mohd Rapheal, M.S.A.; Farhana, A.; Mohd Salleh, M.R.; Abd Rahman, M.Z.; Majid, Z.; Musliman, I.A.; Abdullah, A.F.; Abd Latif, Z. Machine Learning Approach for Tenaga Nasional Berhad (TNB) Overhead Powerline and Electricity Pole Inventory Using Mobile Laser Scanning Data. Int. Arch. Photogramm. Remote Sens. Spat. Inf. Sci. 2022, 46, 239–246. [Google Scholar] [CrossRef]
  15. Mahoney, M.J.; Johnson, L.K.; Guinan, A.Z.; Beier, C.M. Classification and mapping of low-statured shrubland cover types in post-agricultural landscapes of the US Northeast. Int. J. Remote Sens. 2022, 43, 7117–7138. [Google Scholar] [CrossRef]
  16. Abongo, D.A.; Gaha, M.; Cherif, S.; Jaafar, W.; Houle, G.; Buteau, C. A novel framework for distribution power lines detection. In Proceedings of the 2023 IEEE Symposium on Computers and Communications ISCC, Gammarth, Tunisia, 9–12 July 2023. [Google Scholar]
  17. Wang, A.; Zhang, W.; Wei, X. A review on weed detection using ground-based machine vision and image processing techniques. Comput. Electron. Agric. 2019, 158, 226–240. [Google Scholar] [CrossRef]
  18. Liakos, K.; Busato, P.; Moshou, D.; Pearson, S.; Bochtis, D. Machine Learning in Agriculture: A Review. Sensors 2018, 18, 2674. [Google Scholar] [CrossRef] [PubMed]
  19. Haroun, F.M.E.; Deros, S.N.M.; Din, N.M. A review of vegetation encroachment detection in power transmission lines using optical sensing satellite imagery. arXiv 2020, arXiv:2010.01757. [Google Scholar] [CrossRef]
  20. Park, A.; Rajabi, F.; Weber, R. Slash or burn: Power line and vegetation classification for wildfire prevention. arXiv 2021, arXiv:2105.03804. [Google Scholar] [CrossRef]
  21. Oehmcke, S.; Li, L.; Revenga, J.C.; Nord-Larsen, T.; Trepekli, K.; Gieseke, F.; Igel, C. Deep learning-based 3D point cloud regression for estimating forest biomass. In Proceedings of the 30th International Conference on Advances in Geographic Information Systems, Seattle, WA, USA, 1–4 November 2022. [Google Scholar]
  22. Ozcanli, A.K.; Yaprakdal, F.; Baysal, M. Deep learning methods and applications for electrical power systems: A comprehensive review. Int. J. Energy Res. 2020, 44, 7136–7157. [Google Scholar] [CrossRef]
  23. Singh, H.; Dwivedi, R.K.; Kumar, A.; Mishra, V.K. A Review on AI Techniques Applied on Tree Detection in UAV and Remotely Sensed Imagery. In Proceedings of the 2022 11th International Conference on System Modeling & Advancement in Research Trends SMART, Moradabad, India, 16–17 December 2022; IEEE: New York, NY, USA, 2022; pp. 1446–1450. [Google Scholar] [CrossRef]
  24. Khodayar, M.; Liu, G.; Wang, J.; Khodayar, M.E. Deep learning in power systems research: A review. CSEE J. Power Energy Syst. 2021, 7, 209–220. [Google Scholar] [CrossRef]
  25. Nguyen, V.N.; Jenssen, R.; Roverso, D. Automatic autonomous vision-based power line inspection: A review of current status and the potential role of deep learning. Int. J. Electr. Power Energy Syst. 2018, 99, 107–120. [Google Scholar] [CrossRef]
  26. Zhao, L.; Hu, Y.; Yang, X.; Dou, Z.; Kang, L. Robust multi-task learning network for complex LiDAR point cloud data preprocessing. Expert Syst. Appl. 2024, 237, 121552. [Google Scholar]
  27. Rahman, M.M.; Tan, Y.; Xue, J.; Lu, K. Notice of Violation of IEEE Publication Principles: Recent Advances in 3D Object Detection in the Era of Deep Neural Networks: A Survey. IEEE Trans. Image Process. 2020, 29, 2947–2962. [Google Scholar] [CrossRef]
  28. Wang, Y.; Zhang, W.; Gao, R.; Jin, Z.; Wang, X. Recent advances in the application of deep learning methods to forestry. Wood Sci. Technol. 2021, 55, 1171–1202. [Google Scholar] [CrossRef]
  29. Koirala, A.; Walsh, K.B.; Wang, Z.; McCarthy, C. Deep learning—Method overview and review of use for fruit detection and yield estimation. Comput. Electron. Agric. 2019, 162, 219–234. [Google Scholar] [CrossRef]
  30. Pu, S.; Xie, L.; Ji, M.; Zhao, Y.; Liu, W.; Wang, L.; Yang, F.; Qiu, D. Real-time powerline corridor inspection by edge computing of UAV Lidar data. Int. Arch. Photogramm. Remote Sens. Spat. Inf. Sci. 2019, 42, 547–551. [Google Scholar] [CrossRef]
  31. Mantach, S.; Lutfi, A.; Moradi Tavasani, H.; Ashraf, A.; El-Hag, A.; Kordi, B. Deep Learning in High Voltage Engineering: A Literature Review. Energies 2022, 15, 5005. [Google Scholar] [CrossRef]
  32. Diez, Y.; Kentsch, S.; Fukuda, M.; Caceres, M.L.L.; Moritake, K.; Cabezas, M. Deep Learning in Forestry Using UAV-Acquired RGB Data: A Practical Review. Remote Sens. 2021, 13, 2837. [Google Scholar] [CrossRef]
  33. Kattenborn, T.; Leitloff, J.; Schiefer, F.; Hinz, S. Review on Convolutional Neural Networks (CNN) in vegetation remote sensing. ISPRS J. Photogramm. Remote Sens. 2021, 173, 24–49. [Google Scholar] [CrossRef]
  34. Alimi, O.A.; Ouahada, K.; Abu-Mahfouz, A.M. A Review of Machine Learning Approaches to Power System Security and Stability. IEEE Access 2020, 8, 113512–113531. [Google Scholar] [CrossRef]
  35. Datta, S.; Durairaj, S. Review of Deep Learning Algorithms for Urban Remote Sensing UsingUnmanned Aerial Vehicles (UAVs). Recent Adv. Comput. Sci. Commun. 2024, 17, e081223224285. [Google Scholar] [CrossRef]
  36. Toronto-3D GitHub Repository. Available online: https://github.com/WeikaiTan/Toronto-3D (accessed on 20 September 2024).
  37. Qi, C.R.; Yi, L.; Su, H.; Guibas, L.J. Pointnet++: Deep hierarchical feature learning on point sets in a metric space. Adv. Neural Inf. Process. Syst. 2017, 30. [Google Scholar] [CrossRef]
  38. Thomas, H.; Qi, C.R.; Deschaud, J.-E.; Marcotegui, B.; Goulette, F.; Guibas, L.J. Kpconv: Flexible and deformable convolution for point clouds. In Proceedings of the 2019 IEEE/CVF International Conference on Computer Vision (ICCV), Seoul, Republic of Korea, 27 October–2 November 2019; pp. 6411–6420. [Google Scholar] [CrossRef]
  39. Lu, D.; Zhou, J.; Gao, K.Y.; Du, J.; Xu, L.; Li, J. Dynamic clustering transformer network for point cloud segmentation. Int. J. Appl. Earth Obs. Geoinf. 2024, 128, 103791. [Google Scholar] [CrossRef]
  40. Zeng, Z.; Xu, Y.; Xie, Z.; Tang, W.; Wan, J.; Wu, W. Large-scale point cloud semantic segmentation via local perception and global descriptor vector. Expert Syst. Appl. 2024, 246, 123269. [Google Scholar] [CrossRef]
  41. Wang, Y.; Sun, Y.; Liu, Z.; Sarma, S.E.; Bronstein, M.M.; Solomon, J.M. Dynamic graph cnn for learning on point clouds. ACM Trans. Graph. (Tog) 2019, 38, 1–12. [Google Scholar] [CrossRef]
  42. Bahreini, F.; Hammad, A. Point Cloud Semantic Segmentation of Concrete Surface Defects Using Dynamic Graph CNN. In Proceedings of the International Symposium on Automation and Robotics in Construction, Dubai, United Arab Emirates, 2–4 November 2021. [Google Scholar] [CrossRef]
  43. Bahreini, F.; Hammad, A. Dynamic graph CNN based semantic segmentation of concrete defects and as-inspected modeling. Autom. Constr. 2024, 159, 105282. [Google Scholar] [CrossRef]
  44. Gollob, C.; Krassnitzer, R.; Ritter, T.; Tockner, A.; Erber, G.; Kühmaier, M.; Hönigsberger, F.; Varch, T.; Holzinger, A.; Stampfer, K.; et al. Measurement of Individual Tree Parameters with Carriage-Based Laser Scanning in Cable Yarding Operations. Croat. J. For. Eng. J. Theory Appl. For. Eng. 2023, 44, 401–407. [Google Scholar] [CrossRef]
  45. Gaha, M.; Jaafar, W.; Fakhfekh, J.; Houle, G.; Abderrazak, J.B.; Bourgeois, M. Anew lidar-based approach for poles and distribution lines detection and modelling. Comput. Sci. Inf. Technol. 2021, 11, 85–97. [Google Scholar]
  46. Liu, Y.; Tian, B.; Lv, Y.; Li, L.; Wang, F.-Y. Point cloud classification using content-based transformer via clustering in feature space. IEEE/CAA J. Autom. Sin. 2023, 11, 231–239. [Google Scholar] [CrossRef]
  47. Gribov, A.; Duri, K. Reconstruction of power lines from point clouds. In Proceedings of the International Conference on Document Analysis and Recognition, San José, CA, USA, 21–26 August 2023; Springer Nature: Cham, Switzerland, 2023; pp. 105–119. [Google Scholar] [CrossRef]
  48. Amado, M.; Lopes, F.; Dias, A.; Martins, A. LiDAR-based power assets extraction based on point cloud data. In Proceedings of the 2021 IEEE International Conference on Autonomous Robot Systems and Competitions, Santa Maria da Feira, Portugal, 28–29 April 2021; pp. 221–227. [Google Scholar] [CrossRef]
  49. Awrangjeb, M. Extraction of power line pylons and wires using airborne lidar data at different height levels. Remote Sens. 2019, 11, 1798. [Google Scholar] [CrossRef]
  50. Li, X.; Guo, Y. Application of LiDAR technology in power line inspection. IOP Conf. Ser. Mater. Sci. Eng. 2018, 382, 052025. [Google Scholar] [CrossRef]
  51. Horning, N. Land cover mapping with ultra-high-resolution aerial imagey. Remote Sens. Ecol. Conserv. 2020, 6, 429–430. [Google Scholar] [CrossRef]
  52. Al-Najjar, A.; Amini, M.; Rajan, S.; Green, J.R. Identifying Areas of High-risk Vegetation Encroachment on Electrical Powerlines using Mobile and Airborne Laser Scanned Point Clouds. IEEE Sens. J. 2024, 24, 22129–22143. [Google Scholar] [CrossRef]
  53. Zhou, Y.; Feng, Z.; Chen, C.; Yu, F. Bilinear Distance Feature Network for Semantic Segmentation in PowerLine Corridor Point Clouds. Sensors 2024, 24, 5021. [Google Scholar] [CrossRef]
  54. Sun, Q.; Ding, Y.; Chen, Q.; Tian, K. Transmission Line Detection Method Based on Improved Res2Net-YOLACT Model. In Proceedings of the International Conference on the Efficiency and Performance Engineering Network, Qingdao, China, 8–11 May 2024; Springer: Cham, Switzerland, 2024; pp. 71–80. [Google Scholar] [CrossRef]
  55. Li, J.; Zheng, H.; Liu, P.; Liang, Y.; Shuang, F.; Huang, J. Safety monitoring method for powerline corridors based on single-stage detector and visual matching. High Volt. 2024, 9, 805–815. [Google Scholar] [CrossRef]
  56. Sey, N.E.N.; Amo-Boateng, M.; Domfeh, M.K.; Kabo-Bah, A.T.; Antwi-Agyei, P. Deep learning-based framework for vegetation hazard monitoring near powerlines. Spat. Inf. Res. 2023, 31, 501–513. [Google Scholar] [CrossRef]
  57. Shi, Y.; Kissling, W.D. Performance, effectiveness and computational efficiency of powerline extraction methods for quantifying ecosystem structure from light detection and ranging. GISci. Remote Sens. 2023, 60, 2260637. [Google Scholar] [CrossRef]
  58. ElGharbawi, T.; Susaki, J.; Chureesampant, K.; Arunplod, C.; Thanyapraneedkul, J.; Limlahapun, P.; Suliman, A. Performance evaluation of convolution neural networks in canopy height estimation using sentinel 2 data, ap-plication to Thailand. Int. J. Remote Sens. 2023, 44, 1726–1748. [Google Scholar] [CrossRef]
  59. Wang, G.; Wang, L.; Wu, S.; Zu, S.; Song, B. Semantic Segmentation of Transmission Corridor 3D Point Clouds Based on CA-PointNet++. Electronics 2023, 12, 2829. [Google Scholar] [CrossRef]
  60. Cano-Solis, M.; Ballesteros, J.R.; Sanchez-Torres, G. VEPL-Net: A Deep Learning Ensemble for Automatic Seg-mentation of Vegetation Encroachment in Power Line Corridors Using UAV Imagery. ISPRS Int. J. Geo-Inf. 2023, 12, 454. [Google Scholar] [CrossRef]
  61. Gazzea, M.; Pacevicius, M.; Dammann, D.O.; Sapronova, A.; Lunde, T.M.; Arghandeh, R. Automated power lines vegetation monitoring using high-resolution satellite imagery. IEEE Trans. Power Deliv. 2021, 37, 308–316. [Google Scholar] [CrossRef]
  62. Almeida, C.; Gerente, J.; Prazeres Campos, J.; Caruso Gomes Junior, F.; Providelo, L.A.; Marchiori, G.; Chen, X. Canopy Height Mapping by Sentinel 1 and 2 Satellite Images, Airborne LiDAR Data, and Machine Learning. Remote Sens. 2022, 14, 4112. [Google Scholar] [CrossRef]
  63. Chen, Y.; Lin, J.; Liao, X. Early detection of tree encroachment in high voltage powerline corridor using growth model and UAV-borne LiDAR. Int. J. Appl. Earth Obs. Geoinf. 2022, 108, 102740. [Google Scholar] [CrossRef]
  64. Qayyum, A.; Razzak, I.; Malik, A.S.; Anwar, S. Fusion of CNN and sparse representation for threat estimation near power lines and poles infrastructure using aerial stereo imagery. Technol. Forecast. Soc. Change 2021, 168, 120762. [Google Scholar] [CrossRef]
  65. Kandanaarachchi, S.; Anantharama, N.; Munoz, M.A. Early detection of vegetation ignition due to powerline faults. IEEE Trans. Power Deliv. 2020, 36, 1324–1334. [Google Scholar] [CrossRef]
  66. Vemula, S.; Frye, M. Multi-head attention based transformers for vegetation encroachment over powerline corridors using UAV. In Proceedings of the 2021 IEEE/AIAA 40th Digital Avionics Systems Conference, San Antonio, TX, USA, 3–7 October 2021; IEEE: New York, NY, USA, 2021; pp. 1–5. [Google Scholar] [CrossRef]
  67. Ma, J.; Cheng, J.C.; Jiang, F.; Gan, V.J.; Wang, M.; Zhai, C. Real-time detection of wildfire risk caused by powerline vegetation faults using advanced machine learning techniques. Adv. Eng. Inform. 2020, 44, 101070. [Google Scholar] [CrossRef]
  68. Nardinocchi, C.; Balsi, M.; Esposito, S. Fully automatic point cloud analysis for powerline corridor mapping. IEEE Trans. Geosci. Remote Sens. 2020, 58, 8637–8648. [Google Scholar] [CrossRef]
  69. Sankaran, S.; Majumder, S.; Viswanathan, A.; Guttal, V. Clustering and correlations: Inferring resilience from spatial patterns in ecosystems. Methods Ecol. Evol. 2019, 10, 2079–2089. [Google Scholar] [CrossRef]
  70. Ahmad, A.; Khan, S.S. Survey of State-of-the-Art Mixed Data Clustering Algorithms. IEEE Access 2019, 7, 31883–31902. [Google Scholar] [CrossRef]
  71. Tchórzewski, J.; Kania, T. Cluster analysis on the example of work data of the National Power System. Part 2. Research and selected results. Stud. Inform. 2021, 23, 25–42. [Google Scholar] [CrossRef]
  72. Gao, H. Agricultural Soil Data Analysis Using Spatial Clustering Data Mining Techniques. In Proceedings of the 2021 IEEE 13th International Conference on Computer Research and Development ICCRD, Beijing, China, 29 March 2021; IEEE: New York, NY, USA; pp. 83–90. [Google Scholar] [CrossRef]
  73. Chen, H.; Xie, T.; Liang, M.; Liu, W.; Liu, P.X. A local tangent plane distance-based approach to 3D point cloud segmentation via clustering. Pattern Recognit. 2023, 137, 109307. [Google Scholar] [CrossRef]
  74. Glumova, E.; Filinskih, A. Investigation of Algorithms for Generating Surfaces of 3D Models Based on an Un-structured Point Cloud. In Proceedings of the International Conference Computing for Physics and Technology, Bryansk State Technical University, Pushchino, Moscow Region, Russia, 15 March 2020; pp. 287–293. [Google Scholar] [CrossRef]
  75. Ismail, F.A.; Shukor, S.A.A.; Rahim, N.A.; Wong, R. Surface Reconstruction from Unstructured Point Cloud Data for Building Digital Twin. Int. J. Adv. Comput. Sci. Appl. 2023, 14, 0141075. [Google Scholar] [CrossRef]
  76. Tagarakis, A.C.; Benos, L.; Kyriakarakos, G.; Pearson, S.; Sørensen, C.G.; Bochtis, D. Digital Twins in Agriculture and Forestry: A Review. Sensors 2024, 24, 3117. [Google Scholar] [CrossRef]
  77. Chen, C.; Wang, H.; Wang, D.; Wang, D. Towards the digital twin of urban forest: 3D modeling and parame-terization of large-scale urban trees from close-range laser scanning. Int. J. Appl. Earth Obs. Geoinf. 2024, 127, 103695. [Google Scholar] [CrossRef]
  78. Zhang, W.; Li, W. Construction of Environment-Sensitive Digital Twin Plant Model for Ecological Indicators Analysis. J. Digit. Landsc. Archit. 2024, 9, 18–28. [Google Scholar]
  79. Gobeawan, L.; Wise, D.J.; Wong, S.T.; Yee, A.T.; Lim, C.W.; Su, Y. Tree species modelling for digital twin cities. Trans. Comput. Sci. 2021, 12620, 17–35. [Google Scholar]
  80. Buonocore, L.; Yates, J.; Valentini, R. A Proposal for a Forest Digital Twin Framework and Its Perspectives. Forests 2022, 13, 498. [Google Scholar] [CrossRef]
  81. Kim, T.; Cho, W.; Matono, A.; Kim, K.-S. PinSout: Automatic 3D Indoor Space Construction from Point Clouds with Deep Learning. In Proceedings of the 28th International Conference on Advances in Geographic Information Systems, ACM, Seattle WA, USA, 3–6 November 2020; pp. 211–214. [Google Scholar] [CrossRef]
  82. La Guardia, M.; Koeva, M. Towards Digital Twinning on the Web: Heterogeneous 3D Data Fusion Based on Open-Source Structure. Remote Sens. 2023, 15, 721. [Google Scholar] [CrossRef]
  83. Wu, Y.; Shang, J.; Xue, F. RegARD: Symmetry-Based Coarse Registration of Smartphone’s Colorful Point Clouds with CAD Drawings for Low-Cost Digital Twin Buildings. Remote Sens. 2021, 13, 1882. [Google Scholar] [CrossRef]
  84. Agapaki, E.; Brilakis, I. Geometric Digital Twinning of Industrial Facilities: Retrieval of Industrial Shapes. arXiv 2022, arXiv:2202.04834. [Google Scholar] [CrossRef]
  85. Li, Y.; Ma, L.; Tan, W.; Sun, C.; Cao, D.; Li, J. GRNet: Geometric relation network for 3D object detection from point clouds. ISPRS J. Photogramm. Remote Sens. 2020, 165, 43–53. [Google Scholar] [CrossRef]
  86. Shu, J.; Zandi, K.; Topac, T.; Chen, R.; Fan, C. Automated Generation of FE Model for Digital Twin of Concrete Structures from Segmented 3D Point Cloud. In Structural Health Monitoring 2019; DEStech Publications, Inc.: Lancaster, PA, USA, 2019. [Google Scholar] [CrossRef]
  87. Truong-Hong, L. Transform Physical Assets to 3D Digital Models. Eng. Proc. 2022, 17, 5. [Google Scholar] [CrossRef]
  88. Ahmed, K.N.; Razak, T.A. A comparative study of different density based spatial clustering algorithms. Int. J. Comput. Appl. 2014, 99, 8887. [Google Scholar] [CrossRef]
  89. Pauly, M.; Keiser, R.; Gross, M. Multi-scale feature extraction on point-sampled surfaces. In Computer Graphics Forum; Wiley Online Library; Blackwell Publishing, Inc.: Oxford, UK, 2003; pp. 281–289. [Google Scholar]
  90. Buhmann, M.D. Radial basis functions. Acta Numer. 2000, 9, 1–38. [Google Scholar] [CrossRef]
  91. Sun, X.; Luo, Q. Density-Based Geometry Compression for LiDAR Point Clouds. In Proceedings of the 26th International Conference on Extending Database Technology (EDBT), Tampere, Finland, 28–31 March 2023; pp. 378–390. [Google Scholar]
  92. Besl, P.J.; McKay, N.D. Method for registration of 3-D shapes. In Sensor Fusion IV: Control Paradigms and Data Structures; Society of Photo Optical: Bellingham, WA, USA, 1992; pp. 586–606. [Google Scholar]
  93. Open3d. Open3D Primary Documentation, Open3d Geometry—Axis Aligned Bounding Box. 2018. Available online: https://www.open3d.org/docs/latest/python_api/open3d.geometry.AxisAlignedBoundingBox.html?utm_source=chatgpt.com (accessed on 2 October 2025).
  94. Sketchfab Inc. 2024. Available online: https://sketchfab.com/ (accessed on 20 September 2024).
  95. CGTrader. 2024. Available online: https://www.cgtrader.com/ (accessed on 20 September 2024).
  96. Petri, A.C.; Koeser, A.K.; Lovell, S.T.; Ingram, D. How green are trees?—Using life cycle assessment methods to assess net environmental benefits. J. Environ. Hortic. 2016, 34, 101–110. [Google Scholar] [CrossRef]
  97. Stephenson, N.L.; Das, A.; Condit, R.; Russo, S.; Baker, P.; Beckman, N.G.; Coomes, D.; Lines, E.; Morris, W.; Rüger, N. Rate of tree carbon accumulation increases continuously with tree size. Nature 2014, 507, 90–93. [Google Scholar] [CrossRef]
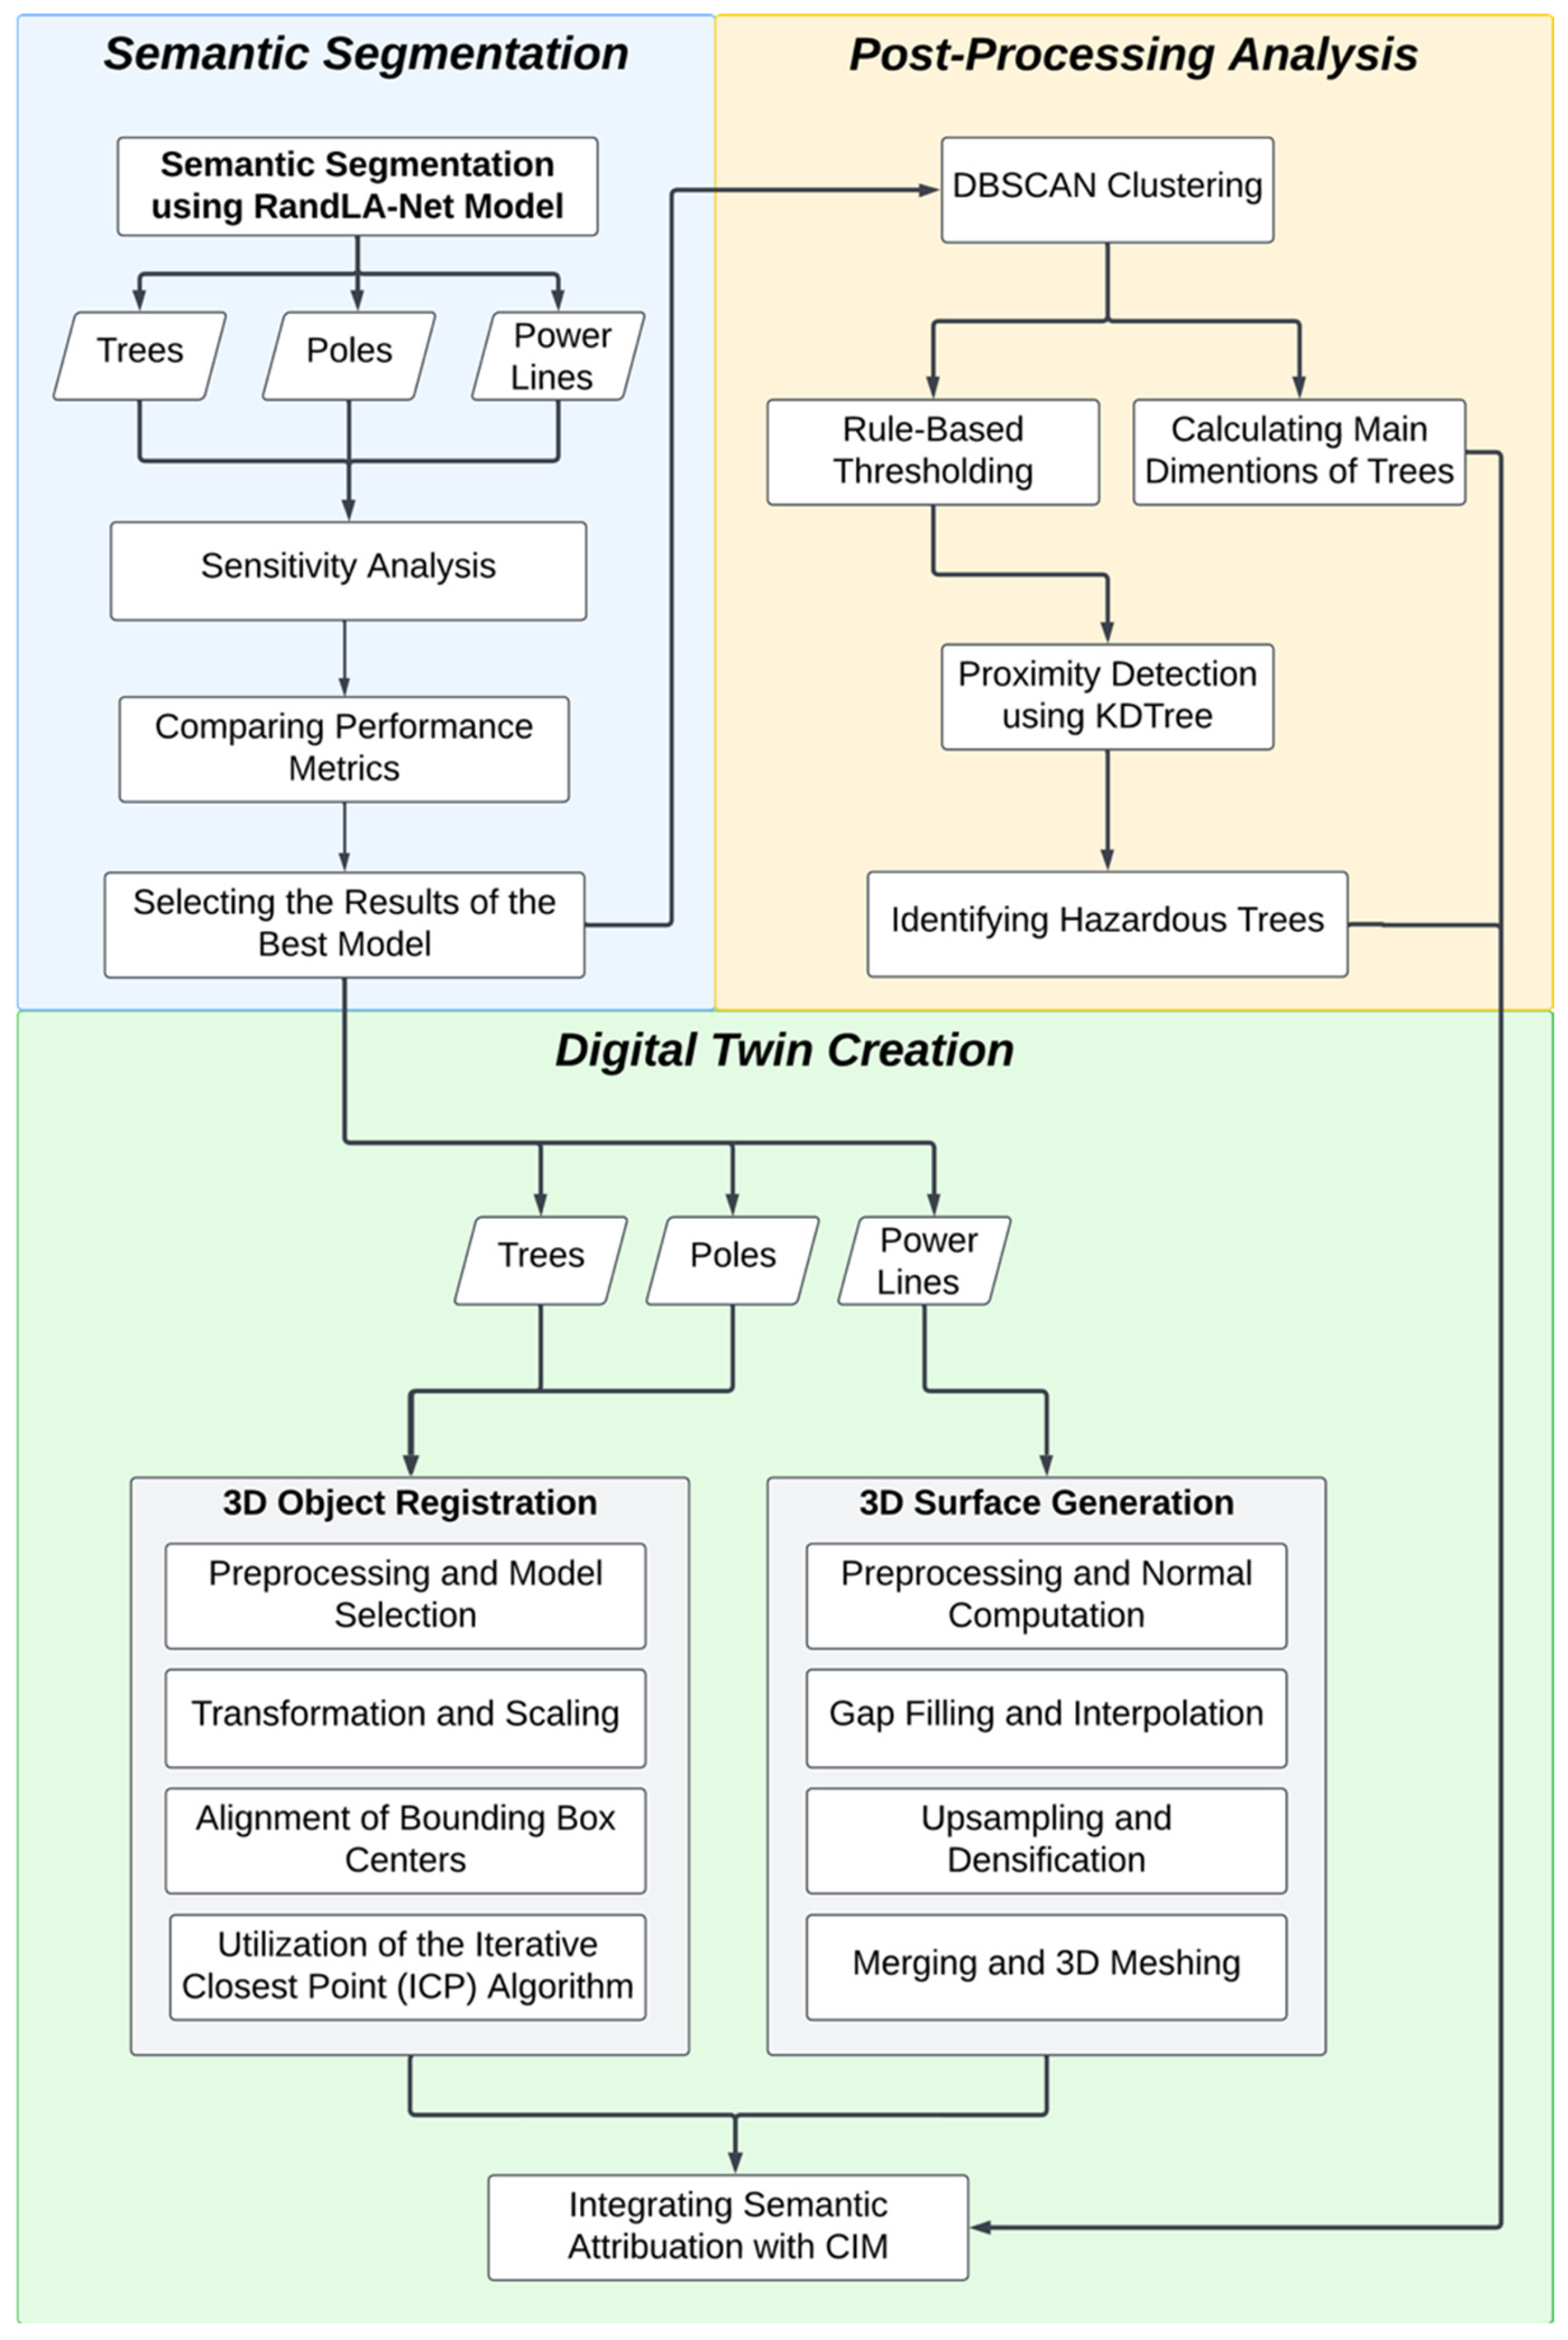
Figure 1. Overview of the proposed framework.
Remotesensing 17 03565 g001
Figure 2. A sample area of point cloud data.
Remotesensing 17 03565 g002
Figure 3. Comparing segmentation results before and after clustering and rule-based thresholding.
Remotesensing 17 03565 g003
Figure 4. Post-processed result of semantic segmentation, highlighting hazardous tree areas.
Remotesensing 17 03565 g004
Figure 5. An example of gap filling and 3D mesh generation for utility line segments.
Remotesensing 17 03565 g005
Figure 6. Pole and tree libraries; (a) Pole 3D model Library, (b) Tree 3D model Library.
Remotesensing 17 03565 g006
Figure 7. An example of 3D surface registration for a Pole.
Remotesensing 17 03565 g007
Figure 8. An example of 3D surface registration for a tree.
Remotesensing 17 03565 g008
Figure 9. Three-dimensional model of trees, poles and power lines based on point cloud data.
Remotesensing 17 03565 g009
Figure 10. Visualization and MMB calculation of a tree sample. (a) Visualization of a cluster of a tree sample; (b) An example of MBB for a sample cluster.
Remotesensing 17 03565 g010
Figure 11. An example of a tree 3D model integrated with semantic information in Revit.
Remotesensing 17 03565 g011
Table 1. Semantic segmentation performance on the Toronto-3D dataset.
MethodVegetation IoU (%)Utility Line
IoU (%)
Pole
IoU (%)
StrengthLimitation
PointNet++ MSG [37]86.1360.9662.81Effective hierarchical feature learning for local detailsHigh computational and memory demands; slow for large-scale datasets like Toronto-3D.
DGCNN [41]91.2562.4062.32Good at capturing dynamic graph structures in point cloudsLimited scalability for high-density urban data; prone to overfitting on unbalanced classes.
KPConv (KPFCNN) [38]96.0787.6881.56Strong local context via kernel convolutions, high accuracy on complex shapesRequires substantial GPU resources and long training times; not ideal for resource-constrained sensitivity analysis.
DCTNet [39]85.5181.7984.03Effective dual-branch design for multi-scale featuresVariable performance on poles; requires additional modalities for optimal results, reducing practicality.
LACV-Net (RGB) [40]97.387.383.4High accuracy with RGB integration, strong on vegetation classesComplex local attention increases training time and overhead; less scalable for million-point urban clouds vs. efficient sampling methods.
RandLA-Net [11] (Optimized Full 9-Class, with RGB + Intensity—this study)97.0588.0982.33Efficient random sampling for large-scale data; high IoUs across urban classes with sensitivity optimizationRandom sampling may overlook subtle details in sparse/noisy regions (mitigated by attentive pooling and feature aggregation).
RandLA-Net [11] (Auxiliary 4-Class, with RGB + Intensity—this study)99.5587.1888.79Targeted high accuracy for key classes (vegetation, lines, poles); adaptable for specialized risk assessmentRandom sampling may overlook subtle details in sparse/noisy regions (mitigated by attentive pooling and feature aggregation).
Table 2. Comparison of research papers focusing on vegetation and power line detection in last five years (2020–2024).
ReferenceYearObjectiveInvestigated Network/TechniqueData SourceMain FocusML/DLPower line DetectionVegetation DetectionDetection of Vegetation Proximity to Power Lines
Bahreini et al. [9]2024Detect proximity of trees and power linesRandLA-Net with DBSCAN and KDTree for post-processing optimizationsToronto-3D—Point CloudDual focus on power line and vegetation detection with proximity analysis
Al-Najjar et al. [52]2024Detect vegetation encroachment on power linesPointCNN, RandLA-Net, P-BED AlgorithmMobile and airborne LiDAR Point CloudsVegetation and power line classification and proximity analysis
Zhou et al. [53]2024Segment power line corridor to detect vegetation hazardsBilinear Distance Feature Network (BDF-Net)Power line Corridor Point Cloud (PPCD)Semantic segmentation of power line corridor, including vegetation risks
Sun et al. [54]2024Monitor safety in Power line corridors and detect hazardsYOLOX with ConvNeXt backbone, EPNP for 3D rangingUAV LiDAR, surveillance camera imagesSafety distance and hazard detection in power line corridors--
Li et al. [55]2024Improve accuracy and speed of transmission line detectionRes2Net-YOLACT, Feature Pyramid Network, DIoU-NMSTransmission Tower/Power Line Aerial-Image (TTPLA)Transmission line detection for UAV-based inspections--
Sey et al. [56]2023Monitor vegetation encroachment near power linesPix2Pix GAN for NDVI estimation, YoLov5 for power line detectionUAV RGB and multispectral imageryVegetation health monitoring, power line detection, proximity assessment
Shi & Kissling [57]2023Evaluate power line removal methods to improve vegetation metricsPointCNN, eigenvalue decomposition, hybrid methodAirborne LiDARVegetation height, cover, and vertical variability metrics
Kyuroson et al. [12]2023Autonomous segmentation and analysis of power lines and vegetation Unsupervised ML (DBSCAN, Kd-tree, PCA)LiDAR—Unlabeled Point CloudPower line corridor monitoring for hazard detection and inspection of both vegetation and lines
ElGharbawi et al. [58]2023Estimate canopy heights along power lines for vegetation hazard monitoringSeg-Net, Res-NetS2 satellite data, airborne LiDARVegetation height estimation for encroachment monitoring-
Abongo et al. [16] 2023Efficient detection of distribution power linesXGBoost with geometric analysisLiDAR Dataset—Point CloudPower line detection in dense vegetation areas--
Gollob et al. [44] 2023Tree detection in forested areas SLAM algorithm with density-based clusteringMobile LiDAR—Point Clouds Detection of individual trees and structural analysis---
Wang et al. [59] 2023Semantic segmentation of transmission corridorCA-PointNet++ with Coordinate Attention moduleUAV Lidar dataset—Point CloudTransmission corridor vegetation and power line segmentation--
Cano-Solis et al. [60]2023Vegetation encroachment detection in power line corridorsVEPL-Net (DeepLab, U-Net, and VGG-16)VEPL Dataset (UAV RGB Orthomosaics)Vegetation and power line segmentation without proximity focus
Gazzea et al. [61]2022Develop a method to monitor vegetation encroachment near powerlinesSemi-supervised segmentation, supervised classification (NDVI, FCN)WorldView-2, Pleiades-1 satellite images, LiDARMonitoring vegetation risks in powerline corridors-
Oehmcke et al. [21]2022Predict vegetated area biomass and wood volumeMinkowski-CNN, KPConv, PointNetAirborne LiDAR—Point CloudVegetated area biomass estimation--
Mahoney et al. [15]2022Classify and map vegetation typesStacked ensemble (Random Forest, GBM, ANN)LiDAR and Landsat satellite imageryClassification of vegetation types in post-agricultural landscapes--
Almeida et al. [62]2022Canopy height mappingRandom Forest, CART, Linear RegressionS1 and S2 satellite, airborne LiDARVegetation height estimation in transmission corridors
Mohd Rapheal et al. [14]2022Detect and classify power lines and polesRandom Forest, LiDAR360Mobile Laser Scanning (MLS) dataPower line and electricity pole inventory in suburban areas--
Li et al. [13]2022Classify tree species in transmission corridorsRandom forest, SVMLiDAR, Aerial imageryVegetation species classification in transmission corridors-
Chen et al. [63]2022Detection of tree encroachment using and growth models in high voltage power line corridorRichards’s growth model, two-phase tree encroachment detection algorithmUAV-borne LiDAR (Fujian, China)Vegetation encroachment detection and growth prediction
Qayyum et al. [64]2021Estimate vegetation threat near power linesCNN and sparse representation for disparity map estimationUAV and satellite stereo imageryVegetation height and proximity estimation for threat detection
Kandanaarachchi et al. [65]2021Detect vegetation ignition risks caused by high impedance faults near power linesFourier and Wavelet transforms, decision tree classifiersPower line Bushfire Safety Program (PBSP) datasetEarly detection of vegetation ignition risk
Vemula et al. [66]2021Detect vegetation encroachment near power linesVE-DETR, Multi-head Attention Transformer, ResNetUAV-acquired imageryVegetation encroachment detection and segmentation
Park et al. [20]2021Detect power lines and classify vegetation overgrowth for wildfire prevention.Feature-enhanced CNNs (AlexNet, ResNet18, VGG11), HOG, Hough TransformsGoogle Street View imagesClassification of vegetation encroachment for fire risk
Gaha et al. [45]2021Detect poles and power linesRANSAC, 3D Parabola Modeling, Cylinder DetectionMobile LiDAR Point Cloud Power line and pole detection for distribution networks-
Kattenborn et al. [33]2021Identify and classify vegetation traits (species, structure)CNN architectures (VGG, ResNet), multi-modal approachesHigh-resolution satellite imagery, UAV, LiDARSpecies classification, segmentation, and structure detection in vegetation--
Diez et al. [32]2021Review of DL applications for tree detection, species classification, and forest healthCNN (VGG, ResNet, U-Net), transfer learningUAV-acquired RGB dataTree detection, species classification, forest health monitoring--
Ma et al. [67]2020Detect vegetation-related wildfire risks caused by power line faultsHybrid Step XGBoost (HSXG)188 ignition field testsVegetation fault detection and ignition risk prediction
Nardinocchi et al. [68]2020Detect power lines and classify obstacles in power line corridors3-D Power Line Obstacle Detection (3-D-PowLOD) algorithmUAV LiDAR point clouds and airborne surveysPower line detection and obstacle classification, including vegetation-
Table 3. Comparative overview of most related works and their critical performance metrics.
ReferenceYearMethodologyUsed DatasetMain FocusIoU for ClassesComparative Highlights
Wang et al. [59] 2023CA-PointNet++ with Coordinate Attention moduleUtilized a self-constructed UAV Lidar datasetTransmission corridor segmentationPower lines: 67.4%Lacks proximity focus, lower IoU
Cano-Solis et al. [60]2023VEPL-Net focusing on ensemble methodsUAV imagery may lack LiDAR’s depth resolutionVegetation and power line segmentation without proximity focusVegetation: 77%, Power lines: 64%, showing room for improvementGood in vegetation detection, less so in detailed context, lacks proximity analysis
Abongo et al. [16]2023XGBoost with basic geometric analysisStandard LiDAR dataset without specified complexitySole focus on power line detectionPower lines: 82.49%Effective in basic detection, lacks complexity
Our study2025Advanced RandLA-Net with specific post-processing optimizationsToronto-3D, providing diverse urban landscape challengesDual focus on both power line and vegetation with proximity analysisTrees: 97.05%, Power lines: 88.09%, Poles:
82.33%
KDTree for proximity analysis, detailed class-specific IoU scores, and enhancing detection accuracy
Table 4. Comparative overview of digital twin creation from point cloud data in infrastructure contexts.
StudyYearAlgorithm OverviewMethodApplicationsFocusSpecific Context
Buonocore et al. [80]2024Use of digital twins in vegetation managementDynamic simulations for predicting tree growth and impact on infrastructurePower distribution line managementDirectly focused on digital twin creationVegetation management and power distribution
Chen et al. [77]2024Enhanced mesh fidelity from point cloudsIncorporating dynamic simulation data for accurate modelingPredictive modeling, risk assessment in power distribution line managementDirectly focused on digital twin creationPower distribution line management
Shu et al. [86]2024Hybrid approach for generating digital twins using segmented 3D point cloudsSegmenting geometry, converting to FE mesh, assigning material propertiesStructural health monitoring, real-time infrastructure evaluationDirectly focused on digital twin creation
Zhang & Li [78]2024Environment-sensitive digital twin plant modelGrowth simulation responsive to environmental factors using Blender and The Grove pluginEcological indicators analysis, urban planningDirectly focused on digital twin creationVegetation modeling and environmental impact
Ismail et al. [75]2023Surface reconstruction methods like Poisson and Ball Pivoting AlgorithmParameter testing for behavior and computational efficiencyEnhanced 3D modeling and digital twin creation for urban environmentsEvaluation of surface reconstruction techniques
Truong-Hong [87]2022Framework integrating spatial and contextual knowledge for object modelingEstimating parameters, filtering unrealistic objectsInfrastructure monitoring, inspection, managementFramework supporting the creation of accurate 3D models
Agapaki & Brilakis [84]2020Shape retrieval and matching point cloud clusters with CAD modelsDeep learning networks for classification and matchingIndustrial facility management, digital twin generationMatching algorithm for integrating CAD models and point clouds
Gobeawan et al. [79]2021Species-specific growth model integration within digital twinsMatching algorithms to fit models within point cloud spatial constraintsEnvironmental monitoring, urban planningDirectly focused on digital twin creationVegetation and environmental monitoring
La Guardia & Koeva [82]20203D Web navigation model fusing heterogeneous datasetsJavaScript libraries, WebGL for visualizing point clouds, BIM, and 3D modelsGovernmental and private sector decision-making, urban planningIntegration of visualization technologies for 3D model navigation
Li et al. [85]2020GRNet for detecting and modeling 3D objects using geometric relationshipsIntra-object and inter-object feature for 3D bounding box predictionIndoor mapping, robotic perception, building reconstructionAlgorithm for 3D object detection and modeling
Glumova & Filinskih [74]2020Surface reconstruction using depth maps and Delaunay triangulationKD-tree indexing for large datasets, Delaunay triangulation for 3D mesh constructionLarge-scale 3D modeling for urban environments and infrastructure managementSurface reconstruction method for generating detailed 3D models
Kim et al. [81]2020PinSout framework for 3D indoor space modeling from point clouds using deep learningPointNet for semantic segmentation, PCL for computing surface elements, 3DCityDB for exportIndoor modeling, digital twin creationFramework for generating 3D indoor models
Wu et al. [83]2020RegARD for registering colorful 3D point clouds with CAD drawingsArchitectural reflection detection, nonlinear optimizationIndustrial object modeling, CAD model reconstructionAlgorithm for aligning point clouds with CAD models
Table 5. Model’s hyperparameters.
CasesNumber of PointsSubsampling RatioFeature DimensionsKNNRGBIntensityLearning RateLearning Rate Decay
Case 1—Baseline65,536[4, 4, 4, 4, 2][16, 64, 128, 256, 512]16UsedUsed1 × 10−20.95
Case 2—Exclude RGB and intensity65,536[4, 4, 4, 4, 2][16, 64, 128, 256, 512]16Not usedNot used1 × 10−20.95
Case 3—Point number increase131,072[4, 4, 4, 4, 2][16, 64, 128, 256, 512]16UsedUsed1 × 10−20.95
Case 4—Reduce subsampling65,536[2, 2, 2, 2, 2][16, 64, 128, 256, 512]16UsedUsed1 × 10−20.95
Case 5—Increase feature dimensions65,536[4, 4, 4, 4, 2][32, 128, 256, 512, 1024]16UsedUsed1 × 10−20.95
Case 6—Increase KNN65,536[4, 4, 4, 4, 2][16, 64, 128, 256, 512]32UsedUsed1 × 10−20.95
Case 7—Aggressive learning decay65,536[4, 4, 4, 4, 2][16, 64, 128, 256, 512]16UsedUsed1 × 10−20.90
Case 8—Increase point number and feature dimensions131,072[4, 4, 4, 4, 2][32, 128, 256, 512, 1024]16UsedUsed1 × 10−20.95
Table 6. Testing results.
CasesOverall
Accuracy (%)
ClassesPrecision (%)Recall (%)F1 Score (%)IoU (%)
Case 1—Baseline95.97Tree98.1098.7998.4496.93
Power Line93.9491.3792.6486.28
Pole88.7188.9588.8379.90
Case 2—Exclude RGB and intensity90.42Tree98.3697.5397.9495.97
Power Line93.4391.5092.4685.97
Pole84.2688.7786.4676.14
Case 3—Point number increase96.64Tree98.3798.1798.2796.59
Power Line95.5391.3793.4087.62
Pole90.2490.3690.3082.31
Case 4—Reduce subsampling96.29Tree97.9298.9798.4496.93
Power Line95.0291.7893.3787.57
Pole90.7488.1889.4480.90
Case 5—Increase feature dimensions96.53Tree98.2498.6398.4396.92
Power Line95.0492.3493.6788.09
Pole89.1390.0389.5881.12
Case 6—Increase KNN96.27Tree98.1498.6398.3996.82
Power Line93.0991.9592.5986.8
Pole87.8189.5788.6879.67
Case 7—Aggressive learning decay95.94Tree97.6098.4898.0496.15
Power Line95.6091.3993.4587.70
Pole85.6289.4587.4977.76
Case 8—Increase point number and feature dimensions96.90Tree98.4798.5498.5097.05
Power Line94.1892.4493.3087.44
Pole91.5589.0290.2782.33
Table 7. Focused 4-class model test results.
Focused 4-class model on vegetation, pole, and utility line classesOverall
Accuracy (%)
ClassesPrecision (%)Recall (%)F1 Score (%)IoU (%)
95.97Tree99.5599.4699.5199.02
Power Line94.6291.7293.1587.18
Pole92.7795.3994.0688.79
Table 8. Clustering values and thresholds for each class.
ClassClustering ValuesDefined Thresholds
Epsilon (m)Minimum SamplesMinimum Point CountMinimum Height (m)
Trees0.52012,0006.5
Poles0.5105008
Power lines0.33--
Table 9. Geometric information of the sample cluster.
Tree ID4
Height13.5 m
Width (Canopy spread)6.2 m
Disclaimer/Publisher’s Note: The statements, opinions and data contained in all publications are solely those of the individual author(s) and contributor(s) and not of MDPI and/or the editor(s). MDPI and/or the editor(s) disclaim responsibility for any injury to people or property resulting from any ideas, methods, instructions or products referred to in the content.