Highlights
What are the main findings?
- The proposed ED-ConvLSTM-Res model, which integrates solar and geomagnetic activity indices as multi-channel features, consistently outperforms both the data-driven ConvLSTM model and CODE’s one-day-ahead forecast product c1pg.
- The model demonstrates strong spatiotemporal feature representation, achieving RMSE values of 1.28 TECU in 2019 (low solar activity year) and 5.28 TECU in 2024 (current high solar activity year), and substantially reducing prediction errors compared to the other two models.
What is the implication of the main finding?
- The ED-ConvLSTM-Res framework, enhanced with solar and geomagnetic indices as auxiliary parameters, provides a reliable and high-precision tool for global ionospheric TEC forecasting, with implications for space weather prediction, satellite-based navigation, and communication systems.
Abstract
This paper proposes a convolutional Long Short-Term Memory (ConvLSTM) network integrated with multi-channel features dedicated to ionospheric total electron content (TEC) forecasting. To improve generalization, solar, and geomagnetic activity indices are added as auxiliary channel inputs. The model is built upon an Encoder–Decoder (ED) architecture enhanced with residual connections and convolutional channel projection, which collectively improve the synergy among its core components. Based on this framework, we developed ED-ConvLSTM-Res, a multi-channel feature-based global ionospheric TEC prediction model. Comprehensive accuracy evaluation and comparative tests were carried out using datasets from the solar minimum year of 2019 and the current solar maximum year of 2024. The results indicate that the proposed model consistently achieves strong predictive performance compared with other models, along with a significantly enhanced feature representation capability. Specifically, the Root Mean Square Errors (RMSE) of the ED-ConvLSTM-Res model’s predictions in 2019 and 2024 are 1.28 TECU and 5.28 TECU, respectively, while the corresponding Mean Absolute Errors (MAE) are 0.87 and 3.87, and the coefficients of determination (R2) are 0.95 and 0.94. In the current high solar activity year 2024, the proposed model achieves error reductions of 13.6% in MAE and 11.6% in RMSE compared with the Center for Orbit Determination in Europe (CODE)’s one-day-ahead forecast product, c1pg. These results confirm that the proposed model not only outperforms the ConvLSTM model without additional indices and c1pg but also exhibits strong generalization capability, maintaining stable performance with low errors under both high and low solar activity conditions.
1. Introduction
The ionosphere, located in the upper region of Earth’s atmosphere, is characterized by the presence of ionized atoms and molecules within the neutral gas, forming a plasma comprising free electrons and ions [1]. The abundance of charged particles in the ionosphere significantly influences the propagation of radio waves [2]. The TEC is an important parameter in the coupled ionosphere-thermosphere system [3,4], as its magnitude is proportional to the additional delay in radio wave propagation caused by the ionosphere. Based on the analysis of TEC parameters, studies can explore the diurnal variations and disturbance processes of the ionosphere. From the perspective of the application, TEC forecasting plays a critical role in radio wave propagation and electromagnetic environment-dependent fields such as navigation, radar imaging, and shortwave communications. Therefore, real-time monitoring and accurate prediction of TEC have become essential aspects of space weather research [5]. In recent years, with the rapid development of deep learning, its applications have become widespread across numerous domains. Applying deep learning techniques to ionospheric TEC forecasting has proven to be an effective approach, and a substantial number of related studies have already been published in the scientific community. This progress has been largely facilitated by the availability of rich and standardized ionospheric datasets, such as the Global Ionospheric Maps (GIM) products released by the International GNSS Service (IGS), which now provide nearly three decades of continuous records. In 2025, Zhang et al. provided a comprehensive review of the main deep learning methods applied to ionospheric forecasting and their corresponding performance [6].
Among the numerous approaches, ConvLSTM-based methods have been widely adopted. The ConvLSTM network effectively leverages the advantages of LSTM in handling temporal forecasting while simultaneously utilizing convolutional operations to capture spatial variations. Such a design is particularly well suited for ionospheric modeling, as the ionosphere is characterized by inherently complex spatiotemporal dynamics. Motivated by this challenge, researchers have proposed various deep learning architectures to capture these dynamics [7]. For instance, in 2021, Ruwali et al. developed a hybrid convolutional neural network named LSTM-CNN to extract the spatiotemporal features from the global TEC maps. The LSTM–CNN model outperformed other ionospheric deep-learning forecasting algorithms, achieving a minimum RMSE of 1.5 TECU and an R2 of 0.99 [8]. In 2022, Liu et al. applied ConvLSTM-based models to forecast global ionospheric TEC maps up to 24 h ahead, yielding minimum RMSE values of 0.81 TECU during quiet periods and 1.28 TECU during storm periods, thus surpassing CODE’s 1-day predictions under most conditions [9]. In 2023, Se-Heon Jeong et al. evaluated deep learning models for predicting ionospheric TEC over the Korean Peninsula and found that ConvLSTM produced more accurate and reliable forecasts than LSTM [10]. However, despite these advances, some forecasting approaches still overlooked the influence of solar and geomagnetic activity, relying solely on large-scale data training to achieve short-term predictions [9,11,12,13,14]. This limitation is critical, as the ionosphere is primarily driven by solar activity and further modulated by the geomagnetic field. Moreover, most existing model evaluations have been restricted to solar cycle 24, leaving their generalizability under different solar conditions insufficiently explored. Solar cycle 24 was a relatively weak cycle [15,16]: even at its peak in 2015, its solar activity indices such as F10.7 were much lower than those of cycle 23 and are still lower compared to the current cycle 25. Under this relatively low solar activity background, studies have further shown that even the persistence method, which simply repeat the previous day’s results as forecasts for the following day, achieves reasonably good accuracy [17]. This is largely because, during periods of low solar activity, the overall variability of the ionosphere is less pronounced compared to periods of high solar activity. This also explains why forecasting accuracy typically degrades under higher solar activity conditions.
In prior studies, diverse neural-network approaches have been applied to storm-time TEC forecasting. Building on these efforts and addressing the need for more accurate predictions, this paper employs an ED-ConvLSTM-Res neural network to improve the accuracy of ionospheric TEC forecasting. The encoder–decoder module, also known as the degradation–decomposition framework, is designed to extract deep spatiotemporal representations by compressing the input sequence into a latent space and subsequently reconstructing it into the prediction horizon. This structure enables the network to efficiently capture both short-term and long-term dependencies while reducing redundant information. The residual connection, on the other hand, directly passes low-level spatial and temporal features from earlier layers to later stages of the network. This mechanism facilitates stable gradient propagation, alleviates information loss during deep network training, and allows the model to focus on learning the incremental changes between input and target sequences. The combination of ED and RES modules has been demonstrated to significantly enhance forecasting accuracy in spatiotemporal sequence prediction tasks [18,19,20], and thus provides a powerful architecture for ionospheric TEC prediction. Motivated by these insights, in this study we comprehensively integrate the advantages of ED structure and RES connections with the ConvLSTM framework to develop a more robust ionospheric TEC forecasting model. In addition to the spatiotemporal features extracted from global ionospheric maps, the model incorporates solar activity indices and geomagnetic activity indices as auxiliary inputs, thereby explicitly accounting for external drivers of ionospheric variability. To assess its forecasting capability under conditions of elevated solar activity, the model is evaluated using data from solar cycle 25, which corresponds to the current solar maximum period. This method provides a more comprehensive approach to TEC forecasting, enabling improved prediction accuracy compared with models that do not consider solar and geomagnetic influences. Leveraging this deep learning architecture, global TEC maps are predicted with a temporal resolution of 2 h, enabling detailed characterization of spatiotemporal variability. The datasets consist of CODE GIMs as well as the ap index and the solar F10.7 index spanning 2002 through 31 May 2025. The primary objective is to improve prediction accuracy during geomagnetic storms, while also evaluating the model’s performance against alternative approaches under both high- and low-solar-activity conditions.
2. Data and Methods
This section presents the source, format, and resolution of data we used in this study. Then, the principle of the ED-ConvLSTM-Res network and the data preprocessing were introduced. Furthermore, we calculated the RMSE, R2, and MAE as evaluation metrics for the prediction performance of the proposed model.
2.1. Data Description
The ionospheric TEC dataset used in this study consists of global ionospheric maps generated in the Ionosphere Map Exchange (IONEX) format provided by IGS. The IGS operates multiple ionospheric analysis centers that deliver GIM products and forecasts, including the Center for Orbit Determination in Europe, the Jet Propulsion Laboratory (JPL), and the European Space Agency (ESA). We utilize the CODE GIMs for analysis. The maps span longitudes from 180°W to 180°E and latitudes from 87.5°S to 87.5°N, with a spatial resolution of 5° in longitude and 2.5° in latitude. The CODE TEC data used in this study are from 1 January 2002 to 31 December 2023, except 2019. Data from 1 January 2024 to 31 May 2025 and 2019 were used for testing sets.
Given the significant influence of solar and geomagnetic activity on the coupled ionosphere-thermosphere system [21,22,23], this study selects the F10.7 and ap indices as auxiliary training parameters [24]. Among these, the F10.7 index reflects the impact of solar activity on the plasma density in the upper atmosphere [25]. The 3-hourly ap index is the linearized counterpart of Kp, obtained via a fixed Kp to ap conversion table and reported in ~2 nT units, thereby converting Kp’s quasi-logarithmic scale into one roughly proportional to geomagnetic range [26].
2.2. ED-ConvLSTM-Res Network
In this study, we propose a novel deep learning architecture, termed the Encoder–Decoder Convolutional Long Short-Term Memory model with Residual Connection, specifically designed to address the challenges of high-resolution spatiotemporal sequence prediction. Traditional recurrent neural networks and convolutional models often struggle to simultaneously capture fine-grained spatial features and long-term temporal dependencies, which are critical for accurately performing ionospheric modeling. The encoder–decoder framework provides a natural mechanism for compressing and reconstructing sequential information, enabling the extraction of salient temporal patterns while preserving essential spatial structures. By integrating ConvLSTM units [27], the model is capable of learning complex local spatial correlations along with nonlinear temporal dynamics. Furthermore, the introduction of residual connections facilitates more stable gradient propagation, alleviates vanishing gradient problems, and allows for deeper network design without degradation in performance. Together, these components form a robust and scalable architecture aimed at delivering improved accuracy and stability in sequence-to-sequence forecasting tasks involving highly dynamic ionospheric processes.
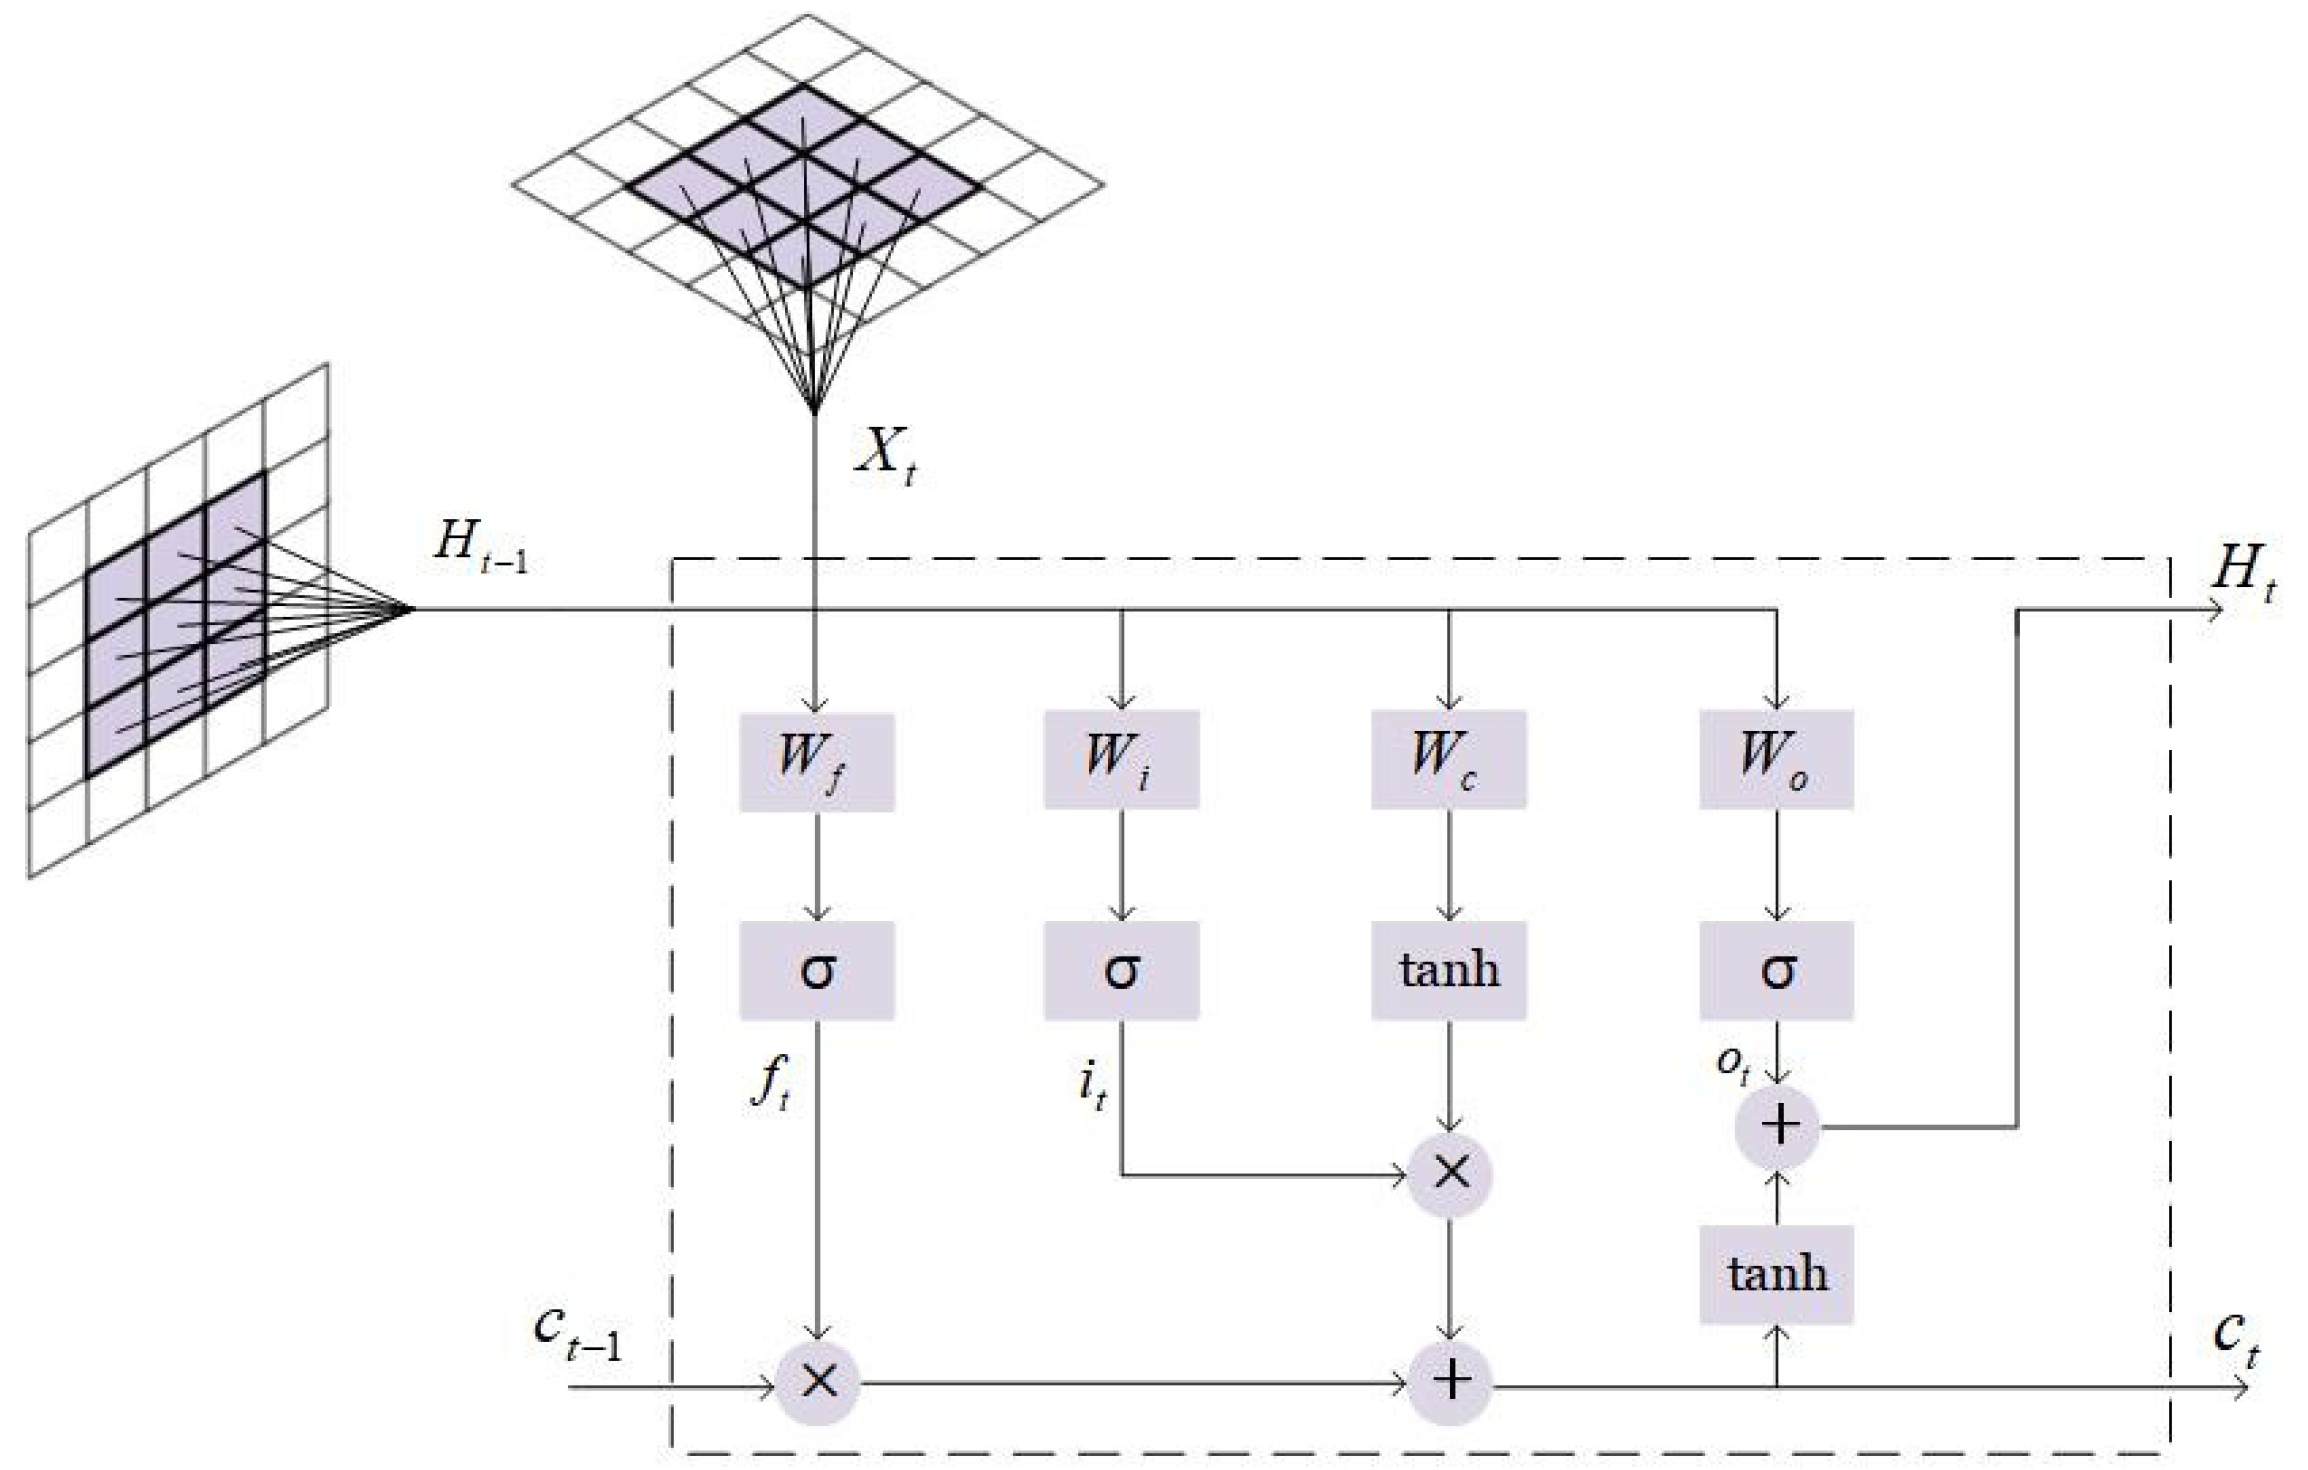
Figure 1 shows the internal structure of the ConvLSTM network at time point t. The ConvLSTM architecture incorporates input gates , output gates , and forget gates , together with a memory cell that serves as the hidden state , to effectively retain and update information. Each gate receives as input both the current observation and the hidden state from the previous time step . Through these mechanisms, the network regulates the flow of spatial-temporal information across time. The input gate determines how much new information from the current input and the previous hidden state is passed through. It is calculated as follows:
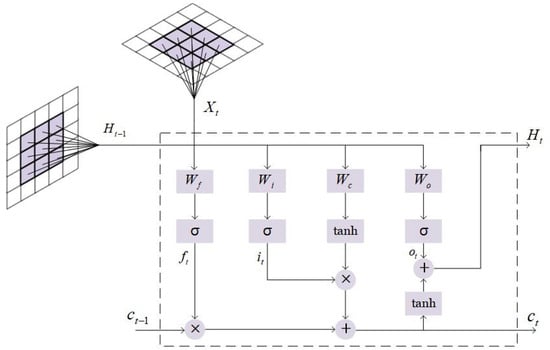
Figure 1.
The internal structure of the convolutional long short-term memory network at time point t.
The forget gate controls the retention of past information. By combining the current input and previous hidden state through convolutional transformations, it generates a gating tensor that modulates the previous memory state . It is calculated as follows:
The output gate determines how much of the updated cell state should be revealed to the hidden state. It is calculated as follows:
The candidate memory is a proposal of new content to be stored in the cell state. It is obtained from the convolutional combination of and . It is calculated as follows:
The updated memory cell is formed by a gated combination of the previous state and the candidate memory. Specifically, the forget gate decides how much of should be retained, while the input gate regulates the incorporation of . It is calculated as follows:
Finally, the hidden state is produced by applying the output gate to the activated cell state. The hidden state serves as both the observable output of the ConvLSTM cell and the recurrent input for the next time step. This dual role allows the model to propagate spatiotemporal representations forward through the sequence. It is calculated as follows:
In these equations, W denotes the convolutional weight matrices and b the bias terms. The hidden state represents the final output at time point t, which is passed forward to the next time step together with the updated cell state . Here, ‘’ indicates the convolution operation, and ‘’ denotes the Hadamard product.
To mitigate the problem of vanishing gradients and to strengthen the preservation of low-level spatial information, we incorporate a residual connection into the proposed ED-ConvLSTM-Res architecture. Specifically, the residual formulation is expressed as
where F(·) represents the nonlinear spatiotemporal transformation performed by the ConvLSTM decoder, denotes the input frame at time step t and is the residual-enhanced prediction. By introducing this shortcut pathway, the network no longer needs to learn the entire mapping from input to target directly. Instead, it focuses on estimating the residual difference between the predicted frame and the input frame.
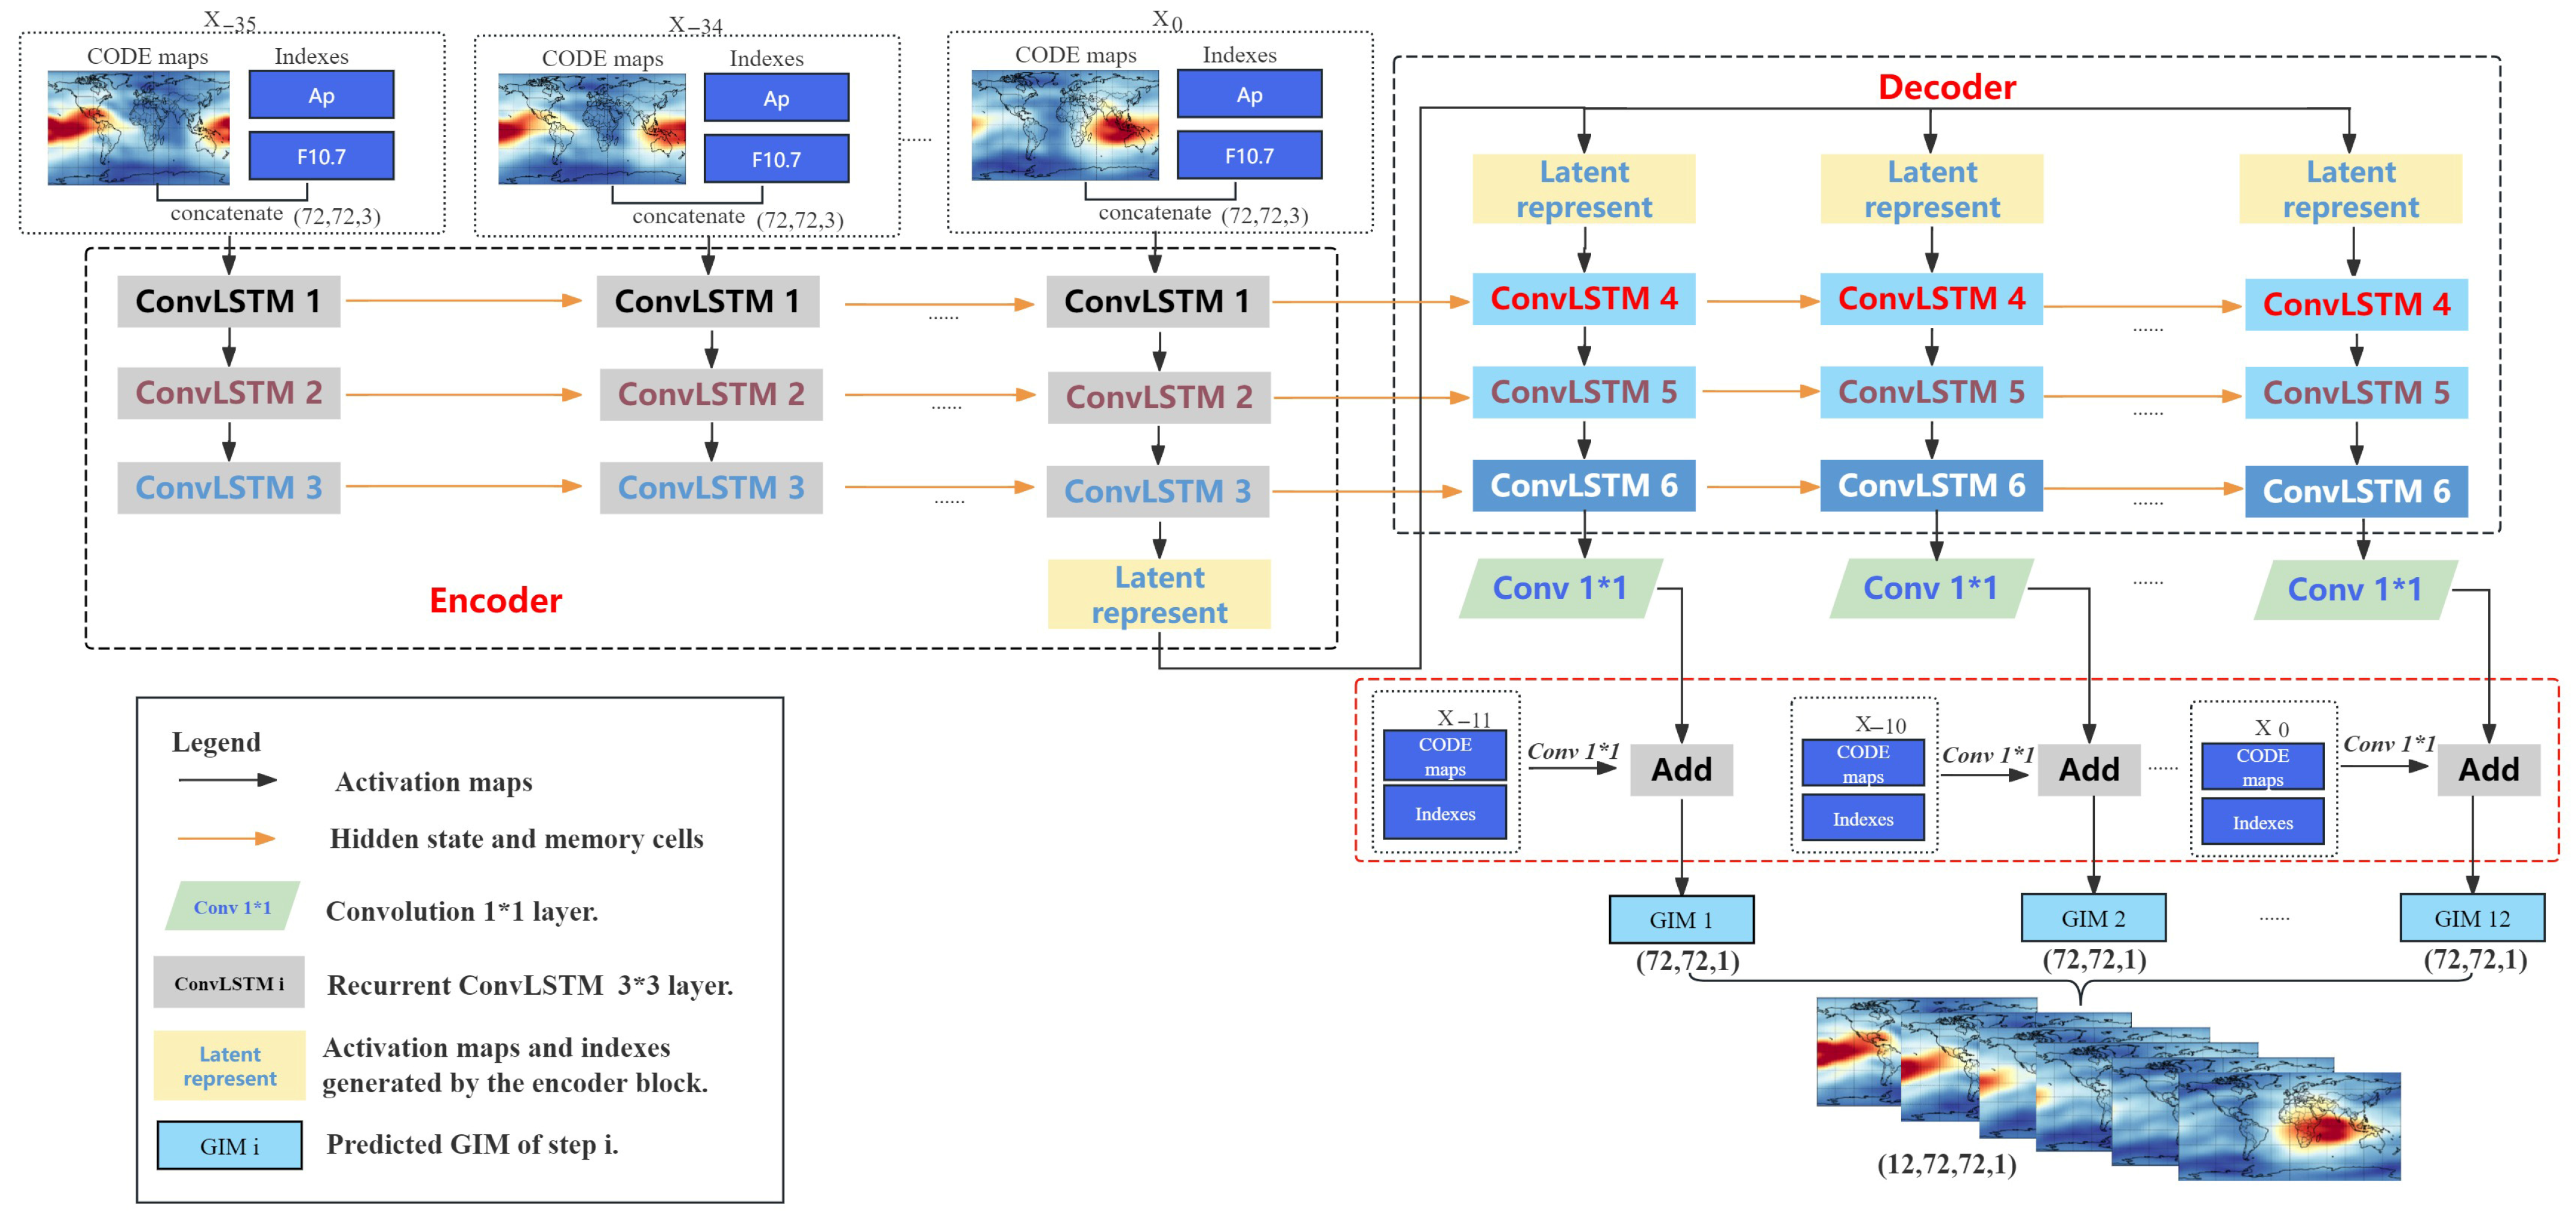
The GIM forecasting problem is formulated as a sequence-to-sequence regression task. For each training and testing sample, as illustrated in Figure 2, the model ingests a temporal window of 36 consecutive global ionospheric maps, representing three days of historical data at a temporal resolution of 12 maps per day, and predicts the subsequent 12 GIMs, corresponding to the following 24 h period. In this setup, the input window spans from t = i − 35 to t = i − 0, while the prediction horizon covers t = i + 1 to t = i + 12. This configuration allows the model to capture both short- and mid-term spatiotemporal dependencies within the ionospheric dynamics. Each dataset comprises 362 samples, resulting in a total of 4344 GIM maps used for model training, validation, and evaluation.
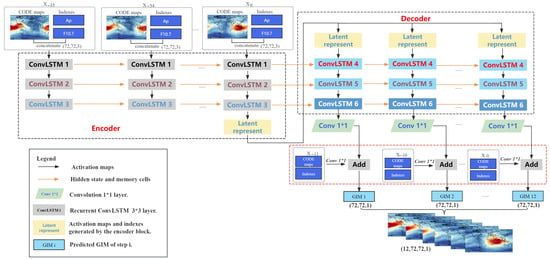
Figure 2.
ED-ConvLSTM-Res architecture: input GIM t = i− 35 to t = i − 0 are sequentially processed to create the hidden state, memory cells, and latent representation that are passed to the decoder part of the network. The decoder ConvLSTM predicts the GIM for the next day.
The model was implemented in Python 3.8.10 using the Keras library and all experiments were conducted on an NVIDIA vGPU with 48 GB memory. The model takes as input a four-dimensional tensor of size (36, 72, 72, 3), where the 36 temporal steps correspond to three days of historical GIMs sampled at 12 intervals per day, the 72 × 72 grid represents the spatial resolution, and the three channels encode multiple physical parameters at each grid point. Considering that both the F10.7 and ap indices are one-dimensional time series without spatial information, these index vectors need to be reshaped into matrices with the same dimensions as the TEC channel (72 × 72). By stacking the feature maps of F10.7 and ap indices along the channel axis, a multi-channel input with dimensions of height × width × channel (72, 72, 3) can be generated. The encoder module consists of three stacked ConvLSTM2D layers. These layers jointly model spatial dependencies via convolutional operations and temporal dynamics through gated recurrent mechanisms, thereby generating a compact spatiotemporal representation of the input sequence. At the core of the network, a deep processing block comprising three ConvLSTM2D layers further refines deep latent representations, enabling the extraction of higher-order, nonlinear spatiotemporal dependencies crucial for accurate prediction. The output of the encoder is referred to as the latent representation, as it serves as the input to the network’s decoder. This latent representation is replicated 12 times at the input side of each decoder step, while the hidden state and cell memory are transferred as the initial states to the ConvLSTM layers in the decoder. The initial hidden state and cell memory provided to the decoder establish a data flow derived from the information within the input window, enabling the prediction of each GIM across the forecasting horizon. In addition, a temporally separable two-dimensional convolution layer with a 1 × 1 kernel is employed to reduce the feature maps from 24 to 1. The resulting output, when combined with the residual information between the previous day and the input sequence, produces the final prediction of the next day’s TEC map. By combining deep spatiotemporal modeling with residual learning, the ED-ConvLSTM-Res architecture achieves a balanced integration of depth, temporal coherence, and spatial fidelity, making it highly suitable for advanced forecasting tasks such as ionospheric TEC prediction, weather nowcasting, and other geophysical applications requiring robust modeling of complex spatial-temporal patterns.
2.3. Evaluation Metrics
To quantify the prediction performance of the ED-ConvLSTM-Res model, the RMSE, R2 and MAE were estimated, the formula is as follows:
where N is the number of TEC bins, TECp is the predicted TEC values and TECr is the real values.
3. Results
In this section, we assess the accuracy of the proposed ED-ConvLSTM-Res model by comparing its forecasts with those from c1pg, ConvLSTM, and the CODE analysis fields (used here as ground truth). The c1pg product denotes CODE’s official 1-day global TEC forecast, obtained by extrapolating spherical harmonic (SH) coefficients [28].
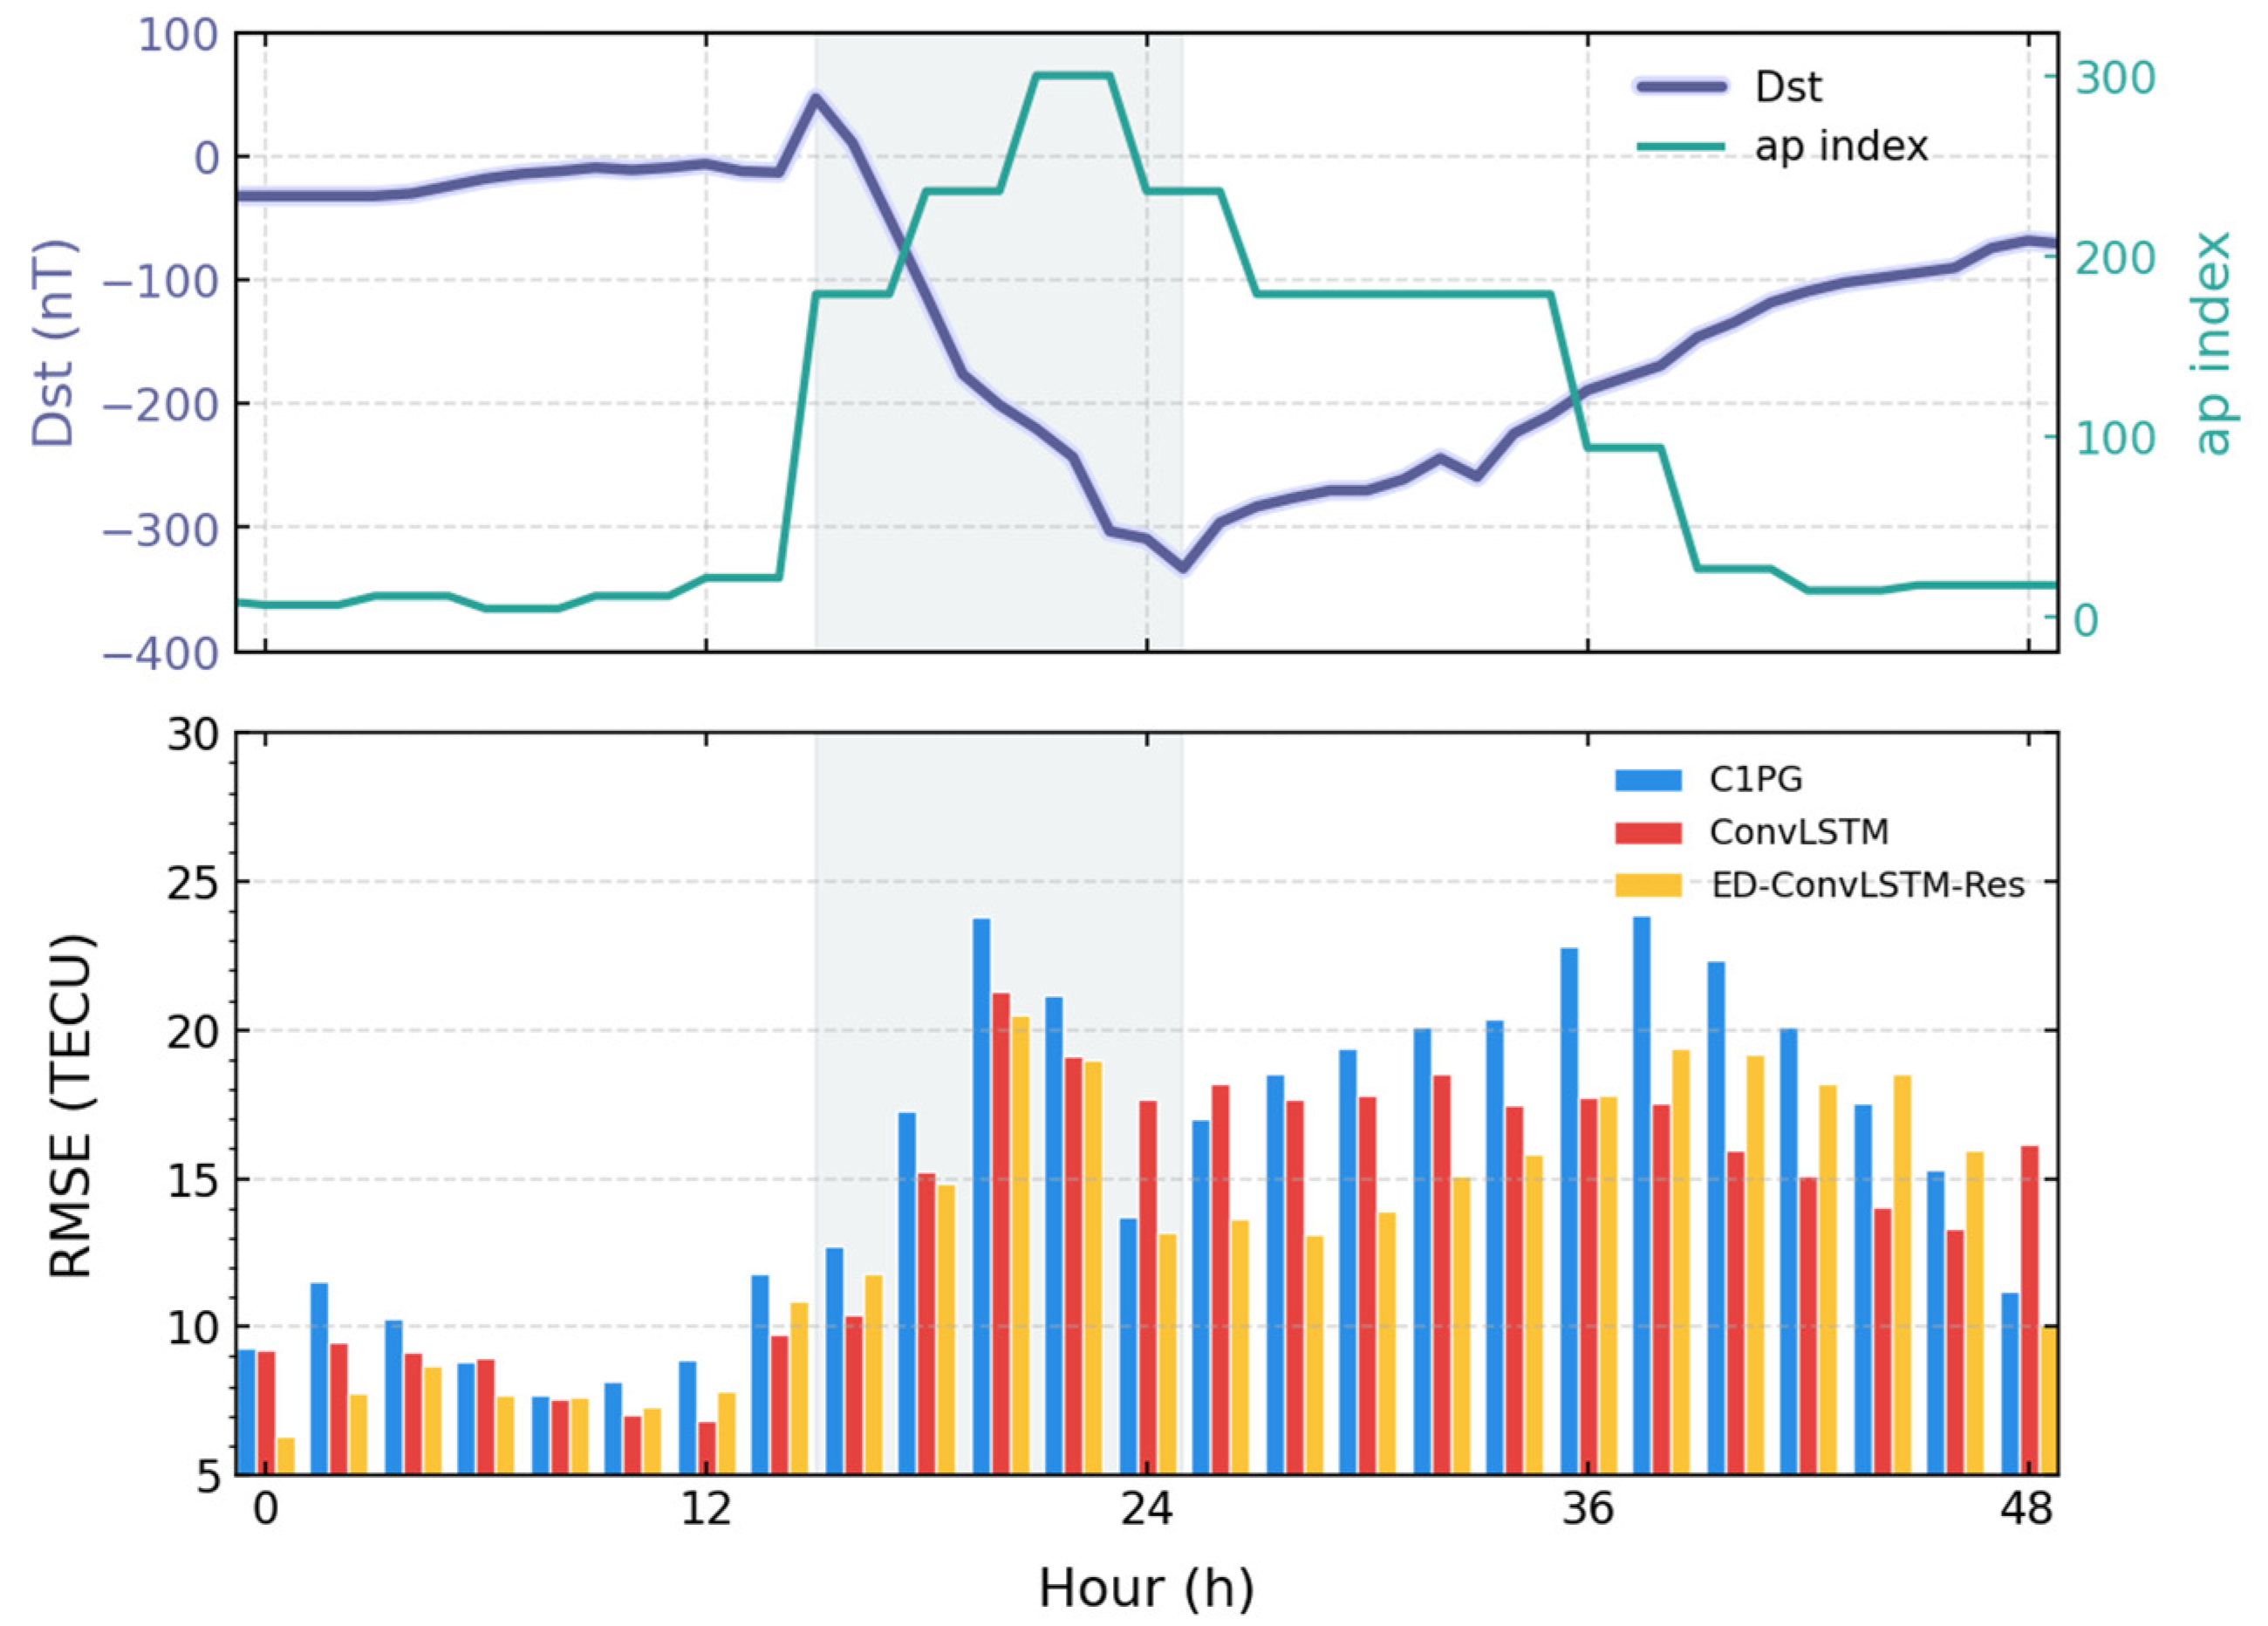
Figure 3 depicts the evolution of Dst and the ap index from 10 to 11 October 2024 (minimum Dst = −333 nT) and compares the 2 hourly RMSE of ED-ConvLSTM-Res, ConvLSTM, and c1pg over the storm interval. As the storm’s main phase develops, the errors of all three models increase. Nevertheless, ED-ConvLSTM-Res attains the lowest RMSE of 13.75 TECU, representing a 4.7% reduction relative to ConvLSTM with 14.43 TECU and a 4.9% reduction relative to c1pg with 14.46 TECU. The improvement is most evident during the storm’s main phase, highlighting the model’s enhanced storm-time prediction capability.
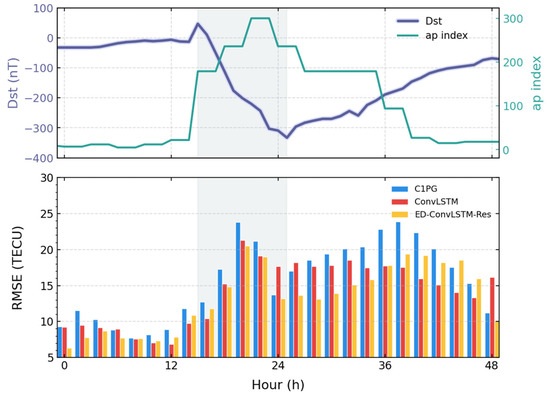
Figure 3.
The first plot is Dst (blue line) and the ap index (green line) variations from 10 October to 11 October 2024, and the main phase of geomagnetic storm event (shaded interval). The second plot shows the RMSE of the ConvLSTM, c1pg, and ED-ConvLSTM-Res models at 2 h intervals.
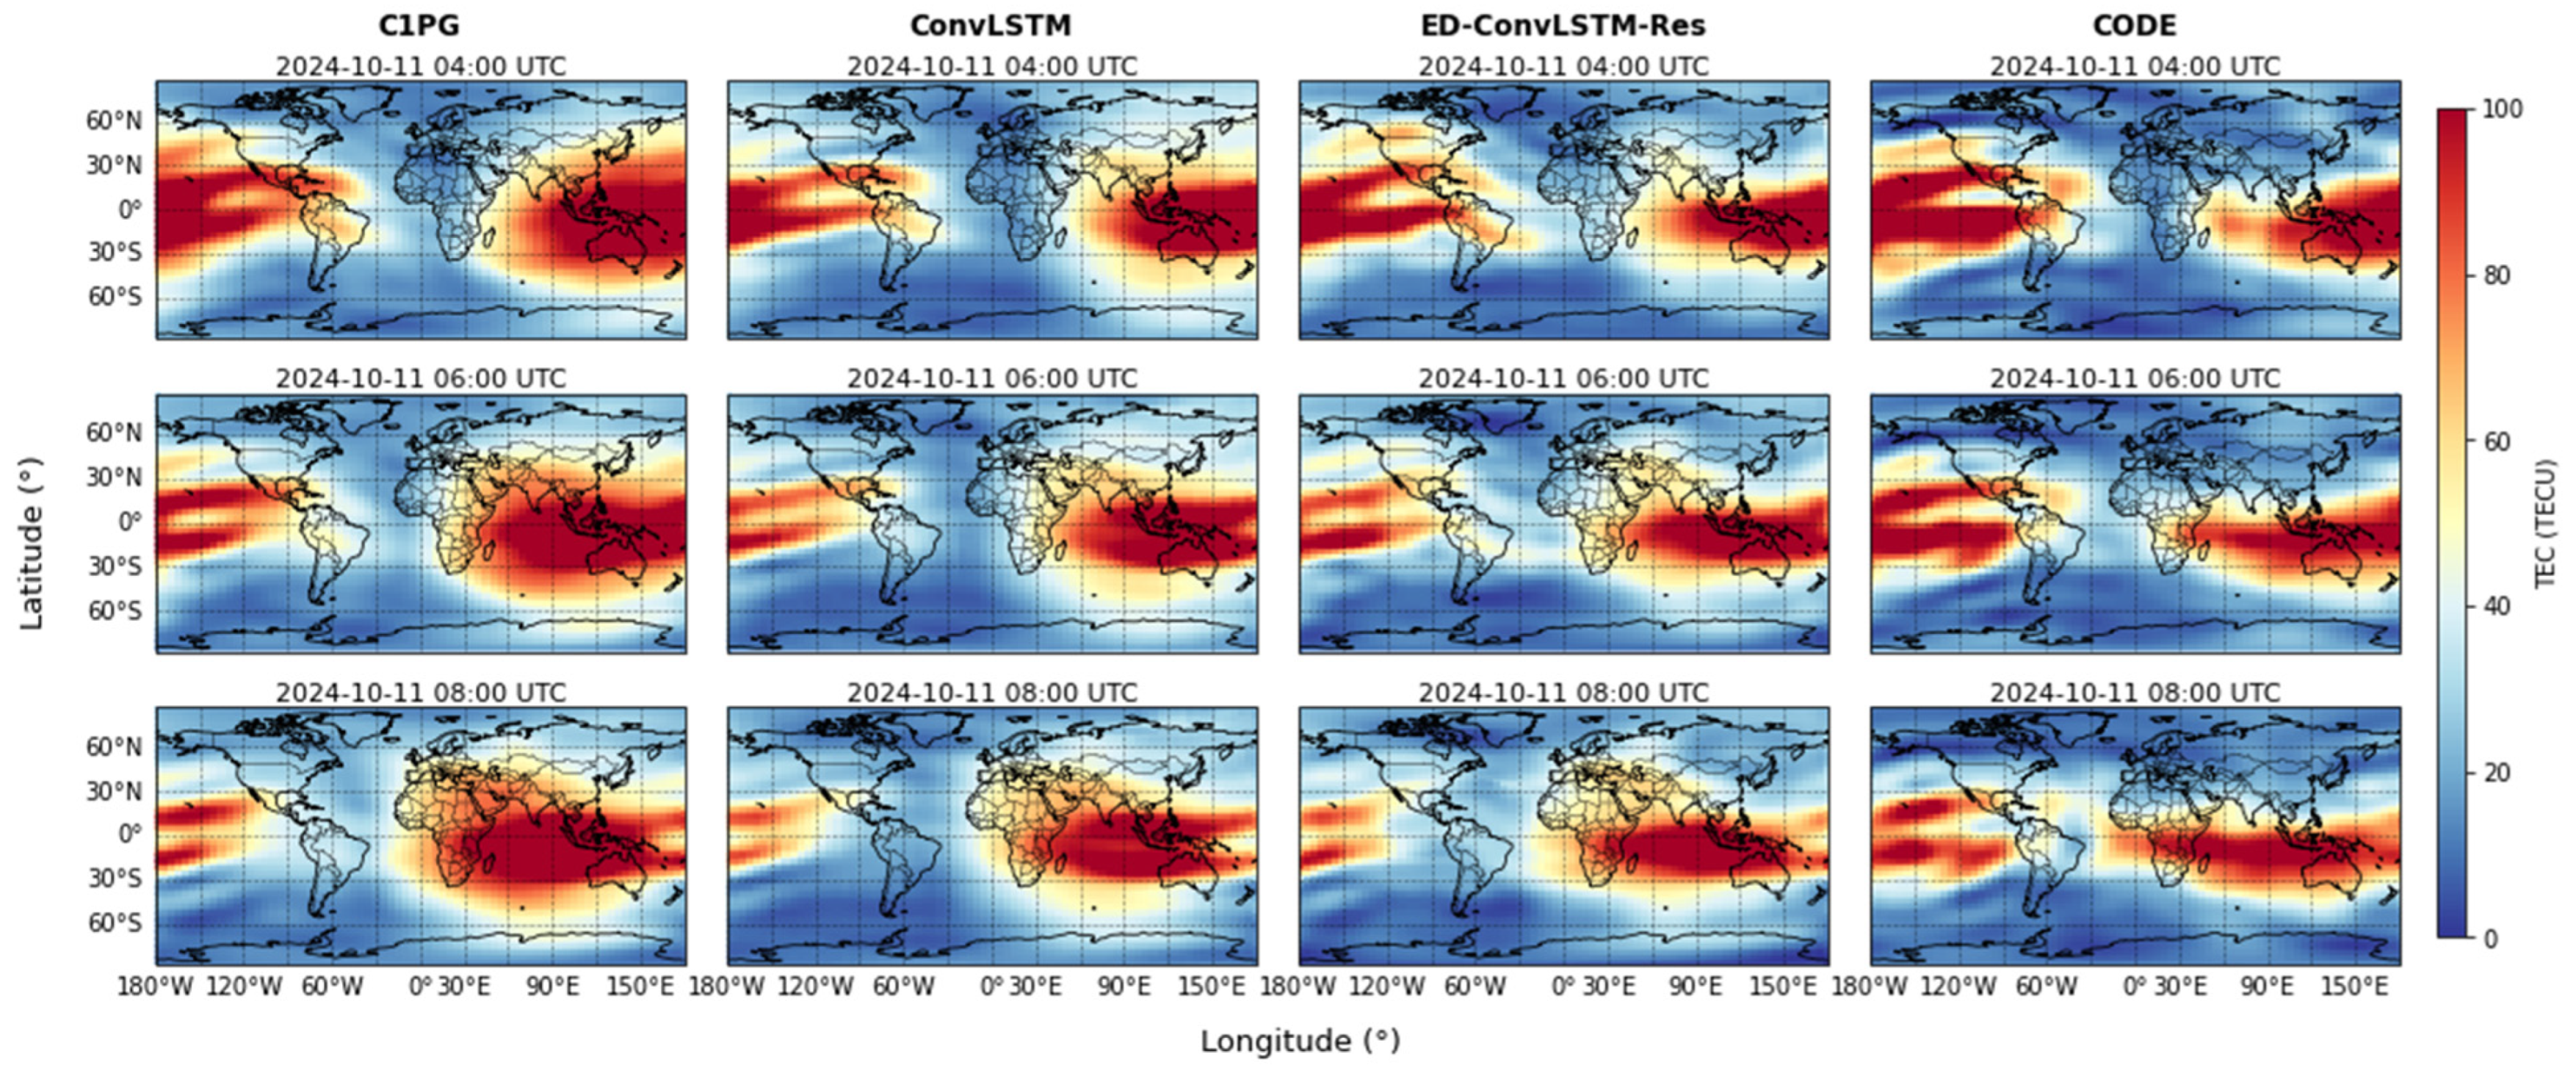
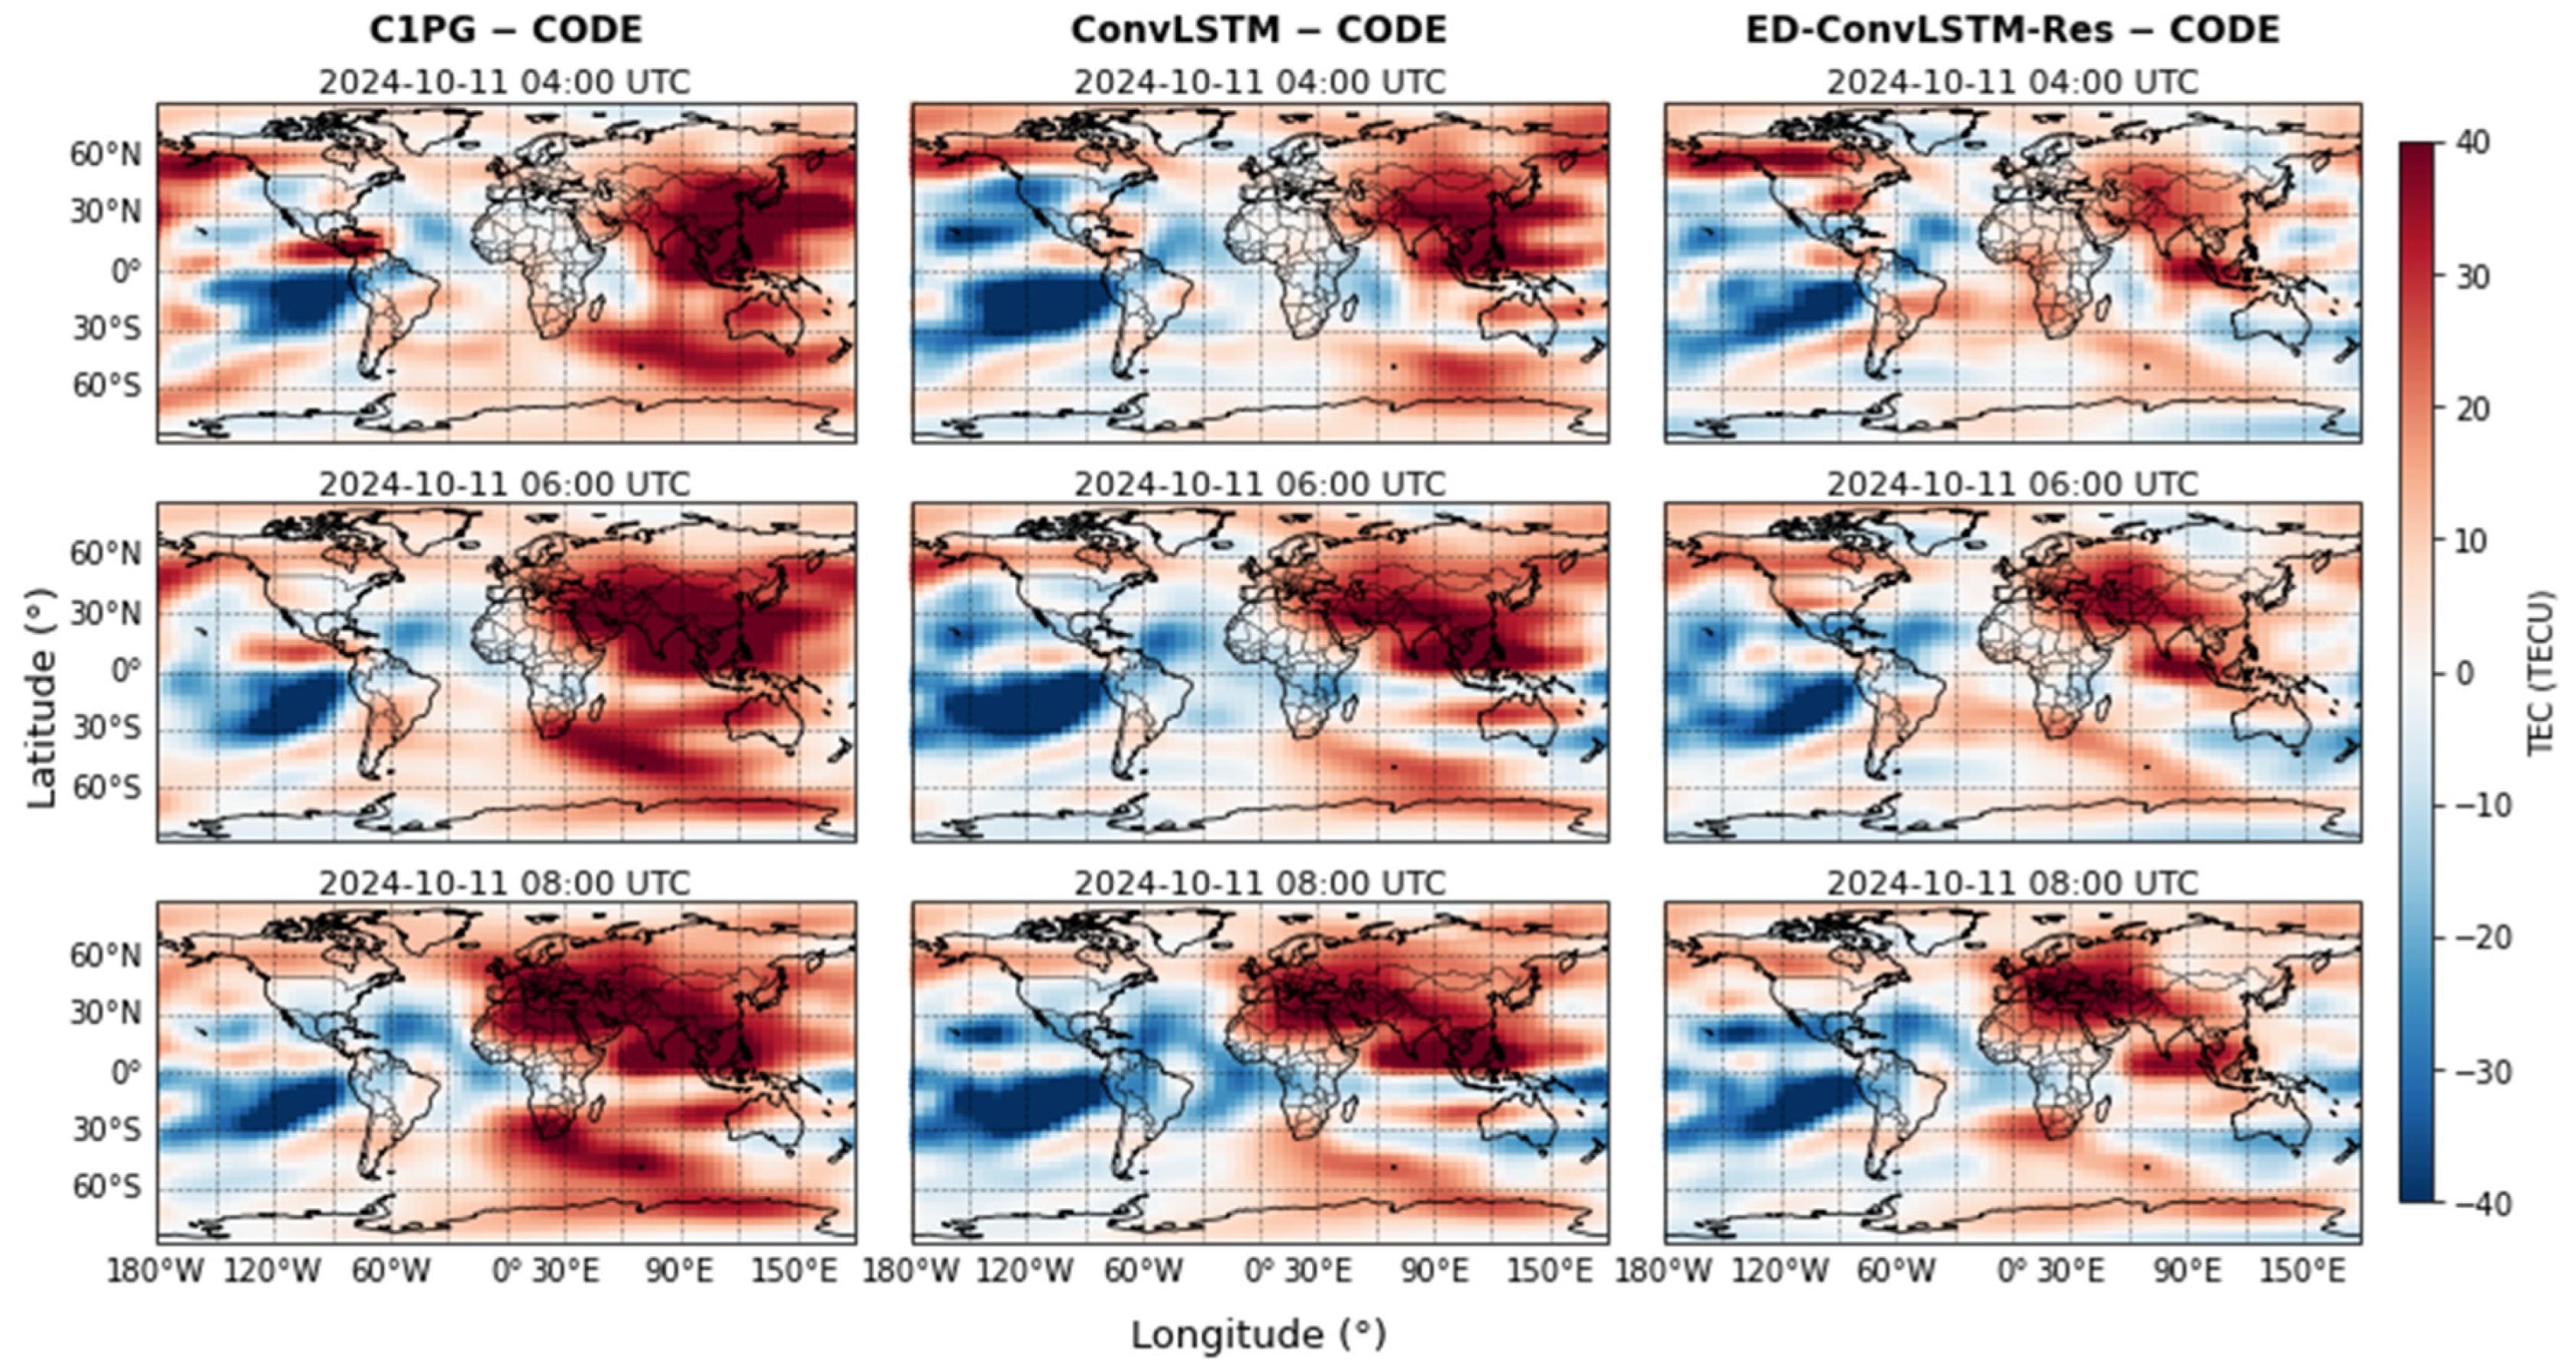
Figure 4 presents the prediction results from the ED-ConvLSTM-Res and ConvLSTM models, along with the GIMs released by CODE and the corresponding ground truth observations. The time points UT 04:00, 06:00, and 08:00 correspond to hours 28, 30, and 32 in Figure 3, respectively. It is evident that the ED-ConvLSTM-Res model produces TEC forecasts that are more accurate and closer to ground-truth measurements compared to both the ConvLSTM model and the operational c1pg product. The model successfully captures the TEC enhancement around the latitudinal band of approximately 30°S–20°N on the dayside, a feature that is not well represented in the c1pg or ConvLSTM predictions. A quantitative evaluation based on Formula (8) shows that on 11 October 2024, the c1pg model achieved an RMSE of 19.27 TECU, while the ConvLSTM model achieved a lower RMSE of 16.76 TECU, and the ED-ConvLSTM-Res model achieved an RMSE of 16.15 TECU. Furthermore, under geomagnetically quiet conditions, the ED-ConvLSTM-Res model’s predictions were closer to the measured values, indicating that the forecast performance of the c1pg, ConvLSTM and ED-ConvLSTM-Res models decrease with increasing geomagnetic storm intensity.
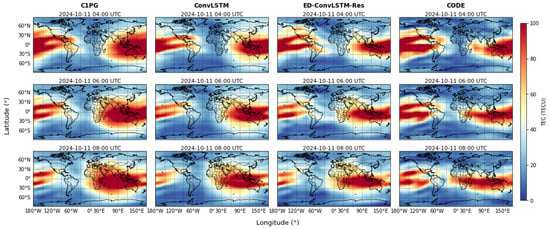
Figure 4.
Predicted global TEC maps at 2 h intervals during a geomagnetic storm from UT 04:00 to 08:00 on 11 October 2024 (Dst = −333 nT). Columns (left to right): CODE 1-day-ahead prediction, ConvLSTM 1-day-ahead prediction, ED-ConvLSTM-Res prediction, and CODE ground truth.
Figure 5 compares global ionospheric TEC difference maps (prediction − CODE) on 11 October 2024 during a geomagnetic storm for three GIM prediction schemes. All three methods degrade under storm-time conditions, exhibiting large residuals; peak TEC differences evolve into zonally banded structures as the event progresses. At UT 6:00 and 8:00 in the low–mid latitudes, coherent regions of underestimation and overestimation are evident. Among the models, ED-ConvLSTM-Res consistently produces smaller and less spatially extensive errors than ConvLSTM and c1pg. Together with the hourly RMSE shown in Figure 3, these results substantiate the superior storm-time predictive skill of the ED-ConvLSTM-Res approach.
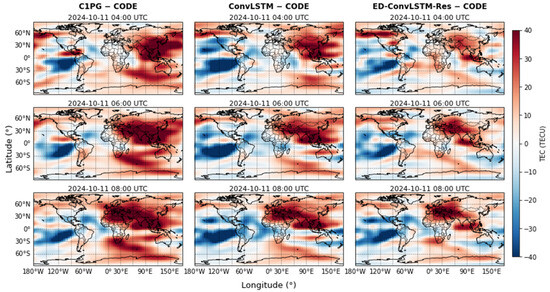
Figure 5.
Distribution of the vertical total electron content difference between different predicted global ionospheric maps and CODE ground truth at UT 4:00, UT 6:00 and UT 8:00 on 11 October 2024 (From left to right: c1pg, ConvLSTM model, ED-ConvLSTM-Res model).
Table 1 summarizes the evaluation metrics computed for each model on the 2019 and 2024 datasets constructed from GIM, with mean and standard deviation across days. Overall, ED-ConvLSTM-Res achieves the lowest MAE and RMSE in both low- and high-solar-activity years, while maintaining competitive R2 scores. In 2019, the model reduces MAE by about 14.7% relative to c1pg and by 3.3% relative to ConvLSTM, with corresponding RMSE reductions of 10.5% and 1.5%. In 2024, when solar activity was high, ED-ConvLSTM-Res attains a MAE of 3.87 TECU, corresponding to reductions of 13.6% and 8.1% compared to c1pg and ConvLSTM, respectively. Similarly, its RMSE is reduced by 11.6% and 8.2% relative to c1pg and ConvLSTM. These results indicate that ED-ConvLSTM-Res not only performs best under quiet conditions but also shows enhanced robustness and accuracy under disturbed, high–solar-activity conditions.

Table 1.
Experimental RMSE, MAE, and R2 test results of various models in 2019 and 2024.
Table 2 summarizes the statistics of space environment conditions for 2015, 2019 and 2024, with raw data obtained from the Space Weather Prediction Center (SWPC) website. In this table, 1 period corresponds to 3 h. As shown, 2019 was characterized by very low solar activity, with the annual mean F10.7 index around 69.7 sfu, only 3 h of geomagnetic activity reaching strong storm levels (Kp > 6), and an annual mean sunspot number of about 3.7. In contrast, solar activity increased substantially in 2024, with the annual mean F10.7 rising to 190.7 sfu, the annual mean sunspot number rising to 147.4, and geomagnetic storms occurring frequently, including the most intense storm of the past two decades. The annual mean F10.7 index and sunspot number in 2024 substantially exceed those of the previous cycle’s peak in 2015. Furthermore, geomagnetic activity in 2024 is markedly more intense, with 32 periods of strong storms (Kp = 7, 8) and 7 periods of an extreme storm (Kp = 9), compared to only 12 and 0, respectively, in 2015. As reflected in Table 1, in the low solar activity year the inclusion of solar and geomagnetic indices led to only modest improvements over the ConvLSTM model without these indices. However, under the high solar activity conditions of 2024, the model achieved significant gains in predictive performance, with MAE and RMSE reduced by 13.6% and 11.6% compared with c1pg, respectively, demonstrating a pronounced enhancement in forecasting accuracy.

Table 2.
Comparison of solar and geomagnetic activities in 2015, 2019, and 2024.
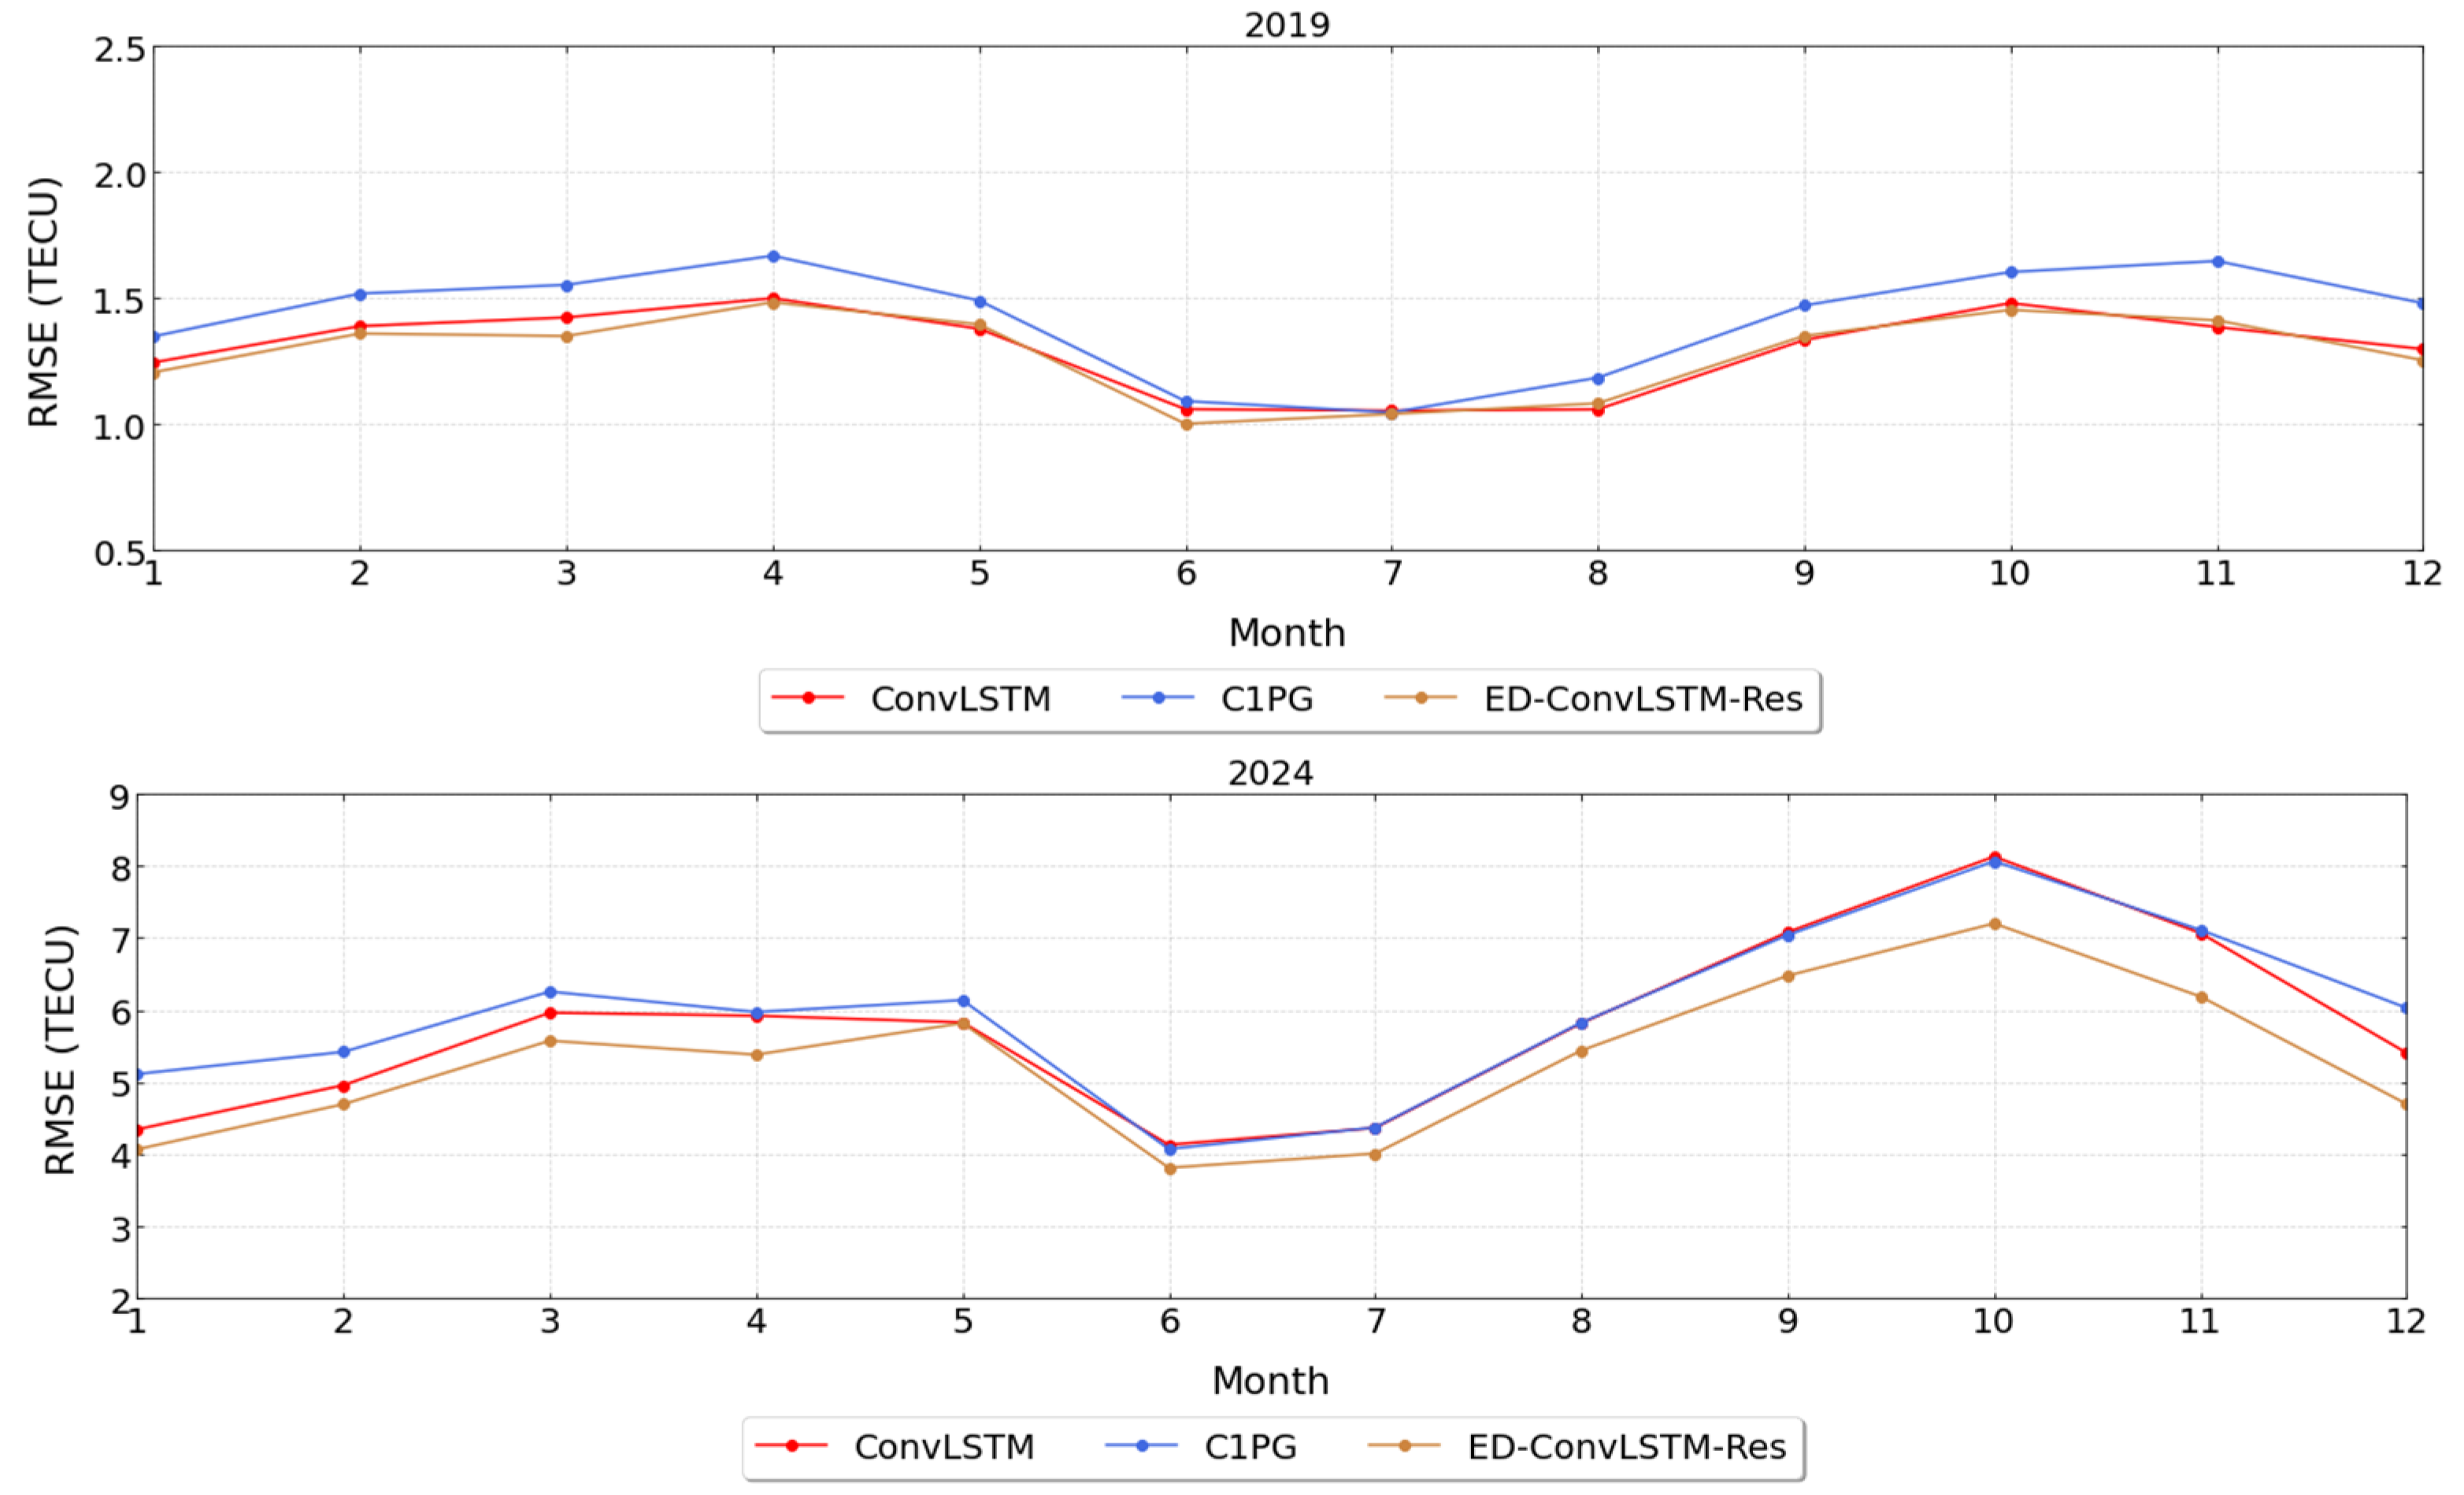
Figure 6 depicts the RMSE of different models throughout 2019 and 2024, revealing cyclical changes. In the performance of the whole year, the RMSE of ED-ConvLSTM-Res is the smallest, the prediction performance of ED-ConvLSTM-Res is better than ConvLSTM and c1pg, and the prediction performance is the best. Comparing the low-solar-activity year 2019 with the high-solar-activity year 2024 reveals a systematic degradation in predictive accuracy, with consistently larger RMSE values in 2024. The intensity of ionospheric changes is positively correlated with the intensity of solar activity. The stronger the solar activity, the greater the TEC fluctuations and prediction errors. The model’s prediction performance varies by season, with RMSE in northern hemisphere summer lower than in spring, autumn, and winter. It is well known that summer ionospheric conditions are more stable owing to longer solar illumination, which suppresses large TEC fluctuations. In addition to this, background atmospheric circulation may also contribute to enhanced stability during summer. Prevailing thermospheric winds and neutral dynamics can suppress irregularities and upward propagating disturbances, leading to smoother ionospheric structures and reduced TEC variability [29]. In the other seasons, stronger dynamical and geomagnetic processes introduce greater variability, leading to poorer accuracy for methods that rely on previous observations.
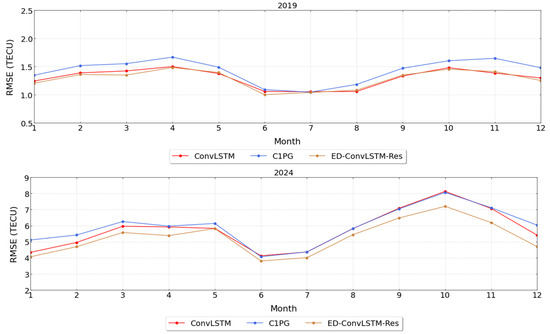
Figure 6.
The RMSE values averaged over each month of TEC prediction by ED-ConvLSTM-Res compared with c1pg and ConvLSTM in 2019 (low solar activity year) and 2024 (high solar activity year).
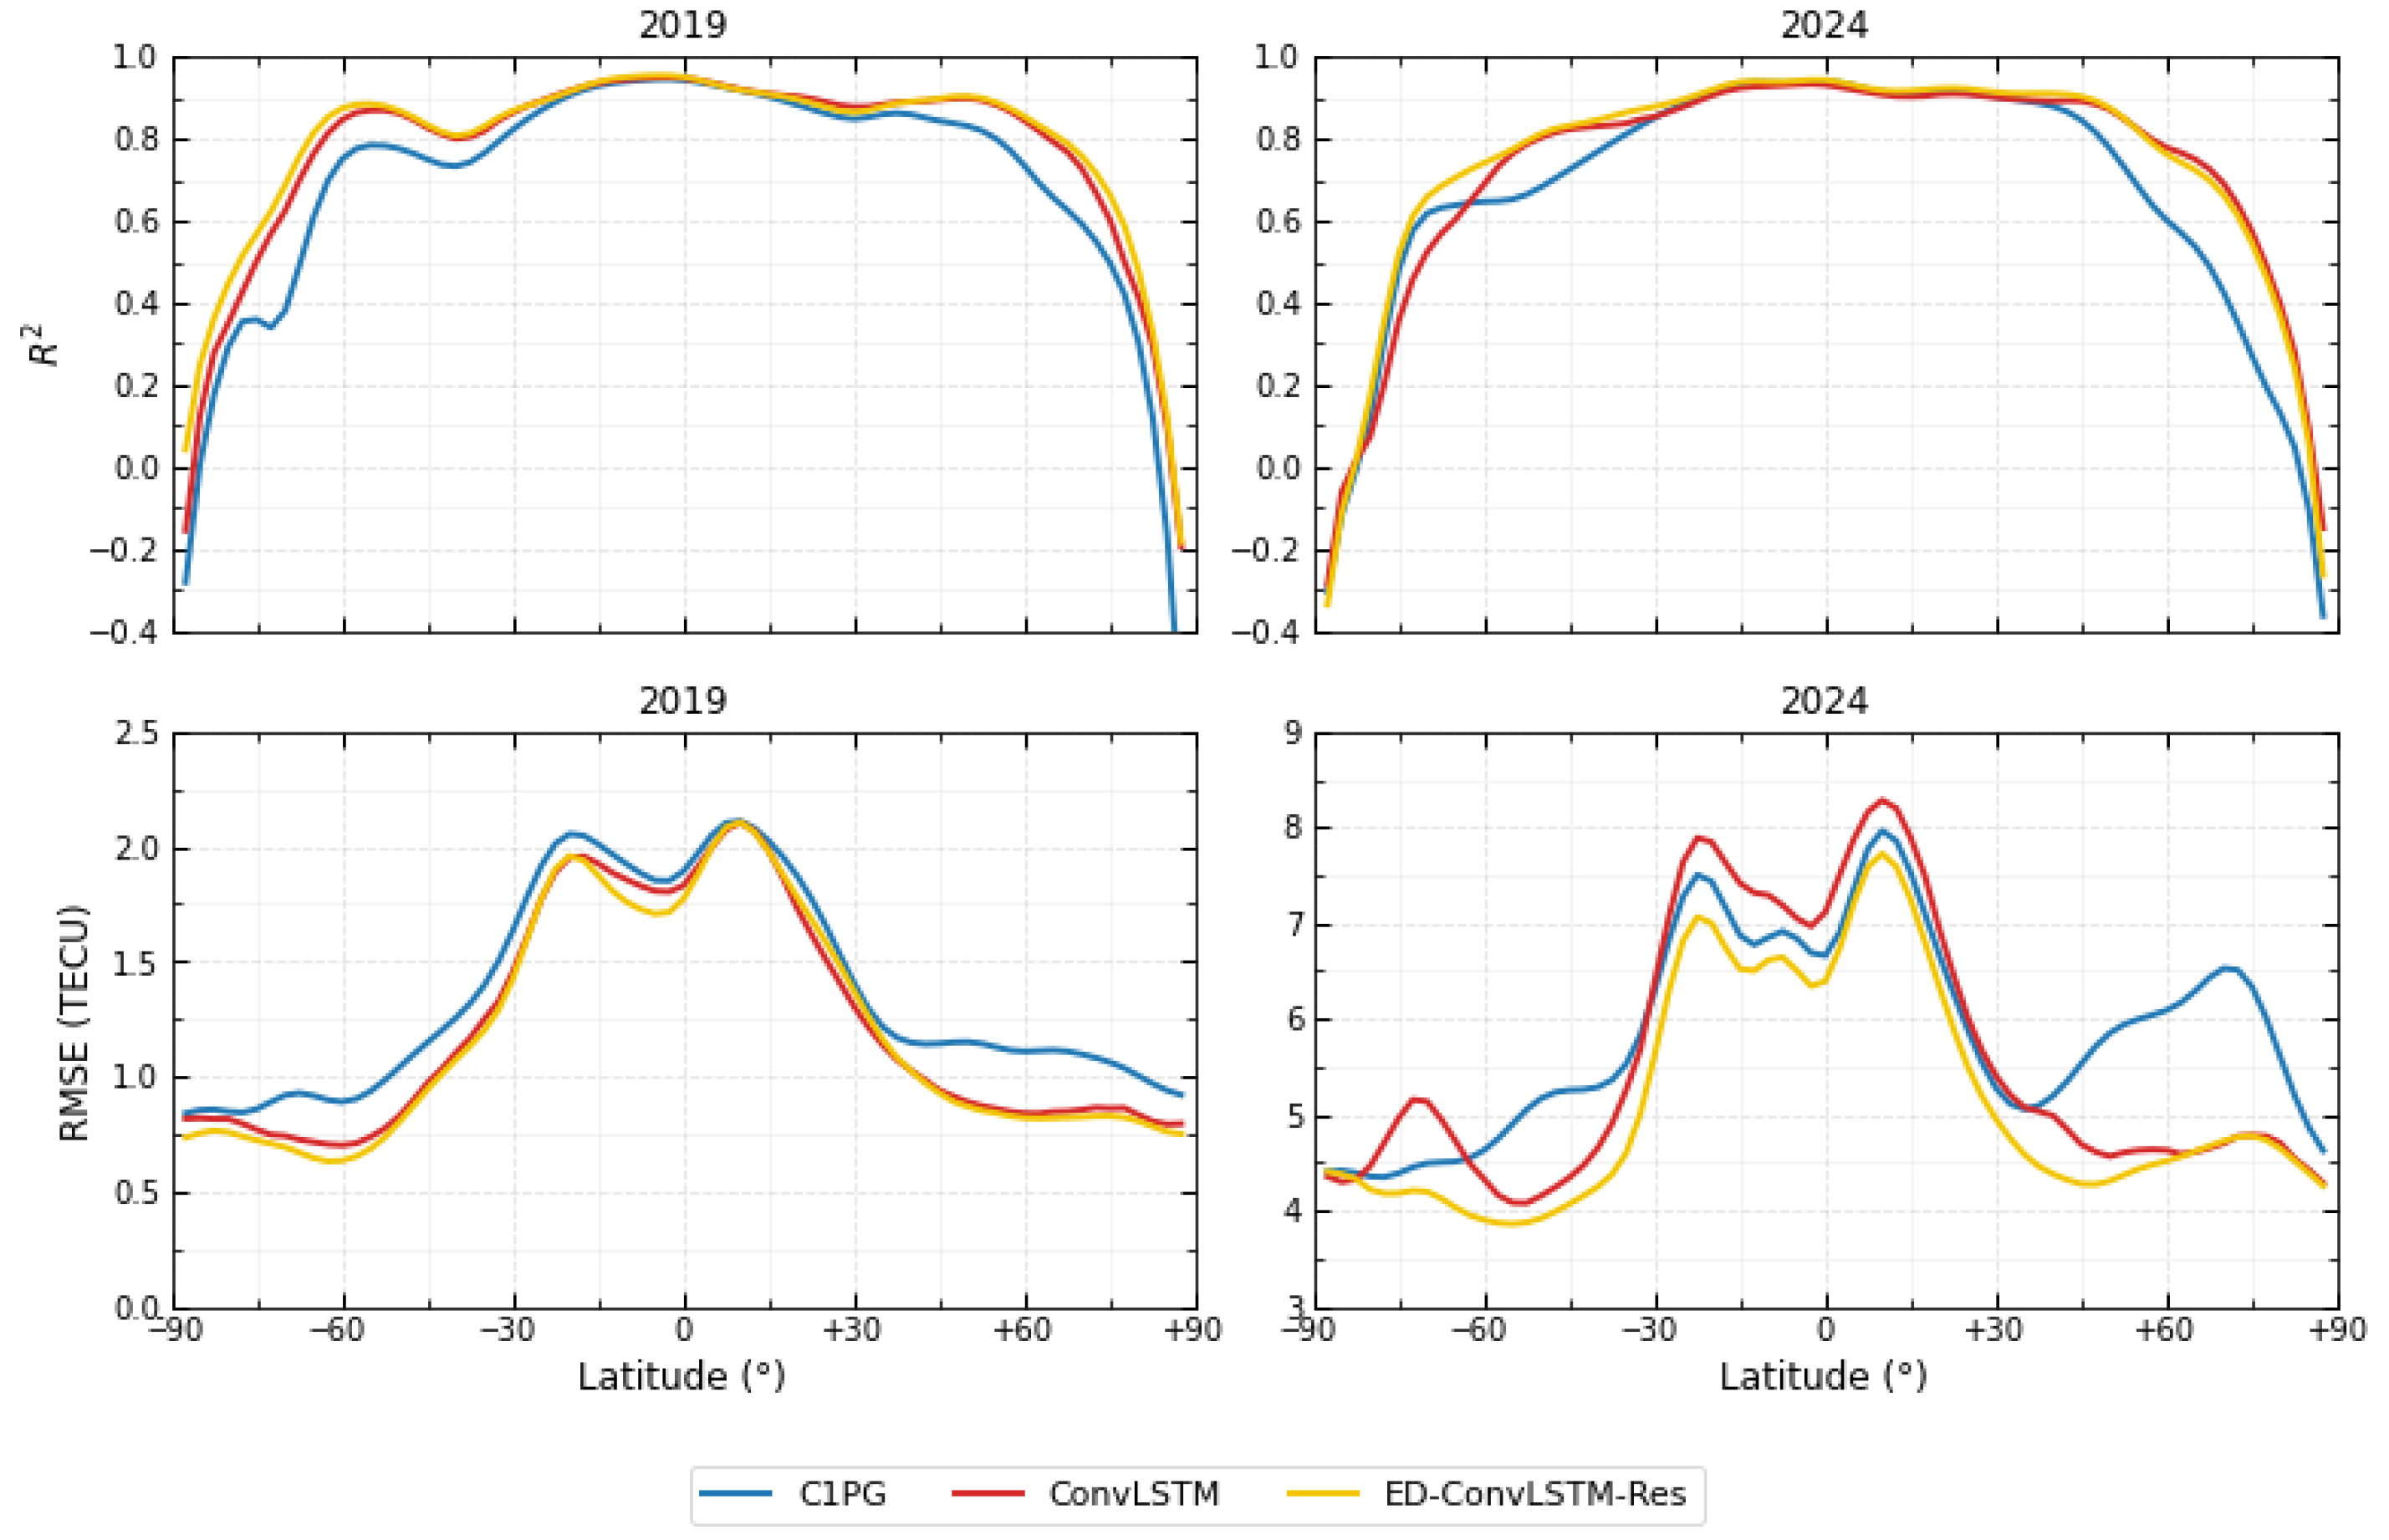
Figure 7 illustrates the variation in RMSE and R2 with latitude for the datasets from 2019 and 2024. Notably, the ED-ConvLSTM-Res model consistently exhibits the lowest error across latitudes. It can be observed that the ED-ConvLSTM-Res model outperforms both the c1pg product and the ConvLSTM model, particularly in the mid-latitude regions. All three prediction results display a pronounced latitude-dependent pattern in RMSE, which is likely associated with the equatorial ionization anomaly (EIA). Furthermore, the errors in the year 2024, a period of elevated solar activity, are generally higher than those observed during the lower solar activity year of 2019. The ED-ConvLSTM-Res model attains the highest R2, indicating that it explains the largest share of the variance in observed TEC. The higher R2 also implies smaller unexplained residual variance and superior skill in tracking TEC variability across latitude.
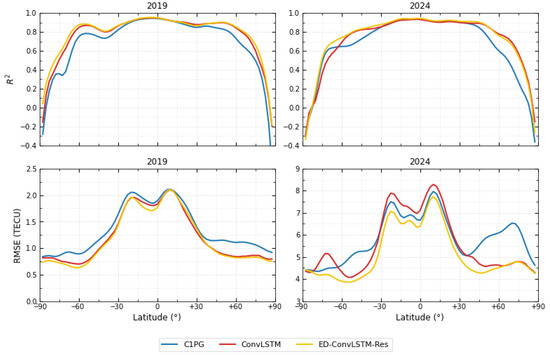
Figure 7.
The RMSE and R2 of the ED-ConvLSTM-Res model, c1pg, and ConvLSTM model vary with latitude in 2019 and 2024.
We assessed 1-day-ahead ionospheric TEC prediction errors over the entire test set using the trained model. Following Formula (8), RMSE was calculated for each forecast, and the distribution histogram is presented in Figure 8. In 2019, the ED-ConvLSTM-Res model yielded a mean RMSE of 1.28 TECU and a standard deviation of 0.26 TECU, indicating strong stability. During the high-solar-activity year of 2024, the mean RMSE was 5.28 TECU and the standard deviation was 1.78 TECU.

Figure 8.
The histogram of 1-day prediction error in 2019 ((left), µ = 1.28, σ = 0.26) and 2024 ((right), µ = 5.28, σ = 1.78).
4. Conclusions
This paper proposes an ED-ConvLSTM-Res model incorporating solar and geomagnetic indices for GIM forecasting. The model was trained using CODE GIM data and ap, F10.7 index from 2002 to 2018 and 2020 to 2023, and tested on datasets from 2019 and 1 January 2024 to 31 May 2025. Inputs consisted of three consecutive days of data to predict the GIM of the following day. Comparative experiments with the c1pg and ConvLSTM models demonstrate that the ED-ConvLSTM-Res model achieves higher prediction accuracy, particularly during geomagnetic storm periods. Based on the performance of our model during both high and low solar activity periods compared to other models, the conclusions are as follows:
The ConvLSTM model incorporating residual connections not only simultaneously captures both temporal dynamics and spatial dependencies within the data, but also enhances training stability and accelerates convergence. By integrating solar and geomagnetic indices as auxiliary input features, the model effectively captures characteristic patterns during geomagnetic storm events, thereby significantly improving prediction accuracy of years with high solar activity.
In terms of quantitative results, the ED-ConvLSTM-Res model achieved mean RMSE values of 1.28 TECU (σ = 0.26) in 2019 and 5.28 TECU (σ = 1.78) in 2024, corresponding to error reductions of 10.5% and 11.6% relative to c1pg. The corresponding MAE values are 0.87 and 3.87, with reductions of 14.7% and 13.6%, while the R2 values are 0.95 and 0.94. Overall, performance remains stable throughout the year, and in the high–solar-activity year 2024 the model delivers a more pronounced accuracy gain over c1pg.
In summary, the global ionospheric TEC prediction model proposed in this study demonstrates high forecast accuracy. The model requires only the preceding three days of GIM data as input, combined with geomagnetic activity indices and solar activity parameters, to effectively predict the GIM for the future. Providing timely, accurate, and reliable ionospheric TEC data and corresponding error correction information is of great significance to relevant scientific research and engineering applications. These data products can be widely used in various fields, including satellite navigation, radar imaging, radio communication error mitigation, aviation support, and shortwave communication optimization. During periods of high solar activity, the increased forecast errors are attributed to several interconnected factors: the limited capacity of the current model to represent multi-scale storm dynamics, the incomplete or coarse representation of key physical drivers such as prompt penetration electric fields and the disturbance dynamo, data constraints related to GIM resolution, and the inherent scarcity of extreme events in the training dataset. To address these limitations, our future work will focus on adopting multi-scale model architectures, fusing higher-resolution TEC products such as the MIT GNSS TEC dataset, and developing probabilistic forecasts to provide calibrated uncertainty quantification. Future research will include developing explainable artificial intelligence to explain model decisions and extending the forecast range to multi-day timescales, significantly improving the reliability and utility of ionospheric forecasts.
Author Contributions
Conceptualization was carried out by W.H. and L.Z., while H.X. and H.S. were responsible for the methodology. Validation was conducted by X.W. and M.L. The main manuscript was prepared primarily by J.Y. All authors have read and agreed to the published version of the manuscript.
Funding
This work is supported by the National Natural Science Foundation of China (41974184, 41674183 and 42504172), the Chinese Sponsored Postdoctoral Fellowship Program (Grant NO. GZC20232695).
Data Availability Statement
The CODE GIM (including the prediction from c1pg and the ground truth) are available from the Crustal Dynamics Data Information System “https://cddis.nasa.gov/” (accessed on 23 September 2025). The Dst data are available from the World Data Center for Geomagnetism, Kyoto “http://wdc.kugi.kyoto-u.ac.jp/” (accessed on 23 September 2025). The ap and F10.7 data are available from Geomagnetic observatory Niemegk, GFZ Helmholtz Centre for Geosciences “https://kp.gfz.de/” (accessed on 23 September 2025). The comparative data on solar and geomagnetic activity are obtained from the SWPC “https://www.swpc.noaa.gov/” (accessed on 25 September 2025).
Acknowledgments
The authors express their gratitude to the Center for Orbit Determination in Europe for providing the products used in this study. Additionally, the authors acknowledge Kyoto University for providing the Dst index data, and the Geomagnetic Observatory Niemegk, GFZ Helmholtz Centre for Geosciences, for the ap and F10.7 data. The authors gratefully acknowledge the National Oceanic and Atmospheric Administration Space Weather Prediction Center for providing the comparative data on solar and geomagnetic activity. Furthermore, the authors would like to express their sincere appreciation to the editor and the anonymous reviewers for their valuable suggestions and insightful comments, which have greatly contributed to improving the quality of this manuscript.
Conflicts of Interest
The authors declare no conflicts of interest.
References
- Bust, G.S.; Mitchell, C.N. History, Current State, and Future Directions of Ionospheric Imaging. Rev. Geophys. 2008, 46. [Google Scholar] [CrossRef]
- Kaselimi, M.; Voulodimos, A.; Doulamis, N.; Doulamis, A.; Delikaraoglou, D. A Causal Long Short-Term Memory Sequence to Sequence Model for TEC Prediction Using GNSS Observations. Remote Sens. 2020, 12, 1354. [Google Scholar] [CrossRef]
- Winglee, R.M.; Chua, D.; Brittnacher, M.; Parks, G.K.; Lu, G. Global Impact of Ionospheric Outflows on the Dynamics of the Magnetosphere and Cross-Polar Cap Potential. J. Geophys. Res. Space Phys. 2002, 107, SMP 11-1–SMP 11-12. [Google Scholar] [CrossRef]
- Wang, X.; Aa, E.; Chen, Y.; Zhang, J.; Zhu, Y.; Cai, L.; Lu, X.; Luo, B.; Liu, S.; Li, M.; et al. Mid-latitude neutral wind response during the mother’s day super-intense geomagnetic storm in 2024 using observations from the Chinese meridian project. J. Geophys. Res. Space Phys. 2025, 130, e2024JA033574. [Google Scholar] [CrossRef]
- Karpov, I.V.; Karpov, M.I.; Borchevkina, O.P.; Yakimova, G.A.; Koren’kova, N.A. Spatial and Temporal Variations of the Ionosphere during Meteorological Disturbances in December 2010. Russ. J. Phys. Chem. B 2019, 13, 714–719. [Google Scholar] [CrossRef]
- Zhang, R.; Li, H.; Shen, Y.; Yang, J.; Li, W.; Zhao, D.; Hu, A. Deep Learning Applications in Ionospheric Modeling: Progress, Challenges, and Opportunities. Remote Sens. 2025, 17, 124. [Google Scholar] [CrossRef]
- Ren, X.; Zhao, B.; Ren, Z.; Wang, Y.; Xiong, B. Deep Learning-Based Prediction of Global Ionospheric TEC During Storm Periods: Mixed CNN-BiLSTM Method. Space Weather 2024, 22, e2024SW003877. [Google Scholar] [CrossRef]
- Ruwali, A.; Kumar, A.J.S.; Prakash, K.B.; Sivavaraprasad, G.; Ratnam, D.V. Implementation of Hybrid Deep Learning Model (LSTM-CNN) for Ionospheric TEC Forecasting Using GPS Data. IEEE Geosci. Remote Sens. Lett. 2021, 18, 1004–1008. [Google Scholar] [CrossRef]
- Liu, L.; Morton, Y.J.; Liu, Y. ML Prediction of Global Ionospheric TEC Maps. Space Weather 2022, 20, e2022SW003135. [Google Scholar] [CrossRef]
- Jeong, S.; Lee, W.K.; Kil, H.; Jang, S.; Kim, J.; Kwak, Y. Deep Learning-Based Regional Ionospheric Total Electron Content Prediction—Long Short-Term Memory (LSTM) and Convolutional LSTM Approach. Space Weather 2024, 22, e2023SW003763. [Google Scholar] [CrossRef]
- Xia, G.; Zhang, F.; Wang, C.; Zhou, C. ED-ConvLSTM: A Novel Global Ionospheric Total Electron Content Medium-Term Forecast Model. Space Weather 2022, 20, e2021SW002959. [Google Scholar] [CrossRef]
- Yang, J.; Huang, W.; Xia, G.; Zhou, C.; Chen, Y. Operational Forecasting of Global Ionospheric TEC Maps 1-, 2-, and 3-Day in Advance by ConvLSTM Model. Remote Sens. 2024, 16, 1700. [Google Scholar] [CrossRef]
- Lee, S.; Ji, E.; Moon, Y.; Park, E. One-Day Forecasting of Global TEC Using a Novel Deep Learning Model. Space Weather 2021, 19, 2020SW002600. [Google Scholar] [CrossRef]
- Xue, K.; Shi, C.; Wang, C. RA-ConvLSTM: Recurrent-Architecture Attentional ConvLSTM Networks for Prediction of Global Total Electron Content. Space Weather 2025, 23, e2024SW004173. [Google Scholar] [CrossRef]
- Pesnell, W.D. Lessons Learned from Predictions of Solar Cycle 24. J. Space Weather Space Clim. 2020, 10, 60. [Google Scholar] [CrossRef]
- Hamid, R.H.; Marzouk, B.A. Forecasting the Peak of the Present Solar Activity Cycle 24. NRIAG J. Astron. Geophys. 2018, 7, 15–19. [Google Scholar] [CrossRef]
- De Paulo, M.C.M.; Marques, H.A.; Feitosa, R.Q.; Ferreira, M.P. New Encoder–Decoder Convolutional LSTM Neural Network Architectures for next-Day Global Ionosphere Maps Forecast. GPS Solut. 2023, 27, 95. [Google Scholar] [CrossRef]
- Guo, G.; Zhang, T. A Residual Spatio-Temporal Architecture for Travel Demand Forecasting. Transp. Res. Part C Emerg. Technol. 2020, 115, 102639. [Google Scholar] [CrossRef]
- Wang, C.; Xue, K.; Shi, C. An Optimized Model With Encoder-Decoder ConvLSTM for Global Ionospheric Forecasting. IEEE Geosci. Remote Sens. Lett. 2025, 22, 1–5. [Google Scholar] [CrossRef]
- Li, Y.; Deng, H.; Xiao, J.; Li, B.; Han, T.; Huang, J.; Liu, H. ED-SA-ConvLSTM: A Novel Spatiotemporal Prediction Model and Its Application in Ionospheric TEC Prediction. Mathematics 2025, 13, 1986. [Google Scholar] [CrossRef]
- Laštovička, J. On the Role of Solar and Geomagnetic Activity in Long-Term Trends in the Atmosphere–Ionosphere System. J. Atmos. Sol.-Terr. Phys. 2005, 67, 83–92. [Google Scholar] [CrossRef]
- Wang, X.; Miao, J.; Aa, E.; Ren, T.; Wang, Y.; Liu, J.; Liu, S. Statistical analysis of Joule heating and thermosphere response during geomagnetic storms of different magnitudes. J. Geophys. Res. Space Phys. 2020, 125, e2020JA027966. [Google Scholar] [CrossRef]
- Wang, X.; Miao, J.; Lu, X.; Aa, E.; Liu, J.; Wang, Y.; Liu, S. Latitudinal impacts of joule heating on the high-latitude thermospheric density enhancement during geomagnetic storms. J. Geophys. Res. Space Phys. 2021, 126, e2020JA028747. [Google Scholar] [CrossRef]
- Matzka, J.; Stolle, C.; Yamazaki, Y.; Bronkalla, O.; Morschhauser, A. The Geomagnetic Kp Index and Derived Indices of Geomagnetic Activity. Space Weather 2021, 19, e2020SW002641. [Google Scholar] [CrossRef]
- Tapping, K.F. The 10.7 Cm Solar Radio Flux (F10.7). Space Weather 2013, 11, 394–406. [Google Scholar] [CrossRef]
- Paularena, K.I.; Szabo, A.; Richardson, J.D. Coincident 1.3-year Periodicities in the Ap Geomagnetic Index and the Solar Wind. Geophys. Res. Lett. 1995, 22, 3001–3004. [Google Scholar] [CrossRef]
- Shi, X.; Chen, Z.; Wang, H.; Yeung, D.-Y.; Wong, W.; Woo, W. Convolutional LSTM Network: A Machine Learning Approach for Precipitation Nowcasting. In Proceedings of the 29th International Conference on Neural Information Processing Systems, Montreal, QC, Canada, 7–12 December 2015. [Google Scholar]
- Gonzalez, W.D.; Joselyn, J.A.; Kamide, Y.; Kroehl, H.W.; Rostoker, G.; Tsurutani, B.T.; Vasyliunas, V.M. What Is a Geomagnetic Storm? J. Geophys. Res. Space Phys. 1994, 99, 5771–5792. [Google Scholar] [CrossRef]
- Fuller-Rowell, T.J.; Codrescu, M.V.; Moffett, R.J.; Quegan, S. Response of the Thermosphere and Ionosphere to Geomagnetic Storms. J. Geophys. Res. Space Phys. 1994, 99, 3893–3914. [Google Scholar] [CrossRef]
Disclaimer/Publisher’s Note: The statements, opinions and data contained in all publications are solely those of the individual author(s) and contributor(s) and not of MDPI and/or the editor(s). MDPI and/or the editor(s) disclaim responsibility for any injury to people or property resulting from any ideas, methods, instructions or products referred to in the content. |
© 2025 by the authors. Licensee MDPI, Basel, Switzerland. This article is an open access article distributed under the terms and conditions of the Creative Commons Attribution (CC BY) license (https://creativecommons.org/licenses/by/4.0/).

