Highlights
What are the main findings?
- Developed an in-flight calibration method that links sunglint reflectance ratios (R763/R765 and R910/R865) to surface–atmosphere parameters (surface pressure and water vapor column concentrations) via radiative-transfer simulations and polynomial fitting, achieving high agreement between simulations and DPC observations (763 nm: R2 > 0.99, MAE < 0.014, RMSE < 0.002; 910 nm: R2 > 0.98, MAE = 0.031).
- Established calibration uncertainty budgets of 3.01% (763 nm) and 3.45% (910 nm) and independently validated the method through desert cross-checks (differences: 0.06% for 763 nm; 4.93% for 910 nm) and product-level comparisons of surface pressure against DEM-derived estimates and total column water vapor against MODIS products.
What is the implication of the main finding?
- Provides a practical and accurate in-flight calibration method for the Gaofen-5 (02) DPC gas absorption bands, enhancing the reliability of atmospheric and environmental retrievals.
- The proposed framework integrates physically based inter-band relationships with readily available reanalysis inputs, ensuring applicability to sensors with similar spectral characteristics and supporting long-term radiometric stability monitoring.
Abstract
The Directional Polarimetric Camera (DPC) onboard the Gaofen-5 (02) satellite includes gas absorption bands that are crucial for the quantitative retrieval of clouds, atmospheric aerosols, and surface parameters. However, in-flight radiometric calibration of these bands remains challenging due to strong absorption features and the lack of onboard calibration devices. In this study, a calibration method that exploits functional relationships between the reflectance ratios of gas absorption and adjacent reference bands and key surface–atmosphere parameters over sunglint were presented. Radiative transfer simulations were combined with polynomial fitting to establish these relationships, and prior knowledge of surface pressure and water vapor column concentration was incorporated to achieve high-precision calibration. Results show that the calibration uncertainty of the oxygen absorption band is mainly driven by surface pressure, with a total uncertainty of 3.01%. For the water vapor absorption band, uncertainties are primarily associated with water vapor column concentration and surface reflectance, yielding total uncertainties of 3.45%. Validation demonstrates the robustness of the proposed method: (1) cross-calibration using desert samples confirms the stability of the results, and (2) the retrieved surface pressure agrees with the DEM-derived estimates, and the retrieved total column water vapor agrees with the MODIS products, confirming the calibration. Overall, the method provides reliable in-flight calibration of DPC gas absorption bands on Gaofen-5 (02) and can be adapted to similar sensors with comparable spectral configurations.
1. Introduction
Launched on 7 September 2021, the Gaofen-5 (02) satellite is an integral component of China’s high-definition Earth observation system. Among its seven onboard instruments, the Directional Polarimetric Camera (DPC) is specifically designed to monitor a wide range of environmental parameters, including terrestrial ecosystems, greenhouse gases, clouds, and air pollutants [1,2,3,4]. Within this system, the oxygen absorption band is employed to retrieve cloud optical properties such as cloud top pressure, while the water vapor absorption band facilitates the estimation of atmospheric water vapor column concentration [5,6]. These parameters are essential for the quantitative detection of clouds, aerosols, and surface environmental conditions.
In orbit, sensor components are susceptible to degradation caused by launch vibrations, ultraviolet radiation, and long-term exposure to the space environment. As a result, achieving accurate in-flight radiometric calibration, particularly for gas absorption bands without onboard calibrators, remains a major challenge. In addition, the strong absorption characteristics of these bands further complicate precise radiative transfer modeling [7]. Consequently, alternative calibration strategies are required to ensure high-precision measurements of gas absorption bands.
For satellite sensors without onboard calibrators, in-flight radiometric calibration typically relies on natural targets such as Rayleigh scattering, sunglint, clouds, and desert sites [8,9,10]. Rayleigh scattering calibration is widely applied for absolute radiometric calibration of visible bands, but its effectiveness rapidly diminishes in the near-infrared due to the steep reduction in Rayleigh scattering signals at longer wavelengths [11,12]. To address this limitation, sunglint-based relative radiometric calibration has been combined with Rayleigh scattering calibration, enabling the extension of absolute calibration coefficients from the visible to near-infrared bands [13]. Nevertheless, accurate modeling of radiative transfer in absorption bands remains highly difficult, limiting the reliability of derived calibration coefficients [7,14]. Calibration using deep convective clouds (DCCs) provides an alternative, since DCCs exhibit high and stable reflectance across the visible and near-infrared range [15,16,17]. However, this approach becomes less effective beyond 865 nm, particularly at the 910 nm water vapor band, because inter-band consistency deteriorates with increasing wavelength. Desert-based field experiments can provide high-accuracy calibration references across the visible-to-infrared spectrum. Nonetheless, the requirement for long-term deployment of instruments and field personnel renders this method impractical for sustained monitoring. Cross-calibration using desert sites and pre-calibrated reference sensors helps to mitigate these constraints [18,19,20]. Despite these efforts, spectral band discrepancies between different sensors and uncertain BRDF still hinder reliable absolute calibration of gas absorption bands.
Overall, existing methods fail to adequately address the challenges associated with in-flight radiometric calibration of gas absorption bands. In long-term radiometric monitoring, it is common to approximate the calibration coefficients of absorption bands by adopting those of adjacent reference bands; however, this oversimplification inevitably reduces calibration accuracy [17]. Hence, an improved method is required to enable operational, high-precision in-flight calibration for gas absorption bands.
Considering these limitations, this study proposes an in-flight calibration method tailored for the gas absorption bands of the DPC onboard Gaofen-5 (02). Firstly, the reference bands are calibrated by an inter-band method using sunglint. Specifically, quantitative relationships between top-of-atmosphere reflectance ratios of absorption and adjacent reference bands over sunglint and the corresponding surface–atmosphere parameters are established. These relationships are derived through radiative transfer simulations combined with polynomial fitting, and calibration coefficients are subsequently obtained by comparing simulated and observed reflectance. The objective of this study is to provide a practical and accurate approach for in-flight radiometric calibration of gas absorption bands, thereby enhancing the reliability of DPC data for atmospheric and environmental applications. Moreover, the integration of Rayleigh-scattering (calibration for 443, 490, 565, 670 nm bands), a sunglint-based inter-band approach (calibration for 765 and 865 nm bands) and the method proposed in this study (calibration for 763 and 910 nm bands) enables radiometric calibration of all DPC bands without relying on external instruments.
The remainder of this paper is organized as follows. Section 2 describes the DPC data and auxiliary datasets used for calibration and outlines the radiometric calibration methodology. Section 3 presents the polynomial fitting relationships for the oxygen and water vapor absorption bands together with the calibration results. Section 4 provides a detailed discussion, including the error budget analysis and validation of the proposed method using desert scenes and product retrievals. Finally, Section 5 summarizes the main conclusions.
2. Materials and Methods
2.1. DPC Data and Auxiliary Data
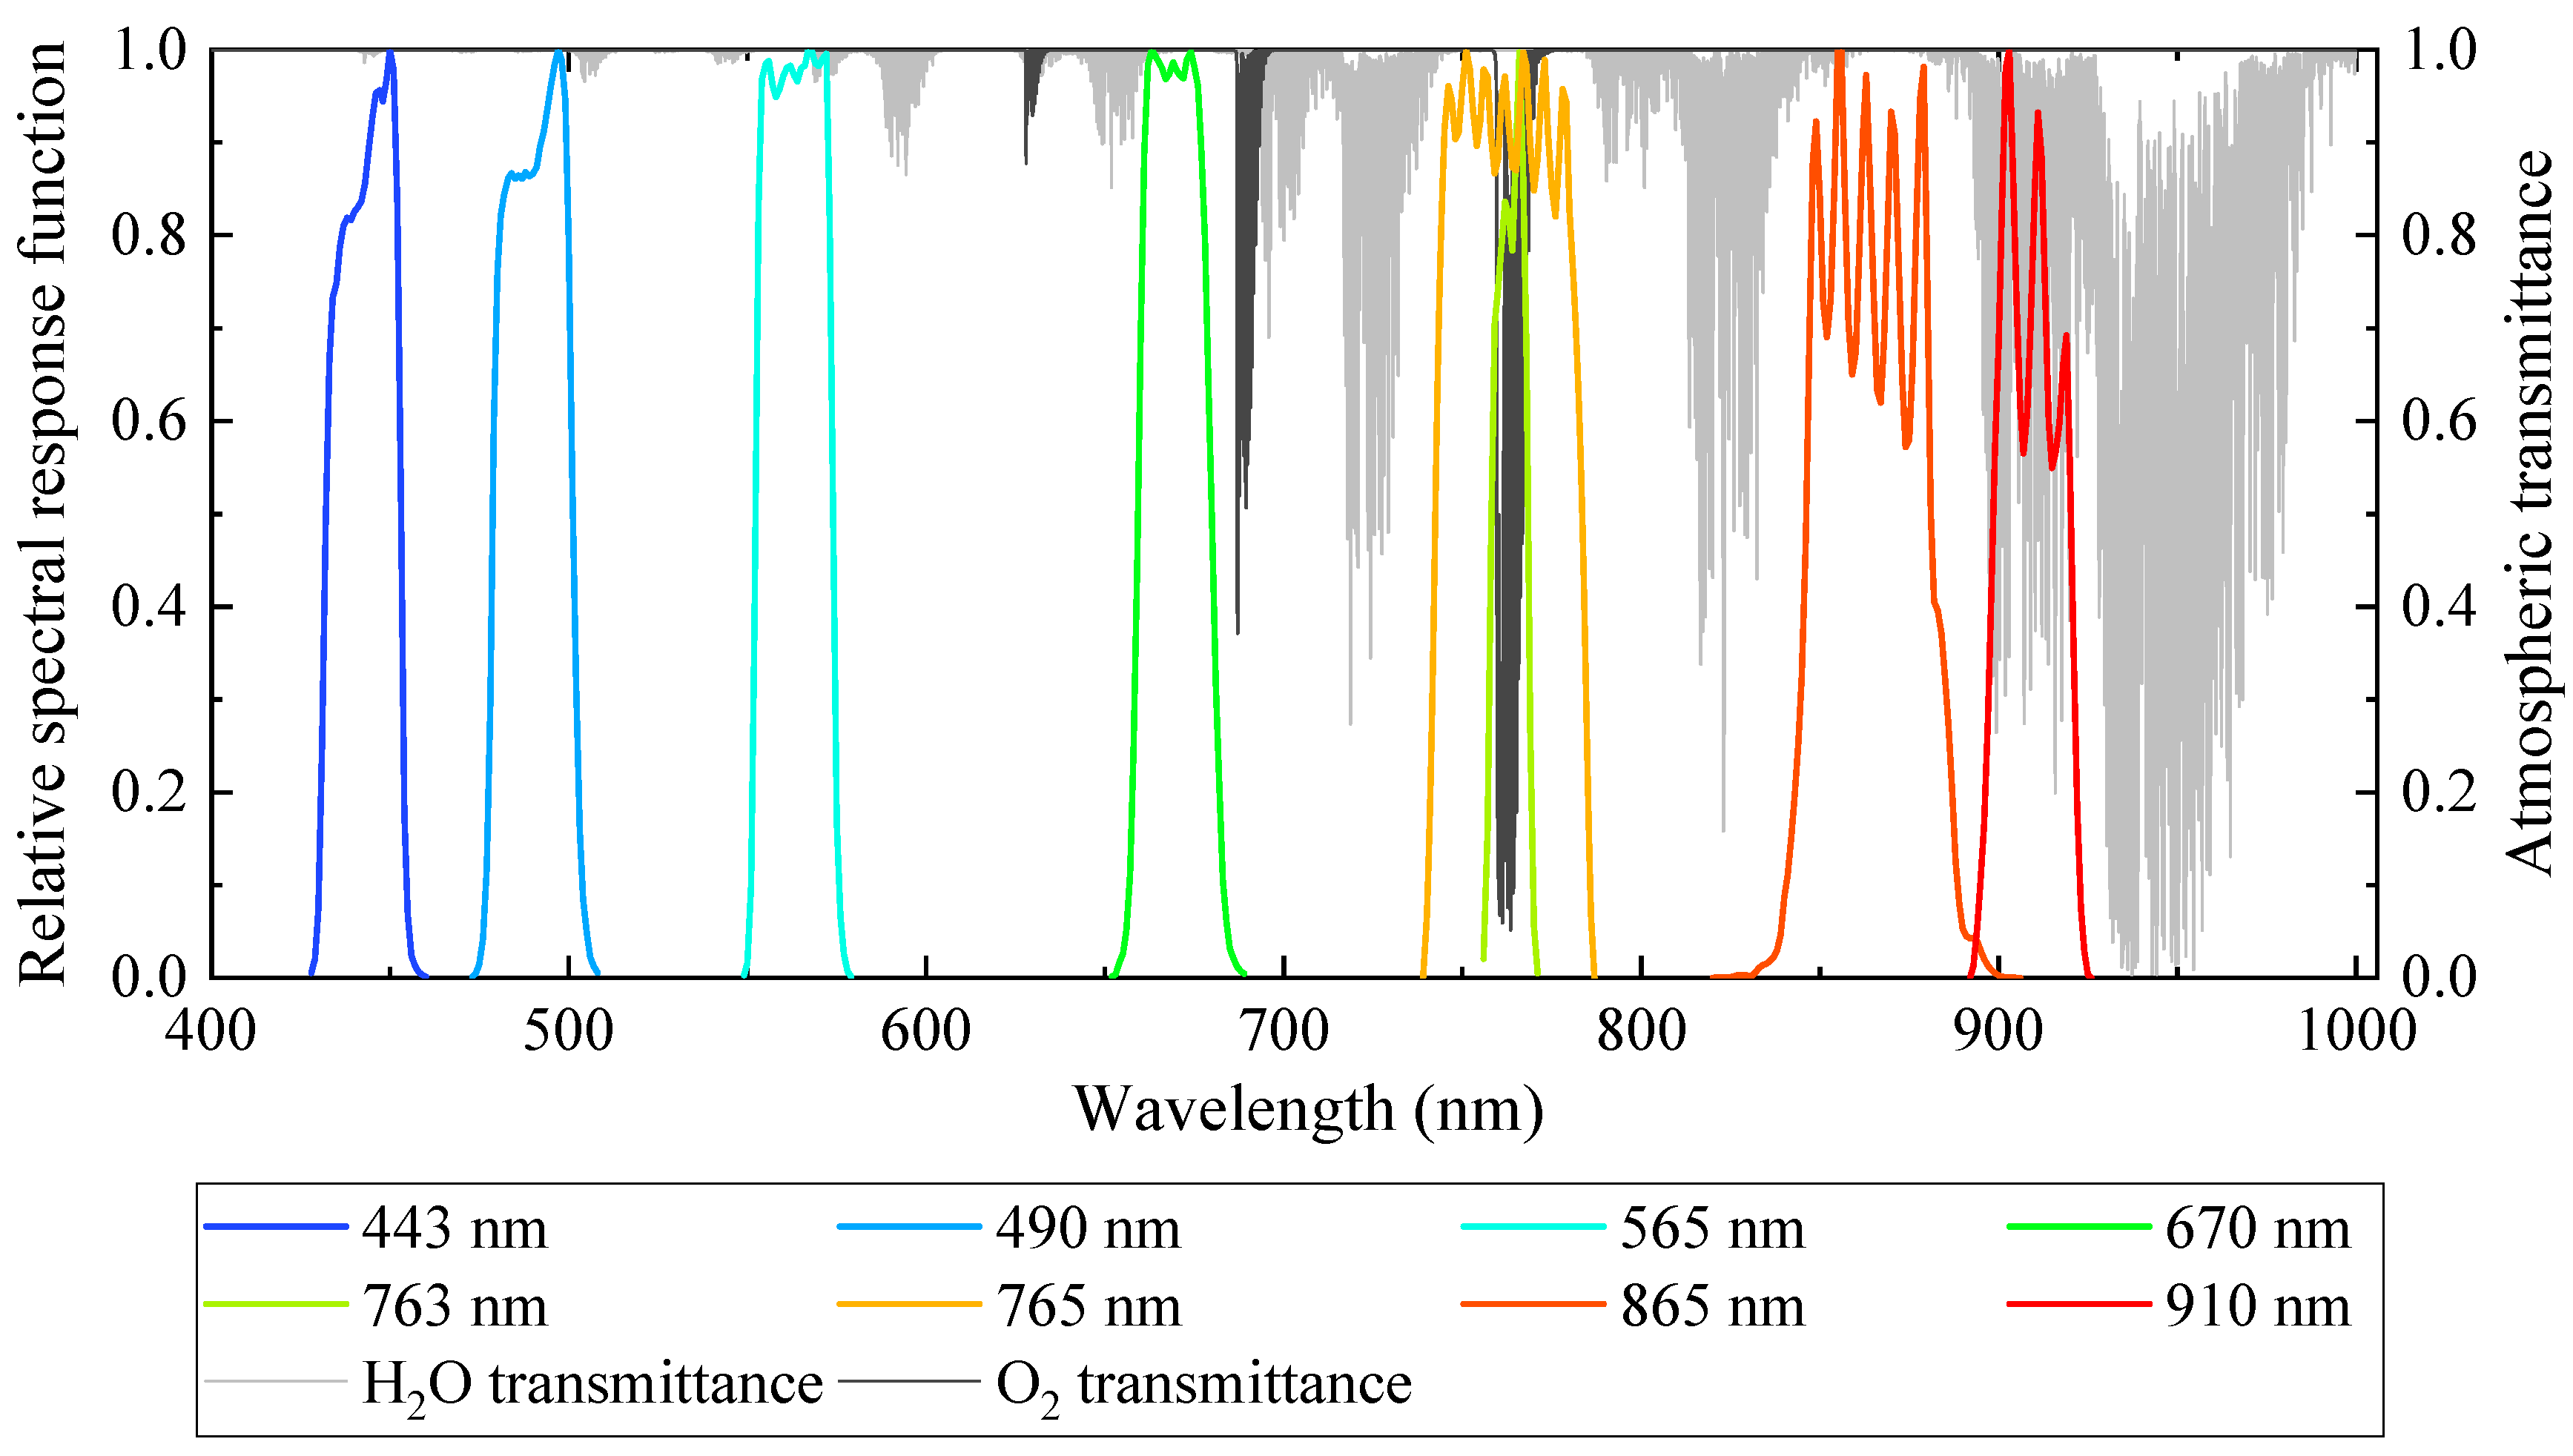
The DPC sensor (Anhui Institute of Optics and Fine Mechanics, Chinese Academy of Sciences, Hefei, China) onboard Gaofen-5 (02) (Shanghai Institute of Satellite Engineering, Shanghai, China) is a multi-angle polarization imager designed for atmospheric aerosol and cloud detection, with a local overpass time of approximately 10:30 a.m. The instrument adopts a design analogous to the POLDER (Centre National d’Études Spatiales, Paris, France), featuring a telecentric optical system with a wide field of view, a combined filter–polarizer rotating wheel, and a bidimensional CCD detector array [21,22]. It provides images at a spatial resolution of approximately 1.7 km over a ±50° swath. The DPC acquires images in eight spectral bands, including three polarized bands (490, 670, and 865 nm) and five non-polarized bands (443, 565, 763, 765, and 910 nm). Among these, the 763 nm and 910 nm bands are dedicated to atmospheric oxygen and water vapor absorption, respectively. The spectral response functions of the sensor and the corresponding atmospheric transmittance curves are illustrated in Figure 1. The CCD detector consists of 1024 × 1024 array, enabling observations of the same ground target from 17 different viewing angles.
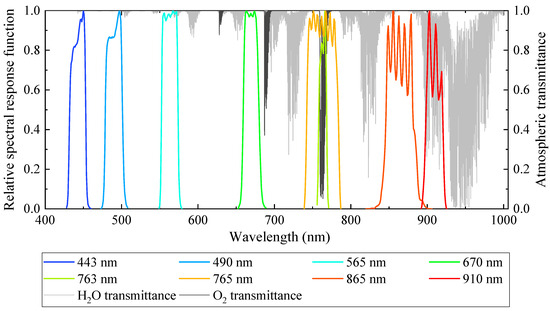
Figure 1.
The spectral response function of DPC.
Auxiliary data used for the calibration include near-real-time surface pressure, water vapor column concentration, wind speed and ozone column concentration products from ERA5 meteorological reanalysis data (with a spatial resolution 0.25° × 0.25°), AOD provided by MODIS/Terra (Raytheon Santa Barbara Remote Sensing, Goleta, CA, USA) level 2 product MOD04 (with a spatial resolution 3 km × 3 km), as well as the GTOPO30 digital elevation model (DEM) for calculating surface pressure [23,24,25,26].
To minimize the influence of oceanic and atmospheric variability, six non-equipped sites located in the deep ocean were selected [27]. The calibration experiments were carried out using all the viewing angle of DPC Level 1b data and auxiliary datasets covering a one-week period from 20–26 January 2022.
2.2. Absorption Band Radiometric Calibration Method
The apparent reflectance measured in a gas absorption band is primarily composed of Rayleigh scattering (), aerosol reflectance (), target surface reflectance (), and the effect of atmospheric transmittance (). The expression is as follows:
Here, is defined as the top-of-atmosphere (TOA) ratio of a reference band to an absorption band. When surface reflectance dominates, can be expressed as [28]:
where and are the atmospheric transmittances of the absorption and reference bands, respectively. is developed to the first order because that: (1) depends strongly on the sunglint surface, and its averaged values over the two spectral filters are almost equal [28,29]; (2) The atmospheric reflectance and varies little with the wavelength, and they are small compared to the surface reflectance over sunglint [30]. For the oxygen absorption band of DPC, is defined as the ratio of the absorption band reflectance at 763 nm () to the reference band reflectance at 765 nm (). For the water vapor absorption band, is defined as the ratio of the absorption band reflectance at 910 nm () to the reference band reflectance at 865 nm ().
- (1)
- Reference band calibration
For a wind-roughened ocean surface, sunglint is produced by Fresnel reflection from innumerable, differently oriented specular microfacets whose slope distribution is governed by wind speed. Exploiting this property, an effective wind speed is first retrieved from a radiometrically calibrated reference band. The retrieved wind speed is then supplied to 6SV (v2.1) model to simulate the apparent reflectance of the near-infrared bands, from which their radiometric calibration coefficients are determined. To ensure a sufficiently bright specular return, the sun–sensor geometry is constrained by the sunglint angle as:
where , and denote the solar zenith angle, view zenith angles and relative azimuth angle, respectively. Scenes with are retained. Because the inter-band ratio is independent of the absolute reflectance of the reference channel, observations satisfying the sunglint-geometry constraint can span a wide radiance range. To ensure clean atmospheric conditions, samples are further limited to AOD < 0.1, and wind speed < 6 m/s to minimize whitecap contamination. Using the DPC 565 nm band, previously calibrated through Rayleigh scattering method, as the reference, radiometric calibration was transferred to the 765 nm and 865 nm bands.
- (2)
- Oxygen absorption band calibration
For the oxygen absorption band, the absorption coefficient is calculated by a line-by-line integral method [31]. Assuming each line to follow a Lorentzian profile, with the atmosphere treated as homogeneous, the average transmittance from wavelength to 2 could be expressed as:
where is the oxygen absorption coefficient, and is the oxygen mass along the path, which can be obtained by the accumulation of absorption spectral lines. and are the line intensity and line width of the -th absorption spectral line, respectively. and represent the standard values at reference temperature (273 K) and pressure (1.013 kPa). is the energy of the lower state of the transition corresponding to the absorption spectrum.
According to these formulations, oxygen absorption is highly sensitive to surface pressure (. A polynomial relationship is therefore established between and , incorporating the air mass factor m (). By drawing on the pressure retrieval method, the relationship between and can be simulated and fitted [31].
- (3)
- water vapor absorption band calibration
For the water vapor absorption band, the transmittance can be obtained using the linear integral method:
where represents the probability related to the average absorption coefficient of the -th absorption spectral line, and is the water vapor absorption amount under pressure (kPa) and temperature (°C). and are empirical exponents, set to 0.9 and 0.45, respectively. Based on these formulations, the absorption of the water vapor band is greatly affected by the total water vapor column concentration. Combined with the air mass factor m, the relationship between and can be constructed [28].
- (4)
- Radiative transfer simulation
Theoretical relationships between the reflectance ratio and surface–atmosphere parameters are derived through radiative transfer modeling (RTM). This approach leverages the functional correlations of the reference-to-absorption band detection ratio with surface pressure (oxygen absorption band) and water vapor column concentration (water vapor absorption band). Polynomial fitting is then applied to these relationships. Based on near-real-time reanalysis data products, the TOA reflectance of gas absorption band was simulated with high precision.
The RTM was configured under different atmospheric models, geometric angles satisfying Equation (3), and surface pressure conditions to simulate the TOA reflectance of the absorption bands. From these simulations, the theoretical band ratio corresponding to different surface pressure or water vapor column concentration were calculated. And the six total column water vapor profiles were selected to represent typical variations from extremely dry to humid conditions. The parameter settings of the radiative transfer simulations are summarized in Table 1.

Table 1.
The parameter setting of radiation transfer simulation.
According to the empirical formulation, the relationship between the simulated band reflectance ratio and the corresponding surface parameter can be expressed as a polynomial. To achieve both accuracy and generalizability, we evaluated polynomial orders 2–8 and selected a sixth-order model that offers the best bias–variance trade-off. It is defined as:
where are the polynomial coefficients and is the intercept. When , is assumed as , and when , is defined as .
3. Calibration Results
3.1. Reference Band
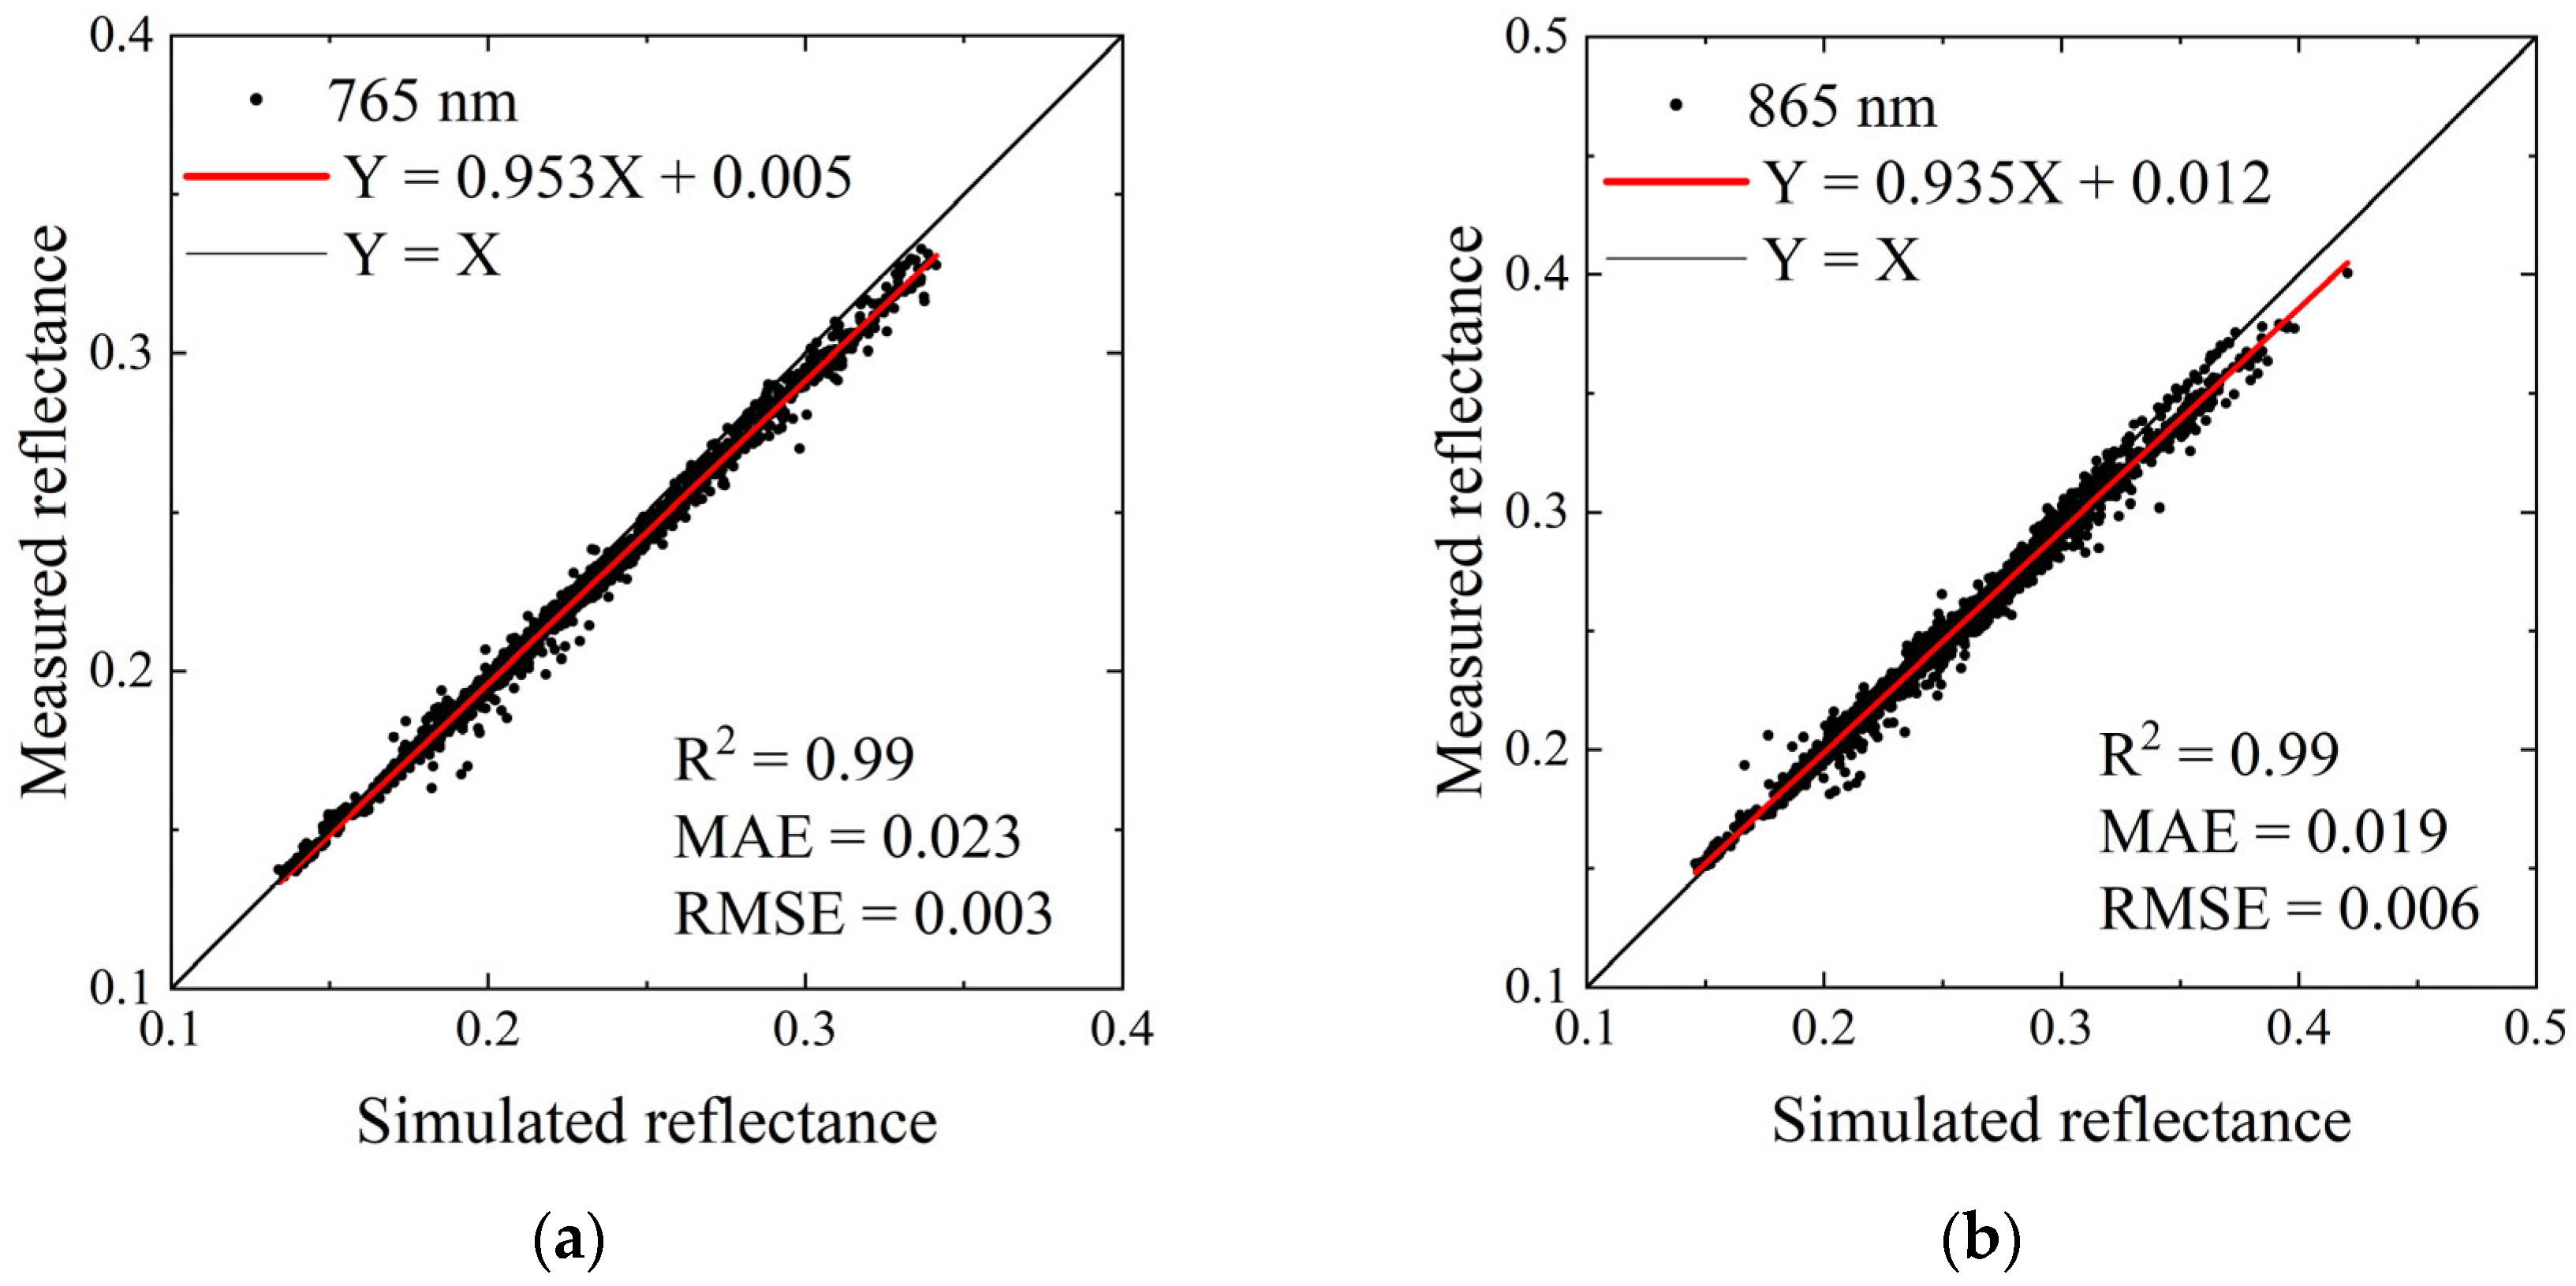
Using the oceanic and atmospheric parameters described in Section 2.1, inter-band radiometric transfer calibration was performed with the sunglint method; the results are shown in Figure 2. The measured reflectance exhibits close agreement with the reference reflectance (R2 = 0.99 for both bands). For the 765 nm and 865 nm bands, the mean absolute errors are 0.023 and 0.019, and the root-mean-square errors are 0.003 and 0.006, respectively.
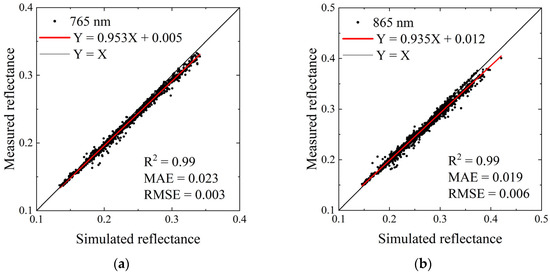
Figure 2.
The calibration result of DPC 765 nm (a) and 865 nm (b) by using sunglint.
3.2. Oxygen Absorption Band
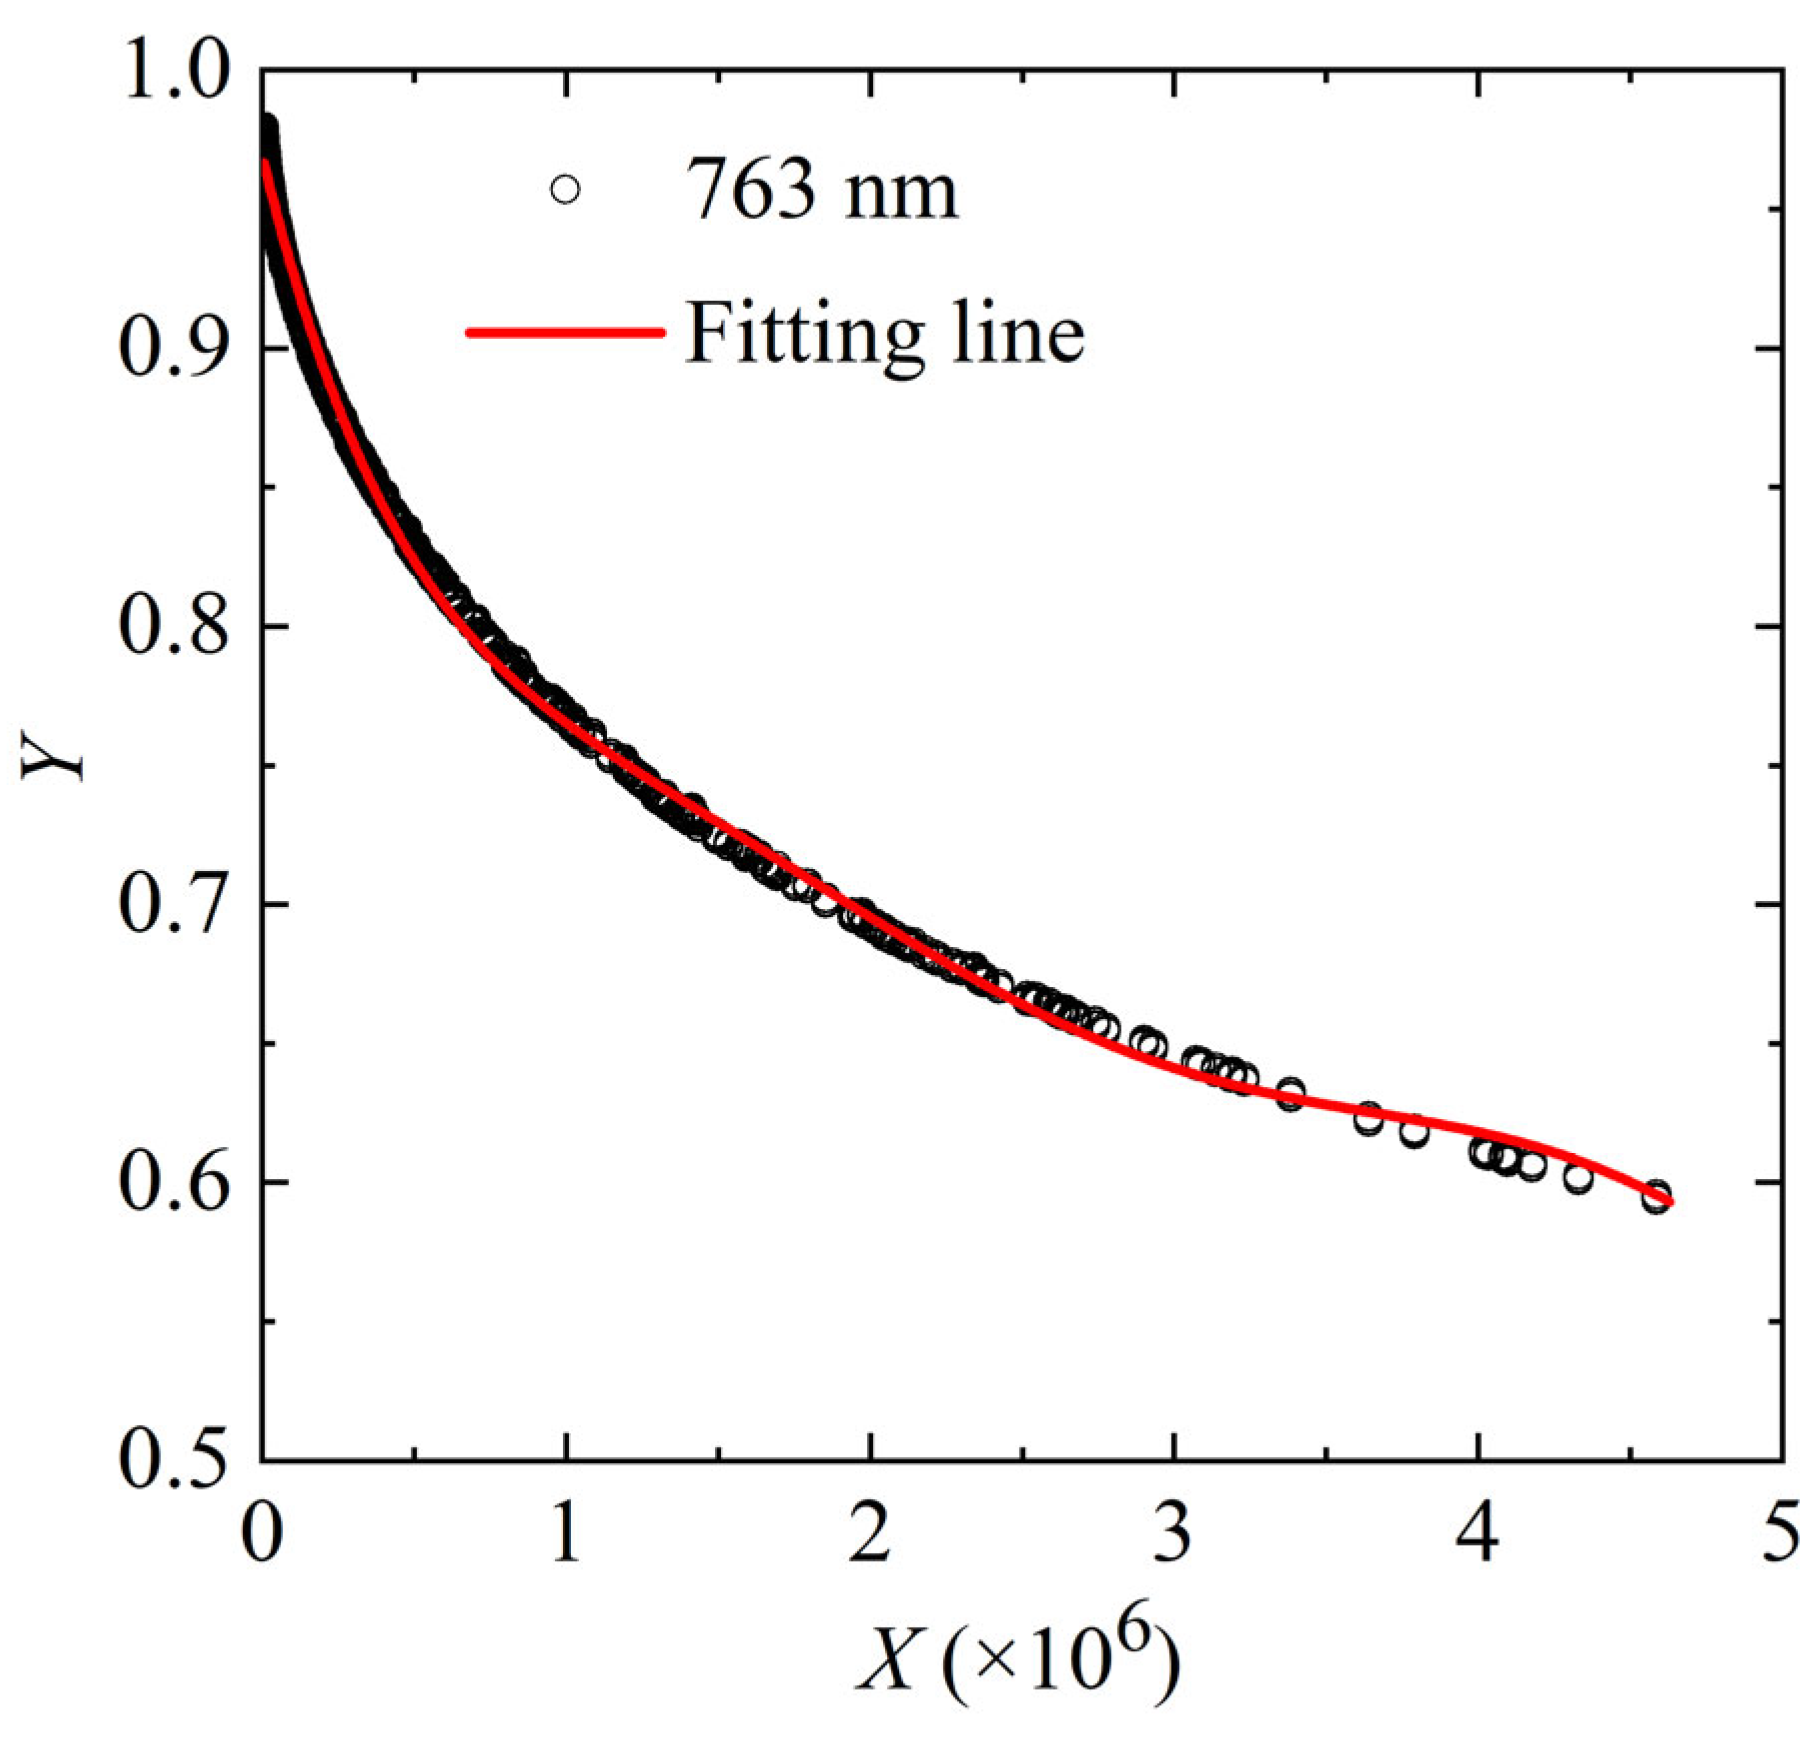
Due to the close proximity of the 763 nm and 765 nm wavelengths, the influence of surface reflectance is minimal. Simulations using the 6SV RTM reveal a strong polynomial relationship between the and , as shown in Figure 3. The corresponding fitting polynomial coefficients are provided in Table 2. Using these coefficients, the reflectance measured at 763 nm can be accurately simulated based on the surface pressure product.
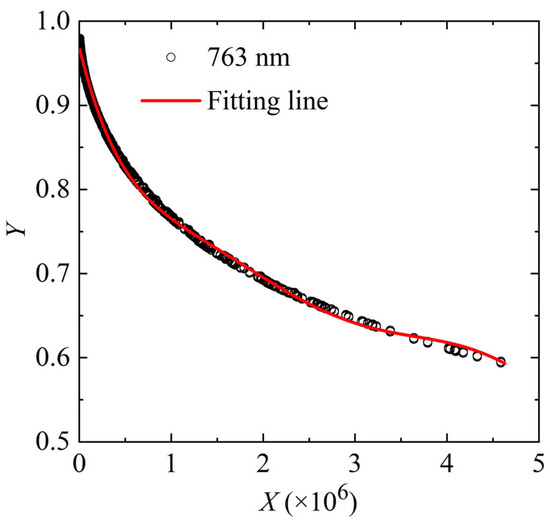
Figure 3.
Polynomial fitting relationship between and at DPC 763 nm band.

Table 2.
Polynomial fitting coefficients between and at DPC 763 nm band.
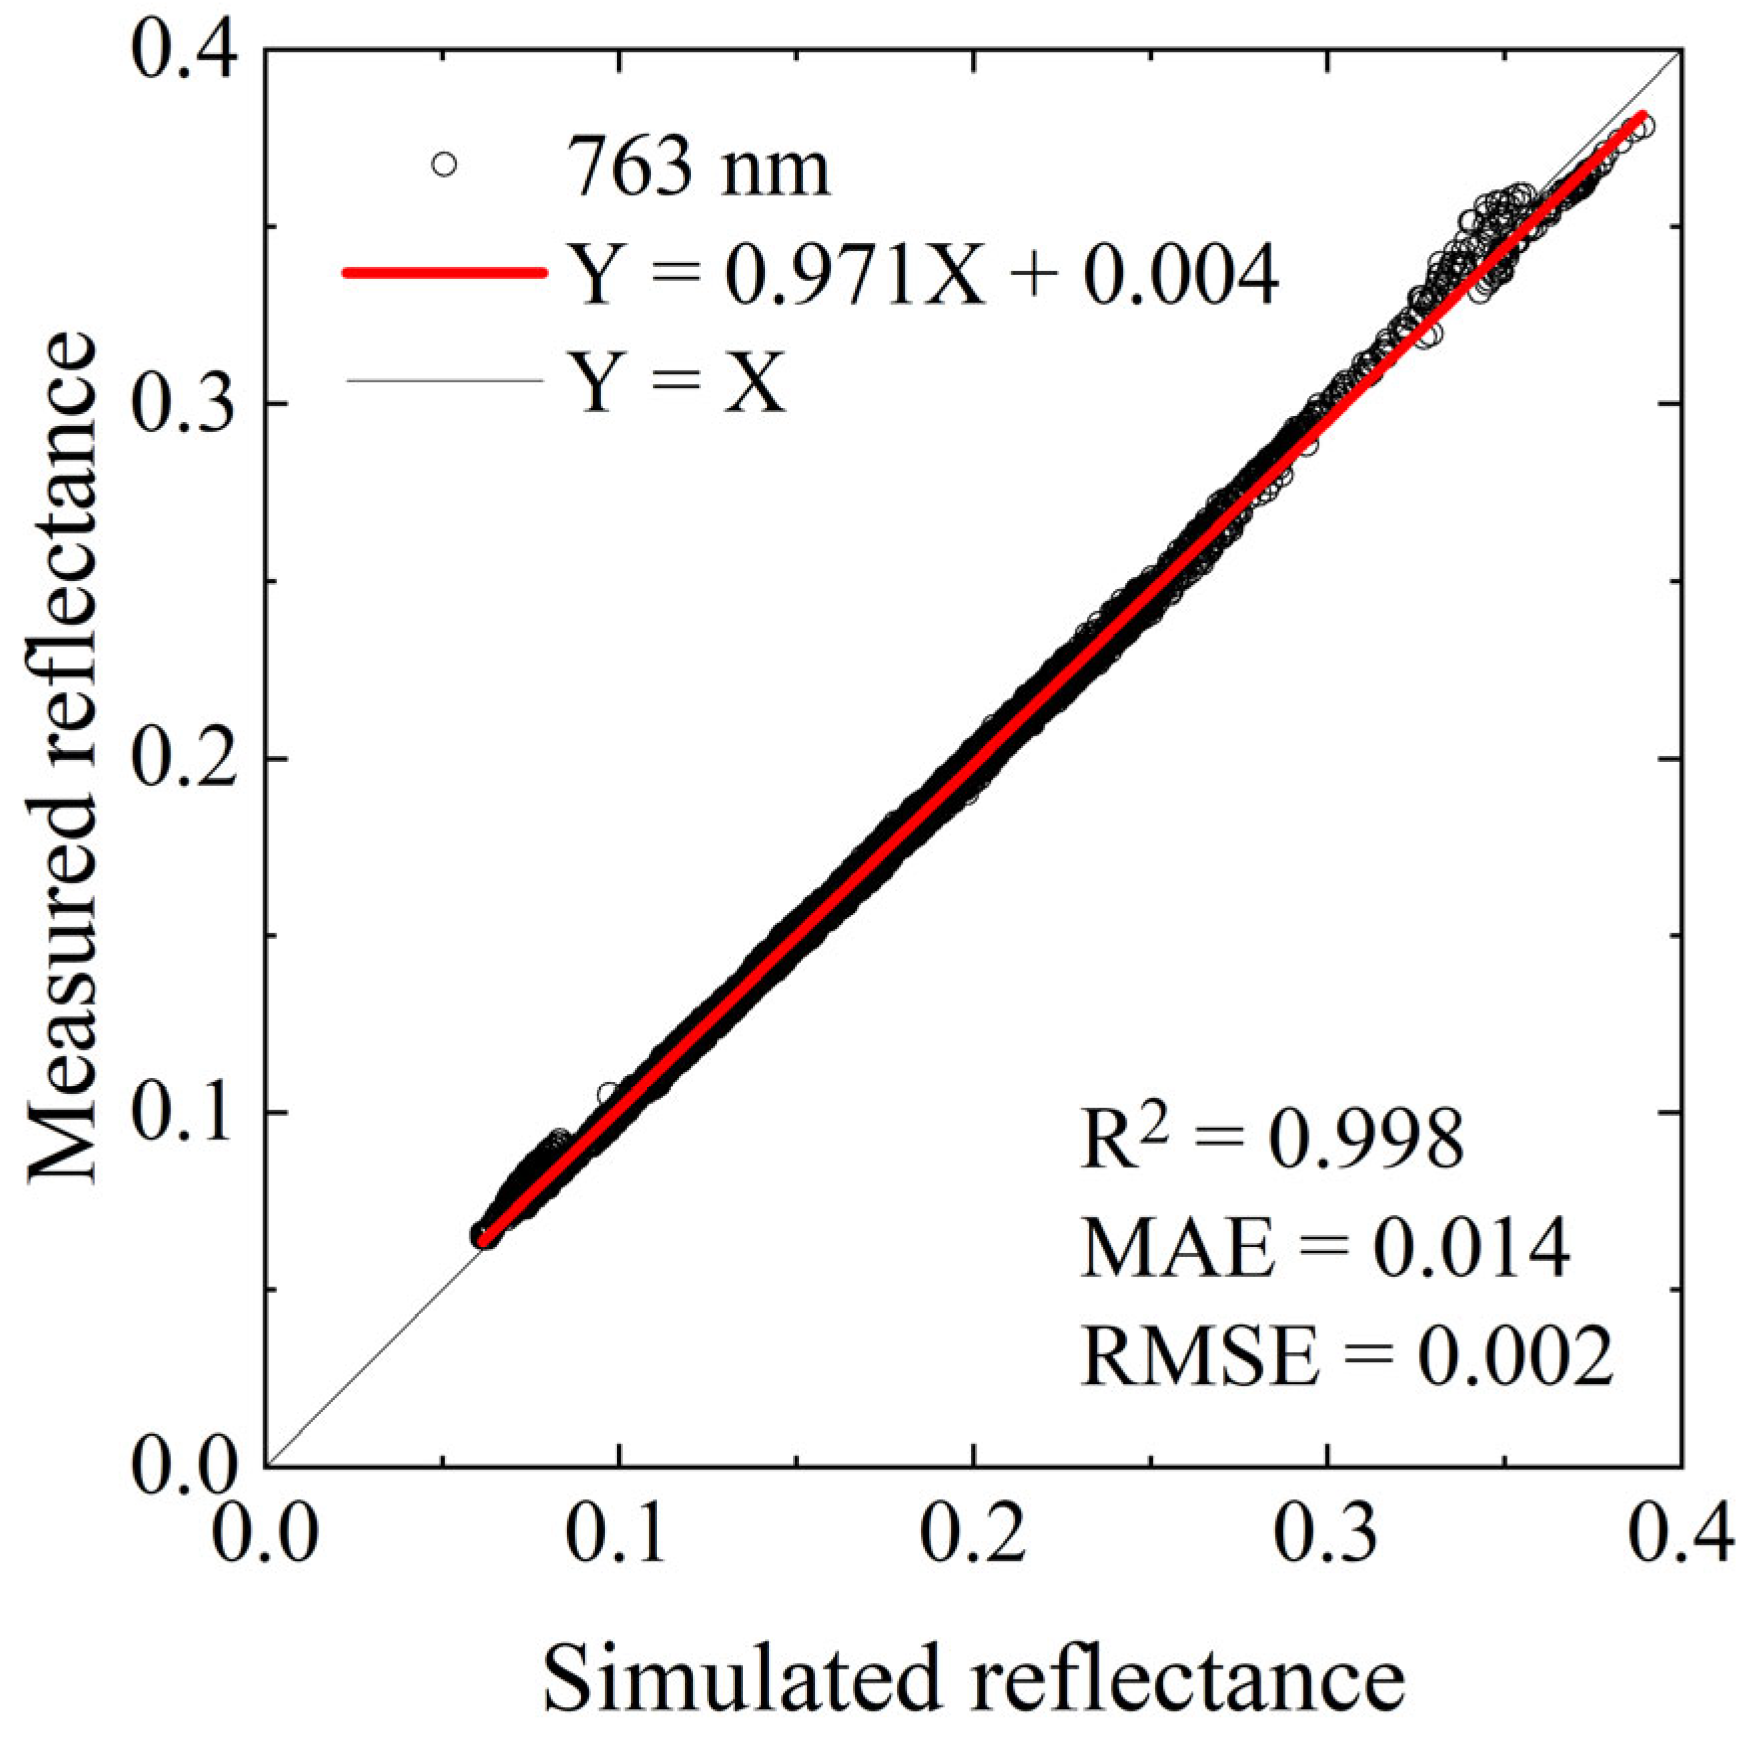
Following Equations (2) and (10), Table 2, reference 765 nm reflectance, geometric angles and reanalysis-derived surface pressure enables precise simulation of DPC reflectance at 763 nm. Meanwhile, the measured reflectance is derived directly from the L1 level product which is calibrated by pre-flight laboratory coefficient. As shown in Figure 4, the simulated and measured reflectance of 11,049 independent samples at 763 nm exhibit high consistency, with an R2 exceeding 0.99, mean absolute error (MAE) below 0.014, and root mean square error (RMSE) less than 0.002. These results indicate that the calibration is robust for sunglint conditions.
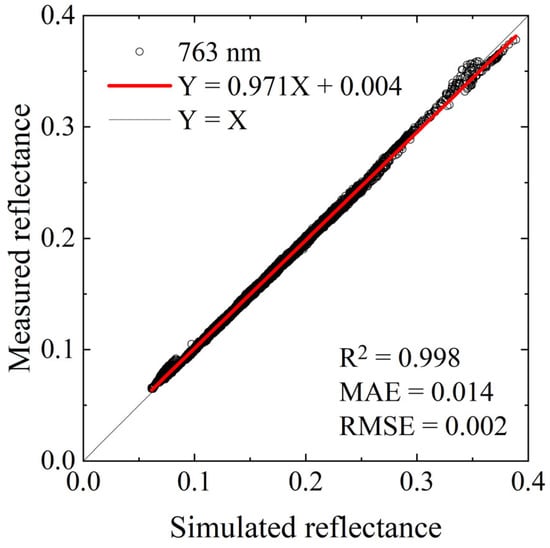
Figure 4.
Comparison between measured and simulated reflectance of the Gaofen-5 (02) DPC 763 nm band over sunglint.
3.3. Water Vapor Absorption Band
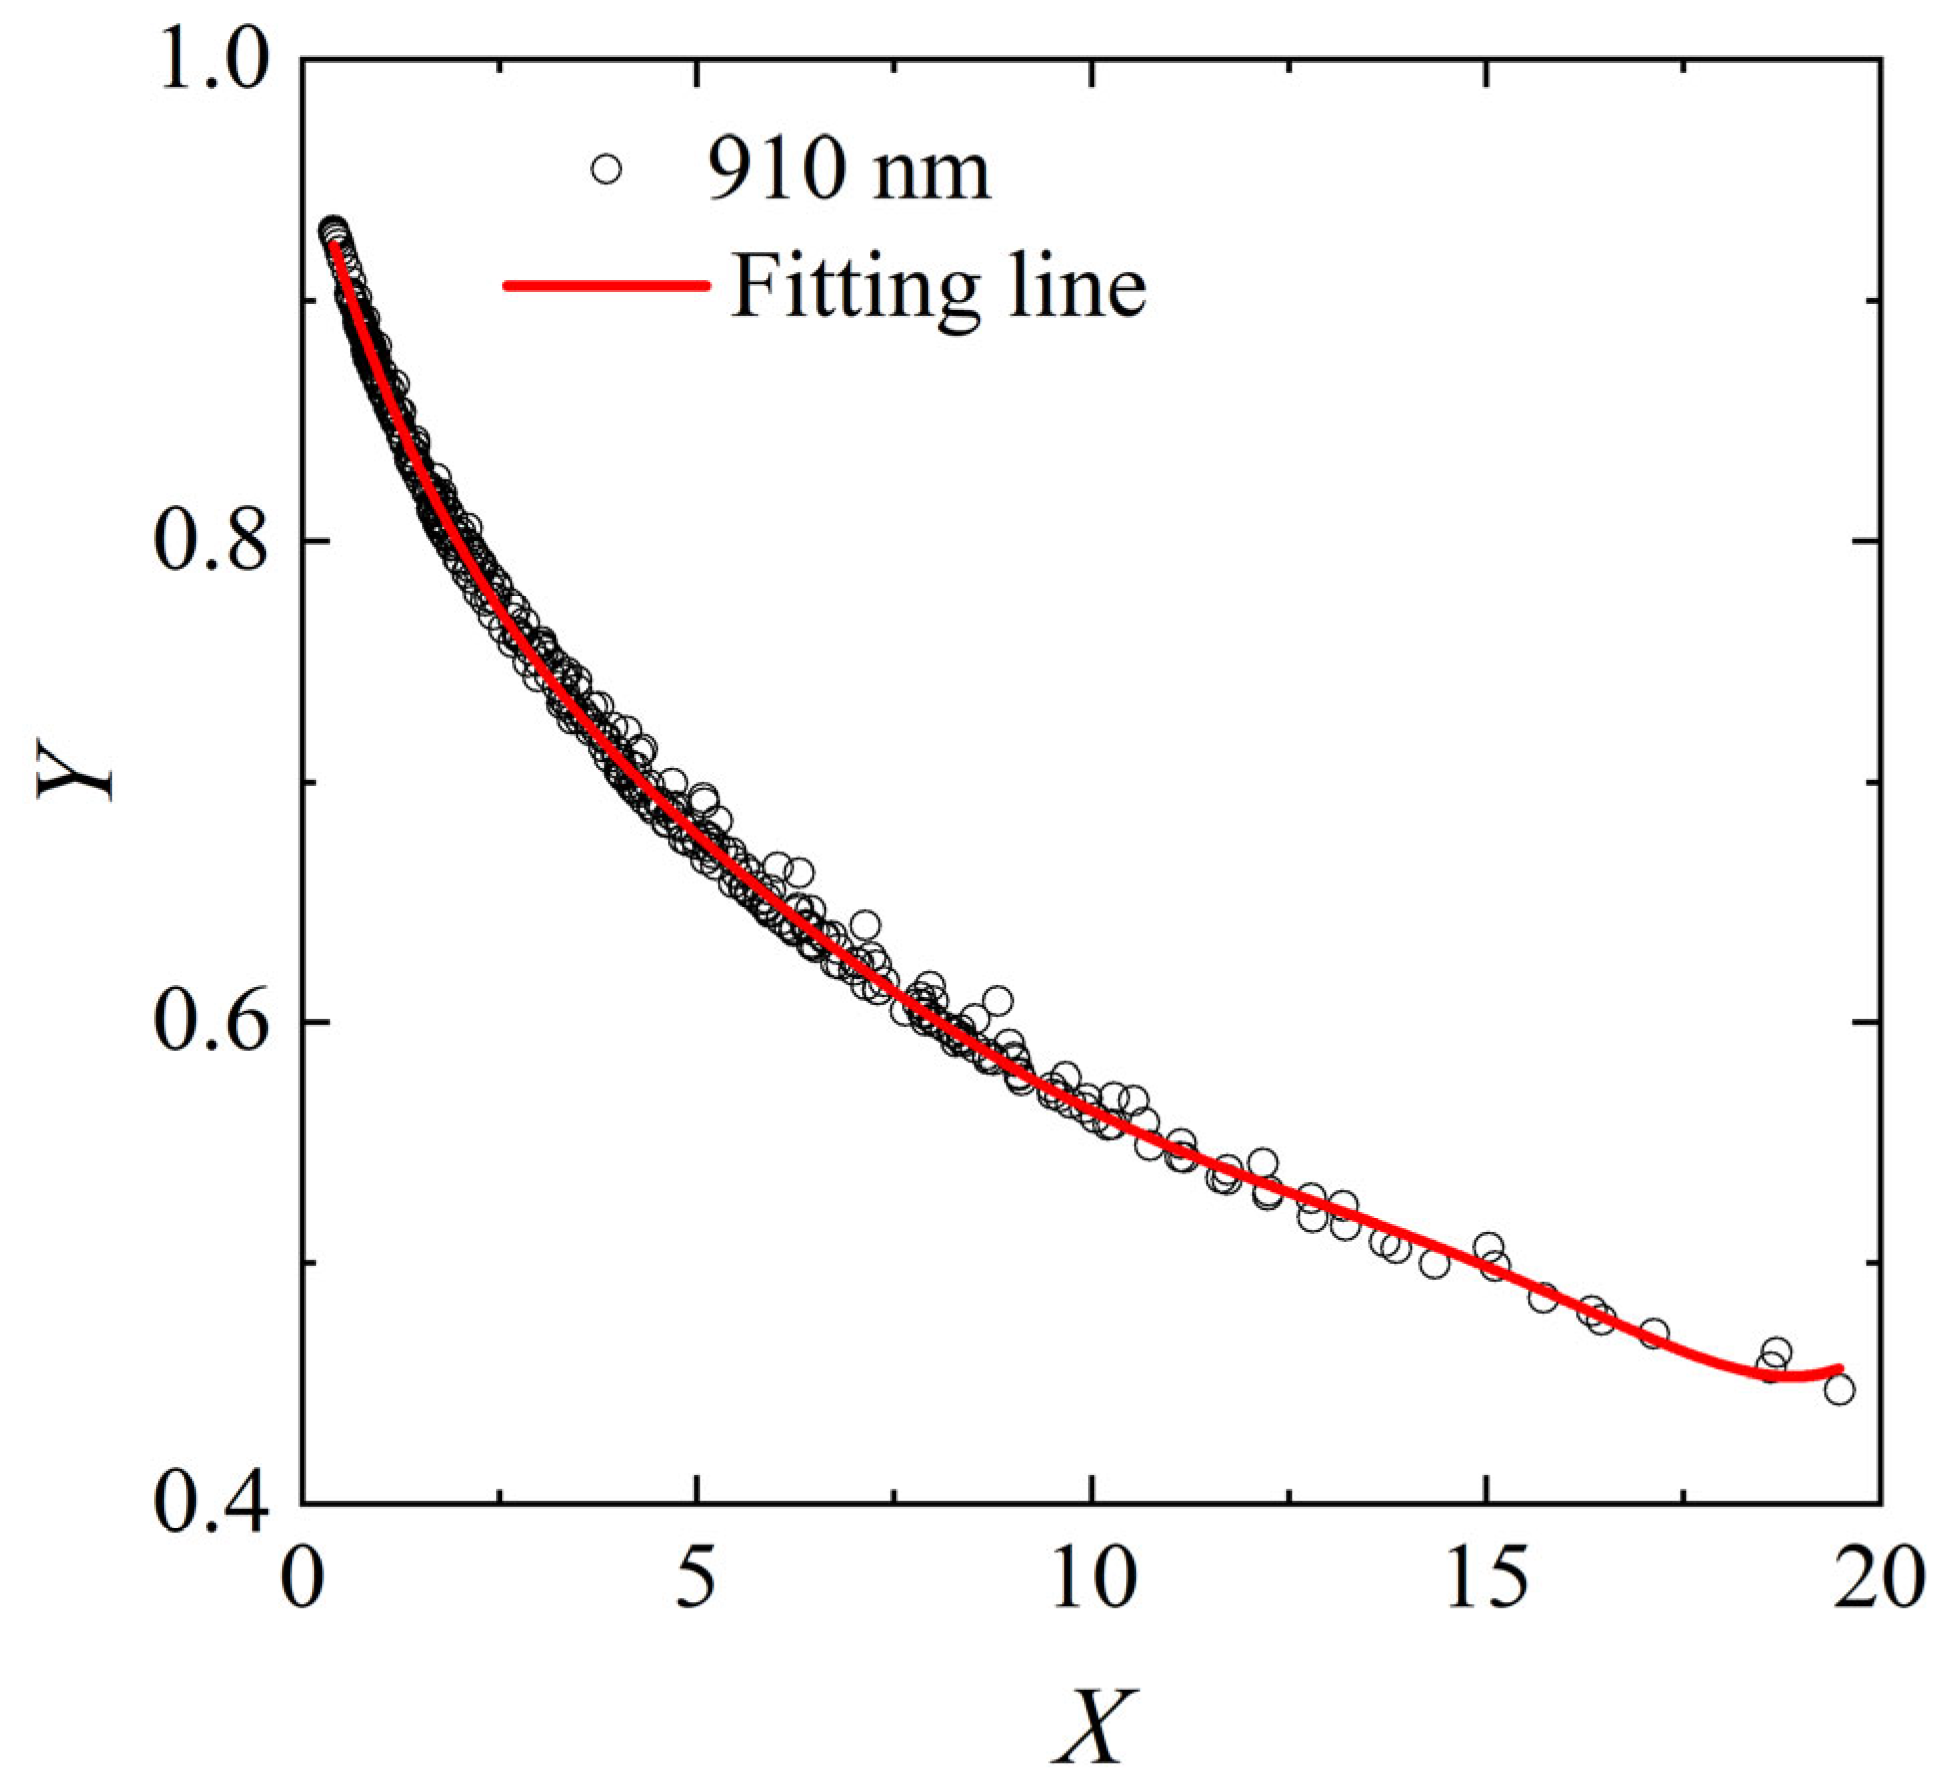
The spectral reflectance of sunglint shows minimal wavelength dependence between the 865 nm and 910 nm bands. Over clean oceanic waters under low aerosol loading, the observed reflectance differences between these two bands are primarily attributable to water vapor absorption. Based on the assumptions and conditions outlined in Section 2.2, the relationship between and was derived. As shown in Figure 5, polynomial curve provides an excellent fit to this relationship, with the fitting coefficients detailed in Table 3. The of scatter points are concentrated in 0–2 in Figure 3 and 0–5 in Figure 5 due to the simulation step setting of , and surface pressure and water vapor concentration in Table 1. Unlike the oxygen absorption band ratio, which is relatively insensitive to surface type, the water vapor band ratio is significantly affected by the underlying surface spectrum characteristics. However, since this study employs exclusively sunglint scenes over ocean surfaces, the impact of surface spectrum variability can be considered negligible.
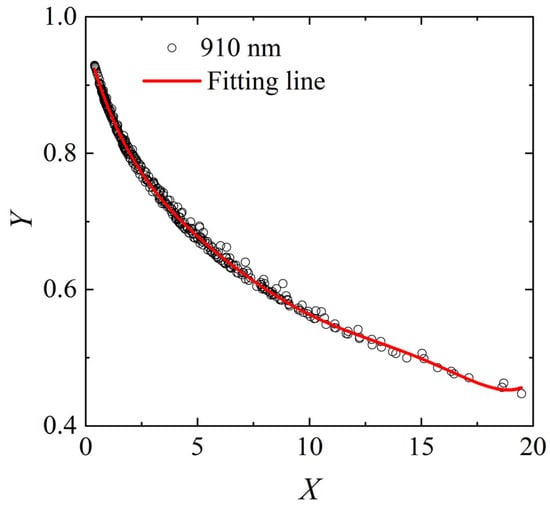
Figure 5.
Polynomial fitting relationship between and at DPC 910 nm band.

Table 3.
Polynomial fitting coefficients of and at DPC 910 nm band.
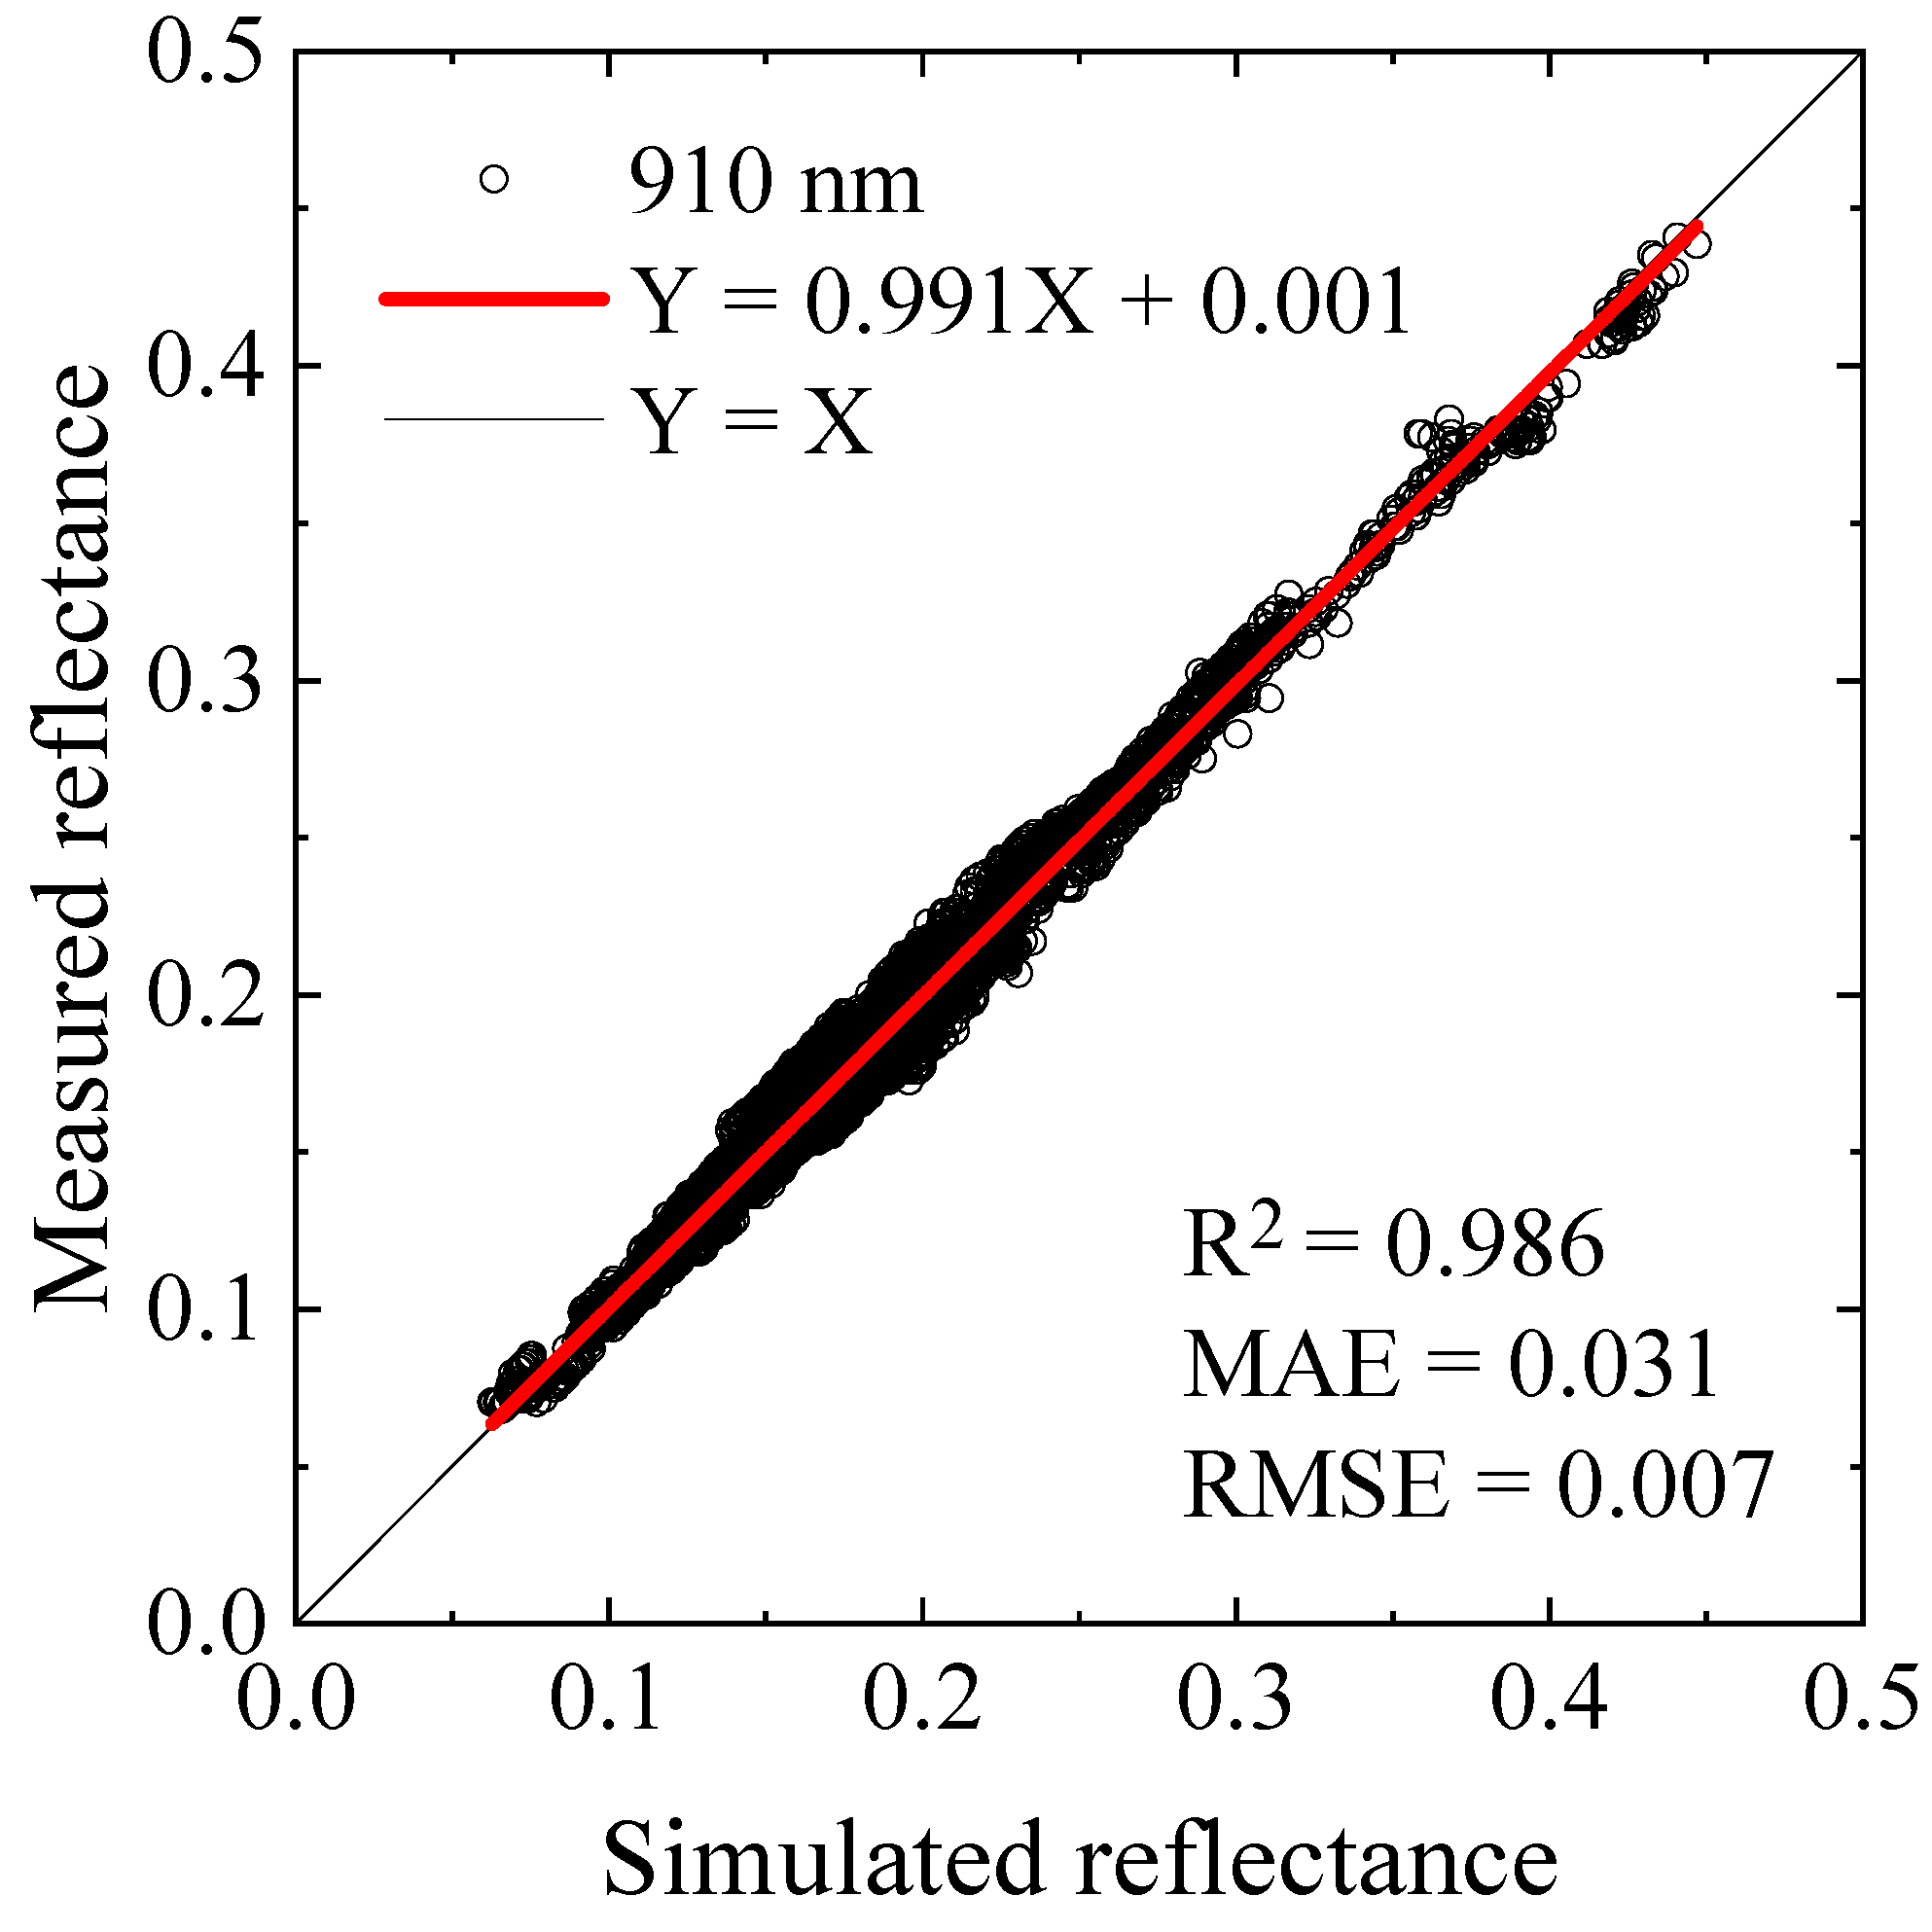
The calibration results for the 910 nm band, computed using same method with 763 nm and water vapor data from the ERA5 product, are shown in Figure 6. The measured and simulated TOA reflectance of the DPC at the 910 nm band display a strong linear correlation. For the calibration samples, the slope is 0.991, the R2 exceeds 0.98, and the MAE is 0.031, confirming the reliability of the proposed calibration method.
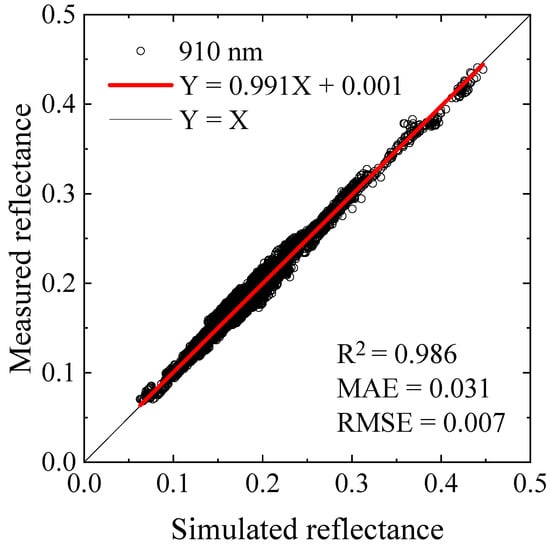
Figure 6.
Comparison between measured and simulated reflectance of the Gaofen-5 (02) DPC 910 nm band over sunglint.
4. Discussion
4.1. Error Budget
An error budget analysis was carried out to evaluate the reliability of the radiometric calibration for the gas absorption bands. The theoretical calibration error is defined as the relative variation in the simulated reflectance arising from uncertainties in polynomial fitting, atmospheric parameters, and surface conditions. These errors were assessed under different geometric configurations using the 6SV model. To cover the entire DPC field of view, simulations were performed for view zenith angles from 0° to 70° at 10° intervals, solar zenith angles from 0° to 70° at 10° intervals, and sun–satellite relative azimuth angles from 0° to 180° at 20° intervals. The radiometric calibration relative-errors of each parameter were quantified as the mean simulation error across these angular conditions.
As listed in Table 4, typical errors for the input parameters considered in 765 nm and 865 nm simulation are as follows: (1) The wind speed uncertainty, reference to the meteorological reanalysis accuracy, is set to 2 m/s in a range of 0–6 m/s with a step of 1 m/s; (2) The AOD uncertainty is set to 5% in a range of 0–0.1 with a step of 0.01; (3) For aerosol model, a maritime type is expected, considering the influence of long-range transported desert aerosols; (4) The ozone uncertainty is set to 5% in a range of 0.2–0.3 cm∙atm with a step of 0.05 cm∙atm. As summarized in Table 4, wind speed is the largest single contributor to calibration uncertainty at 765 and 865 nm, accounting for 2.87% and 2.91%, respectively. At 765 nm, contributions from aerosol optical depth (AOD), aerosol model, and ozone are 1.26%, 1.04%, and 0.05%, respectively—each higher than those at 865 nm, which are 0.66%, 0.54% and 0%. The propagated theoretical uncertainty of the in-flight calibration is 3.41% for 765 nm and 3.03% for 865 nm.

Table 4.
Error budget for in-flight radiometric calibration of the 765 nm and 865 nm band.
As listed in Table 5, typical errors for the input parameters considered in 763 nm simulation are as follows: (1) A tropical atmosphere model is simulated, with potential reference as standard atmosphere model; (2) A typical maritime surface spectrum is expected, considering the surface type may tend to be sand; (3) The AOD uncertainty is set to 5% in a range of 0–0.1 with a step of 0.01; (4) For aerosol model, a maritime type is expected, considering the influence of long-range transported desert aerosols; (5) The surface pressure product uncertainty is set to 50 hPa at 1013 hPa; (6) The RTM output fitting uncertainty is simulated by calculating the absolute error of polynomial fitting. Total error is the square root of the sum of the squares of the errors from all factors. As shown in Table 5, surface pressure is the dominant source of uncertainty for the 763 nm calibration, contributing 2.91%. The uncertainties due to the atmosphere model, surface spectrum, and polynomial fitting are 0.31%, 0.37%, and 0.60%, respectively. The limited humidity profiles were included in the fitting error and the contributions of AOD and aerosol type are less than 0.02% and can therefore be neglected. The propagated theoretical uncertainty of the in-flight calibration at 763 nm is 3.01%; when the 765 nm reference band calibration error derived from inter-band sunglint method is included, the total uncertainty increases to 4.59%.

Table 5.
Error budget for in-flight radiometric calibration of the 763 nm oxygen absorption band.
Similarly, the error budget of the 910 nm water vapor absorption band is summarized in Table 6. The considered typical uncertainties for the input parameters in 910 nm simulation are as follows: (1) A tropical atmosphere model is simulate with potential reference as standard atmosphere model; (2) The AOD uncertainty is set to 5% in a range of 0–0.1 with a step of 0.01; (3) For aerosol model, a maritime type is expected, considering the influence of long-range transported sand aerosols; (4) The wind speed uncertainty is set to 2 m/s in a range of 0–6 m/s with the step of 1 m/s; (5) The water vapor is set to 10% reference to a typical accuracy of meteorological reanalysis data; (6) The RTM output fitting uncertainty is simulated by calculating the absolute error of polynomial fitting. As presented in Table 6, the surface spectrum and water vapor concentration are two major contributors, with an uncertainty of 2.9% and 1.48%, respectively. The atmospheric model, AOD, aerosol type, surface wind speed and fitting error contribute 0.43%, 0.49%, 0.64%, 0.17% and 0.68%, respectively. It reveals that 910 nm simulation is more sensitive to wind speed than the 763 nm band due to its larger wavelength separation. The propagated theoretical uncertainty of the in-flight calibration at 910 nm is 3.01%; when the 865 nm reference band calibration error is included, the total uncertainty increases to 4.55%.

Table 6.
Error budget for in-flight radiometric calibration of the 910 nm water vapor absorption band.
4.2. Validation over Sand Surfaces
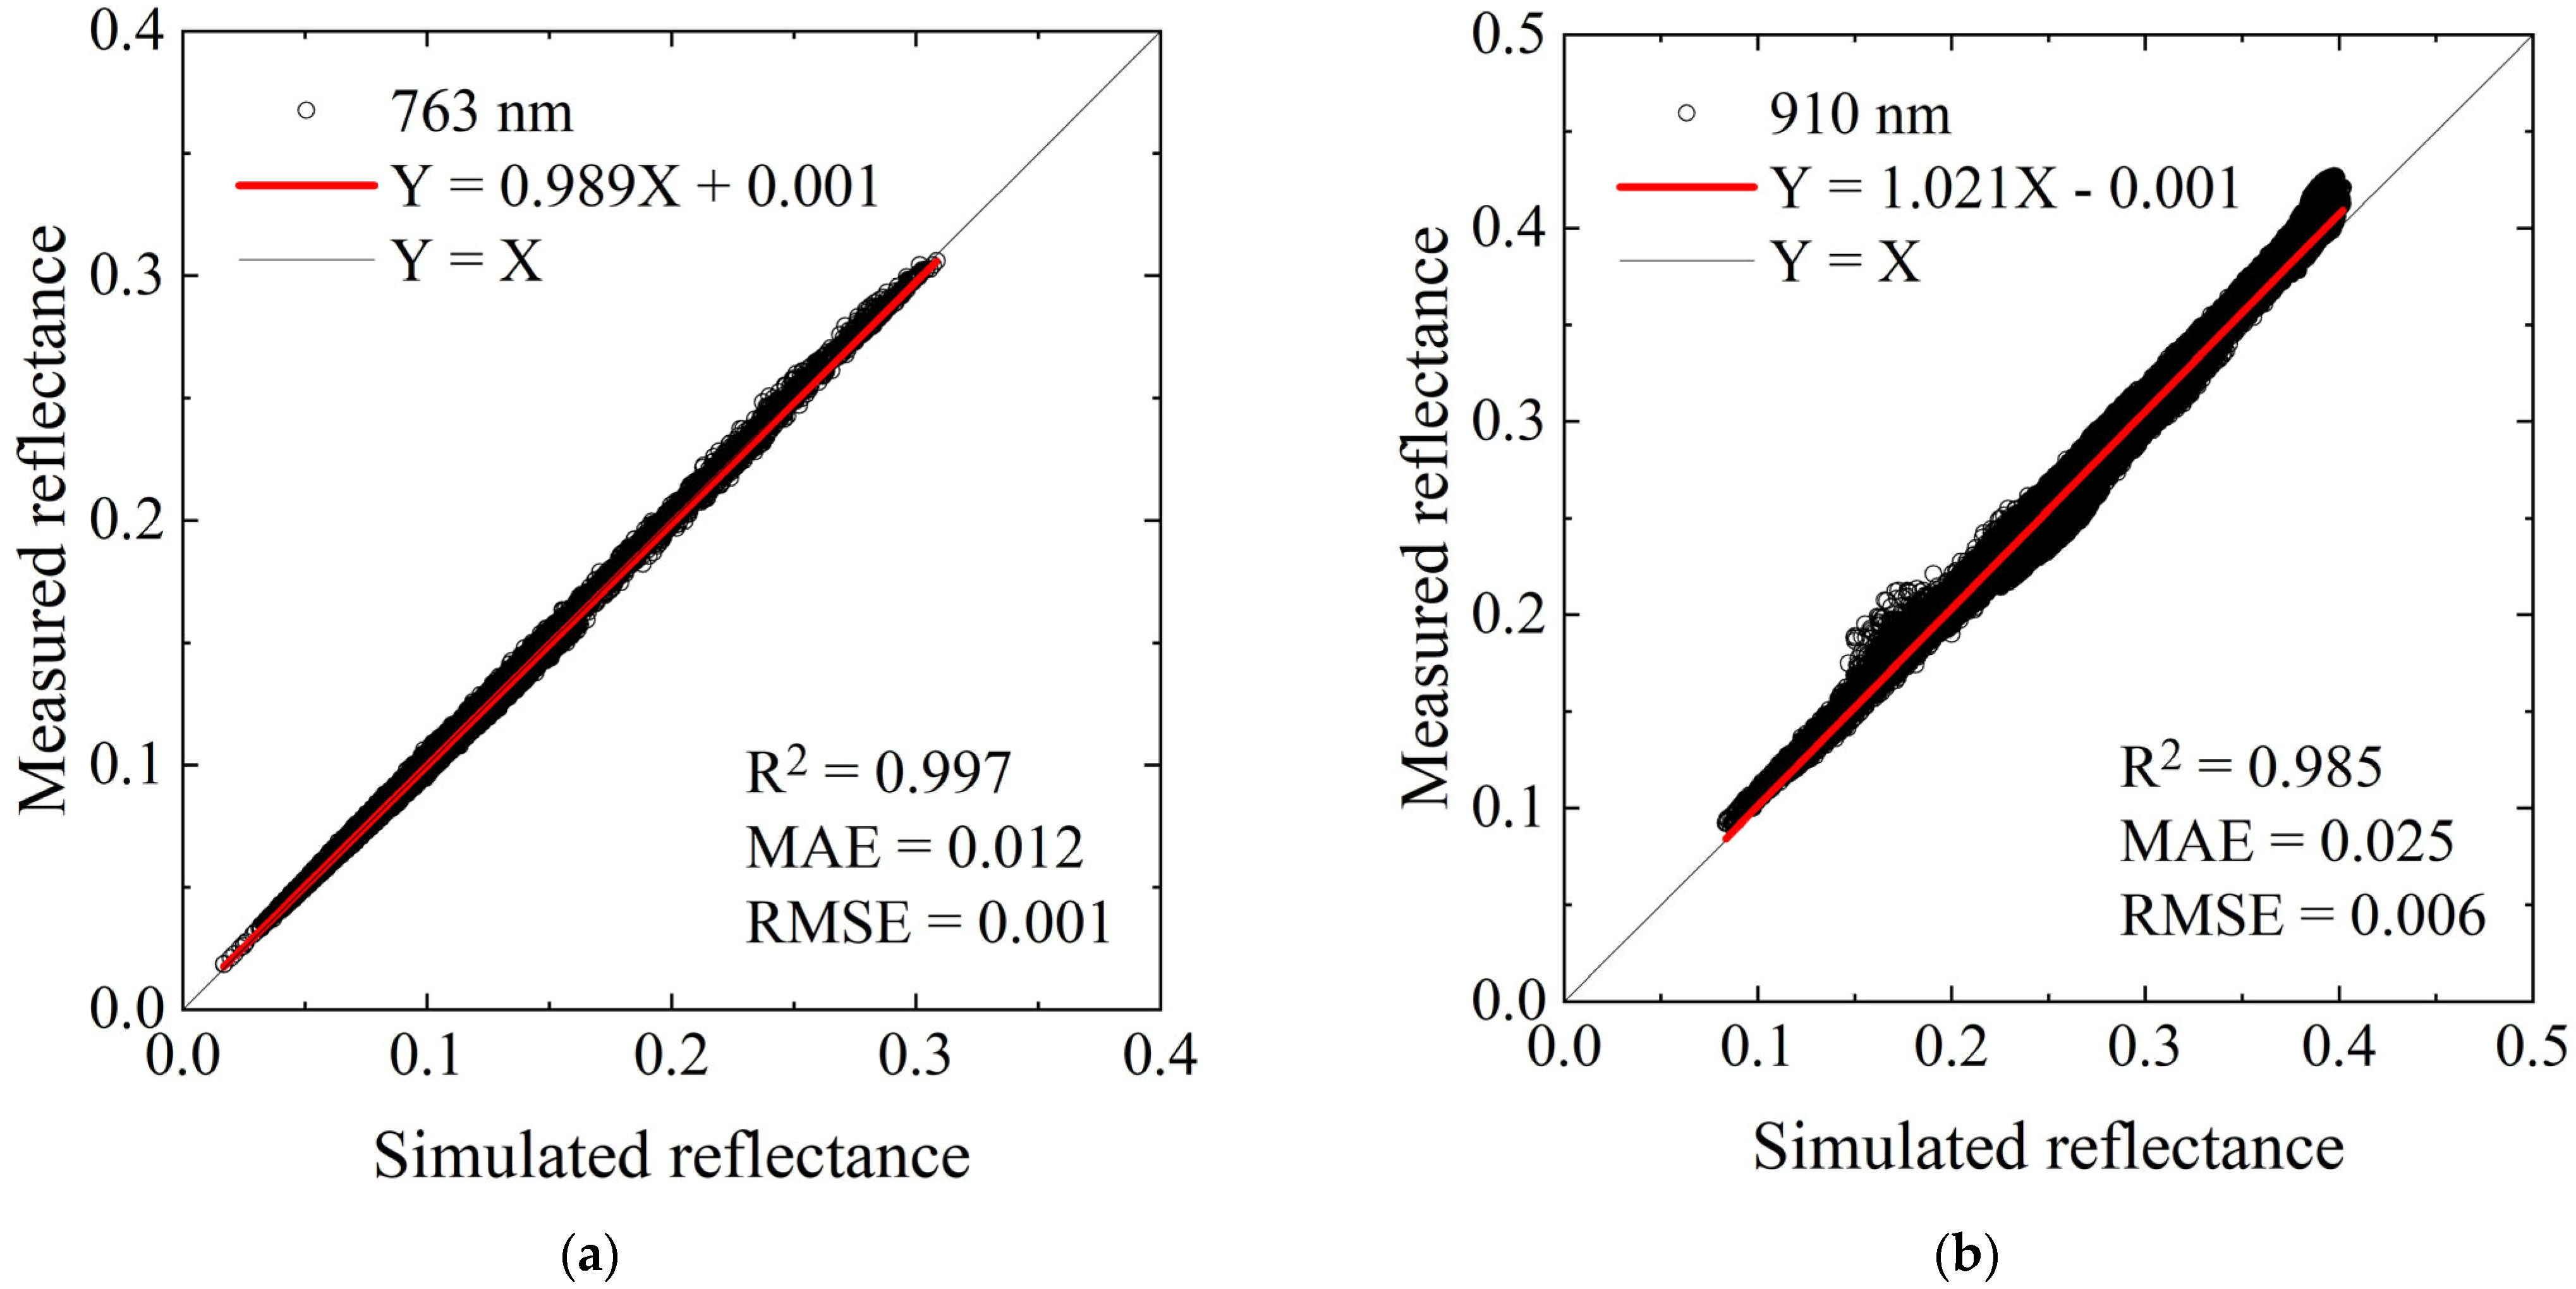
To further validate the accuracy of the sunglint-based in-flight calibration for gas absorption bands, an approach consistent with the methodology described in Section 3 was employed to simulate the relationship between the band ratio and parameter over desert surfaces. Calibration sites located in North Africa and the Arabian Peninsula were selected, with ERA5 surface pressure and water vapor column concentration data used as inputs. The BRDF effect of the desert surface is not considered, as the viewing-angle difference between the absorption and reference bands is negligible. The resulting in-flight radiometric calibration for oxygen (763 nm) and water vapor (910 nm) absorption bands over desert is illustrated in the accompanying Figure 7. These results demonstrate strong consistency between simulated and observed reflectance over desert, validating the robustness of the proposed gas absorption band-calibration method across different surface types.
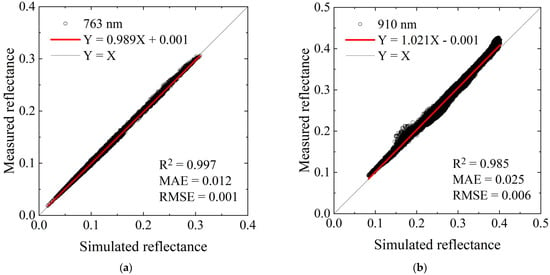
Figure 7.
Comparison of measured and simulated reflectance of the Gaofen-5 (02) DPC over desert calibration sites. (a) 763 nm band, and (b) 910 nm band.
For the 763 nm band, as shown in Table 7, the calibration results derived from desert scenes deviate by only 0.06% compared with the sunglint-based method. In contrast, the 910 nm band exhibits greater dispersion than the 763 nm band and, moreover, shows a 4.9% discrepancy compared to the sunglint-based method. This difference mainly reflects the greater sensitivity of the 910 nm band reflectance ratio () to surface-type variability, together with limitations of the default desert spectral reflectance used in 6SV, which may not faithfully represent actual desert surface properties. These results indicate that calibration using sunglint can be replaced by desert surface samples at 763 nm, and potentially by sufficiently accurate surface reflectance data at 910 nm.

Table 7.
Calibration coefficient differences between desert and sunglint-based methods for the Gaofen-5 (02) DPC oxygen (763 nm) and water vapor (910 nm) absorption bands.
4.3. Validation by Product Retrieval
4.3.1. Oxygen Absorption Band Validation
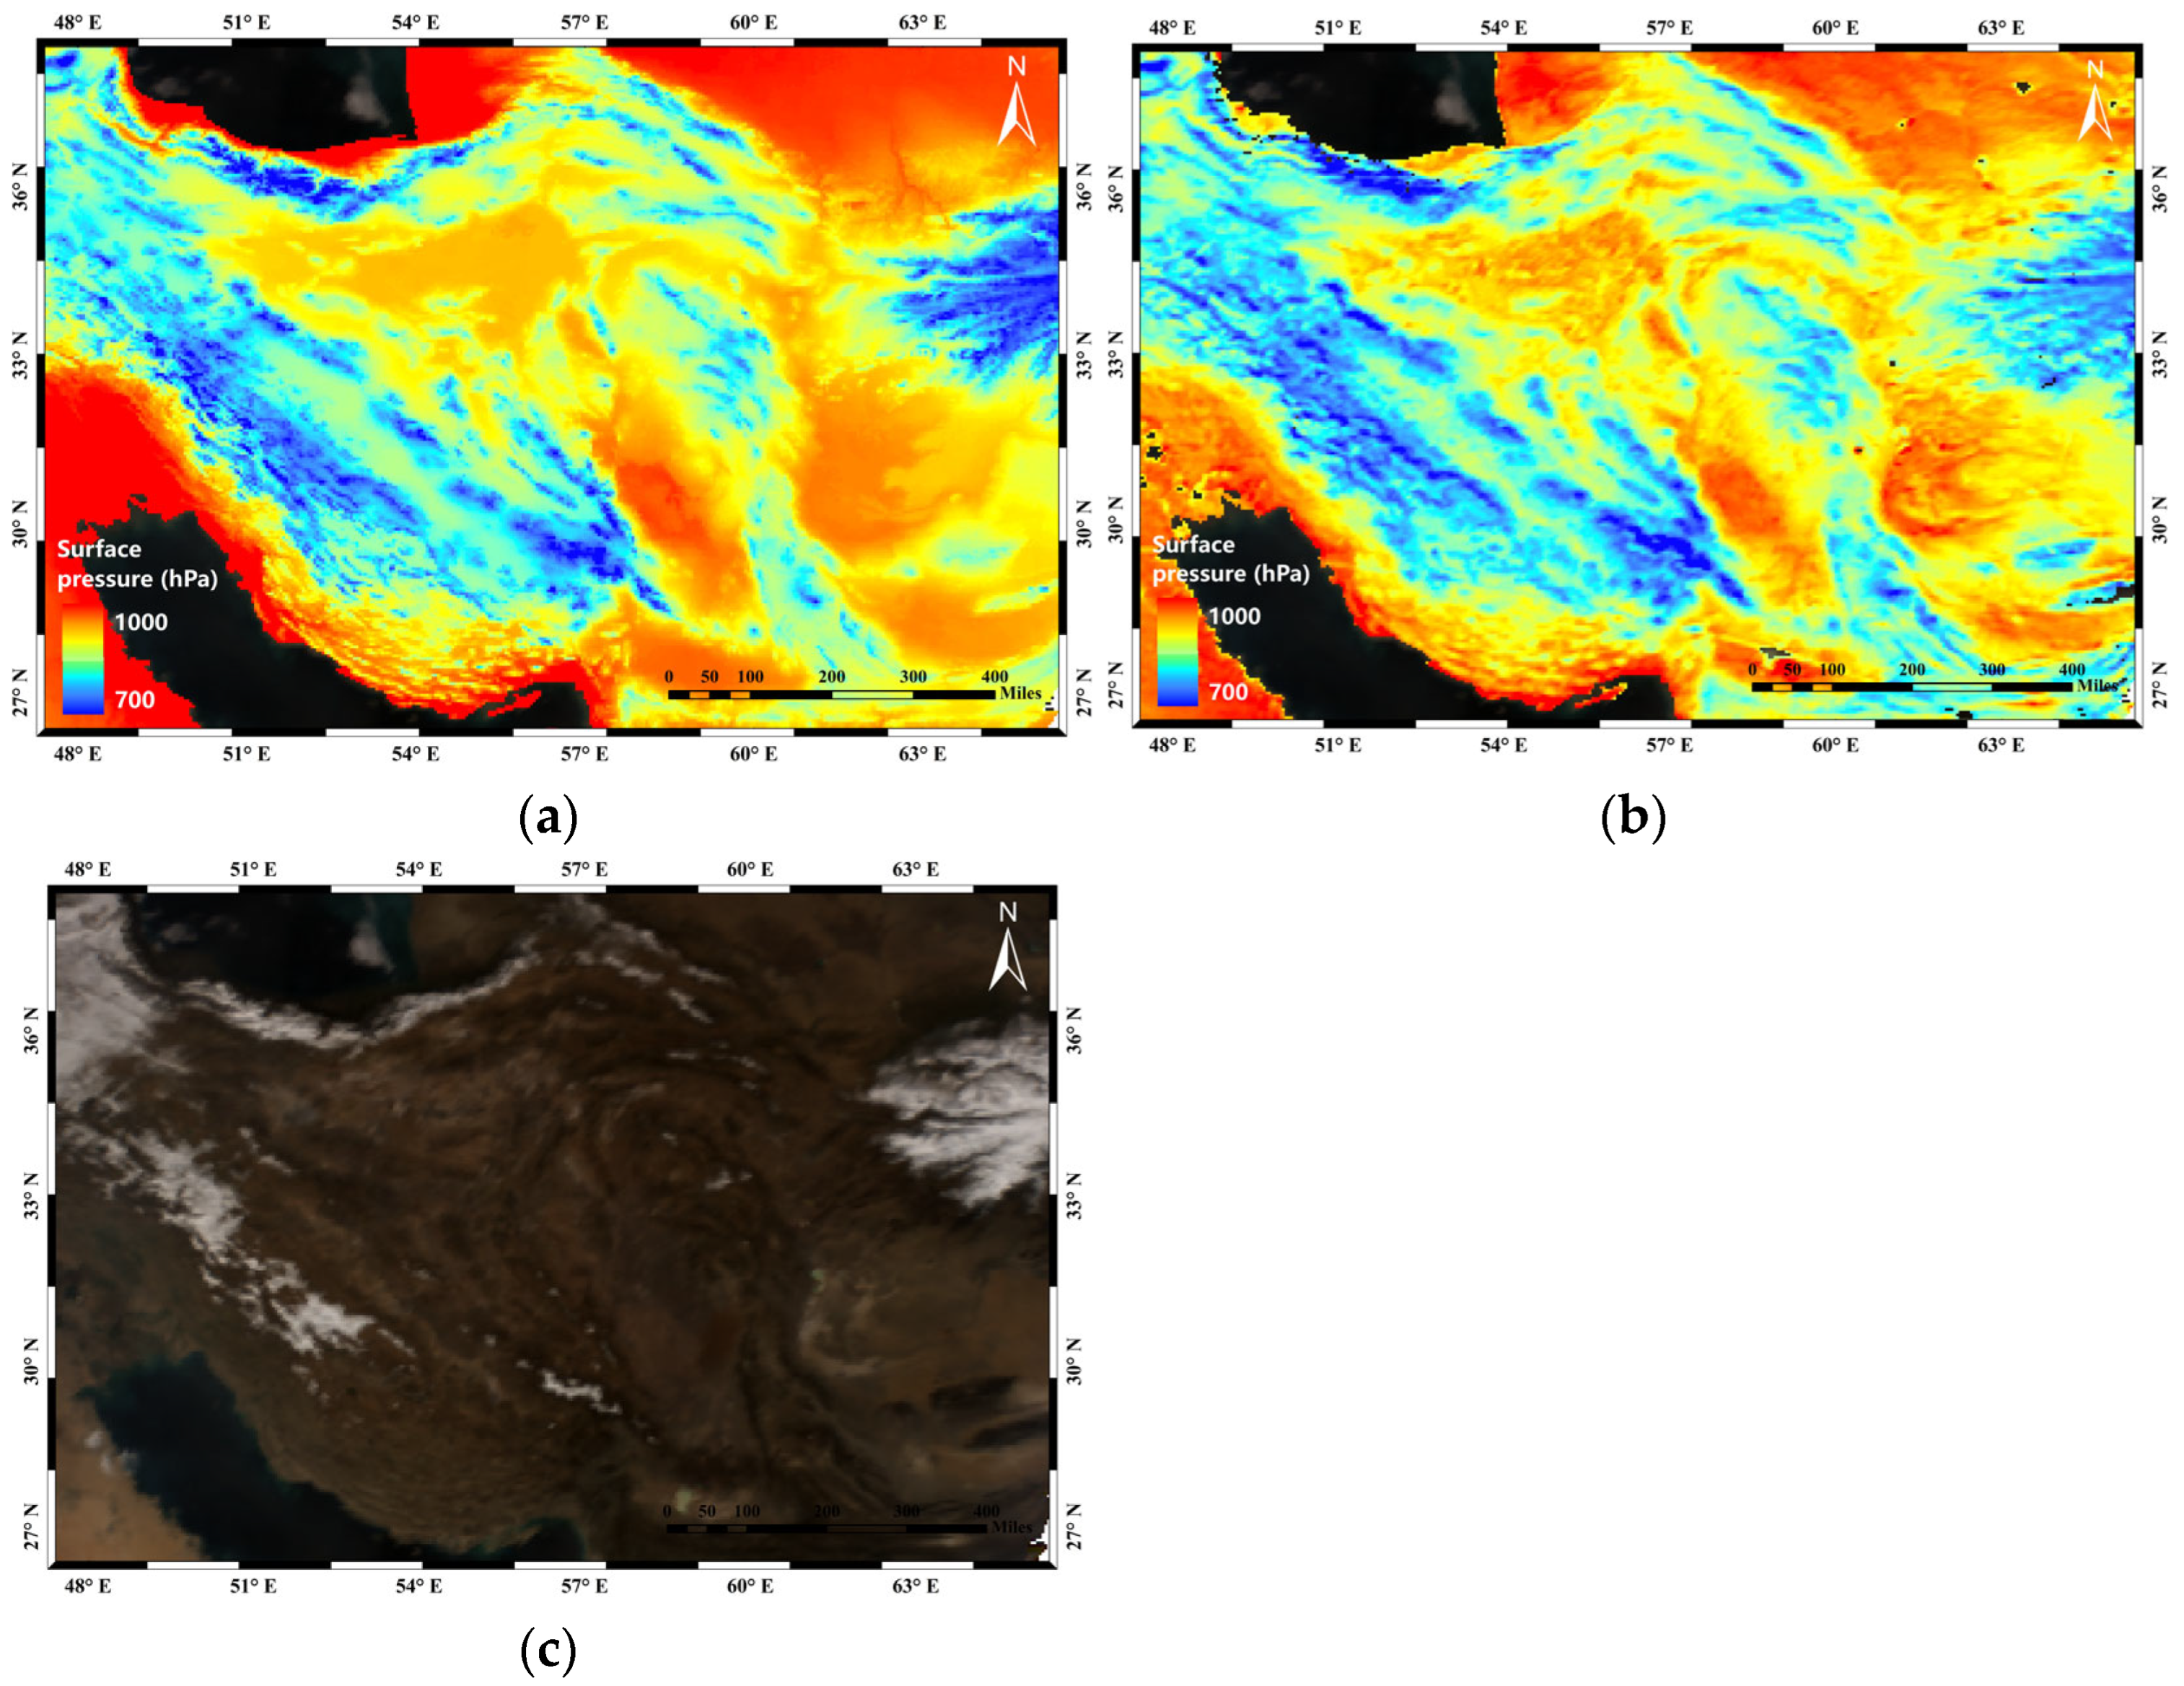
To validate the calibration method of the oxygen absorption band, surface pressure was retrieved over West Asia, a region characterized by significant elevation variability. Reference surface pressure was calculated from the GTOPO30 DEM data and then resampled to 1.7 km to match the resolution of the DPC sensor [32]. The retrieval algorithm was derived by interchanging the horizontal and vertical coordinates in Figure 3 and applying a polynomial fit to the resulting relationship. By combining this algorithm with DPC measurements at 763 nm and 765 nm, the surface pressure distribution was obtained (Figure 8). The retrieved distribution closely aligns with the reference reanalysis product, particularly around the 700 hPa level, although a slight underestimation occurs near 1000 hPa. These results demonstrate that the calibration accuracy of the DPC 763 nm band is sufficient for surface pressure retrieval over complex terrains, including desert, snow, and ice.
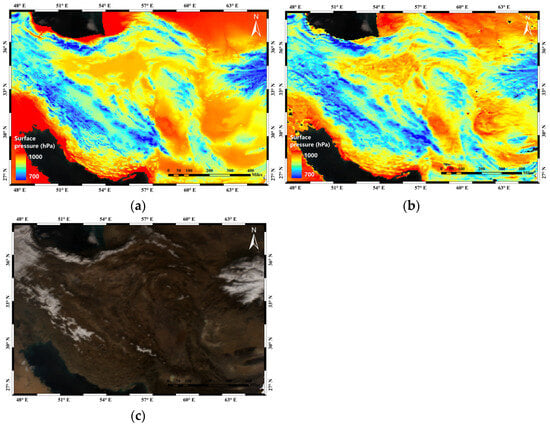
Figure 8.
Surface pressure distribution over Central Asia on 25 January 2022. (a) DEM derived product, (b) DPC retrieval results, and (c) DPC true-color map.
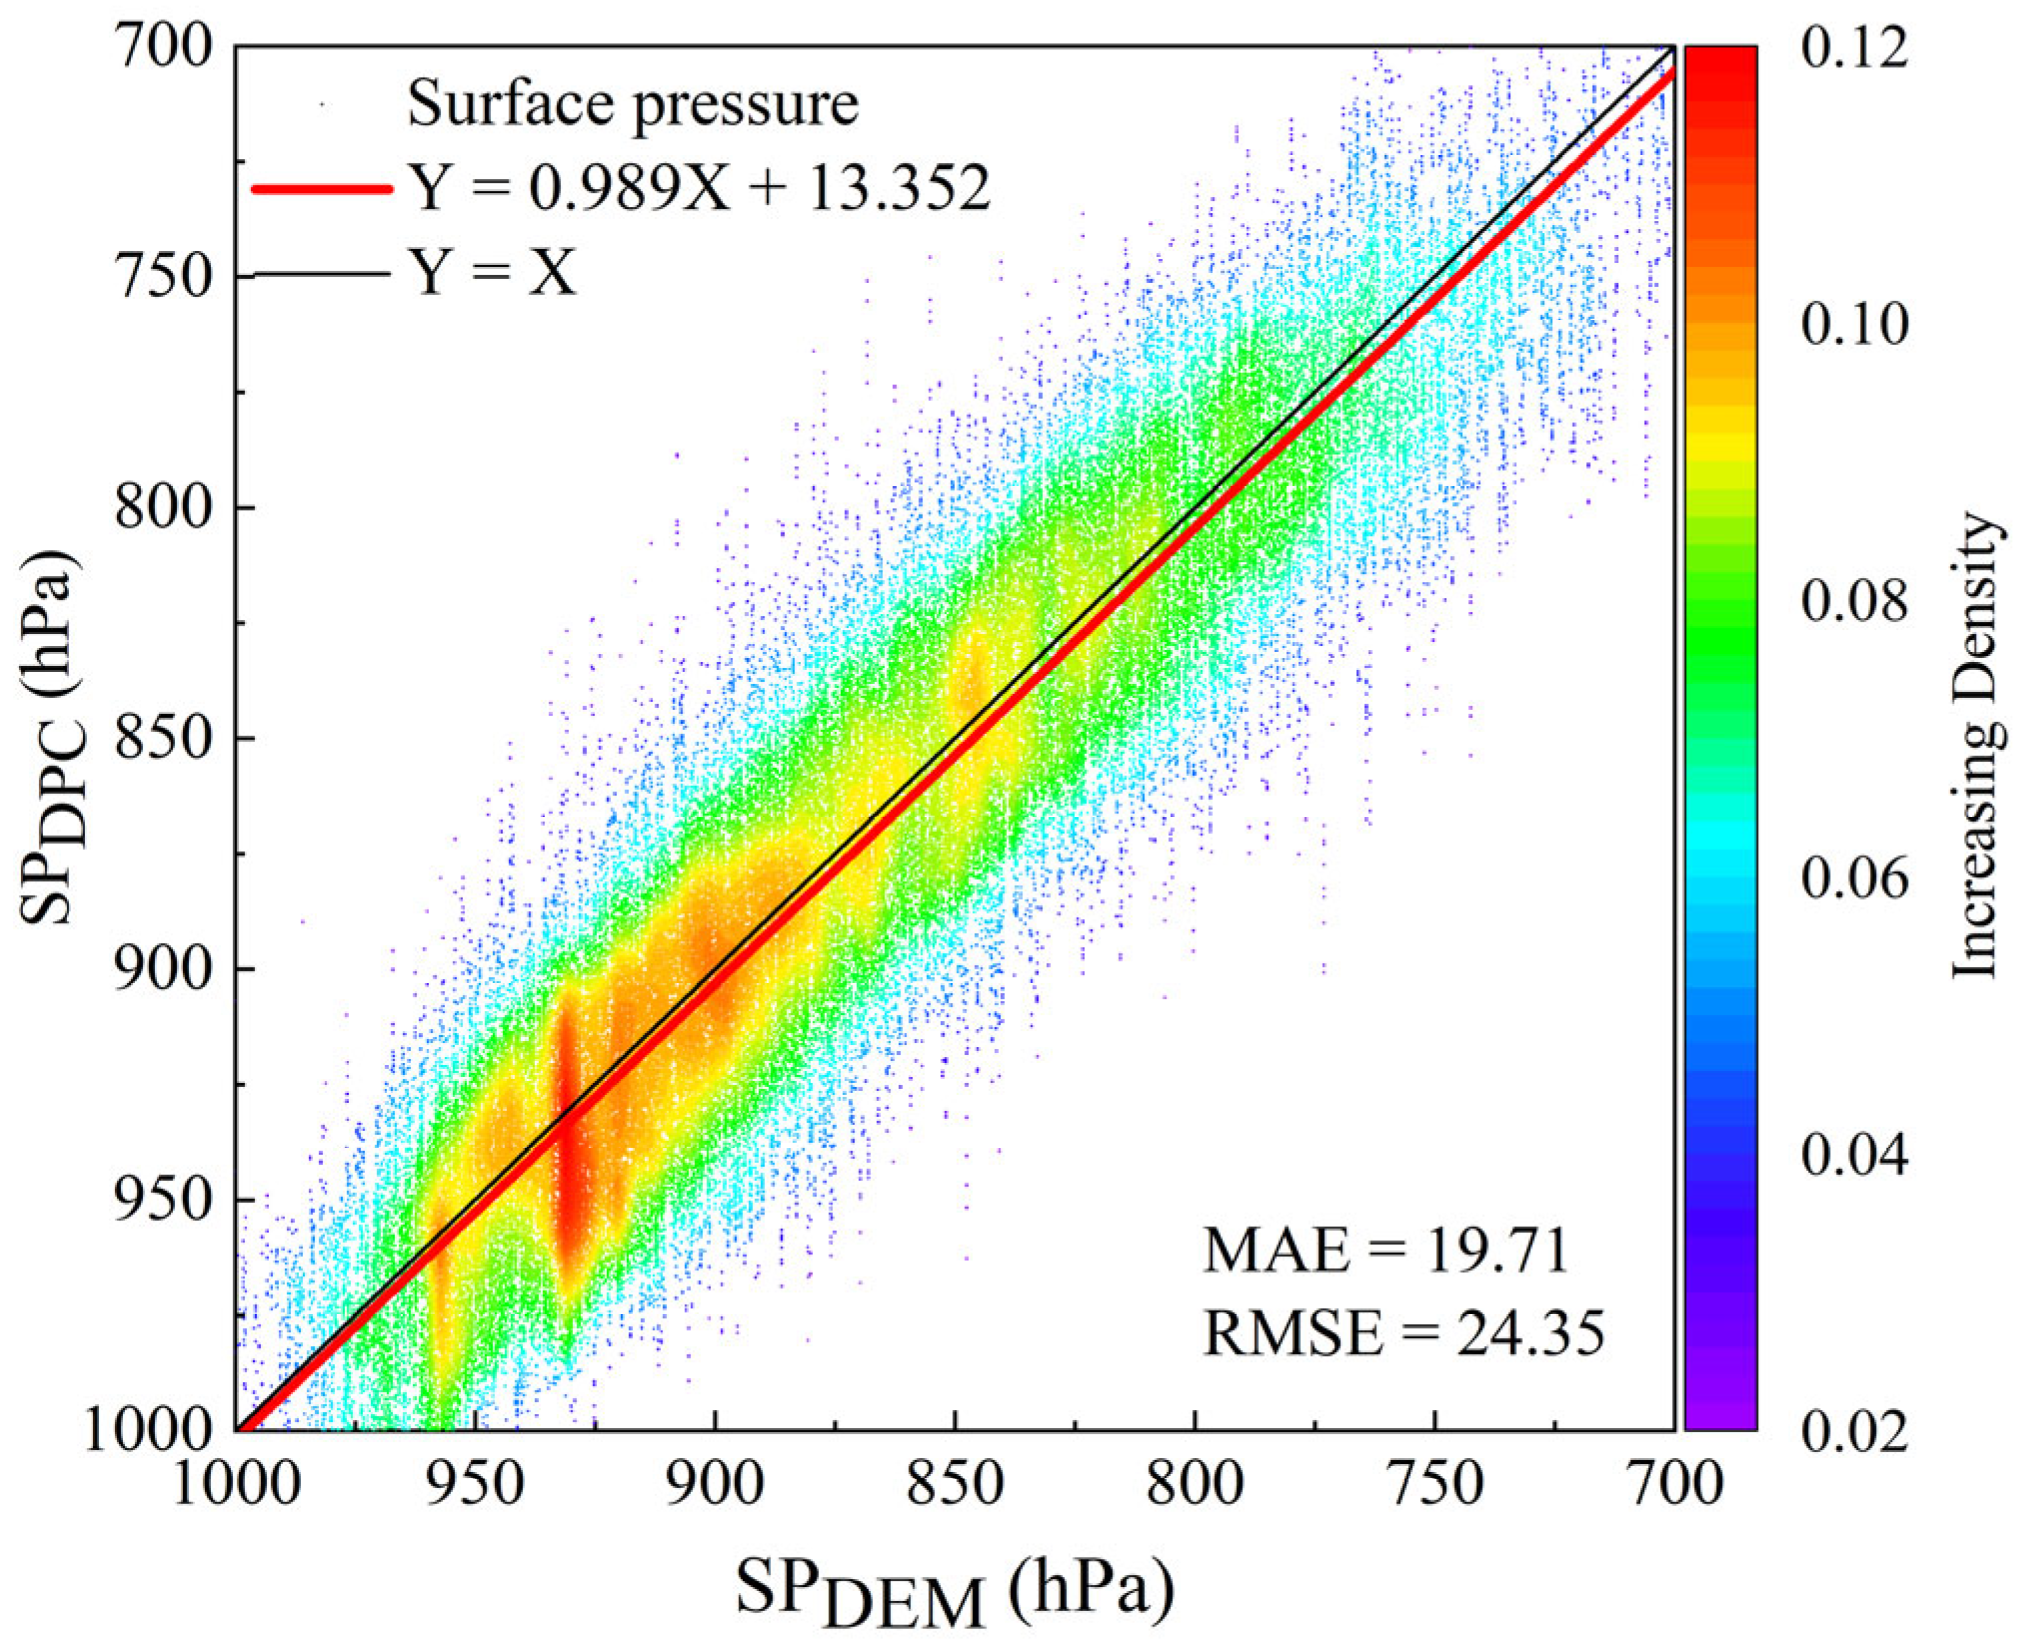
A further comparison between surface pressure retrieved from DPC measurements and that calculated from DEM (Figure 9) shows a strong linear correlation, with a fitted slope of 0.989, a MAE of 19.71, and a RMSE of 24.35. The deviation may be caused by complicated surface types and some undetected clouds. To sum up, this high level of agreement confirms that the calibrated data can be reliably used for estimating both surface and cloud elevation.
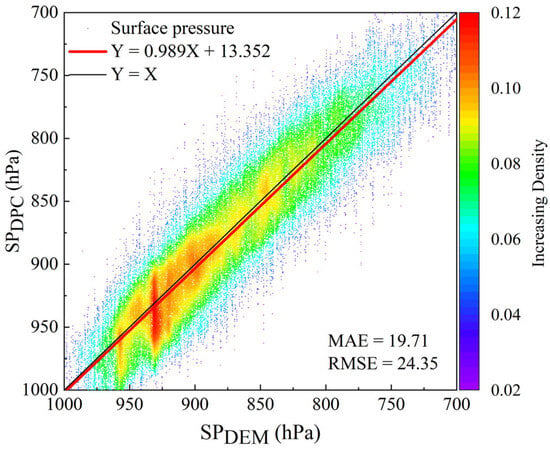
Figure 9.
Comparison of surface pressure retrieved from DPC and that calculated from DEM.
4.3.2. Water Vapor Absorption Band Validation
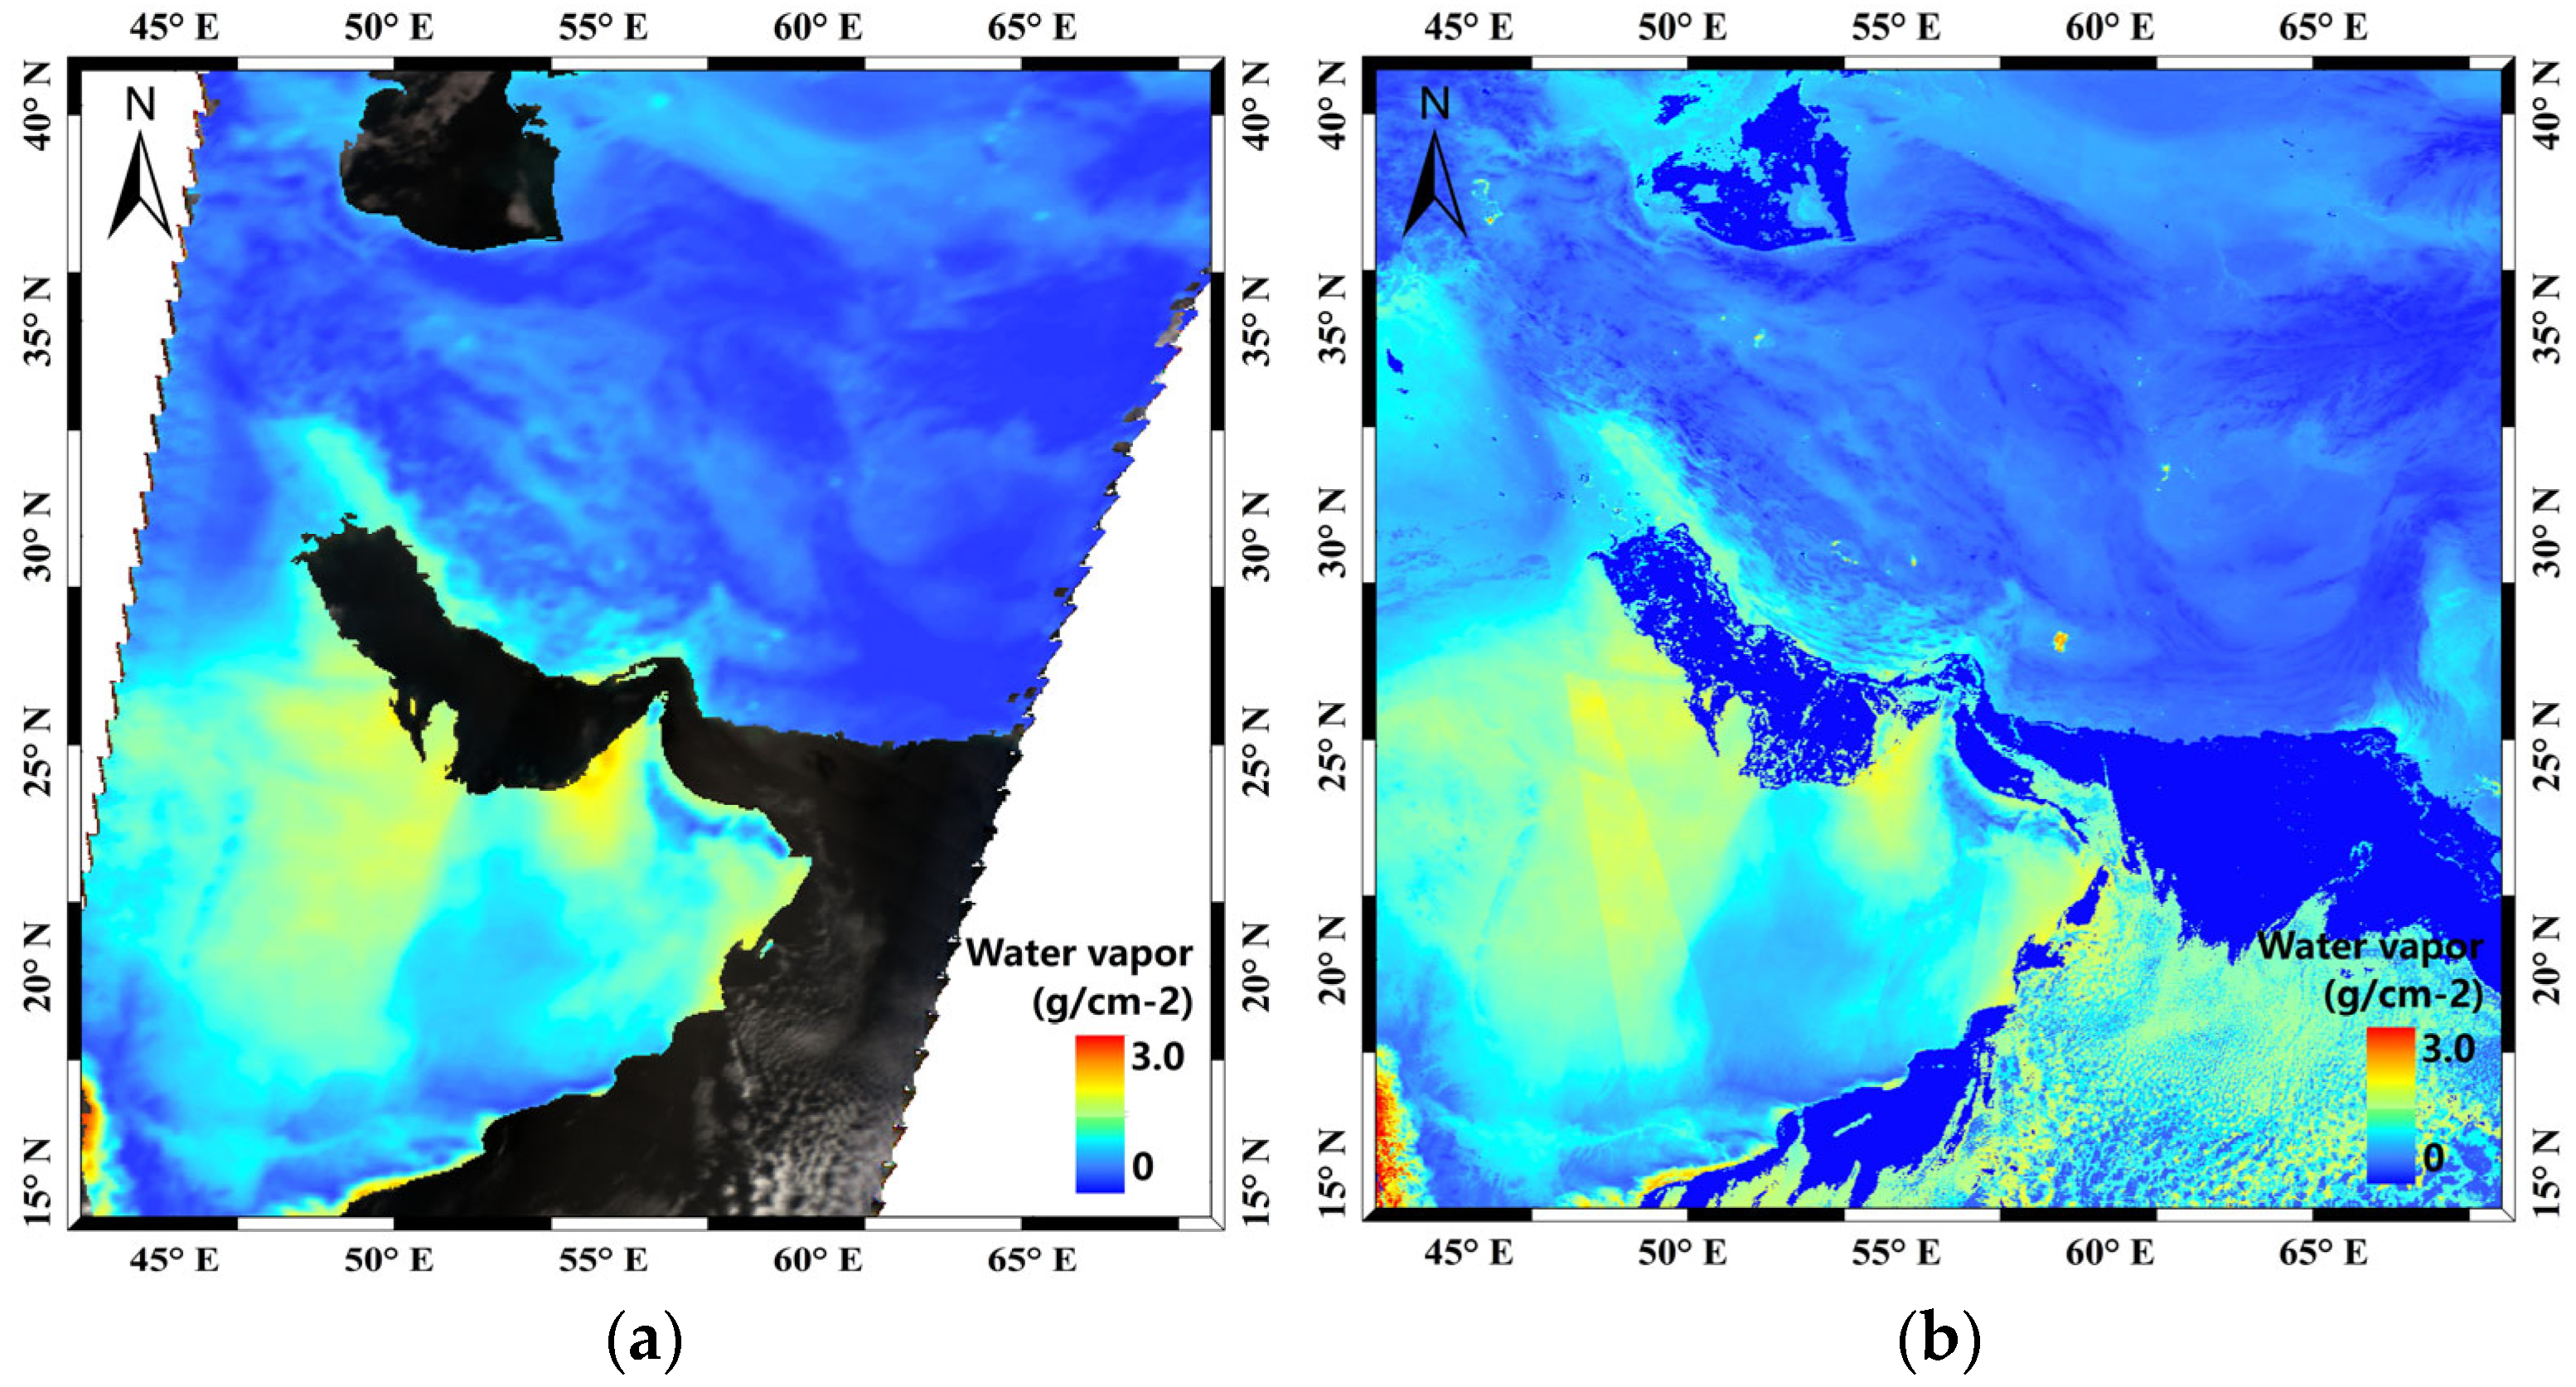
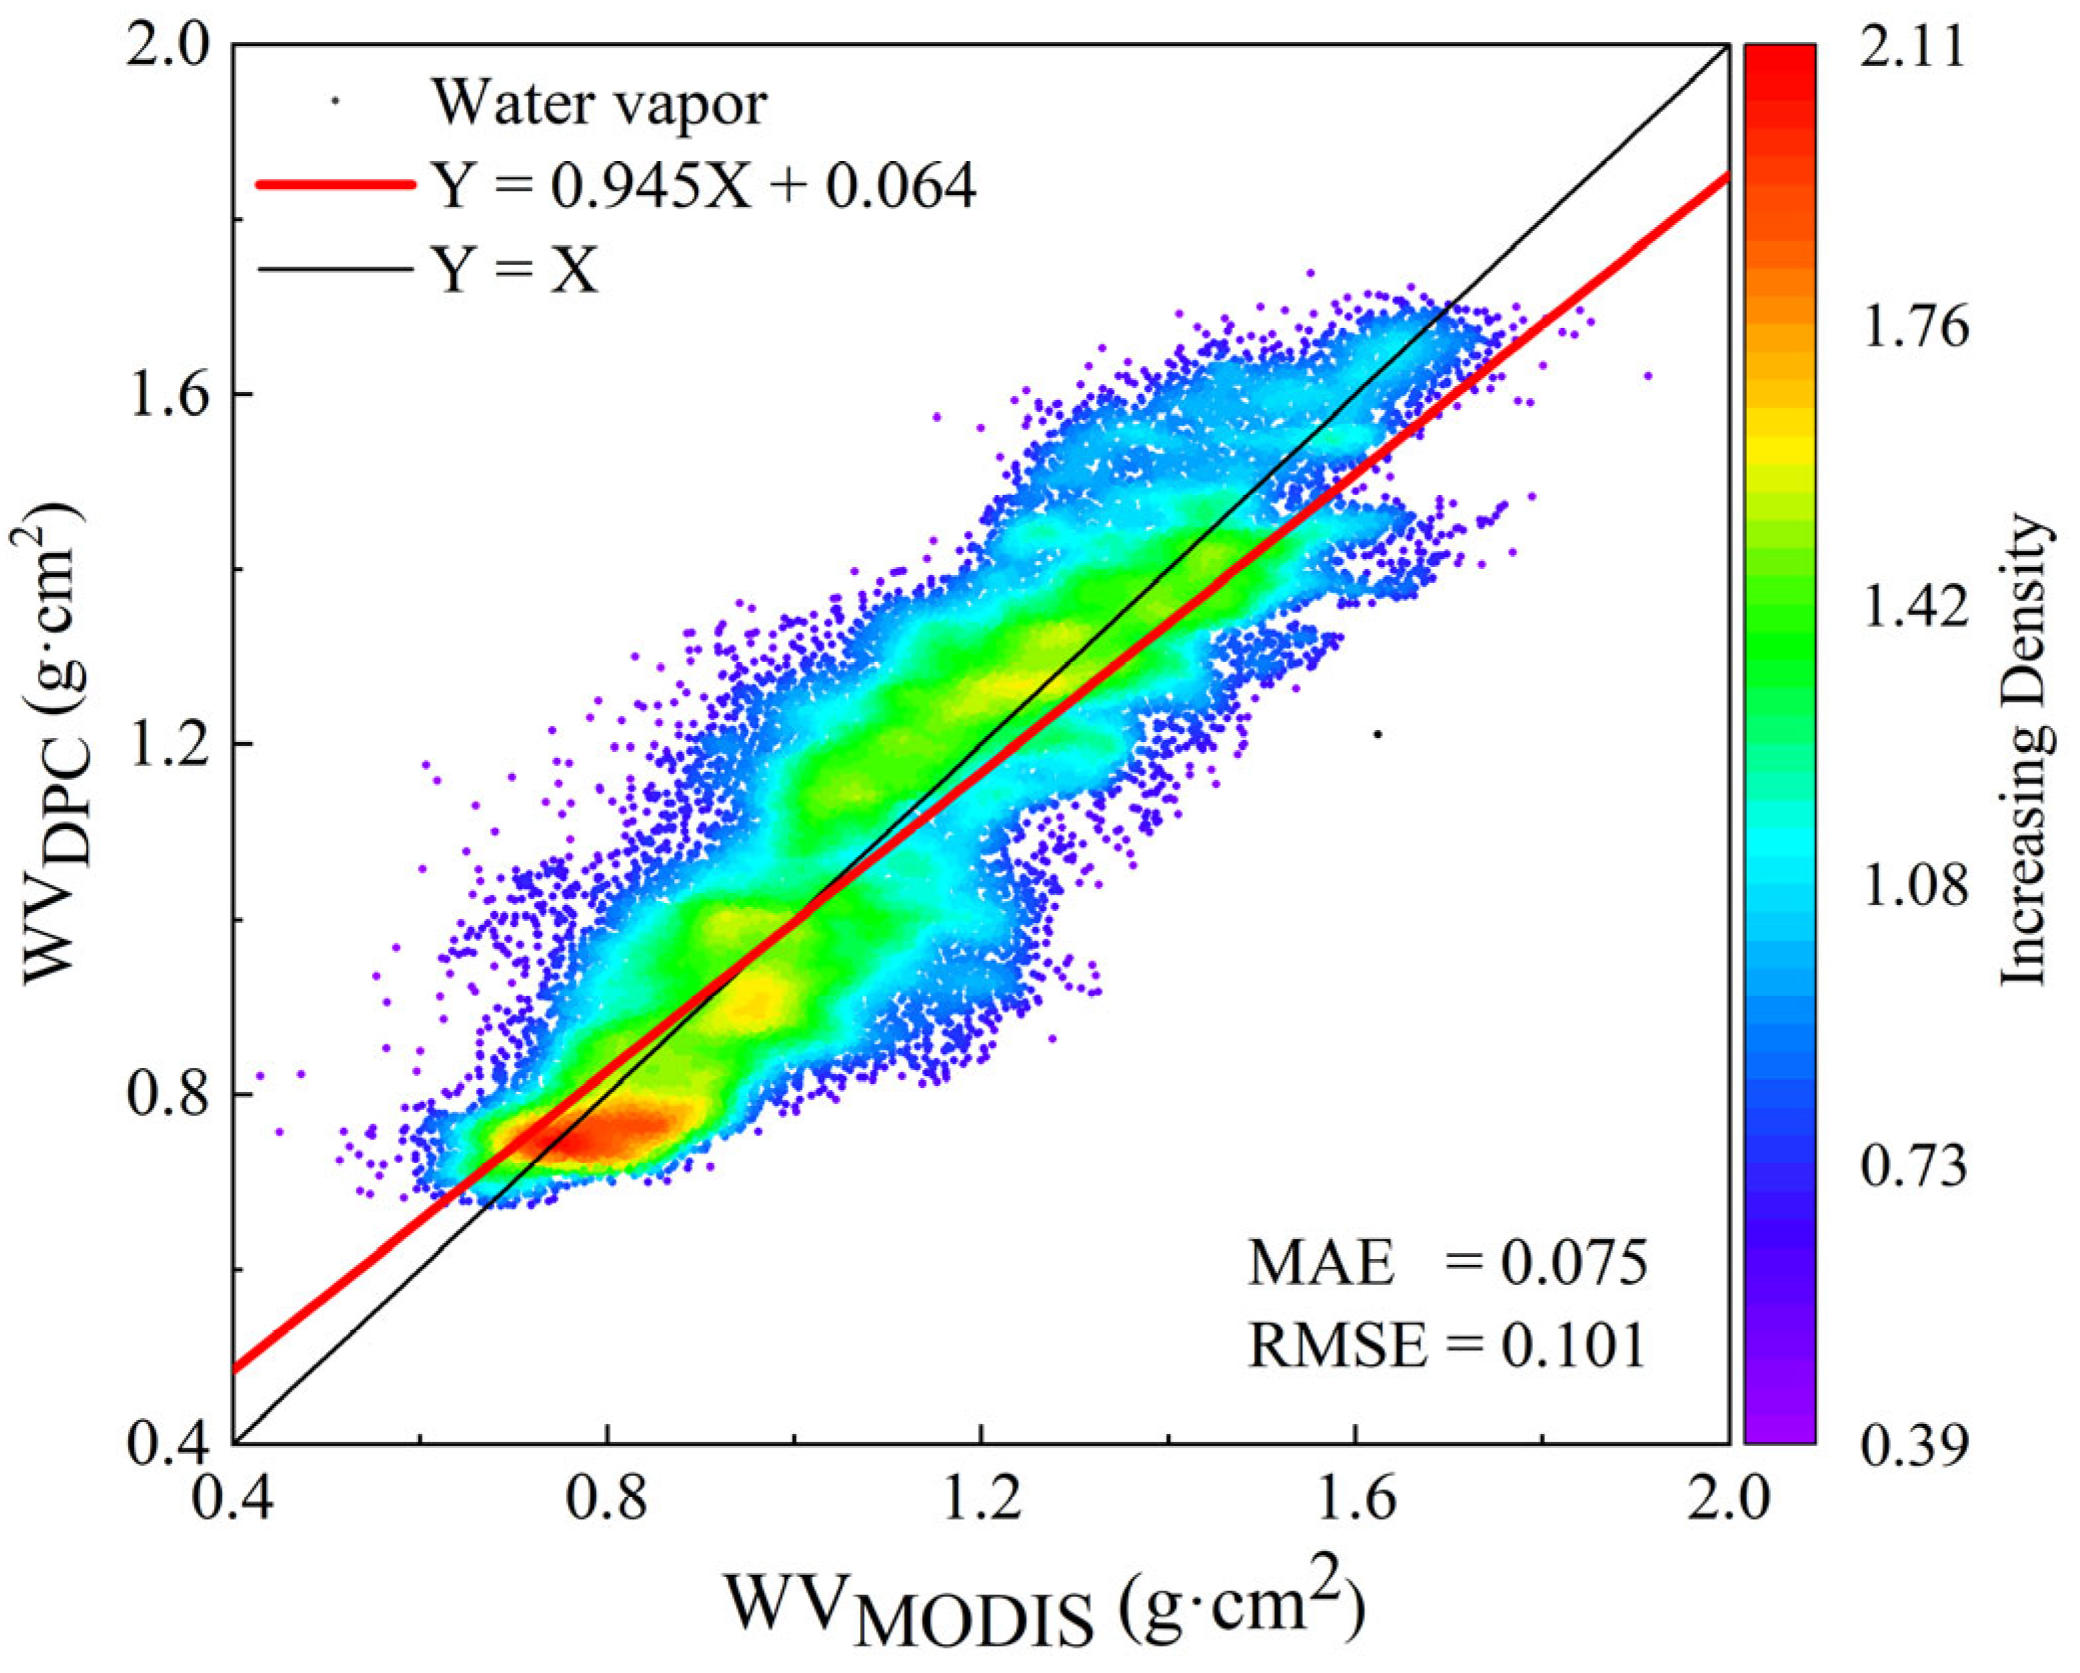
To assess the calibration accuracy of the 910 nm band, water vapor column concentrations retrieved from DPC measurements were compared with the MODIS product. The retrieval algorithm was developed by interchanging the horizontal and vertical axes in Figure 5 and then applying a polynomial fit to the resulting relationship. Figure 10 presents the retrieval results for the Arabian Peninsula and Central Asia, indicating that the spatial distribution of water vapor derived from DPC agrees well with that from MODIS which has higher resolution. Furthermore, as shown in Figure 11, DPC-derived and MODIS water vapor column concentrations exhibit strong consistency. The results yield a fitted slope of 0.954, an MAE of 0.075, and an RMSE of 0.101.
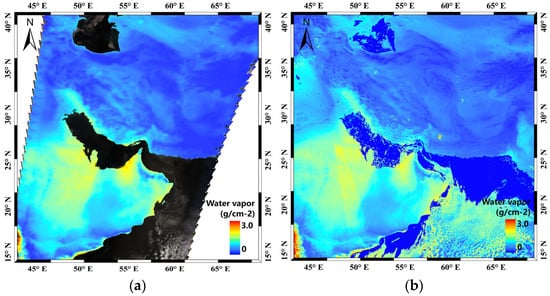
Figure 10.
Water vapor column concentration distribution over the Arabian and Central Asia on 25 January 2022: (a) DPC-derived; (b) MODIS product.
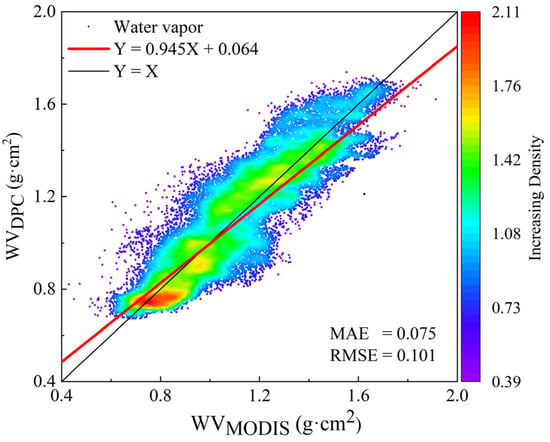
Figure 11.
Comparison of DPC-derived water vapor column concentration with MODIS product.
5. Conclusions
Achieving operational in-flight radiometric calibration of gas absorption bands has long been a challenge for satellite sensors. In this study, we developed a calibration approach that establishes functional relationships between the ratio of TOA reflectance in a gas absorption band to that in an adjacent reference band and the corresponding surface–atmosphere parameters. By incorporating near-real-time surface pressure and water vapor column concentration data using sunglint, the calibration of the 763 nm and 910 nm absorption bands was successfully implemented.
Applied to the Gaofen-5 (02) DPC sensor, the method demonstrates high accuracy: calibration scatter plots yield R2 greater than 0.98, with RMSE below 0.014 for the 763 nm band and below 0.031 for the 910 nm band. Error budget analysis further reveals that the overall calibration uncertainty for the 763 nm band is less than 3.01%, with oxygen contributing approximately 2.91%. For the 910 nm band, the uncertainty is less than 3.45%, with water vapor column concentration and surface reflectance contributing 1.48% and 2.90%, respectively. The calibration derived from the desert scene is used to validate the sunglint results, showing discrepancies of less than 0.06% and 4.93% at 763 nm and 910 nm, respectively. In addition, independent comparisons of DPC-retrieved surface pressure with DEM-derived pressure, and of DPC-retrieved total column water vapor with MODIS products, confirm the validity of the calibration.
By integrating the Rayleigh scattering calibration, the sunglint inter-band transfer method, and the proposed method, an independent and self-consistent absolute radiometric calibration framework can be established. This framework enables long-term in-flight monitoring of the bands from visible to near-infrared for multispectral sensors without relying on external instruments. Given its reliance on physically based relationships and commonly available atmospheric parameters, the approach also holds potential for application to other sensors with comparable spectral characteristics.
Author Contributions
This work was carried out in collaboration with all the authors. Conceptualization, S.Z., Y.X. and X.W.; methodology, S.Z. and L.Z.; writing—original draft, S.Z., L.Z., Y.X., L.Q., Z.L., M.Z. and X.W. All authors have read and agreed to the published version of the manuscript.
Funding
This work was supported by the National Natural Science Foundation of China (Grant No. 42305155, No. 42175148), Jing-Jin-Ji Regional Integrated Environmental Improvement-National Science and Technology Major Project of Ministry of Ecology and Environment of China (No. 2025ZD1200900), and the Dreams Foundation of Jianghuai Advance Technology Center (No. 2023-ZM01K007).
Data Availability Statement
All data used in this study can be downloaded for free. DPC/GF-5 data can be downloaded from the High Resolution Earth Observation System Grid Platform/Chinese National Space Administration Earth Observation and Data Center website (https://data.cresda.cn/#/home, accessed on 31 January 2022). Surface pressure, wind speed, water vapor column concentration and ozone column concentration products were downloaded from Copernicus Climate Change Service (https://cds.climate.copernicus.eu/, accessed on 31 January 2022).
Acknowledgments
The authors would like to thank the Chinese National Space Administration Earth Observation and Data Center for providing the DPC/Gaofen-5 (02) data, thank NASA for providing the MODIS L1 data and AOD product, and thank ECMWF for providing the surface pressure, wind speed, water vapor column concentration and ozone column concentration products.
Conflicts of Interest
The authors declare no conflicts of interest.
References
- Li, Z.; Hou, W.; Hong, J.; Zheng, F.; Luo, D.; Wang, J.; Gu, X.; Qiao, Y. Directional Polarimetric Camera (DPC): Monitoring aerosol spectral optical properties over land from satellite observation. J. Quant. Spectrosc. Radiat. Transf. 2018, 218, 21–37. [Google Scholar] [CrossRef]
- Li, Z.; Hou, W.; Hong, J.; Fan, C.; Wei, Y.; Liu, Z.; Lei, X.; Qiao, Y.; Hasekamp, O.P.; Fu, G. The polarization crossfire (PCF) sensor suite focusing on satellite remote sensing of fine particulate matter PM 2.5 from space. J. Quant. Spectrosc. Radiat. Transf. 2022, 286, 108217. [Google Scholar] [CrossRef]
- Dong, Y.; Li, J.; Zhang, Z.; Zheng, Y.; Zhang, C.; Li, Z. Machine Learning-Based Retrieval of Aerosol and Surface Properties Over Land From the Gaofen-5 Directional Polarimetric Camera Measurements. IEEE Trans. Geosci. Remote Sens. 2024, 62, 1–15. [Google Scholar] [CrossRef]
- Wang, Z.; Jin, S.; Chen, C.; Liu, Z.; Zhai, S.; Chen, H.; Zhou, C.; Zhang, R.; Li, H. Aerosol Retrieval Method Using Multi-Angle Data from GF-5 02 DPC over the Jing–Jin–Ji Region. Remote Sens. 2025, 17, 1415. [Google Scholar] [CrossRef]
- Wei, L.; Shang, H.; Xu, J.; Shi, C.; Tana, G.; Chao, K.; Bao, S.; Chen, L.; Letu, H. Cloud Top Pressure Retrieval Using Polarized and Oxygen A-band Measurements from GF5 and PARASOL Satellites. Adv. Atmos. Sci. 2024, 41, 680–700. [Google Scholar] [CrossRef]
- Wang, C.; Shi, Z.; Xie, Y.; Luo, D.; Li, Z.; Wang, D.; Chen, X. Precipitable Water Vapor Retrieval Based on DPC Onboard GaoFen-5 (02) Satellite. Remote Sens. 2023, 15, 94. [Google Scholar] [CrossRef]
- Qie, L.; Li, Z.; Zhu, S.; Xu, H.; Xie, Y.; Qiao, R.; Hong, J.; Tu, B. In-flight radiometric and polarimetric calibration of the Directional Polarimetric Camera onboard the GaoFen-5 satellite over the ocean. Appl. Opt. 2021, 60, 7186–7199. [Google Scholar] [CrossRef]
- Li, Z.; Qie, L.; Xie, Y.; Zhu, S.; Li, Z.; Pan, Z. In-flight polarimetric calibration of directional polarization camera on GF-5 satellite. J. Atmos. Environ. Opt. 2019, 14, 18. [Google Scholar]
- Zhu, S.; Qie, L.; Xu, H.; Xie, Y.; Li, Z.; Xie, Y.; Ge, B.; Li, K. In-flight cross radiometric calibration of DPC/GaoFen-5 and MODIS/Aqua. Acta Opt. Sin. 2022, 42, 1828008. [Google Scholar]
- Lei, X.; Liu, Z.; Tao, F.; Dong, H.; Hou, W.; Xiang, G.; Qie, L.; Meng, B.; Li, C.; Chen, F.; et al. Data Comparison and Cross-Calibration between Level 1 Products of DPC and POSP Onboard the Chinese GaoFen-5(02) Satellite. Remote Sens. 2023, 15, 1933. [Google Scholar] [CrossRef]
- Hagolle, O.; Goloub, P.; Deschamps, P.Y.; Cosnefroy, H.; Briottet, X.; Bailleul, T.; Nicolas, J.M.; Parol, F.; Lafrance, B.; Herman, M. Results of POLDER in-flight calibration. IEEE Trans. Geosci. Remote Sens. 1999, 37, 1550–1566. [Google Scholar] [CrossRef]
- Zhu, S.; Chen, X.; Liu, L.; Qie, L.; Li, Z.; Ma, J.; Ge, S.; Hong, J.; Li, X.; Gao, H. Evaluation of radiometric performance of MODIS visible bands using the Rayleigh scattering method. J. Appl. Remote Sens. 2019, 13, 018503. [Google Scholar] [CrossRef]
- Fougnie, B.; Bracco, G.; Lafrance, B.; Ruffel, C.; Hagolle, O.; Tinel, C. PARASOL in-flight calibration and performance. Appl. Opt. 2007, 46, 5435–5451. [Google Scholar] [CrossRef]
- Xie, Y.; Zhu, Q.; Zhu, S.; Hou, W.; Zhang, L.; Lei, X.; Zhang, M.; Li, Y.; Liu, Z.; Wen, Y.; et al. Radiometric Calibration of the Near-Infrared Bands of GF-5-02/DPC for Water Vapor Retrieval. Remote Sens. 2024, 16, 1806. [Google Scholar] [CrossRef]
- Lafrance, B.; Hagolle, O.; Bonnel, B.; Fouquart, Y.; Brogniez, G. Interband calibration over clouds for POLDER space sensor. IEEE Trans. Geosci. Remote Sens. 2002, 40, 131–142. [Google Scholar] [CrossRef]
- Fougnie, B.; Bach, R. Monitoring of Radiometric Sensitivity Changes of Space Sensors Using Deep Convective Clouds: Operational Application to PARASOL. IEEE Trans. Geosci. Remote Sens. 2009, 47, 851–861. [Google Scholar] [CrossRef]
- Fougnie, B. Improvement of the PARASOL Radiometric In-Flight Calibration Based on Synergy Between Various Methods Using Natural Targets. IEEE Trans. Geosci. Remote Sens. 2016, 54, 2140–2152. [Google Scholar] [CrossRef]
- Xu, N.; Hu, X.-Q.; Chen, L.; Zhang, Y.-X. Cross-calibration of FY-2E/VISSR infrared window and water vapor channels with TERRA/MODIS. J. Infrared Millim. Waves 2012, 31, 319–324. [Google Scholar] [CrossRef]
- Lacherade, S.; Fougnie, B.; Henry, P.; Gamet, P. Cross Calibration Over Desert Sites: Description, Methodology, and Operational Implementation. IEEE Trans. Geosci. Remote Sens. 2013, 51, 1098–1113. [Google Scholar] [CrossRef]
- Chen, F.; Luo, D.; Li, S.; Yang, B.; Sun, L.; Ge, S.; Hong, J. The Operational Inflight Radiometric Uniform Calibration of a Directional Polarimetric Camera. Remote Sens. 2021, 13, 3823. [Google Scholar] [CrossRef]
- Huang, C.; Chang, Y.; Xiang, G.; Han, L.; Chen, F.; Luo, D.; Li, S.; Sun, L.; Tu, B.; Meng, B.; et al. Polarization measurement accuracy analysis and improvement methods for the directional polarimetric camera. Opt Express 2020, 28, 38638–38666. [Google Scholar] [CrossRef] [PubMed]
- Huang, C.; Xiang, G.; Chang, Y.; Han, L.; Zhang, M.; Li, S.; Tu, B.; Meng, B.; Hong, J. Pre-flight calibration of a multi-angle polarimetric satellite sensor directional polarimetric camera. Opt. Express 2020, 28, 13187–13215. [Google Scholar] [CrossRef] [PubMed]
- U.S. Geological Survey, Earth Resources Observation and Science (EROS) Center. Global 30 Arc-Second Elevation Data Set (GTOPO30). Sioux Falls, SD, USA, 2003. Available online: https://www.usgs.gov/centers/eros/science/usgs-eros-archive-digital-elevation-global-30-arc-second-elevation-gtopo30 (accessed on 31 January 2022).
- Hersbach, H.; Bell, B.; Berrisford, P.; Hirahara, S.; Horányi, A.; Muñoz--Sabater, J.; Nicolas, J.; Peubey, C.; Radu, R.; Schepers, D.; et al. The ERA5 global reanalysis. Q. J. R. Meteorol. Soc. 2020, 146, 1999–2049. [Google Scholar] [CrossRef]
- Hersbach, H.; Bell, B.; Berrisford, P.; Biavati, G.; Horányi, A.; Muñoz Sabater, J.; Nicolas, J.; Peubey, C.; Radu, R.; Rozum, I.; et al. ERA5 hourly data on single levels from 1940 to present. In Copernicus Climate Change Service (C3S) Climate Data Store (CDS); 2023; Available online: https://doi.org/10.24381/cds.adbb2d47 (accessed on 23 October 2025).
- Levy, R.C.; Mattoo, S.; Munchak, L.A.; Remer, L.A.; Sayer, A.M.; Patadia, F.; Hsu, N.C. The Collection 6 MODIS aerosol products over land and ocean. Atmos. Meas. Tech. 2013, 6, 2989–3034. [Google Scholar] [CrossRef]
- Fougnie, B.; Llido, J.; Gross-Colzy, L.; Henry, P.; Blumstein, D. Climatology of Oceanic Zones Suitable for In-flight Calibration of Space Sensors. In Proceedings of the Earth Observing Systems XV, San Diego, CA, USA, 2–5 August 2010. [Google Scholar]
- Bouffies, S.; Bréon, F.M.; Tanré, D.; Dubuisson, P. Atmospheric water vapor estimate by a differential absorption technique with the polarization and directionality of the Earth reflectances (POLDER) instrument. J. Geophys. Res. Atmos. 1997, 102, 3831–3841. [Google Scholar] [CrossRef]
- Kay, S.; Hedley, J.D.; Lavender, S. Sun Glint Correction of High and Low Spatial Resolution Images of Aquatic Scenes: A Review of Methods for Visible and Near-Infrared Wavelengths. Remote Sens. 2009, 1, 697–730. [Google Scholar] [CrossRef]
- Harmel, T.; Chami, M. Estimation of the sunglint radiance field from optical satellite imagery over open ocean: Multidirectional approach and polarization aspects. J. Geophys. Res. Oceans 2013, 118, 76–90. [Google Scholar] [CrossRef]
- Bréon, F.M.; Bouffiés, S. Land surface pressure estimate from measurements in the oxygen A absorption band. J. Appl. Meteorol. Climatol. 1996, 35, 69–77. [Google Scholar] [CrossRef][Green Version]
- Lindstrot, R.; Preusker, R.; Fischer, J. The retrieval of land surface pressure from MERIS measurements in the oxygen A band. J. Atmos. Ocean. Technol. 2009, 26, 1367–1377. [Google Scholar] [CrossRef]
Disclaimer/Publisher’s Note: The statements, opinions and data contained in all publications are solely those of the individual author(s) and contributor(s) and not of MDPI and/or the editor(s). MDPI and/or the editor(s) disclaim responsibility for any injury to people or property resulting from any ideas, methods, instructions or products referred to in the content. |
© 2025 by the authors. Licensee MDPI, Basel, Switzerland. This article is an open access article distributed under the terms and conditions of the Creative Commons Attribution (CC BY) license (https://creativecommons.org/licenses/by/4.0/).

