Highlights
What are the main findings?
- Semi-automatic ULS processing (CloudCompare/ArcMap) produced more accurate DBH than the fully automatic Spatix workflow across the urban park.
- TLS provided the most accurate DBH when compared with ground-based measurements (TGBM); ULS produced slightly higher and more uniform tree height estimates.
What are the implications of the main findings?
- For urban forest inventories, TLS is preferable for DBH estimation.
- A hybrid workflow combining ULS with personal/mobile laser scanning (PLS; SLAM-based) can reduce occlusion, increase completeness, and improve overall accuracy in heterogeneous urban canopies.
Abstract
Urban mediterranean forests are key components of urban ecosystems. Accurate, high-resolution data on forest structural attributes are essential for effective management. This study evaluates the efficiency of unmanned laser scanning systems (ULS) and terrestrial LiDAR (TLS) in deriving key tree attributes, diameter at breast height (DBH) and tree height, within a small urban park in Zadar, Croatia. Accuracy assessment of the ULS and TLS-derived DBH was conducted based on traditional ground-based measurement (TGBM) data. For ULS, an automatic Spatix workflow was applied that classified points into a Tree class, segmented trees using trunk-based logic, and estimated DBH by fitting a circle to a 1.3 m slice; tree height was computed from the ground-normalized cloud with the Output Tree Cells tool. A semi-automatic CloudCompare/ArcMap workflow used CSF ground filtering, Connected Components segmentation, extraction of a 10 cm slice, manual trunk vectorization, and DBH calculation via Minimum Bounding Geometry. TLS scans, processed in FARO SCENE, were then analyzed in Spatix using the same automatic trunk-fitting procedure to derive DBH and height. Accuracy for DBH was evaluated against TGBM; comparative performance was summarized with standard error metrics, while ULS and TLS tree heights were compared using Concordance Correlation Coefficient (CCC) and Bland–Altman statistics. Results indicate that the semi-automatic approach outperformed the automatic approach in deriving DBH. TLS-derived DBH values demonstrated higher consistency and agreement with TGBM, as evidenced by their strong linear correlation, minimal bias, and narrow residual spread, while ULS exhibited greater variability and systematic deviation. Tree height comparisons between ULS and TLS revealed that ULS consistently produced slightly higher and more uniform measurements. This study highlights limitations in the evaluated techniques and proposes a hybrid approach combining ULS scanning with personal laser scanning (PLS) systems to enhance data accuracy in urban forest assessments.
1. Introduction
There is a growing emphasis on the mapping of green spaces in urban environments [1,2]. Urban green spaces, recognized as a part of “green infrastructure” [3], include all vegetated areas within cities, such as forests, privately owned gardens, parks, cemeteries, meadows, roadside greenery, and arable land [4]. Their proximity positively impacts quality of life [5] and helps mitigate urban environmental challenges such as air pollution, elevated temperatures, and noise [6]. Among these, urban forests are the most prominent elements, playing a critical role in the ecological health and sustainability of cities [7]. In the Mediterranean region, urban forests are a vital component of green infrastructure. Urban forests face increasing pressure from climate change, unsustainable urbanisation, and urban sprawl [8,9].
Jorgensen [10] emphasized the significance of each individual tree in urban forests management, which led to the development of urban forestry as a specialized discipline. This has fueled growing interest in developing urban forest cadastre and accurately determining geometric tree characteristics [11,12]. Urban trees contribute to numerous ecosystem services, including recreation [11,13], carbon sequestration [14] (p. 11), wildlife habitat provision [15], and air pollution mitigation [11,16]. High-resolution data on urban forest structure is essential for effective planning, management, and conservation of urban green spaces. However, traditional inventory methods are often time-consuming and costly [17].
Significant advancements in vegetation mapping have been made since the 1990s with the advent of Light Detection and Ranging (LiDAR) and the emergence of airborne laser scanning (ALS), which provided a cost-effective means of estimating forest structural attributes at plot or forest stand level [18,19]. Constant and rapid technological progress regarding sensor miniaturization and algorithm development, as well as constant decrease of its costs, led to emerging of various close-range remote sensing laser scanning systems which observe at a target-to-sensor distance ranging from very short lengths to hundred or more meters [20]. Compared to classical remote sensing, close-range remote sensing laser systems provide the acquisition of highly detailed data that can be used not only at a plot or stand level but also for estimating individual tree attributes [20].
Close-range remote sensing laser systems include both aerial and ground-based systems. The aerial system, i.e., unmanned aerial vehicles (UAV) equipped with LiDAR sensors, is commonly referred to as unmanned laser scanning (ULS) systems. Based on platforms, terrestrial laser systems can be divided into static and mobile systems. Currently, static terrestrial laser scanning (TLS) and mobile hand-held personal laser scanning (PLS) represent the systems that are most used in forest inventory research studies and practice [20,21,22].
Accurate individual tree segmentation (ITS) is essential for processing close-range remote sensing data because it represents a crucial step in determining tree locations and estimation of key tree attributes [23,24]. ITS is usually performed using point cloud-based methods [24] or canopy height model (CHM)-based methods [25]. However, CHM-based methods are limited by information loss during point cloud interpolation [25], making point cloud-based methods generally more accurate [24]. Various algorithms and methods for point cloud-based ITS (e.g., region growing-based methods, cluster-based methods, watershed algorithm, graph-based segmentation, deep learning-based methods, mean shift clustering, voxel-based methods, etc.) have been developed [26,27,28,29] and tested [23,30,31].
Comparative studies on the accuracy of aerial and terrestrial LiDAR systems, and traditional mapping methods for estimating key tree features are underrepresented in the literature. Given the complex morphology of trees and the variability of terrain, the applicability of various software’s for extracting these features remains insufficiently explored.
The primary objective of this study is to compare the traditional ground-based measurement method (TGBM) with ULS and TLS systems, focusing on their ability to assess the basic tree geometric features, i.e., the main tree attributes within a small urban park in Zadar (Croatia). Particular emphasis is placed on extracting and estimating the main tree attributes, such as diameter at breast height (dbh) and tree height. For the extraction and estimation of tree attributes from ULS and TLS data, two different processing workflows, i.e., approaches, were applied and tested: a fully automatic approach using the commercial software Spatix-x64 v.025.003-r6648 within DJI Terra and a semi-automatic approach using the combination of open-source software CloudCompare (CC) v2.12.4 (Kyiv) and ArcMap 10.4.1. These workflows were compared with TGBM to assess whether automated segmentation and trunk modeling can deliver metrics with acceptable accuracy in urban parks. Although traditional methods are labor-intensive and difficult to scale [31], they remain valuable benchmarks for modern automatic and semi-automatic forest measurement techniques [32]. By exploring the capabilities and limitations of these advanced LiDAR-based approaches, this study aims to address critical challenges in urban forestry management, including the need for high-resolution, accurate data for planning and conservation efforts.
2. Materials and Methods
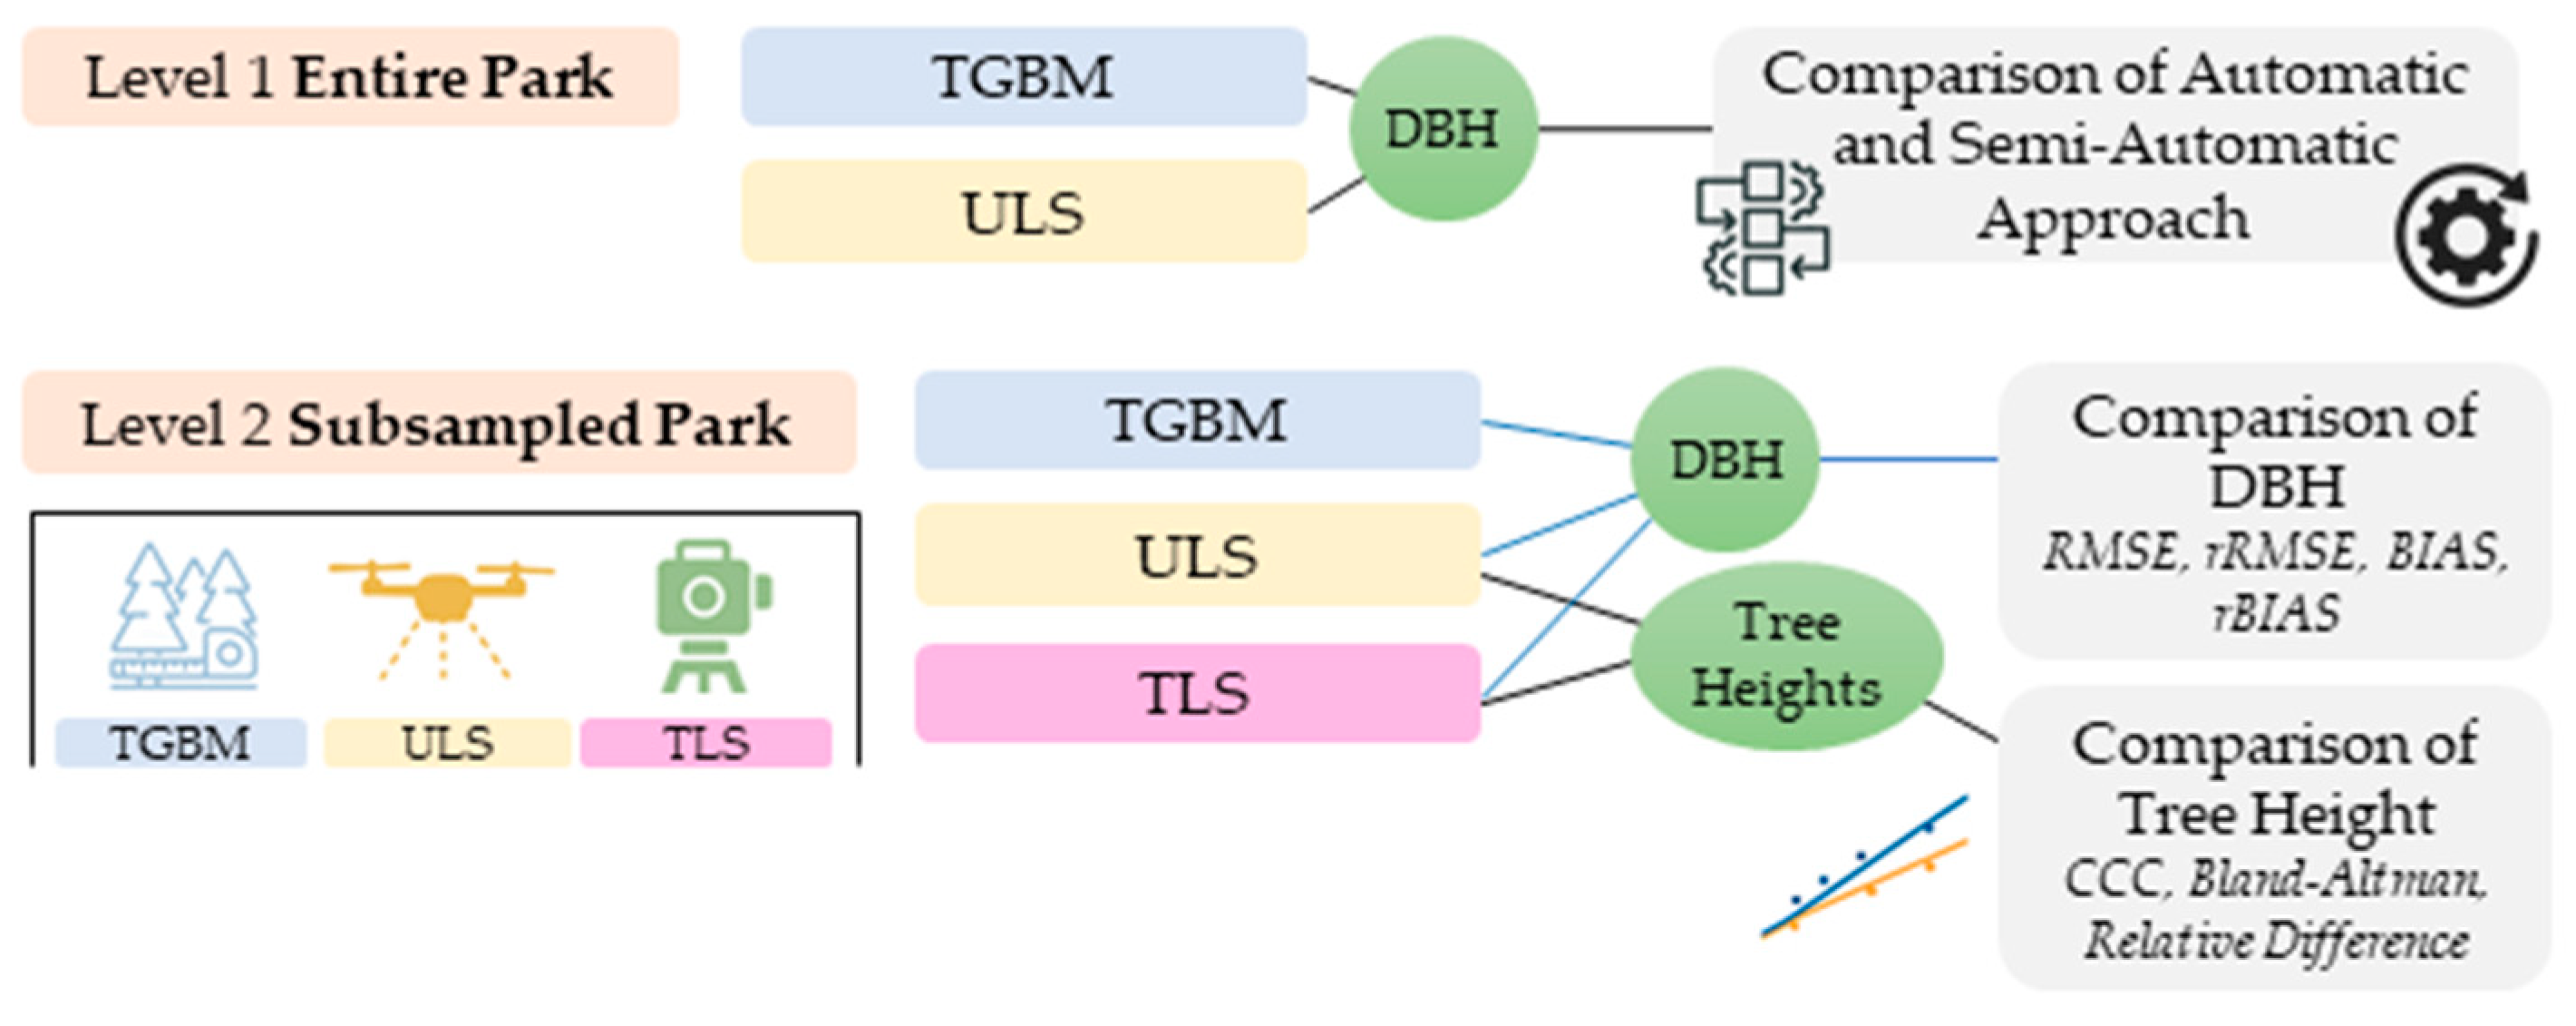
Considering the study objectives, this research was conducted at two distinct levels differing in the size of the observed area, the tree attributes assessed, and the technologies and methods used for data collection and processing (Figure 1). The first level encompassed the entire park, where DBH estimates derived from ULS were processed using two different workflows (fully automatic and semi-automatic) and evaluated against the TGBM method. The second level focused on a smaller, subsampled area of the park where TLS data were also collected. This allowed for a more detailed comparison of DBH estimates from different close-range remote sensing technologies (ULS, TLS) with reference TGBM data. Additionally, at this level, a detailed comparison of tree height estimates from ULS and TLS was also performed. At this level, tree attributes (DBH, tree height) from both ULS and TLS data were extracted and estimated using a fully automatic workflow only. To ensure consistency, all data were collected on the same day, 7 December 2023.
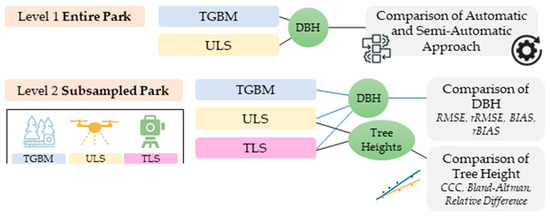
Figure 1.
Methodological workflow.
2.1. Study Area and Traditional Ground-Based Measurement (TGBM) Method
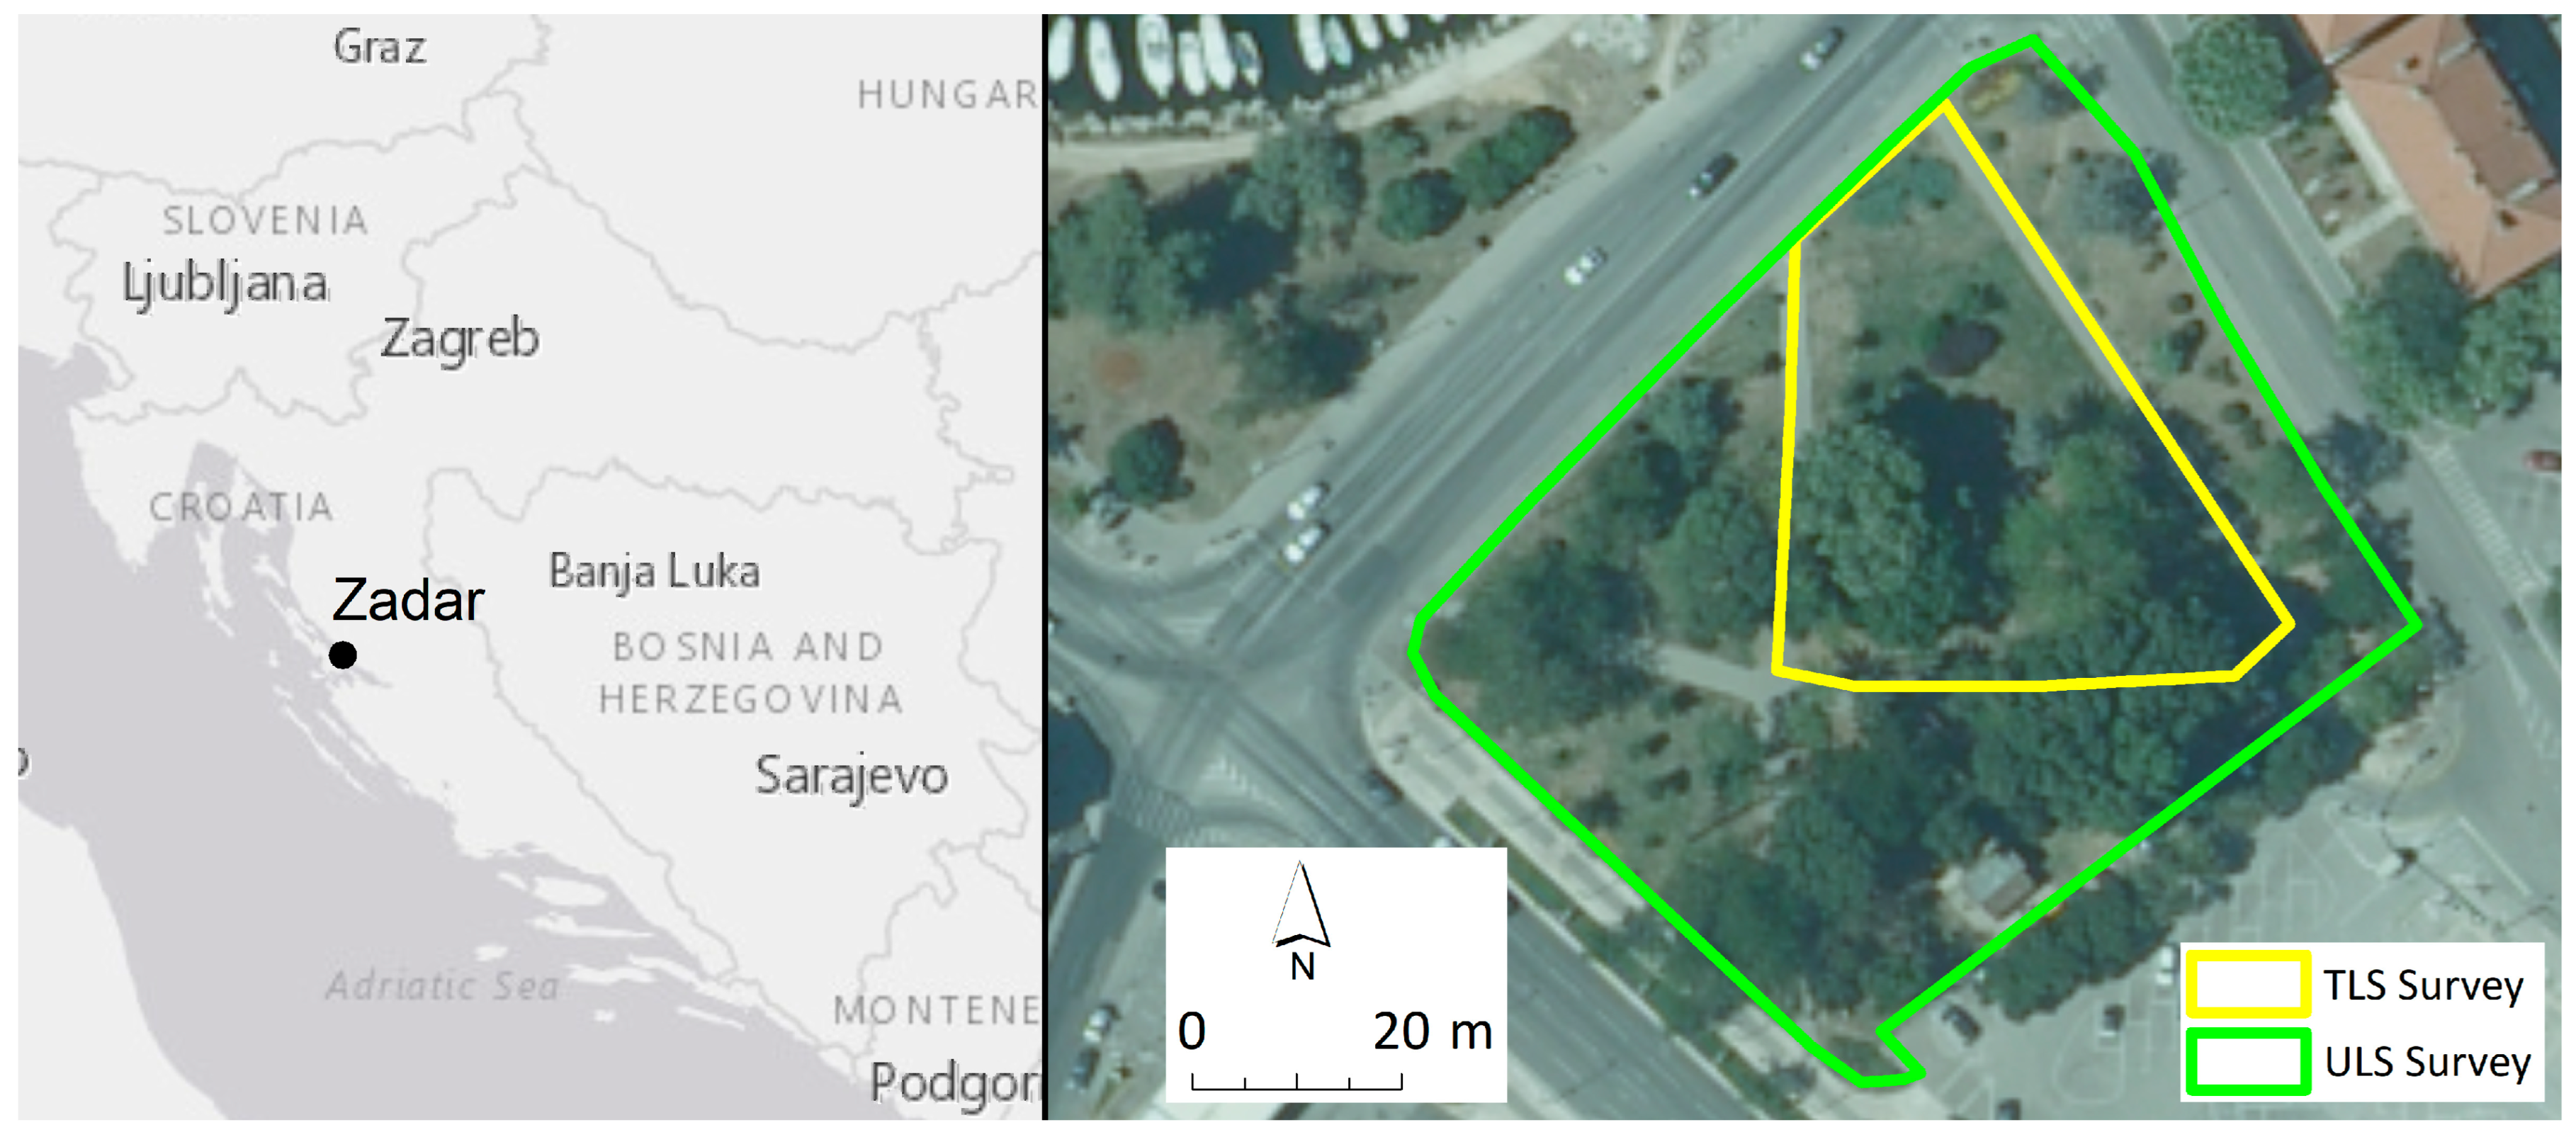
The study was conducted in a small, urban park (44.1109°N, 15.2349°E, elevation 2 m a.s.l.) located in the city of Zadar, Republic of Croatia. The entire park, representing the first level of research, covers an area of 4964 m2, while the subsampled area, representing the second level of research, covers 1500 m2 on the park’s northwest side (Figure 2).
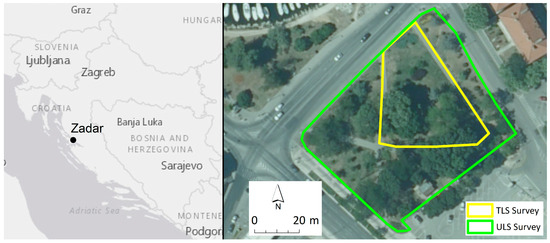
Figure 2.
Study area—small urban park in Zadar (Croatia).
TGBM conducted across the entire park included the identification of tree or shrub species, as well as measurements of their position and tree circumference (TC). Tree and shrub species were identified based on residual leaves, fruits, or bark characteristics. The position of each tree or shrub was precisely measured using a Trimble R12i GNSS receiver, which features an integrated inertial measurement unit (IMU) and Trimble’s proprietary tilt compensation technology. This setup allows for accurate data acquisition without the need to level the pole. The Trimble R12i provides real-time kinematic (RTK) accuracy of up to 8 mm horizontally and 15 mm vertically [33]. Since the centroid of a tree cannot be physically measured in the field, centroid’s position was adjusted to the centre of the tree during post-processing [34]. The centroid was determined from the ULS point cloud by fitting a circular or cylindrical model around the trunk base and extracting its geometric centre. This position was then visually verified and, where necessary, manually corrected in GIS software to ensure alignment with the true trunk centre. TC was measured at a height of 1.3 m above ground using a diameter tape with a precision of 0.1 cm. A standard construction meter was also used to verify the measurement height. From the recorded TC values, DBH was calculated. A geographic information system (GIS) database was subsequently developed, assigning a unique ID to each tree or shrub, along with associated attributes such as species name, position, TC and DBH.
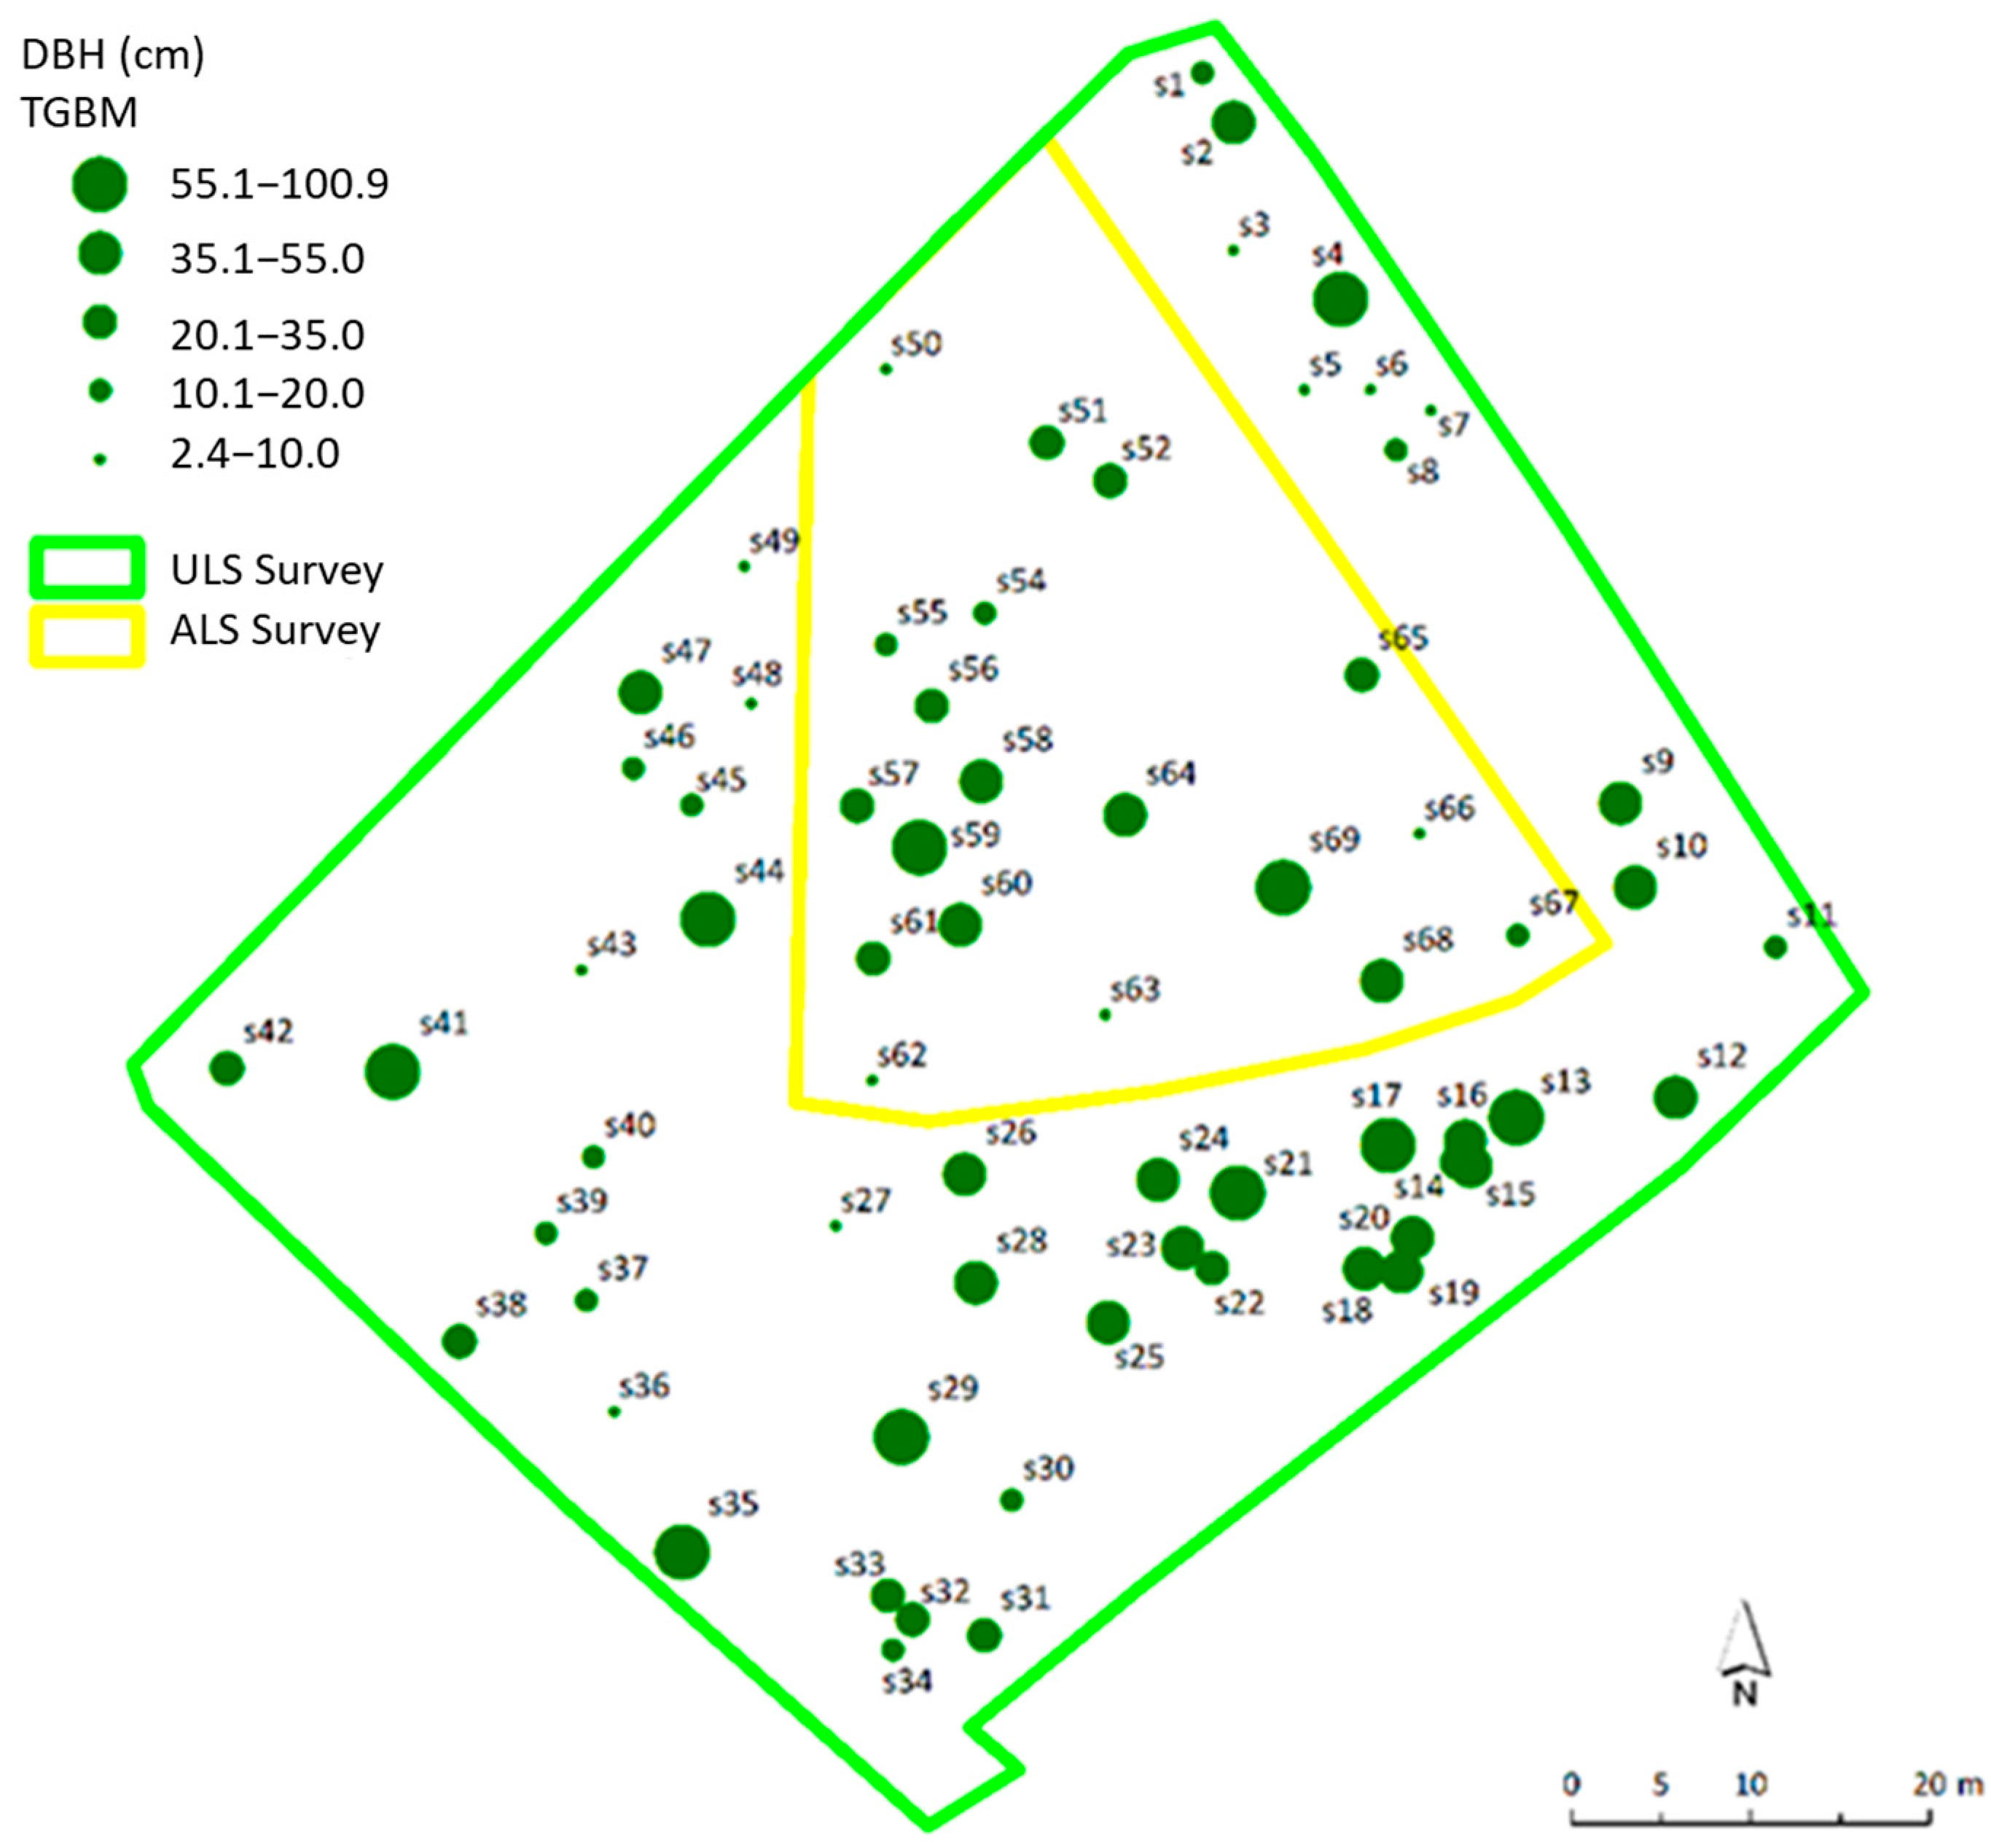
Based on TGBM data, the study area can be characterized as an urban Mediterranean forest park with low tree density but high species richness. It contains a variety of deciduous broadleaved, deciduous evergreen and coniferous tree and shrub species. A total of 68 tree and shrub individuals, representing 24 different species, were recorded. In terms of structural characteristics, this park represents a multi-layered urban forest with high variability in tree and shrub attributes (e.g., DBH, height), as well as their spatial distribution (Figure 3).
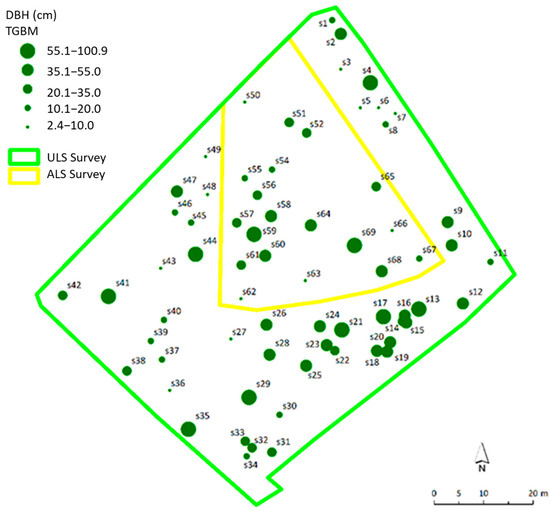
Figure 3.
Spatial distribution of the recorded and measured trees and shrubs in the study area using TGBM method.
2.2. Unmanned Laser Scanning (ULS) Data
2.2.1. ULS Data Collection
ULS data collection of the park was performed using a DJI Matrice M300 RTK equipped with the DJI Zenmuse L1 LiDAR. The DJI Zenmuse L1 is a compact and integrated system that combines a LiDAR module, an RGB camera, and an inertial measurement unit (IMU). Equipped with a Livox LiDAR module, the Zenmuse L1 can capture up to 240,000 points per second, with a detection range extending up to 450 m. It has 70° field of view (FoV) and supports up to three returns per laser pulse, enhancing data acquisition capabilities [35]. ULS flight missions were planned using the DJI Pilot 2 software, with the Oblique mission type selected [36]. The front overlap was set to 70%, and the side overlap to 20%. The oblique mission is designed for capturing aerial images at an angle and is widely used in 3D modeling to generate detailed representations of complex structures [37]. Before the survey, the IMU and compass calibration were done. The Gimbal Pitch (Oblique) was set to −45°, allowing the laser beam to capture additional points beneath the canopy. The flight altitude was set to 35 m, with a maximum flight speed of 4.1 m/s and a take-off speed of 10 m/s. The LiDAR pulse rate was configured at 240 kHz, while the scanning rate was set at 720 kHz. Maximum Return parameter was set to three returns per pulse in order to obtain more points under the canopy. The survey was conducted under ideal conditions, with light wind and minimal shadows, as the area was recorded between 11:00 and 12:30. Checkpoints (CPs) were collected to validate the accuracy of the directly georeferenced ULS point cloud. CPs (n = 51) were acquired using a Trimble R12i GNSS receiver, with each point collected over 5 s based on 10 epochs to ensure precision on various surface types.
ULS survey acquired 141,223,143 points over an area of 13,448.6 m2 (approximately 10,500 points/m2) at an average flight speed of 4 m/s and a flight altitude of 35 m. Noise points caused by pigeons were removed during post-processing. After noise removal and point cloud extraction within the survey area, the total number of points was 48,570,413, resulting in a point density of 9313 points/m2 and Ground Sampling Distance (GSD) of 1.35 cm per pixel. The RMSE estimated on the basis of the acquired CPs (n = 51) was 4.55 cm, while SD was 4.60 c.
2.2.2. ULS Data Processing Using Fully Automatic Workflow
The ULS data was processed using DJI Terra 3.6.0. The point cloud density parameter was set to High (100%). All collected CPs were used to assess the accuracy of RTK/PPK dense point cloud. The effective point cloud distance was set to 49.5 m, calculated using the specified formula (1).
where D is sensor distance from the terrain, h is 35 m (altitude of the UAV) and θ is 45° (camera angle from the nadir).
The Smooth Point Cloud parameter was enabled to reduce point cloud thickness, eliminate discrete noise, and enhance the clarity of tree structures. After deriving a dense point cloud, the process continued in Spatix. It is developed as a simple CAD platform for running Terra applications. First, the Split Trajectories Settings tool splits the trajectory into separate flight paths, allowing for easy comparison and removal of overlaps. Within the tool, the Break at Trajectory Gasp option is disabled. It splits the trajectory if there is a time gap between trajectory observations. Split at Turns is set to Sharpe Turn (trajectory intersected at a turning point), and Delete Short Passes is set to 100 m, representing a limitation on the flight path length. In the second step, the Match Passes Settings tool is used. The tool smooths out the mismatch between overlapping paths, thus improving the accuracy of the dense point cloud. The Mmax xy mismatch parameters are set to 1 m, and the Max z mismatch parameters (the difference between the elevation lines) are set to 0.5 m. All per-session correction parameters (heading, roll, and pitch) are selected, thus applying a systematic correction to all selected parameters. The Solve mirror angle correction parameter is set to Skip central part in the range of −20 to 20°. Within the Cut Overlap Settings tool, the default settings were used, the maximum size of the area without dots was set to 0.5 m. It was used to remove the noises that were caused by the pigeons in this case is Smoothen and Remove Noise Settings which smooths surfaces and classifies deviations above and below the surface as noise. Classify isolated points, if enabled, separates them individually or in a group of points and classifies them as noise. The maximum size of the group of points to be isolated is set to 3, and the radius for finding neighbouring points is set to 3 m. The options for smoothing the surface and removing noise around the surface are selected. The points affected by the process are placed in non-vegetation-only areas. The subsequent step involved the application of the Thin Points Settings tool, which reduces the density of the point cloud by deactivating the selected point class. The targeted point class, with a surface value of 19, was processed using a point spacing of 0.100 m. To generate a smooth ground surface model, the Classify Ground tool was utilized, which eliminates edge points and classifies the lowest points as ground [38]. Following this, the Height from Ground tool was employed to classify points above the ground into three categories based on specified parameters: low vegetation (up to 0.25 m), medium vegetation (0.25–2 m), and high vegetation (above 2 m) [38]. The classification of the dense point cloud was carried out using the Classify Above Ground Features tool, which builds upon the functionality of the Height from Ground tool and requires its prior activation. This step divided the dense point cloud into user-defined classes based on the specific needs of the project [38]. The selected classes included building roof, roof structure, wall structure, tree, vegetation, columns, and car. Additionally, the vegetation index value was set to 0.05. The software automatically derived classes based on the specified parameters, resulting in a classified point cloud. However, isolated classification errors were identified and manually corrected using the Classify Using Brush tool. Following manual corrections, the dense point cloud was classified into 13 classes: Ground, Low Vegetation, Medium Vegetation, High Vegetation, Building Roof, Low Points, Vegetation, Roof Structure, Wall Structure, Tree (class 15), Car, and Pole.
Then, based on classified dense point cloud, the ITS process was performed (Figure 4). ITS for ULS point cloud derived in Spatix was performed using the Assign Groups tool. Class 15, representing Trees, was selected. The Group by Tree Logic parameter was applied to group points associated with trees, with two grouping methods available: the highest point method or the trunk method. The trunk method was selected as it provides an individualized approach to tree analysis and requires a substantial number of points. The minimum tree height was set to 3 m, and the maximum DBH was limited to 1 m to account for the high DBH variability of trees within the study area. As a consequence, this threshold excluded approximately 10–15 smaller trees, mostly those with a DBH below 10 cm, which was intentional and consistent with study design. Additionally, the minimum tree trunk length was defined as 1.5 m, which further excluded certain small trees or larger shrubs that branch very close to the ground. This choice was deliberate, as our aim was to segment and measure only those trees that meet such structural characteristics.
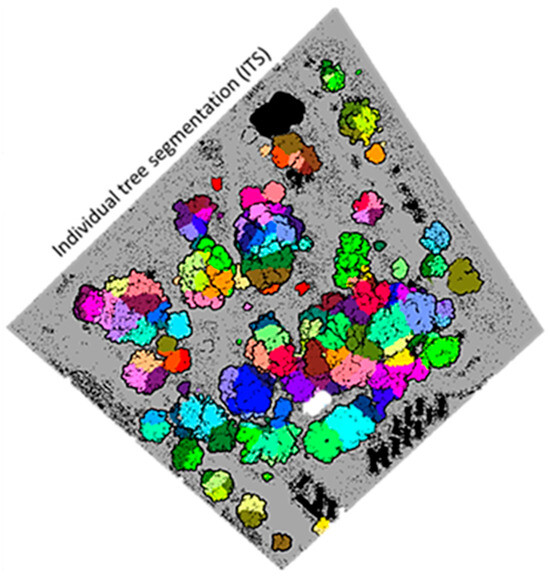
Figure 4.
Individual tree segmentation process in Spatix.
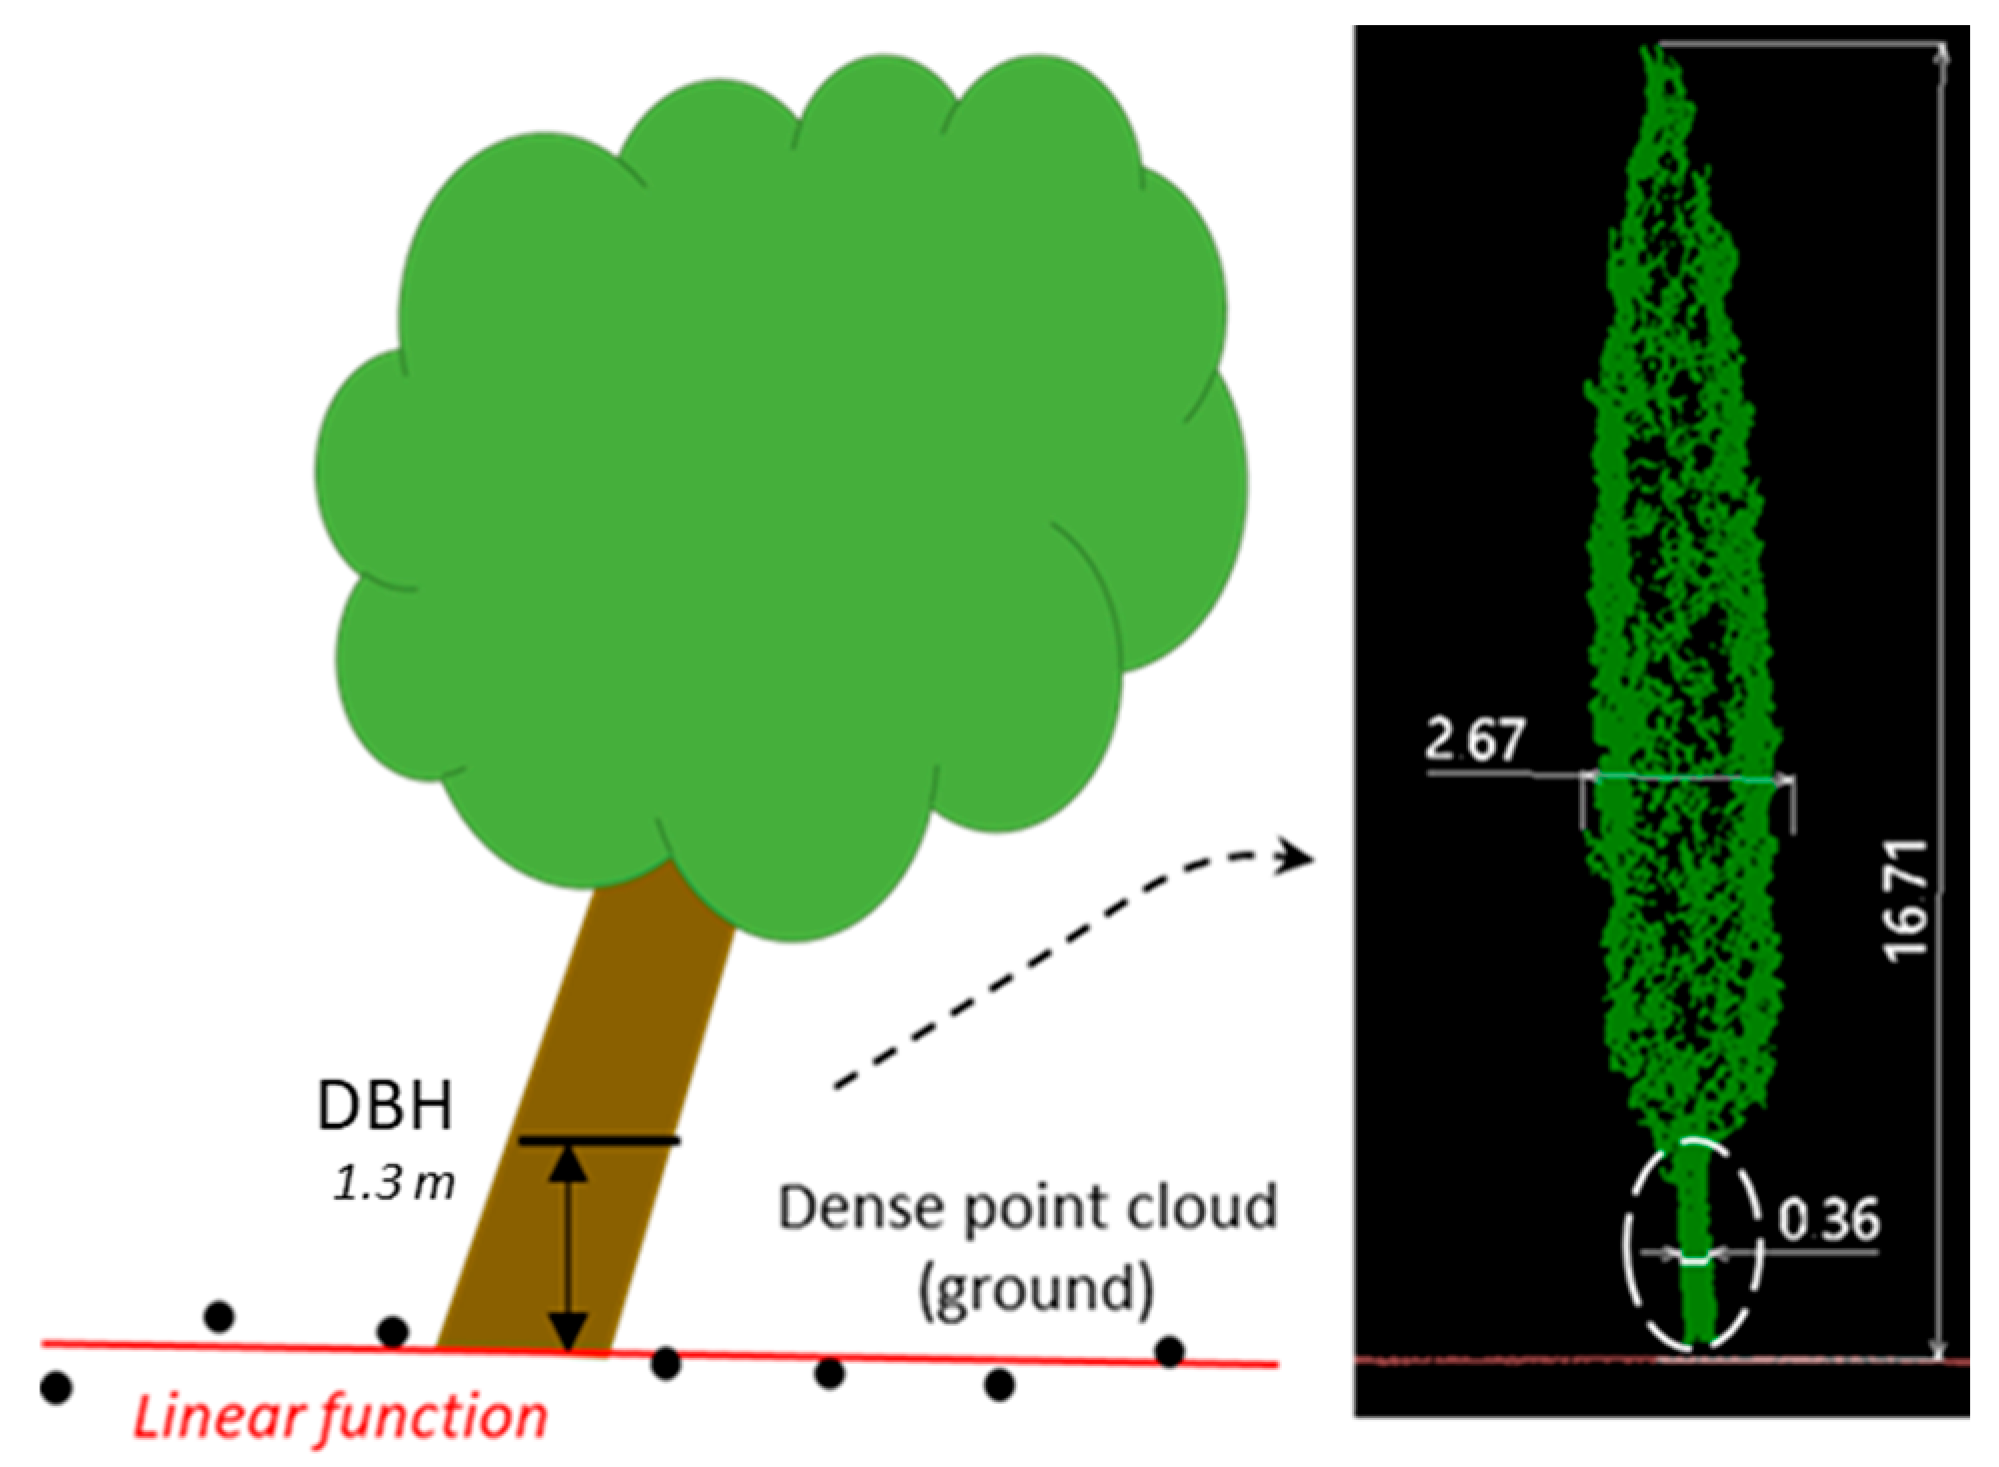
The process of ‘cutting’ a tree at a height of 1.3 m and calculating the DBH was conducted using the Measure Trunk Diameters tool. This tool measures DBH from a dense point cloud by fitting a circle to the points. All points in Class 15 were selected based on the specified height of 1.3 m. The Diameter parameter defines the formula used to calculate the DBH, while the Tolerance parameter determines the allowable percentage deviation of the fitted circle from the actual points. A tolerance of 30% was applied to account for the irregular shapes of many trunks, with higher tolerance improving the output results. Based on these parameters, the software isolates the trunk at the specified height and calculates its DBH. The algorithm that ‘cuts’ a tree at a height of 1.3 m operates based on the principles of a linear function. It calculates the mean value of the ground model to determine the trunk height, accounting for tree inclination (Figure 5).
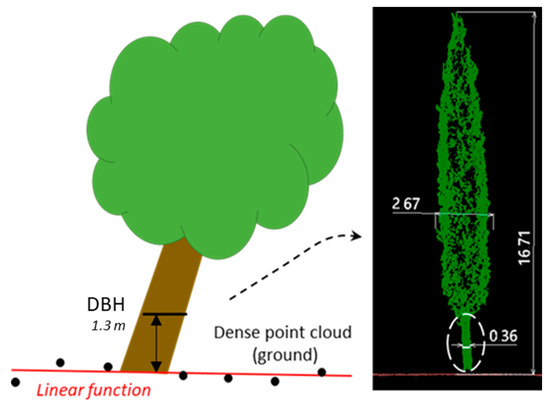
Figure 5.
Derivation of trunk height in Spatix.
In addition to the DBH data obtained using the Measure Trunk Diameters tool, tree height data were acquired using the Output Tree Cells tool.
2.2.3. ULS Data Processing in CloudCompare (CC)—Semi-Automatic Workflow
CloudCompare (CC) is an open-source 3D software designed for the processing of dense point clouds. Due to its numerous, extensive features, CC has been extensively used for a wide range of applications [39,40,41,42]. Within this research, the processing in CC involved seven steps. The first step (1) included the extraction of ground and off-ground models using the Cloth Simulation Filter (CSF). Due to the low vertical relief dissection of the terrain, the Flat scenario was employed. The next step (2) involved defining the parameters for Cloth resolution, Max iterations, and Classification threshold. The Cloth resolution was set to 100, the maximum number of iterations was set to 500, and the classification threshold was set to 100. Following the extraction of the ground and off-ground models, the ITS from off-ground model was segmented out (3) using the Connected Components (CC) tool. The Octree Level parameter was set to 8, and the minimum number of points per component was set to 2400. The threshold for the minimum points per component was set to one-tenth of the total number of points in the model. After segmentation, manual extraction (4) was performed for elements (trees) that merged into a single segment. This was done using the Segment tool to separate the joined segments, which were then saved individually in LAS format in the database. The calculation of DBH and TC data using CC semi-automatic process requires additional steps. In contrast to Spatix, which facilitates automatic DBH calculation, this process involved using LAS data format and additional software (ArcMap 10.4). Therefore, after segmenting individual trees, the Filter by Value tool (5) was used. It enables the extraction of point clouds based on a specified parameter, in this case, height. An additional extraction step was conducted by the same tool. The height of 1.2 m was used to obtain a 10 cm thick sample, which would be used for subsequent manual vectorization. The extracted point cloud was saved in LAS format, and a LAS Dataset was created in ArcMap using the Create LAS Dataset tool. This step transformed the 3D point cloud into a 2D vector layer consisting of points. During manual vectorization, the Straight Segment tool (6) was used to outline the circumference of each trunk based on the point pattern. After vectorization, the DBH was calculated and compared with the field survey data measured with TGBM method (7). The DBH parameter in ArcMap was calculated using Minimum Bounding Geometry tool.
2.3. Terrestrial Laser Scanning (TLS)
2.3.1. TLS Data Collection
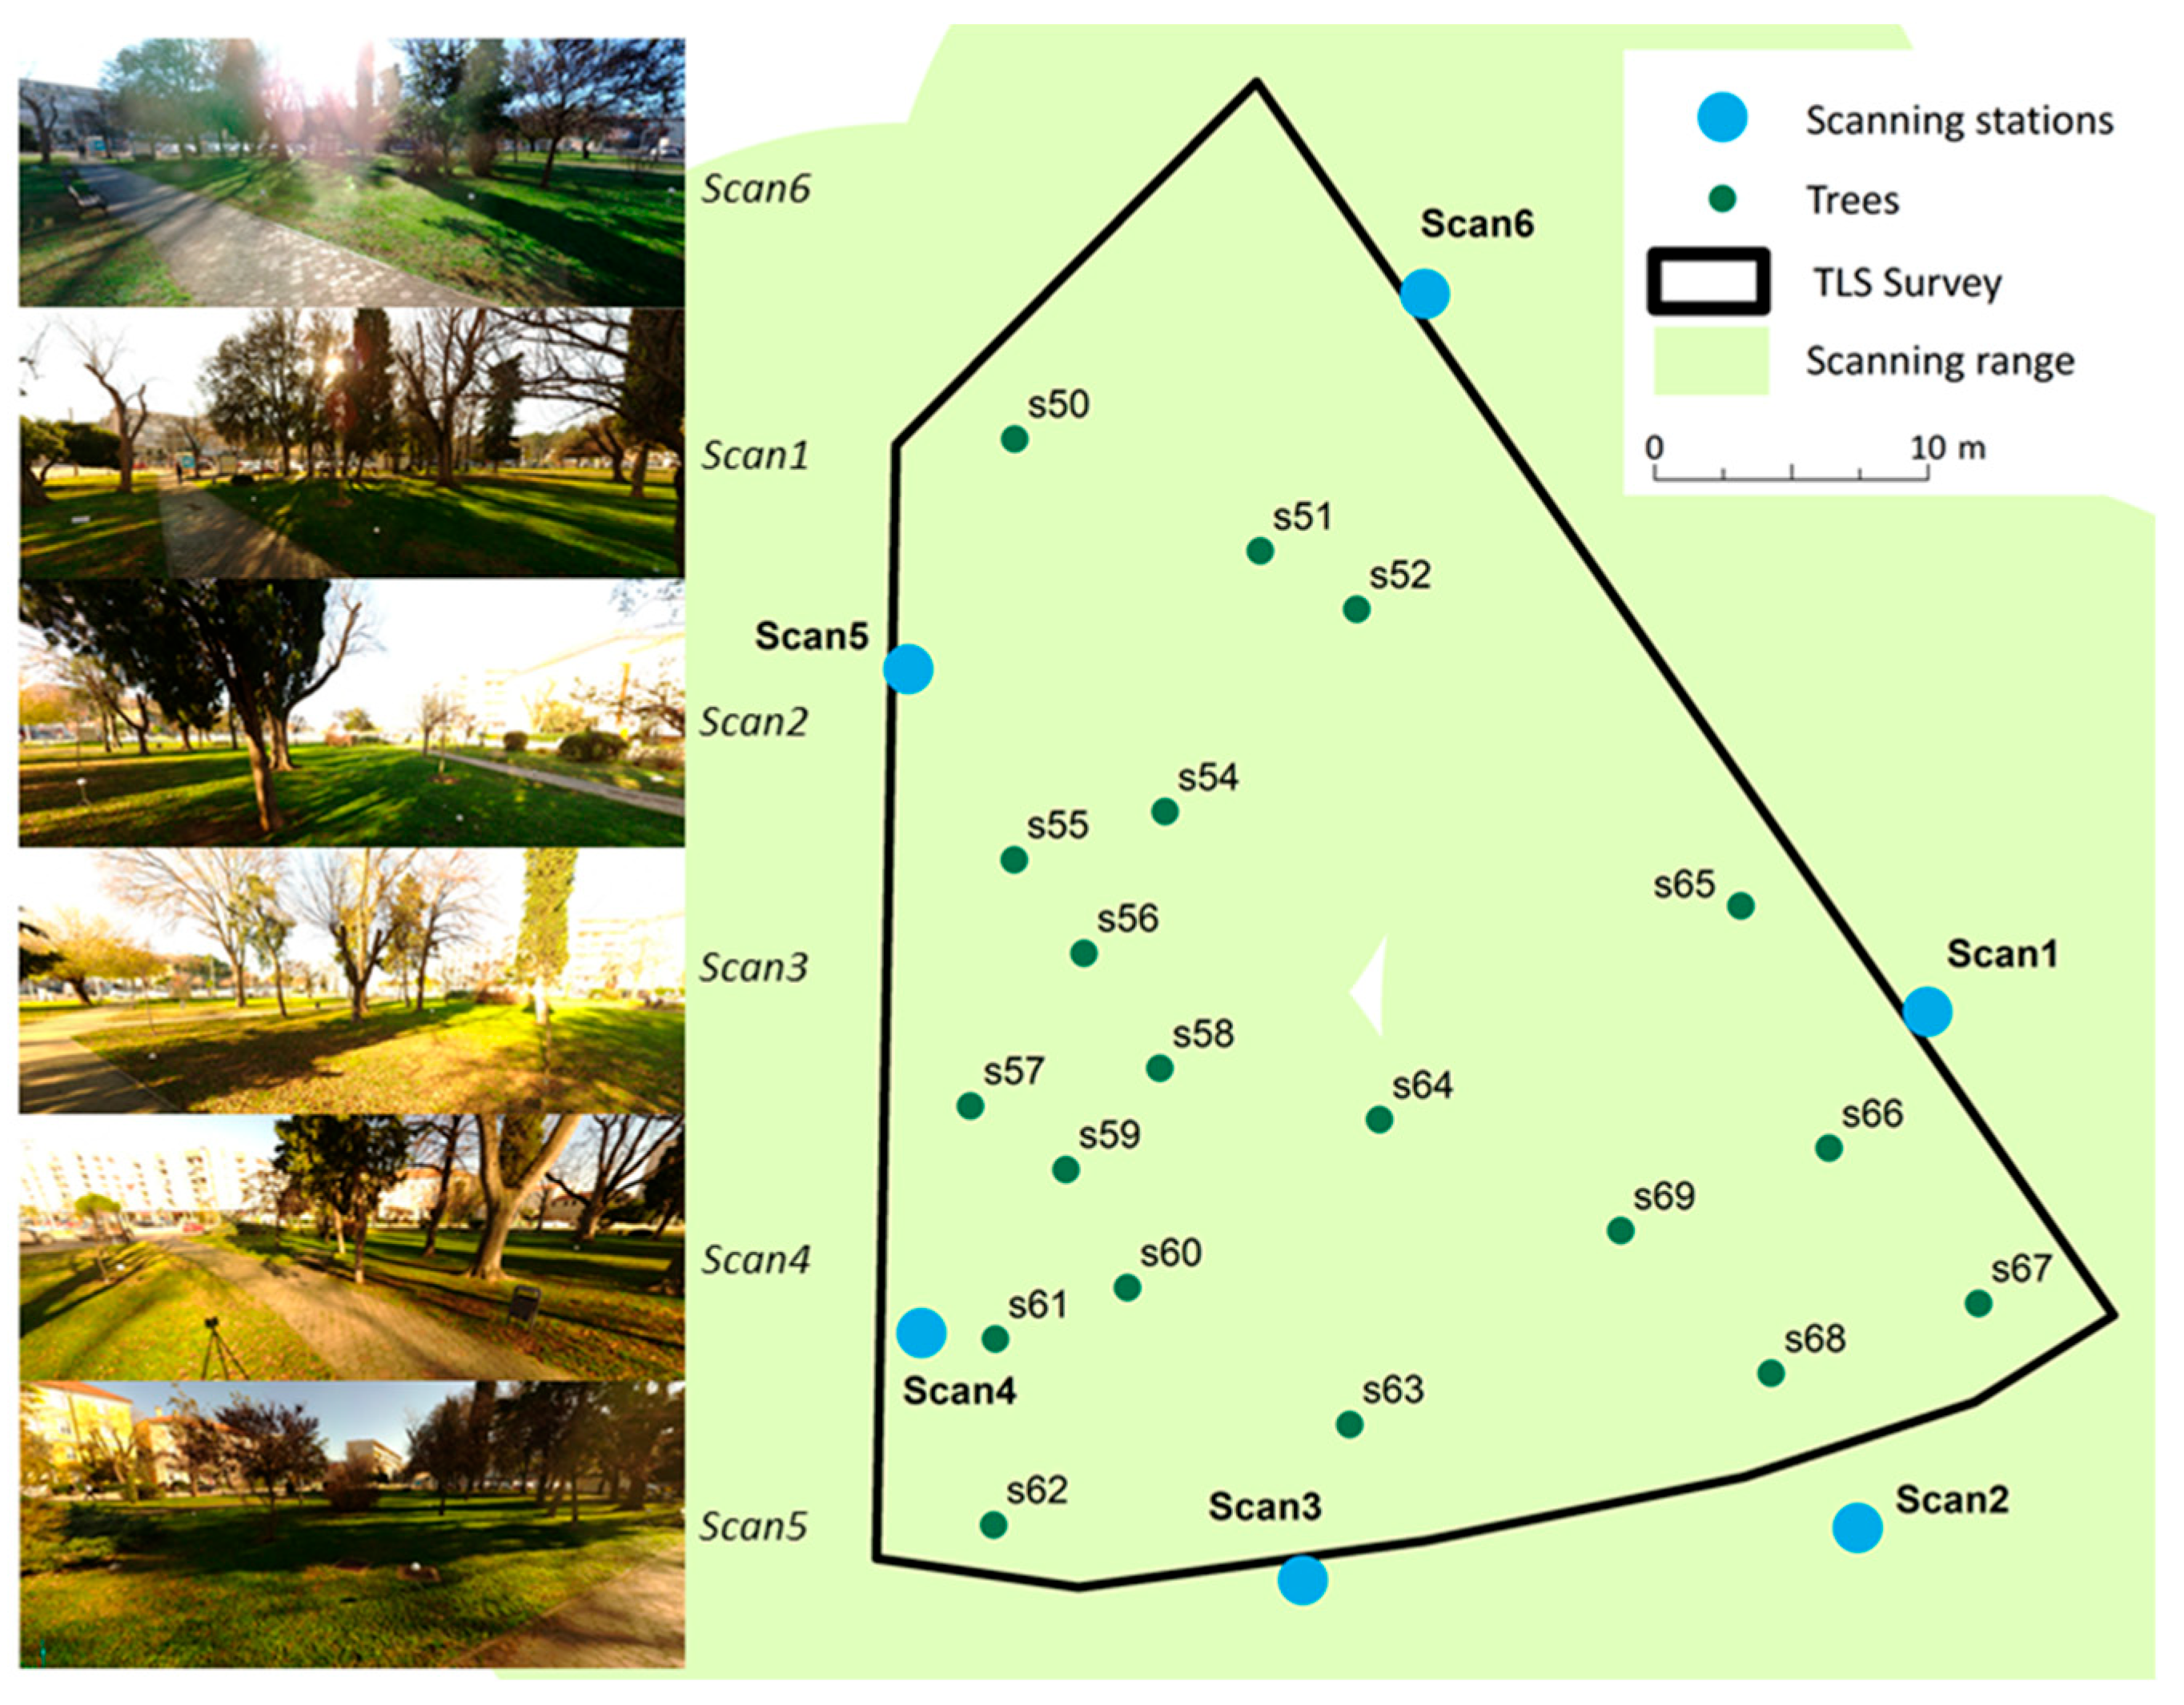
TLS survey of a smaller section area within the park was conducted using Faro Focus M70, a compact and lightweight device designed for capturing precise and detailed 3D data in small to medium-sized areas [43]. Faro Focus M70 has a field of view (vertical/horizontal) of 300°/360°, maximum scanning range of 70 m and measurement speed of 488,000 pts/sec [44]. Five spheres were used to align the scans recorded from different viewpoints. A section of the park was scanned from six positions, i.e., using a multi-scan approach (Figure 6). The user-defined parameters were selected based on prior studies utilizing the same sensor for vegetation surveys [45]. The resolution was set to 1/4, corresponding to a point spacing of 6 mm at a 10 m distance, with a quality setting of 2×. Additionally, the High Dynamic Range (HDR) texture parameter was enabled to enhance data quality. Each scan location required approximately 6–7 min to complete.
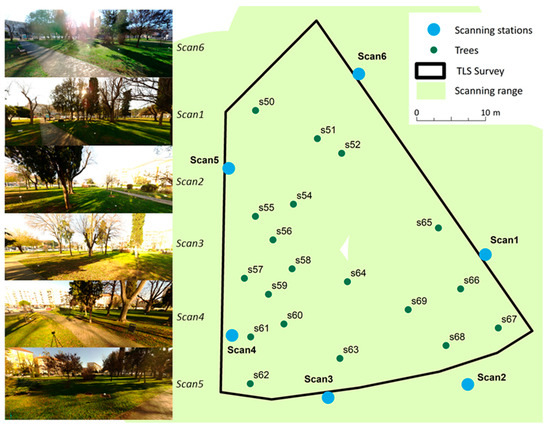
Figure 6.
Location of scanning stations within smaller section of park.
2.3.2. TLS Data Processing
Acquired data were processed in Faro SCENE software. The workflow included following six steps: (1) creating a project, (2) processing individual laser scans, (3) registering the laser scans, (4) assigning coordinates to reference targets, (5) generating point clouds, and (6) exporting the point clouds [45,46].
Firstly, six individual laser scans were added to the project. During processing, the Dark Scan Point Filter, Stray Point Filter, and Edge Artifact Filter were applied to remove artefacts, particularly at the edges of objects. The subsequent step involved the registration of laser scans, which is the most critical phase of data processing, as its accuracy directly impacts the precision of the output model. Due to an insufficient number of connection points on the spheres, these points were manually identified, enabling subsequent automatic registration. GCPs acquired with the Trimble R12i then were integrated into the registered point cloud. Following the point cloud transformation, automatic colour balancing, removal of duplicate points, and homogenization of the final point cloud were conducted. The final TLS point cloud was exported and georeferenced in CC based on three GCPs. Table 1 shows scan point statistics from Faro SCENE software for all six scan positions after alignment. The maximum point error was 10.7 mm, mean point error was 8.1 mm and minimum overlap was 37.8%.

Table 1.
Scan point statistics from Faro SCENE software for all six scan positions.
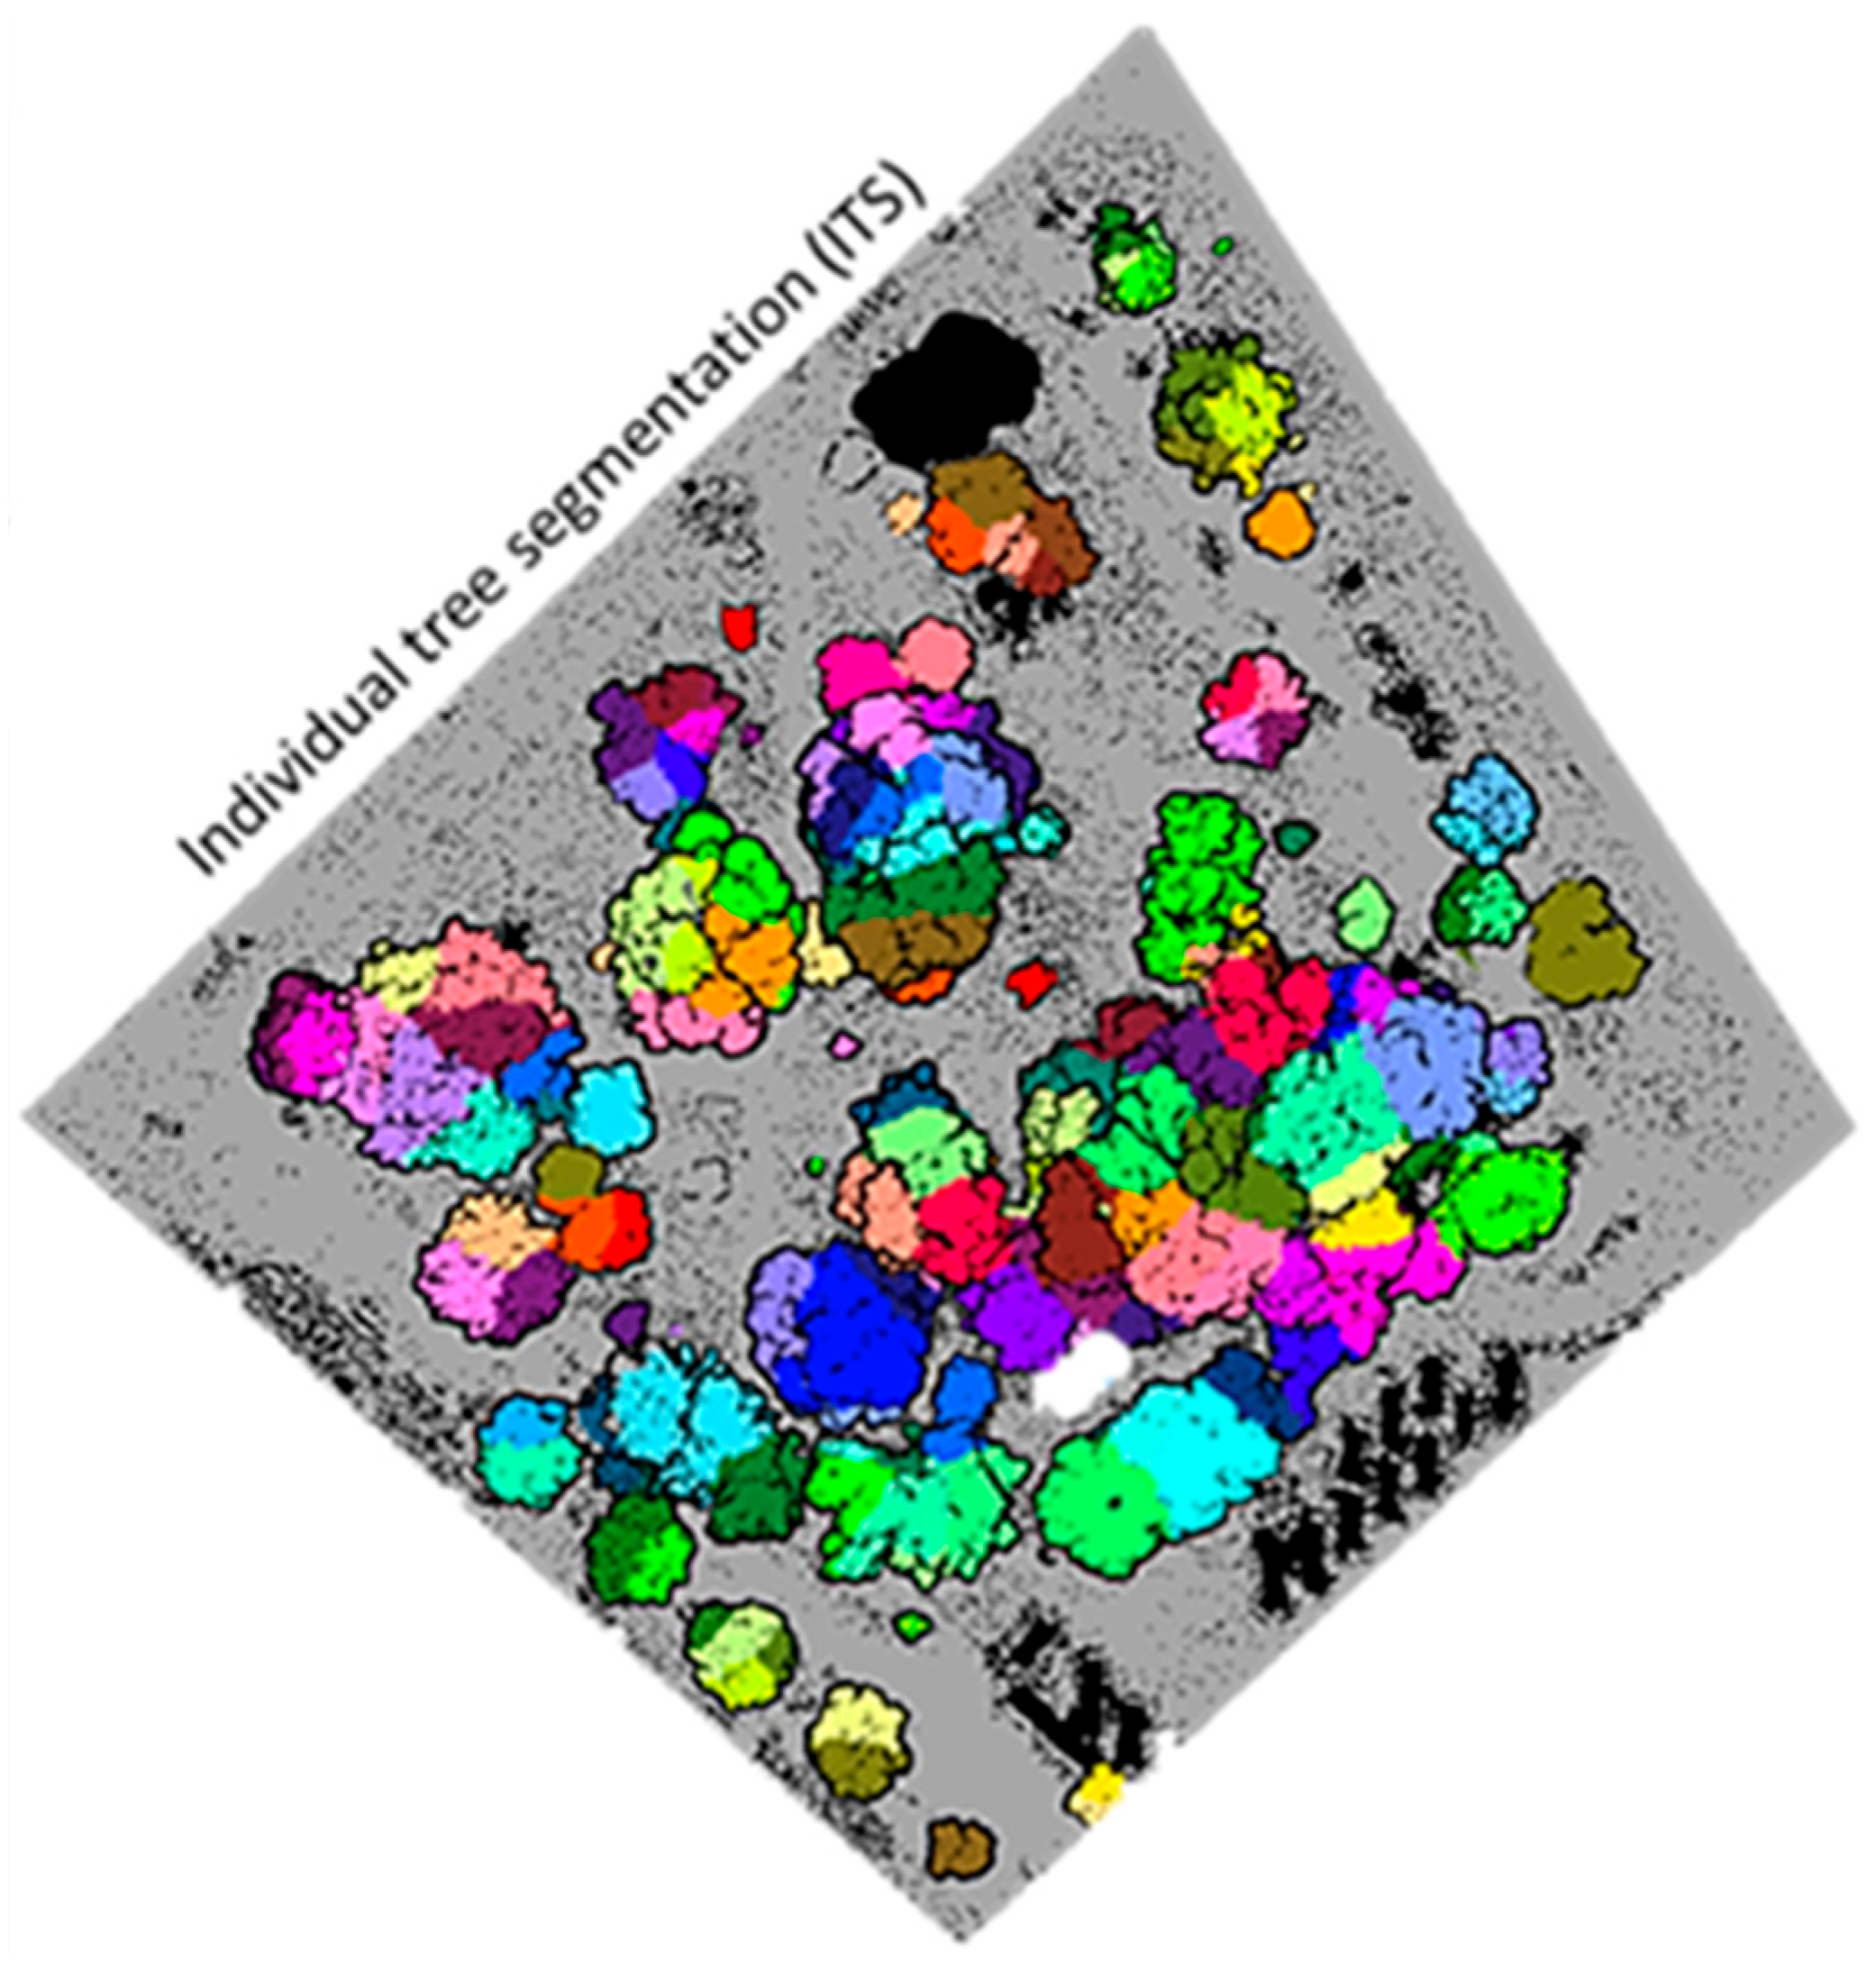
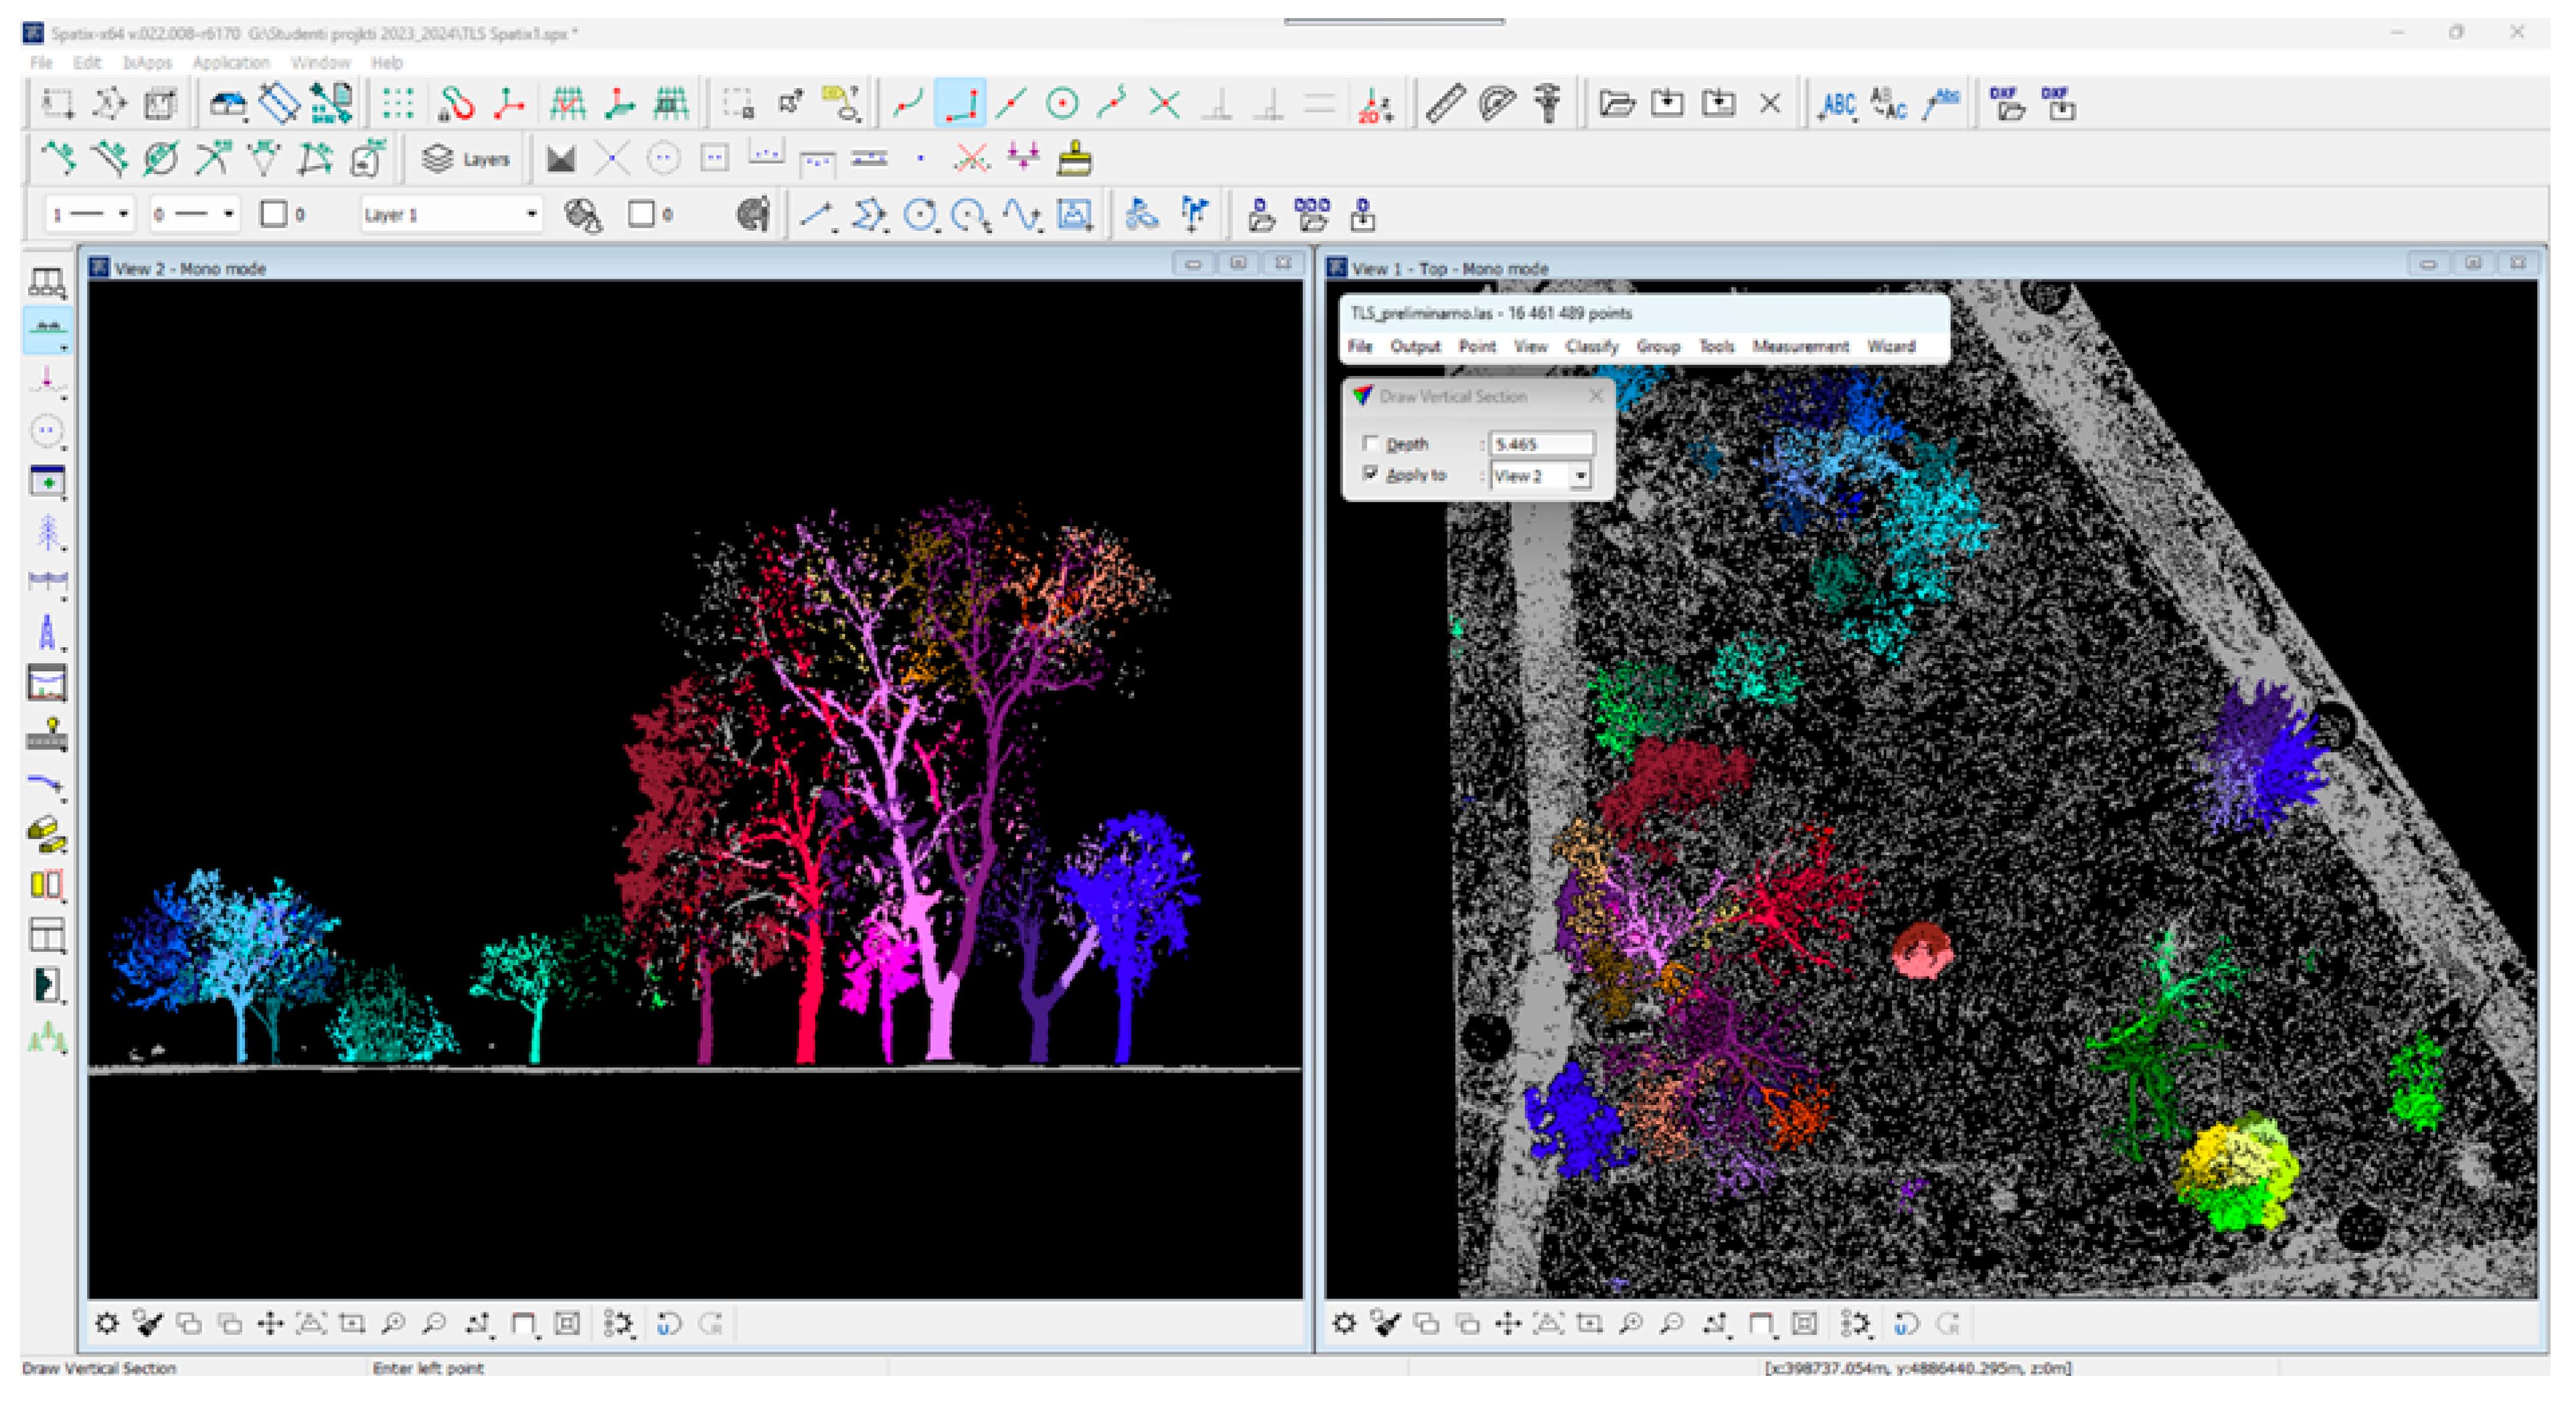
The extraction off-ground model from TLS data followed the workflow described in the TLS section. However, for the off-ground model obtained from the TLS dense point cloud, the number of points per element was set at 900. The segmentation of the TLS data was successfully completed without the need for manual intervention (Figure 7). Tree morphometry parameter derivation from the TLS dense point cloud was performed in Spatix following the same procedure as for the ULS data.
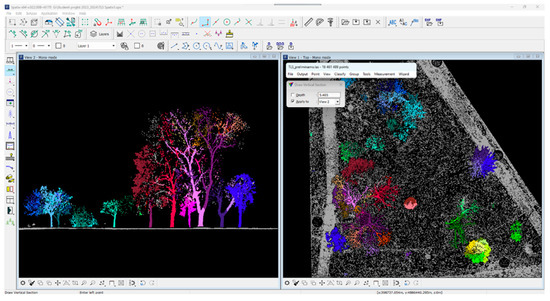
Figure 7.
Individual tree segmentation of TLS dense point cloud in Spatix.
2.4. Accuracy Assessment of Data Acquisition Methods and Software
To assess the accuracy of DBH estimates from both ULS and TLS data, the TGBM method was used as the reference. The accuracy assessment was conducted at two levels: (i) across the entire park area for ULS-derived DBH estimates using both fully automatic (Spatix software) and semi-automatic (CC v2.12.4 (Kyiv)/ArcMap 10.4.1 softwares) processing workflows, and (ii) within a smaller section of the park for both ULS- and TLS-derived DBH estimates using a fully automatic processing workflow only. The accuracy assessment was performed using the following five metrics: (1) Root Mean Square Error (RMSE), (2) Relative Root Mean Square Error (rRMSE), (3) BIAS or mean error, (4) relative mean error (rBIAS) and (5) Standard Deviation (SD). These metrics provide insight into the spread, magnitude, and relative accuracy of the estimations.
where ytrue,i is observed or true value, ypred,i is predicted value, and n is number of observations.
This also refers for mean error (BIAS), from which relative mean error (rBIAS) is derived.
where is each individual value, is mean of the data and n is number of samples.
Also, the correlation coefficient was derived in Excel using CORREL function [47] for selected datasets.
In addition, a comparison was conducted between tree heights obtained from ULS and TLS data, processed using a fully automatic workflow in Spatix software, for the smaller section park area. Since the study lacked a third reference method (e.g., direct measurements using a tape measure or handheld laser of felled tree lengths or number of TLS scan positions sufficient to serve as an uncompromised ground truth) we conducted a quantitative intercomparison of tree height attributes derived from ULS and TLS. Both datasets were processed using the same automatic approach (Spatix software) for a standardized park subsection. Consequently, the analysis focused on pairwise method comparison without designating either dataset as a reference. Three statistical metrics were employed (6) Concordance Correlation Coefficient (CCC)
where: Cov is covariance between datasets X(ULS) and Y(TLS); σ is variance; μ is average.
Additionally, the Bland–Altman analysis which quantifies agreement between two measurement methods (e.g., TLS and ULS) by evaluating: mean bias (systematic error) and (7) Limits of Agreement (LoA) (random error variability) was used. 95% Limits of Agreement (LoA) are calculated following this formula:
where: BIAS is average difference between ULS and TLS measurements; SD is standard deviation of differences and; 1.96 z-score.
(8) Relative difference (%) is used to express how different two measurements are in proportion to their average, and it is calculated following the formula
where: ULS is value from ULS measurement, TLS is value from your TLS measurement, |ULS − TLS| is the absolute difference between the two methods
3. Results
3.1. Level 1 (The Entire Park Area)—Accuracy Assessment of ULS-Based DBH Estimates Derived from Fully Automatic and Semi-Automatic Processing Workflows Compared to TGBM
The number of correctly segmented trees and shrubs using ULS data and tested processing workflows (fully automatic and semi-automatic), i.e., applied software (Spatix and CC), differs. Of the 69 trees and shrubs recorded in the study area using TGBM, Spatix successfully segmented 61 individuals (88.4%), while CC segmented 50 individuals (72.4%). Not all segmented trees were included in the DBH accuracy assessment. Given the focus of this study, shrubs and small, young trees were excluded during data processing. Additionally, due to very high tree density in certain parts of the park and the crown structure of some species, the trunks of some trees lacked a sufficient number of points for reliable DBH estimation. This issue was particularly common with Quercus ilex L. trees, 15 of which were excluded for the analysis. Table 2 shows the general information and descriptive DBH statistics of trees (based on TGBM method) included in the accuracy assessment.

Table 2.
The general information and DBH descriptive statistics of trees (based on TGBM method) included in the accuracy assessment at Level 1 (the entire park area). Number in brackets in the Species column refers to a number of trees of a certain species.
The average ground-truth DBH measured using the TGBM for the 27 analysed trees was 42.41 cm. Corresponding DBH estimates from ULS data were 42.66 cm using Spatix and 45.49 cm using CC. The CC produced significantly higher BIAS and rBIAS values (7.28%) compared to Spatix (0.56%) (Table 3). These results indicate that both methods tend to overestimate DBH on average, with the overestimation being substantially larger when using CC. Although the results above may suggest that Spatix produces more accurate DBH estimates, more advanced statistical metrics indicate the opposite (Table 3). Specifically, CC produced a considerably narrower range of residuals (from −6.71 cm to 11.81 cm) with a SD of 4.15 cm. In contrast, residuals from Spatix ranged from −25.52 cm to 14.52 cm, with a much higher SD of 9.30 cm. Based on RMSE and rRMSE values, CC (12.05%) produced substantially more accurate DBH estimates than Spatix (20.07%). In addition, DBH estimates from Spatix showed a strong positive correlation with TGBM (r = 0.91), while DBH estimates from CC exhibited an almost perfect positive correlation (r = 0.98).

Table 3.
Accuracy assessment statistics of ULS-based DBH estimates derived from Fully Automatic (Spatix) and Semi-Automatic (CC/ArcMap) Processing Workflows Compared to TGBM Method.
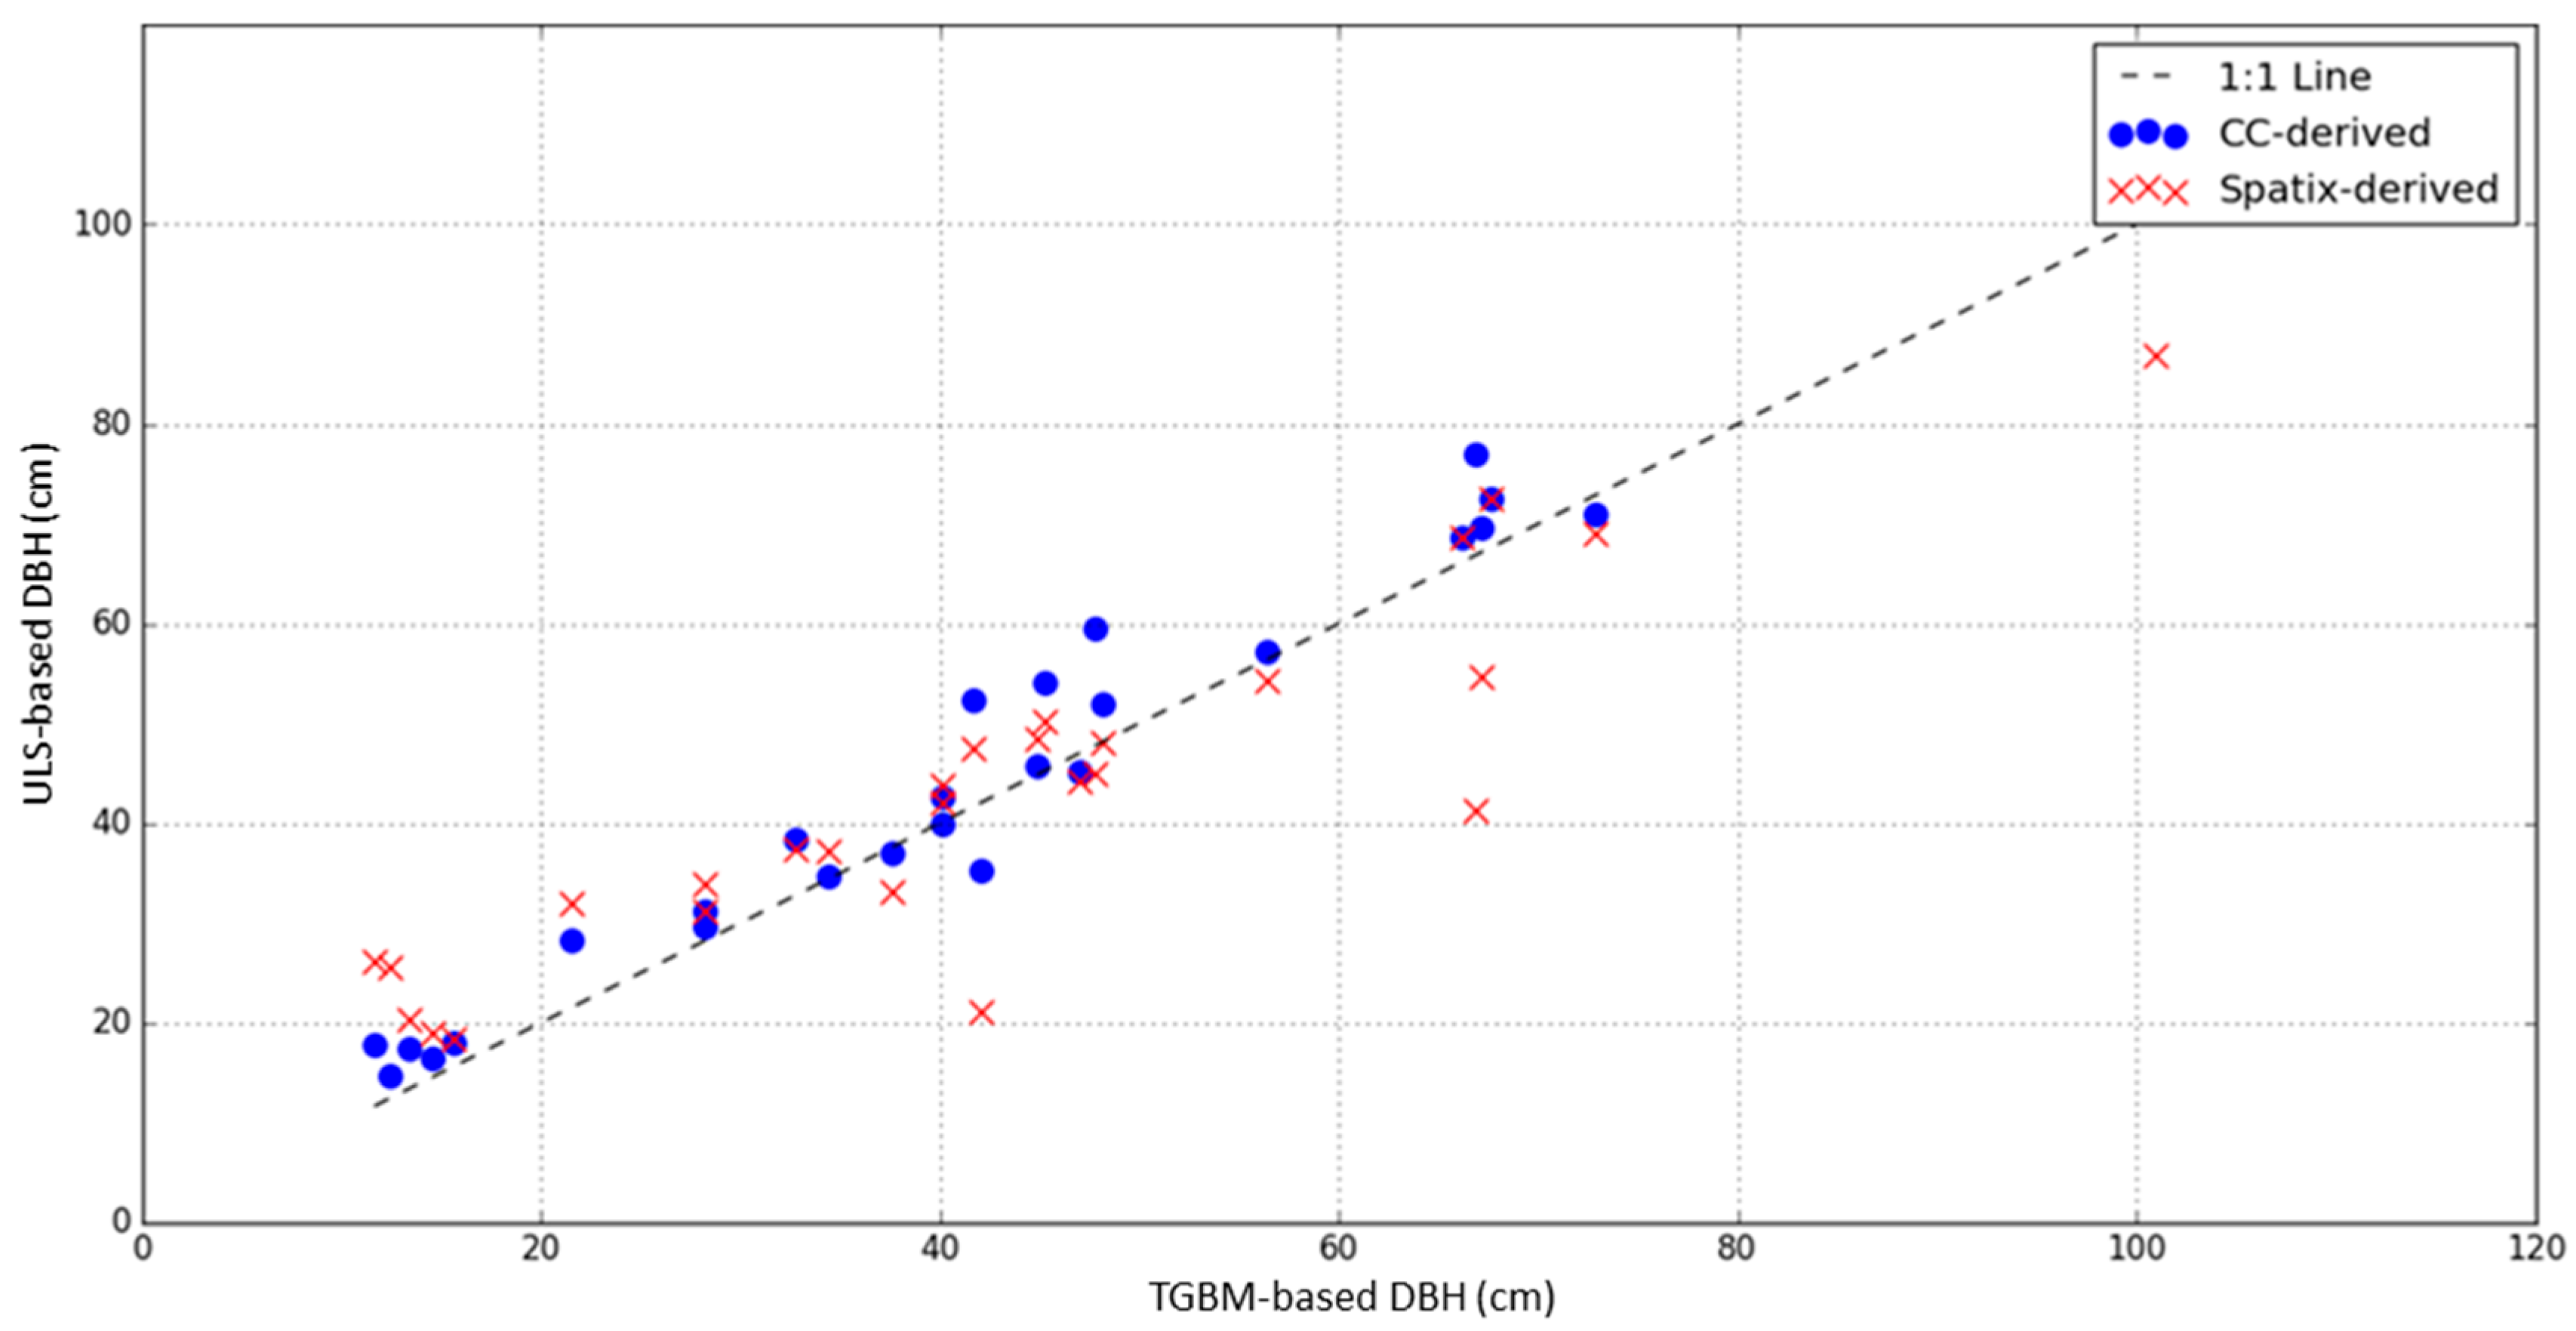
The results of the accuracy assessment (Table 3) are further supported with graphical analyses shown in Figure 8. The scatter plot illustrates the relationship between the TGBM method and DBH values estimated using both Spatix and CC/ArcMap. In both cases, the estimates generally follow the 1:1 line, but the values from CC/ArcMap are more closely aligned with the TGBM reference, whereas Spatix estimates show greater variability.
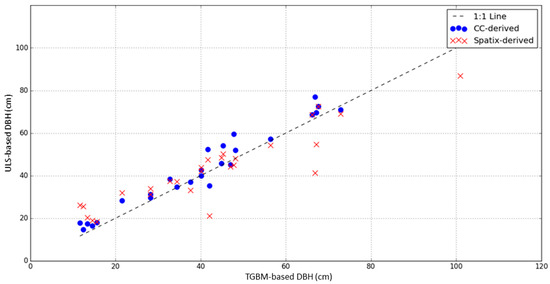
Figure 8.
Scatter Plot of TGBM-derived DBH vs. ULS-based DBH estimates derived from Fully Automatic (Spatix) and Semi-Automatic (CC/ArcMap) Processing Workflows.
The graphical analysis reveals that the DBH estimates from the semi-automatic processing workflow (CC/ArcMap) exhibit a narrower distribution compared to those from the fully automatic workflow (Spatix), indicating a more consistent alignment with the TGBM data. Specifically, the spread of residuals is notably smaller for CC/ArcMap, suggesting less deviation in DBH differences. This is also evident in substantially lower SD, RMSE and rRMSE values for CC/ArcMap indicating reduced dispersion and overall error. However, despite giving lower overall error magnitudes, CC/ArcMap exhibits a systematic overestimation, as indicated by higher BIAS and rBIAS values (as reflected in RMSE and SD). This is evident in the scatter plot, where most CC-derived values fall consistently above the 1:1 line. In contrast, Spatix predictions are more dispersed, with deviations occurring both above and below the reference values. While this results in a lower overall bias, it also indicates higher random error. Visually, this is represented by a wider scatter around the 1:1 line, highlighting Spatix’s tendency to produce larger individual errors, though without consistent directional bias.
3.2. Level 2 (The Subsampled Park Area)
Level 2 of this research focused on the subsampled park area, where, in addition to ULS, TLS data were collected. A total of 18 trees in the subsampled park area were correctly segmented and included in further analysis (Table 4).

Table 4.
The general information and DBH descriptive statistics of trees (based on TGBM method) included in the accuracy assessment at Level 2 (the subsampled park area). Number in brackets in the Species column refers to a number of trees of a certain species.
3.2.1. Accuracy Assessment of ULS- and TLS-Based DBH Estimates Derived from Fully Automatic (Spatix) Processing Workflow: Comparison with the TGBM Method
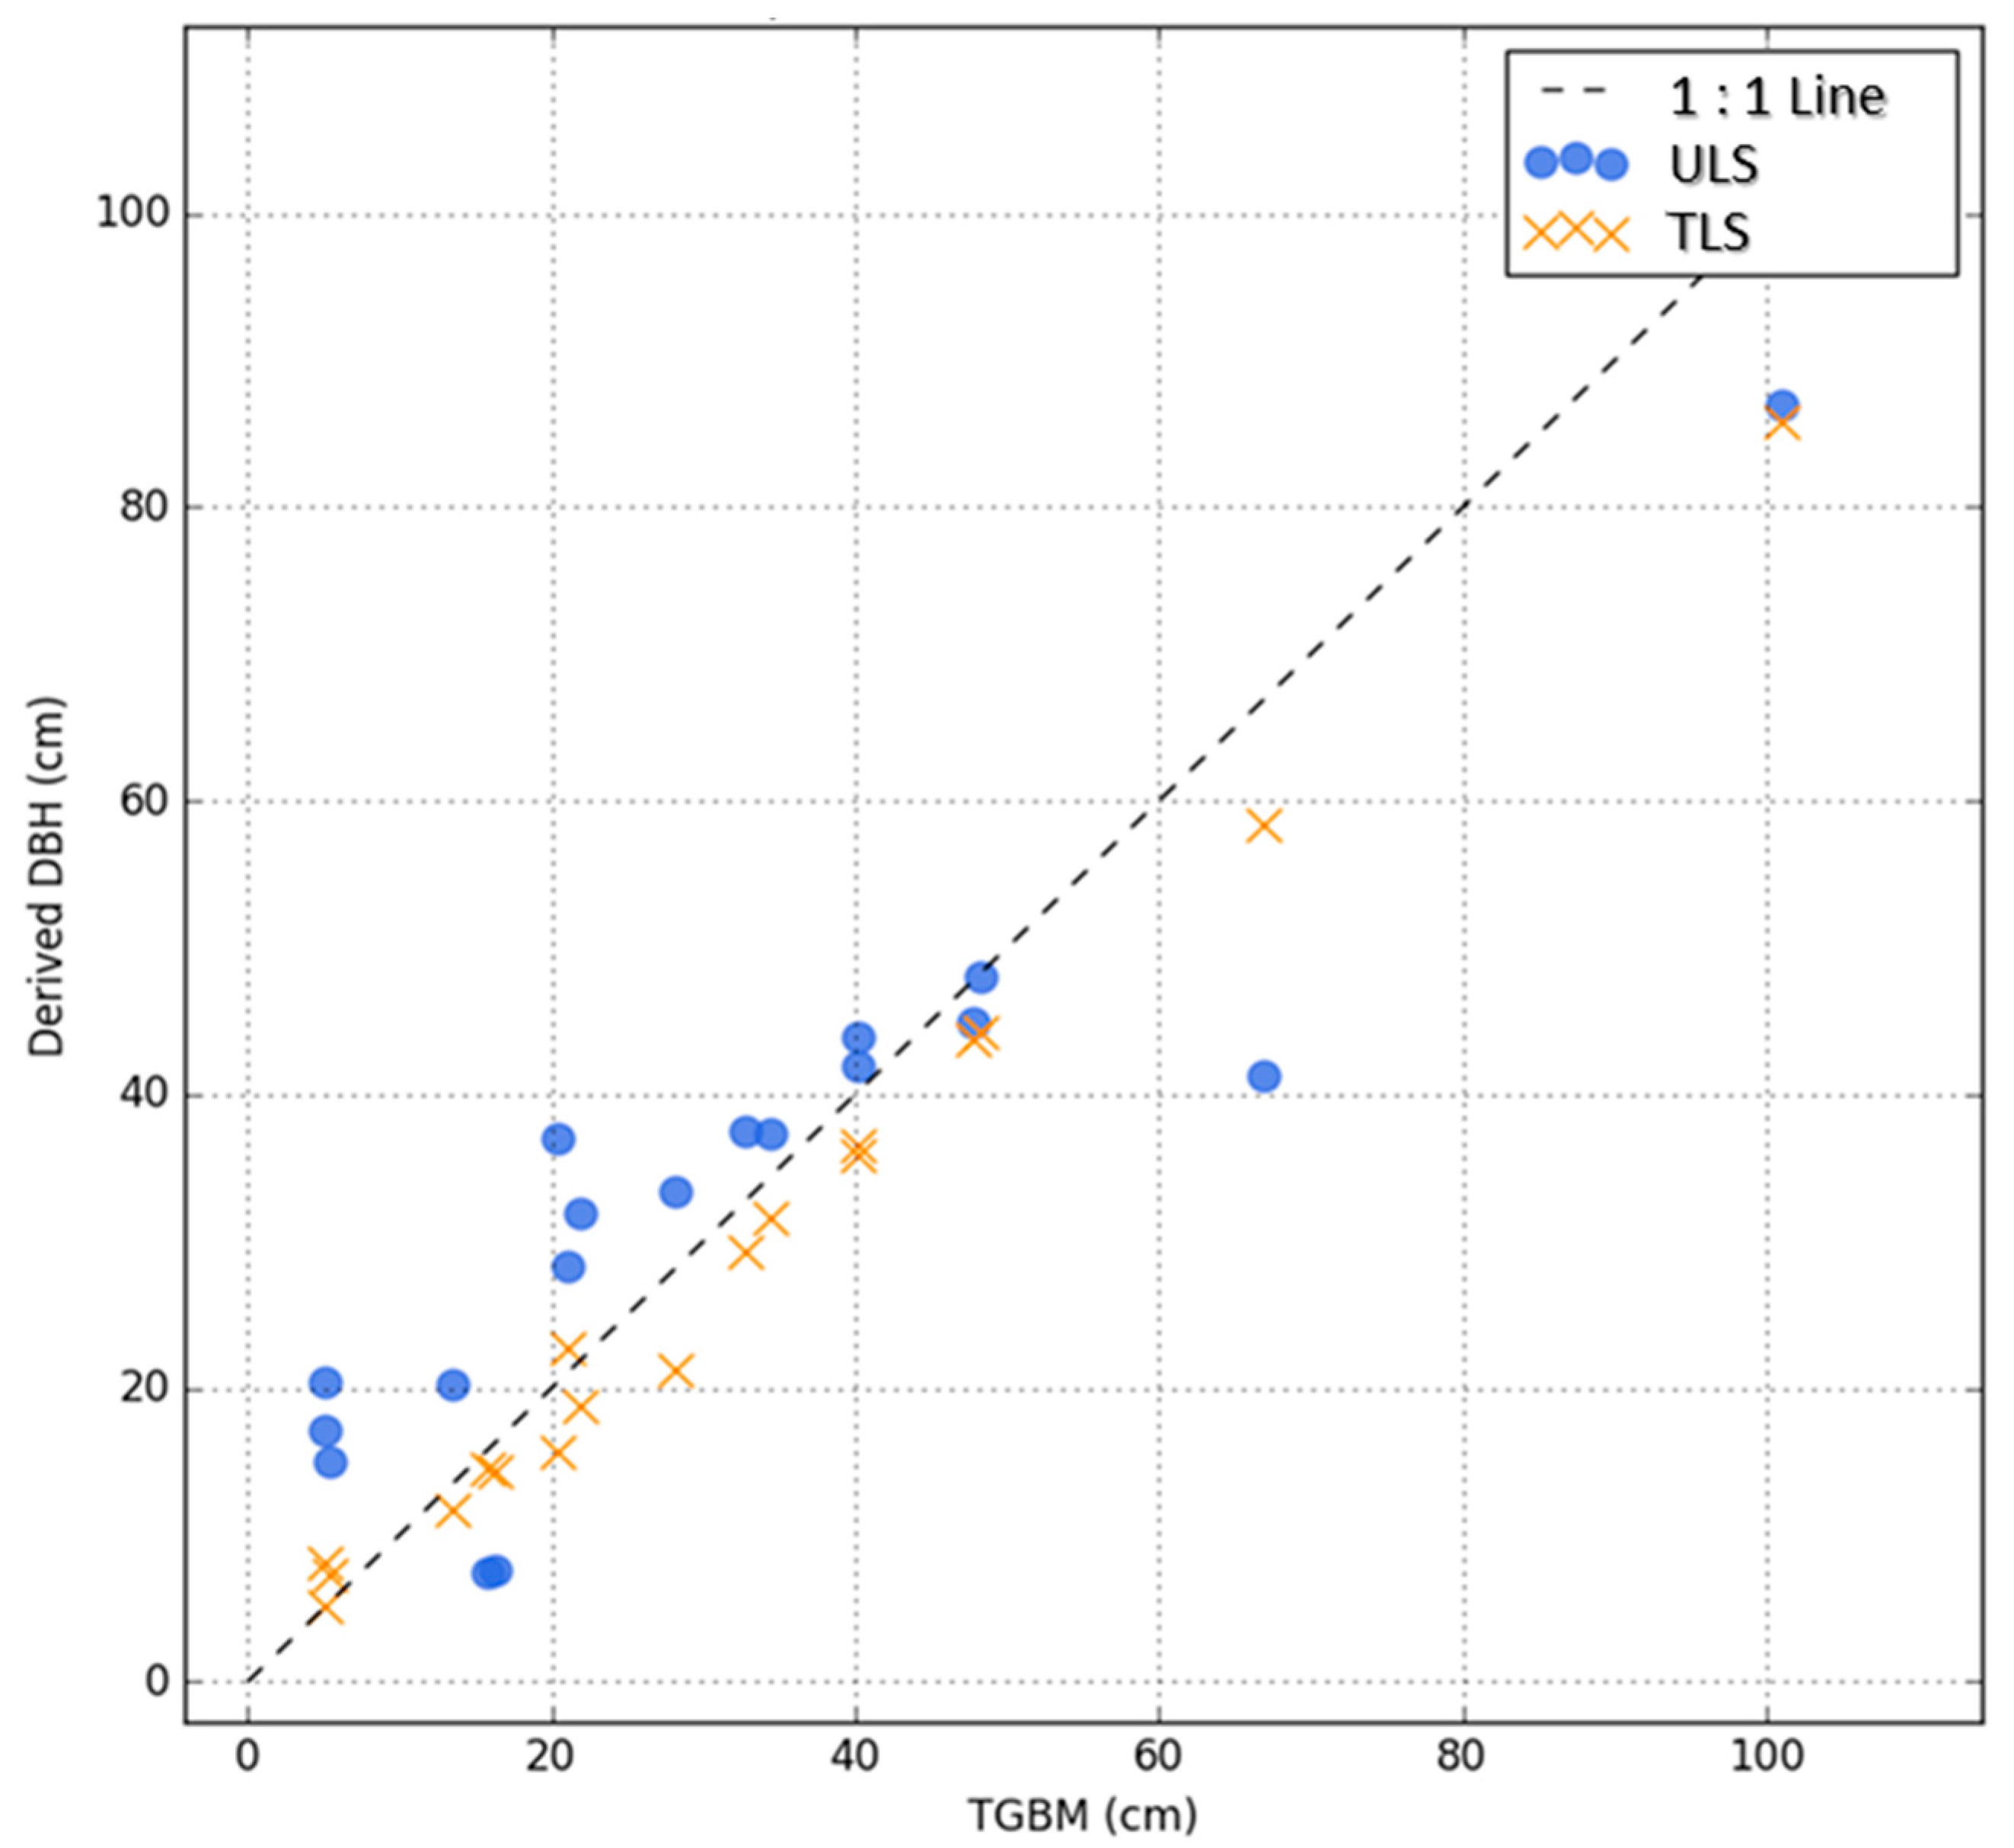
The average ground-truth DBH measured using TGBM method for the 18 analysed trees was 31.31 cm. In comparison, the DBH estimated from ULS data processed automatically using Spatix software was higher, at 33.37 cm, while the DBH derived from TLS data was lower, at 28.08 cm. A detailed accuracy assessment of both ULS- and TLS-based DBH estimates is presented in Table 5 and further illustrated through graphical analyses in Figure 8. Overall, both the statistical metrics (Table 5) and visual comparisons (Figure 8) indicate that TLS data yields more accurate DBH estimates than ULS data. Specifically, TLS residuals ranged from –15.00 cm to 3.00 cm, with a SD of 4.15 cm, while ULS residuals showed a much wider range (–25.60 cm to 16.50 cm) and a higher SD of 10.73 cm. This trend is clearly visible in the scatterplot (Figure 8), where TLS-derived estimates closely align with the 1:1 reference line, whereas ULS estimates display greater variability and several large errors (outliers). Consequently, TLS estimates (R = 0.996) exhibited a stronger correlation with TGBM (R = 0.996), indicating an almost perfect linear relationship, compared to ULS estimates (R = 0.908).

Table 5.
Accuracy assessment statistics of ULS- and TLS-based DBH estimates automatically derived using Spatix software compared to the TGBM method.
Additionally, TLS data achieved substantially better accuracy in terms of RMSE and rRMSE, with rRMSE at 16.51% compared to 33.95% for ULS. Bias metrics (Table 4) revealed that ULS tends to overestimate DBH, with a positive rBIAS of 6.56%, particularly for trees with DBH < 50 cm. This is reflected in the scatterplot (Figure 9), where ULS estimates consistently fall above the 1:1 line with the exception of several estimates that considerably underestimate ground-truth DBH. In contrast, TLS estimates exhibit a negative rBIAS of −10.32%, indicating a general underestimation of DBH. However, these underestimations are smaller in magnitude and visually closer to the 1:1 line than those from ULS, supporting the conclusion that TLS provides more reliable DBH estimates in this context.
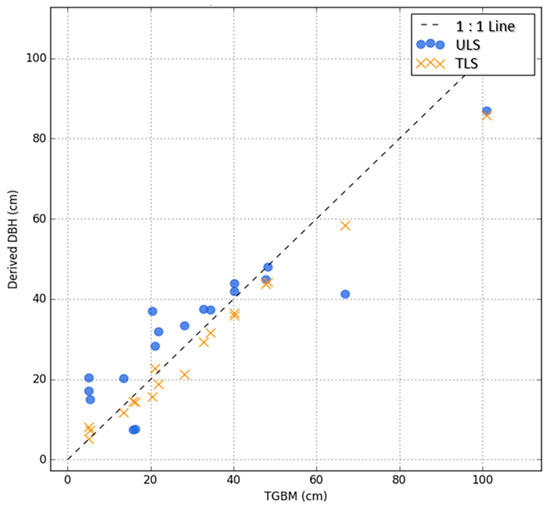
Figure 9.
Scatter Plot of TGBM-derived vs. ULS- and TLS-based DBH estimates automatically derived using Spatix.
3.2.2. Comparison of ULS- and TLS-Based Tree Height Estimates Automatically Processed in Spatix
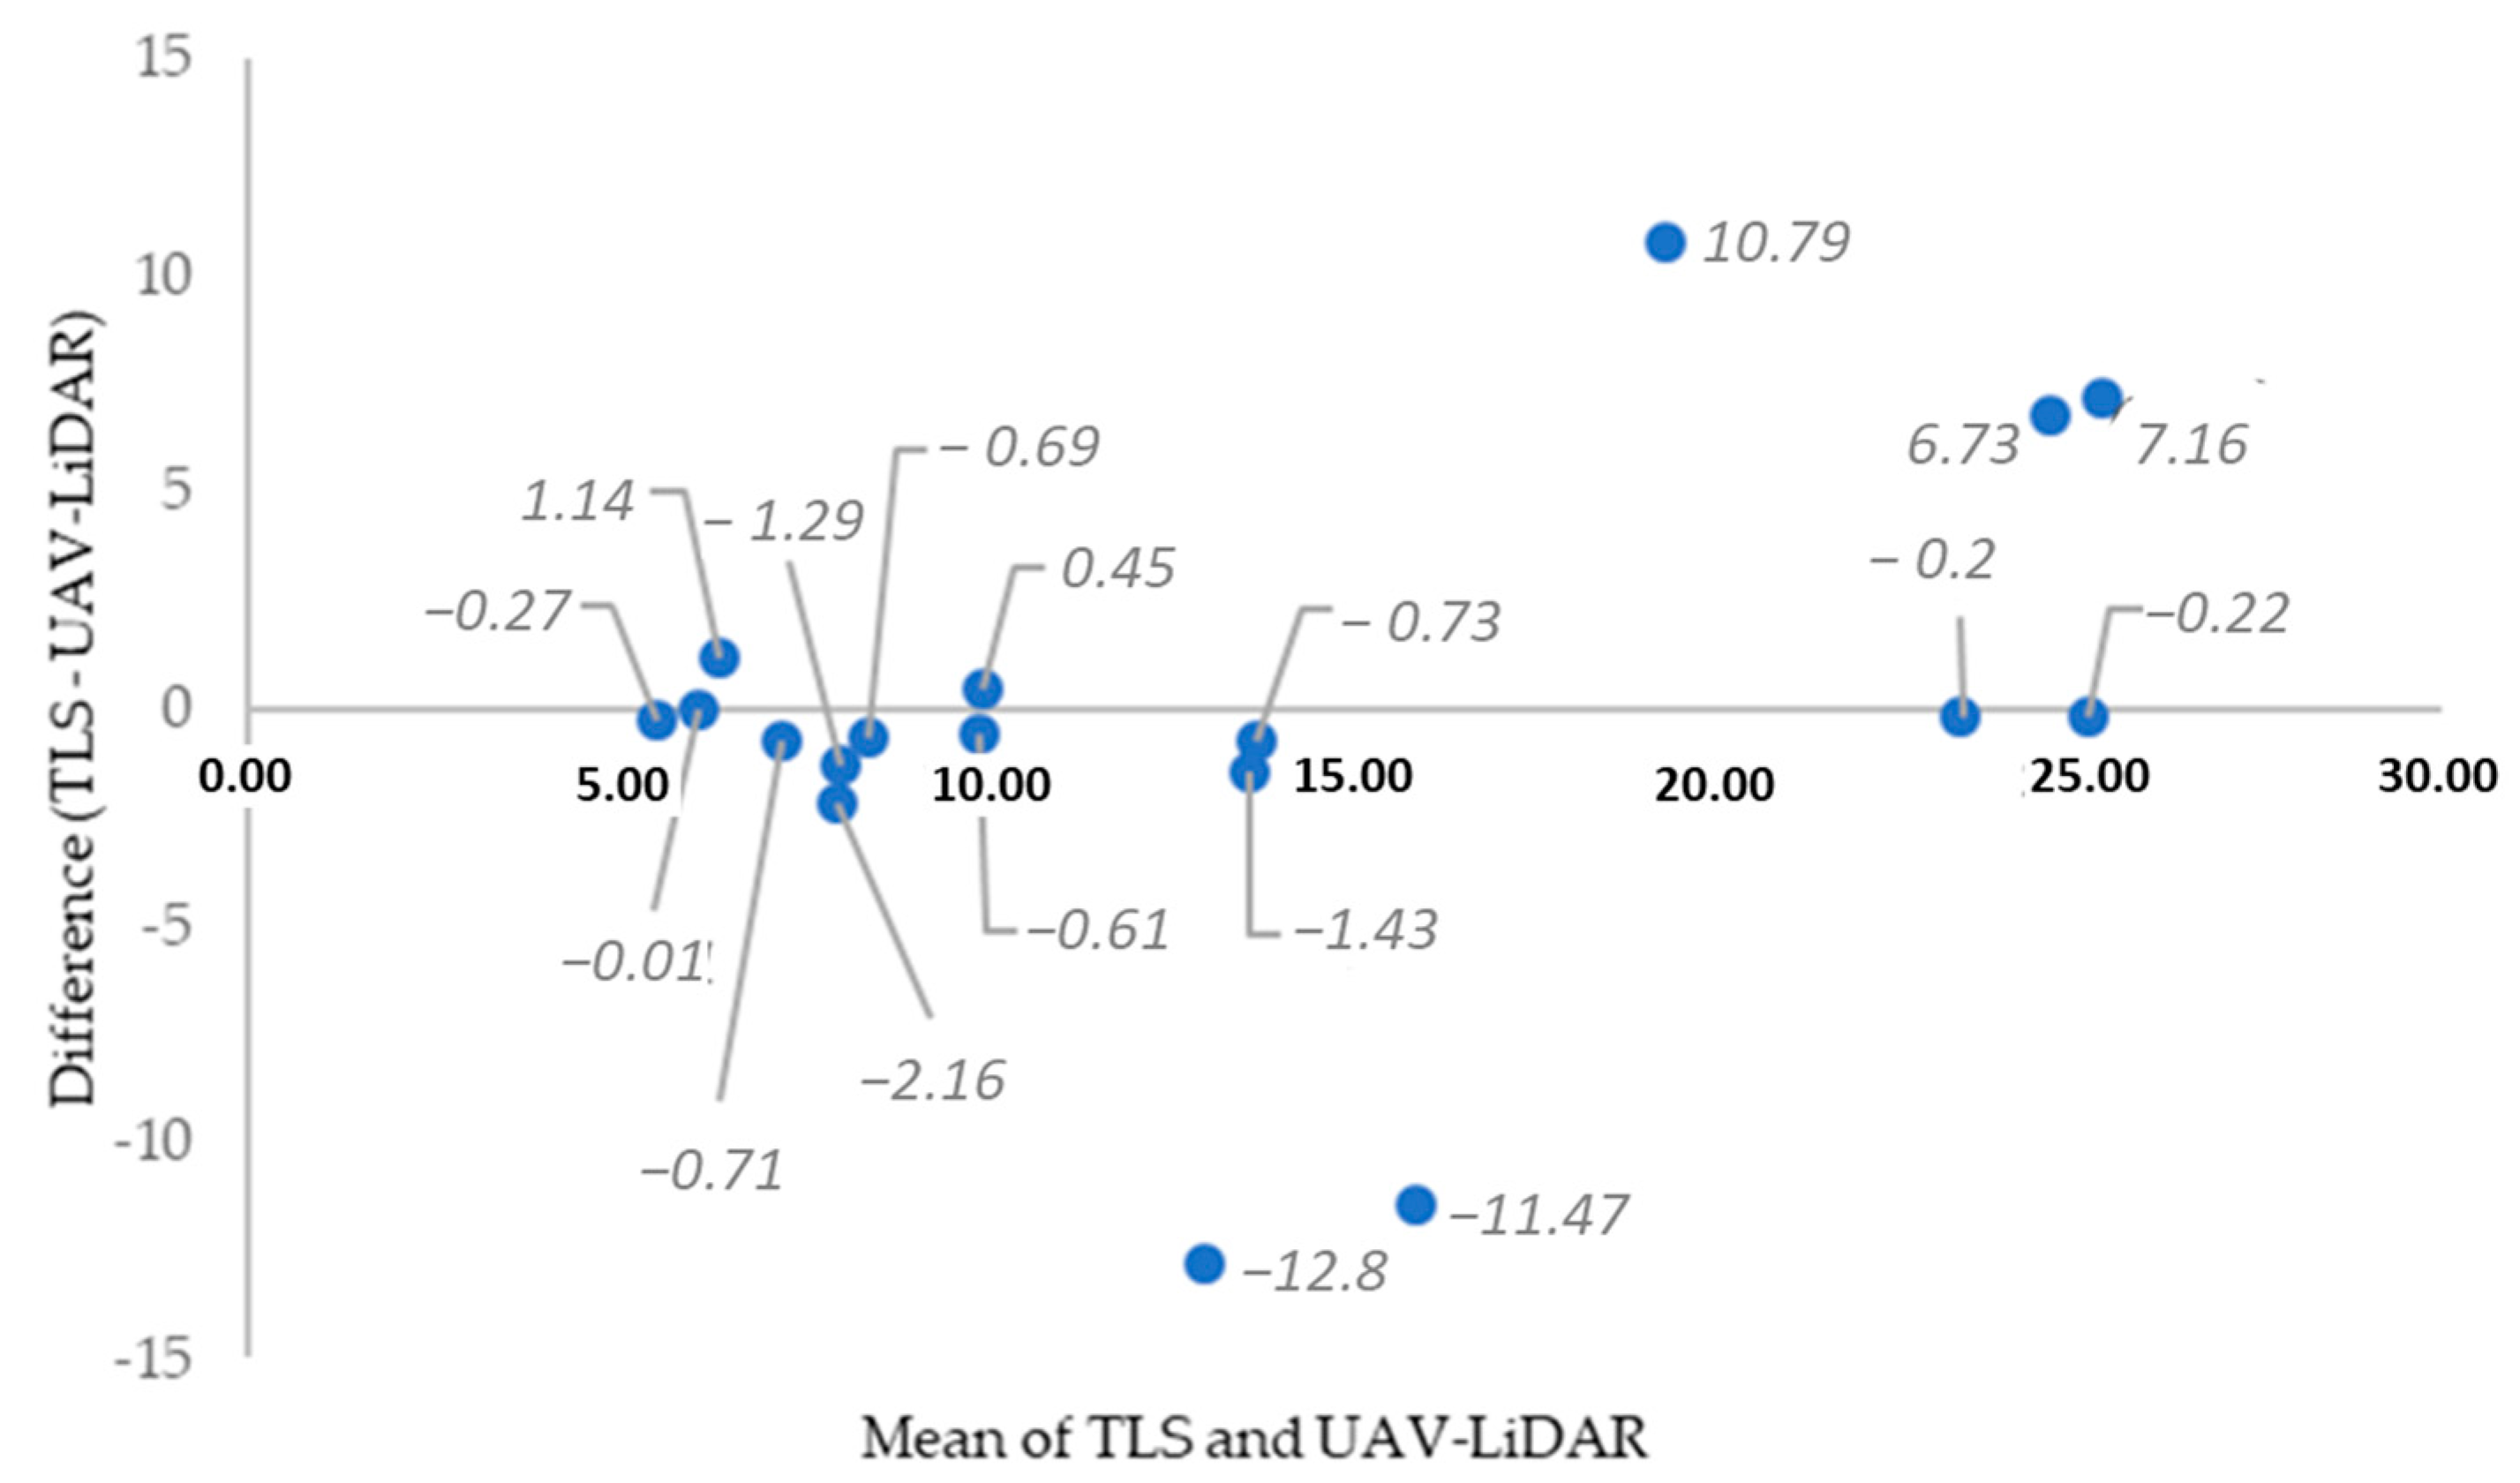
A comparison of automatically derived tree height estimates from ULS and TLS data, using Spatix, was conducted on the same 18 correctly segmented trees used for DBH accuracy assessment (Table 4). The average tree heights estimated from ULS and TLS were 9.29 m and 8.94 m, respectively. ULS estimated tree height had SD of 4.95 m, while TLS estimated tree height had 5.60 m. ULS and TLS datasets of estimated tree heights showed a moderate positive correlation of 0.46 and Concordance Correlation Coefficient (CCC) of 0.45. Based on Bland–Altman analysis, mean difference (BIAS) of −0.35, upper LoA (limits of agreement) of 10.47 and lower LoA of −11.17 were calculated.
The BIAS of –0.35 indicates that TLS tends to estimate tree heights slightly lower than ULS on average. The LoA range (from −11.17 to +10.47) suggests that in most cases (95% of them), the difference between TLS and ULS will fall within this range. However, this wide range (~21.64 m) reflects large variability, again pointing to potential outliers or mismatched measurements (Figure 10).
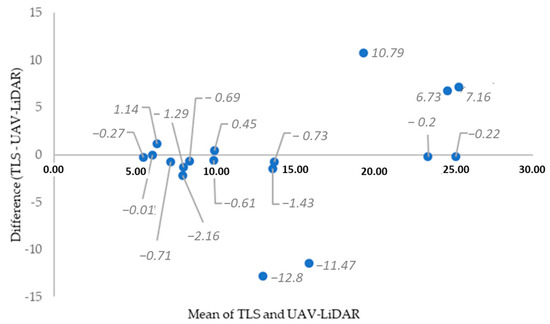
Figure 10.
Bland–Altman plot (TLS and ULS derived tree heights).
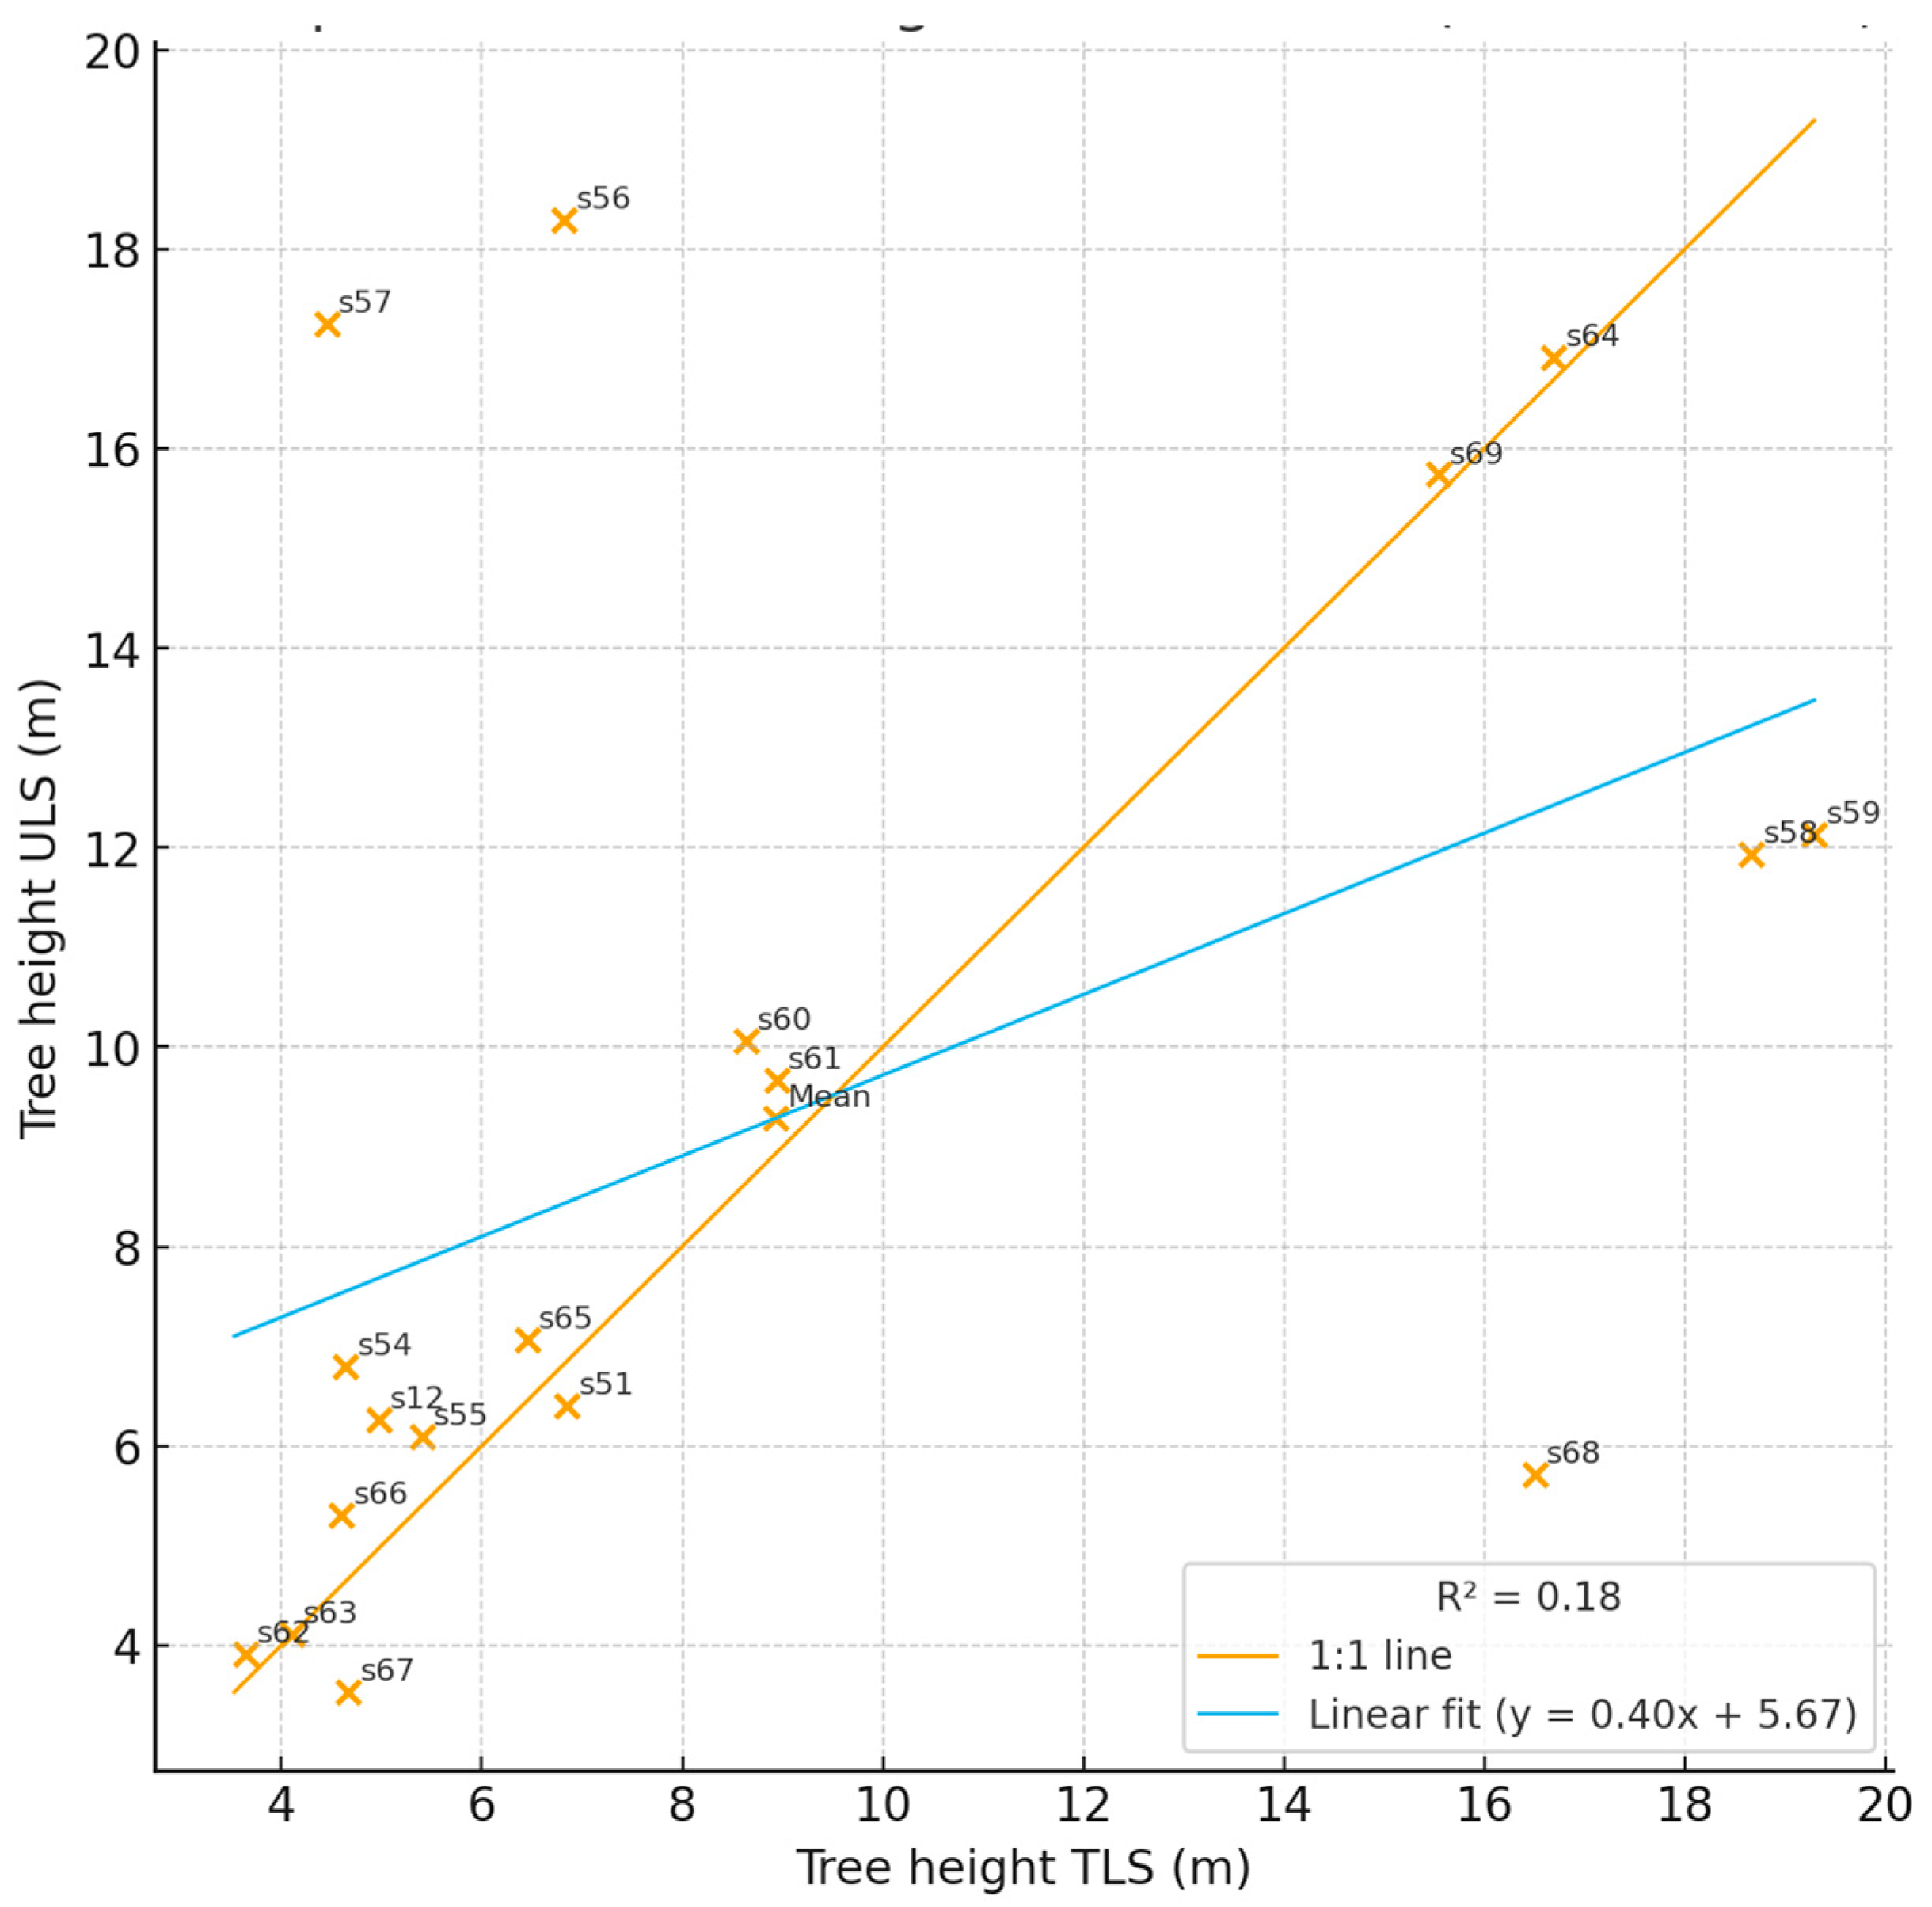
Figure 11 shows the comparison of tree heights measured using TLS and ULS methods. The coefficient of determination (R2) is only 0.18, indicating that TLS explains just about 18% of the variability in ULS-derived heights. In general, TLS tends to have lower height estimates compared to ULS (negative TLS–ULS differences are more common). However, in some cases TLS provides higher values, for example, trees with IDs s59 and s58. In many cases, relative differences exceed 10–30%, and for certain trees even more than 30%. The linear fit further reveals that ULS tends to overestimate the heights of smaller trees (intercept = 5.67), while the slope < 1 suggests that this discrepancy diminishes with increasing tree height. Nevertheless, the data are highly scattered, and this pattern does not apply consistently to all trees. Overall, there is only a weak linear relationship between the height estimates obtained by the two methods, with considerable variability across individual cases (see Table A1).
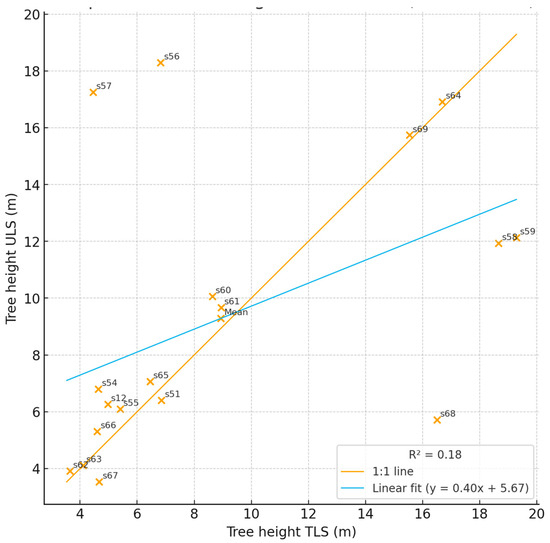
Figure 11.
Scatter Plot of tree height (m) derived using ULS and TLS.
Regarding relative difference (%) metric, samples like s57 (119.34%) and s56 (91.48%) show extreme differences, suggesting potential outliers or measurement errors. s68 (93.18%) is another critical case where TLS ≈ 16.50 m vs. ULS ≈ 5.71 m. While the average relative difference (31.02%) reflects substantial disagreement, this value is heavily influenced by a few stated outliers (Table A1). After identifying and potentially removing extreme cases, the recalculated average metric reflects a more reliable estimate of systematic bias. The ULS and TLS datasets of estimated tree heights showed a very strong positive correlation (r = 0.88), in contrast to the previous case (r = 0.46). The concordance correlation coefficient (CCC) was 0.85, indicating relatively good agreement between the two methods, which is substantially higher than when outliers were included (CCC = 0.46). Based on the Bland–Altman analysis, the mean difference (BIAS) was 0.48 m (on average, TLS measured trees 0.48 m taller than ULS), with upper and lower limits of agreement (LoA) of +5.85 m and −4.89 m, respectively. This represents a much narrower range compared to the values obtained when outliers were included (upper LoA = 10.47 m; lower LoA = −11.17 m). Furthermore, the SD of the differences (TLS–ULS) was 2.74 m, compared to 5.52 m when outliers were included. It is important to emphasize that although the average difference (BIAS) is small and close to zero (0.48 m), individual measurements may still differ by up to ±5–6 m, which is considerable.
4. Discussion
4.1. Comparison of ULS-Based DBH Estimates Derived from Fully Automatic and Semi-Automatic with the TGBM Method
DBH estimates derived from ULS data using two processing workflows, fully automatic in Spatix software and semi-automatic in CloudCompare combined with ArcMap software (CC/ArcMap), were compared against reference measurements using the TGBM method. Most previous studies utilizing CC employed the Random Sample Consensus (RANSAC) plugin, and/or the Poisson algorithm for mesh generation [48,49,50,51]. In this study, the CC workflow included the following steps: Connected Components-Segment-Filter by Value (1.2–1.3 m) followed by manual vectorization using GIS software (Straight Segment). Although ArcMap was used in this case, other open-source GIS tools (e.g., QGIS) can also be applied.
As expected, the semi-automatically derived DBH estimates using CC/ArcMap workflow demonstrated higher accuracy compared to the fully automated Spatix results. This difference can largely be attributed to the manual vectorization step, which introduces human oversight that improves precision, especially in complex and heterogeneous natural environments such as this study area. These findings are consistent with those of [52], who compared automated and manual DBH estimates from ULS data in boreal forests with varying stand complexity. For automated DBH estimation, Ref. [52] reported rRMSE values ranging from 18% to 52% with accuracy strongly influenced by stand complexity. The removal of gross errors significantly improved the performance of the automated method, yielding rRMSE values between 15% and 30%, which were comparable to those obtained through manual estimation.
Several studies have demonstrated the effectiveness of CC in supporting parts of the DBH extraction workflow from both TLS and UAV LiDAR data [53,54,55]. ULS However, this approach is more time-consuming and requires additional software, such as ArcMap, R, MATLAB or QGIS. The comparison between these two approaches reflects a broader trade-off in remote sensing-based forest monitoring: precision versus efficiency. While the CC/ArcMap approach leans toward precision, making it suitable for research or applications requiring high fidelity, the Spatix approach offers greater efficiency and may be more appropriate for rapid, large-scale forest assessments where moderate error is acceptable.
4.2. Comparison of ULS- and TLS-Based DBH Estimates Derived from Fully Automatic Processing Workflow with the TGBM Method
A comparison of automatically derived DBH estimates using Spatix software from ULS and TLS data yielded expected results; i.e., TLS data (rRMSE = 16.51%) provided substantially more accurate DBH estimates than ULS data (rRMSE = 33.95%). These findings are consistent with previous studies that directly compared TLS and ULS for DBH estimation [17,52,56]. In general, these earlier studies reported higher DBH estimation accuracy for both TLS and ULS compared to the present study. Specifically, rRMSE values ranged from 2.5% to 13% for TLS, and from 7.2% to 52.0%, or from 7.2% to 30.0% after removing gross errors, for ULS [52].
The slightly lower accuracy observed in this study for both technologies is likely due to the highly heterogeneous vegetation structure in the study area, characterised by high species richness and significant variability in tree and shrub attributes and spatial distribution. Additional factors affecting the ULS estimates include the relatively high flight altitude and the limitations of the sensor used (DJI Zenmuse L1), which reduced the number of laser returns reaching the lower canopy. As a result, the point density around tree stems, particularly for small or narrow trees, was insufficient, leading to overestimated DBH values. This overestimation was most evident in trees with DBH < 50 cm, and especially pronounced in those with DBH < 10 cm, where several gross errors (outliers) were recorded.
Similar trends have been reported in the literature, where ULS often overestimates DBH [17,52,56], whereas TLS data typically results in slight DBH underestimation [17,57]. However, as confirmed in this study, TLS-derived DBH estimates tend to show less variability and fewer gross errors compared to ULS. The consistent underestimation observed in TLS data is a multifactorial issue influenced by instrumentation limitations [58,59], scanner setup [60,61], algorithm limitations [62], environmental conditions [57,63], occlusion effects [64], tree characteristics [65,66], etc. For the study area analysed in this research, the accuracy of TLS-derived DBH estimates could be improved by optimising scan setup, i.e., by increasing the number of scan positions and ensuring better spatial distribution. These adjustments would enhance stem visibility and reduce occlusion effects. Additionally, employing higher-performance TLS instruments or experimenting with more advanced DBH extraction algorithms and processing software may further improve accuracy.
4.3. Comparison of Automatically Derived ULS- and TLS-Based Tree Height Estimates
A quantitative intercomparison of automatically derived tree height estimates using Spatix [67] from ULS and TLS data was conducted for the subsampled park area, revealing key differences.
The mean difference (bias) of 0.35 m between ULS and TLS data confirms that TLS tends to estimate tree heights slightly lower than ULS. This aligns with previous research findings, which reported that TLS often underestimates tree height, particularly in complex forest structures or in areas with dense understorey vegetation that obstruct a clear line of sight to the canopy top [47,58]. SD values for both datasets also reflect differences in estimation variability, with ULS showing a slightly lower SD (4.95 m) compared to TLS (5.60 m), indicating more consistent results across the sample set. In addition, a moderate positive Pearson correlation (r = 0.46) and a Concordance Correlation Coefficient (CCC) of 0.45 between the two datasets suggest that, while the systems are broadly aligned, substantial deviations exist in individual cases. The limits of agreement (LoA) were relatively wide, with a total LoA span of approximately 21.64 m. This large range indicates considerable variability between the two datasets and suggests the presence of outliers or inconsistent measurements in several cases. Analysis of relative difference (%) highlighted several extreme cases (e.g., 91.48%, and 93.18%, and 119.34%), likely caused by poor point cloud coverage from TLS in densely vegetated or structurally complex canopy areas. These outliers significantly impacted the overall statistics, inflating the average relative difference to 31.02%. These findings are consistent with previous studies showing that ULS, due to its aerial perspective, is often more reliable in capturing the tops of tree crowns [68]. In contrast, TLS may struggle to accurately detect tree tops without optimized survey planning, especially in stands with dense understorey or obstructed views. Therefore, while both systems provide valuable insights into forest structure, ULS in this case demonstrates superior capability in accurately capturing tree heights under diverse conditions.
4.4. Future Perspectives
This research highlights the limitations of relying on a single technology or approach for accurate forest inventory, limitations that become especially evident in diverse and structurally complex forest environments.
To address these challenges, we propose the integration of mobile or personal laser scanning (PLS) systems, which utilize Simultaneous Localization and Mapping (SLAM) technology [69,70], with ULS for comprehensive (urban) forest mapping. PLS systems offer mobility and flexibility, enabling rapid data collection and mitigating the drawbacks of static TLS, as well as ULS, which often struggles to capture data beneath dense canopies). When combined, ULS and PLS can create a synergistic solution: ULS efficiently captures large-scale canopy structure, while PLS systems fill in fine-scale structural details from ground level. This hybrid approach significantly improves both the accuracy and completeness of tree geometry measurements. It offers a promising alternative to overcome the inherent limitations of static TLS and traditional forest inventory methods, especially in urban and heterogeneous forest environments.
4.5. Limitations of the Study
This study has few limitations that should be considered when interpreting the results. First, the analyzed sample is modest: DBH accuracy at Level 1 was assessed on a subset of 27 trees, and the paired ULS–TLS intercomparison at Level 2 included 18 trees. Although this design enabled tightly controlled, paired evaluations, it reduces statistical power and may not capture the full variability present in larger urban forests. Second, the TLS acquisition relied on six scan positions, giving mean point errors around 8 mm but relatively low minimum overlaps. Such geometry can leave occlusions around trunks and lower canopy, particularly in heterogeneous, multi-species stands. Increasing the number of scan stations would likely reduce occlusion-driven underestimation and improve trunk reconstruction. Third, some aspects of the ULS setup may have constrained stem sampling. Flights were conducted at 35 m AGL with a DJI Zenmuse L1. Despite high nominal point counts, the effective trunk-level point density under complex crowns was limited, which affected DBH extraction, especially for smaller trees, leading to positive bias and higher dispersion of errors. To standardize processing, segmentation thresholds were intentionally applied that exclude small individuals. While these rules improve the robustness of automated fitting, they also reduce coverage of small trunks and shrubs. Therefore, the results should not be extrapolated to very small DBH classes or to understory elements with short bole sections. Finally, tree height was compared between ULS and TLS without an independent field-based height reference. The absence of a third, uncompromised ground limits the ability to attribute discrepancies definitively to either system. The relatively wide Bland–Altman limits of agreement and the influence of several clear outliers underscore this constraint. Finally, the study area, a small, species-rich urban Mediterranean park, presents both a strength (a challenging, operationally relevant test bed) and a limitation (context specificity).
Taken together, these limitations motivate the future directions outlined in the paper, larger samples across additional parks, denser TLS station geometry, and hybrid acquisitions that combine ULS with mobile/personal laser scanning, to strengthen external validity and reduce method-specific biases in complex urban canopies.
5. Conclusions
This study evaluated the performance of ULS and TLS systems in deriving key tree attributes (DBH, tree height) within a structurally complex, species-rich Mediterranean urban forest park in Zadar, Croatia. First, the accuracy of DBH estimates from ULS data was assessed using both fully automatic and semi-automatic processing workflows across the entire park. Compared to the reference TGBM method, the semi-automatic workflow yielded more accurate results, underscoring the continued value of human intervention in enhancing DBH estimation accuracy, particularly in heterogeneous environments. Second, comparisons between ULS and TLS data were conducted on a subsample of the park. TLS provided significantly more accurate DBH estimates than ULS, whereas ULS demonstrated superior performance in estimating tree height under complex canopy conditions. These findings highlight the respective strengths and limitations of ULS and TLS technologies, as well as those of automatic versus semi-automatic processing approaches, in the context of urban forest inventory. As a future direction, the integration of lightweight, mobile personal laser scanning (PLS) systems, utilizing SLAM technology, with ULS is recommended to enhance data acquisition flexibility and accuracy, potentially offering a more effective solution for comprehensive urban forest mapping.
Author Contributions
Conceptualization, A.Š. and I.B.; methodology, A.Š.; software, A.Š. and K.K.; validation, I.B. and I.M.; formal analysis, I.B.; data curation, K.K. and F.D.; writing—original draft preparation, K.K., I.M. and A.Š.; writing—review and editing, A.Š., I.M. and I.B.; visualization, F.D.; supervision, A.Š.; funding acquisition, I.B. All authors have read and agreed to the published version of the manuscript.
Funding
This research was funded by the European Union – NextGenerationEU under the Recovery and Resilience Plan for Croatia (Ministry of Science, Education and Youth), within the project No. 400-01/23-01/6-1 “Establishment and development of the Laboratory for Remote Research and Geoinformation in Forestry and Environment (LabDIG).
Data Availability Statement
The data that support the findings of this study are available on request from authors.
Acknowledgments
The research was conducted with the help of Center for Geospatial Technologies.
Conflicts of Interest
The authors declare no conflicts of interest.
Abbreviations
The following abbreviations are used in this manuscript:
| TLS | Terrestrial Laser Scanning |
| ULS | Unmanned Laser Scanning |
| PLS | Personal Laser Scanning |
| TGBM | Traditional Ground-Based Measurement |
| CC | CloudCompare |
| SLAM | Simultaneous Localization and Mapping |
| DBH | Diameter at Breast Height |
| SD | Standard Deviation |
| RMSE | Root-Mean-Square Error |
| CCC | Concordance Correlation Coefficient |
Appendix A

Table A1.
Differences of ULS- and TLS-based tree height estimates automatically processed in Spatix.
Table A1.
Differences of ULS- and TLS-based tree height estimates automatically processed in Spatix.
| ID | TLS | ULS | Mean (TLS+ULS/2) | Diff. (TLS-ULS) | Rel. Diff. (∣TLS-ULS∣)/((TLS+ULS)/2) × 100 |
|---|---|---|---|---|---|
| s62 | 3.64 | 3.91 | 5.60 | −0.27 | 7.15 |
| s66 | 4.6 | 5.31 | 7.26 | −0.71 | 14.33 |
| s63 | 4.1 | 4.11 | 6.16 | −0.01 | 0.24 |
| s67 | 4.67 | 3.53 | 6.44 | 1.14 | 27.94 |
| s55 | 5.4 | 6.09 | 8.45 | −0.69 | 12.07 |
| s54 | 4.64 | 6.8 | 8.04 | −2.16 | 37.72 |
| s12 | 4.97 | 6.26 | 8.10 | −1.29 | 23.20 |
| s51 | 6.85 | 6.4 | 10.05 | 0.45 | 6.84 |
| s65 | 6.45 | 7.06 | 9.98 | −0.61 | 8.99 |
| s57 | 4.45 | 17.25 | 13.08 | −12.8 | 119.34 |
| s56 | 6.82 | 18.29 | 15.97 | −11.47 | 91.48 |
| s61 | 8.94 | 9.67 | 13.78 | −0.73 | 7.83 |
| s64 | 16.69 | 16.91 | 25.15 | −0.22 | 1.31 |
| s68 | 16.5 | 5.71 | 19.36 | 10.79 | 93.18 |
| s58 | 18.66 | 11.93 | 24.63 | 6.73 | 43.92 |
| s60 | 8.63 | 10.06 | 13.66 | −1.43 | 15.59 |
| s59 | 19.29 | 12.13 | 25.36 | 7.16 | 45.99 |
| s69 | 15.54 | 15.74 | 23.41 | −0.2 | 1.28 |
References
- Šiljeg, S.; Marić, I.; Nikolić, G.; Šiljeg, A. Accessibility analysis of urban green spaces in the settlement of Zadar in Croatia. Šumarski List 2018, 142, 487–496. [Google Scholar] [CrossRef]
- Jones, B.A. Planting urban trees to improve quality of life? The life satisfaction impacts of urban afforestation. For. Policy Econ. 2021, 125, 102408. [Google Scholar] [CrossRef]
- World Health Organization (WHO). Urban Green Spaces: A Brief for Action; WHO: Copenhagen, Denmark, 2017; Available online: https://iris.who.int/bitstream/handle/10665/344116/9789289052498-eng.pdf (accessed on 13 December 2024).
- Biernacka, M.; Kronenberg, J. Urban green space availability, accessibility and attractiveness, and the delivery of ecosystem services. Cities Environ. (CATE) 2019, 12, 5. [Google Scholar] [CrossRef]
- Orlandi, F.; Fornaciari, M.; Ranfa, A.; Proietti, C.; Ruga, L.; Meloni, G.; Burnelli, M.; Ventura, F. LIFE-CLIVUT, ecosystem benefits of urban green areas: A pilot case study in Perugia (Italy). iforest-Biogeosci. For. 2022, 15, 133. [Google Scholar] [CrossRef]
- Kothencz, G.; Kolcsár, R.; Cabrera-Barona, P.; Szilassi, P. Urban green space perception and its contribution to well-being. Int. J. Environ. Res. Public Health 2017, 14, 766. [Google Scholar] [CrossRef] [PubMed]
- Tyrväinen, L.; Pauleit, S.; Seeland, K.; De Vries, S. Benefits and uses of urban forests and trees. In Urban Forests and Trees: A Reference Book; Konijnendijk, C.C., Nilsson, K., Randrup, T.B., Schipperijn, J., Eds.; Springer: Berlin/Heidelberg, Germany, 2005; pp. 81–114. [Google Scholar] [CrossRef]
- Nardi, P.; Di Matteo, G.; Palahi, M.; Scarascia Mugnozza, G. Structure and evolution of Mediterranean forest research: A science mapping approach. PLoS ONE 2016, 11, e0155016. [Google Scholar] [CrossRef] [PubMed]
- Ostoić, S.K.; Salbitano, F.; Borelli, S.; Verlič, A. Urban forest research in the Mediterranean: A systematic review. Urban For. Urban Green. 2018, 31, 185–196. [Google Scholar] [CrossRef]
- Jorgensen, E. Urban forestry in the rearview mirror. Arboric J. 1986, 10, 177–190. [Google Scholar] [CrossRef]
- Scholz, T.; Hof, A.; Schmitt, T. Cooling effects and regulating ecosystem services provided by urban trees—Novel analysis approaches using urban tree cadastre data. Sustainability 2018, 10, 712. [Google Scholar] [CrossRef]
- Noe, N.; Massi, F. Urban Forest Digital Cadastre. J. Civ. Eng. Archit. 2021, 15, 330–341. [Google Scholar] [CrossRef]
- Lupp, G.; Förster, B.; Kantelberg, V.; Markmann, T.; Naumann, J.; Honert, C.; Pauleit, S. Assessing the recreation value of urban woodland using the ecosystem service approach in two forests in the Munich metropolitan region. Sustainability 2016, 8, 1156. [Google Scholar] [CrossRef]
- Nowak, D.J.; Crane, D.E. Carbon storage and sequestration by urban trees in the USA. Environ. Pollut. 2002, 116, 381–389. [Google Scholar] [CrossRef] [PubMed]
- Alvey, A.A. Promoting and preserving biodiversity in the urban forest. Urban For. Urban Green. 2006, 5, 195–201. [Google Scholar] [CrossRef]
- Jones, B.A.; McDermott, S.M. Health impacts of invasive species through an altered natural environment: Assessing air pollution sinks as a causal pathway. Environ. Resour. Econ. 2018, 71, 23–43. [Google Scholar] [CrossRef]
- Panagiotidis, D.; Abdollahnejad, A.; Slavík, M. 3D point cloud fusion from UAV and TLS to assess temperate managed forest structures. Int. J. Appl. Earth Obs. Geoinf. 2022, 112, 102917. [Google Scholar] [CrossRef]
- Balenović, I.; Alberti, G.; Marjanović, H. Airborne laser scanning-the status and perspectives for the application in the south-east European forestry. South-East. Eur. For. SEEFOR 2013, 4, 59–79. [Google Scholar] [CrossRef]
- Sakari, T.; Juho, P.; Andras, B.; Pekka, H.; Eero, M. NFI plots as complementary reference data in forest inventory based on airborne laser scanning and aerial photography in Finland. Silva Fenn. 2014, 48, 983. [Google Scholar] [CrossRef]
- Liang, X.; Kukko, A.; Balenović, I.; Saarinen, N.; Junttila, S.; Kankare, V.; Holopainen, M.; Mokroš, M.; Surový, P.; Kaartinen, H.; et al. Close-range remote sensing of forests: The state of the art, challenges, and opportunities for systems and data acquisitions. IEEE Geosci. Remote Sens. Mag. 2022, 10, 32–71. [Google Scholar] [CrossRef]
- Balenović, I.; Liang, X.; Jurjević, L.; Hyyppä, J.; Seletković, A.; Kukko, A. Hand-held personal laser scanning–current status and perspectives for forest inventory application. Croat. J. For. Eng. J. Theory Appl. For. Eng. 2021, 42, 165–183. [Google Scholar] [CrossRef]
- Wu, Y.; Zhong, S.; Ma, Y.; Zhang, Y.; Liu, M. Application of SLAM-Based Mobile Laser Scanning in Forest Inventory: Methods, Progress, Challenges, and Perspectives. Forests 2025, 16, 920. [Google Scholar] [CrossRef]
- Ayrey, E.; Hayes, D.J.; Kilbride, J.B.; Fraver, S.; Kershaw, J.A.; Cook, B.D.; Weiskittel, A.R. Synthesizing disparate LiDAR and satellite datasets through deep learning to generate wall-to-wall regional inventories for the complex, mixed-species forests of the eastern United States. Remote Sens. 2021, 13, 5113. [Google Scholar] [CrossRef]
- Chen, Q.; Gao, T.; Zhu, J.; Wu, F.; Li, X.; Lu, D.; Yu, F. Individual tree segmentation and tree height estimation using leaf-off and leaf-on UAV-LiDAR data in dense deciduous forests. Remote Sens. 2022, 14, 2787. [Google Scholar] [CrossRef]
- Douss, R.; Farah, I.R. Extraction of individual trees based on Canopy Height Model to monitor the state of the forest. Trees For. People 2022, 8, 100257. [Google Scholar] [CrossRef]
- Bienert, A.; Hess, C.; Maas, H.G.; Von Oheimb, G. A voxel-based technique to estimate the volume of trees from terrestrial laser scanner data. Int. Arch. Photogramm. Remote Sens. Spat. Inf. Sci. 2014, 40, 101–106. [Google Scholar] [CrossRef]
- Fu, H.; Li, H.; Dong, Y.; Xu, F.; Chen, F. Segmenting individual tree from TLS point clouds using improved DBSCAN. Forests 2022, 13, 566. [Google Scholar] [CrossRef]
- Li, W.; Guo, Q.; Jakubowski, M.K.; Kelly, M. A new method for segmenting individual trees from the lidar point cloud. Photogramm. Eng. Remote Sens. 2012, 78, 75–84. [Google Scholar] [CrossRef]
- Yang, J.; Kang, Z.; Cheng, S.; Yang, Z.; Akwensi, P.H. An individual tree segmentation method based on watershed algorithm and three-dimensional spatial distribution analysis from airborne LiDAR point clouds. IEEE J. Sel. Top. Appl. Earth Obs. Remote Sens. 2020, 13, 1055–1067. [Google Scholar] [CrossRef]
- Latella, M.; Sola, F.; Camporeale, C. A density-based algorithm for the detection of individual trees from LiDAR data. Remote Sens. 2021, 13, 322. [Google Scholar] [CrossRef]
- Windrim, L.; Bryson, M. Detection, segmentation, and model fitting of individual tree stems from airborne laser scanning of forests using deep learning. Remote Sens. 2020, 12, 1469. [Google Scholar] [CrossRef]
- Luoma, V.; Saarinen, N.; Wulder, M.A.; White, J.C.; Vastaranta, M.; Holopainen, M.; Hyyppä, J. Assessing precision in conventional field measurements of individual tree attributes. Forests. 2017, 8, 38. [Google Scholar] [CrossRef]
- Trimble. Trimble R12i. Available online: https://geospatial.trimble.com/en/products/hardware/trimble-r12i (accessed on 13 December 2024).
- Wallace, L.; Lucieer, A.; Watson, C.S. Evaluating tree detection and segmentation routines on very high resolution UAV LiDAR data. IEEE Trans. Geosci. Remote Sens. 2014, 52, 7619–7628. [Google Scholar] [CrossRef]
- DJI. Support for Zenmuse L1. Available online: https://www.dji.com/hr/support/product/zenmuse-l1 (accessed on 13 December 2024).
- Hebel, M.; Stilla, U. Simultaneous calibration of ALS systems and alignment of multiview LiDAR scans of urban areas. IEEE Trans. Geosci. Remote Sens. 2011, 50, 2364–2379. [Google Scholar] [CrossRef]
- Spadavecchia, C.; Campos, M.B.; Piras, M.; Puttonen, E.; Shcherbacheva, A. Wood-Leaf Unsupervised Classification of Silver Birch Trees for Biomass Assessment Using Oblique Point Clouds. Int. Arch. Photogramm. Remote Sens. Spat. Inf. Sci. 2023, 48, 1795–1802. [Google Scholar] [CrossRef]
- ASPRS. The LAS 1.4 Specification. 2012. Available online: https://www.asprs.org/wp-content/uploads/2010/12/LAS_Specification.pdf (accessed on 7 April 2025).
- Dong, X.; Kim, W.Y.; Lee, K.H. Drone-based three-dimensional photogrammetry and concave hull by slices algorithm for apple tree volume mapping. J. Biosyst. Eng. 2021, 46, 474–484. [Google Scholar] [CrossRef]
- Šiljeg, A.; Marić, I.; Domazetović, F.; Cukrov, N.; Lovrić, M.; Panđa, L. Bathymetric survey of the St. Anthony channel (Croatia) using multibeam echosounders (MBES)—A new methodological semi-automatic approach of point cloud post-processing. J. Mar. Sci. Eng. 2022, 10, 101. [Google Scholar] [CrossRef]
- Domazetović, F.; Šiljeg, A.; Marić, I. A comprehensive framework for multiscale soil erosion modeling: A case study of Pag Island, Croatia. In Geographical Information Science; Elsevier: Amsterdam, The Netherlands, 2024; pp. 127–157. [Google Scholar] [CrossRef]
- Laino, D.; Cabo, C.; Prendes, C.; Janvier, R.; Ordonez, C.; Nikonovas, T.; Santin, C. 3DFin: A software for automated 3D forest inventories from terrestrial point clouds. For. An. Int. J. For. Res. 2024, 97, 479–496. [Google Scholar] [CrossRef]
- Compeán-Aguirre, J.L.; López-Serrano, P.M.; Silván-Cárdenas, J.L.; Martínez-García-Moreno, C.A.; Vega-Nieva, D.J.; Corral-Rivas, J.J.; Pompa-García, M. Evaluation of Two-Dimensional DBH Estimation Algorithms Using TLS. Forests 2024, 15, 1964. [Google Scholar] [CrossRef]
- Faro. FARO® FocusM 70 Laser Scanner, Short-Range Professional Grade Laser Scanner. 2016. Available online: https://www.laserscanning-europe.com/sites/default/files/redakteur_images/faro-focus-m-70-tech-sheet_0.pdf (accessed on 13 December 2024).
- Šiljeg, A.; Marić, I.; Cukrov, N.; Domazetović, F.; Roland, V. A multiscale framework for sustainable management of tufa-forming watercourses: A case study of National Park “Krka”, Croatia. Water 2020, 12, 3096. [Google Scholar] [CrossRef]
- Domazetović, F.; Šiljeg, A.; Marić, I.; Panđa, L. A new systematic framework for optimization of multi-temporal terrestrial LiDAR surveys over complex gully morphology. Remote Sens. 2022, 14, 3366. [Google Scholar] [CrossRef]
- Brede, B.; Lau, A.; Bartholomeus, H.M.; Kooistra, L. Comparing RIEGL RiCOPTER UAV LiDAR derived canopy height and DBH with terrestrial LiDAR. Sensors 2017, 17, 2371. [Google Scholar] [CrossRef] [PubMed]
- Olofsson, K.; Holmgren, J.; Olsson, H. Tree stem and height measurements using terrestrial laser scanning and the RANSAC algorithm. Remote Sens. 2014, 6, 4323–4344. [Google Scholar] [CrossRef]
- Weiser, H.; Schäfer, J.; Winiwarter, L.; Krašovec, N.; Fassnacht, F.E.; Höfle, B. Individual tree point clouds and tree measurements from multi-platform laser scanning in German forests. Earth Syst. Sci. Data 2022, 14, 2989–3012. [Google Scholar] [CrossRef]
- Singh, A.; Pavlenko, V.; Mokros, M. Tree parameter estimation with iPhone point cloud data using multiple algorithms. Int. J. Remote Sens. 2024, 45, 9443–9460. [Google Scholar] [CrossRef]
- Florea, S.C.; Dutca, I.; Nita, M.D. Tradeoffs and limitations in determining tree characteristics using 3D pointclouds from terrestrial laser scanning: A comparison of reconstruction algorithms on European bech (Fagus sylvatica L.) trees: A Case Study with European Beech (Fagus sylvatica). Ann. For. Res. 2024, 67, 185–199. [Google Scholar] [CrossRef]
- Liang, X.; Wang, Y.; Pyörälä, J.; Lehtomäki, M.; Yu, X.; Kaartinen, H.; Deng, S. Forest in situ observations using unmanned aerial vehicle as an alternative of terrestrial measurements. For. Ecosyst. 2019, 6, 20. [Google Scholar] [CrossRef]
- Zeybek, M. Semiautomatic Diameter-at-Breast-Height Extraction from Structure-from-Motion-Based Point Clouds Using a Low-Cost Fisheye Lens. Forests 2025, 16, 439. [Google Scholar] [CrossRef]
- Sheng, Y.; Zhao, Q.; Wang, X.; Liu, Y.; Yin, X. Tree Diameter at Breast Height Extraction Based on Mobile Laser Scanning Point Cloud. Forests 2024, 15, 590. [Google Scholar] [CrossRef]
- Panagiotidis, D.; Surový, P.; Kuželka, K. Accuracy of Structure from Motion models in comparison with terrestrial laser scanner for the analysis of DBH and height influence on error behaviour. J. For. Sci. 2016, 62, 357–365. [Google Scholar] [CrossRef]
- Kükenbrink, D.; Marty, M.; Bösch, R.; Ginzler, C. Benchmarking laser scanning and terrestrial photogrammetry to extract forest inventory parameters in a complex temperate forest. Int. J. Appl. Earth Obs. Geoinf. 2022, 113, 102999. [Google Scholar] [CrossRef]
- Liu, G.; Wang, J.; Dong, P.; Chen, Y.; Liu, Z. Estimating individual tree height and diameter at breast height (DBH) from terrestrial laser scanning (TLS) data at plot level. Forests 2018, 9, 398. [Google Scholar] [CrossRef]
- Wang, P.; Gan, X.; Zhang, Q.; Bu, G.; Li, L.; Xu, X.; Li, Y.; Liu, Z.; Xiao, X. Analysis of parameters for the accurate and fast estimation of tree diameter at breast height based on simulated point cloud. Remote Sens. 2019, 11, 2707. [Google Scholar] [CrossRef]
- Lee, Y.; Lee, J. Evaluation of accuracy in estimating diameter at breast height based on the scanning conditions of terrestrial laser scanning and circular fitting algorithm. Forests 2024, 15, 313. [Google Scholar] [CrossRef]
- Pueschel, P.; Newnham, G.; Rock, G.; Udelhoven, T.; Werner, W.; Hill, J. The influence of scan mode and circle fitting on tree stem detection, stem diameter and volume extraction from terrestrial laser scans. ISPRS J. Photogramm. Remote Sens. 2023, 77, 44–56. [Google Scholar] [CrossRef]
- Gollob, C.; Ritter, T.; Wassermann, C.; Nothdurft, A. Influence of scanner position and plot size on the accuracy of tree detection and diameter estimation using terrestrial laser scanning on forest inventory plots. Remote Sens. 2019, 11, 1602. [Google Scholar] [CrossRef]
- Nurunnabi, A.; Teferle, F.; Al-Sharadqah, A.; Xia, Y.; Hunegnaw, A. Robust estimation of tree diameter at breast height from point clouds. In Proceedings of the IEEE International Geoscience and Remote Sensing Symposium (IGARSS 2024), Athens, Greece, 7–12 July 2024; pp. 5284–5287. [Google Scholar] [CrossRef]
- Li, Z.; Qiao, Q.; Han, Z.; Liu, X.; Wang, Y.; Tang, H.; Deng, L. Terrestrial laser scanning in forestry: Accuracy and efficiency in measuring individual tree parameters. PLoS ONE 2025, 20, e0331126. [Google Scholar] [CrossRef]
- Li, L.; Mu, X.; Soma, M.; Wan, P.; Qi, J.; Hu, R.; Zhang, W.; Tong, Y.; Yan, G. An iterative-mode scan design of terrestrial laser scanning in forests for minimizing occlusion effects. IEEE Transactions on Geoscience and Remote Sensing 2020, 59, 3547–3566. [Google Scholar] [CrossRef]
- Bauwens, S.; Bartholomeus, H.; Calders, K.; Lejeune, P. Forest inventory with terrestrial LiDAR: A comparison of static and hand-held mobile laser scanning. Forests 2016, 7, 127. [Google Scholar] [CrossRef]
- Kuželka, K.; Marušák, R.; Surový, P. Inventory of close-to-nature forest stands using terrestrial mobile laser scanning. Int. J. Appl. Earth Obs. Geoinf. 2022, 115, 103104. [Google Scholar] [CrossRef]
- DJI Terra. Spatix-x64 v.025.003-r6648, DJI: Shenzhen, China, 2025.
- Liao, K.; Li, Y.; Zou, B.; Li, D.; Lu, D. Examining the role of UAV Lidar data in improving tree volume calculation accuracy. Remote Sens. 2022, 14, 4410. [Google Scholar] [CrossRef]
- Yang, S.; Xing, Y.; Xing, T.; Deng, H.; Xi, Z. Multi-sensors fusion SLAM-aided forest plot mapping with backpack dual-LiDAR system. IEEE J. Sel. Top. Appl. Earth Obs. Remote Sens. 2024, 17, 16051–16070. [Google Scholar] [CrossRef]
- Pan, D.; Shao, J.; Zhang, S.; Zhang, S.; Chang, B.; Xiong, H.; Zhang, W. Slam-based forest plot mapping by integrating imu and self-calibrated dual 3-d laser scanners. IEEE Trans. Geosci. Remote Sens. 2023, 61, 5703713. [Google Scholar] [CrossRef]
Disclaimer/Publisher’s Note: The statements, opinions and data contained in all publications are solely those of the individual author(s) and contributor(s) and not of MDPI and/or the editor(s). MDPI and/or the editor(s) disclaim responsibility for any injury to people or property resulting from any ideas, methods, instructions or products referred to in the content. |
© 2025 by the authors. Licensee MDPI, Basel, Switzerland. This article is an open access article distributed under the terms and conditions of the Creative Commons Attribution (CC BY) license (https://creativecommons.org/licenses/by/4.0/).

