Article

Spatiotemporal Distribution and Applicability Evaluation of Remote Sensing Precipitation in River Basins Across Mainland China

1
Meteorological Observation Center, China Meteorological Administration, Beijing 100081, China
2
Key Laboratory of Atmospheric Sounding, China Meteorological Administration, Chengdu 610225, China
3
Key Laboratory of Transportation Meteorology of China Meteorological Administration, Nanjing Joint Institute for Atmospheric Sciences, Nanjing 210041, China
4
State Key Laboratory of Environment Characteristics and Effects for Near-Space, Beijing 100081, China
5
Engineering Technology Research Center for Meteorological Observation of China Meteorological Administration, Beijing 100081, China
6
Xinjiang Weather Modification Office, Urumqi 830002, China
7
Shandong Meteorological Engineering Technology Center, Jinan 250031, China
8
Key Laboratory for Meteorological Disaster Prevention and Mitigation of Shandong, Jinan 250031, China
9
Meteorologic Technology Equip Center of Hunan, Changsha 410007, China
10
National Satellite Meteorological Center (National Centre for Space Weather), Beijing 100081, China
11
Innovation Center for FengYun Meteorological Satellite (FYSIC), Beijing 100081, China
12
Key Laboratory of Radiometric Calibration and Validation for Environmental Satellites, China Meteorological Administration, Beijing 100081, China
13
Shaanxi Meteorological Observation Centre, Shaanxi Provincial Meteorological Bureau, Xi’an 710082, China
*
Author to whom correspondence should be addressed.
Remote Sens. 2025, 17(21), 3534; https://doi.org/10.3390/rs17213534 (registering DOI)
Submission received: 11 August 2025 / Revised: 16 October 2025 / Accepted: 21 October 2025 / Published: 25 October 2025
(This article belongs to the Special Issue Remote Sensing in Natural Resource and Water Environment II)

Highlights

What are the main findings?
  • Systematic Errors: GPM IMERG-F overestimates annual rainy-day frequency but un-derestimates intensity in most basins (e.g., 18–20% annual precipitation overestima-tion in Liao River Basins), with seasonal monthly errors (larger deviations in winter in northern/western regions).
  • Basin-Scale Analysis and Application Insights: multi-temporal (daily–annual) and multi-metric analyses quantify terrain–climate impacts on basins (e.g., western YZRB (>2000 m) CSI < 0.5 vs. eastern 0.6–0.7), and basin-specific error ranges (e.g., monthly RMSD 25–50 mm) support rainy-season heavy rainfall detection in low-altitude basins (e.g., SEIRB) and sparse station supplementation in arid basins.
What are the implications of the main findings?
  • This study complements existing research by conducting systematic basin-scale assessments to reveal error variations across ten basins (a topic less reported in national-scale studies).
  • This study establishes terrain–climate-error links to provide basin-specific references for hydrological applications.

Abstract

This research evaluates the performance of the Final Run remote sensing precipitation products from the Integrated Multi-satellite Retrievals for GPM (IMERG-F) in complex terrain river basins (2014–2023). Utilizing decade-long daily precipitation data from 2415 manned national-level ground stations, the evaluation employs eight statistical metrics—probability of detection, false alarm ratio, accuracy, critical success index, Pearson correlation coefficient (PCC), root mean square difference, mean difference, and relative difference—to analyze detection accuracy, correlation, and bias on daily, monthly, and annual scales. The main findings include the following: (1) IMERG-F’s daily precipitation detection capability follows a three-tier spatial pattern (northwest to southeast), aligning with the stepped terrain of China. (2) Stronger correlations (PCC = 0.7–0.9) with gauge data emerge in southeastern regions despite higher biases, while northwestern areas show weaker correlations but fewer deviations. (3) IMERG-F overestimates annual rainy days, but slightly underestimates precipitation intensity compared with ground observations. (4) Annual precipitation estimates exceed gauge measurements, particularly in the Songhua and Liao River Basins (18–20% overestimation). Monthly analysis shows fewer errors during rainy seasons versus winter dry periods, with pronounced seasonal variations in northwestern basins. These findings emphasize the need for terrain-aware calibration to improve satellite precipitation monitoring in hydrologically diverse basins, particularly addressing seasonal and spatial error patterns in water resource management applications in northern China.

1. Introduction

As a product of earth–air interaction, precipitation is a crucial part of the earth’s water cycle. High-quality precipitation data are of paramount importance in hydrological simulation, drought monitoring, disaster prevention and mitigation, and water resource management. Recently, precipitation data have primarily been obtained through three observational methods: ground-station observations (e.g., rain gauges), weather radar observations, and satellites [1]. Ground-station observations are the primary method of obtaining precipitation data. However, they have limitations such as low resolution and uneven coverage. Consequently, it is arduous to accurately represent the spatial and temporal heterogeneity of precipitation, particularly in the western regions where ground-based observation stations are scarce [2]. Although rain gauges and weather radars can provide point measurements with high accuracy, the distribution of rain gauge networks is influenced by factors like terrain complexity and population density, resulting in uneven spatial coverage. Weather radars are prone to terrain-induced interference, which impedes their coverage. Additionally, the high construction and maintenance costs also limit the construction of radars to a certain extent, which in turn affects the coverage of radars in mainland China [3,4]. Inversion of precipitation with satellite remote sensing not only provides three-dimensional monitoring information on precipitation structures, but also overcomes the shortcomings of ground-based rain gauges that are insufficient to portray the spatial distribution of precipitation. It is characterized by high temporal and spatial resolution, extensive coverage, and continuous spatial estimation. As such, it serves as a crucial source of precipitation data in data-lacking and ungauged regions and has been extensively applied as an alternative to ground-based precipitation observations in fields such as hydrological simulation, disaster mitigation, and water resource management [5,6,7].
In recent years, multi-satellite precipitation inversion technology has been developed to provide precipitation datasets with high spatial and temporal resolution, which can be used to support hydrometeorological research in complex terrain [8,9]. The Global Precipitation Mission (GPM), as the successor of the Tropical Rainfall Measuring Mission (TRMM), can offer real-time updated satellite precipitation products [10,11,12,13,14,15,16,17,18]. Evaluating the suitability of a satellite precipitation product is one of the most important steps prior to product application [19,20,21]. Global scholars have systematically assessed multiple generations of satellite precipitation products through a rigorous methodology and cross-regional validation of product performance. For example, Tang et al. used the observational data from eight rain gauge stations during the summers between 2014 and 2018 to evaluate the Integrated Multi-satellite Retrievals for GPM (IMERG) Final Run product and the GSMap product in Southwest China-Yingjing River (mountainous catchment) [22]. Mahmoud et al. utilized the observational data from 275 stations from March 2014 to June 2018 to assess the GPM IMERG V05B precipitation product in Saudi Arabia [23]. Nan et al. employed the observational data from over 800 stations from 2014 to 2018 to evaluate three GPM IMERG precipitation products (IMERG-E, IMERG-L, and IMERG-F) in China [24]. Tang et al. used the station observational data from 2016 to 2018 to evaluate three GPM IMERG precipitation products (IMERG-E, IMERG-L, and IMERG-F) at the grid, regional, and seasonal scales in the Sichuan Basin [25]. Liu et al. evaluated the accuracy and consistency of TRMM precipitation products at the national and basin scales [26]. Liao et al. verified and evaluated the accuracy of six satellite precipitation products at three spatial scales in China, including the eastern and western regions of China [27]. However, previous studies mostly focused on specific small-scale regional terrains or were limited by the lack of long-time-scale precipitation data from high-density ground-based stations. Therefore, the validation of the IMERG Final Run precipitation product in river basins of mainland China is still insufficient. There is an urgent need to further conduct a systematic quality evaluation combining point and area scales by integrating high-density and long-series ground-based observational data.
Precipitation constitutes a fundamental component of hydrological processes, serving as the primary recharge mechanism for aquatic systems. This phenomenon has significant influence on critical scientific domains including hydrological resource allocation and hydrometeorological forecasting accuracy at the basin scale [28,29]. The systematic evaluation of the quality of the IMERG-F product on a watershed basis is of great significance for the application of this product in mainland China. Therefore, in this article, 2415 national manned meteorological stations with daily precipitation data from 2014 to 2023 in mainland China are used to perform a systematical evaluation at multiple spatial and temporal scales. We assess the IMERG-F precipitation product at both the meteorological station scale and the basin scale using watersheds/slabs as the basic zoning, and combining this with the spatial interpolation of precipitation at ground-based stations.

2. Materials and Methods

2.1. Study Area

Geographically positioned within the East Asian continental core and bordering the northwestern Pacific Rim, the mainland of China extends across 18–53° N latitude and 73–135° E longitude (Figure 1). The nation’s territorial expanse encompasses approximately 9.6 million square kilometers of landmass, representing one of the world’s most extensive continuous geographical units. Considering the spatial distribution of precipitation, topographic and geomorphic effects such as plateaus and basins, and mountain ranges, as well as the morphology of the water system and the characteristics of the river system, mainland China is mainly divided into 10 river basins, including the Songhua River Basin (SRB), Liao River Basin (LRB), Hai River Basin (HRB), Yellow River Basin (YRB), Huai River Basin (HURB), Yangtze River Basin (YZRB), Southeast Inland Rivers Basin (SEIRB), Pearl River Basin (PRB), Southwest Inland Rivers Basin (SWIRB), and Northwest Inland Rivers Basin (NWIRB), respectively, from the northeast to the southwest [30]. Figure 1 shows the topography of the 10 major river basins in mainland China, as well as the total number of national manned ground-based stations and their distribution within each river basin. Table 1 details the drainage area, precipitation, and water resource status of each river basin.

2.2. Data Collection and Pre-Processing

2.2.1. Manned National-Level Ground-Station Data

The information from 2415 national manned stations was obtained from the Integrated Meteorological Observation Service Operation Informatization Platform (Tianyuan). Daily precipitation data spanning 2014 to 2023 were acquired through the Meteorological Big Data Cloud Platform (Tianqing). The dataset underwent rigorous multi-level quality control procedures and standardization processes. Importantly, this high-density CMA station network serves as a fully independent validation dataset. The satellite product evaluated in this study (IMERG-F V07) is calibrated using the GPCC Monitoring Product, which is an international near-real-time gauge dataset with a distinct data source and processing chain from the CMA network. Furthermore, due to the multi-year latency in releasing the full GPCC final product, the IMERG-F V07 data for our study period, especially recent years, could not have been calibrated using the complete set of recent CMA observations available to us. This ensures the independence and robustness of our validation.
Given the vast extent of the study area and high spatial heterogeneity of precipitation, the Inverse Distance Weighting (IDW) spatial interpolation demonstrates superior adaptability over Kriging and spline methods for large-scale regions with sparsely distributed stations. Furthermore, IDW more effectively captures precipitation extremes while offering higher computational efficiency. Thus, this study employs the IDW to generate gridded daily precipitation data from station observations [36,37,38]. This methodology generated a high-resolution gridded precipitation dataset covering mainland China with a spatial resolution of 0.01° × 0.01° (approximately 1 km at the equator). Based on the principle of distance decay weighting, the IDW interpolation technique utilizes the weighted average of the surrounding observations to predict the data at unknown locations, and the samples have a greater impact on the calculation results if the distance is smaller.

2.2.2. The GPM IMERG-Final Precipitation Data

This study utilizes the GPM IMERG-Final V07 (referred to as IMERG-F) global precipitation dataset spanning 2014 to 2023. As the latest iteration of this satellite-based precipitation product, the GPM dataset integrates comprehensive data sources during calibration processes, incorporating observations from the GPM Core Observatory satellite constellation, multi-satellite radars, microwave radiometers, and ground-based meteorological stations. The IMERG-F product features a 3-month latency period for quality assurance, maintaining native specifications of daily temporal intervals and 0.1° spatial grid resolution. Consistent with established practices in satellite–ground precipitation validation studies [39,40,41,42], bilinear interpolation was adopted as the standard resampling method. Furthermore, after comparing the differences between bilinear interpolation and nearest-neighbor interpolation in this study, it was found that the discrepancies between the two are negligible. Therefore, bilinear interpolation was chosen for this study. Specifically, the IMERG-Final dataset was first clipped to mainland China’s spatial extent, then resampled to a 0.01° spatial resolution grid (approximately 1 km at the equator) using bilinear interpolation in order to achieve dimensional consistency with ground observation data, so as to facilitate subsequent comparative analysis.

2.3. Evaluation Methodology

This study establishes a systematic spatiotemporal matching framework between the resampled GPM satellite data and national manned station observations through nearest-neighbor point matching. The day-scale precipitation measurements of IMERG-F (between 2014 and 2023) have been systematically evaluated through comparison with in situ precipitation records collected at ground-based stations. To comprehensively evaluate the hydrological applicability of IMERG-F products across different basin partitions, a multi-metric analytical framework was implemented, combining detection capability metrics and statistical accuracy metrics. This dual-aspect evaluation framework enables quantitative characterization of the product’s detection sensitivity and estimation accuracy across various hydrological basins, particularly addressing geographical heterogeneity in precipitation retrieval performance.
As demonstrated in Table 2 and Table 3, the precipitation detection performance of IMERG-F products was quantitatively evaluated using four key categorical metrics: probability of detection (POD), accuracy (ACC), critical success index (CSI), and false alarm ratio (FAR). The metric interpretation reveals distinct detection characteristics:
(1) Optimal detection capability corresponds to the POD, ACC, and CSI approaching the theoretical maximum (1.0);
(2) Effective error suppression manifests as FAR trending toward the minimum (0.0);
(3) The CSI particularly reflects the balanced detection capacity considering both missed and false precipitation events.
This multi-indicator framework systematically characterizes IMERG-F precipitation identification accuracy across different intensity thresholds, with metric values closer to their respective ideal thresholds indicating enhanced detection reliability.
This research applies another four statistical measures—Pearson correlation coefficient (PCC), root mean square difference (RMSD), mean difference (MD), and relative difference (RD)—to assess both the measurement accuracy and data reliability of IMERG-F precipitation product estimates using systematic comparison methods. The specifics are as follows:
The PCC measures how closely the IMERG-F product aligns with rainfall measurements from ground-based observations in terms of linear relationships.
RMSD measures the overall deviation between the IMERG-F product and ground observations, reflecting the magnitude of systematic errors. RMSD calculates the average differences between IMERG-F product estimates and ground observations, indicating the size of consistent measurement discrepancies.
MD indicates the average bias of the IMERG-F data relative to ground measurements, highlighting persistent overestimation or underestimation trends.
RD further evaluates the proportional discrepancy relative to observed precipitation values, providing a normalized assessment of bias.
P C C = Σ i = 1 N P i P ¯ S i S ¯ Σ i = 1 N P i P ¯ 2 S i S ¯ 2
R M S D = Σ i = 1 N ( P i S i 2 ) N
M D = 1 N Σ i = 1 N P i S i
R D = P i S i S i × 100 %
Definition of Variables:
(1) Pi: Precipitation value from the IMERG-F product at the i-th time/location;
(2) P ¯ : Mean precipitation of the IMERG-F dataset;
(3) Si: Precipitation value from ground-based observations at the i-th time/location;
(4) S ¯ : Mean precipitation of the ground observation dataset;
(5) N: Total number of paired samples (time points or spatial grids).

3. Results

3.1. Evaluation of Precipitation Detection Performance

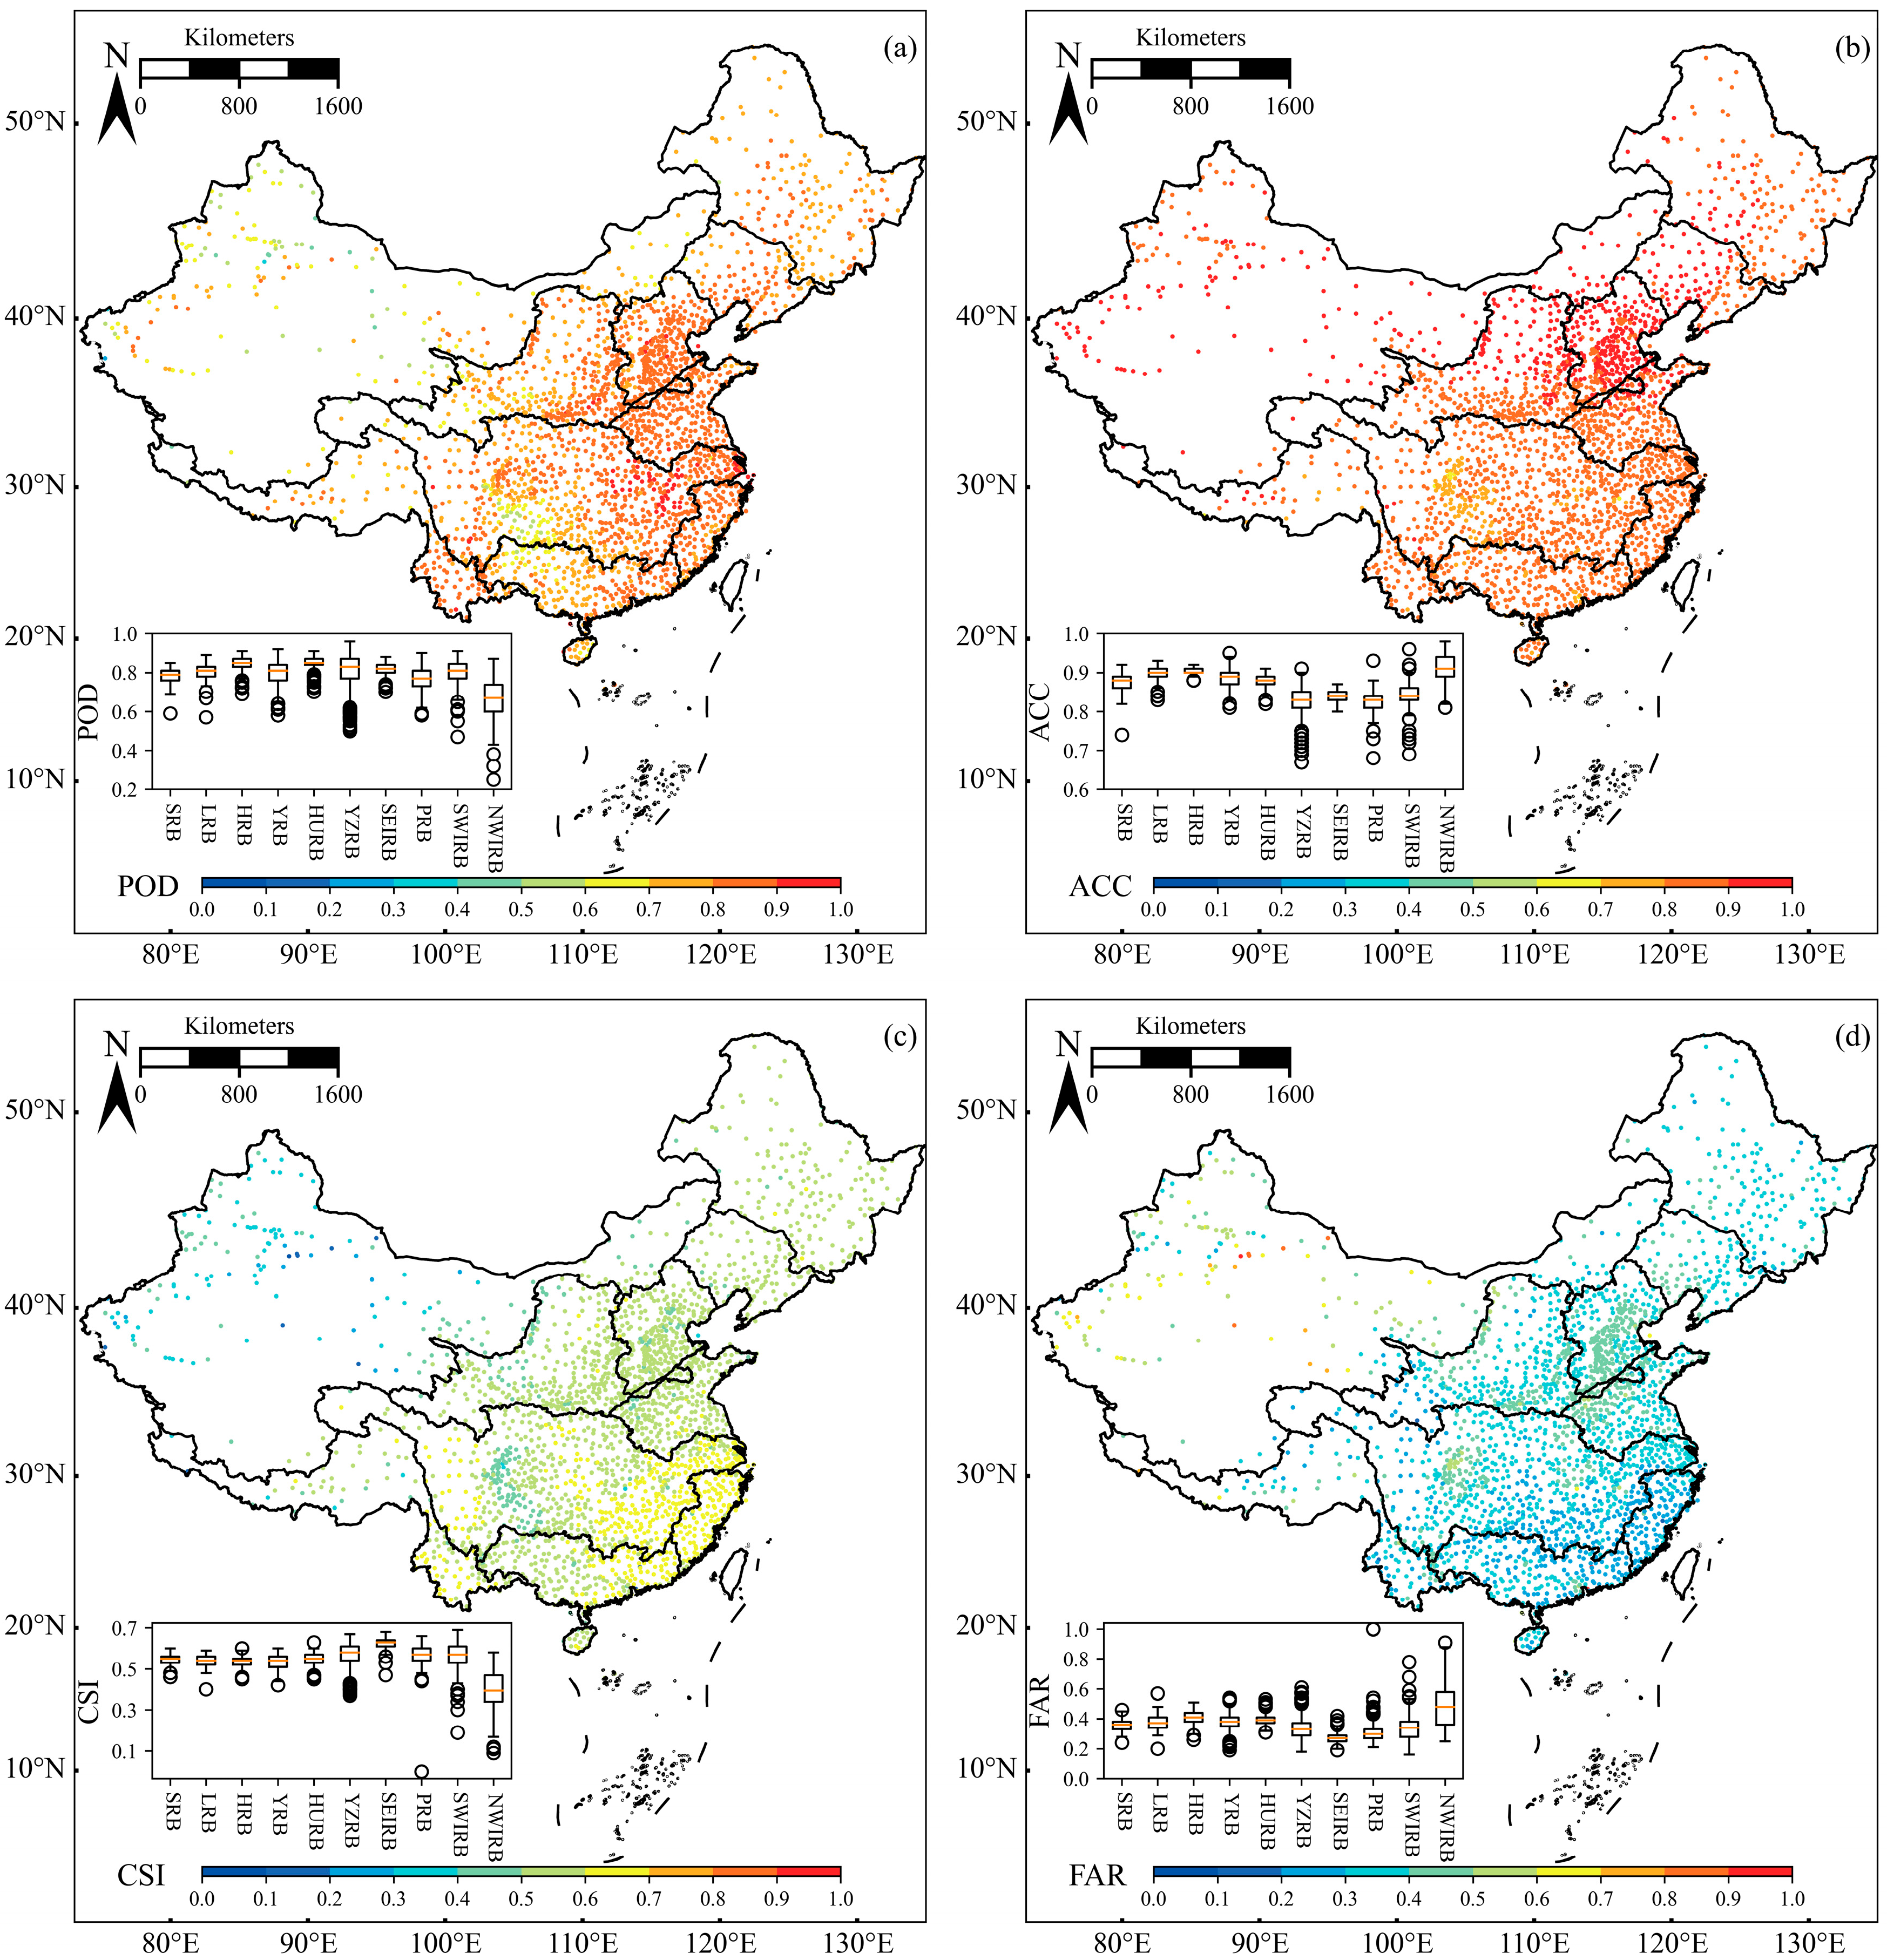
The accuracy evaluation results of IMERG-F precipitation products at ground-based observation stations across various river basins in mainland China reveal notable regional disparities (Figure 2). The median POD exceeds 0.6 in all basins, with eight major basins achieving median POD values above 0.8, except the NWIRB. Notably, the data distributions demonstrate greater consistency in seven principal basins compared to the YRB, YZRB, and NWIRB. Significant POD outliers below 0.6 are observed in the YRB, YZRB, SWIRB, and NWIRB, particularly concentrated in the Sichuan Basin and western plateau regions, suggesting reduced satellite detection capability for precipitation events in these topographically complex areas with distinctive climatic characteristics (Figure 2a).
The CSI demonstrates a clear three-level geographic distribution, with values progressively declining from southeastern coastal regions to northwestern inland areas (Figure 2c). The SEIRB, eastern YZRB, and PRB maintain CSI values of 0.6–0.7, while the Northern Inland basins including the SRB, LRB, HRB, YRB, HURB, and SWIRB predominantly range between 0.5 and 0.6. The NWIRB shows the lowest CSI values (0.3–0.4). Particularly in the western YZRB and high-altitude plateaus above 2 km, CSI performance decreases significantly, with spatial patterns mirroring those of POD anomalies in the Sichuan Basin. Complementary analyses of ACC and FAR confirm these findings, demonstrating consistent spatial distributions that collectively highlight reduced detection reliability in basin topography and high-altitude plateau regions (Figure 2b,d).
In summary, the IMERG-F product shows good overall detection capabilities across mainland China, following a clear three-level pattern from higher accuracy in the southeast to lower accuracy in the northwest. This pattern matches the natural landscape of eastern lower plains, central hills, and western highlands in China. In the YZRB, the accuracy of the system varies significantly due to the area’s size and mountainous terrain, especially showing lower reliability in western Sichuan Basin areas. The NWIRB exhibits the lowest detection performance, mainly because of its high-altitude desert environment, limited rainfall, and sparse ground-based stations spread over large distances. These conditions create more errors in satellite rainfall measurements, proving how terrain challenges and ground-station availability directly affect satellite data quality.

3.2. Spatial Distribution of Annual Precipitation Frequency and Intensity

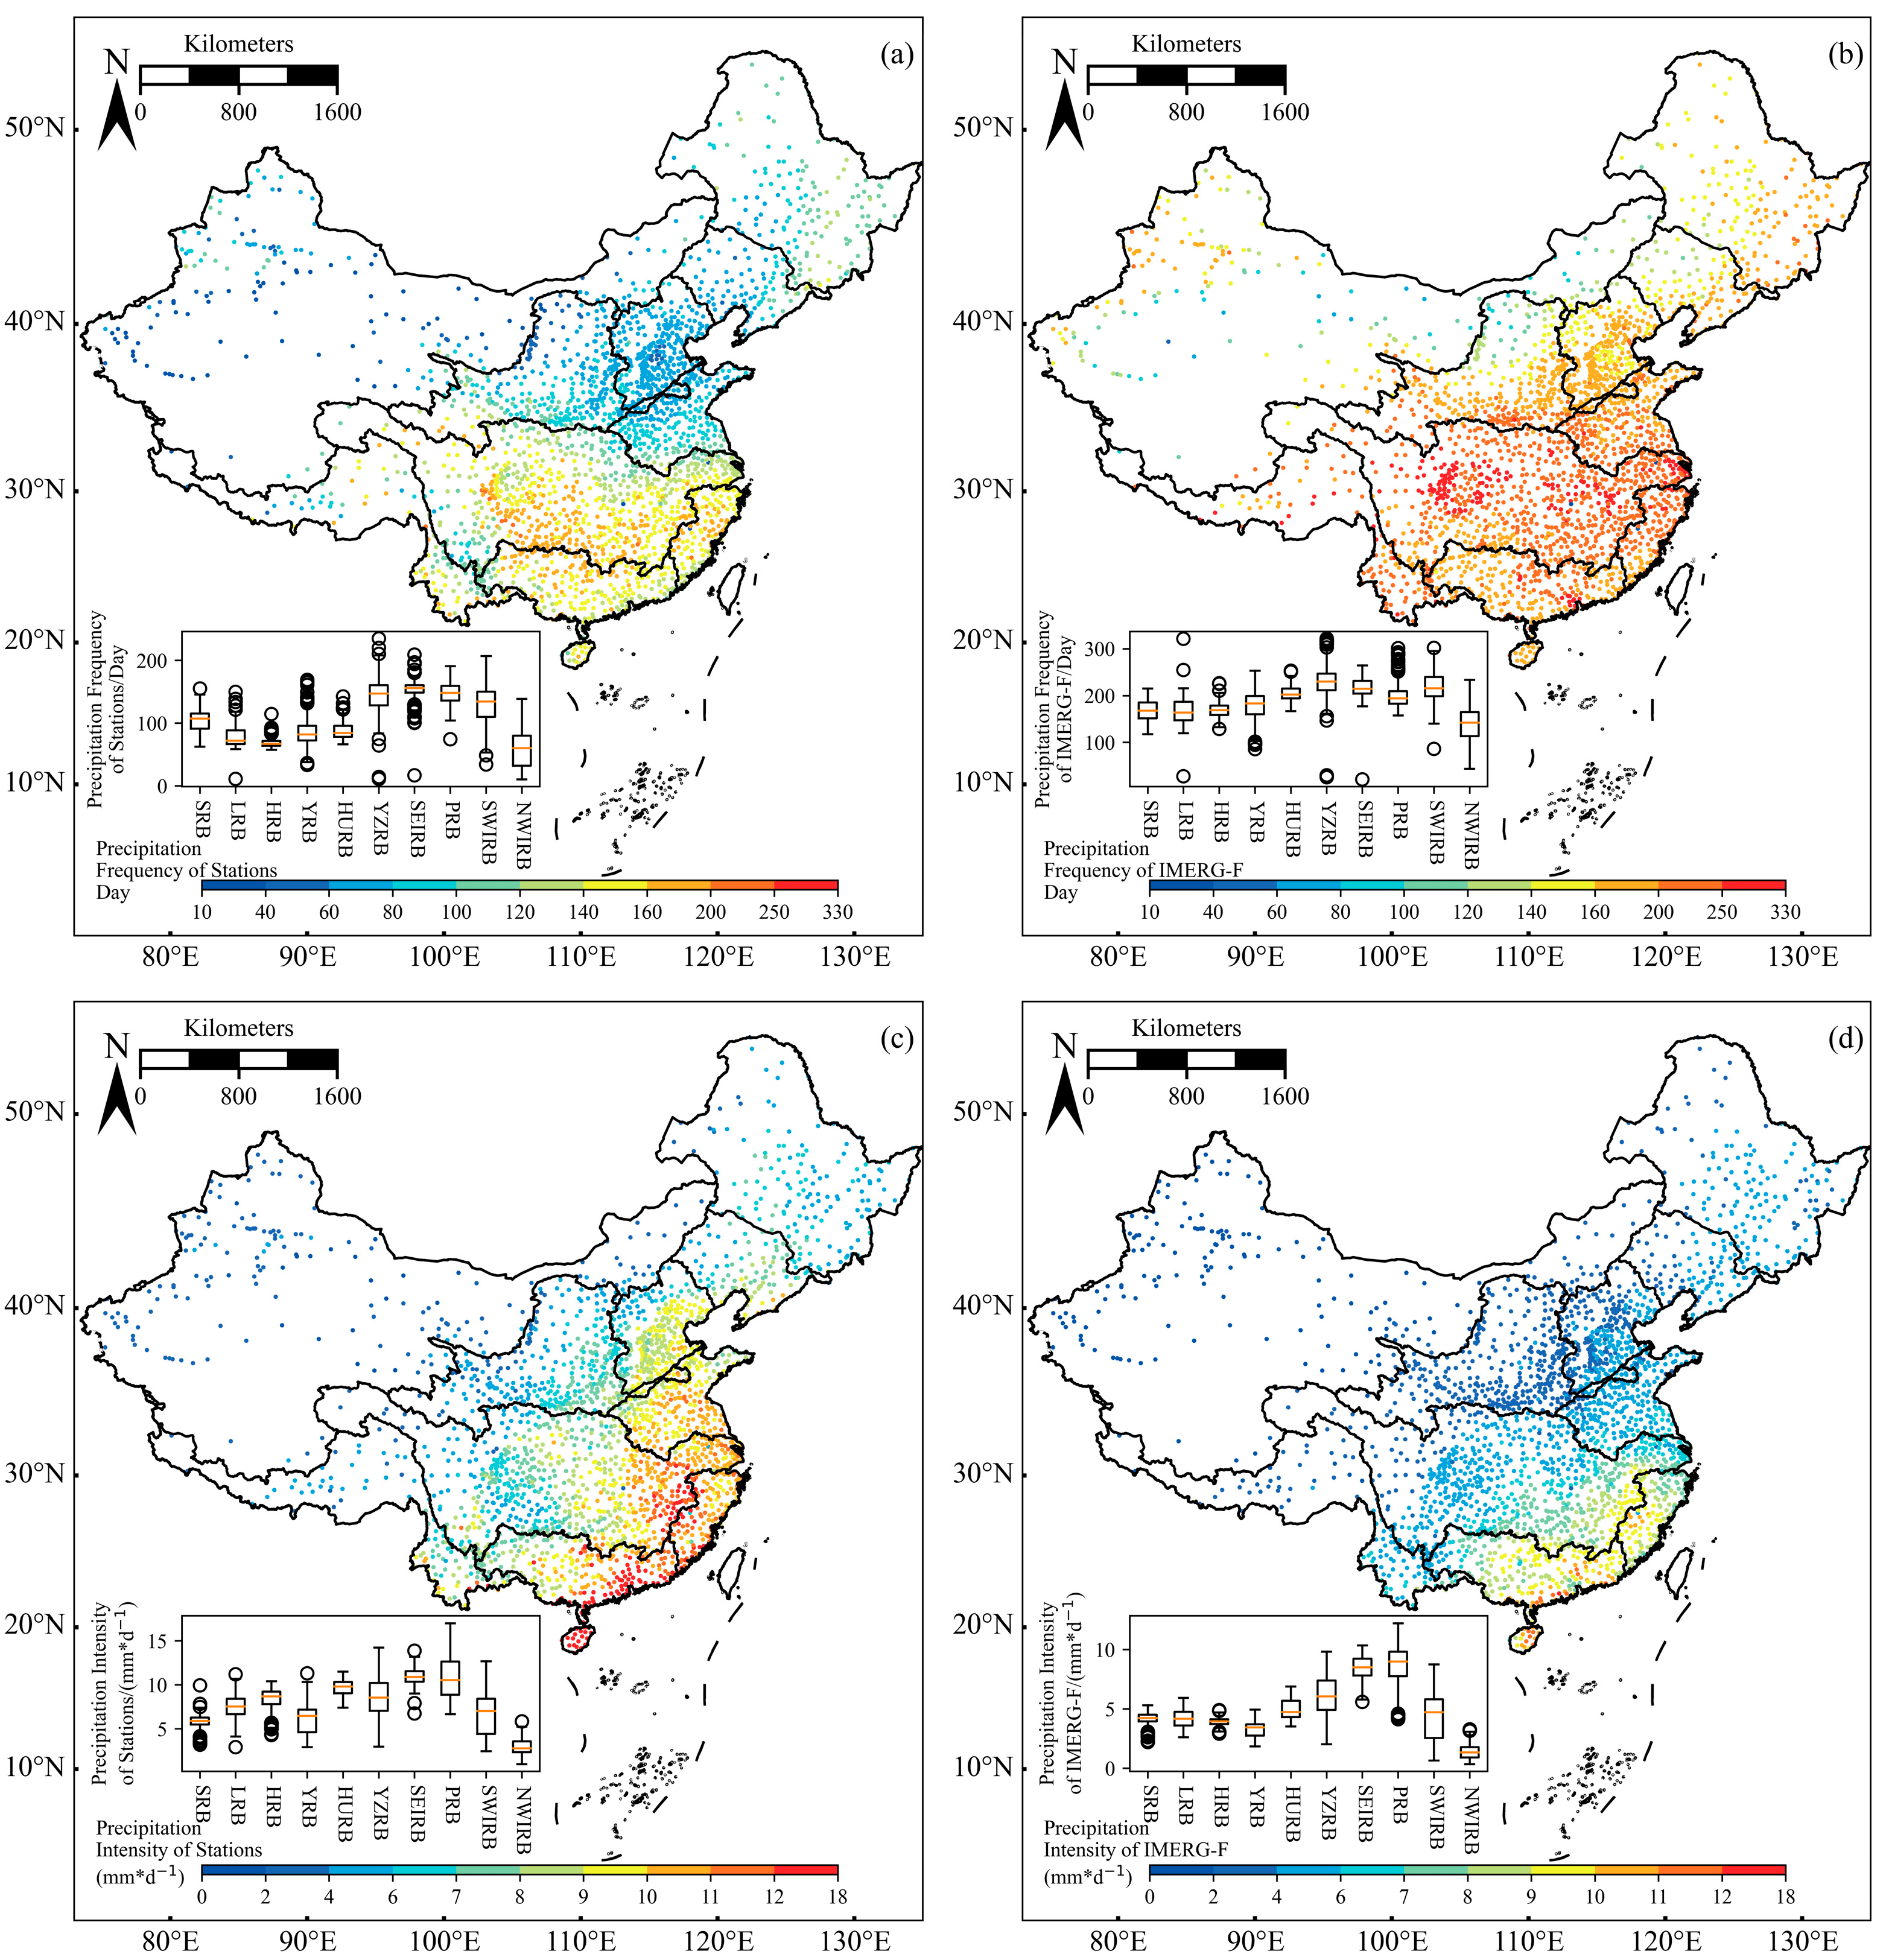
Evaluation results for the annual precipitation frequency and intensity (daily precipitation amount) between ground-based observation stations and IMERG-F products across river basins are presented in Figure 3. The IMERG-F dataset systematically overestimates annual precipitation frequency compared with ground-based measurements. Statistical analysis of boxplots reveals that the median annual precipitation frequency ranges between 80 and 120 days for in situ observations, whereas IMERG-F yields significantly higher values (130–220 days) (Figure 3a,b). Regarding precipitation intensity, the slightly lower intensity values in IMERG compared to station observations may be partly attributed to the bilinear interpolation method. This resampling approach can smooth local precipitation peaks, potentially leading to an underestimation of high-intensity precipitation in IMERG-F (Figure 3c,d). However, both datasets exhibit consistent spatial patterns characterized by a southeast-to-northwest decreasing gradient. This spatial coherence suggests that while IMERG-F captures regional precipitation intensity trends effectively, systematic biases exist in its quantification of precipitation occurrence frequency, particularly in regions with complex terrain and sparse observational coverage.

3.3. Accuracy Evaluation of IMERG-F Precipitation Estimates

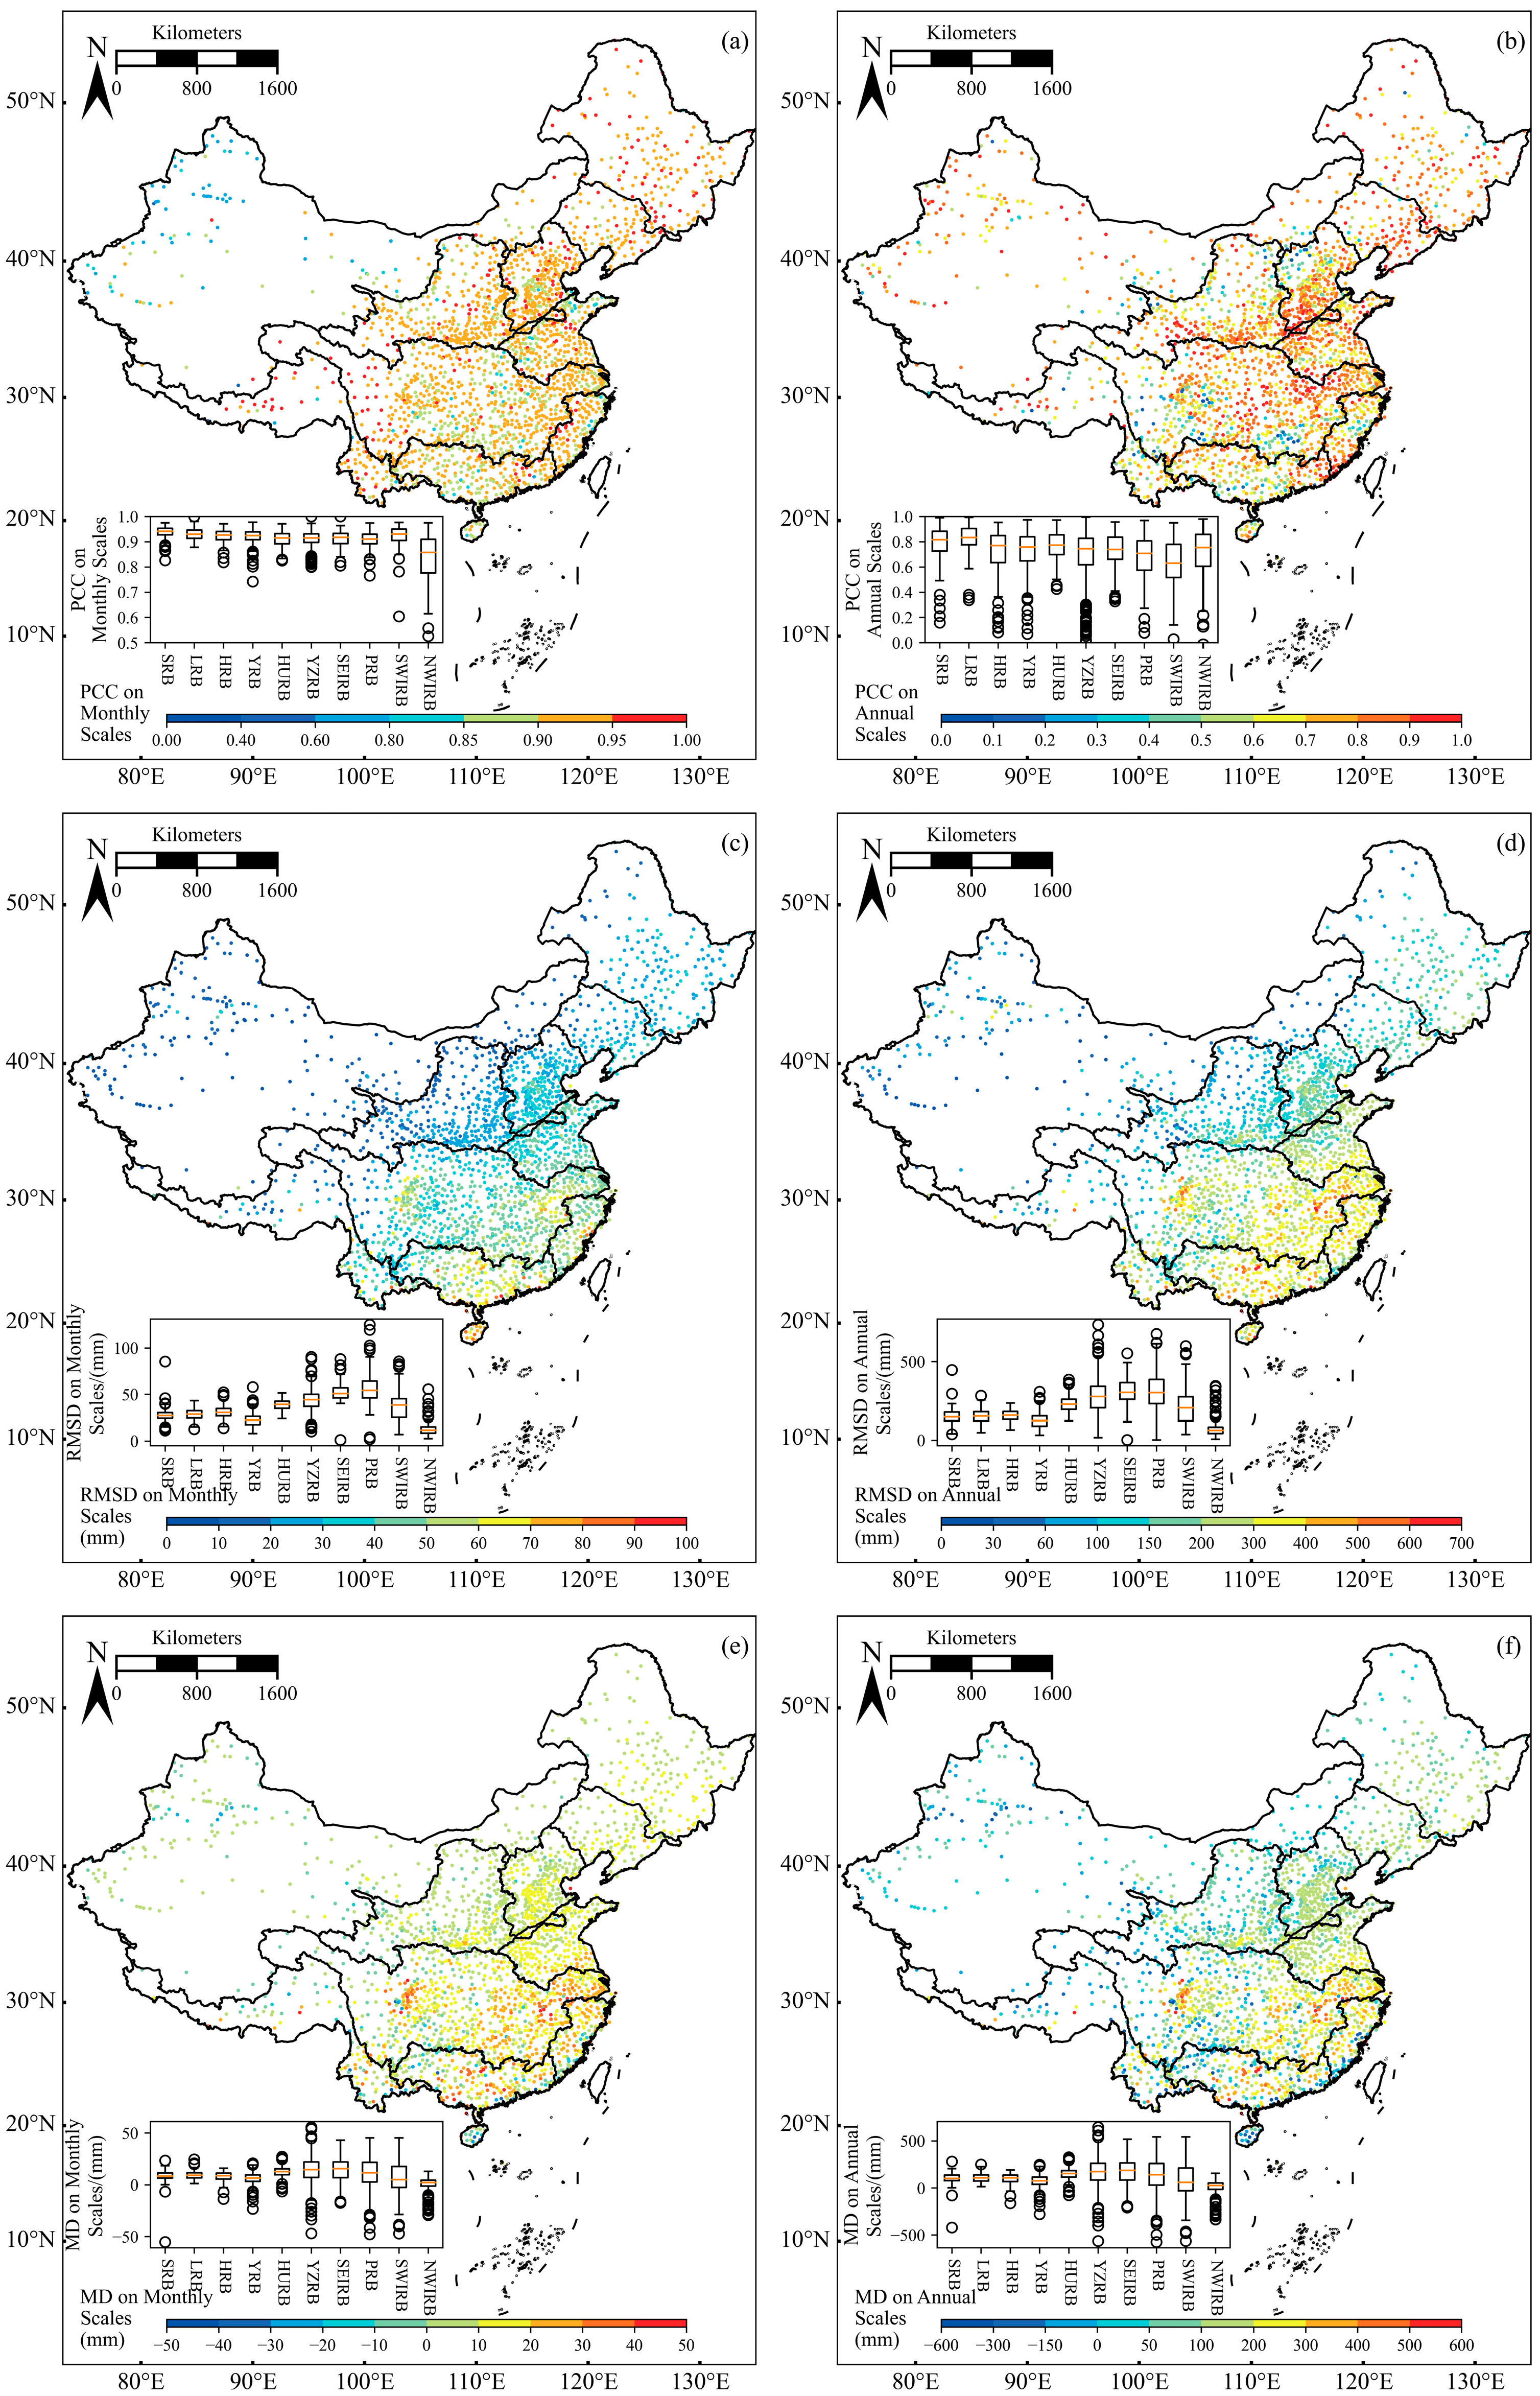
A comprehensive evaluation of the IMERG-F precipitation data for each basin on monthly and annual scales showed that the PCC between the IMERG-F data and the data from ground-based meteorological observation stations on the monthly scale was generally good, with the median PCC reaching 0.9 across most basins (Figure 4a). The NWIRB exhibited a slightly lower PCC (median 0.6–0.8), particularly in northwestern Xinjiang Uygur Autonomous Region. The annual-scale PCC remained stable (above 0.7) for most regions, though the YZRB, HRB, and YRB contained relatively more stations with a PCC below 0.5 (Figure 4b).
Error analysis demonstrated median RMSD values of 25–50 mm/month and 150–300 mm/year across basins (Figure 4c,d). Notably elevated RMSD values occurred in the YZRB and PRB, attributable to frequent heavy rainfall events that caused significant discrepancies between satellite retrievals and ground-based observations. The MD displayed a distinct spatial gradient, decreasing from positive biases of 0–20 mm/month (0–100 mm/year) in southeastern coastal regions to near-neutral values in northwestern inland areas (Figure 4e,f). Exceptionally high deviations (up to 20 mm/month and 300 mm/year) were identified in the eastern YZRB and the Sichuan Basin of western China, indicating systematic overestimations by IMERG-F data in these subregions.
The analysis reveals unique spatial distribution patterns of errors across the study regions. Southeastern and southern China exhibit higher PCC values. This result indicates that the data are in better consistency, but are affected by systematic biases, as evidenced by persistent positive bias. In contrast, northwestern regions demonstrate lower PCC levels with ground-based stations, yet maintain smaller overall biases with predominately random errors, suggesting that they are more susceptible to factors such as localized topography rather than systematic errors.

3.4. Spatial Characteristics of Annual Areal and Monthly Areal Precipitation

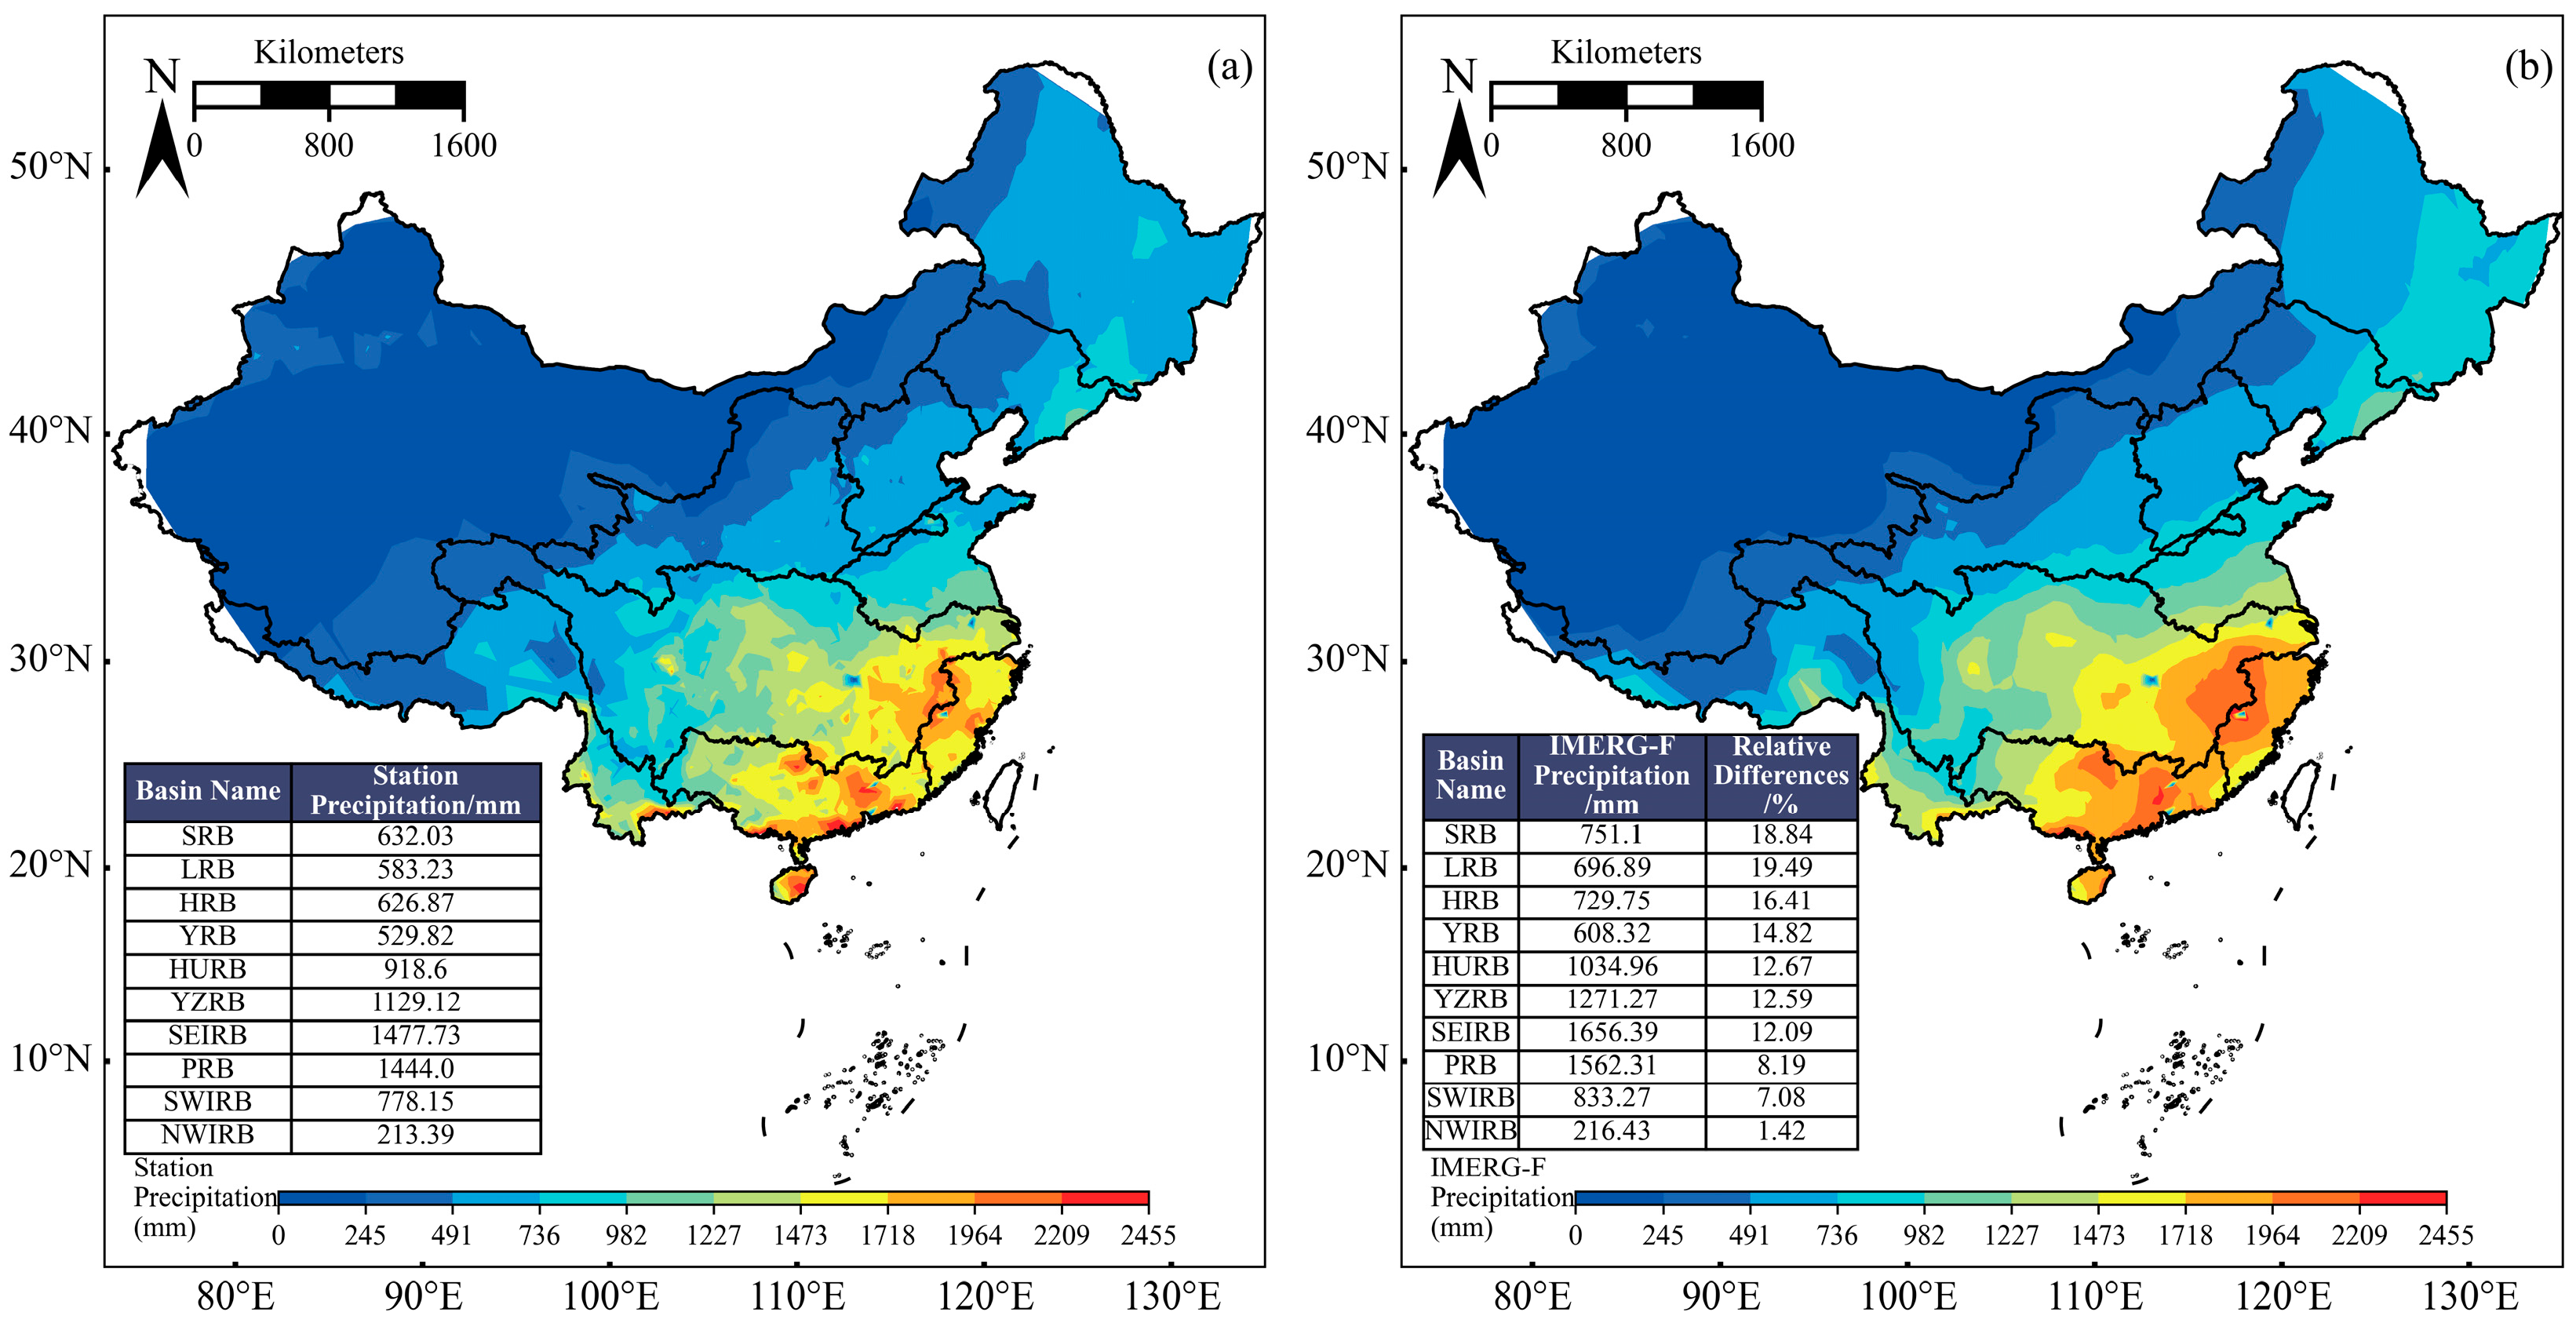
As demonstrated in Figure 5, the multi-year mean areal precipitation estimates derived from IMERG-F satellite products consistently exceeded ground-based observation stations across all river basins. Particularly pronounced discrepancies were identified in the SRB and LRB, where systematic overestimations corresponded to REs of 18–20%. Nevertheless, the IMERG-F dataset demonstrated strong consistency with the spatial distribution patterns of terrestrial precipitation over mainland China. Notably superior performance was observed in the PRB and SWIRB of southern China, where REs remained below 10%, indicating enhanced retrieval accuracy in humid subtropical regions.
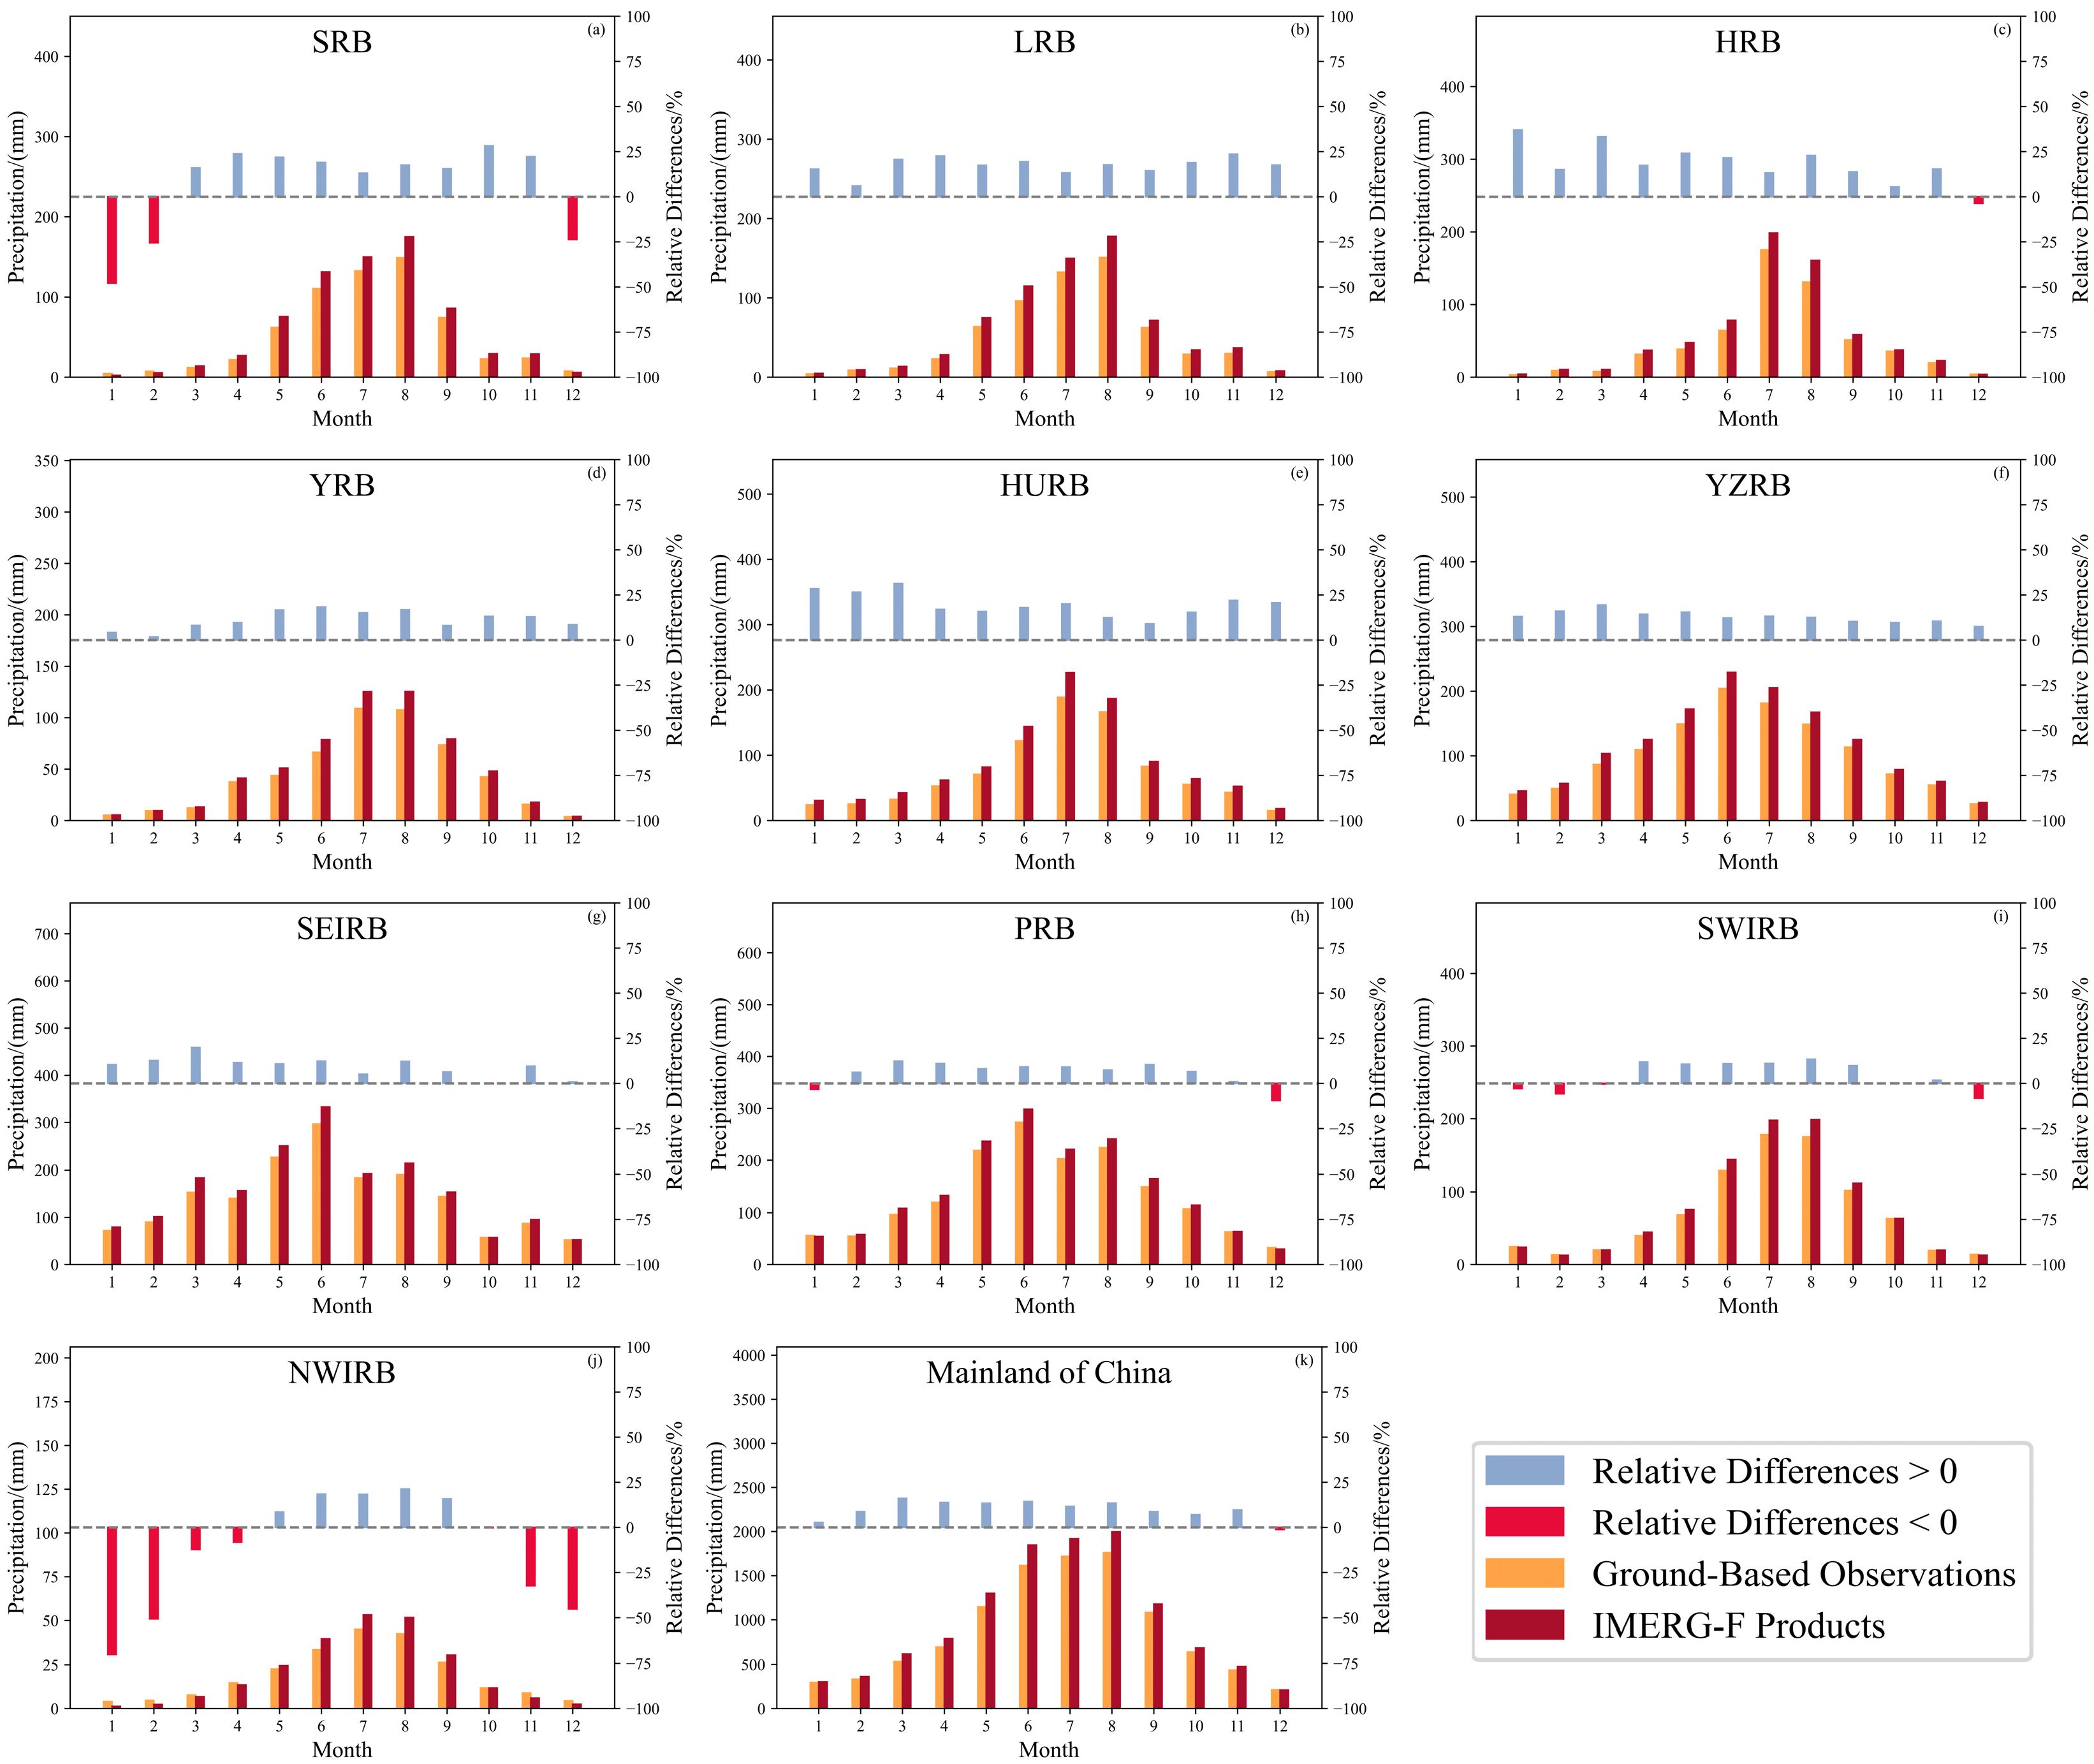
As demonstrated in Figure 6, the IMERG-F-based monthly areal precipitation estimates generally overestimate ground-based observations across river basins (REs below 15%), with the exception of December. Regional disparities reveal a distinct north-to-south gradient: Southern basins, including the PRB and SWIRB, exhibit relatively smaller errors (predominantly below 20%) but show systematic dry-season underestimations, particularly during winter months. In contrast, northern basins display consistent IMERG-F overestimations except for the snow-dominated SRB and NWIRB, where winter precipitation is significantly underestimated (greater than 25% negative bias) despite slight rainy-season overestimations (10–25% positive bias). Notably, error magnitudes exhibit strong seasonal dependence, with amplified uncertainties in winter, particularly in regions with significant precipitation phase shifts (i.e., rain–snow transitions). These patterns highlight critical limitations of the IMERG-F product’s ability to detect snowfall and orographic precipitation during cold seasons, while affirming its improved performance in capturing rainy-season rainfall dynamics.

4. Discussion

4.1. Discussion of Seasonal Deviation

This study identifies seasonal biases of “overestimation in wet seasons and underestimation in dry seasons”, which may stem from challenges in solid precipitation monitoring and topographic complexity. This finding is closely related to previous studies of complex terrain areas. The primary cause of winter underestimation is the inadequate sensitivity of passive microwave (PMW) sensors to solid precipitation and signal scattering interference from snow-/ice-covered surfaces. Overestimation during the wet season is partially attributable to insufficient parameterization of orographic rainfall enhancement. For example, Tang et al. found that IMERG-F underestimates solid precipitation by 30–45% over the Tibetan Plateau. This occurs because PMW sensors struggle to differentiate scattering signals from snow layers and cold land surfaces (<−15 °C) [40]. Another study by Chen et al. assessing IMERG products across mainland China found suboptimal performance during winter, particularly over Xinjiang and the Tibetan Plateau, with prevalent underestimation across most northern regions in winter [43]. Jin et al. investigated the applicability of GPM satellite precipitation products in the Tianshan Mountains. While IMERG products showed higher accuracy than TMPA and CMORPH products, performance was poorer in the complex central Tianshan region. Underestimation was also observed at high altitudes, likely due to the poor detection capability of the Dual-frequency Precipitation Radar (DPR) for snowfall in these areas. Their study further indicated that the estimation capability of satellite precipitation products varies seasonally, performing better in summer and autumn but relatively worse in spring and winter [44]. The study by Ma et al. demonstrated that IMERG products perform well over the Tibetan Plateau, but also noted a lower detection frequency for precipitation events at high altitudes [14]. These findings are highly consistent with the conclusions of the present study. Regarding whether integrating radar or snow cover detection algorithms would be helpful, the answer is affirmative, although the improvement in accuracy would be limited. Pan et al. noted that IMERG satellite precipitation products incorporating GPM information show better accuracy for winter precipitation in mid–high latitudes compared to other satellite products, yet the degree of improvement remains constrained [45]. This can also be regarded as one of the directions for the future improvement of satellite precipitation products.

4.2. Discussion on Different Characteristics

Based on the analysis of eight conventional statistical indicators in this study, the collaborative interpretation of the statistical results provides us with more in-depth diagnostic insights into the different characteristics of IMERG-F and better reveals its inherent correlation patterns with regional hydroclimatic conditions. For instance, in humid river basins such as the SRB and LRB, the combination of a high POD (around 0.8), a relatively high FAR (around 0.4), and a positive RD (around 18%) indicates a systematic tendency toward over-detection. This phenomenon may stem from the retrieval of weak precipitation events. The most significant challenge occurs in the Qinghai–Tibet Plateau region, specifically in the NWIRB and SWIRB. The concurrent presence of a low POD (around 0.6), a high FAR (around 0.5), and a relatively low positive RE (less than 7%) indicates fundamental difficulties in both the detection of precipitation events and the accurate quantification of precipitation intensity. Therefore, this multi-dimensional diagnostic approach advances the discussion from a focus on single performance metrics to a mechanistic understanding of error sources.

5. Conclusions

In the present study, IMERG-F precipitation products from 2415 manned national ground stations in complex terrain basins in mainland China were systematically evaluated. The main conclusions are drawn by analyzing the two dimensions of detection capabilities and statistical indicators:
(1) The IMERG-F product demonstrates robust daily precipitation detection aligned with three-step topographic zonation of China. Superior detection accuracy occurs in southeastern low-altitude basins, contrasting with decreased performance in northwestern regions containing the Sichuan Basin and desert–plateau terrains. This three-tiered accuracy pattern mirrors the national topographic transition from the Tibetan Plateau to eastern coastal plains.
(2) Systematic overestimation is observed in IMERG-F precipitation data compared with ground-based observation stations, with predominantly positive bias values. While strong correlations (PCC = 0.7–0.9) between IMERG-F and station data are achieved in southeastern and southern China (albeit with higher overall biases), northwestern regions exhibit weaker correlations but smaller biases. The IMERG-F product generally overestimates annual rainy-day frequency with notable spatial heterogeneity, though it slightly underestimates precipitation intensity compared with ground-based observation stations.
(3) Annual areal precipitation estimates from IMERG-F systematically exceed ground-based observation station calculations, particularly in the SRB and LRB where REs reach 18–20%. Monthly areal precipitation estimates exhibit significant seasonal variability, showing smaller REs during rainy seasons but larger discrepancies in winter periods. These patterns highlight critical limitations of the IMERG-F product’s ability to detect snowfall and orographic precipitation during the dry season, while affirming its improved performance in capturing rainy-season rainfall dynamics.

Hydrological Implications

Our assessment provides prior knowledge essential for hydrological modeling applications. Firstly, the quantified systematic biases define necessary pre-processing steps. The rainy-season overestimations, if used uncorrected, would introduce systematic errors into precipitation-flood forecasting models, especially in medium-altitude basins. Building on the identified seasonal biases, we emphasize that IMERG-F has the greatest value in short-term flood forecasting in low- and medium-altitude regions (e.g., the HRB, the SEIRB, and the PRB), using its high spatial and temporal resolution to capture locally biased heavy rainfall events. Secondly, the identified uncertainty range dictates appropriate application scenarios. When monitoring drought in arid inland basins (e.g., west of the YRB and east of the NWIRB), although there is underestimation during the dry season, and such underestimation may affect drought early warning systems for basins that rely on snowmelt, IMERG-F’s daily data still provide a critical reference when ground observations are sparse. Therefore, it is necessary to combine them with ground observations for reliable long-term assessment. These findings underscore the necessity of product assessments prior to hydrologic applications in areas with complex terrain.

Author Contributions

Conceptualization, C.Z. and Z.W.; methodology, C.Z. and M.Y.; formal analysis, C.Z. and J.Z.; data curation, C.Z. and Y.T.; writing—original draft preparation, C.Z. and J.L.; writing—review and editing, C.Z., M.X., and Z.W.; supervision, L.S.; funding acquisition, C.Z. and M.X. All authors have read and agreed to the published version of the manuscript.

Funding

This research was jointly supported by the Open Project of the Key Laboratory of Atmospheric Sounding of China Meteorological Administration under Grant 2023KLAS02Z, the Innovation and Development Project of China Meteorological Administration under Grant CXFZ2025J153, the Arctic Pavilion Open Research Fund of Nanjing Joint Institute for Atmospheric Sciences under Grant BJG202410, the National Key Research and Development Plan projects of China under Grant 2022YFC3004101, and the China Scholarship Council program under Grant 202305330027.

Data Availability Statement

The datasets presented in this article are not readily available because the data are part of an ongoing study. Requests to access the datasets should be directed to xumy@cma.gov.cn.

Conflicts of Interest

The authors declare no conflicts of interest.

References

  1. Panziera, L.; Gabella, M.; Germann, U.; Martius, O. A 12-year radar-based climatology of daily and sub-daily extreme precipitation over the Swiss Alps. Int. J. Climatol. 2018, 38, 3749–3769. [Google Scholar] [CrossRef]
  2. Cai, Y.C.; Jin, C.J.; Wang, A.Z.; Guan, D.X.; Wu, J.B.; Yuan, F.H.; Xu, L.L. Comprehensive precipitation evaluation of TRMM 3B42 with dense rain gauge networks in a midlatitude basin, northeast China. Theor. Appl. Climatol. 2016, 126, 659–671. [Google Scholar] [CrossRef]
  3. Chen, H.Q.; Wen, D.B. Dependency of errors for four global reanalysis and satellite precipitation estimates on four crucial factors. Atmos. Res. 2023, 296, 107076. [Google Scholar] [CrossRef]
  4. Dogra, A.; Thakur, J.; Tandon, A. Do satellite-based products suffice for rainfall observations over data-sparse complex terrains? Evidence from the North-Western Himalayas. Remote Sens. Environ. 2023, 299, 113855. [Google Scholar] [CrossRef]
  5. Li, X.H.; Zhang, Q.; Xu, C.Y. Suitability of the TRMM satellite rainfalls in driving a distributed hydrological model for water balance computations in Xinjiang catchment, Poyang lake basin. J. Hydrol. 2012, 426–427, 28–38. [Google Scholar] [CrossRef]
  6. Du, L.T.; Tian, Q.J.; Yu, T.; Meng, Q.Y.; Jancso, T.; Udvardy, P.; Huang, Y. A comprehensive drought monitoring method integrating MODIS and TRMM data. Int. J. Appl. Earth Obs. 2013, 23, 245–253. [Google Scholar] [CrossRef]
  7. Tang, G.Q.; Li, Z.; Xue, X.W.; Hu, Q.F.; Yong, B.; Hong, Y. A study of substitutability of TRMM remote sensing precipitation for gauge-based observation in Ganjiang River basin. Adv. Water Sci. 2015, 26, 340–346. [Google Scholar]
  8. Guo, R.F.; Liu, Y.B. Multi-satellite retrieval of high-resolution precipitation: An overview. Adv. Earth Sci. 2015, 30, 891–903. [Google Scholar]
  9. Mo, C.X.; Lei, X.B.; Mo, X.X.; Ruan, R.L.; Tang, G.; Li, L.G.; Sun, G.K.; Jiang, C.H. Comprehensive evaluation and comparison of ten precipitation products in terms of accuracy and stability over a typical mountain basin, Southwest China. Atmos. Res. 2024, 297, 107116. [Google Scholar] [CrossRef]
  10. Gilewski, P.; Nawalany, M. Inter-comparison of rain-gauge, radar, and satellite (IMERG GPM) precipitation estimates performance for rainfall-runoff modeling in a mountainous catchment in Poland. Water 2018, 10, 1665. [Google Scholar] [CrossRef]
  11. Ahmed, E.; Al Janabi, F.; Zhang, J.; Yang, W.Y.; Saddique, N.; Krebs, P. Hydrologic assessment of TRMM and GPM-Based precipitation products in transboundary river catchment (Chenab River, Pakistan). Water 2020, 12, 1902. [Google Scholar] [CrossRef]
  12. Wang, X.N.; Ding, Y.J.; Zhao, C.C.; Wang, J. Similarities and improvements of GPM IMERG upon TRMM 3B42 precipitation product under complex topographic and climatic conditions over Hexi region, Northeastern Tibetan Plateau. Atmos. Res. 2019, 218, 347–363. [Google Scholar] [CrossRef]
  13. Yuan, F.; Zhang, L.M.; Win, K.W.W.; Ren, L.L.; Zhao, C.X.; Zhu, Y.H.; Jiang, S.H.; Liu, Y. Assessment of GPM and TRMM multi-satellite precipitation products in streamflow simulations in a data-sparse mountainous watershed in Myanmar. Remote Sens. 2017, 9, 302. [Google Scholar] [CrossRef]
  14. Ma, Y.Z.; Tang, G.Q.; Long, D.; Yong, B.; Zhong, L.Z.; Wan, W.; Hong, Y. Similarity and error intercomparison of the GPM and its predecessor-TRMM multisatellite precipitation analysis using the best available hourly gauge network over the Tibetan Plateau. Remote Sens. 2016, 8, 569. [Google Scholar] [CrossRef]
  15. Tan, M.L.; Santo, H. Comparison of GPM IMERG, TMPA 3B42 and PERSIANN-CDR satellite precipitation products over Malaysia. Atmos. Res. 2018, 202, 63–76. [Google Scholar] [CrossRef]
  16. Muhammad, W.; Yang, H.B.; Lei, H.M.; Muhammad, A.; Yang, D.W. Improving the regional applicability of satellite precipitation products by ensemble algorithm. Remote Sens. 2018, 10, 577. [Google Scholar] [CrossRef]
  17. Satgé, F.; Hussain, Y.; Bonnet, M.-P.; Hussain, B.M.; Martinez-Carvajal, H.; Akhter, G.; Uagoda, R. Benefits of the successive GPM Based satellite precipitation estimates IMERG–V03, –V04, –V05 and GSMaP–V06, –V07 over diverse geomorphic and meteorological regions of Pakistan. Remote Sens. 2018, 10, 1373. [Google Scholar] [CrossRef]
  18. Geng, H.P.; Pan, B.T.; Huang, B.; Cao, B.; Gao, H.S. The spatial distribution of precipitation and topography in the Qilian Shan Mountains, northeastern Tibetan Plateau. Geomorphology 2017, 297, 43–54. [Google Scholar] [CrossRef]
  19. Chen, J.C.; Wang, Z.L.; Wu, X.S.; Chen, X.H.; Lai, C.G.; Zeng, Z.Y.; Li, J. Accuracy evaluation of GPM multi-satellite precipitation products in the hydrological application over alpine and gorge regions with sparse rain gauge network. Hydrol. Res. 2019, 50, 1710–1729. [Google Scholar] [CrossRef]
  20. Liu, J.Z.; Duan, Z.; Jiang, J.C.; Zhu, A.-X. Evaluation of three satellite precipitation products TRMM 3B42, CMORPH, and PERSIANN over a subtropical watershed in China. Adv. Meteorol. 2015, 1, 151239. [Google Scholar] [CrossRef]
  21. Ali, A.F.; Xiao, C.D.; Anjum, M.N.; Adnan, M.; Nawaz, Z.; Ijaz, M.W.; Sajid, M.; Farid, H.U. Evaluation and comparison of TRMM multi-satellite precipitation products with reference to rain gauge observations in Hunza River Basin, Karakoram Range, Northern Pakistan. Sustainability 2017, 9, 1954. [Google Scholar] [CrossRef]
  22. Tang, X.; Li, H.X.; Qin, G.H.; Huang, Y.Y.; Qi, Y.L. Evaluation of satellite-based precipitation products over complex topography in mountainous Southwestern China. Remote Sens. 2023, 15, 473. [Google Scholar] [CrossRef]
  23. Eini, M.R.; Olyaei, M.A.; Kamyab, T.; Teymoori, J.; Brocca, L.; Piniewski, M. Evaluating three non-gauge-corrected satellite precipitation estimates by a regional gauge interpolated dataset over Iran. J. Hydrol.-Reg. Stud. 2021, 38, 100942. [Google Scholar] [CrossRef]
  24. Nan, L.J.; Yang, M.X.; Wang, H.; Xiang, Z.L.; Hao, S.K. Comprehensive evaluation of Global Precipitation Measurement Mission (GPM) IMERG precipitation products over Mainland China. Water 2021, 13, 3381. [Google Scholar] [CrossRef]
  25. Tang, S.X.; Li, R.; He, J.X.; Wang, H.; Fan, X.G.; Yao, S.Y. Comparative evaluation of the GPM IMERG early, late, and final hourly precipitation products using the CMPA data over Sichuan Basin of China. Water 2020, 12, 554. [Google Scholar] [CrossRef]
  26. Liu, S.H.; Yan, D.H.; Wang, H.; Li, C.Z.; Qin, T.L.; Weng, B.S.; Xing, Z.Q. Evaluation of TRMM 3B42V7 at the basin scale over mainland China. Adv. Water Sci. 2016, 27, 639–651. [Google Scholar]
  27. Liao, R.W.; Zhang, D.B.; Shen, Y. Validation of six satellite-derived rainfall estimates over China. Meteorol. Mon. 2015, 41, 970–979. [Google Scholar]
  28. Liu, Y.J.; Chen, J.; Pan, T. Analysis of changes in reference evapotranspiration, pan evaporation, and actual evapotranspiration and their influencing factors in the North China plain during 1998–2005. Earth Space Sci. 2019, 6, 1366–1377. [Google Scholar] [CrossRef]
  29. Hirji, R.; Panella, T. Evolving policy reforms and experiences for addressing downstream impacts in World Bank water resources projects. River Res. Appl. 2003, 19, 667–681. [Google Scholar] [CrossRef]
  30. Zhai, J.Q.; Liu, B.; Hartmann, H.; Su, B.D.; Jiang, T.; Fraedrich, K. Dryness/wetness variations in China during the first 50 years of the 21st century. Hydrol. Earth Syst. Sci. Discuss. 2009, 6, 1385–1409. [Google Scholar]
  31. Li, Y.; Ding, J.; Zhang, L.Y.; Liu, X.S.; Wang, G.Y. Occurrence and ranking of pharmaceuticals in the major rivers of China. Sci. Total Environ. 2019, 696, 133991. [Google Scholar] [CrossRef]
  32. Wang, H.; Gao, J.B.; Hou, W.J. Quantitative attribution analysis of soil erosion in different morphological types of geomorphology in karst areas: Based on the geographical detector method. J. Geogr. Sci. 2019, 29, 271–286. [Google Scholar] [CrossRef]
  33. Yue, Y.; Ni, J.R.; Borthwick, A.G.L.; Miao, C.Y. Diagnosis of river basins as CO2 sources or sinks subject to sediment movement. Earth Surf. Proc. Land. 2012, 37, 1398–1406. [Google Scholar] [CrossRef]
  34. Yang, H.C.; Wang, G.Q.; Jiang, H.; Fang, H.Y.; Ishidaira, H. Integrated modeling approach to the response of soil erosion and sediment export to land-use change at the basin scale. J. Hydrol. Eng. 2014, 20, C4014003. [Google Scholar] [CrossRef]
  35. Zhao, Y.; Pei, Y.S. A study on distributed simulation of soil wind erosion and its application to the Tuhaimajia River Basin. Procedia Environ. Sci. 2010, 2, 1555–1568. [Google Scholar] [CrossRef]
  36. Ren, G.Y.; Zhan, Y.J.; Ren, Y.Y.; Chen, Y.; Wang, T.; Liu, Y.J.; Sun, X.B. Spatial and temporal patterns of precipitation variability over mainland China: I: Climatology. Adv. Water Sci. 2015, 26, 299–310. [Google Scholar]
  37. Chen, D.L.; Ou, T.H.; Gong, L.B.; Xu, C.-Y.; Li, W.J.; Ho, C.-H.; Qian, W.H. Spatial interpolation of daily precipitation in China: 1951–2005. Adv. Atmos. Sci. 2010, 27, 1221–1232. [Google Scholar] [CrossRef]
  38. Lu, G.Y.; Wong, D.W. An adaptive inverse-distance weighting spatial interpolation technique. Comput. Geosic. 2008, 34, 1044–1055. [Google Scholar] [CrossRef]
  39. Gebregiorgis, A.; Hossain, F. How much can a priori hydrologic model predictability help in optimal merging of satellite precipitation products? J. Hydrometeorol. 2011, 12, 1287–1298. [Google Scholar] [CrossRef]
  40. Tang, G.; Clark, M.P.; Papalexiou, S.M.; Ma, Z.; Hong, Y. Have satellite precipitation products improved over last two decades? A comprehensive comparison of GPM IMERG with nine satellite and reanalysis datasets. Remote Sens. Environ. 2020, 240, 111697. [Google Scholar] [CrossRef]
  41. Beck, H.E.; Wood, E.F.; Pan, M.; Fisher, C.K.; Miralles, D.G.; van Dijk, A.I.J.M.; McVicar, T.R.; Adler, R.F. MSWEP V2 global 3-hourly 0.1° precipitation: Methodology and quantitative assessment. Bull. Am. Meteorol. Soc. 2018, 100, 473–500. [Google Scholar] [CrossRef]
  42. Salio, P.; Hobouchian, M.P.; Skabar, Y.G.; Vila, D. Evaluation of high-resolution satellite precipitation estimates over southern South America using a dense rain gauge network. Atmos. Res. 2015, 163, 146–161. [Google Scholar] [CrossRef]
  43. Chen, F.R.; Li, X. Evaluation of IMERG and TRMM 3B43 monthly precipitation products over mainland China. Remote Sens. 2016, 8, 472. [Google Scholar] [CrossRef]
  44. Jin, X.L.; Shao, H.; Zhang, C.; Yan, Y. The applicability evaluation of three satellite products in Tianshan mountains. J. Nat. Resour. 2016, 31, 2074–2085. [Google Scholar]
  45. Pan, Y.; Gu, J.X.; Shi, C.X.; Wang, Z. Assessment and merged optimization of multi-source winter precipitation products over northern China. Acta Meteorol. Sin. 2022, 80, 953–966. [Google Scholar]
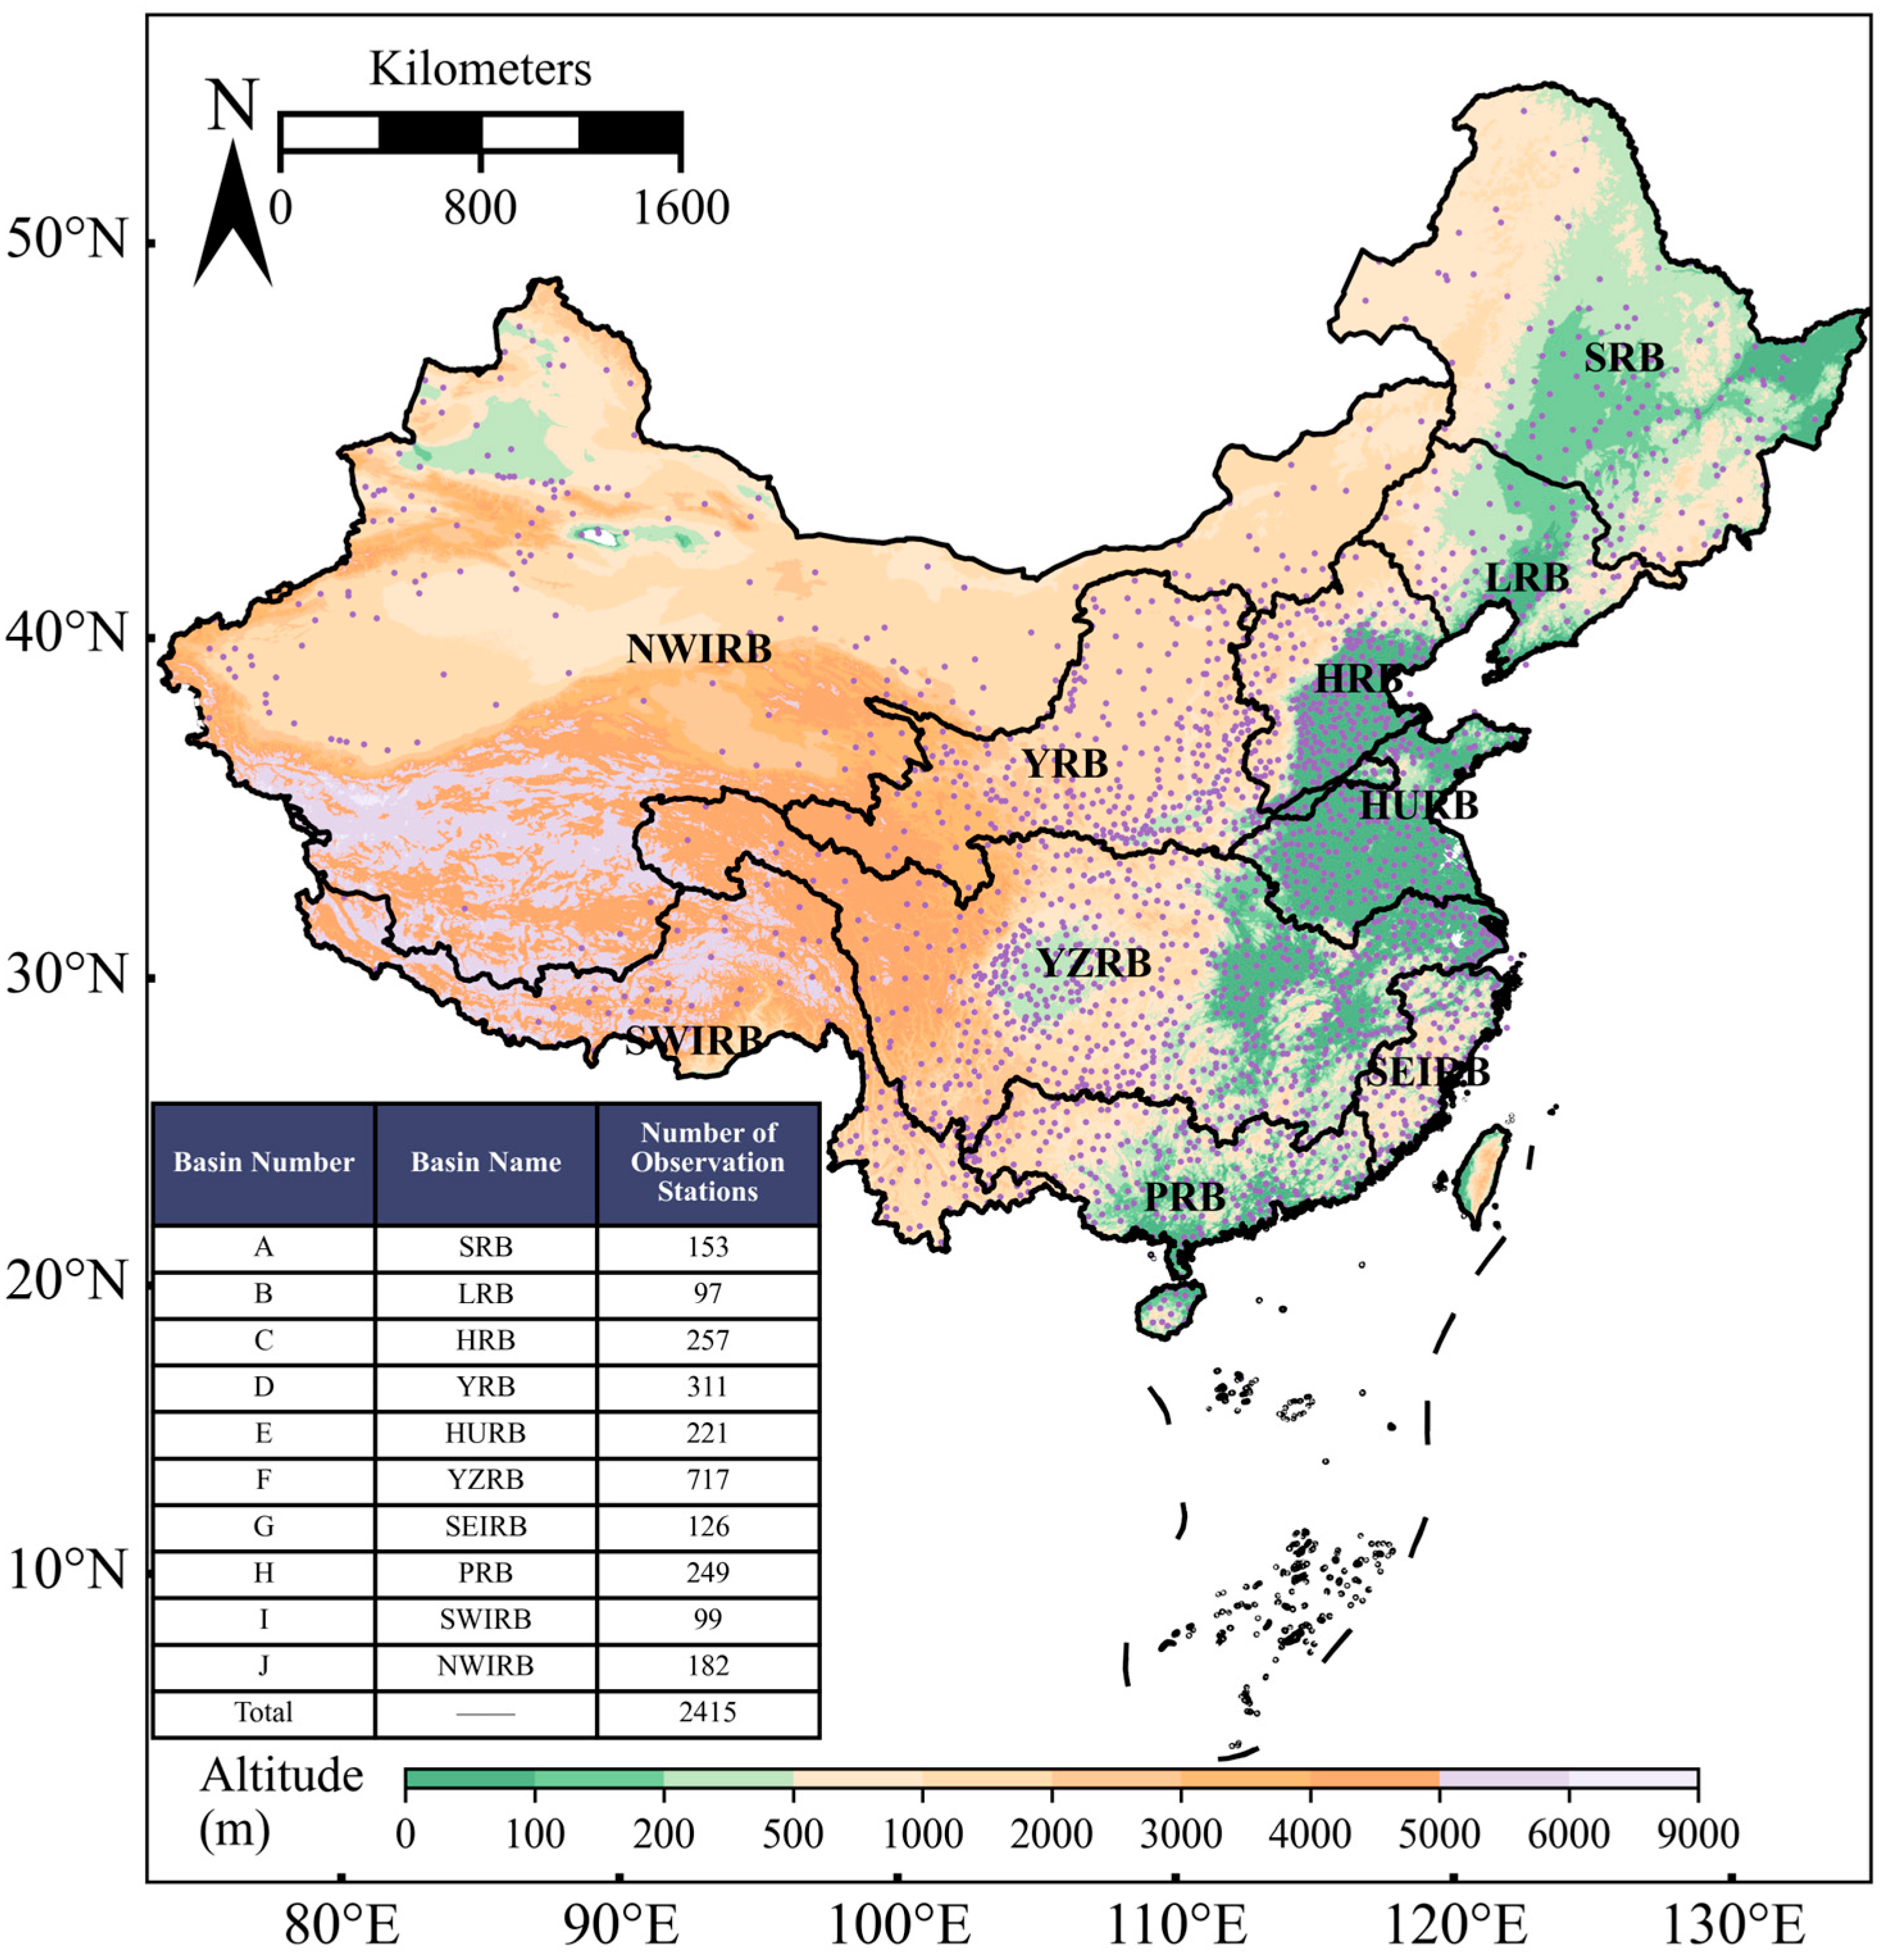
Figure 1. Basin topography and spatial distribution of national-level manned stations in mainland China. SRB: Songhua River Basin; LRB: Liao River Basin; HRB: Hai River Basin; YRB: Yellow River Basin; HURB: Huai River Basin; YZRB: Yangtze River Basin; SEIRB: Southeast Inland Rivers Basin; PRB: Pearl River Basin; SWIRB: Southwest Inland Rivers Basin; and NWIRB: Northwest Inland Rivers Basin.
Remotesensing 17 03534 g001
Figure 2. Spatial distribution of IMERG-F metrics of daily precipitation detection capability. (The values are derived from the point-to-pixel comparison where ground stations are matched to the corresponding 1 × 1 km grid cell of the resampled IMERG product.) (a) probability of detection (POD); (b) accuracy (ACC); (c) critical success index (CSI); (d) false alarm ratio (FAR).
Remotesensing 17 03534 g002
Figure 3. Distribution of annual precipitation frequency and intensity (daily precipitation amount) in mainland China (the values are derived from the point-to-pixel comparison where ground stations are matched to the corresponding 1 × 1 km grid cell of the resampled IMERG product): (a) frequency from ground-based observation stations; (b) frequency from IMERG-F products; (c) intensity from ground-based observation stations; (d) intensity from IMERG-F products.
Remotesensing 17 03534 g003
Figure 4. Correlation and bias distribution of satellite inversions of precipitation and observation stations (the values are derived from the point-to-pixel comparison where ground stations are matched to the corresponding 1 × 1 km grid cell of the resampled IMERG product): (a) Pearson correlation coefficient (PCC) on monthly scales; (b) PCC on annual scales; (c) root mean square difference (RMSD) on monthly scales; (d) RMSD on annual scales; (e) mean difference (MD) on monthly scales; (f) MD on annual scales.
Remotesensing 17 03534 g004
Figure 5. Spatial distribution of multi-year average precipitation from IMERG-F products and ground-based meteorological observations: (a) station precipitation; (b) IMERG-F precipitation.
Remotesensing 17 03534 g005
Figure 6. Comparison of monthly mean areal precipitation between ground-based observations and IMERG-F products in various basins in mainland China: (a) SRB; (b) LRB; (c) HRB; (d) YRB; (e) HURB; (f) YZRB; (g)SEIRB; (h) PRB; (i) SWIRB; (j) NWIRB; (k) all basins.
Remotesensing 17 03534 g006
Table 1. Basic situation of each river basin.
River Basin NameApproximate Drainage Area (km2)Precipitation Characteristics
Songhua River Basin 921,000Precipitation is relatively plentiful and water vapor conditions are good [31].
Liao River Basin314,900Water resources are relatively scarce.
Hai River Basin318,300Severe water scarcity issues due to high population density/water demand combined with limited seasonal rainfall. Frequent historical flooding.
Yellow River Basin794,500Highly influenced by monsoons, but overall drier than southern basins. Precipitation concentrated in summer (Jul-Sep), causing most runoff. Soil erosion is serious on the Loess Plateau, which accounts for most of the basin area [32,33,34,35]. The river basin is susceptible to drought and flooding.
Huai River Basin 328,700Historically prone to severe flooding due to flat terrain, monsoon intensity, and its position between the Yellow and Yangtze floodplains.
Yangtze River Basin 1,780,500It has a vast water system, with numerous lakes connected to it, and extremely rich water resources.
Southeast Inland
Rivers Basin
201,400The basin has relatively abundant precipitation and is crisscrossed by several short rivers.
Pearl River Basin 575,300The precipitation is abundant, and the rivers in the basin flow very well.
Southwest Inland
Rivers Basin
851,500Affected by both the monsoon climate and the plateau–mountain climate, there are significant differences in the seasonal variation in precipitation.
Northwest Inland
Rivers Basin
3,358,500There are mostly inland lakes in the basin; therefore, the ecological environment is extremely fragile, precipitation is scarce, and the rational utilization of water resources is crucial.
Table 2. Precipitation event detection results.
Precipitation Detection ResultsObserved Results a
PrecipitationNo Precipitation
IMERG-FPrecipitationHitsFalse alarms
No PrecipitationMissesCorrect negatives
a A threshold of 1 mm per day is used to determine the presence or absence of precipitation events.
Table 3. Precipitation detection performance metrics.
MetricFormulaIdeal Value
Probability of Detection (POD) P O D = H i t s H i t s + M i s s e s 1
Accuracy (ACC) A C C = H i t s + C o r r e c t   H i t s + M i s s e s s + F a l s e + C o r r e c t 1
Critical Success Index (CSI) C S I = H i t s H i t s + M i s s e s + F a l s e 1
False Alarm Ratio (FAR) F A R = F a l s e H i t s + F a l s e 0
Disclaimer/Publisher’s Note: The statements, opinions and data contained in all publications are solely those of the individual author(s) and contributor(s) and not of MDPI and/or the editor(s). MDPI and/or the editor(s) disclaim responsibility for any injury to people or property resulting from any ideas, methods, instructions or products referred to in the content.