Article

Impacts of Aerosol Optical Depth on Different Types of Cloud Macrophysical and Microphysical Properties over East Asia

1
National Institute of Natural Hazards, Ministry of Emergency Management of China, Beijing 100085, China
2
State Key Laboratory of Pulsed Power Laser, College of Electronic Engineering, National University of Defense Technology, Hefei 230037, China
3
Chaoyang District Meteorological Service, Beijing Meteorological Bureau, Beijing 100016, China
4
State Key Laboratory of Atmospheric Environment and Extreme Meteorology, Institute of Atmospheric Physics, Chinese Academy of Sciences, Beijing 100029, China
*
Author to whom correspondence should be addressed.
Remote Sens. 2025, 17(21), 3535; https://doi.org/10.3390/rs17213535 (registering DOI)
Submission received: 20 August 2025 / Revised: 8 October 2025 / Accepted: 23 October 2025 / Published: 25 October 2025

Highlights

What are the main findings?
  • Aerosols modulate three-dimensional cloud structures by enhancing convective and high-level ice-phase development while suppressing stratiform and low-level cloud growth.
  • After controlling for meteorological factors, AOD significantly influences cloud properties, demonstrating independent and cloud-type-dependent aerosol effects.
What is the implication of the main finding?
  • Accounting for cloud-type differences, moisture conditions, and dynamic processes is essential for more accurate assessments of aerosol–cloud–climate interactions.
  • The findings provide observational evidence that can help improve the parameterization of the indirect effects of aerosols in climate models.

Abstract

Aerosol–cloud interaction remains one of the largest sources of uncertainty in weather and climate modeling. This study investigates the impacts of aerosols on the macro- and microphysical properties of different cloud types over East Asia, based on nine years of joint satellite observations from CloudSat, CALIPSO, and MODIS, combined with ERA5 reanalysis data. Results reveal pronounced cloud-type dependence in aerosol effects on cloud fraction, cloud top height, and cloud thickness. Aerosols enhance the development of convective clouds while suppressing the vertical extent of stable stratiform clouds. For ice-phase structures, ice cloud fraction and ice water path significantly increase with aerosol optical depth (AOD) in deep convective and high-level clouds, whereas mid- to low-level clouds exhibit reduced ice crystal effective radius and ice water content, indicating an “ice crystal suppression effect.” Even after controlling for 14 meteorological variables, partial correlations between AOD and cloud properties remain significant, suggesting a degree of aerosol influence independent of meteorological conditions. Humidity and wind speed at different altitudes are identified as key modulating factors. These findings highlight the importance of accounting for cloud-type differences, moisture conditions, and dynamic processes when assessing aerosol–cloud–climate interactions and provide observational insights to improve the parameterization of aerosol indirect effects in climate models.

1. Introduction

Aerosols, as a key component of the Earth’s atmosphere, play a critical role in cloud formation and evolution through complex physical and chemical processes [1,2]. Depending on their source, size, composition, and concentration, aerosols can act as cloud condensation nuclei (CCN) or ice-nucleating particles (INPs), thereby influencing the microphysical properties of clouds (e.g., droplet number, size, and liquid water content) as well as their macrophysical characteristics (e.g., thickness, vertical development, lifetime, and radiative properties) [3,4]. Due to their high variability and complexity, aerosol–cloud interactions (ACIs) represent one of the largest uncertainties in current climate models and have drawn significant attention from the Intergovernmental Panel on Climate Change (IPCC) [5].
At the microphysical level, increased aerosol concentrations typically enhance cloud droplet number and reduce droplet radius—a phenomenon known as the Twomey effect. This suppresses precipitation in warm clouds, prolongs cloud lifetime, and increases cloud albedo, thereby affecting the Earth’s radiative balance. In ice or mixed-phase clouds, aerosols influence ice water content and precipitation efficiency by altering ice nucleation pathways. These processes are not only dependent on aerosol type but are also strongly modulated by cloud type, altitude, and ambient meteorological conditions [6,7,8]. At the macroscopic scale, aerosol-induced changes in cloud microphysics can further alter cloud vertical structure, spatial extent, optical thickness, and even cloud lifetime. In convective systems, high aerosol concentrations can delay warm rain formation, allowing more cloud water to ascend and release latent heat upon freezing, thereby enhancing updrafts—a process known as the aerosol invigoration effect [9]. This effect has been widely supported by both observational and modeling studies, particularly over heavily polluted continental regions [10,11,12,13,14,15]. However, under certain thermodynamic conditions, excessive aerosol loading may suppress convection, indicating that this mechanism is highly nonlinear and regime-dependent [16,17,18,19,20].
Aerosol-induced cloud modulation exhibits pronounced variability across different cloud types. Stratiform clouds (e.g., stratocumulus) are particularly sensitive to aerosol-driven microphysical changes, typically characterized by increased droplet number concentration and reduced droplet radius, which enhance cloud albedo and extend cloud lifetime (i.e., Twomey and Albrecht effects) [21,22]. While the development of cumulus and deep convective clouds is primarily governed by thermodynamic and dynamic processes, aerosols can modulate their precipitation efficiency and vertical structure by delaying warm rain onset, intensifying updrafts, and enhancing latent heat release during freezing—an effect that is nonlinear and regime-dependent (aerosol invigoration effect) [19,23,24,25]. In high-level ice clouds such as cirrus, cloud formation is strongly influenced by heterogeneous ice nucleation, with dust and black carbon aerosols playing critical roles due to their ice-nucleating capabilities [26,27,28]. These mechanisms collectively underscore that aerosol–cloud interactions are not only cloud-type specific but also strongly modulated by environmental meteorological conditions and aerosol physicochemical properties.
Despite substantial progress in understanding ACIs, quantifying and attributing their impacts remain highly challenging [29]. In situ and ground-based observational data are often constrained by limited temporal and spatial coverage, whereas satellite-based retrievals may be affected by uncertainties arising from the overlap of aerosol and cloud signals [30]. While numerical simulations serve as powerful tools, they are constrained by uncertainties in parameterization schemes and scale mismatches [13,31]. Moreover, complex interactions between aerosols and meteorological conditions—such as humidity, wind shear, and atmospheric stability—further complicate the analysis [32,33]. In recent years, the advancement of multi-platform observation systems, including ground-based lidars, cloud radars, aircraft campaigns, and satellite remote sensing, has significantly improved our ability to investigate aerosol effects on various cloud types [34,35]. These developments offer new opportunities to explore cloud-type-specific aerosol responses under diverse meteorological regimes.
Although significant progress has been made in aerosol–cloud interaction research in recent years, systematic observational studies on the effects of aerosols on both the macro- and microphysical properties of different cloud types remain limited, particularly over East Asia [36,37,38]. Clouds play a crucial role in regulating the water cycle and energy balance in the climate system, and cloud observations are essential for improving our understanding of cloud processes and enhancing the performance of weather and climate models [39]. While extensive research has been conducted on aerosol interactions with liquid and mixed-phase clouds [7,15,40,41,42,43], much less attention has been given to other cloud types—especially cirrus clouds, which are globally widespread and account for approximately 30% of total cloud coverage [44,45,46,47]. Therefore, there is an urgent need for more observational studies on aerosol effects on different cloud types in East Asia, with a particular focus on ice-phase clouds.
This study systematically analyzes the macro- and microphysical responses of eight cloud types to aerosol optical depth (AOD) using nine years of multi-source satellite observations. The column AOD is used as a proxy for aerosol loading to investigate its interactions with various cloud types. The study focuses on East Asia (70–135°E, 15–55°N; see Figure 1), a region characterized by vast spatial extent, complex topography, and intense anthropogenic aerosol emissions [26,27].

2. Materials and Methods

2.1. Sources and Collocation of Satellite Retrievals

In this study, the collocated aerosol and cloud property datasets are primarily derived from sensors aboard the “A-Train” satellite constellation, including CALIOP (Cloud–Aerosol Lidar with Orthogonal Polarization) on CALIPSO (NASA Langley Research Center, Hampton, VA, USA, and CNES, Paris, France), MODIS (Moderate Resolution Imaging Spectroradiometer) on Aqua (NASA Goddard Space Flight Center, Greenbelt, MD, USA), and CloudSat (NASA Jet Propulsion Laboratory, Pasadena, CA, USA) observations from 2007 to 2015. Aerosol optical depth (AOD) data are obtained from the MODIS/Aqua joint atmospheric product MYDATM (Level 2, Collection 6.1), with a spatial resolution of 10 km. Cloud properties are provided at a 5 km resolution, either from original 5 km products or aggregated from 1 km pixels in a 5 × 5 sampling window.
CALIOP Level 2 products (05kmMLay, Version 4.1) provide vertically resolved aerosol and cloud layer information, including layer number, layer optical depth, feature classification flags (with aerosol type identification), Cloud–Aerosol Discrimination (CAD) scores, and extinction quality control flags, with a horizontal resolution of 5 km along-track. Additionally, we utilize the 2B-CLDCLASS-LIDAR product (Version P1_R05), which integrates Cloud Profiling Radar (CPR) aboard CloudSat and CALIOP observations to classify cloud subtypes and retrieve macrophysical parameters such as cloud base height, cloud top height, and cloud layer boundaries, along with cloud phase and its confidence level, at a horizontal resolution of approximately 1.7 km along-track.
To account for meteorological influences, the collocated ECMWF-AUX product (European Centre for Medium-Range Weather Forecasts, Reading, UK) is incorporated, providing key atmospheric variables such as convective available potential energy (CAPE), wind shear, vertically resolved pressure, vertical velocity, and wind speed at the same horizontal resolution as the CloudSat observations. Table 1 summarizes the data used in this study.
We performed a collocation of satellite-retrieved aerosol and cloud property data. Specifically, we selected vertical profiles from the CloudSat–CALIOP joint product (2B-CLDCLASS-LIDAR) with a 1.7 km along-track resolution as the reference dataset due to its high spatial resolution and detailed cloud vertical structure information. All aerosol, cloud, and meteorological data from other sensors were then matched to these reference profiles. Because AOD can only be retrieved in cloud-free areas and MODIS often fails to provide valid values under cloudy conditions, we extracted all available AOD pixels from the MYDATML2 product (10 × 10 km resolution) within a 50 km radius of each CloudSat–CALIOP profile and averaged them to obtain a representative estimate of aerosol loading. The selection of a 50 km radius was based on two main considerations: (1) Previous studies have shown that mesoscale variability (40–400 km) is a common feature of lower tropospheric aerosol extinction [48]. From a spatial correlation perspective, Omar et al. (2013) found that aerosol autocorrelation coefficients drop below 80% beyond 40 km, indicating strong spatial coherence within this range [49]. (2) Based on extensive preliminary experiments, a 50 km threshold was determined to provide enough valid AOD samples while minimizing the statistical error of regional AOD averages. In addition, we used the “cloud layer” variable from the 2B-CLDCLASS-LIDAR product to identify single-layer cloud profiles (1.7 km along-track resolution) and selected samples with valid quality assurance flags (20 ≤ CAD score ≤ 100, Extinction QC = 0/1) to ensure data reliability.
Secondly, all satellite data were temporally synchronized. The observation time difference is approximately 17.5 s between CloudSat and CALIPSO and about 72.5 s between CALIPSO and Aqua. Considering orbital drift and data sampling uncertainties, a temporal matching tolerance of ±70 s (approximately one standard deviation) was applied in the algorithm. After 2012, due to battery issues with CloudSat, the time difference between CloudSat and MODIS increased to approximately 4–5 min. To correct this discrepancy, the MODIS-CloudSat matching time was uniformly adjusted by delaying it by 5 min during subsequent data preprocessing. Based on satellite overpass times, the nearest ERA5 time steps were identified, and the corresponding data were matched to the CloudSat–CALIOP profiles within the nearest 0.25° × 0.25° ERA5 grid cells.
Finally, further screening was applied to the CPR/CloudSat reference track data. To ensure the accuracy of cloud-type identification, only single-layer cloud profiles were retained, allowing for a clearer analysis of aerosol–cloud interactions associated with specific cloud types. As illustrated in Figure 2, the vertical distribution of the identified convective clouds is shown, along with a schematic representation of the spatiotemporal collocation among CALIPSO, CloudSat, and MODIS in the vertical dimension.

2.2. Determination of Cloud Types

In this study, the 2B-CLDCLASS-LIDAR product was primarily used for cloud-type classification. This product integrates observations from the CPR aboard CloudSat and the CALIOP lidar aboard CALIPSO, classifying clouds into eight categories: stratus, stratocumulus, cumulus, nimbostratus, altocumulus, altostratus, deep convective clouds, and cirrus. By combining lidar and radar measurements of cloud vertical structure, 2B-CLDCLASS-LIDAR enables more comprehensive cloud detection and significantly improves classification accuracy. CPR is more effective at detecting ice particles in mixed-phase clouds, while lidar is more sensitive to liquid water droplets; their synergistic observations thus offer more reliable cloud phase identification [51]. Furthermore, the product determines the phase of each cloud layer, providing essential information for accurate cloud-type classification [52,53].

2.3. Partial Correlation Analysis

Meteorological conditions may act as potential confounding factors in the relationship between aerosol and cloud properties. To isolate the influence of aerosols, this study employs partial correlation analysis, controlling for relevant meteorological variables, to examine their independent association with cloud properties. The partial correlation coefficient between two variables, X and Y , controlling for a third variable Z , is calculated using the following formula:
r X Y · Z = r X Y r X Z r Y Z ( 1 r X Z 2 ) ( 1 r Y Z 2 )
where r X Y · Z is the partial correlation coefficient between X and Y , controlling for Z , and r X Y , r X Z , and r Y Z are the Pearson correlation coefficients between the respective pairs of variables.
This method allows us to assess the direct relationship between AOD and cloud properties while minimizing the confounding influence of meteorological conditions.

3. Results

3.1. Effects of AOD on the Three-Dimensional Structures of Different Cloud Types

Table 2 presents the sample sizes of eight cloud types over East Asia during 2005–2017. The results indicate that cirrus and cumulus clouds have the largest sample sizes, followed by stratocumulus, altocumulus, and altostratus clouds, while nimbostratus, deep convective, and stratus clouds are less represented. Previous studies have shown that different cloud types exhibit significant differences in both macrophysical and microphysical properties [54,55,56]. Accordingly, this study further examines the effects of aerosols on the macrophysical (e.g., cloud fraction, cloud top height, and cloud thickness) and microphysical (e.g., effective radius and ice water path of ice clouds) characteristics of various cloud types.
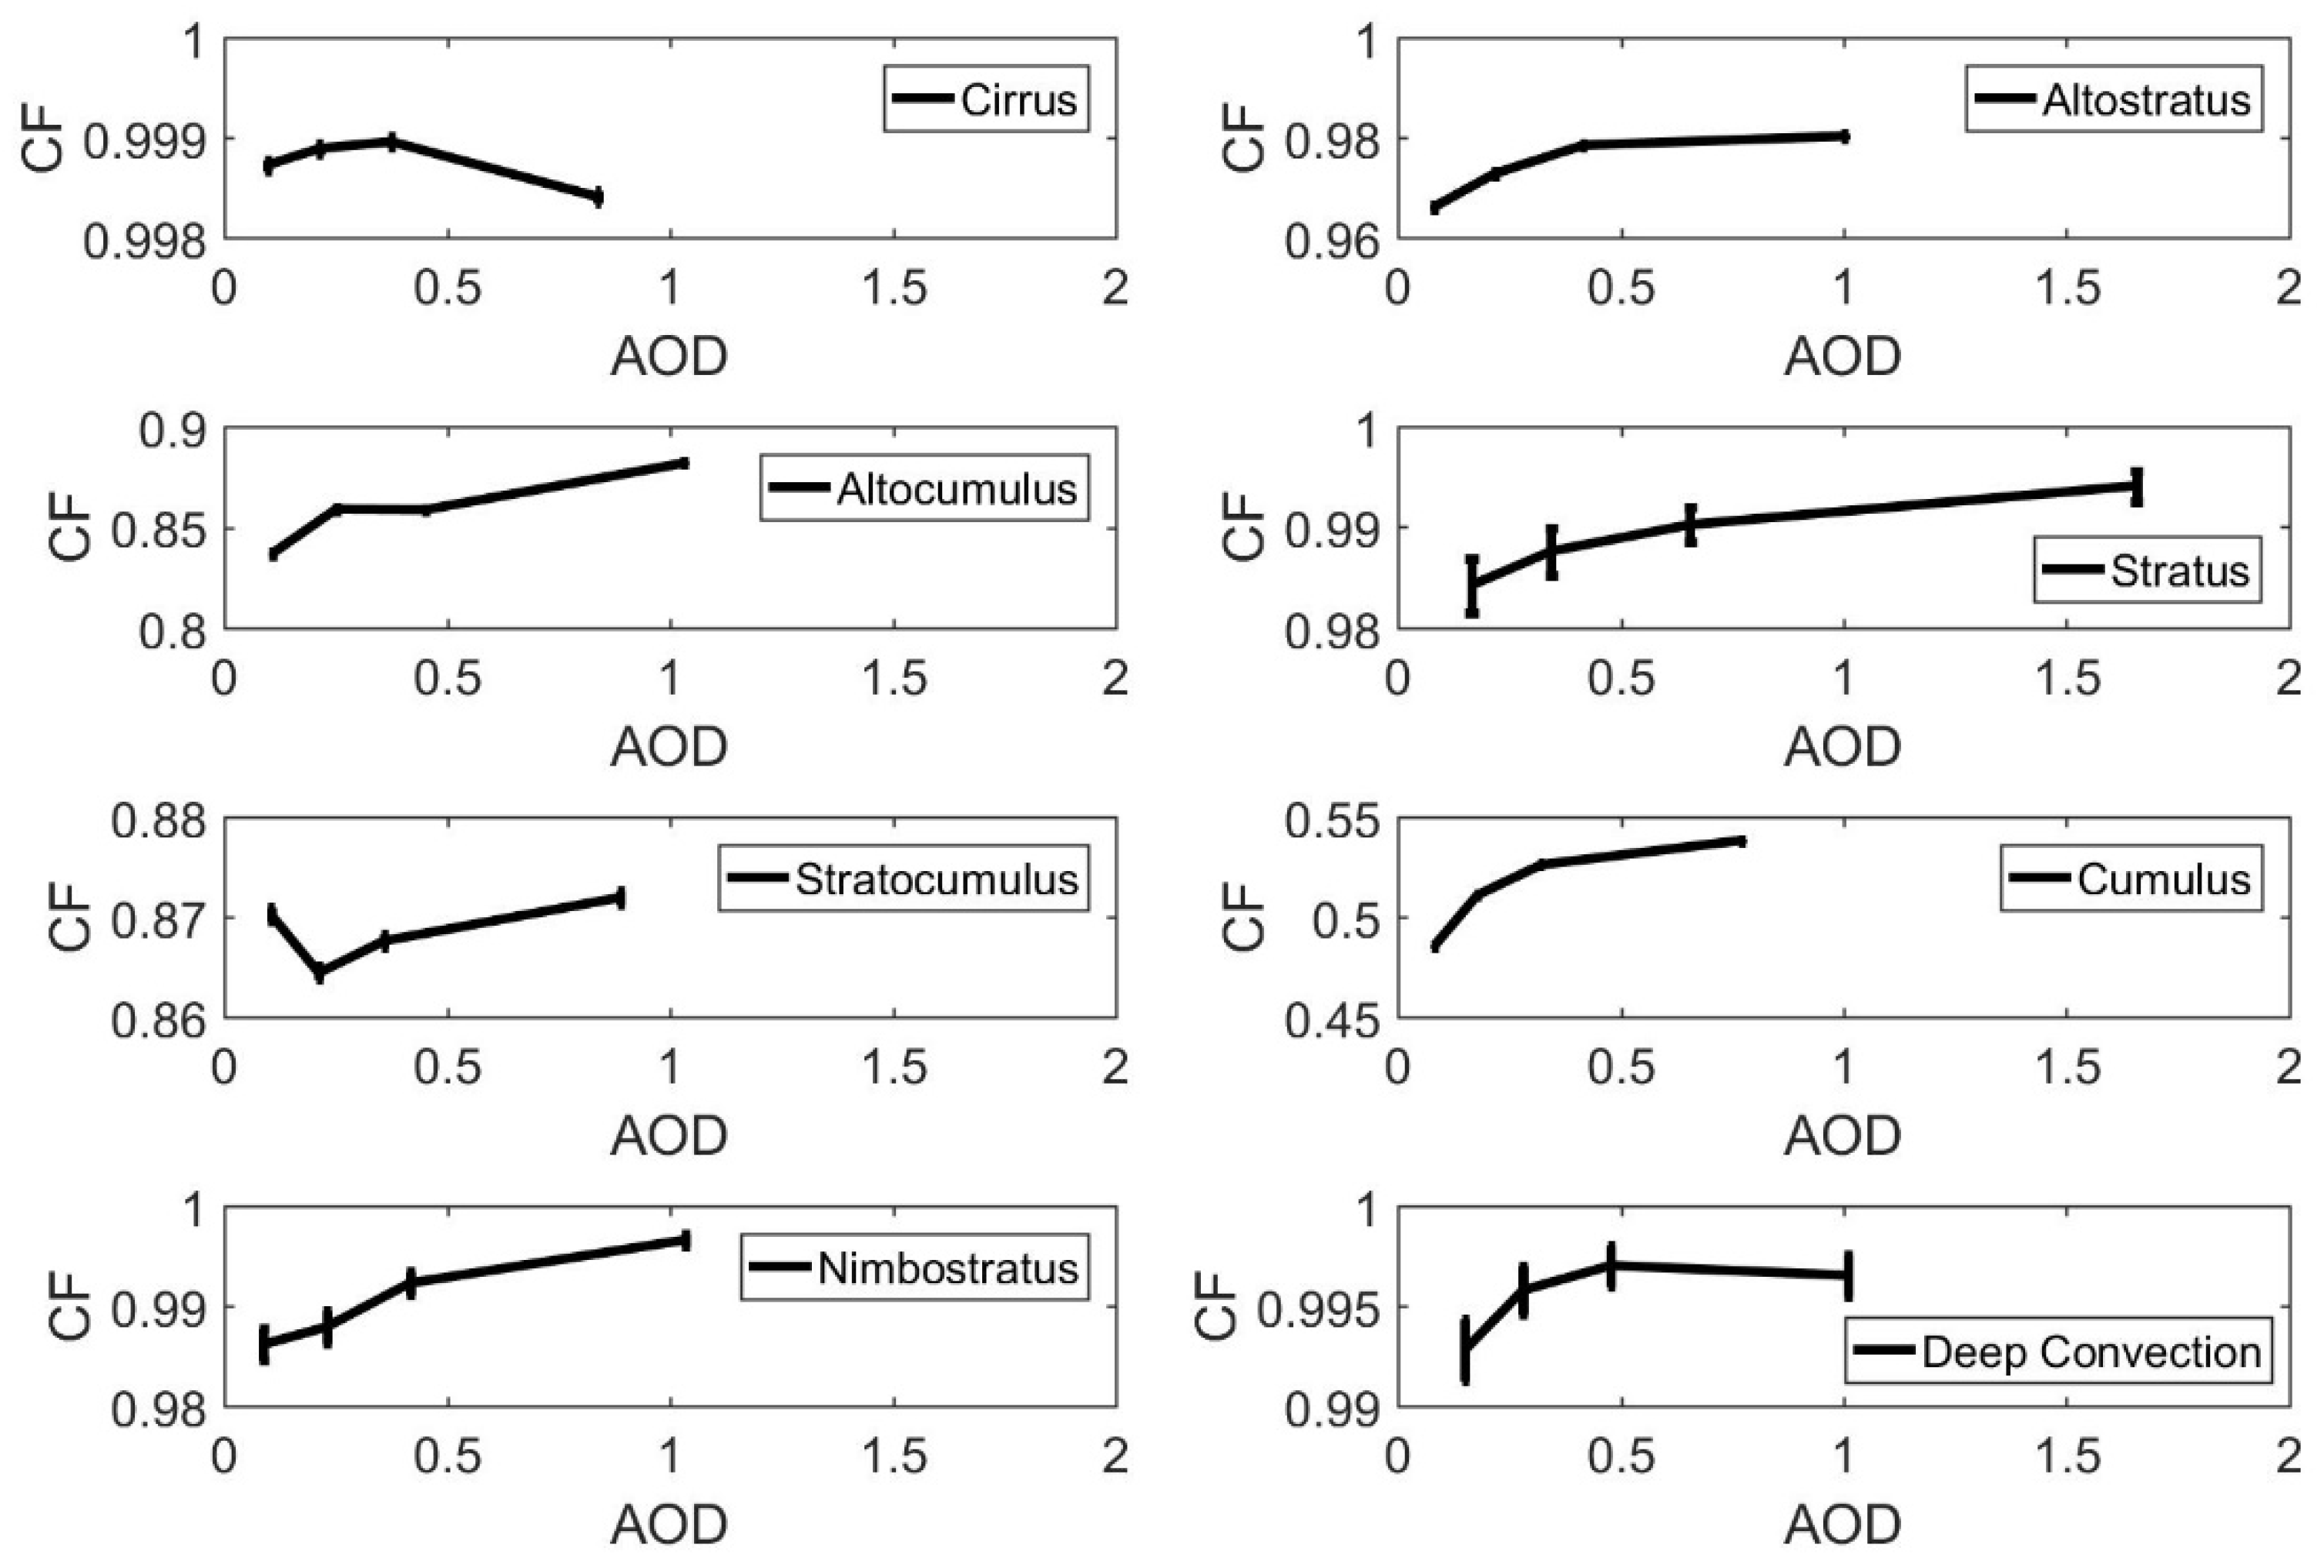
Figure 3 illustrates the response of cloud fraction (CF) to varying AOD for eight representative cloud types. Overall, most cloud types exhibit an increasing trend in CF with rising AOD, suggesting that aerosols may enhance cloud coverage. However, the magnitude and pattern of this response vary significantly among cloud types.
Stratus clouds show a continuous and significant CF enhancement, increasing from approximately 0.98 to nearly 1 as AOD increases, indicating that aerosols may enhance boundary layer stability and prolong cloud lifetime, thereby increasing the horizontal extent of low-level clouds. Cumulus clouds also exhibit a noticeable CF increase from ~0.45 to 0.55, suggesting that aerosols may invigorate shallow convection despite the relatively low initial CF. In contrast, stratocumulus clouds show only a slight increase in CF (from ~0.87 to 0.88), indicating a relatively stable response to aerosol loading. Both altocumulus and altostratus clouds display clear positive correlations between CF and AOD, with CF increasing from 0.82 to 0.89 and from 0.96 to 0.98, respectively. This suggests that in the mid-troposphere, aerosols may delay precipitation and enhance cloud persistence and horizontal development by influencing cloud droplet formation [57]. Nimbostratus clouds also exhibit a near-linear CF increase from ~0.98 to 1.00 with increasing AOD, further supporting the hypothesis that aerosols may extend the duration of precipitation-related cloud systems [58]. Cirrus and deep convective clouds maintain high CF values (>0.995) with relatively minor changes. Cirrus clouds show a slight increase in CF at moderate AOD levels, followed by a marginal decrease, while deep convection shows an initial CF increase at low AOD, leveling off at AOD >1.0. These weak responses may be attributed to the dominance of ice-phase processes in high-level clouds, where aerosol impacts depend on ice nucleation mechanisms and are closely linked to upper-level dynamical conditions such as convective intensity and wind shear [46,59].
These results highlight the macrophysical modulation of cloud coverage by aerosols across different cloud types. As cloud condensation nuclei (CCN) or ice nuclei (IN), aerosols can increase droplet/ice crystal number concentrations, reduce particle size, suppress precipitation, and prolong cloud lifetime, thereby enhancing cloud coverage—particularly in low- to mid-level clouds such as stratus and altocumulus. Moreover, high aerosol concentrations can absorb shortwave radiation, stabilize the boundary layer, and suppress vertical convection, favoring horizontal rather than vertical cloud development and thus increasing low-level CF. In contrast, the formation of high-level clouds (e.g., cirrus and deep convection) is primarily driven by strong updrafts and ice-phase processes, making aerosol effects more dependent on convective intensity, environmental temperature, and upper-tropospheric humidity. As a result, their CF responses are weaker or non-monotonic. Overall, these findings underscore the cloud-type-dependent nature of aerosol–cloud interactions, with stronger CF enhancements observed in low- and mid-level clouds due to aerosol-induced changes in cloud microphysics and thermodynamic conditions.
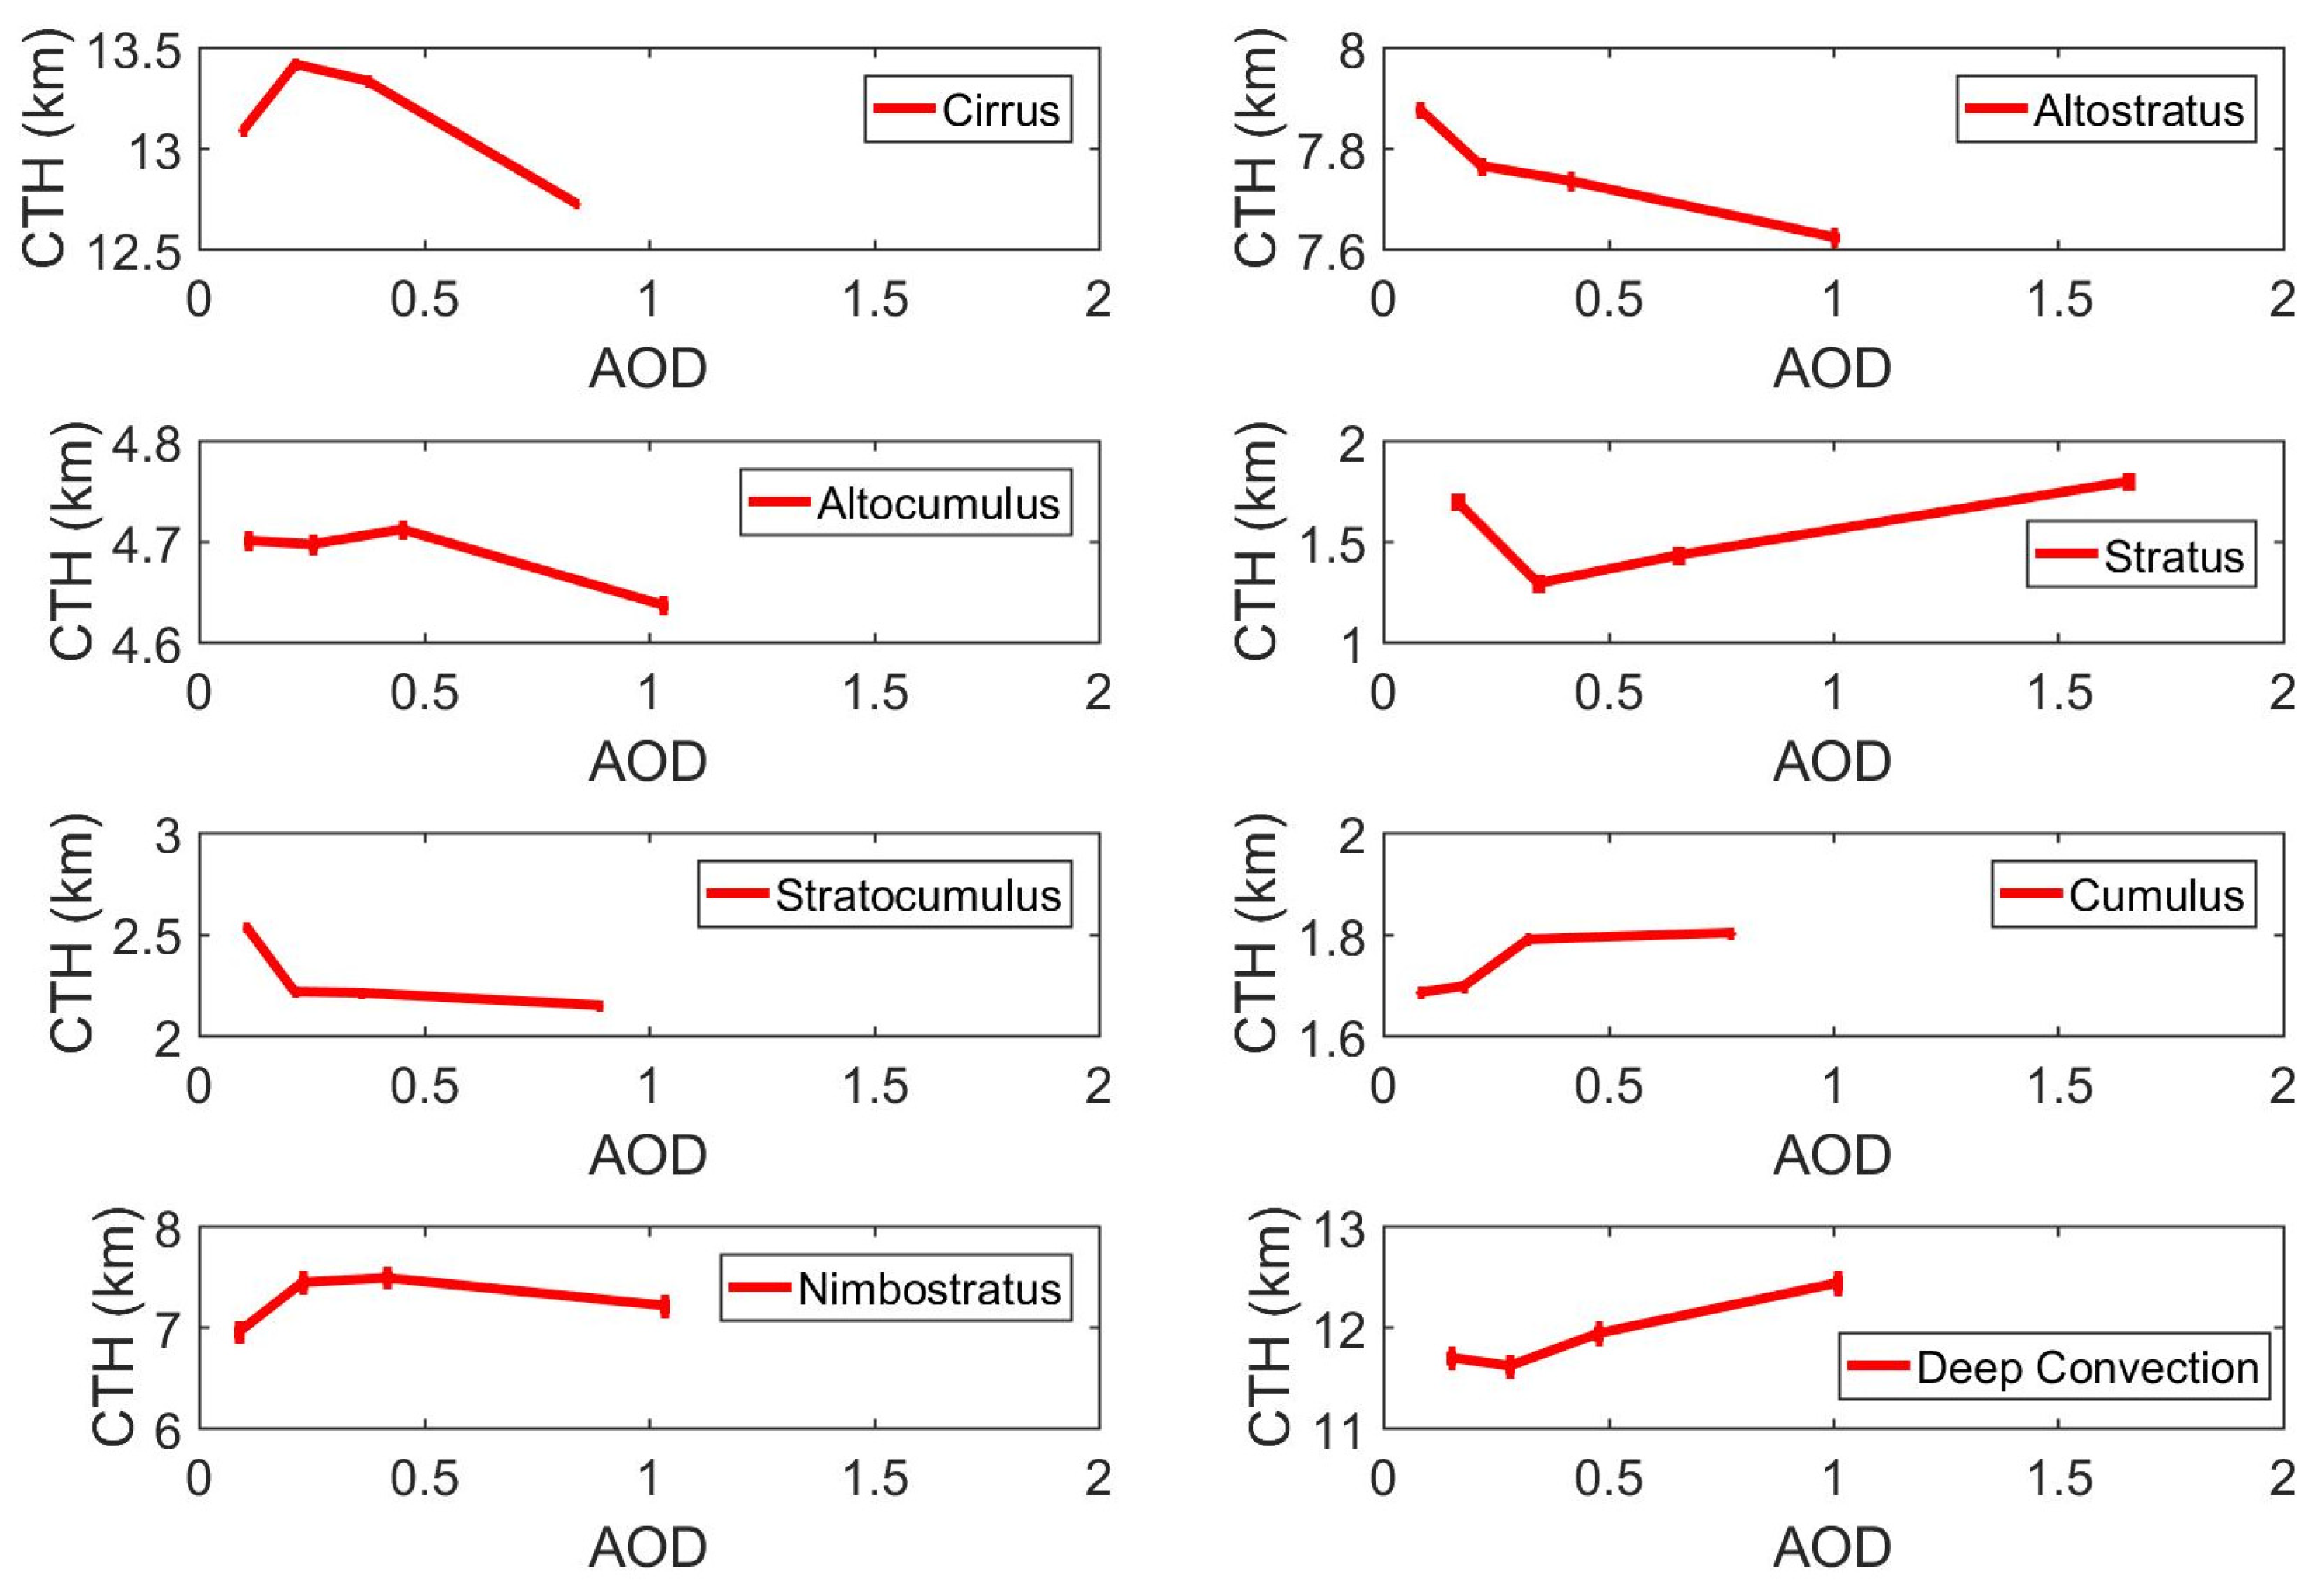
Figure 4 presents the response of cloud top height (CTH) to AOD for eight cloud types. The results reveal pronounced differences in how various cloud types respond to increasing aerosol loading. Convective clouds exhibit a clear upward trend in CTH. For instance, deep convective clouds show a significant increase in CTH from approximately 11 km to 13 km with rising AOD. Similar upward trends are observed for cumulus and stratus clouds, with stratus CTH increasing by more than 0.5 km as AOD rises from 0 to 1.5. These patterns suggest that higher aerosol concentrations may enhance convective activity and promote vertical cloud development. In contrast, several stratiform cloud types exhibit decreasing CTH with increasing AOD. Both altostratus and altocumulus clouds show slight declines in CTH (by ~0.1–0.2 km), indicating a weakening of vertical growth under higher aerosol loads. Stratocumulus clouds experience a rapid CTH decline under low AOD conditions, followed by stabilization. Nimbostratus and cirrus clouds exhibit non-monotonic CTH responses, likely influenced by ice-phase processes, ambient temperature, and aerosol composition [26,60]. In strongly convective clouds, aerosols may suppress early precipitation and enhance updraft strength, thereby facilitating vertical cloud growth and increasing CTH [14,15]. In contrast, for stratiform clouds, aerosol-induced radiative heating and stabilization of the boundary layer may inhibit vertical development, resulting in decreased CTH [61].
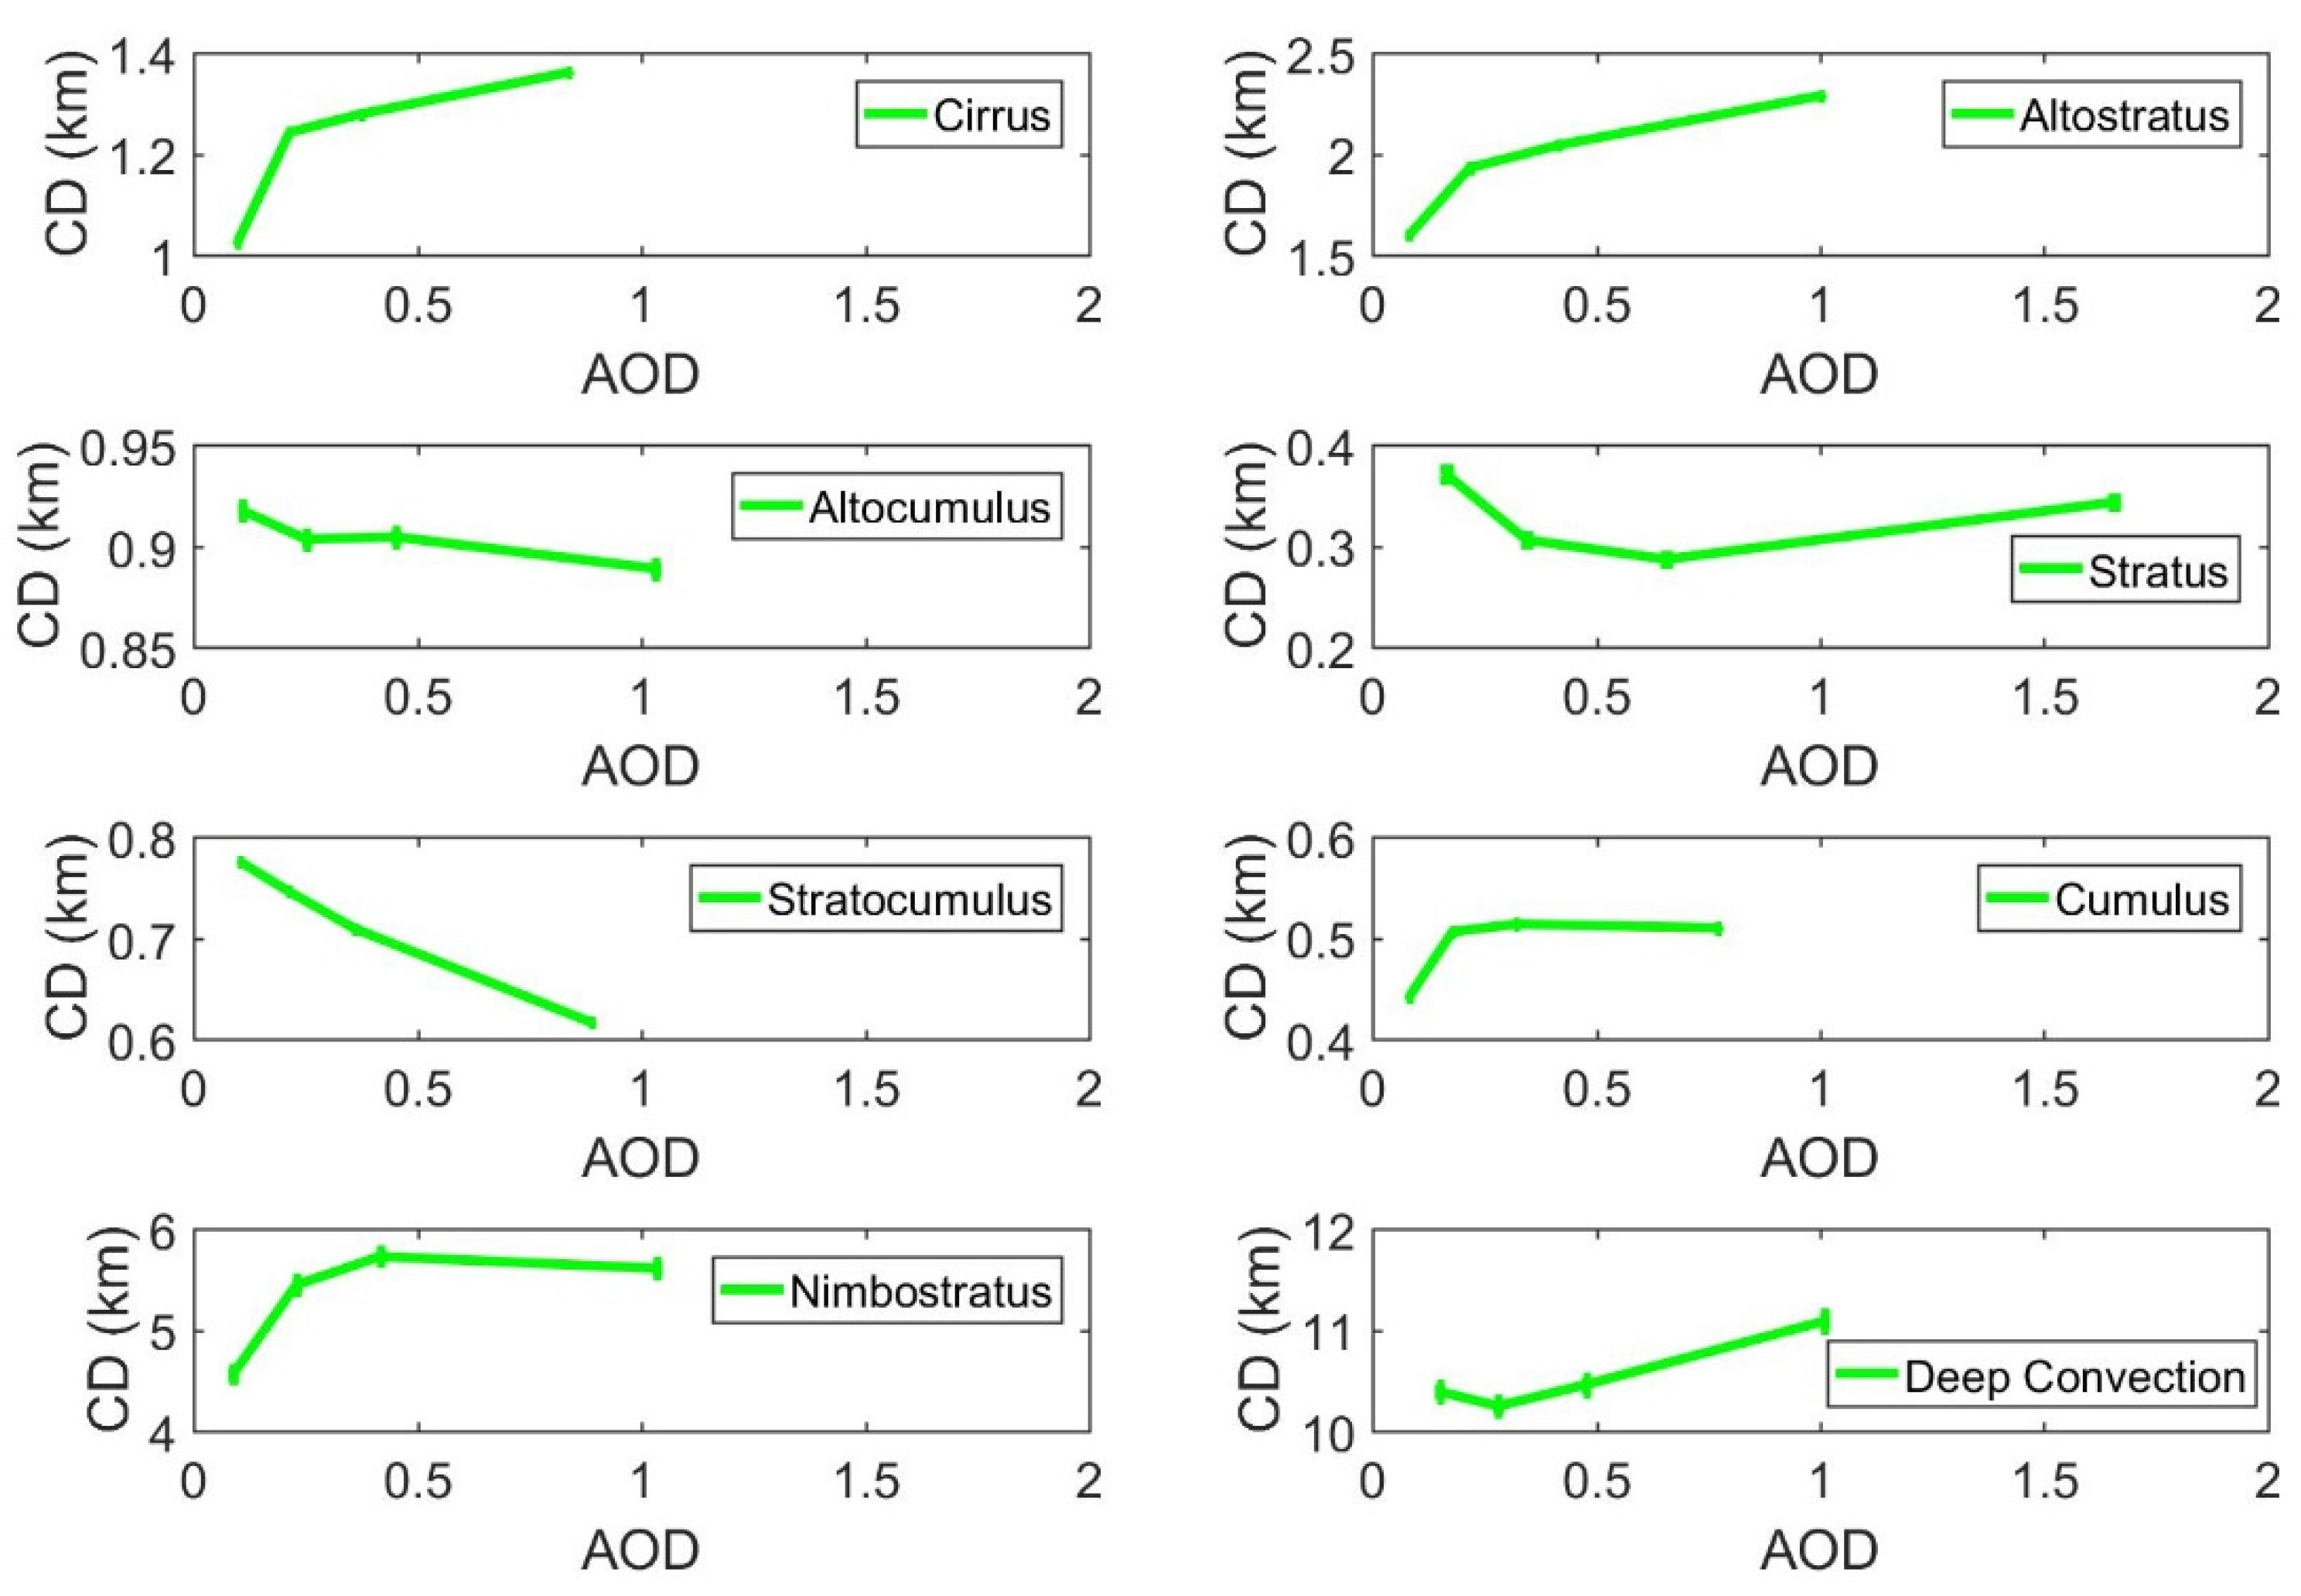
Figure 5 illustrates the response of cloud thickness (CD) to AOD for eight representative cloud types. The results indicate a strong cloud-type dependence on aerosol effects on cloud thickness. Among convective clouds, CD increases significantly with rising AOD. For instance, deep convective clouds show a notable thickening from approximately 10 km to nearly 12 km. Both cirrus and altostratus clouds also exhibit clear increases in cloud thickness, by about 0.4 km and 1.0 km, respectively. These patterns suggest that higher aerosol concentrations may enhance the vertical development of convective and high-level clouds, likely through mechanisms such as delayed precipitation, intensified updrafts, and enhanced ice-phase processes [7,25,62]. In contrast, low-level clouds exhibit more subdued responses. Stratus and cumulus clouds maintain relatively stable CD values, with only slight increases under high-AOD conditions, remaining within the ranges of 0.3–0.4 km and 0.5–0.6 km, respectively. For nimbostratus clouds, cloud thickness increases rapidly at low AOD levels and then stabilizes around 5.5 km, suggesting that aerosol influence may be most pronounced during the early cloud development stages, after which precipitation processes dominate. Mid-level clouds primarily show a decreasing trend. Both altocumulus and stratocumulus clouds exhibit slight reductions in CD with increasing AOD. In particular, stratocumulus thickness decreases from approximately 0.8 km to 0.6 km, indicating a possible suppressive effect of aerosols. This may be associated with aerosol-induced radiative heating, which enhances lower tropospheric stability and limits vertical cloud growth [63,64]. In summary, while convective and high-level ice clouds tend to thicken with increasing AOD, some mid- to low-level stratiform clouds may experience thinning due to enhanced atmospheric stability. Understanding the underlying mechanisms requires an integrated analysis that considers both cloud microphysical properties and the surrounding atmospheric conditions.

3.2. Effects of AOD on Ice-Phase Properties of Different Cloud Types

Ice clouds are a major source of uncertainty in radiative forcing estimates, with their response to aerosols—particularly across different cloud types—still poorly understood. Using CloudSat and MODIS observations, we examine how ice cloud fraction (ICF), ice crystal effective radius (Rei), and ice water path (IWP) in eight cloud types vary with AOD, revealing type-dependent aerosol–ice cloud interactions.
Figure 6 illustrates the response of ICF to variations in AOD for eight typical cloud types. Overall, high-level clouds (e.g., cirrus and altostratus), deep convective clouds, and nimbostratus exhibit a pronounced increase in ICF with rising AOD. Specifically, ICF increases from approximately 0.22 to 0.29 for cirrus, from 0.22 to 0.34 for altostratus, and from 0.43 to 0.52 for deep convective clouds, indicating a substantial enhancement of the ice-phase component under higher aerosol loading. In contrast, mid- to low-level clouds such as stratocumulus, altocumulus, stratus, and cumulus show weaker or non-monotonic responses. For example, stratocumulus ICF slightly decreases with increasing AOD, while cumulus ICF remains relatively stable across the AOD range. These results highlight a clear cloud-type dependence in the impact of aerosols on the ice-phase cloud fraction. For high-level and strongly convective clouds, increased concentrations of ice-nucleating particles together with enhanced updrafts facilitate ice crystal formation [60,65]. By contrast, in low-level clouds, aerosol–radiation interactions and stable-layer effects may suppress the horizontal development of ice clouds [66].
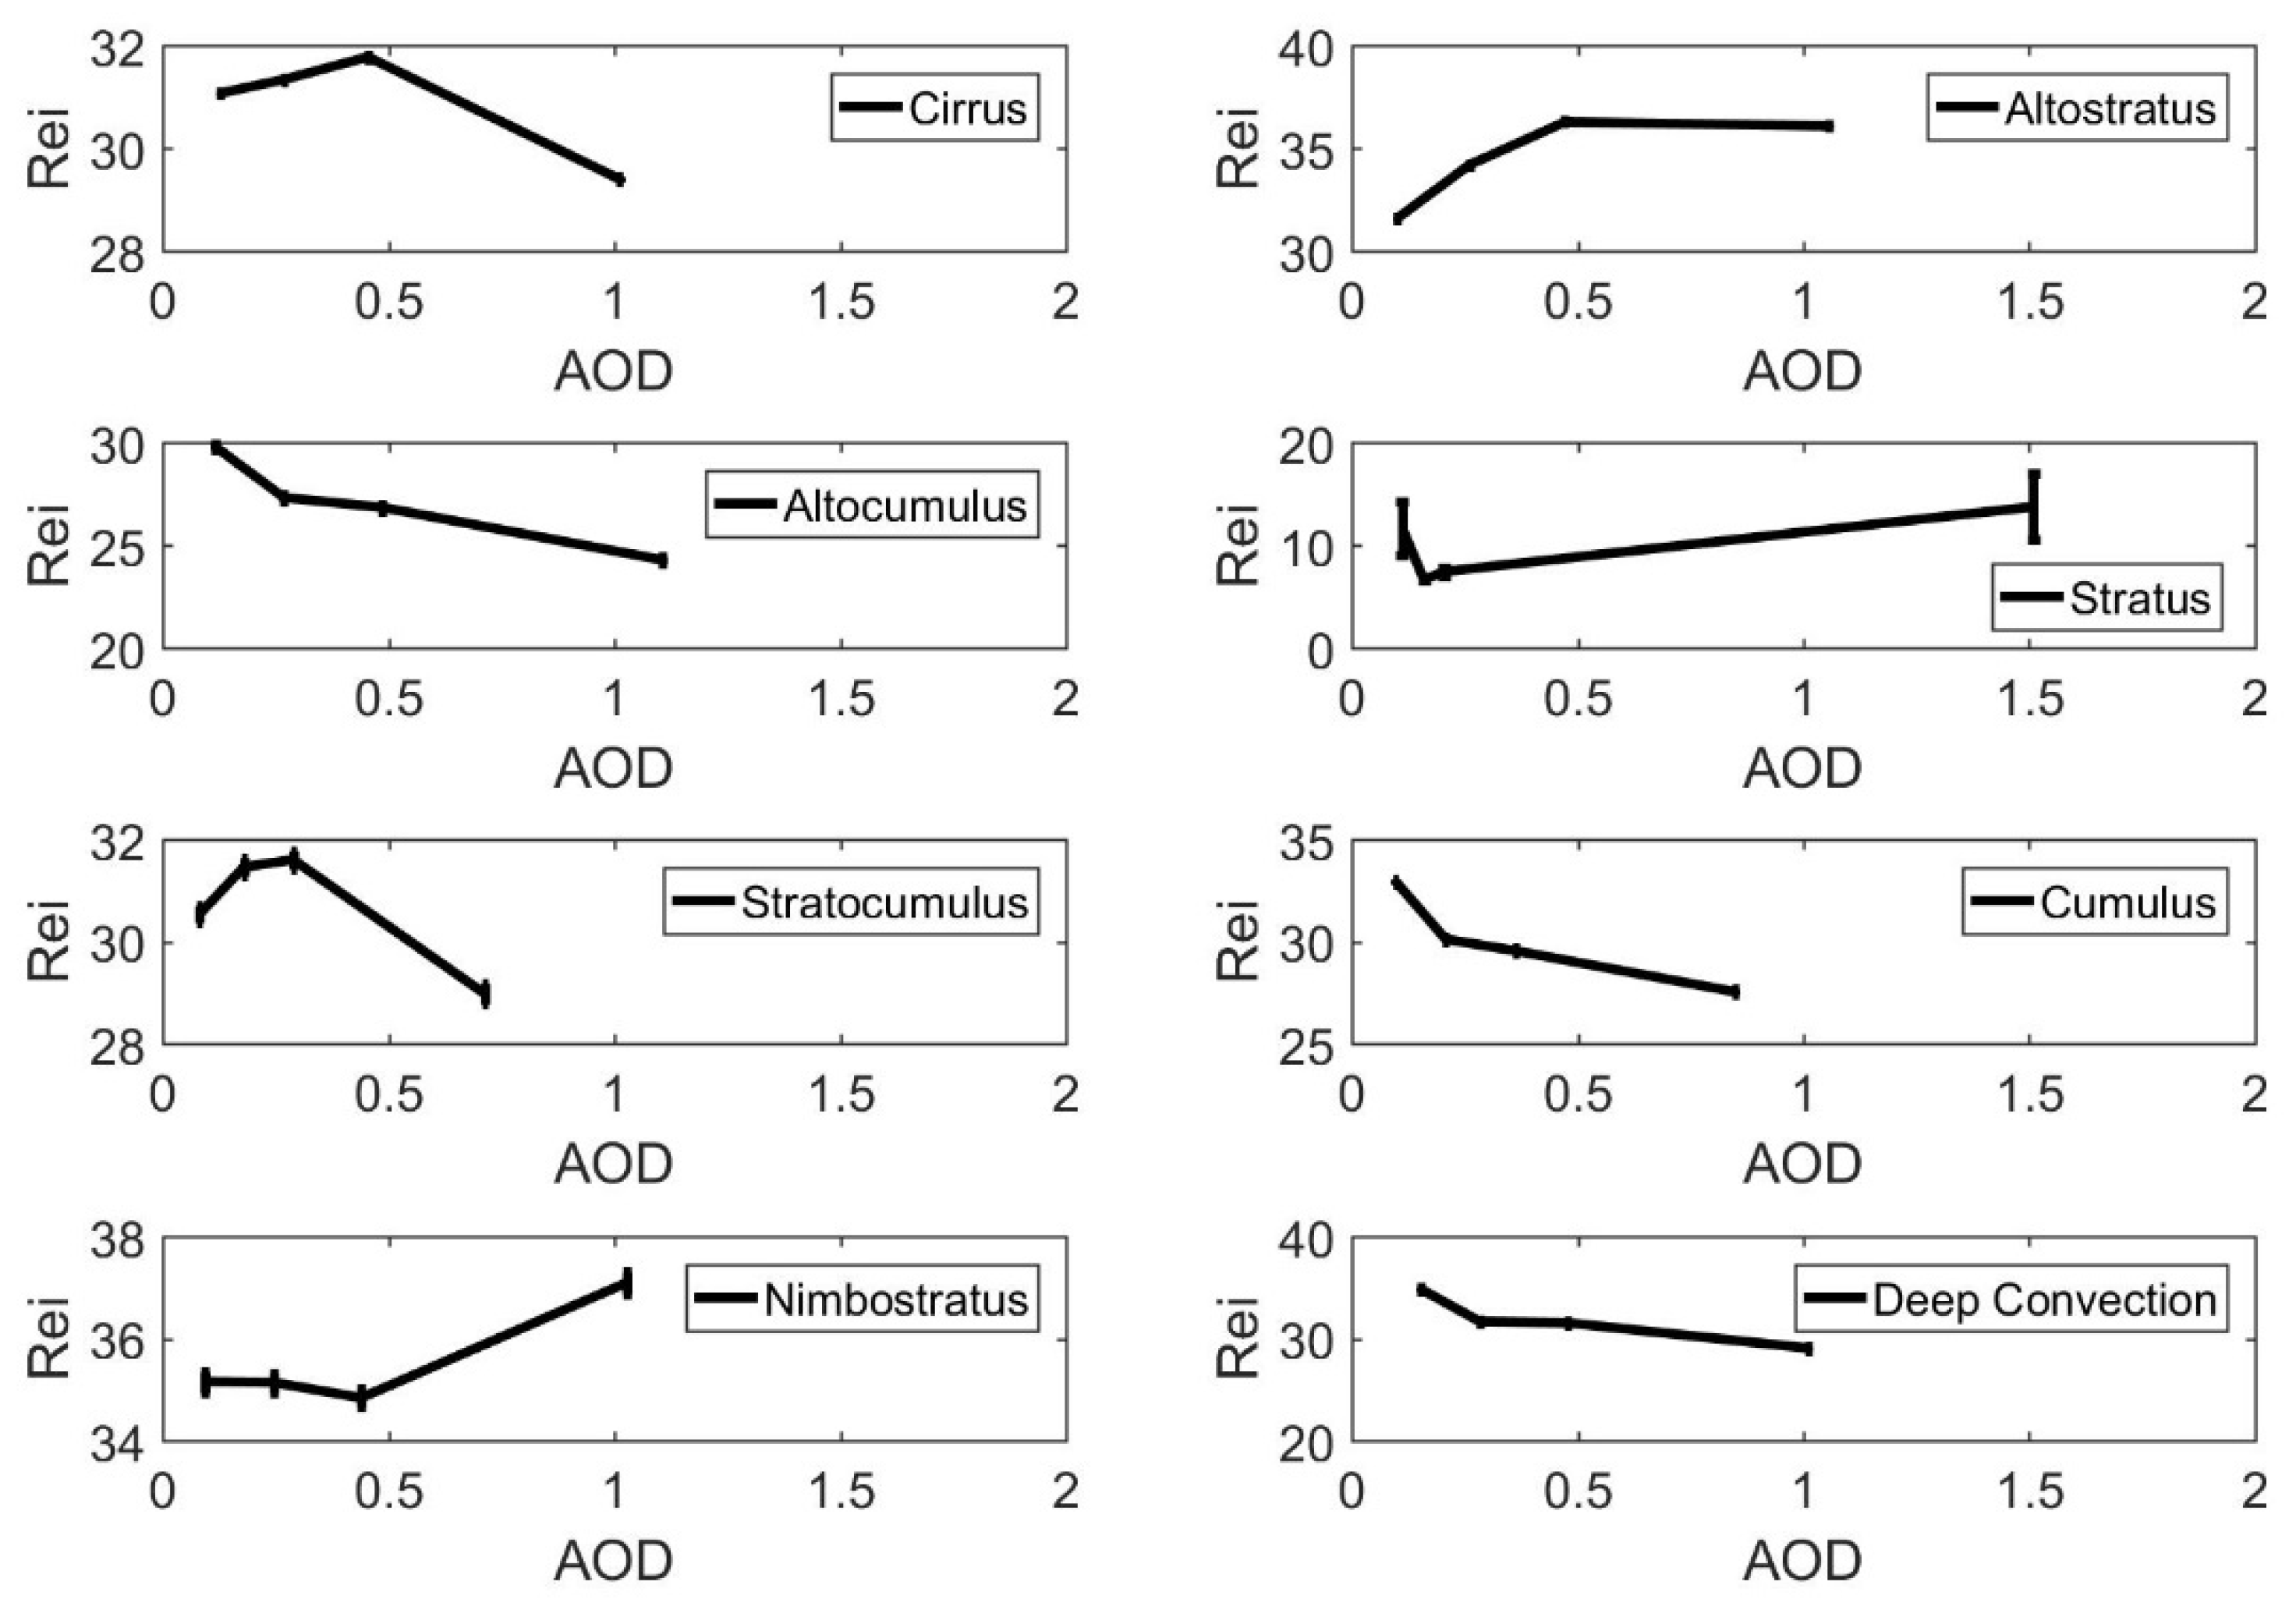
Figure 7 shows the response of Rei to variations in AOD across eight cloud types. Overall, most cloud types exhibit a decreasing trend in Rei with increasing aerosol loading, particularly evident in cumulus, stratocumulus, altocumulus, and deep convective clouds. For instance, Rei decreases from about 34 μm to 27 μm in cumulus and from about 32 μm to 29 μm in stratocumulus, suggesting that higher aerosol concentrations may suppress ice crystal growth. This phenomenon is consistent with the “ice crystal suppression effect,” in which competition among ice-nucleating particles under elevated aerosol levels increases ice crystal number while reducing individual crystal size [67,68]. In contrast, some high-level or deep-layer cloud types—such as altostratus, nimbostratus, and stratus—show increasing or weakly fluctuating Rei with rising AOD. For example, Rei in altostratus increases from about 31 μm to 36 μm, and stratus also shows a gradual increase, possibly due to stronger vertical motion or replenished moisture supply, which facilitates further ice crystal growth [69]. These findings indicate substantial cloud-type-dependent differences in aerosol modulation of ice cloud microstructure. Overall, aerosol enhancement tends to suppress ice crystal growth in mid- to low-level clouds, while in deep or high-level clouds its effects are more complex, potentially exhibiting both competitive and growth-promoting roles.
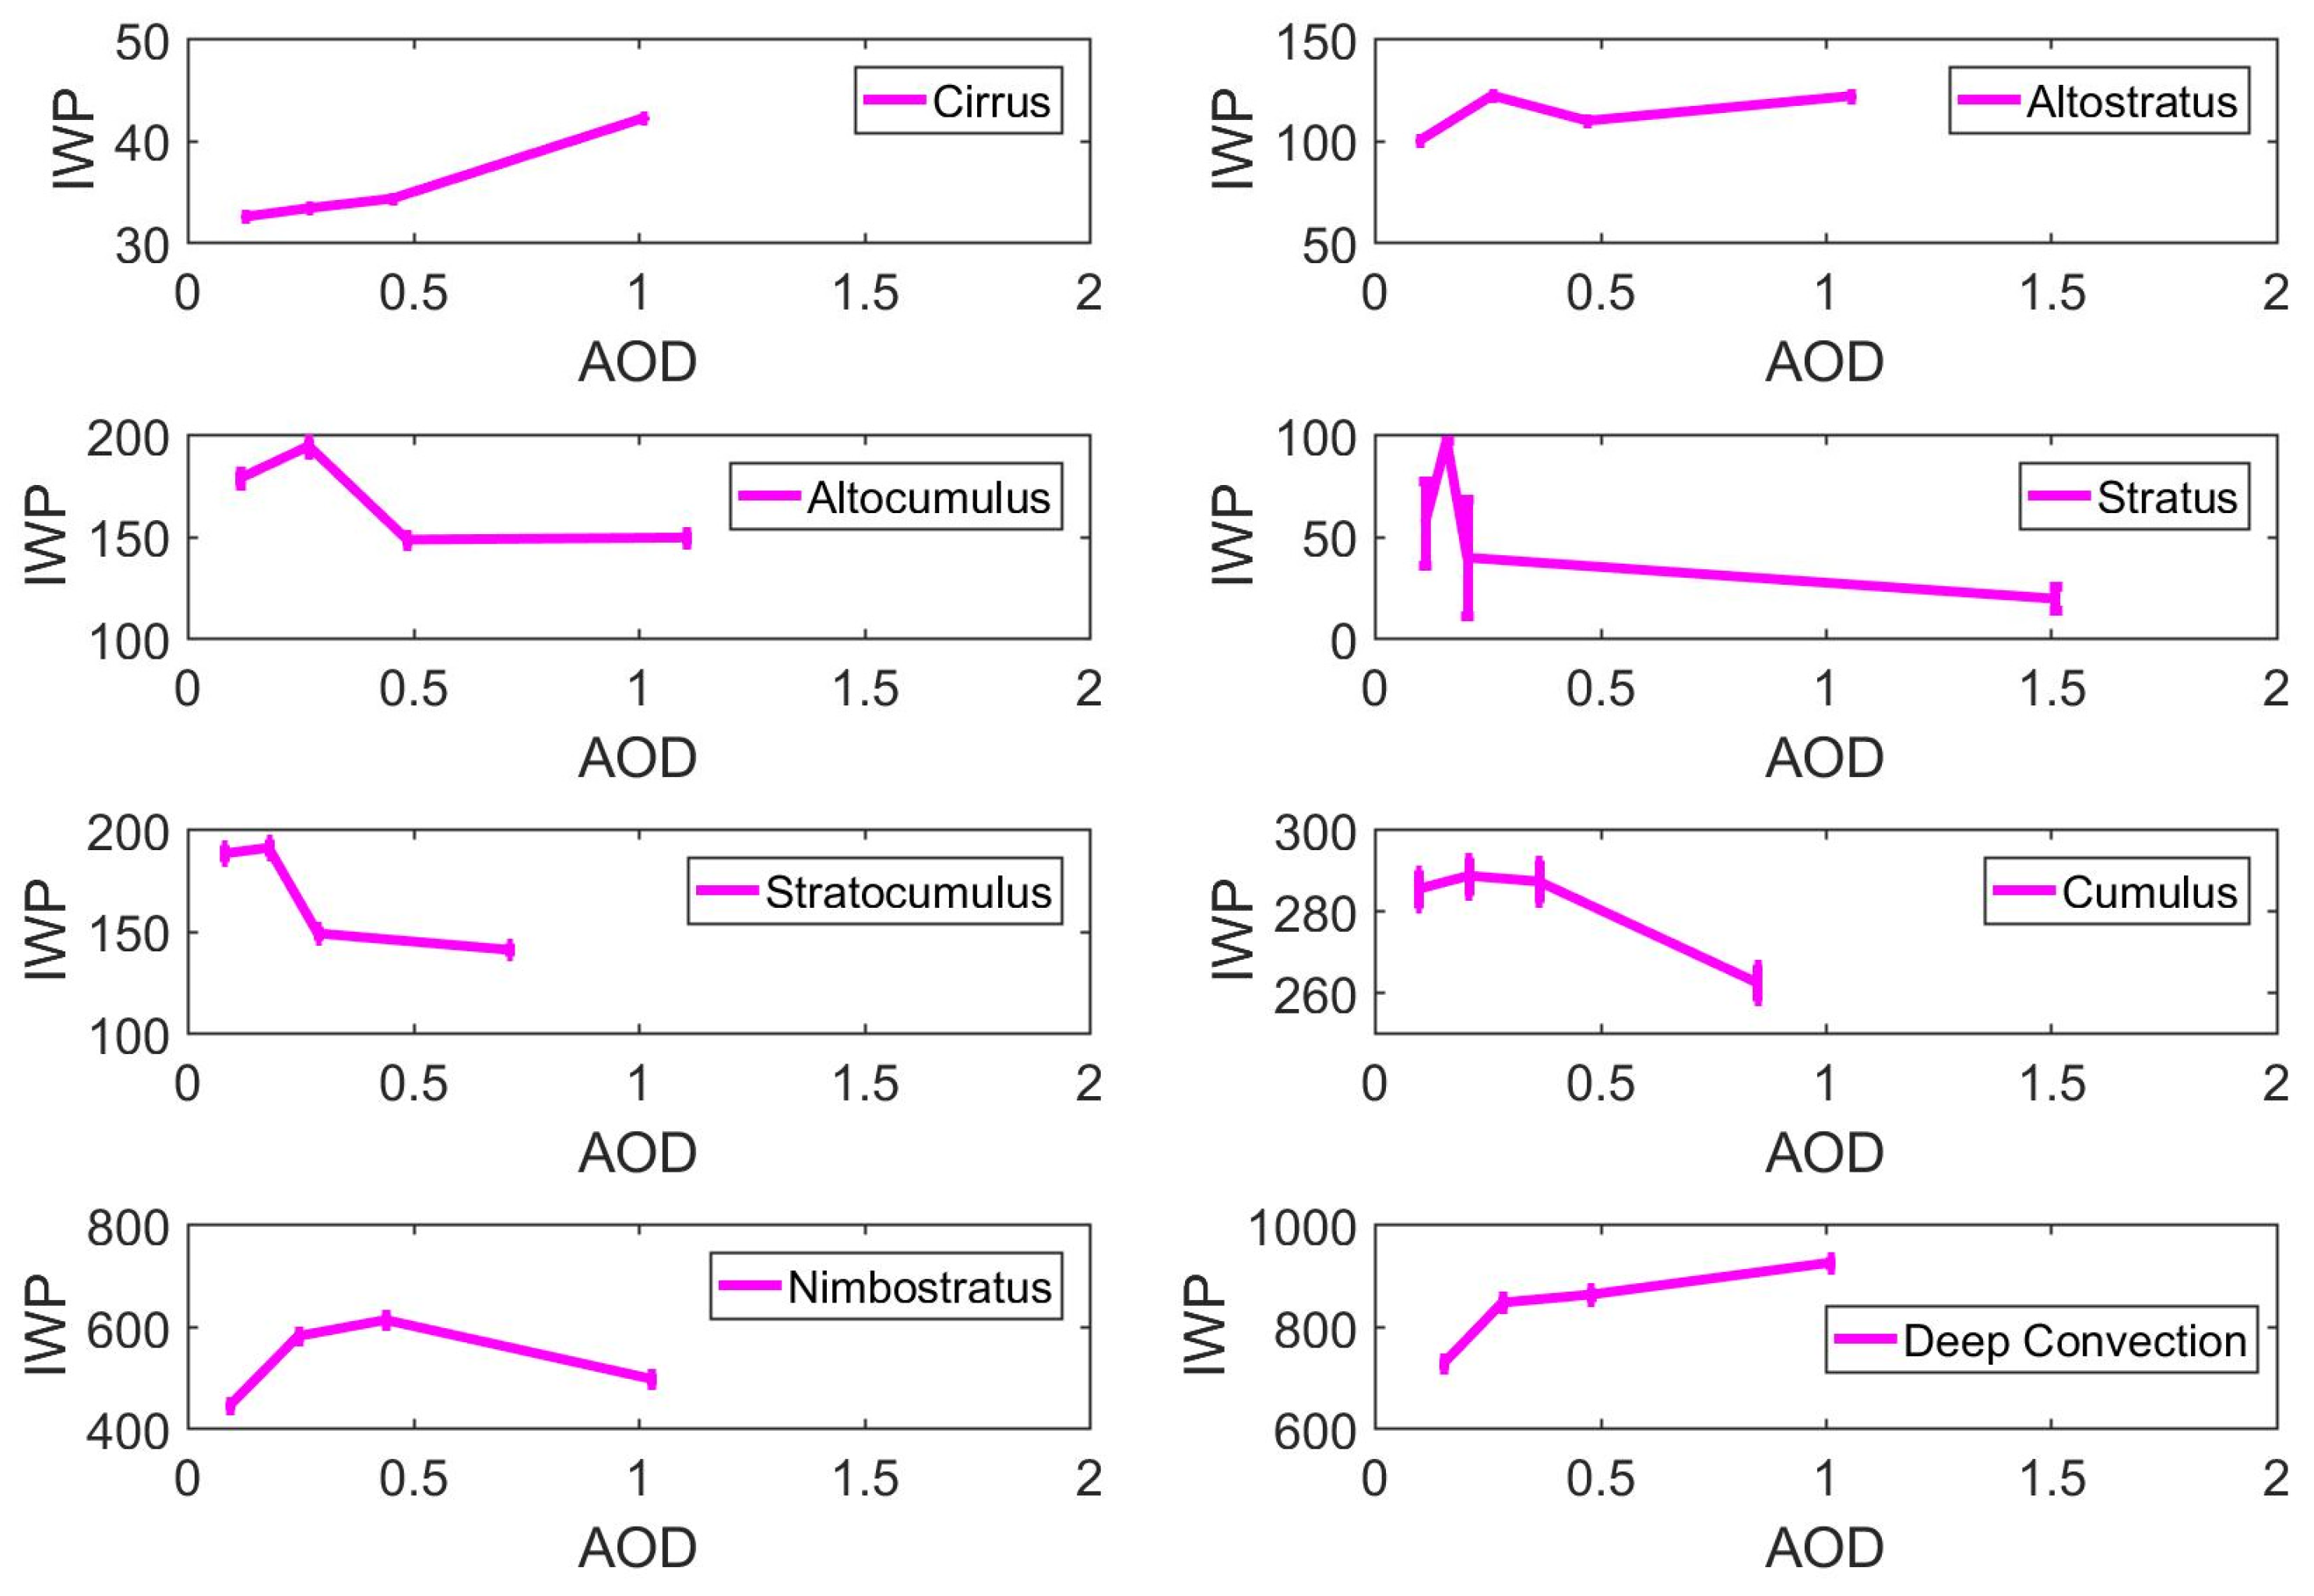
Figure 8 presents the response of IWP to variations in AOD for eight CloudSat-identified cloud types. Overall, the responses vary markedly among cloud types, reflecting the complex regulation of ice water content by aerosols. Cirrus and altostratus show a gradual increase in IWP with rising AOD, suggesting that in upper-tropospheric layers, enhanced aerosol loading may promote ice water accumulation by strengthening updrafts or increasing ice-nucleating particle concentrations [70]. In contrast, altocumulus, stratocumulus, and stratus exhibit a pronounced decrease in IWP with increasing AOD, likely due to an aerosol “cooling interference effect” in which aerosols weaken lower-level updrafts or reduce ice crystal aggregation efficiency, thereby lowering total ice water content [7,71]. Cumulus shows a slight IWP decrease at higher AOD, implying that its response may be more strongly influenced by local thermodynamic processes [72]. Nimbostratus displays a non-monotonic response, with IWP peaking at ~600 g m−2 around an AOD of 0.5. Deep convective clouds show a strong positive response, with IWP increasing by as much as 300 g m−2, indicating that aerosols in deep convective systems may intensify convection and moisture transport, thereby enhancing ice water accumulation and upward transport [60]. Overall, aerosols tend to increase IWP in high-level and deep convective clouds by strengthening updrafts and prolonging cloud lifetimes but suppress IWP in mid- to low-level clouds through radiative cooling and/or microphysical feedbacks. These contrasting effects highlight the need for precise representation of aerosol–cloud interactions in climate and weather models.

3.3. Disentangling the Influence of Meteorological Factors

The relationship between AOD and cloud properties discussed in the previous section does not necessarily imply causality. Variations in certain meteorological factors may cause simultaneous changes in both aerosols and cloud properties, potentially leading to a mistaken inference that clouds are directly influenced by aerosols. The observed correlations may instead arise from the co-variability driven by meteorological conditions. Therefore, it is essential to assess whether meteorological variability can account for the observed AOD–cloud associations. In this section, we employ partial correlation analysis to disentangle the influence of meteorological factors on the aerosol–cloud property relationship. This method quantifies the linear correlation between two variables (here, AOD and a given cloud property) while controlling for all other relevant variables [73,74]. In this study, we consider 14 meteorological variables that may affect aerosol–cloud interactions (ACIs): the zonal wind components (u) at 300 hPa (u300), 850 hPa (u850), and 1000 hPa (u1000); the meridional wind components (v) at 300 hPa (v300), 850 hPa (v850), and 1000 hPa (v1000); the vertical wind components (w) at 300 hPa (w300), 850 hPa (w850), and 1000 hPa (w1000); relative humidity at 300 hPa (RH300), 850 hPa (RH850), and 1000 hPa (RH1000); convective available potential energy (CAPE); and convective inhibition (CIN). If the sign and magnitude of the total correlation between AOD and a cloud property are consistent with those of the partial correlation after controlling for meteorological factors, the association is unlikely to be driven by these factors. Conversely, if the sign changes or the magnitude differs substantially, meteorological influences cannot be ruled out.
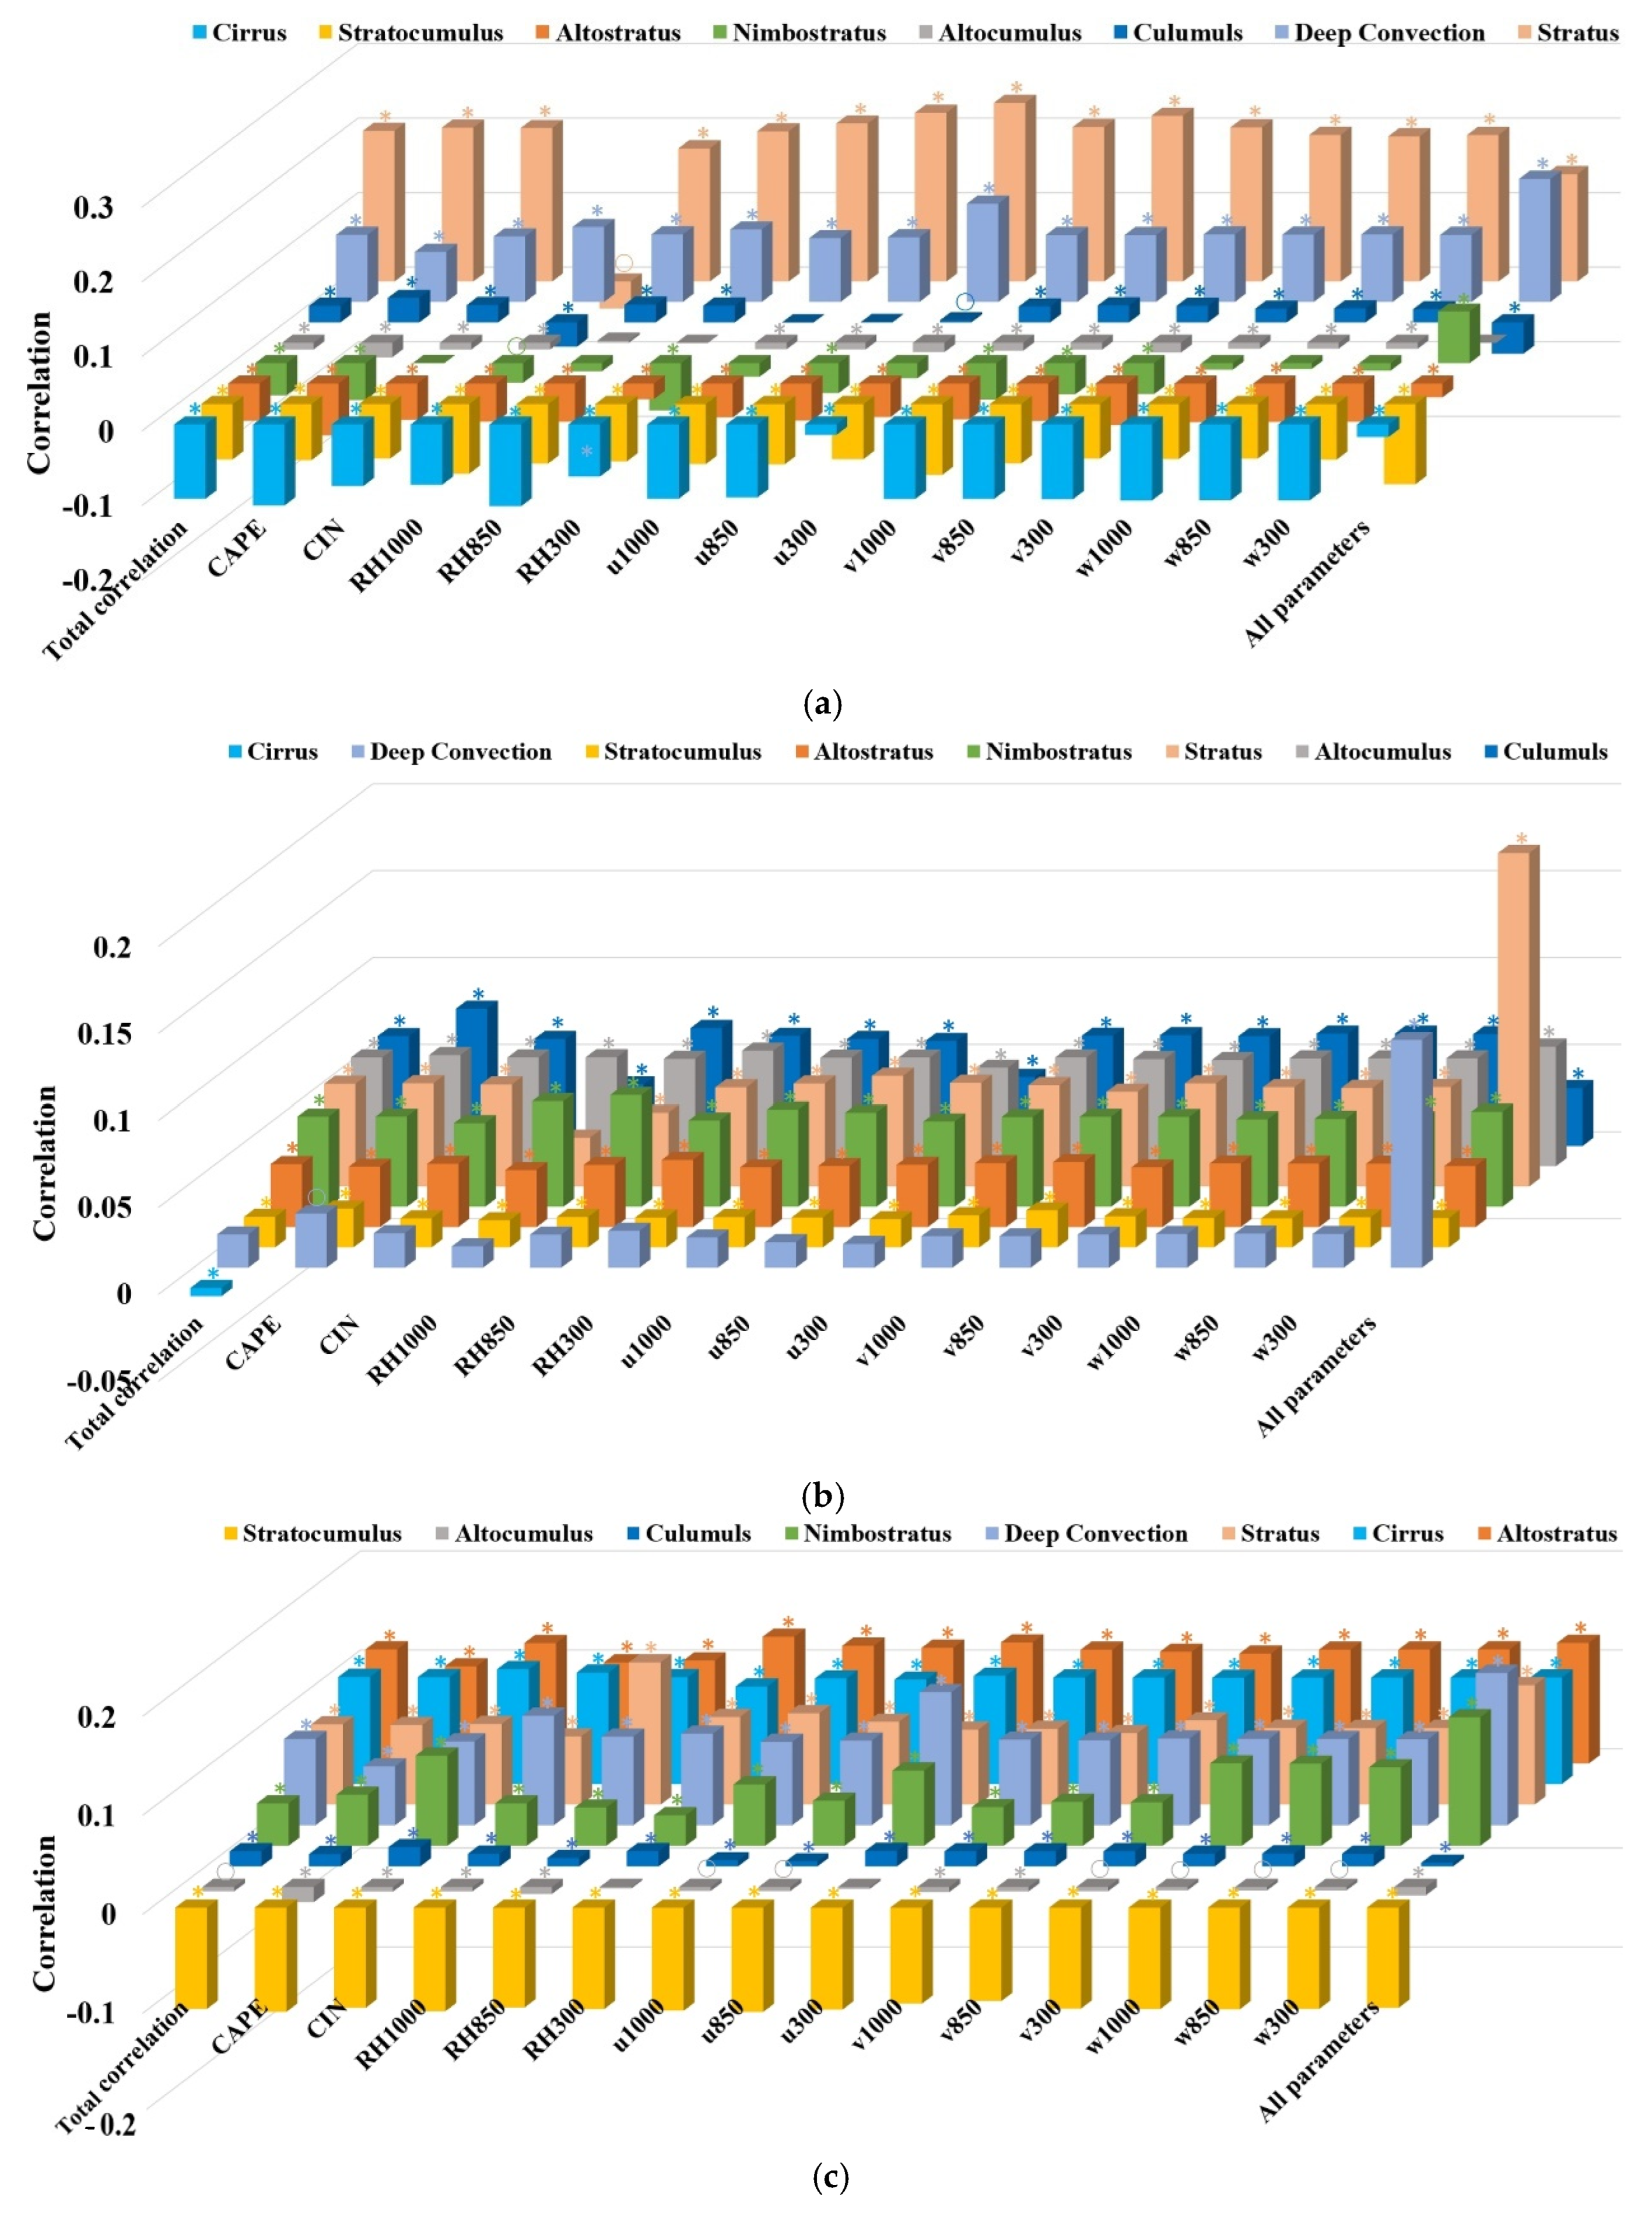
Figure 9 compares the total and partial correlations between AOD and the CTH, CF, and CD for eight cloud types, controlling for all 14 meteorological variables. The fact that total and partial correlations generally pass or fail the significance test simultaneously suggests that meteorological influences on the AOD–cloud relationship are limited. In other words, for each cloud type, the sign of the total correlation is almost always the same as that of the corresponding partial correlation, with only minor differences in magnitude. This consistency indicates that the observed aerosol–cloud relationships across cloud types can be largely attributed to aerosol effects rather than meteorological co-variability.
Specifically, Figure 9a presents the total correlations between AOD and CTH, along with the partial correlations obtained after controlling for 14 meteorological parameters. The results reveal pronounced differences in cloud-type sensitivity to meteorological conditions. For deep convection and stratus, correlations remain significantly positive after meteorological control (asterisks in the figure), whereas cirrus and stratocumulus show negative correlations, consistent with the findings in Section 3.1. The persistence of strong partial correlations after controlling for multiple meteorological factors suggests that AOD may modulate CTH, positively or negatively, through mechanisms relatively independent of meteorological variability, potentially by enhancing or suppressing updrafts or microphysical processes. In contrast, for other cloud types, the direct influence of AOD appears weaker and more susceptible to environmental variability. Among all control variables, low-level relative humidity (e.g., RH1000) and upper-level wind speed (e.g., u300) exert the most notable effects on the partial correlation coefficients, underscoring their role as key modulators of the AOD–CTH relationship. Overall, the larger discrepancies between total and partial correlations under the “All parameters” control condition further confirm that meteorological interference in the AOD–CTH relationship cannot be ignored. Figure 9b shows the total and partial correlations between AOD and CF across different cloud types. Both total and partial correlations are generally positive, particularly for cumulus, altocumulus, stratus, and nimbostratus, where correlations are higher. After controlling for all meteorological factors, deep convection, stratus, and cumulus exhibit substantial differences between total and partial correlations, indicating that CF variations in these cloud types are more strongly driven by complex meteorological conditions than by direct aerosol effects. Here again, RH1000 and u300 emerge as prominent modulators of partial correlations, especially for cumulus, stratus, and deep convection. Figure 9c depicts the total and partial correlations between AOD and CD for eight cloud types. In general, AOD is positively correlated with CD in most cloud types, particularly in altostratus and cirrus, whereas stratocumulus exhibits significant negative correlations in both total and partial measures. This suggests that AOD can either enhance or suppress vertical cloud development depending on cloud type. Furthermore, upper-tropospheric humidity (RH300) and instability-related parameters such as CIN play critical roles in modulating partial correlations for several cloud types. After controlling for all meteorological factors, deep convection and nimbostratus still show large differences between total and partial correlations, highlighting the strong influence of complex meteorological conditions. In summary, these results demonstrate that aerosol impacts on cloud vertical structure exhibit marked cloud-type dependence and are strongly modulated by meteorological conditions, with humidity and wind speed emerging as particularly influential factors.
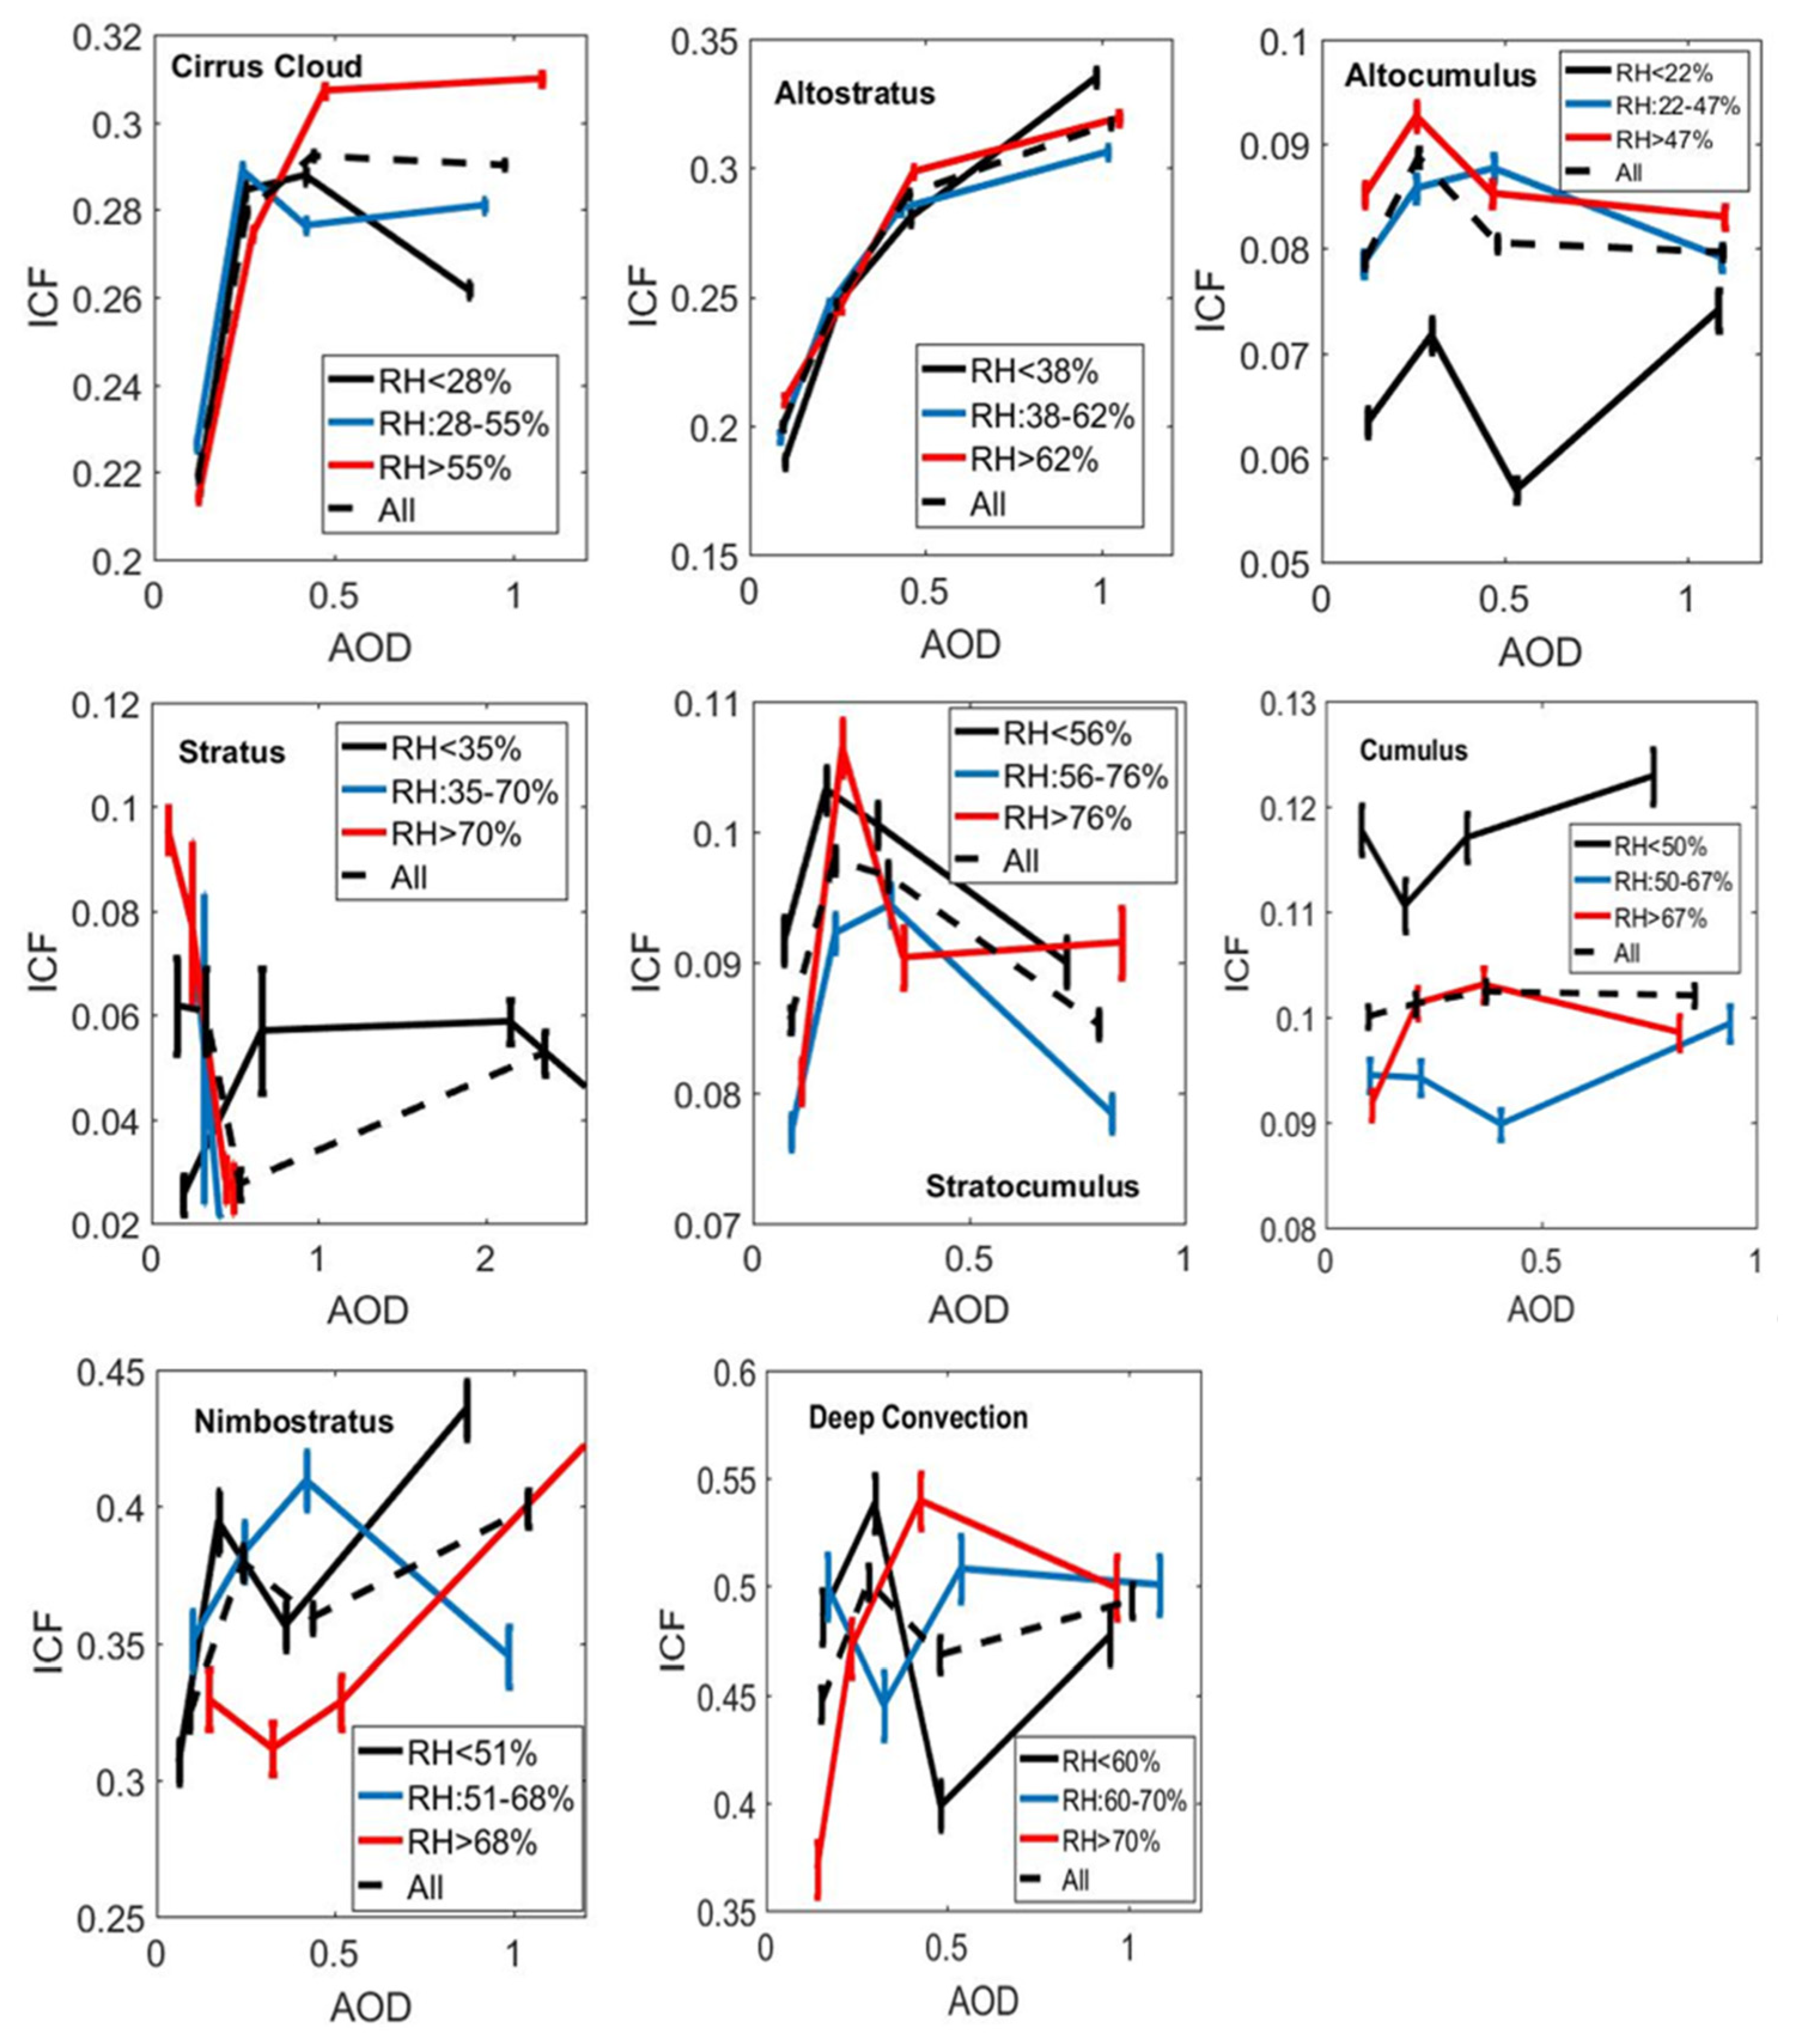
Given the non-negligible role of meteorological factors in cloud development, Zhao et al. (2018) [75] reported that water vapor can largely account for differences in the response of ice cloud effective radius to aerosols and is critical for accurately estimating aerosol–cloud radiative forcing from ice clouds. Therefore, to investigate the influence of meteorological factors on aerosol–cloud relationships, we used relative humidity (RH) as an indicator and examined how the ICF of eight cloud types responds to increasing AOD under different RH conditions. Figure 10 presents the AOD–ICF relationships for these cloud types, highlighting substantial differences in aerosol–cloud interactions modulated by humidity. Overall, cirrus, altostratus, nimbostratus, and deep convective clouds show a strong positive response to AOD in high-RH environments, implying that under humid conditions, aerosols enhance ice crystal formation by supplying additional nuclei and delaying precipitation, consistent with a positive indirect effect. In contrast, mid- and low-level clouds such as stratus, cumulus, and stratocumulus show more complex responses, with negative correlations emerging under low-RH or high-AOD conditions, potentially due to moisture limitations, changes in boundary layer stability, or insufficient updrafts [76]. Across humidity regimes, AOD–ICF relationships generally display nonlinear features, particularly an “enhancement–saturation” pattern in deep convective clouds. These findings suggest that RH is a key regulator of aerosol–ice cloud interactions and that the aerosol response varies substantially across cloud types, highlighting the complex coupled mechanisms linking aerosols, cloud properties, and the surrounding atmospheric environment.

4. Discussion

Many previous studies have examined the effects of aerosols on liquid and mixed-phase clouds [14,19,43,77], but relatively few have addressed their impacts on the macrophysical and microphysical properties of different cloud types, particularly ice clouds. Given the markedly different optical properties of various cloud types, aerosols may exert either a cooling or a warming effect on their characteristics. Therefore, identifying and distinguishing cloud types is essential when assessing the overall radiative effects of the aerosol–cloud system. Our results reveal variations in the macrophysical and microphysical properties of different cloud types in response to aerosol changes, and demonstrate that, after controlling for multiple meteorological factors, the response mechanisms differ markedly and are highly complex across cloud types. The persistence of statistically significant correlations between AOD and certain cloud properties indicates that, under specific meteorological conditions, aerosol effects on clouds can be independent. Humidity and wind speed at different atmospheric levels are identified as key meteorological factors modulating aerosol–cloud relationships. In addition to meteorological factors, aerosol particle size and composition exert decisive influences on cloud responses. Smaller hygroscopic particles (e.g., sulfate and secondary organics) tend to enhance droplet activation and cloud albedo [77], whereas larger particles (e.g., sea salt and dust) facilitate droplet growth and precipitation [78]. Absorbing aerosols such as black carbon can further disrupt ice processes and alter cloud vertical development through semi-direct radiative effects [79,80]. These findings underscore that inferring causality solely from aerosol–cloud correlations is insufficient; incorporating the dynamic meteorological background together with aerosol size and type into the analytical framework is essential for accurately identifying the true climatic impacts of aerosols. This long-term observational analysis, by distinguishing cloud-type-specific macrophysical and microphysical responses to aerosol loading, provides a systematic basis for evaluating and refining the physical representation of aerosol–cloud interactions in numerical models. Our results not only corroborate global evidence of strong aerosol impacts on marine and stratiform low clouds (including ship-track evidence) [4,78,81] and regional findings of environment-dependent, non-monotonic responses in deep convective and high-cloud regimes [25,26,82,83], but also extend these insights by providing a comprehensive assessment over East Asia. Finally, the study highlights the need to jointly consider cloud type, humidity conditions, aerosol size and composition, and atmospheric dynamical processes in aerosol–cloud interaction research, with the goal of improving the parameterization of indirect radiative effects in climate models, enhancing cloud process simulations, and enabling more robust assessments of the climatic impacts of anthropogenic emissions.

5. Conclusions

This study utilized nine years of satellite observations from CloudSat, CALIPSO, and MODIS, together with reanalysis data, to examine the impacts of aerosols on the macrophysical and microphysical properties of different cloud types over East Asia. The main conclusions are as follows:
(1)
Aerosol effects on CF, CTH, and CD exhibit strong cloud-type dependence. Most mid- and low-level clouds (e.g., stratus, cumulus, and altocumulus) show a pronounced increase in CF with rising AOD, whereas high-level clouds (e.g., cirrus and deep convective clouds) display weaker or non-monotonic responses. Convective clouds (e.g., deep convective clouds and cumulus) exhibit significant CTH increases under high-AOD conditions, indicating that aerosols enhance convective development. In contrast, stable stratiform clouds (e.g., altostratus and altocumulus) tend to show CTH reductions, suggesting aerosol-induced suppression of vertical growth. Likewise, convective and high-level ice clouds experience enhanced vertical development and greater thickness in high-AOD environments, while some mid- and low-level stratiform clouds show reduced thickness due to aerosol-induced strengthening of lower-level stability.
(2)
The modulation of ice-phase structure and ice water content by aerosols exhibits pronounced cloud-type dependence. For high-level clouds (e.g., cirrus and altostratus) and deep convective clouds, increases in aerosol concentration are generally associated with higher ICF and IWP, while Rei varies within these clouds. In contrast, most mid- and low-level clouds (e.g., altocumulus, stratocumulus, and cumulus) tend to show reductions in Rei and IWP, indicating both an “ice crystal suppression effect” and aerosol-induced stabilization of lower layers that inhibits ice cloud development. Overall, aerosol impacts on the microphysical and macrophysical properties of ice clouds are jointly regulated by cloud vertical development, ice nucleation mechanisms, and ambient thermodynamic conditions, underscoring the need to account for cloud-type differences and coupled processes in studies of aerosol–cloud interactions.
(3)
Although AOD generally shows positive correlations with cloud properties such as CTH, CF, and CD, controlling for 14 meteorological variables reveals substantial differences in partial correlations across cloud types, indicating that meteorological conditions partly confound the observed aerosol–cloud relationships. High-level humidity and wind speed exert particularly strong influences on CTH and CF. Further analysis shows that under high-humidity conditions, the ICF of cirrus, nimbostratus, and deep convective clouds increases significantly with AOD, reflecting a typical positive aerosol invigoration effect, whereas mid- and low-level clouds may experience suppression under low humidity or high AOD.

Author Contributions

X.H.: Formal analysis, Methodology, Investigation, Funding acquisition, Writing—original draft. Q.C.: Resources, Data curation, Investigation, Formal analysis. Z.S.: Investigation, Formal analysis, Writing—review and editing. D.F.: Conceptualization, Supervision, Resources, Writing—review and editing. H.S.: Writing—review and editing. All authors have read and agreed to the published version of the manuscript.

Funding

This work was supported by the Beijing Natural Science Foundation (8254064).

Data Availability Statement

The satellite and meteorological datasets employed in this study can be freely accessed from the following sources. The CloudSat Level 2 Combined Radar and Lidar Cloud Scenario Classification Product (2B-CLDCLASS-LIDAR) used in this study is available from the open repository hosted by Colorado State University (https://www.cloudsat.cira.colostate.edu/, accessed on 6 January 2024). The CALIPSO Level 2 Cloud, Aerosol, and Merged Layer (05kmMLay) V4.1 products can be obtained from the NASA Langley Research Center Atmospheric Science Data Center (NASA/LARC/SD/ASDC) at https://asdc.larc.nasa.gov/data/CALIPSO/ (accessed on 20 October 2023). The MODIS/Aqua Aerosol 5-Min L2 Swath 10 km Product and Clouds 5-Min L2 Swath 1 km Product (MYDATM, Collection 6.1) are accessible from https://ladsweb.modaps.eosdis.nasa.gov/search/ (accessed on 1 October 2023). The fifth-generation reanalysis dataset (ERA5), provided by the European Center for Medium-Range Weather Forecasts (ECMWF), is available from the Copernicus Climate Data Store (https://cds.climate.copernicus.eu/, accessed on 1 June 2024).

Conflicts of Interest

The authors declare no conflicts of interest.

References

  1. Wei, C.; Zhao, P.; Wang, Y.; Wang, Y.; Mo, S.; Zhou, Y. Aerosol Influence on Cloud Macrophysical and Microphysical Properties over the Tibetan Plateau and Its Adjacent Regions. Environ. Sci. Pollut. Res. 2024, 31, 30174–30195. [Google Scholar] [CrossRef]
  2. Michibata, T.; Kawamoto, K.; Takemura, T. The Effects of Aerosols on Water Cloud Microphysics and Macrophysics Based on Satellite-Retrieved Data over East Asia and the North Pacific. Atmos. Chem. Phys. 2014, 14, 11935–11948. [Google Scholar] [CrossRef]
  3. Chen, Y.; Haywood, J.; Wang, Y.; Malavelle, F.; Jordan, G.; Partridge, D.; Fieldsend, J.; De Leeuw, J.; Schmidt, A.; Cho, N.; et al. Machine Learning Reveals Climate Forcing from Aerosols Is Dominated by Increased Cloud Cover. Nat. Geosci. 2022, 15, 609–614. [Google Scholar] [CrossRef]
  4. Chen, Y.; Haywood, J.; Wang, Y.; Malavelle, F.; Jordan, G.; Peace, A.; Partridge, D.G.; Cho, N.; Oreopoulos, L.; Grosvenor, D.; et al. Substantial Cooling Effect from Aerosol-Induced Increase in Tropical Marine Cloud Cover. Nat. Geosci. 2024, 17, 404–410. [Google Scholar] [CrossRef]
  5. Intergovernmental Panel on Climate Change (IPCC). Climate change 2021: The physical science basis. In Contribution of Working Group I to the Sixth Assessment Report of the Intergovernmental Panel on Climate Change; Cambridge University Press: Cambridge, UK; New York, NY, USA, 2023; pp. 923–1054. [Google Scholar]
  6. Zhao, P.; Zhao, W.; Yuan, L.; Zhou, X.; Ge, F.; Xiao, H.; Zhang, P.; Wang, Y.; Zhou, Y. Spatial Heterogeneity of Aerosol Effect on Liquid Cloud Microphysical Properties in the Warm Season Over Tibetan Plateau. J. Geophys. Res. Atmos. 2023, 128, e2022JD037738. [Google Scholar] [CrossRef]
  7. Zhu, S.; Qian, L.; Ma, X.; Qiu, Y.; Yang, J.; He, X.; Li, J.; Zhu, L.; Gong, J.; Lu, C. Impact of Aerosols on the Macrophysical and Microphysical Characteristics of Ice-Phase and Mixed-Phase Clouds over the Tibetan Plateau. Remote Sens. 2024, 16, 1781. [Google Scholar] [CrossRef]
  8. Liu, T.; Liu, Q.; Chen, Y.; Wang, W.; Zhang, H.; Li, D.; Sheng, J. Effect of Aerosols on the Macro- and Micro-Physical Properties of Warm Clouds in the Beijing-Tianjin-Hebei Region. Sci. Total Environ. 2020, 720, 137618. [Google Scholar] [CrossRef] [PubMed]
  9. Rosenfeld, D.; Lohmann, U.; Raga, G.B.; O’Dowd, C.D.; Kulmala, M.; Fuzzi, S.; Reissell, A.; Andreae, M.O. Flood or Drought: How Do Aerosols Affect Precipitation? Science 2008, 321, 1309–1313. [Google Scholar] [CrossRef] [PubMed]
  10. Guo, J.; Deng, M.; Lee, S.S.; Wang, F.; Li, Z.; Zhai, P.; Liu, H.; Lv, W.; Yao, W.; Li, X. Delaying Precipitation and Lightning by Air Pollution over the Pearl River Delta. Part I: Observational Analyses. J. Geophys. Res. Atmos. 2016, 121, 6472–6488. [Google Scholar] [CrossRef]
  11. Li, Z.; Li, C.; Chen, H.; Tsay, S.-C.; Holben, B.; Huang, J.; Li, B.; Maring, H.; Qian, Y.; Shi, G.; et al. East Asian Studies of Tropospheric Aerosols and Their Impact on Regional Climate (EAST-AIRC): An Overview. J. Geophys. Res. 2011, 116, D00K34. [Google Scholar] [CrossRef]
  12. Guo, J.; Su, T.; Chen, D.; Wang, J.; Li, Z.; Lv, Y.; Guo, X.; Liu, H.; Cribb, M.; Zhai, P. Declining Summertime Local-Scale Precipitation Frequency Over China and the United States, 1981–2012: The Disparate Roles of Aerosols. Geophys. Res. Lett. 2019, 46, 13281–13289. [Google Scholar] [CrossRef]
  13. Lee, S.S.; Guo, J.; Li, Z. Delaying Precipitation by Air Pollution over the Pearl River Delta: 2. Model Simulations. J. Geophys. Res. Atmos. 2016, 121, 11739–11760. [Google Scholar] [CrossRef]
  14. Li, Z.; Niu, F.; Fan, J.; Liu, Y.; Rosenfeld, D.; Ding, Y. Long-Term Impacts of Aerosols on the Vertical Development of Clouds and Precipitation. Nat. Geosci. 2011, 4, 888–894. [Google Scholar] [CrossRef]
  15. Li, Z.; Lau, W.K.-M.; Ramanathan, V.; Wu, G.; Ding, Y.; Manoj, M.G.; Liu, J.; Qian, Y.; Li, J.; Zhou, T.; et al. Aerosol and Monsoon Climate Interactions over Asia. Rev. Geophys. 2016, 54, 866–929. [Google Scholar] [CrossRef]
  16. Seinfeld, J.H.; Bretherton, C.; Carslaw, K.S.; Coe, H.; DeMott, P.J.; Dunlea, E.J.; Feingold, G.; Ghan, S.; Guenther, A.B.; Kahn, R.; et al. Improving Our Fundamental Understanding of the Role of Aerosol−cloud Interactions in the Climate System. Proc. Natl. Acad. Sci. USA 2016, 113, 5781–5790. [Google Scholar] [CrossRef]
  17. Khatri, P.; Yoshida, K.; Hayasaka, T. Aerosol Effects on Water Cloud Properties in Different Atmospheric Regimes. J. Geophys. Res. Atmos. 2023, 128, e2023JD039729. [Google Scholar] [CrossRef]
  18. Fan, J.; Wang, Y.; Rosenfeld, D.; Liu, X. Review of Aerosol–Cloud Interactions: Mechanisms, Significance, and Challenges. J. Atmos. Sci. 2016, 73, 4221–4252. [Google Scholar] [CrossRef]
  19. Tao, W.; Chen, J.; Li, Z.; Wang, C.; Zhang, C. Impact of Aerosols on Convective Clouds and Precipitation. Rev. Geophys. 2012, 50, 2011RG000369. [Google Scholar] [CrossRef]
  20. Koren, I.; Martins, J.V.; Remer, L.A.; Afargan, H. Smoke Invigoration Versus Inhibition of Clouds over the Amazon. Science 2008, 321, 946–949. [Google Scholar] [CrossRef]
  21. Twomey, S. Pollution and the Planetary Albedo. Atmos. Environ. 2007, 41, 120–125. [Google Scholar] [CrossRef]
  22. Albrecht, B.A. Aerosols, Cloud Microphysics, and Fractional Cloudiness. Science 1989, 245, 1227–1230. [Google Scholar] [CrossRef] [PubMed]
  23. Xi, J.; Li, R.; Fan, X.; Wang, Y. Aerosol Effects on the Three-Dimensional Structure of Organized Precipitation Systems over Beijing-Tianjin-Hebei Region in Summer. Atmos. Res. 2024, 298, 107146. [Google Scholar] [CrossRef]
  24. Guo, X.; Fu, D.; Guo, X.; Zhang, C. A Case Study of Aerosol Impacts on Summer Convective Clouds and Precipitation over Northern China. Atmos. Res. 2014, 142, 142–157. [Google Scholar] [CrossRef]
  25. Han, X.; Zhao, B.; Lin, Y.; Chen, Q.; Shi, H.; Jiang, Z.; Fan, X.; Wang, J.; Liou, K.; Gu, Y. Type-Dependent Impact of Aerosols on Precipitation Associated With Deep Convective Cloud Over East Asia. J. Geophys. Res. Atmos. 2022, 127, e2021JD036127. [Google Scholar] [CrossRef]
  26. Zhao, B.; Gu, Y.; Liou, K.; Wang, Y.; Liu, X.; Huang, L.; Jiang, J.H.; Su, H. Type-Dependent Responses of Ice Cloud Properties to Aerosols From Satellite Retrievals. Geophys. Res. Lett. 2018, 45, 3297–3306. [Google Scholar] [CrossRef]
  27. Zhao, B.; Wang, Y.; Gu, Y.; Liou, K.-N.; Jiang, J.H.; Fan, J.; Liu, X.; Huang, L.; Yung, Y.L. Ice Nucleation by Aerosols from Anthropogenic Pollution. Nat. Geosci. 2019, 12, 602–607. [Google Scholar] [CrossRef]
  28. Protat, A.; Bouniol, D.; Delanoë, J.; O’Connor, E.; May, P.T.; Plana-Fattori, A.; Hasson, A.; Görsdorf, U.; Heymsfield, A.J. Assessment of Cloudsat Reflectivity Measurements and Ice Cloud Properties Using Ground-Based and Airborne Cloud Radar Observations. J. Atmos. Ocean. Technol. 2009, 26, 1717–1741. [Google Scholar] [CrossRef]
  29. Intergovernmental Panel on Climate Change (Ed.) Clouds and Aerosols. In Climate Change 2013—The Physical Science Basis; Cambridge University Press: Cambridge, UK, 2014; pp. 571–658. ISBN 978-1-107-05799-9. [Google Scholar]
  30. Satheesh, S.; Krishnamoorthy, K. Radiative Effects of Natural Aerosols: A Review. Atmos. Environ. 2005, 39, 2089–2110. [Google Scholar] [CrossRef]
  31. Qian, Y.; Gong, D.; Fan, J.; Leung, L.R.; Bennartz, R.; Chen, D.; Wang, W. Heavy Pollution Suppresses Light Rain in China: Observations and Modeling. J. Geophys. Res. Atmos. 2009, 114, 2008JD011575. [Google Scholar] [CrossRef]
  32. Stevens, B.; Feingold, G. Untangling Aerosol Effects on Clouds and Precipitation in a Buffered System. Nature 2009, 461, 607–613. [Google Scholar] [CrossRef] [PubMed]
  33. Fan, J.; Rosenfeld, D.; Yang, Y.; Zhao, C.; Leung, L.R.; Li, Z. Substantial Contribution of Anthropogenic Air Pollution to Catastrophic Floods in Southwest China. Geophys. Res. Lett. 2015, 42, 6066–6075. [Google Scholar] [CrossRef]
  34. Miao, H.; Wang, X.; Liu, Y.; Wu, G. Characterization of Cloud Microphysical Properties in Different Cloud Types over East Asia Based on CloudSat/CALIPSO Satellite Products. Atmos. Ocean. Sci. Lett. 2021, 14, 100050. [Google Scholar] [CrossRef]
  35. Lu, X.; Mao, F.; Rosenfeld, D.; Zhu, Y.; Pan, Z.; Gong, W. Satellite Retrieval of Cloud Base Height and Geometric Thickness of Low-Levelcloud Based on CALIPSO. Atmos. Chem. Phys. Discuss. 2021, 21, 11979–12003. [Google Scholar] [CrossRef]
  36. Li, Z.; Wang, Y.; Guo, J.; Zhao, C.; Cribb, M.C.; Dong, X.; Fan, J.; Gong, D.; Huang, J.; Jiang, M.; et al. East Asian Study of Tropospheric Aerosols and Their Impact on Regional Clouds, Precipitation, and Climate (EAST-AIRCPC). J. Geophys. Res. Atmos. 2019, 124, 13026–13054. [Google Scholar] [CrossRef]
  37. Zhou, C.; Zhang, X.; Gong, S.; Wang, Y.; Xue, M. Improving Aerosol Interaction with Clouds and Precipitation in a Regional Chemical Weather Modeling System. Atmos. Chem. Phys. 2016, 16, 145–160. [Google Scholar] [CrossRef]
  38. Fan, J.; Leung, L.R.; Li, Z.; Morrison, H.; Chen, H.; Zhou, Y.; Qian, Y.; Wang, Y. Aerosol Impacts on Clouds and Precipitation in Eastern China: Results from Bin and Bulk Microphysics. J. Geophys. Res. Atmos. 2012, 117, 2011JD016537. [Google Scholar] [CrossRef]
  39. Stephens, G.L. Cloud Feedbacks in the Climate System: A Critical Review. J. Clim. 2005, 18, 237–273. [Google Scholar] [CrossRef]
  40. Costantino, L.; Bréon, F.-M. Aerosol Indirect Effect on Warm Clouds over South-East Atlantic, from Co-Located MODIS and CALIPSO Observations. Atmos. Chem. Phys. 2013, 13, 69–88. [Google Scholar] [CrossRef]
  41. Koren, I.; Dagan, G.; Altaratz, O. From Aerosol-Limited to Invigoration of Warm Convective Clouds. Science 2014, 344, 1143–1146. [Google Scholar] [CrossRef]
  42. Miltenberger, A.K.; Field, P.R.; Hill, A.A.; Rosenberg, P.; Shipway, B.J.; Wilkinson, J.M.; Scovell, R.; Blyth, A.M. Aerosol–Cloud Interactions in Mixed-Phase Convective Clouds–Part 1: Aerosol Perturbations. Atmos. Chem. Phys. 2018, 18, 3119–3145. [Google Scholar] [CrossRef]
  43. Zhao, J.; Ma, X.; Quaas, J.; Jia, H. Exploring Aerosol–Cloud Interactions in Liquid-Phase Clouds over Eastern China and Its Adjacent Ocean Using the WRF-Chem–SBM Model. Atmos. Chem. Phys. 2024, 24, 9101–9118. [Google Scholar] [CrossRef]
  44. Ding, Y.; Liu, Q.; Lao, P.; Li, M.; Li, Y.; Zheng, Q.; Peng, Y. Spatial Distributions of Cloud Occurrences in Terms of Volume Fraction as Inferred from CloudSat and CALIPSO. Remote Sens. 2023, 15, 3978. [Google Scholar] [CrossRef]
  45. Mitchell, D.L.; Garnier, A. Advances in CALIPSO (IIR) Cirrus Cloud Property Retrievals–Part 2: Global Estimates of the Fraction of Cirrus Clouds Affected by Homogeneous Ice Nucleation. EGUsphere, 2024; preprint. [Google Scholar]
  46. Maciel, F.V.; Diao, M.; Patnaude, R. Examination of Aerosol Indirect Effects during Cirrus Cloud Evolution. Atmos. Chem. Phys. 2023, 23, 1103–1129. [Google Scholar] [CrossRef]
  47. Cairo, F.; Krämer, M.; Afchine, A.; Di Donfrancesco, G.; Di Liberto, L.; Khaykin, S.; Lucaferri, L.; Mitev, V.; Port, M.; Rolf, C.; et al. A Comparative Analysis of in Situ Measurements of High-Altitude Cirrus in the Tropics. Atmos. Meas. Tech. 2023, 16, 4899–4925. [Google Scholar] [CrossRef]
  48. Anderson, T.L.; Charlson, R.J.; Winker, D.M.; Ogren, J.A.; Holmén, K. Mesoscale Variations of Tropospheric Aerosols. J. Atmos. Sci. 2003, 60, 119–136. [Google Scholar] [CrossRef]
  49. Omar, A.H.; Winker, D.M.; Tackett, J.L.; Giles, D.M.; Kar, J.; Liu, Z.; Vaughan, M.A.; Powell, K.A.; Trepte, C.R. CALIOP and AERONET Aerosol Optical Depth Comparisons: One Size Fits None. J. Geophys. Res. Atmos. 2013, 118, 4748–4766. [Google Scholar] [CrossRef]
  50. Young, A.H.; Bates, J.J.; Curry, J.A. Application of Cloud Vertical Structure from CloudSat to Investigate MODIS-derived Cloud Properties of Cirriform, Anvil, and Deep Convective Clouds. J. Geophys. Res. Atmos. 2013, 118, 4689–4699. [Google Scholar] [CrossRef]
  51. Deng, M.; Mace, G.G.; Wang, Z.; Okamoto, H. Tropical Composition, Cloud and Climate Coupling Experiment Validation for Cirrus Cloud Profiling Retrieval Using CloudSat Radar and CALIPSO Lidar. J. Geophys. Res. Atmos. 2010, 115, 2009JD013104. [Google Scholar] [CrossRef]
  52. Sassen, K.; Wang, Z.; Liu, D. Global Distribution of Cirrus Clouds from CloudSat/Cloud-Aerosol Lidar and Infrared Pathfinder Satellite Observations (CALIPSO) Measurements. J. Geophys. Res. Atmos. 2008, 113, 2008JD009972. [Google Scholar] [CrossRef]
  53. Sassen, K.; Wang, Z. Classifying Clouds around the Globe with the CloudSat Radar: 1-year of Results. Geophys. Res. Lett. 2008, 35, 2007GL032591. [Google Scholar] [CrossRef]
  54. Muhlbauer, A.; McCoy, I.L.; Wood, R. Climatology of Stratocumulus Cloud Morphologies: Microphysical Properties and Radiative Effects. Atmos. Chem. Phys. 2014, 14, 6695–6716. [Google Scholar] [CrossRef]
  55. Gao, W.; Sui, C.-H.; Hu, Z. A Study of Macrophysical and Microphysical Properties of Warm Clouds over the Northern Hemisphere Using CloudSat/CALIPSO Data: Properties of Warm Clouds over NH. J. Geophys. Res. Atmos. 2014, 119, 3268–3280. [Google Scholar] [CrossRef]
  56. Zhang, J.-Q.; Chen, H.-B. Macrophysical Properties of Specific Cloud Types from Radiosonde and Surface Active Remote Sensing Measurements over the ARM Southern Great Plains Site. Atmos. Ocean. Sci. Lett. 2017, 10, 29–35. [Google Scholar] [CrossRef]
  57. Chen, Y.-C.; Wang, S.-H.; Min, Q.; Lu, S.; Lin, P.-L.; Lin, N.-H.; Chung, K.-S.; Joseph, E. Aerosol Impacts on Warm-Cloud Microphysics and Drizzle in a Moderately Polluted Environment. Atmos. Chem. Phys. 2021, 21, 4487–4502. [Google Scholar] [CrossRef]
  58. Lee, S.S. Effect of Aerosol on Circulations and Precipitation in Deep Convective Clouds. J. Atmos. Sci. 2012, 69, 1957–1974. [Google Scholar] [CrossRef]
  59. Ngo, D.; Diao, M.; Patnaude, R.J.; Woods, S.; Diskin, G. Aerosol–Cloud Interactions in Cirrus Clouds Based on Global-Scale Airborne Observations and Machine Learning Models. Atmos. Chem. Phys. 2025, 25, 7007–7036. [Google Scholar] [CrossRef]
  60. Zhang, J.; Zhao, B.; Liu, X.; Lin, G.; Jiang, Z.; Wu, C.; Zhao, X. Effects of Different Types of Aerosols on Deep Convective Clouds and Anvil Cirrus. Geophys. Res. Lett. 2022, 49, e2022GL099478. [Google Scholar] [CrossRef]
  61. Wood, R. Stratocumulus Clouds. Mon. Weather Rev. 2012, 140, 2373–2423. [Google Scholar] [CrossRef]
  62. Sun, Y.; Wang, Y.; Zhao, C.; Zhou, Y.; Yang, Y.; Yang, X.; Fan, H.; Zhao, X.; Yang, J. Vertical Dependency of Aerosol Impacts on Local Scale Convective Precipitation. Geophys. Res. Lett. 2023, 50, e2022GL102186. [Google Scholar] [CrossRef]
  63. Diamond, M.S.; Wood, R. Limited Regional Aerosol and Cloud Microphysical Changes Despite Unprecedented Decline in Nitrogen Oxide Pollution During the February 2020 COVID-19 Shutdown in China. Geophys. Res. Lett. 2020, 47, e2020GL088913. [Google Scholar] [CrossRef]
  64. Wilcox, E.M. Stratocumulus Cloud Thickening beneath Layers of Absorbing Smoke Aerosol. Atmos. Chem. Phys. 2010, 10, 11769–11777. [Google Scholar] [CrossRef]
  65. Fan, J.; Leung, L.R.; Rosenfeld, D.; Chen, Q.; Li, Z.; Zhang, J.; Yan, H. Microphysical Effects Determine Macrophysical Response for Aerosol Impacts on Deep Convective Clouds. Proc. Natl. Acad. Sci. USA 2013, 110, E4581–E4590. [Google Scholar] [CrossRef]
  66. Herbert, R.J.; Williams, A.I.L.; Weiss, P.; Watson-Parris, D.; Dingley, E.; Klocke, D.; Stier, P. Regional Variability of Aerosol Impacts on Clouds and Radiation in Global Kilometer-Scale Simulations. Atmos. Chem. Phys. 2025, 25, 7789–7814. [Google Scholar] [CrossRef]
  67. Lee, J.; Seifert, P.; Hashino, T.; Maahn, M.; Senf, F.; Knoth, O. Simulations of the Impact of Cloud Condensation Nuclei and Ice-Nucleating Particles Perturbations on the Microphysics and Radar Reflectivity Factor of Stratiform Mixed-Phase Clouds. Atmos. Chem. Phys. 2024, 24, 5737–5756. [Google Scholar] [CrossRef]
  68. Simpson, E.L.; Connolly, P.J.; McFiggans, G. Competition for Water Vapour Results in Suppression of Ice Formation in Mixed-Phase Clouds. Atmos. Chem. Phys. 2018, 18, 7237–7250. [Google Scholar] [CrossRef]
  69. Beswick, K.; Baumgardner, D.; Gallagher, M.; Raga, G.B.; Minnis, P.; Spangenberg, D.A.; Volz-Thomas, A.; Nedelec, P.; Wang, K.-Y. Properties of Small Cirrus Ice Crystals from Commercial Aircraft Measurements and Implications for Flight Operations. Tellus B Chem. Phys. Meteorol. 2015, 67, 27876. [Google Scholar] [CrossRef]
  70. Williams, A.S.; Igel, A.L. Cloud Top Radiative Cooling Rate Drives Non-Precipitating Stratiform Cloud Responses to Aerosol Concentration. Geophys. Res. Lett. 2021, 48, e2021GL094740. [Google Scholar] [CrossRef]
  71. Glassmeier, F.; Hoffmann, F.; Johnson, J.S.; Yamaguchi, T.; Carslaw, K.S.; Feingold, G. Aerosol-Cloud-Climate Cooling Overestimated by Ship-Track Data. Science 2021, 371, 485–489. [Google Scholar] [CrossRef]
  72. Hernandez-Deckers, D.; Matsui, T.; Fridlind, A.M. Updraft Dynamics and Microphysics: On the Added Value of the Cumulus Thermal Reference Frame in Simulations of Aerosol–Deep Convection Interactions. Atmos. Chem. Phys. 2022, 22, 711–724. [Google Scholar] [CrossRef]
  73. Engström, A.; Ekman, A.M.L. Impact of Meteorological Factors on the Correlation between Aerosol Optical Depth and Cloud Fraction. Geophys. Res. Lett. 2010, 37, 2010GL044361. [Google Scholar] [CrossRef]
  74. Hahs-Vaughn, D.L. Applied Multivariate Statistical Concepts; Routledge: New York, NY, USA, 2024. [Google Scholar]
  75. Zhao, B.; Liou, K.-N.; Gu, Y.; Jiang, J.H.; Li, Q.; Fu, R.; Huang, L.; Liu, X.; Shi, X.; Su, H.; et al. Impact of Aerosols on Ice Crystal Size. Atmos. Chem. Phys. 2018, 18, 1065–1078. [Google Scholar] [CrossRef] [PubMed]
  76. Dimitrelos, A.; Ekman, A.M.L.; Caballero, R. Moisture and Aerosols as Key Drivers of the Turbulent State of Arctic Mixed-Phase Clouds During Idealized Moist Intrusions. J. Geophys. Res. Atmos. 2024, 129, e2023JD039580. [Google Scholar] [CrossRef]
  77. Pöhlker, M.L.; Pöhlker, C.; Quaas, J.; Mülmenstädt, J.; Pozzer, A.; Andreae, M.O.; Artaxo, P.; Block, K.; Coe, H.; Ervens, B.; et al. Global Organic and Inorganic Aerosol Hygroscopicity and Its Effect on Radiative Forcing. Nat. Commun. 2023, 14, 6139. [Google Scholar] [CrossRef]
  78. Liu, F.; Mao, F.; Rosenfeld, D.; Pan, Z.; Zang, L.; Zhu, Y.; Gong, W. Marine Stratocumulus Clouds with More Coarse Sea Spray Aerosols Are Brighter. Geophys. Res. Lett. 2025, 52, e2024GL113718. [Google Scholar] [CrossRef]
  79. Baró Pérez, A.; Diamond, M.S.; Bender, F.A.-M.; Devasthale, A.; Schwarz, M.; Savre, J.; Tonttila, J.; Kokkola, H.; Lee, H.; Painemal, D.; et al. Comparing the Simulated Influence of Biomass Burning Plumes on Low-Level Clouds over the Southeastern Atlantic under Varying Smoke Conditions. Atmos. Chem. Phys. 2024, 24, 4591–4610. [Google Scholar] [CrossRef]
  80. Allen, R.J.; Amiri-Farahani, A.; Lamarque, J.-F.; Smith, C.; Shindell, D.; Hassan, T.; Chung, C.E. Observationally Constrained Aerosol–Cloud Semi-Direct Effects. npj Clim. Atmos. Sci. 2019, 2, 16. [Google Scholar] [CrossRef]
  81. Yuan, T.; Song, H.; Wood, R.; Wang, C.; Oreopoulos, L.; Platnick, S.E.; Von Hippel, S.; Meyer, K.; Light, S.; Wilcox, E. Global Reduction in Ship-Tracks from Sulfur Regulations for Shipping Fuel. Sci. Adv. 2022, 8, eabn7988. [Google Scholar] [CrossRef]
  82. Liu, H.; Guo, J.; Koren, I.; Altaratz, O.; Dagan, G.; Wang, Y.; Jiang, J.H.; Zhai, P.; Yung, Y.L. Non-Monotonic Aerosol Effect on Precipitation in Convective Clouds over Tropical Oceans. Sci. Rep. 2019, 9, 7809. [Google Scholar] [CrossRef]
  83. Jiang, J.H.; Su, H.; Huang, L.; Wang, Y.; Massie, S.; Zhao, B.; Omar, A.; Wang, Z. Contrasting Effects on Deep Convective Clouds by Different Types of Aerosols. Nat. Commun. 2018, 9, 3874. [Google Scholar] [CrossRef] [PubMed]
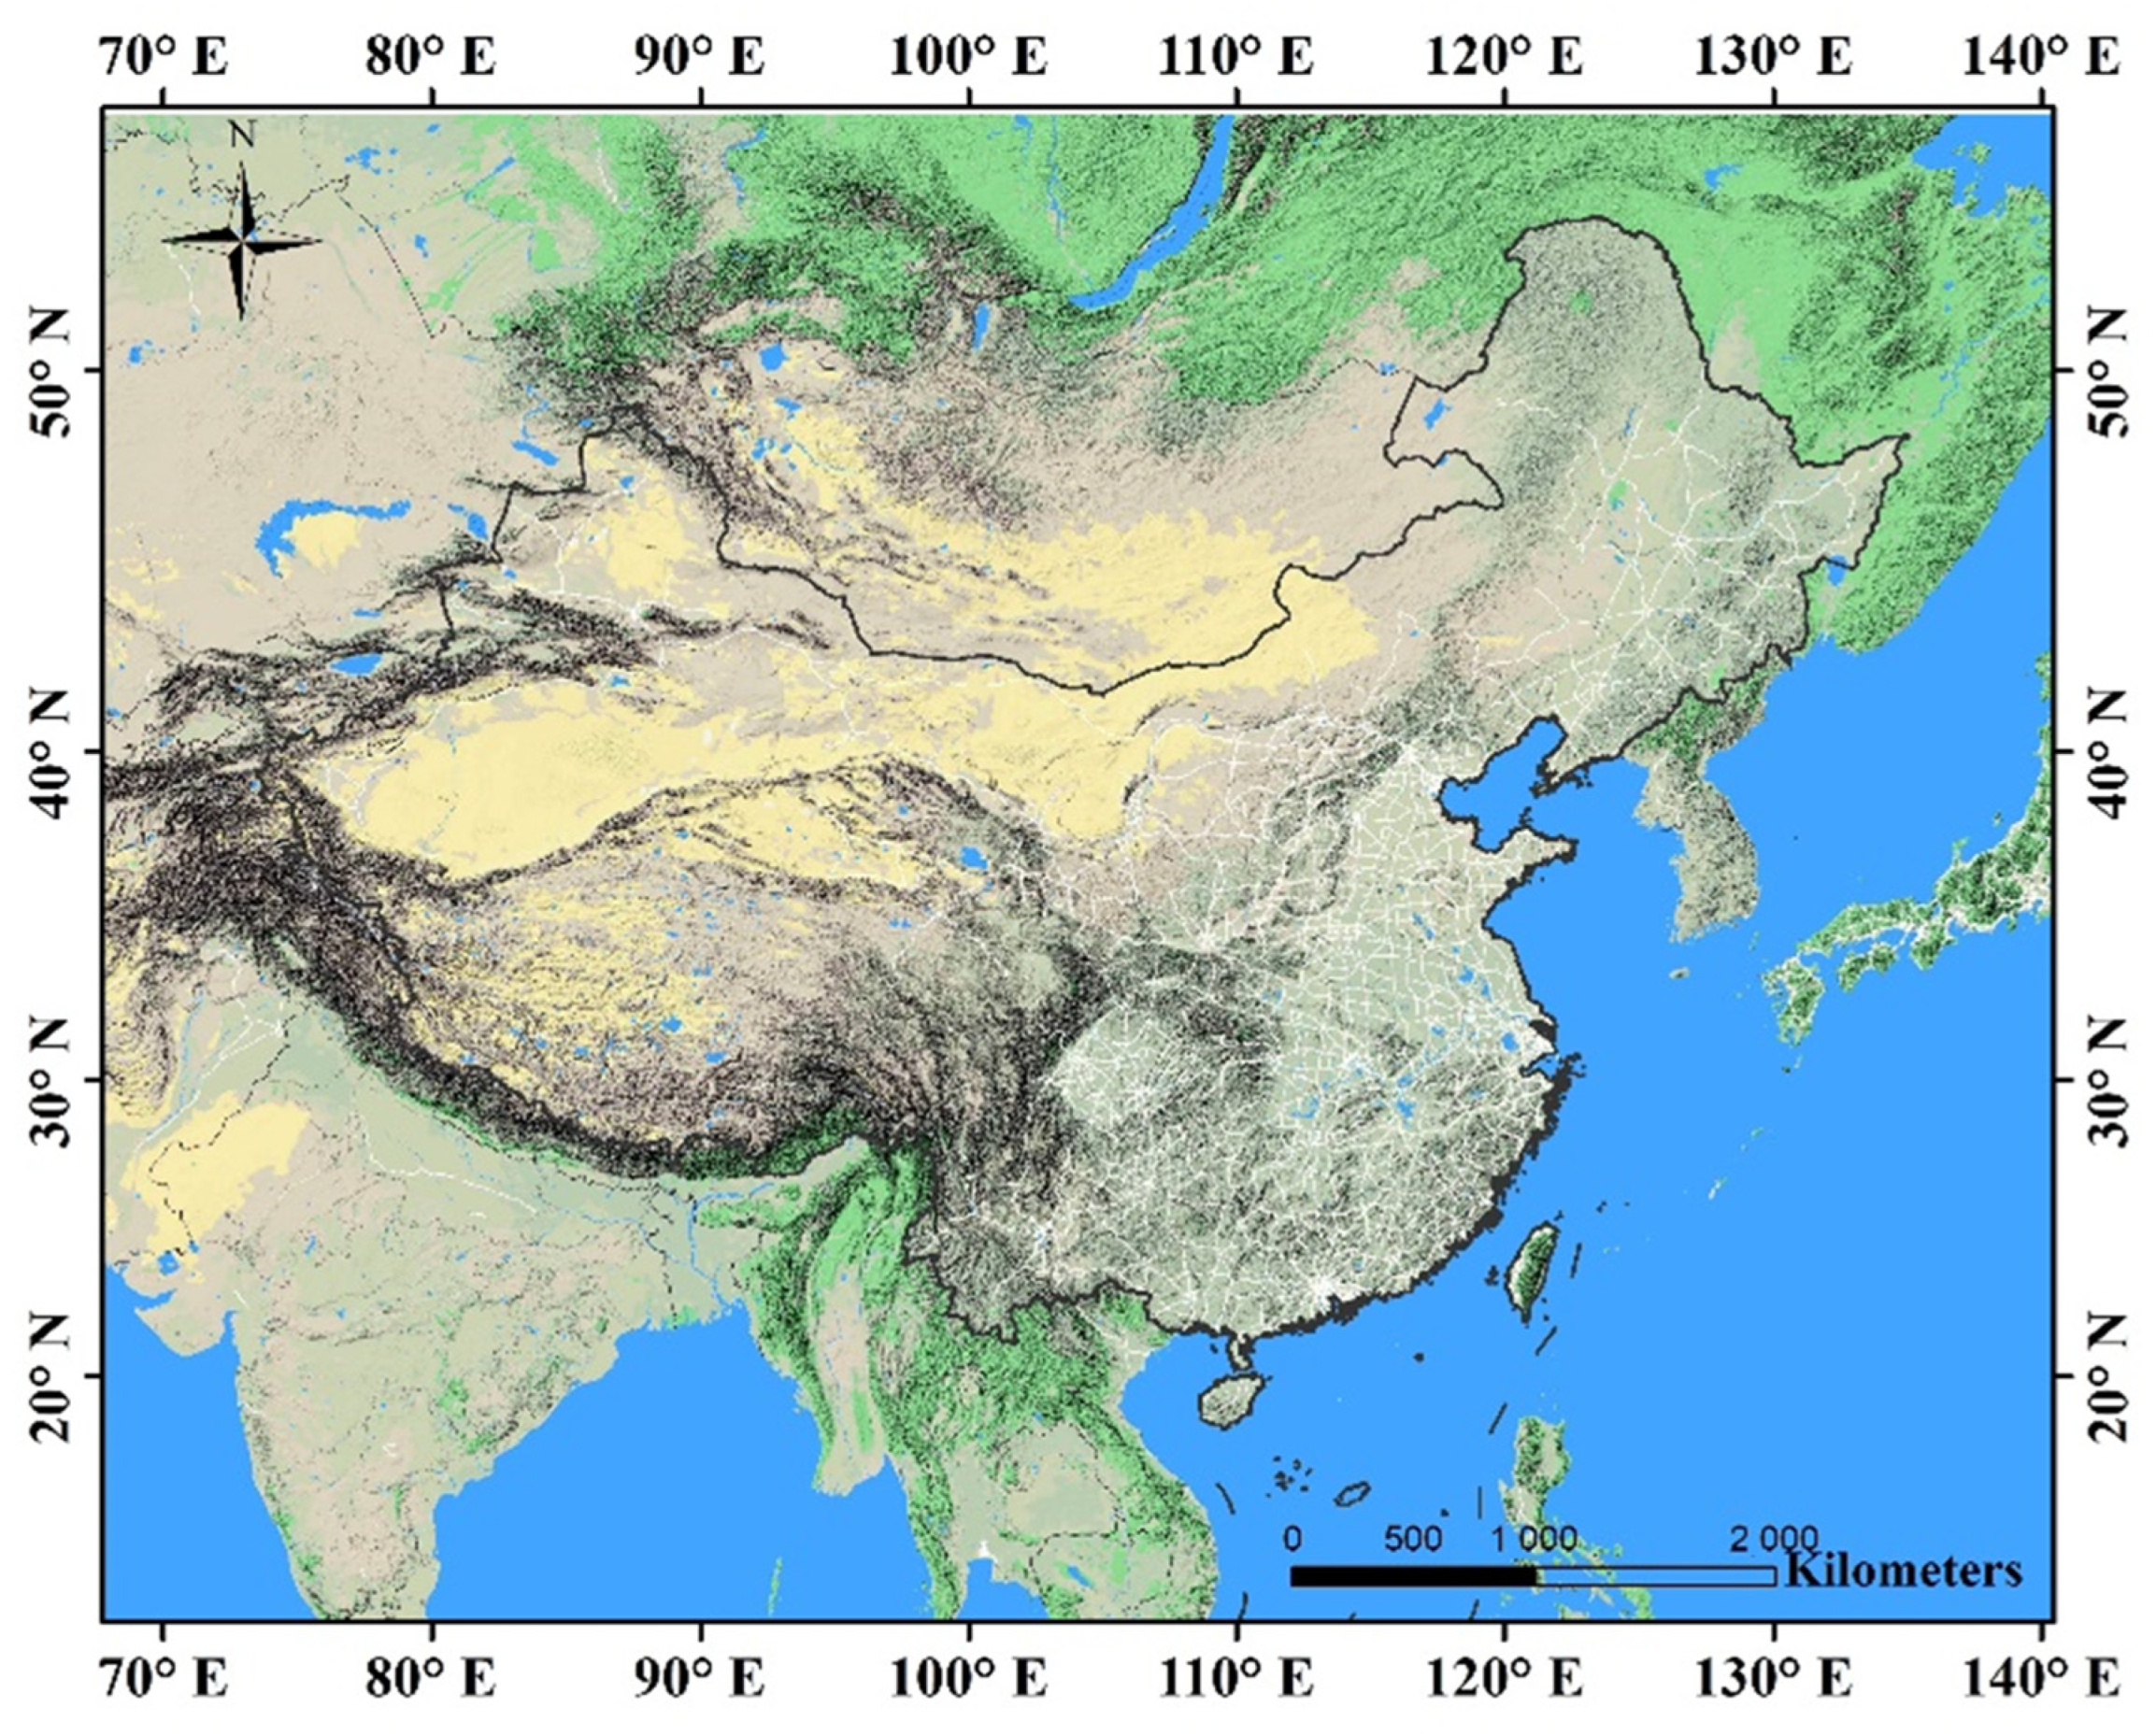
Figure 1. Illustration of the spatial domain of this study (15–55°N, 70–135°E).
Remotesensing 17 03535 g001
Figure 2. Schematic diagram of the vertical collocation of satellite products (adapted from Young et al., 2013 [50]).
Remotesensing 17 03535 g002
Figure 3. Response of cloud fraction (CF) to AOD for eight cloud types identified by CloudSat. For each cloud type, AOD values were divided into four bins with equal sample sizes, and the mean and standard deviation of CF were calculated for each bin.
Remotesensing 17 03535 g003
Figure 4. Same as Figure 3 but for the response of cloud top height (CTH) to AOD for eight cloud types identified by CloudSat.
Remotesensing 17 03535 g004
Figure 5. Same as Figure 3 but for the response of cloud depth (CD) to AOD for eight cloud types identified by CloudSat.
Remotesensing 17 03535 g005
Figure 6. Same as Figure 3 but for the response of ice cloud fraction (ICF) to AOD for eight cloud types identified by CloudSat.
Remotesensing 17 03535 g006
Figure 7. Same as Figure 3 but for the response of ice cloud effective radius (Rei) to AOD for eight cloud types identified by CloudSat.
Remotesensing 17 03535 g007
Figure 8. Same as Figure 3 but for the response of the ice water path (IWP) to AOD for eight cloud types identified by CloudSat.
Remotesensing 17 03535 g008
Figure 9. Pearson’s total and partial correlations between AOD and CTH (a), CF (b) and CD (c) for the eight cloud types. The leftmost and rightmost columns denote the total correlation and partial correlations with the influence of all the 14 meteorological parameters simultaneously removed, respectively. The remaining columns denote partial correlations with the meteorological effect removed individually. The correlations that are statistically significant at the 0.01 level on the basis of the Student t-test are marked with * symbol, and those with statistical significance at the 0.05 level are marked with ○ symbol.
Remotesensing 17 03535 g009
Figure 10. Responses of ICF to changes in AOD for eight cloud types under different relative humidity (RH) conditions. The samples were evenly divided into three groups according to RH, and the AOD–ICF relationship curve was calculated for each group (blue, red, and black solid lines), along with the overall trend for all data (black dashed line).
Remotesensing 17 03535 g010
Table 1. Datasets used in this study.
Satellite/SensorProductVariableHorizontal Resolution
Aqua/MODISMYDATM (Level 2, Collection 6.1)Column AOD10 km × 10 km
Cloud phase (determined by the “cloud optical property” algorithm) and primary cloud retrieval outcome, which are used to calculate ice cloud fraction1 km × 1 km
CALIPSO/CALIOP05kmMLay
(Level 2, V4.1)
Aerosol/cloud layer number, layer aerosol/cloud optical depth, feature classification flags (containing the “aerosol type” flag), CAD score, and extinction QC5 km along-track
CloudSat/CPR2B-CLDCLASS-LIDARCloud subtypes
Cloud Base Height
Cloud Top Height
Cloud Layer
Cloud Phase
Cloud Phase Confidence Level
1.7 km along-track
ECMWF-AUXMeteorological parameters such as CAPE, wind shear, vertically resolved pressure, vertical velocity, and wind speed1.7 km along-track 1
1 In the ECMWF-AUX product, the ECMWF state variable data have been interpolated to the track of CloudSat, so it has the same resolution as most CloudSat level 2 products.
Table 2. Sample size statistics corresponding to eight cloud types.
Cirrus846,772
Altostratus214,676
Altocumulus344,451
Stratus4312
Stratocumulus477,437
Cumulus750,291
Nimbostratus8822
Deep Convection5383
Total Samples9,621,940
Valid Samples (AOD ≥ 0)2,652,686
Disclaimer/Publisher’s Note: The statements, opinions and data contained in all publications are solely those of the individual author(s) and contributor(s) and not of MDPI and/or the editor(s). MDPI and/or the editor(s) disclaim responsibility for any injury to people or property resulting from any ideas, methods, instructions or products referred to in the content.