Highlights
What are the main findings?
- In southwestern Saudi Arabia, vegetation cover and human activity were identified as the dominant drivers of wildfire occurrence, with clear clustering in high-elevation mountainous areas.
- The Maxent model demonstrated a significant advantage in regions with scarce data or limited samples, producing more focused and accurate predictions that verify its robustness in small-sample modeling.
What is the implications of the main finding?
- In data-limited regions, models such as Maxent can achieve robust wildfire risk prediction and provide methodological guidance for integrating high-resolution vegetation and human activity data to support long-term wildfire risk monitoring and management in arid and semi-arid areas.
Abstract
In recent years, ecosystems in Saudi Arabia have experienced severe degradation due to factors such as hyperaridity, overgrazing, climate change, urban expansion, and an increase in uncontrolled wildfires. Among these, wildfires have emerged as the second most significant threat to forests after urban expansion. This study aims to map wildfire susceptibility in southwestern Saudi Arabia by identifying key driving factors and evaluating the performance of several machine learning models under conditions of limited and imbalanced data. The models tested include Maxent, logistic regression, random forest, XGBoost, and support vector machine. In addition, an NDVI-based phenological approach was applied to assess seasonal vegetation dynamics and to compare its effectiveness with conventional machine learning-based susceptibility mapping. All methods generated effective wildfire risk maps, with Maxent achieving the highest predictive accuracy (AUC = 0.974). The results indicate that human activities and dense vegetation cover are the primary contributors to wildfire occurrence. This research provides valuable insights for wildfire risk assessment in data-scarce regions and supports proactive fire management strategies in non-traditional fire-prone environments.
1. Introduction
Forests are vital natural resources that provide essential ecosystem services, such as preserving biodiversity, sequestering carbon, filtering water, regenerating soil, and supplying fuel, food and timber, and recreation opportunities [1,2]. However, the frequency of wildfires has gradually increased globally in recent years due to anthropogenic or natural factors [3,4]. Although forest wildfires are a common natural hazard and an essential ecological process in forest ecosystems worldwide [5], the combined effects of global warming and increasing extreme weather events have made them a major driver of severe ecological damage to forested areas [6]. In some parts of the world, wildfires are one of the key factors that can cause environmental, economic, security, demographic and social problems in a region [7,8,9]. According to the Food and Agriculture Organization of the United Nations (FAO) report, the Global Forest Resources Assessment 2020 [10], fires burnt about four percent of the world’s forests each year, and soil degradation caused by wildfires resulted in significant loss of arable land and reduced crop yields [11,12]. In terms of economic losses, wildfires not only cause hundreds of billions of dollars in direct economic losses [13], but also have huge indirect costs, such as life and health, environmental remediation, insurance and relief costs, property depreciation, and a host of other socio-economic issues, which may even exceed the direct economic losses [14,15,16]. In addition, the contribution of wildfires to carbon emissions is so significant that in 2023 alone, the area burned by wildfires in Canada will be seven times the annual average of the past four decades, and will result in carbon emissions comparable to those of the world’s major fossil fuels and only slightly lower than the annual fossil fuel emissions of the United States, China, and India [17].
A review of the existing literature reveals that the factors contributing to forest fire occurrence are multifaceted. Climatic conditions such as temperature, humidity, wind speed and drought strongly influence the occurrence of wildfires [18]. Vegetation is particularly sensitive to changes in these factors [19]. For instance, extreme drought events increase forest susceptibility to fire [20]. Topography also plays a critical role in wildfire occurrence and development, as terrain can either facilitate or hinder fire spread and ignition [21]. For example, a study by Maingi and Henry [22] noted a significant relationship between topography and fire frequency. Different elevations, slopes, and aspects all directly affect vegetation cover density, moisture accumulation, and surface dryness and wetness by influencing the distribution of moisture, light, and temperature. In addition to natural environmental factors, other factors may also influence the occurrence and spread of wildfires. For example, Zumbrunnen et al. [23] pointed out that the occurrence of fires can be affected by land use and economic conditions. Sturtevant et al. [24] identified housing density as a significant predictor of fire occurrence. Romero-Calcerrada et al. [25] found that spatial patterns of wildfire ignition are closely related to human access to natural landscapes, with proximity to urban areas and roads being the most important risk factors. The influence of fire risk factors varies from region to region, depending on environmental, geographical, and socio-economic conditions. Therefore, understanding the relationship between fire risk factors and fire occurrence in a region is of great significance for improving forest fire prevention policies and establishing effective fire prevention measures. In recent years, risk assessment of regional forest fires has also received more attention from scholars and international organizations [26].
Advancements in GIS and remote sensing, together with modern analysis and modeling techniques that integrate remotely sensed observations with field data, have greatly enhanced wildfire research [27,28]. For wildfire susceptibility or risk assessment, some researchers have used decision analysis methods such as fuzzy logic methods [29] and analytical hierarchical analysis (AHP) [30]; neural networks, e.g., CNN-based spatial prediction models [31] and multilayer perceptron MLP-NN models [32]; statistical modeling and machine learning, such as logistic regression [33], geographically weighted logistic regression [34], SVM [35], random forest [36], Bayesian networks [37], and Maxent [38]. Although the application of machine learning methods has significantly advanced wildfire risk assessment, each algorithm exhibits distinct advantages under varying landscape conditions and data environments. Random forest has been widely recognized as a preferred model in wildfire susceptibility mapping due to its robustness against overfitting, high predictive accuracy, and strong capability to handle multicollinearity in environmental datasets [39,40,41]. Support vector machine demonstrates superior performance in small-sample and high-dimensional feature scenarios, as it effectively captures complex boundary relationships between variables and enhances classification accuracy and generalization ability [42,43,44]. Logistic regression, as a classical probabilistic modeling approach, is valued for its strong interpretability and low computational cost [45], although its performance tends to decline when dealing with nonlinear patterns, multicollinearity, or high-dimensional data [46]. XGBoost, as a gradient boosting algorithm, offers high efficiency and accuracy, making it especially suitable for structured environmental datasets and widely adopted in wildfire susceptibility studies [47]. While no single model proves universally optimal, effective and reliable wildfire risk mapping requires a comprehensive consideration of dataset characteristics, computational constraints, and the need for model interpretability in order to select the most appropriate machine learning (ML) approach.
Remote sensing is a critical source of large-scale land cover data, especially for vegetation. Vegetation indices, such as the Normalized Difference Vegetation Index (NDVI), Enhanced Vegetation Index (EVI), and Soil-Adjusted Vegetation Index (SAVI), are calculated from spectral image data. These indices quantify plant spectral characteristics to monitor vegetation cover, assess its health status, and track its seasonal dynamics across various spatial scales [48,49]. In wildfire studies, Chéret et al. [50] analyzed NDVI time series data from MODIS Terra images between 2000 and 2006, revealing the annual variations in vegetation across different phenological stages. By integrating indicators such as spring and annual vegetation greenness, they assessed the fire susceptibility of Mediterranean vegetation. Similarly, Van Wagtendonk et al. [51] utilized multi-temporal Landsat NDVI data to map vegetation fuel, identifying potential fire-prone areas by analyzing vegetation photosynthesis and health conditions. In the Kurdistan region, Rahimi et al. [52] employed remote sensing and GIS techniques, incorporating the NDVI and other vegetation indices along with geospatial data to map potential forest fire risk areas.
This study aims to evaluate the applicability of a number of machine learning methods for wildfire susceptibility mapping, including the Maxent model, logistic regression, random forest, XGBoost, and SVM. The southwestern region of Saudi Arabia was selected as the study area for comparative analysis. Although these methods have been widely applied in different regions, there is still a lack of systematic comparison between multiple modeling techniques in data-scarce environments. In addition, this study makes use of NDVI-based vegetation indices and phenological information to investigate the main environmental drivers of wildfire occurrence in the region, thereby addressing the existing research gap concerning wildfire risk in southwestern Saudi Arabia.
2. Materials and Methods
2.1. Study Area
The study area is located in the southwest of Saudi Arabia, encompassing Al Bahah, Makkah, Jazan, and Asir, as show in Figure 1. The geographical extent of the study area is from 16°05′39.5″ N to 27°23′56.0″ N latitude and from 36°46′19.98″ E to 47°44′36.5″ E longitude. Saudi Arabia is an arid country in the usual sense of the word, with only a few exceptional semi-humid areas in the southwestern highlands with mountain streams, forests, and high-altitude terraces, which together constitute one of the most unusual ecological zones in the country [53]. According to the Ministry of Agriculture of Saudi Arabia, this region is endowed with vast natural forests with a woodland area of about 27,000 square kilometers, of which about 80% is dispersed in the Sarawat Mountains [54]. The region is rich in ecological resources, and more than 80% of the tree species in Saudi Arabia are found here, including Acacia and Ficus spp. It is characterized by a semi-arid climate due to high precipitation [55]. Precipitation in Saudi Arabia throughout the year is mainly concentrated from October of the current year to April of the following year, and in the other months there is almost no precipitation except in the southwestern region [56]. In the case of Asir, for example, although precipitation occurs essentially throughout the year, due to the influence of the Indian monsoon [57], precipitation also occurs mainly during the period from October of the current year to March of the following year with an average rainfall of 300 mm, which is about more than 60% of the annual precipitation of the region.
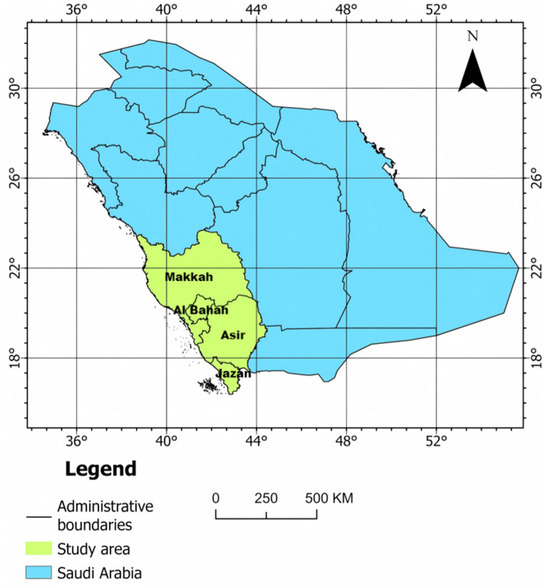
Figure 1.
Study Area.
In recent years, ecosystems in this region have been severely damaged with the degradation of woodlands due to a variety of reasons including overgrazing, climate change, urban expansion, and the spread of uncontrolled forest fires [58]. Fire is also considered the second most important forest threat after urban sprawl. The National Center for Vegetation Development and Combating Desertification (NCVC) of Saudi Arabia acknowledges the vital importance of the Kingdom’s forests, particularly in the south and southwest. To support local forest wildfire prevention policies, this research will conduct a targeted study on fire susceptibility in the southwestern region.
2.2. Methodology
The methodology is shown in Figure 2, which involves three main phases: data collection, data processing and data analysis.
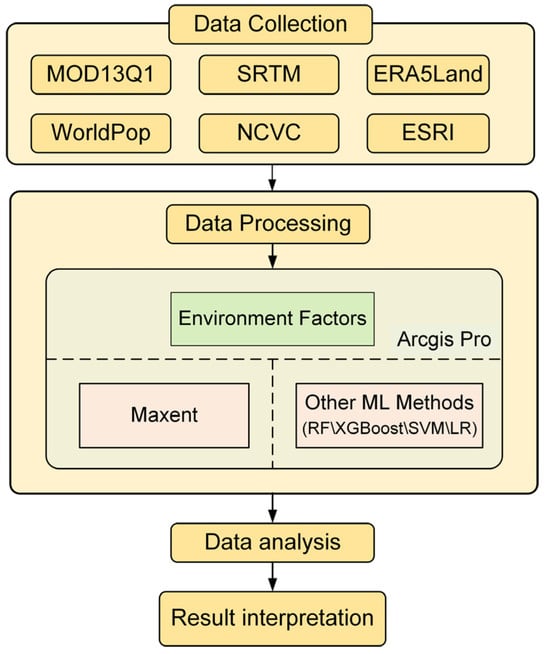
Figure 2.
Research Flowchart.
2.3. Data Collection
The wildfire location data were provided by King Khalid University and NCVC. The data were collected from 12 July 2019 to 18 October 2023, excluding wildfire locations with incomplete information. A total of 54 wildfire data points are shown in Figure 3, most of which tend to be regionally concentrated and are located near roads and in higher elevation areas.
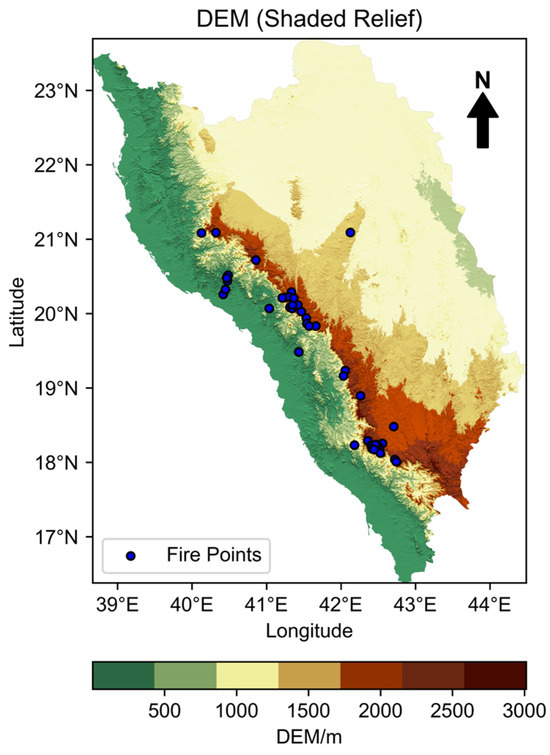
Figure 3.
Wildfire point locations with DEM.
Based on wildfire occurrence processes and the data available for the study area, 11 influencing factors were identified, as listed in Table 1, including topographic, meteorological, vegetation-related, and human factors. These variable behaviors are specific to the biome in which the phenomenon occurred. DEM data were sourced from the Shuttle Radar Topography Mission (SRTM) dataset with a spatial resolution of 30 m [59]. Slope and aspect were derived from the DEM using ArcGIS Pro 3.3. Meteorological variables and surface water storage were extracted from the ERA5-Land reanalysis dataset, and averaged over the five days period preceding each wildfire event using a Python script (Python 3.9.23). NDVI and land use/land cover data were derived from MODIS MOD13Q1 [60] and the global land cover product developed by Impact Observatory based on Sentinel-2 data [61]. Wildfire and road network data were provided by King Khalid University and NCVC, while population data were sourced from WorldPop [62]. All data presented in Table 1 were preprocessed in ArcGIS Pro 3.3, resampled to 1 km resolution, and converted into raster layers with the consistent spatial extent and georeferencing system.

Table 1.
Environmental variables for predicting the probability of wildfire occurrence in the study area.
We used the daily average meteorological data over the 5 days preceding each ignition event because short-term meteorological conditions strongly influence wildfire occurrence and spread. Variables such as temperature, precipitation, and wind speed typically exhibit cumulative effects over several days. For example, high temperatures and low precipitation over consecutive days can progressively dry fuels, while elevated wind speeds can increase ignition likelihood and facilitate fire spread. Using a 5-day window therefore captures the immediate pre-fire conditions that are most relevant to ignition risk, without diluting their influence by incorporating longer-term averages.
2.4. Maximum Entropy Model
Maxent is a general-purpose approach for making predictions or inferences from incomplete information [63]. Its core principle is to estimate a probability distribution with maximum entropy under known constraints, producing the most uniform and least biased prediction [64]. In wildfire risk modeling, the model’s prediction space is defined by the study area, with recorded wildfire locations serving as presence samples. These samples are described by variables representing climatic, environmental, and anthropogenic conditions. Compared to other models, Maxent offers several advantages, including simple input requirements, ease of use, and stable performance. It can produce reliable spatial predictions using only presence data and associated environmental variables, without the need for absence data or randomly generated background points, making it particularly effective when datasets are limited or incomplete [65].
In this project, Maxent version 3.4.4 was employed for modeling; 70% of the fire occurrence points were randomly selected for training and 30% for testing, a commonly applied ratio that balances model calibration with independent evaluation [66,67]. To improve the robustness of the results when modeling with limited samples, we used 10 bootstrap replicates and evaluated model performance as the average across replicates. In addition, we conducted a sensitivity analysis by comparing results across multiple model runs with varying parameter settings. The consistency of spatial prediction patterns across replicates supports the robustness of the model outcomes despite the restricted sample size.
2.5. Other ML Methods
In this study, four other ML models, including random forest, logistic regression, support vector machine, and extreme gradient boosting, were also applied. These models typically require explicit absence samples during the modeling process. To address this, pseudo-absence points were randomly generated within the study area, while those overlapping or adjacent to fire points were removed to avoid spatial bias. The spatial distribution of pseudo-absence points was carefully controlled to ensure uniform coverage across the entire study area. To avoid spatial clustering, we generated a number of pseudo-absence points equal to the number of fire occurrences to ensure a balanced dataset.
2.5.1. Logistic Regression
Logistic regression is a statistical model and a mathematical modeling approach. Logistic regression models are mainly applied to classification problems and can be used to describe the relationship between several independent variables of environmental factors and whether a fire occurs or not [68]. LR models are characterized by model simplicity, ease of implementation, high interpretability and efficiency when dealing with large-scale datasets.
2.5.2. Support Vector Machine
Support vector machine (SVM) is a widely used ML algorithm proposed by Vapnik [69] based on the fundamental risk minimization principle. SVM models have been successfully used in many applications such as image recognition, text classification, bioinformatics, and fire prediction [70]. SVM is a supervised learning model for solving classification and regression problems. Its main idea is to find an optimal hyperplane in the feature space, which is used as a decision to distinguish between different classes of data. Compared with other ML models, SVM has a significant advantage in dealing with high dimensional datasets with large feature spaces [71,72].
2.5.3. Random Forest
Random forest (RF) is an integrated learning algorithm mainly used to solve classification, regression problems and unsupervised learning [73]. RF is usually composed of multiple decision trees, each of which is trained on a different subset of the training data, and these trees produce their own predictions and eventually combine to become a more accurate single prediction [74]. Compared with a single decision tree model, random forests perform well in preventing overfitting and dealing with high-dimensional data [75]. RF methods have been widely used in many fields such as medicine, ecology, and remote sensing and have shown good predictive ability in forest fire prediction [76].
2.5.4. XGBoost
XGBoost is a gradient boosting based algorithm with high accuracy, efficiency, and flexibility for classification, regression, and sorting problems, and has been used in wildfire and other different research areas [77,78]. The method builds a stronger learner by combining multiple weak learners to achieve better performance [79]. The core algorithm works by iteratively computing the current model’s residuals, fitting a new decision tree to those residuals, and then using this tree’s predictions to update the model. The final prediction is a weighted sum of the outputs from all the trees [80].
2.6. Model Performance Evaluation
To evaluate the predictive performance of the model, this study employed the Area Under the Receiver Operating Characteristic Curve (AUC) as the primary metric. AUC is a widely accepted measure in spatial analysis and geoscience research [81,82]. It is based on calculating the True Positive Rate (TPR) and False Positive Rate (FPR) across various threshold values, plotting the resulting ROC curve, and quantifying the model’s overall ability to distinguish between occurrence and non-occurrence events using the area under the curve. The AUC is calculated using the following formula:
where TP (true positive) and TN (true negative) represent the correctly identified fire and non-fire occurrences, respectively; P denotes the total number of fire samples, and N denotes the total number of non-fire samples.
2.7. Vegetation Phenology Analysis
In this study, a method similar to that used by Rahimi [83] is adopted to detect vegetation phenology changes. In our study area, the landscape is primarily composed of sparse woodlands and shrub-grasslands, and grasslands serve as a critical fuel source of wildfires [84]. we not only considered the impact of elevation on vegetation phenology but also analyzed the seasonal variations in different vegetation types. Vegetation exhibits distinct spectral reflectance across seasons, which can be represented using phenological indicators, such as SOS (Start of Season), EOS (End of Season), and MAX (Maximum Vegetation Index) [85,86,87]. These indicators are widely used for monitoring and analyzing vegetation phenology changes. In addition, the DEM was used to categorize the study area into two elevation zones as shown in Figure 4. Elevation has a very significant effect on the phenology of both trees and grasses [88,89]. Accordingly, the study area was divided into two broad categories: (i) areas with mean elevation above 1000 m, and (ii) areas with mean elevation below 1000 m. Figure 5 presents the inter-annual trends observed in these two elevation zones.
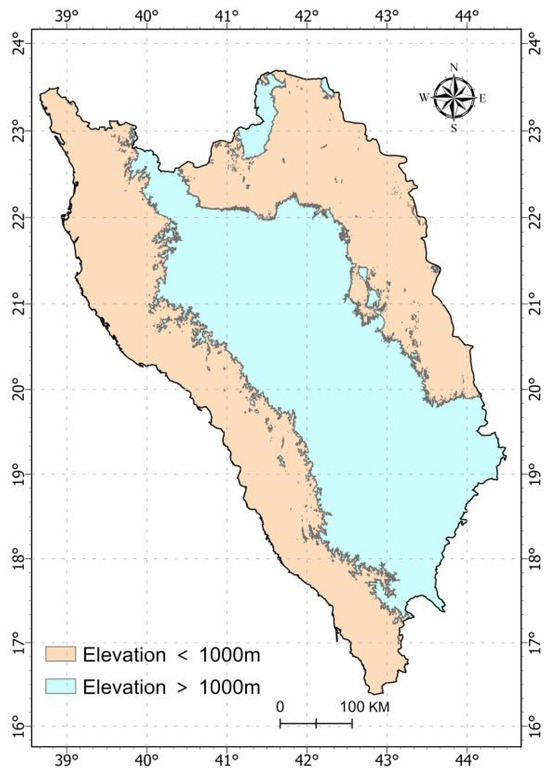
Figure 4.
Elevation Classification of the Study Area.
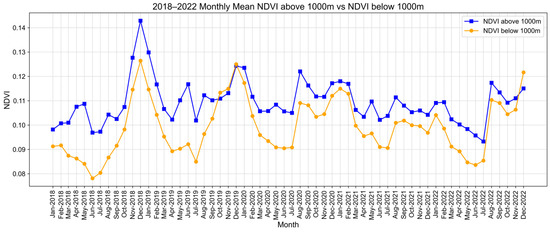
Figure 5.
Monthly Mean NDVI Comparison (2018–2022) Between Elevations Above and Below 1000 m.
As shown in Figure 5, the temporal NDVI patterns in areas above and below 1000 m AMSL are broadly similar. In 2018, both regions reached peak NDVI in December, followed by a gradual decline to a stable level by March 2019, indicating no significant phenological shift with elevation. However, NDVI values were consistently higher at elevations above 1000 m, likely due to denser vegetation and greater forest cover. Beyond elevation, phenological differences also arise from species composition. Given that sparse woodlands and shrubby grasslands dominate the area and most wildfires occur in rangelands, so this study focuses exclusively on the rangeland category in the LULC dataset.
To accurately capture phenological changes, NDVI data from the MODIS MOD13Q1 product were analyzed at 16-day intervals for the period 2018–2019. Figure 6 shows a one-year phenological cycle across the study area.
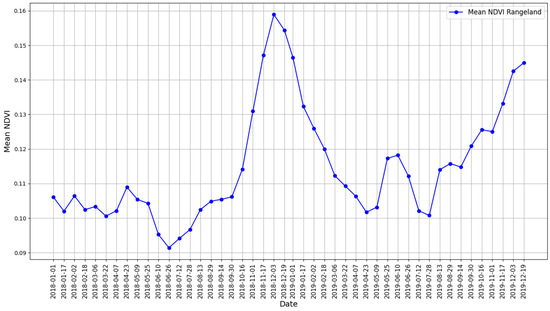
Figure 6.
Mean NDVI of Rangeland from 2018 to 2019.
Based on the observed dependence of vegetation phenology indicators on elevation and vegetation distribution, as illustrated in Figure 5 and Figure 6, a site-specific phenological scenario was established for the study area, as shown in Figure 7.
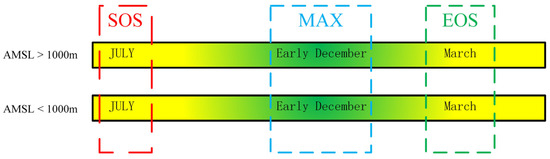
Figure 7.
Phenology of the rangeland vegetation. The periods of SOS, MAX and EOS are shown for different altitude ranges (AMSL > 1000 m and AMSL < 1000 m).
No significant differences were found in vegetation growing seasons across different altitudes. The key phenological stages include the Start of Season (SOS), Maximum Growth (MAX), and End of Season (EOS), all identified using NDVI time series data. SOS is detected as the point where NDVI shows a continuous upward trend. EOS is marked by the end of a continuous decline in NDVI. MAX corresponds to the peak NDVI value, indicating the highest level of canopy photosynthetic activity and vegetation growth.
2.8. Wildfire Risk Assessment Based on Vegetation Phenology Cycles
Within the study area, changes in NDVI can be directly attributed to grassland growth and dieback processes, as grassland is the dominant land use type. Mathematically, using the NDVI value at MAX minus the NDVI value at EOS effectively describes the dynamics of vegetation in the study area throughout the growing season and also reflects the degree of combustible accumulation. The formula for calculating the wildfire risk index in the study area is as follows:
The wildfire risk index was applied to rangeland areas identified from the global land use and land cover maps derived from Sentinel-2 data. Wildfire point data from 2019 to 2023 were used to evaluate the index’s performance. A 3 km buffer was created around each wildfire point, and the distribution and frequency of different wildfire risk classes within the buffer were analyzed to assess the validity of vegetation-based wildfire risk mapping.
Here the 3 km buffers account for spatial uncertainty in ignition locations and capture the immediate surrounding environment that influences fire behavior. This scale provides a representative area for analyzing the distribution of wildfire risk classes, while avoiding excessive generalization that might occur with larger buffers. It reflects the local landscape context within which vegetation and environmental conditions contribute to ignition and spread.
3. Results
Five ML models were built and NDVI was used to assess wildfire risks in the study area. The model outputs represent the predicted probability of wildfire occurrence, which were subsequently categorized into discrete risk classes. Areas with higher predicted probabilities correspond to higher wildfire risk, reflecting environmental conditions favorable for fire ignition and spread. Maxent and RF models were also used to evaluate the importance of features or variables in prediction.
3.1. Maxent Results
The performance of the Maxent model was assessed using the AUC, which ranges from 0 to 1. Higher AUC values indicate better predictive ability, with values above 0.8 generally considered good [90,91]. In this study, the Maxent model achieved AUC values of 0.982 for the training set and 0.974 for the test set, indicating excellent predictive performance.
3.1.1. Environmental Variable Contributions in the Maxent Model
The importance and contribution of each environmental factor derived from the Maxent model are presented in Table 2. Here importance refers to the extent to which each individual environmental variable influences the model output. The variables are ranked in descending order of influence: skin reservoir content (38.6%), population density (16%), DEM (13.7%), and NDVI (12%). Contribution refers to the size of the contribution of each environmental variable made to the model’s final prediction. The variables are ranked from highest to lowest contribution as follows: skin reservoir content (32.6%), wind speed (14.1%), DEM (13.6%), and population density (12.7%). Based on the importance and contribution of the environmental factors, it can be concluded that the top four factors play a significant role in wildfire occurrence. In contrast, the remaining seven factors contribute considerably less, with a combined total contribution of only 19.6% and an importance of just 26.9%.
Table 2.
The following table gives estimates of relative contributions of the environmental variables to the Maxent model (Variable in the name of the abbreviation, can refer to Table 1 in the naming).
3.1.2. Wildfire Environmental Response Curves
The response curves of environmental variables influencing wildfire occurrence in the study area are presented in Figure 8. These curves indicate that the effects of environmental factors on wildfires are complex and often nonlinear. Generally, when the predicted probability exceeds 0.5, the corresponding environmental variable can be considered to contribute to wildfire occurrence [92]. However, each factor exhibits a distinct range of conditions under which wildfire occurrence and spread are more likely.
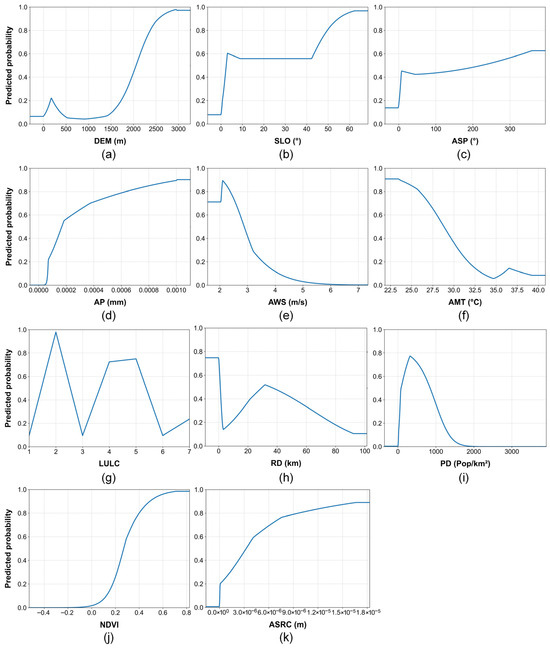
Figure 8.
Response curves for wildfire environmental variables in the study area: (a) DEM, (b) SLO, (c) ASP, (d) AP, (e) AWS, (f) AMT, (g) LULC, (h) RD, (i) PD, (j) NDVI, and (k) ASRC.
- (1)
- In the study area, wildfire probability generally increases with elevation, despite slight fluctuations at lower altitudes. When elevation exceeds 2058 m, the probability surpasses 0.5 and continues to rise, indicating higher wildfire susceptibility in high-altitude regions. This trend corresponds to vegetation distribution in southwestern Saudi Arabia, where forests are primarily concentrated in the mountainous areas of Asir and Jizan, most of which lie above 2000 m. Slope aspects ranging from 220 to 360 degrees are more prone to wildfires, particularly on northwest- to southwest-facing slopes, likely due to denser vegetation and greater fuel accumulation in these directions [93]. Regarding slope gradient, wildfires are more frequent on slopes between 1 and 26 degrees, with the likelihood decreasing on steeper terrain. Overall, wildfires are concentrated in high-elevation, forested areas with relatively gentle slopes.
- (2)
- Southwestern Saudi Arabia is an arid to semi-arid region with limited and mostly seasonal precipitation, primarily occurring between October and April. In terms of meteorological factors, wildfire probability increases with precipitation, possibly due to enhanced vegetation growth during wetter periods. Conversely, wildfire probability decreases with rising mean daily temperature. Wildfires are more likely to occur when temperatures range between 21.8 °C and 28.7 °C. Regarding wind speed, wildfires are more frequent when wind speeds range from 1.56 to 2.96 m/s, with probability declining at higher wind speeds.
- (3)
- Regarding anthropogenic factors, wildfire probability increases sharply with population density, peaking at 318 people/km2 within the range of 88 to 847 people/km2, then gradually decreases. Although the study area includes densely populated coastal cities, these urban centers are generally distant from the mountainous wildfire-prone zones, resulting in a nonlinear relationship between population density and wildfire occurrence. Among the land use types classified as Water, Trees, Flooded Vegetation, Crops, Built Area, Bare Ground, and Rangeland (coded 1–7), wildfires are more likely to occur in areas with Trees, Crops, and Built surfaces. In terms of proximity to roads, wildfires are primarily concentrated within 1 km, suggesting higher risk near accessible areas.
- (4)
- For vegetation-related environmental factors, NDVI is used to represent vegetation cover. Higher NDVI values indicate denser vegetation and greater fuel loads, thereby increasing wildfire risk. Skin reservoir content influences the flammability of surface fuels such as dead leaves and branches. However, as shown in the figures, higher skin reservoir content does not necessarily reduce wildfire occurrence. In fact, wildfires are often concentrated in areas with relatively high skin reservoir content, which may also support better vegetation growth and thus contribute to increased fire susceptibility.
3.1.3. Fire Risk Zoning Based on Maxent Modeling
The ASCII file generated by the Maxent model for wildfire risk prediction was imported into ArcGIS Pro 3.3. Using the natural breaks classification method, wildfire risk in southwestern Saudi Arabia was categorized into five levels: very low, low, medium, high, and very high, as shown in Figure 9. The proportion of the study area in each category is 82.36%, 12.84%, 3.07%, 1.06%, and 0.67%, respectively. High and very high risk areas together account for only 1.73% of the total area, indicating that the vast majority of the region (98.27%) falls into the medium to low risk categories. Spatially, areas classified as high or very high risk are mainly located in mountainous regions with higher elevations, steeper slopes, and greater vegetation cover, while low and medium-risk areas are found in lower elevation zones with more sparse vegetation.
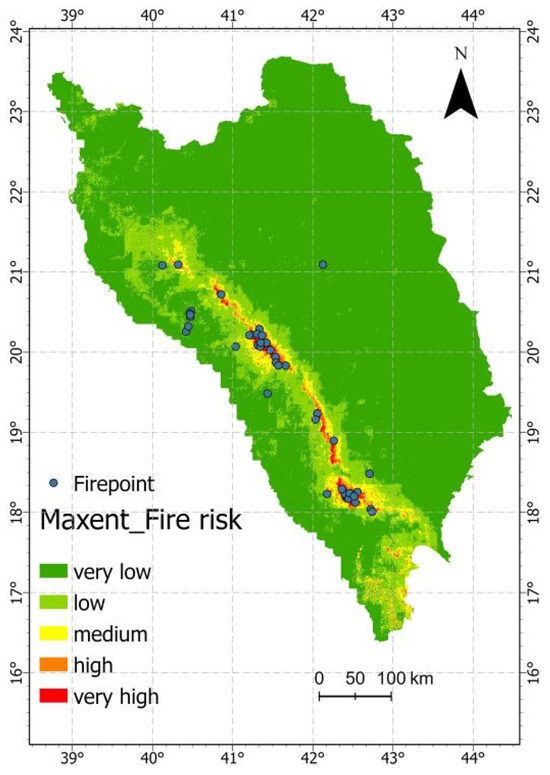
Figure 9.
Maxent model wildfire hazard zoning.
To validate the wildfire risk zoning, data from 54 wildfire points in the study area were analyzed. These points were distributed across the risk zones as follows: 1.8% in very low, 16.7% in low, 1.8% in medium, 20.4% in high, and 59.3% in very high risk areas. Nearly 80% of wildfires occurred within the high and very high risk zones, with a noticeable clustering in the high risk areas. This confirms that the Maxent model accurately identifies wildfire-prone zones and supports the reliability of the model results presented earlier.
3.2. Other ML Model Results
Four other ML models were employed to analyze fire occurrence data and associated environmental factors, with 70% of the dataset allocated for training. Their performance was also evaluated using the AUC metric. The detailed results are summarized in Table 3. Although all models achieved an AUC value exceeding 0.8, Maxent achieved the highest AUC value, and Random Forest the second highest. We used Random Forest to assess wildfire risks in the study area and compared the results with those obtained from the Maxent model.
Table 3.
Evaluation results of the five models.
Wildfire Risk Assessment Based on RF Modeling
The trained random forest model generated a wildfire risk map (Figure 10), which was classified into five categories (very low to very high) using the natural breaks method. These categories accounted for 46.60%, 23.85%, 13.78%, 10.05%, and 5.72% of the total study area, respectively (Figure 11a). Notably, no wildfire sites were identified in the very low risk zone, while the distribution of wildfire occurrences across the remaining four categories was 1.85% in low, 9.26% in medium, 1.85% in high, and 87.04% in very high risk areas, as shown in Figure 11b. This spatial pattern demonstrates the model’s effectiveness in identifying high risk zones, with the majority of wildfires concentrated in the most vulnerable regions.
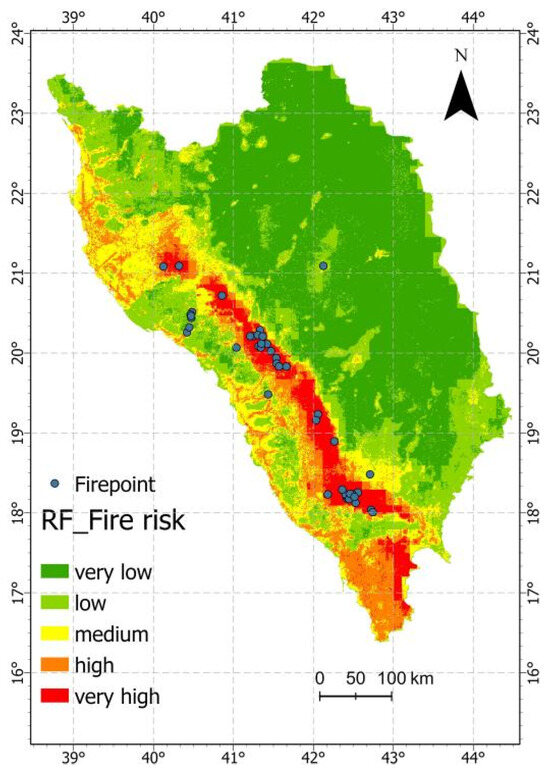
Figure 10.
RF model derived wildfire hazard zoning.
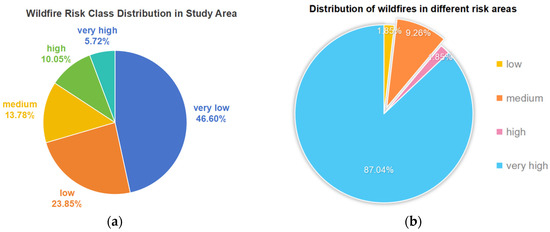
Figure 11.
(a) Distribution of wildfire risk classes within the study area; (b) Proportion of wildfire occurences in each wildfire risk class.
By calculating the feature importance of each environmental factor in the RF model, it was concluded that population density was the primary factor with a Mean Decrease Impurity (MDI) score of 19.58%, followed by NDVI and precipitation with 18.74% and 16.09%, respectively. The MDI scores for other factors are shown in Figure 12.
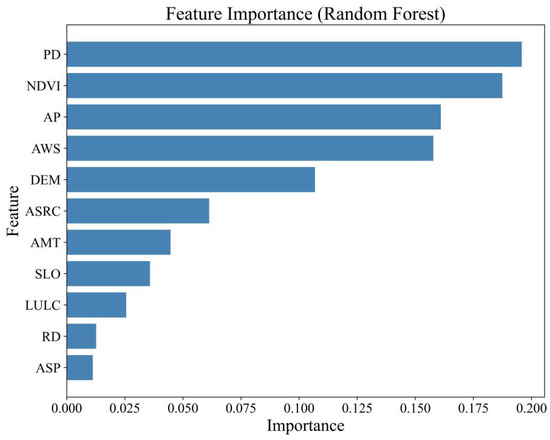
Figure 12.
Feature importance of different environmental factors in the RF model.
3.3. Vegetation Index-Based Wildfire Risk Maps
Based on the vegetation phenology of the study area, GMAX occurred in early December for both elevations above and below 1000 m, while GEOS was identified in March. The raster data were first processed using rangeland masks, as outlined in the methodology. The wildfire risk was then classified into five distinct levels (very low, low, medium, high, and very high). Annual wildfire susceptibility maps were produced for the years 2019 to 2023, showing spatial variations in wildfire risk as illustrated in Figure 13.
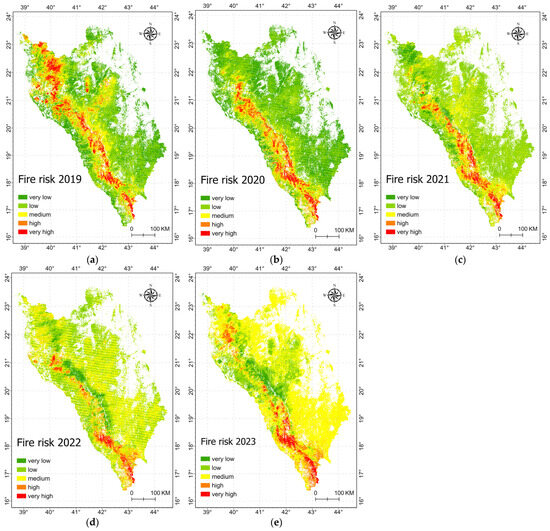
Figure 13.
Fire risk maps derived based on the NDVI phenological index for the years (a) 2019; (b) 2020; (c) 2021; (d) 2022; (e) 2023.
To further assess the effectiveness of the vegetation index-based wildfire susceptibility map, a 3 km buffer was created around each wildfire site, and image elements within these zones were analyzed. Figure 14 illustrates the percentage distribution of wildfire risk levels for each year from 2019 to 2023, along with the cumulative proportions of areas classified as medium or higher risk and high or higher risk. Detailed annual statistics are provided in Table 4. Over the five-year period, more than 50 percent of the image elements were located in areas with at least medium risk, with an average of 60.77 percent and a minimum of 50.59 percent in 2022. In high-risk areas, the annual average was 30.06 percent, with the lowest value of 20.91 percent recorded in 2023.
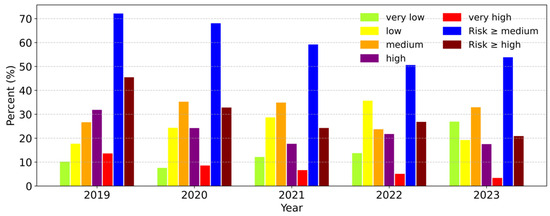
Figure 14.
Wildfire risk levels within 3 km buffer of fire occurrences (based on NDVI phenological index).
Table 4.
Percentage of areas with different wildfire risk levels (based on NDVI phenological index).
Additionally, to validate the effectiveness of the NDVI-based phenological fire risk index, the study area was divided into 3 km × 3 km grid cells, and the mean index value was calculated for each grid cell. Based on wildfire occurrence data, the grid cells were categorized into fire cells and non-fire cells, with the latter derived from background points generated during the machine learning modeling process. The Mann–Whitney U test and Welch’s t-test were then employed to compare the differences between the two cell types, and the effect size was calculated to assess both statistical significance and practical relevance. The Mann–Whitney U test does not rely on the assumption of normality and can reveal systematic differences in the overall distributions of the two groups [94], while Welch’s t-test provides a more robust evaluation of mean differences under conditions of unequal variances or unbalanced sample sizes [95].
The results showed that, as illustrated in Figure 15, the NDVI fire risk index exhibited significant differences between fire and non-fire cells, with higher mean values observed in fire cells. Both the Mann–Whitney U test and Welch’s t-test indicated that this difference was statistically highly significant (p < 0.01). Furthermore, according to Cohen’s criteria, the effect size (r = 0.341) suggested a moderate level of practical significance [96]. Overall, these findings confirm that the index can effectively distinguish areas with and without wildfire occurrences.
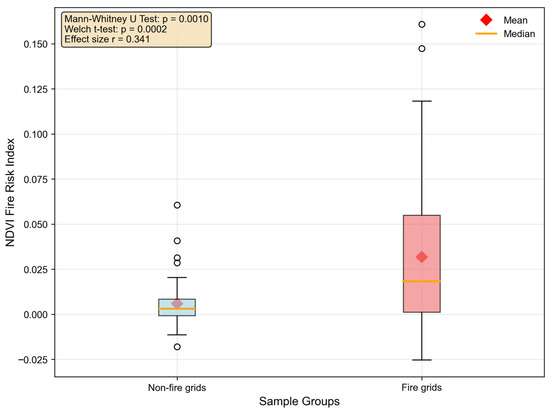
Figure 15.
Comparison of NDVI-Based Fire Risk Index Between Fire and Non-Fire Grid cells.
4. Discussion
4.1. Model Performance
This study compared the performance of five ML models for wildfire risk assessment, with Maxent achieving the highest AUC (0.974). This superior performance is not coincidental; it reflects Maxent’s design for presence-only data through the “presence–background” framework, which is statistically equivalent to an inhomogeneous Poisson point process [97]. This framework allows for direct estimation of relative occurrence intensity under conditions where reliable absence data are lacking, sample sizes are small, and classes are highly imbalanced, thereby reducing the reliance on pseudo-absence data construction and class weighting [98,99]. Moreover, the built-in feature classes and regularization of Maxent can suppress overfitting and retain nonlinear responses with limited data, thus maintaining better generalization across complex environmental gradients [100]. In contrast, methods such as logistic regression, RF, and SVM generally require explicit negative or pseudo-absence data, with performance highly sensitive to the number, spatial distribution, and sampling strategy of pseudo-absence points. Under rare event conditions, these models are more prone to estimation bias or issues of probability calibration. Previous presence-only studies have consistently shown that Maxent tends to perform robustly or even outperform alternatives [101,102]. Overall, Maxent’s methodological alignment with the characteristics of the study area accounts for its superior AUC performance compared to other models.
The observed differences between Maxent and RF in variable importance rankings mainly reflect differences in model objectives, data assumptions, and attribution mechanisms, rather than contradictory ecological processes. Maxent, operating under the presence–background framework, maximizes entropy within environmental constraints, with contribution values and permutation importance highlighting predictors that most reduce entropy in the regularized suitability surface. In contexts with correlated variables, this tends to emphasize predictors with higher information gain [98]. By contrast, RF relies on an explicit classification framework with pseudo-absences, assessing importance through recursive splits or permutation accuracy loss [75], which favors predictors that exhibit strong splitting power in feature space. In this study, for example, RF highlighted NDVI and precipitation as key predictors, whereas Maxent emphasized skin reservoir content (ASRC) and wind speed as factors making greater contributions to entropy reduction. In conclusion, these differences should be viewed as methodological complementarity rather than as conflicting ecological interpretations. In summary, both models demonstrated strong predictive performance for wildfire risk, but they offered different perspectives on variable importance. Combining their outputs with field-based validation can enhance our understanding of the underlying drivers of wildfire occurrence.
We acknowledge that the dataset, comprising 54 wildfire occurrences over a 4-year period, is relatively limited for machine learning applications. To mitigate this constraint, we applied bootstrap resampling and sensitivity analyses, which confirmed consistent spatial prediction patterns. While the results should be viewed as an initial assessment rather than a long-term forecast, they nonetheless provide valuable insights into recent wildfire susceptibility under current conditions. Expanding the dataset both temporally and spatially will be a priority for future work to further strengthen predictive reliability.
4.2. Environmental Drivers and Their Mechanisms
According to the Maxent model results, skin reservoir content had the highest contribution at 38.6%, followed by population density (16%), elevation (13.7%), and NDVI (12%). These results indicate that wildfire occurrence is primarily influenced by surface fuel conditions, human activity, and elevation. This aligns with the fact that most wildfires in the study area are human-induced.
The Maxent model further identified ASRC as the most important predictor of wildfire distribution in this semi-arid region. Unexpectedly, the positive response curve revealed that higher ASRC values corresponded to a greater likelihood of wildfire occurrence. This reflects an indirect but critical mechanism in arid ecosystems: wildfire occurrence is not primarily limited by ignition sources, but by the accumulation and continuity of combustible fuels. In arid climates, fire regimes are strongly constrained by the production of herbaceous fuels [103]. Previous studies have shown that this seemingly paradoxical relationship captures the distinctive fire dynamics of arid regions, where higher soil moisture promotes vegetation growth and biomass accumulation, thus providing the necessary fuel load for large wildfires. By contrast, in humid ecosystems, wildfires are more likely under dry conditions when fuel moisture decreases [104].
From a physical perspective, ASRC measures the amount of water intercepted and stored by the vegetation canopy and the soil “skin layer,” with its capacity largely controlled by vegetation type and structure [105]. Regions with higher ASRC values often correspond to denser vegetation cover and thicker litter layers, conditions that indicate abundant and continuous fuels. Thus, ASRC should not be interpreted simply as a measure of wetter conditions at the moment of ignition, but rather as a proxy for vegetation productivity and fuel accumulation. In these areas, abundant annual plants and fine herbaceous fuels provide sufficient and continuous combustible material, thereby substantially increasing wildfire risk. This interpretation underscores the role of ASRC as a vegetation-linked indicator of fire susceptibility in semi-arid ecosystems.
4.3. Spatiotemporal Patterns of Wildfires and the Role of Vegetation Phenology
Wildfires in the region were found mainly concentrated in high-altitude mountainous areas, exhibiting a clear spatial clustering pattern. This distribution is closely associated with the dominant role of human-induced fires, as many wildfires occur in densely vegetated highland forests and are often triggered by outdoor activities such as picnicking and camping. The response curves from the Maxent model further confirm this perspective, showing that the probability of wildfire occurrence increases significantly within 1 km of roads, highlighting the critical role of human activities in fire ignition.
At the same time, time-series NDVI and vegetation phenology analyses revealed the seasonal characteristics of vegetation growth: vegetation starts growing in July and reaches its peak in December, while wildfires mostly occur after October. Altitude showed little influence on vegetation phenology. The observed summer dormancy and winter NDVI peak reflect complex adaptive mechanisms common in arid and semi-arid regions, where extreme summer conditions and water scarcity suppress plant growth, while milder winter climates and increased precipitation promote it [106,107]. Understanding these vegetation dynamics is crucial for wildfire risk assessment, as seasonal growth and dieback influence fuel availability and fire intensity [108]. With access to more detailed local vegetation and land use data, future studies could explore the phenological responses of specific fire-prone species, enabling more targeted and effective wildfire prevention strategies.
In addition, we acknowledge that using NDVI alone to assess wildfire risk is a simplification. Although it performed well in our study area, the relatively small dataset likely limited model complexity, and incorporating additional environmental and climatic variables would be necessary for reliable predictions in more complex or different biomes.
4.4. Wildfire Management Strategies
Building on the findings above, effective wildfire management in southwest Saudi Arabia requires a proactive, risk-informed strategy that directly addresses the unique interplay of human activity, vegetation dynamics, and mountainous topography identified in this research. Central to this approach is to prioritize high-altitude zones adjacent to roads, especially during the summer dormancy period when vegetation combustibility is at its peak. Targeted fuel management should include prescribed burns in early winter and mechanical clearing to establish defensible spaces and strategic fuel breaks around mountain communities and along ridges. In addition, managed grazing during the spring growth period can serve as a traditional, cost-effective method to reduce fuel loads before the dry season.
In parallel, a robust ignition prevention program is critical to mitigate the clear wildfire posed by human activity near roadsides. This includes the official declaration of a high-fire-risk season that coincides with the summer dormancy period, during which strict regulations on open fires, barbecues, and other high-risk activities must be actively enforced. Public safety can be further supported through infrastructure measures like highly visible, multi-lingual warning signage and the development of designated, fire-resistant recreational areas to redirect visitor activity away from the most hazardous fuels.
To enable a rapid and effective response, preparedness must be tailored to the region’s rugged terrain. This entails strategically pre-positioning firefighting crews, equipment, and aerial resources in high-altitude locations before the fire season begins, significantly reducing response times to the remote, clustered ignition zones. This operational strategy should be supported by a dedicated monitoring system that integrates satellite surveillance with automated camera networks focused on high-risk areas, enabling early detection and timely intervention. Ultimately, success depends on integrating these measures into a cohesive plan that bridges environmental science with community engagement. By aligning fuel treatments with vegetative phenology, strictly controlling ignition sources in high-risk zones, and pre-deploying resources according to elevation-specific risk patterns, authorities can significantly strengthen regional resilience, shifting from a reactive firefighting model to a proactive system of prediction, prevention, and preparedness.
5. Conclusions
This study compared the performance of five machine learning methods (Maxent, random forest, XGBoost, logistic regression, and support vector machine) in assessing wildfire risk in southwestern Saudi Arabia. The results show that the Maxent model outperformed the others in terms of prediction accuracy and robustness, particularly under small-sample and data-limited conditions, while the random Forest model ranked second in overall performance.
Regarding driving factors, vegetation cover and population density were consistently identified as key determinants of wildfire occurrence. The Maxent model highlighted the importance of ASRC, population density, and topography, whereas the random forest model emphasized the contributions of population density and NDVI. Together, these findings indicate that wildfires in the region are primarily driven by human activities, closely linked to fuel conditions and the distribution of high-altitude vegetation.
Our analysis revealed that wildfire events exhibit a clear clustering pattern in high-altitude mountainous areas, often associated with forested regions near roads, reflecting the influence of frequent outdoor activities in these areas. Vegetation phenology analysis showed that vegetation in the study area has the typical “summer dormancy–winter growth” pattern of arid and semi-arid ecosystems. Such phenological rhythms determine the seasonal combustibility of fuels, exerting a critical influence on wildfire intensity and occurrence probability.
In addition, this study introduced a mapping approach based on NDVI-derived phenological indices, which effectively characterized the temporal variations in fire risk associated with vegetation growth and senescence. The results demonstrated that this index can significantly distinguish between fire and non-fire areas, further confirming its value for regional wildfire monitoring and mapping.
Overall, this study not only validates the effectiveness of multiple machine learning approaches in wildfire risk modeling but also reveals the dominant roles of human activities, fuel conditions, topographic factors, and vegetation phenology in shaping wildfire occurrence mechanisms in southwestern Saudi Arabia. These insights provide a scientific basis for regional wildfire prevention and management. Future research could incorporate more detailed vegetation types, land use data, and phenology monitoring to explore the dynamic responses of specific flammable species, thereby enabling the development of more targeted prevention and management strategies.
Author Contributions
Conceptualization, L.L. and X.Z.; methodology, L.L.; software, L.L.; validation, L.L.; formal analysis, L.L.; investigation, X.Z.; resources, X.Z.; data curation, L.L. and X.Z.; writing—original draft preparation, L.L.; writing—review and editing, L.L. and X.Z.; visualization, L.L.; supervision, X.Z.; project administration, X.Z. All authors have read and agreed to the published version of the manuscript.
Funding
This research received no external funding.
Data Availability Statement
The sources of the data used in modeling are listed in Table 1. The derived data are available upon request.
Acknowledgments
We would like to thank King Khalid University and NCVC for providing wildfire and other foundation data for this research.
Conflicts of Interest
The authors declare no conflicts of interest.
References
- Brockerhoff, E.G.; Barbaro, L.; Castagneyrol, B.; Forrester, D.I.; Gardiner, B.; González-Olabarria, J.R.; Lyver, P.O.B.; Meurisse, N.; Oxbrough, A.; Taki, H. Forest biodiversity, ecosystem functioning and the provision of ecosystem services. Biodivers. Conserv. 2017, 26, 3005–3035. [Google Scholar] [CrossRef]
- Chen, S.; Chen, J.; Jiang, C.; Yao, R.T.; Xue, J.; Bai, Y.; Wang, H.; Jiang, C.; Wang, S.; Zhong, Y. Trends in research on forest ecosystem services in the most recent 20 years: A bibliometric analysis. Forests 2022, 13, 1087. [Google Scholar] [CrossRef]
- Cunningham, C.X.; Williamson, G.J.; Bowman, D.M.J.S. Increasing frequency and intensity of the most extreme wildfires on Earth. Nat. Ecol. Evol. 2024, 8, 1420–1425. [Google Scholar] [CrossRef]
- Pausas, J.G.; Keeley, J.E. Wildfires and global change. Front. Ecol. Environ. 2021, 19, 387–395. [Google Scholar] [CrossRef]
- McLauchlan, K.K.; Higuera, P.E.; Miesel, J.; Rogers, B.M.; Schweitzer, J.; Shuman, J.K.; Tepley, A.J.; Varner, J.M.; Veblen, T.T.; Adalsteinsson, S.A. Fire as a fundamental ecological process: Research advances and frontiers. J. Ecol. 2020, 108, 2047–2069. [Google Scholar] [CrossRef]
- Archibald, S.; Lehmann, C.E.R.; Belcher, C.M.; Bond, W.J.; Bradstock, R.A.; Daniau, A.-L.; Dexter, K.G.; Forrestel, E.J.; Greve, M.; He, T. Biological and geophysical feedbacks with fire in the Earth system. Environ. Res. Lett. 2018, 13, 033003. [Google Scholar] [CrossRef]
- Davies, I.P.; Haugo, R.D.; Robertson, J.C.; Levin, P.S. The unequal vulnerability of communities of color to wildfire. PLoS ONE 2018, 13, e0205825. [Google Scholar] [CrossRef]
- Davis, E.J.; Moseley, C.; Nielsen-Pincus, M.; Jakes, P.J. The community economic impacts of large wildfires: A case study from Trinity County, California. Soc. Nat. Resour. 2014, 27, 983–993. [Google Scholar] [CrossRef]
- Baylis, P.; Boomhower, J. Moral Hazard, Wildfires, and the Economic Incidence of Natural Disasters; National Bureau of Economic Research: Cambridge, MA, USA, 2019. [Google Scholar]
- Nations FAO, Food and Agriculture Organization of the United Nations. Global Forest Resources Assessment 2020; Food and Agriculture Organization of the United Nations: Rome, Italy, 2021. [Google Scholar]
- Borrelli, P.; Alewell, C.; Alvarez, P.; Anache, J.A.A.; Baartman, J.; Ballabio, C.; Bezak, N.; Biddoccu, M.; Cerdà, A.; Chalise, D. Soil erosion modelling: A global review and statistical analysis. Sci. Total Environ. 2021, 780, 146494. [Google Scholar] [CrossRef]
- Zong, X.; Tian, X.; Liu, X.; Shu, L. Drought threat to terrestrial gross primary production exacerbated by wildfires. Commun. Earth Environ. 2024, 5, 225. [Google Scholar] [CrossRef]
- Haque, K.M.S.; Uddin, M.; Ampah, J.D.; Haque, M.K.; Hossen, M.S.; Rokonuzzaman, M.; Hossain, M.Y.; Hossain, M.S.; Rahman, M.Z. Wildfires in Australia: A bibliometric analysis and a glimpse on ‘Black Summer’(2019/2020) disaster. Environ. Sci. Pollut. Res. 2023, 30, 73061–73086. [Google Scholar] [CrossRef] [PubMed]
- Robinne, F.-N.; Hallema, D.W.; Bladon, K.D.; Buttle, J.M. Wildfire impacts on hydrologic ecosystem services in North American high-latitude forests: A scoping review. J. Hydrol. 2020, 581, 124360. [Google Scholar] [CrossRef]
- Schmitt, L.H.M.; Graham, H.M.; White, P.C.L. Economic evaluations of the health impacts of weather-related extreme events: A scoping review. Int. J. Environ. Res. Public Health 2016, 13, 1105. [Google Scholar] [CrossRef]
- Rahman, F.S.; Tannous, W.K.; Avsar, G.; Agho, K.E.; Ghassempour, N.; Harvey, L.A. Economic costs of residential fires: A systematic review. Fire 2023, 6, 399. [Google Scholar] [CrossRef]
- Byrne, B.; Liu, J.; Bowman, K.W.; Pascolini-Campbell, M.; Chatterjee, A.; Pandey, S.; Miyazaki, K.; van der Werf, G.R.; Wunch, D.; Wennberg, P.O. Carbon emissions from the 2023 Canadian wildfires. Nature 2024, 633, 835–839. [Google Scholar] [CrossRef]
- Wu, Z.; He, H.S.; Yang, J.; Liang, Y. Defining fire environment zones in the boreal forests of northeastern China. Sci. Total Environ. 2015, 518, 106–116. [Google Scholar] [CrossRef] [PubMed]
- Bottero, A.; D’Amato, A.W.; Palik, B.J.; Bradford, J.B.; Fraver, S.; Battaglia, M.A.; Asherin, L.A. Density-dependent vulnerability of forest ecosystems to drought. J. Appl. Ecol. 2017, 54, 1605–1614. [Google Scholar] [CrossRef]
- Flannigan, M.D.; Amiro, B.D.; Logan, K.A.; Stocks, B.J.; Wotton, B.M. Forest fires and climate change in the 21 st century. Mitig. Adapt. Strateg. Glob. Change 2006, 11, 847–859. [Google Scholar] [CrossRef]
- Holsinger, L.; Parks, S.A.; Miller, C. Weather, fuels, and topography impede wildland fire spread in western US landscapes. For. Ecol. Manag. 2016, 380, 59–69. [Google Scholar] [CrossRef]
- Maingi, J.K.; Henry, M.C. Factors influencing wildfire occurrence and distribution in eastern Kentucky, USA. Int. J. Wildland Fire 2007, 16, 23–33. [Google Scholar] [CrossRef]
- Zumbrunnen, T.; Menéndez, P.; Bugmann, H.; Conedera, M.; Gimmi, U.; Bürgi, M. Human impacts on fire occurrence: A case study of hundred years of forest fires in a dry alpine valley in Switzerland. Reg. Environ. Change 2012, 12, 935–949. [Google Scholar] [CrossRef]
- Sturtevant, B.R.; Cleland, D.T. Human and biophysical factors influencing modern fire disturbance in northern Wisconsin. Int. J. Wildland Fire 2007, 16, 398–413. [Google Scholar] [CrossRef]
- Romero-Calcerrada, R.; Novillo, C.J.; Millington, J.D.A.; Gomez-Jimenez, I. GIS analysis of spatial patterns of human-caused wildfire ignition risk in the SW of Madrid (Central Spain). Landsc. Ecol. 2008, 23, 341–354. [Google Scholar] [CrossRef]
- Andela, N.; Morton, D.C.; Giglio, L.; Paugam, R.; Chen, Y.; Hantson, S.; Van Der Werf, G.R.; Randerson, J.T. The Global Fire Atlas of individual fire size, duration, speed and direction. Earth Syst. Sci. Data 2019, 11, 529–552. [Google Scholar] [CrossRef]
- Ghali, R.; Akhloufi, M.A. Deep learning approaches for wildland fires using satellite remote sensing data: Detection, mapping, and prediction. Fire 2023, 6, 192. [Google Scholar] [CrossRef]
- Ramesh, J.V.N.; Suneel, S.; Dhanke, J.A.; Patil, R.N.; Sharma, S.; Aswani, I.; Kiran, A. Integrating Remote Sensing and GIS Techniques for Effective Wildfire Risk Mapping and Management. Remote Sens. Earth Syst. Sci. 2024, 7, 271–282. [Google Scholar] [CrossRef]
- Pourghasemi, H.r.; Beheshtirad, M.; Pradhan, B. A comparative assessment of prediction capabilities of modified analytical hierarchy process (M-AHP) and Mamdani fuzzy logic models using Netcad-GIS for forest fire susceptibility mapping. Geomat. Nat. Hazards Risk 2016, 7, 861–885. [Google Scholar] [CrossRef]
- Eskandari, S. A new approach for forest fire risk modeling using fuzzy AHP and GIS in Hyrcanian forests of Iran. Arab. J. Geosci. 2017, 10, 190. [Google Scholar] [CrossRef]
- Zhang, G.; Wang, M.; Liu, K. Forest fire susceptibility modeling using a convolutional neural network for Yunnan province of China. Int. J. Disaster Risk Sci. 2019, 10, 386–403. [Google Scholar] [CrossRef]
- Naderpour, M.; Rizeei, H.M.; Ramezani, F. Forest fire risk prediction: A spatial deep neural network-based framework. Remote Sens. 2021, 13, 2513. [Google Scholar] [CrossRef]
- Eslami, R.; Azarnoush, M.; Kialashki, A.; Kazemzadeh, F. GIS-based forest fire susceptibility assessment by random forest, artificial neural network and logistic regression methods. J. Trop. For. Sci. 2021, 33, 173–184. [Google Scholar] [CrossRef]
- Su, Z.; Zheng, L.; Luo, S.; Tigabu, M.; Guo, F. Modeling wildfire drivers in Chinese tropical forest ecosystems using global logistic regression and geographically weighted logistic regression. Nat. Hazards 2021, 108, 1317–1345. [Google Scholar] [CrossRef]
- Gigović, L.; Pourghasemi, H.R.; Drobnjak, S.; Bai, S. Testing a New Ensemble Model Based on SVM and Random Forest in Forest Fire Susceptibility Assessment and Its Mapping in Serbia’s Tara National Park. Forests 2019, 10, 408. [Google Scholar] [CrossRef]
- Milanović, S.; Marković, N.; Pamučar, D.; Gigović, L.; Kostić, P.; Milanović, S.D. Forest Fire Probability Mapping in Eastern Serbia: Logistic Regression versus Random Forest Method. Forests 2021, 12, 5. [Google Scholar] [CrossRef]
- Nepal, S.; Pomara, L.Y.; Gould, N.P.; Lee, D.C. Wildfire Risk Assessment for Strategic Forest Management in the Southern United States: A Bayesian Network Modeling Approach. Land 2023, 12, 2172. [Google Scholar] [CrossRef]
- Banerjee, P. Maximum entropy-based forest fire likelihood mapping: Analysing the trends, distribution, and drivers of forest fires in Sikkim Himalaya. Scand. J. For. Res. 2021, 36, 275–288. [Google Scholar] [CrossRef]
- He, Q.; Jiang, Z.; Wang, M.; Liu, K. Landslide and wildfire susceptibility assessment in Southeast Asia using ensemble machine learning methods. Remote Sens. 2021, 13, 1572. [Google Scholar] [CrossRef]
- Iban, M.C.; Sekertekin, A. Machine learning based wildfire susceptibility mapping using remotely sensed fire data and GIS: A case study of Adana and Mersin provinces, Turkey. Ecol. Inform. 2022, 69, 101647. [Google Scholar] [CrossRef]
- Tan, C.; Feng, Z. Mapping forest fire risk zones using machine learning algorithms in Hunan province, China. Sustainability 2023, 15, 6292. [Google Scholar] [CrossRef]
- Gholamnia, K.; Gudiyangada Nachappa, T.; Ghorbanzadeh, O.; Blaschke, T. Comparisons of diverse machine learning approaches for wildfire susceptibility mapping. Symmetry 2020, 12, 604. [Google Scholar] [CrossRef]
- Ma, T.; Wang, G.; Guo, R.; Chen, L.; Ma, J. Forest fire susceptibility assessment under small sample scenario: A semi-supervised learning approach using transductive support vector machine. J. Environ. Manag. 2024, 359, 120966. [Google Scholar] [CrossRef] [PubMed]
- Mabdeh, A.N.; Al-Fugara, A.; Abualigah, L.; Saleem, K.; Snasel, V. Enhanced forest fire susceptibility mapping by integrating feature selection genetic algorithm and bagging-based support vector machine with artificial neural networks. Stoch. Environ. Res. Risk Assess. 2024, 38, 5039–5058. [Google Scholar] [CrossRef]
- Catry, F.X.; Rego, F.C.; Bação, F.L.; Moreira, F. Modeling and mapping wildfire ignition risk in Portugal. Int. J. Wildland Fire 2009, 18, 921–931. [Google Scholar] [CrossRef]
- Midi, H.; Sarkar, S.K.; Rana, S. Collinearity diagnostics of binary logistic regression model. J. Interdiscip. Math. 2010, 13, 253–267. [Google Scholar] [CrossRef]
- Tian, Y.; Wu, Z.; Cui, S.; Hong, W.; Wang, B.; Li, M. Assessing Wildfire Susceptibility and Spatial Patterns in Diverse Forest Ecosystems Across China: An Integrated Geospatial Analysis. J. Clean. Prod. 2025, 490, 144800. [Google Scholar] [CrossRef]
- Zhang, Z.; Lu, L.; Zhao, Y.; Wang, Y.; Wei, D.; Wu, X.; Ma, X. Recent advances in using Chinese Earth observation satellites for remote sensing of vegetation. ISPRS J. Photogramm. Remote Sens. 2023, 195, 393–407. [Google Scholar] [CrossRef]
- Gao, L.; Wang, X.; Johnson, B.A.; Tian, Q.; Wang, Y.; Verrelst, J.; Mu, X.; Gu, X. Remote sensing algorithms for estimation of fractional vegetation cover using pure vegetation index values: A review. ISPRS J. Photogramm. Remote Sens. 2020, 159, 364–377. [Google Scholar] [CrossRef]
- Chéret, V.; Denux, J.P. Analysis of MODIS NDVI Time Series to Calculate Indicators of Mediterranean Forest Fire Susceptibility. GIScience Remote Sens. 2011, 48, 171–194. [Google Scholar] [CrossRef]
- Van Wagtendonk, J.W.; Root, R.R. The use of multi-temporal Landsat Normalized Difference Vegetation Index (NDVI) data for mapping fuel models in Yosemite National Park, USA. Int. J. Remote Sens. 2003, 24, 1639–1651. [Google Scholar] [CrossRef]
- Rahimi, I.; Azeez, S.N.; Ahmed, I.H. Mapping Forest-Fire Potentiality Using Remote Sensing and GIS, Case Study: Kurdistan Region-Iraq. In Environmental Remote Sensing and GIS in Iraq; Al-Quraishi, A.M.F., Negm, A.M., Eds.; Springer International Publishing: Cham, Switzerland, 2020; pp. 499–513. [Google Scholar]
- El-Juhany, L.I. Forestland degradation and potential rehabilitation in southwest Saudi Arabia. Aust. J. Basic Appl. Sci. 2009, 3, 2677–2696. [Google Scholar]
- El-Juhany, L.I.; Aref, I.M. The Present Status of the Natural Forests in the Southwestern Saudi Arabia: 1-Taif Forests. World Appl. Sci. J. 2012, 20, 1462–1474. [Google Scholar]
- Hasanean, H.; Almazroui, M. Rainfall: Features and Variations over Saudi Arabia, A Review. Climate 2015, 3, 578–626. [Google Scholar] [CrossRef]
- Almazroui, M. Calibration of TRMM rainfall climatology over Saudi Arabia during 1998–2009. Atmos. Res. 2011, 99, 400–414. [Google Scholar] [CrossRef]
- Hasanean, H.M. Middle East Meteorology. 2004. Available online: http://www.eolss.net/ (accessed on 7 August 2015).
- Morgounov, A.; Abubakr, M.; Alhendi, A.; Alkhatran, A.; Alhuwaymil, H.; Ghosh, K. Agroclimatic Zones and Cropping Systems in the Southwestern Regions of the Kingdom of Saudi Arabia: Characterization, Classification and Improvement Potential. Crops 2022, 2, 186–201. [Google Scholar] [CrossRef]
- Farr, T.G.; Rosen, P.A.; Caro, E.; Crippen, R.; Duren, R.; Hensley, S.; Kobrick, M.; Paller, M.; Rodriguez, E.; Roth, L. The Shuttle Radar Topography Mission. Rev. Geophys. 2007, 45, 361. [Google Scholar] [CrossRef]
- Didan, K. MODIS/Terra Vegetation Indices 16-Day L3 Global 250m SIN Grid V061; NASA EOSDIS Land Processes DAAC: Sioux Falls, SD, USA, 2021.
- Karra, K.; Kontgis, C.; Statman-Weil, Z.; Mazzariello, J.C.; Mathis, M.; Brumby, S.P. Global land use/land cover with Sentinel 2 and deep learning. In Proceedings of the 2021 IEEE International Geoscience and Remote Sensing Symposium IGARSS, Brussels, Belgium, 11–16 July 2021; pp. 4704–4707. [Google Scholar]
- Tatem, A.J. WorldPop, open data for spatial demography. Sci. Data 2017, 4, 170004. [Google Scholar] [CrossRef]
- Phillips, S.J.; Anderson, R.P.; Schapire, R.E. Maximum entropy modeling of species geographic distributions. Ecol. Model. 2006, 190, 231–259. [Google Scholar] [CrossRef]
- Bar Massada, A.; Syphard, A.D.; Stewart, S.I.; Radeloff, V.C. Wildfire ignition-distribution modelling: A comparative study in the Huron–Manistee National Forest, Michigan, USA. Int. J. Wildland Fire 2013, 22, 174–183. [Google Scholar] [CrossRef]
- Yi, Y.-j.; Cheng, X.; Yang, Z.-F.; Zhang, S.-H. Maxent modeling for predicting the potential distribution of endangered medicinal plant (H. riparia Lour) in Yunnan, China. Ecol. Eng. 2016, 92, 260–269. [Google Scholar] [CrossRef]
- Kuhn, M.; Johnson, K. Applied Predictive Modeling; Springer: Berlin/Heidelberg, Germany, 2013; Volume 26. [Google Scholar]
- Hastie, T. The Elements of Statistical Learning: Data Mining, Inference, and Prediction; Springer: Berlin/Heidelberg, Germany, 2009. [Google Scholar]
- Zhang, Y.; Lim, S.; Sharples, J.J. Modelling spatial patterns of wildfire occurrence in South-Eastern Australia. Geomat. Nat. Hazards Risk 2016, 7, 1800–1815. [Google Scholar] [CrossRef]
- Cortes, C.; Vapnik, V. Support-vector networks. Mach. Learn. 1995, 20, 273–297. [Google Scholar] [CrossRef]
- Brown, A.R.; Petropoulos, G.P.; Ferentinos, K.P. Appraisal of the Sentinel-1 & 2 use in a large-scale wildfire assessment: A case study from Portugal’s fires of 2017. Appl. Geogr. 2018, 100, 78–89. [Google Scholar] [CrossRef]
- Tien Bui, D.; Le, H.V.; Hoang, N.-D. GIS-based spatial prediction of tropical forest fire danger using a new hybrid machine learning method. Ecol. Inform. 2018, 48, 104–116. [Google Scholar] [CrossRef]
- Roy, D.P.; Huang, H.; Boschetti, L.; Giglio, L.; Yan, L.; Zhang, H.H.; Li, Z. Landsat-8 and Sentinel-2 burned area mapping—A combined sensor multi-temporal change detection approach. Remote Sens. Environ. 2019, 231, 111254. [Google Scholar] [CrossRef]
- Liaw, A.; Wiener, M.C. Classification and Regression by randomForest. R News 2007, 2, 18–22. [Google Scholar]
- Guo, F.; Wang, G.; Su, Z.; Liang, H.; Wang, W.; Lin, F.; Liu, A. What drives forest fire in Fujian, China? Evidence from logistic regression and Random Forests. Int. J. Wildland Fire 2016, 25, 505–519. [Google Scholar] [CrossRef]
- Breiman, L. Random Forests. Mach. Learn. 2001, 45, 5–32. [Google Scholar] [CrossRef]
- Sachdeva, S.; Bhatia, T.; Verma, A.K. GIS-based evolutionary optimized Gradient Boosted Decision Trees for forest fire susceptibility mapping. Nat. Hazards 2018, 92, 1399–1418. [Google Scholar] [CrossRef]
- Seydi, S.T.; Kanani-Sadat, Y.; Hasanlou, M.; Sahraei, R.; Chanussot, J.; Amani, M. Comparison of Machine Learning Algorithms for Flood Susceptibility Mapping. Remote Sens. 2023, 15, 192. [Google Scholar] [CrossRef]
- Liu, J.; Wang, Y.; Lu, Y.; Zhao, P.; Wang, S.; Sun, Y.; Luo, Y. Application of Remote Sensing and Explainable Artificial Intelligence (XAI) for Wildfire Occurrence Mapping in the Mountainous Region of Southwest China. Remote Sens. 2024, 16, 3602. [Google Scholar] [CrossRef]
- Wei, A.; Yu, K.; Dai, F.; Gu, F.; Zhang, W.; Liu, Y. Application of Tree-Based Ensemble Models to Landslide Susceptibility Mapping: A Comparative Study. Sustainability 2022, 14, 6330. [Google Scholar] [CrossRef]
- Michael, Y.; Helman, D.; Glickman, O.; Gabay, D.; Brenner, S.; Lensky, I.M. Forecasting fire risk with machine learning and dynamic information derived from satellite vegetation index time-series. Sci. Total Environ. 2021, 764, 142844. [Google Scholar] [CrossRef]
- Chen, W.; Zhang, S.; Li, R.; Shahabi, H. Performance evaluation of the GIS-based data mining techniques of best-first decision tree, random forest, and naïve Bayes tree for landslide susceptibility modeling. Sci. Total Environ. 2018, 644, 1006–1018. [Google Scholar] [CrossRef]
- Pham, B.T.; Tien Bui, D.; Prakash, I.; Dholakia, M.B. Hybrid integration of Multilayer Perceptron Neural Networks and machine learning ensembles for landslide susceptibility assessment at Himalayan area (India) using GIS. Catena 2017, 149, 52–63. [Google Scholar] [CrossRef]
- Rahimi, I.; Duarte, L.; Teodoro, A.C. Zagros Grass Index—A New Vegetation Index to Enhance Fire Fuel Mapping: A Case Study in the Zagros Mountains. Sustainability 2024, 16, 3900. [Google Scholar] [CrossRef]
- Stavi, I. Wildfires in Grasslands and Shrublands: A Review of Impacts on Vegetation, Soil, Hydrology, and Geomorphology. Water 2019, 11, 1042. [Google Scholar] [CrossRef]
- Gong, Z.; Kawamura, K.; Ishikawa, N.; Goto, M.; Wulan, T.; Alateng, D.; Yin, T.; Ito, Y. MODIS normalized difference vegetation index (NDVI) and vegetation phenology dynamics in the Inner Mongolia grassland. Solid Earth 2015, 6, 1185–1194. [Google Scholar] [CrossRef]
- Orusa, T.; Viani, A.; Cammareri, D.; Borgogno Mondino, E. A Google Earth Engine Algorithm to Map Phenological Metrics in Mountain Areas Worldwide with Landsat Collection and Sentinel-2. Geomatics 2023, 3, 221–238. [Google Scholar] [CrossRef]
- You, X.; Meng, J.; Zhang, M.; Dong, T. Remote Sensing Based Detection of Crop Phenology for Agricultural Zones in China Using a New Threshold Method. Remote Sens. 2013, 5, 3190–3211. [Google Scholar] [CrossRef]
- Yin, H.; Liu, Q.; Liao, X.; Ye, H.; Li, Y.; Ma, X. Refined Analysis of Vegetation Phenology Changes and Driving Forces in High Latitude Altitude Regions of the Northern Hemisphere: Insights from High Temporal Resolution MODIS Products. Remote Sens. 2024, 16, 1744. [Google Scholar] [CrossRef]
- Wu, H.; Li, J.; Zhou, J.; Jiang, M.; Wei, X. Elevational pattern and temperature sensitivity of spring leaf phenology of three co-occurring tree species in a subtropical mountain forest. Trees 2023, 37, 863–874. [Google Scholar] [CrossRef]
- Jiménez-Valverde, A. Insights into the area under the receiver operating characteristic curve (AUC) as a discrimination measure in species distribution modelling. Glob. Ecol. Biogeogr. 2012, 21, 498–507. [Google Scholar] [CrossRef]
- Vilar del Hoyo, L.; Martín Isabel, M.P.; Martínez Vega, F.J. Logistic regression models for human-caused wildfire risk estimation: Analysing the effect of the spatial accuracy in fire occurrence data. Eur. J. For. Res. 2011, 130, 983–996. [Google Scholar] [CrossRef]
- Yang, X.; Jin, X.; Zhou, Y. Wildfire Risk Assessment and Zoning by Integrating Maxent and GIS in Hunan Province, China. Forests 2021, 12, 1299. [Google Scholar] [CrossRef]
- Bindajam, A.A.; Mallick, J.; AlQadhi, S.; Singh, C.K.; Hang, H.T. Impacts of Vegetation and Topography on Land Surface Temperature Variability over the Semi-Arid Mountain Cities of Saudi Arabia. Atmosphere 2020, 11, 762. [Google Scholar] [CrossRef]
- MacFarland, T.W.; Yates, J.M. Mann–Whitney U Test. In Introduction to Nonparametric Statistics for the Biological Sciences Using R; Springer International Publishing: Cham, Switzerland, 2016; pp. 103–132. [Google Scholar]
- Welch, B.L. The Significance of the Difference Between Two Means when the Population Variances are Unequal. Biometrika 1938, 29, 350–362. [Google Scholar] [CrossRef]
- Cohen, J. Statistical Power Analysis for the Behavioral Sciences; Routledge: London, UK, 2013. [Google Scholar]
- Fithian, W.; Hastie, T. Finite-sample equivalence in statistical models for presence-only data. Ann. Appl. Stat. 2012, 7, 1917. [Google Scholar] [CrossRef] [PubMed]
- Elith, J.; Phillips, S.J.; Hastie, T.; Dudík, M.; Chee, Y.E.; Yates, C.J. A statistical explanation of MaxEnt for ecologists. Divers. Distrib. 2011, 17, 43–57. [Google Scholar] [CrossRef]
- Renner, I.W.; Warton, D.I. Equivalence of MAXENT and Poisson Point Process Models for Species Distribution Modeling in Ecology. Biometrics 2013, 69, 274–281. [Google Scholar] [CrossRef]
- Phillips, S.J.; Dudík, M. Modeling of species distributions with Maxent: New extensions and a comprehensive evaluation. Ecography 2008, 31, 161–175. [Google Scholar] [CrossRef]
- Valavi, R.; Guillera-Arroita, G.; Lahoz-Monfort, J.J.; Elith, J. Predictive performance of presence-only species distribution models: A benchmark study with reproducible code. Ecol. Monogr. 2022, 92, e01486. [Google Scholar] [CrossRef]
- Ahmadi, M.; Hemami, M.-R.; Kaboli, M.; Shabani, F. MaxEnt brings comparable results when the input data are being completed; Model parameterization of four species distribution models. Ecol. Evol. 2023, 13, e9827. [Google Scholar] [CrossRef] [PubMed]
- Bradstock, R.A. A biogeographic model of fire regimes in Australia: Current and future implications. Glob. Ecol. Biogeogr. 2010, 19, 145–158. [Google Scholar] [CrossRef]
- O, S.; Hou, X.; Orth, R. Observational evidence of wildfire-promoting soil moisture anomalies. Sci. Rep. 2020, 10, 11008. [Google Scholar] [CrossRef] [PubMed]
- Hu, C.; Zhang, X.; Ding, X.; Yan, D.; Jian, S. Comparison of Different Methods to Estimate Canopy Water Storage Capacity of Two Shrubs in the Semi-Arid Loess Plateau of China. Forests 2022, 13, 1187. [Google Scholar] [CrossRef]
- Gillespie, L.M.; Volaire, F.A. Are winter and summer dormancy symmetrical seasonal adaptive strategies? The case of temperate herbaceous perennials. Ann. Bot. 2017, 119, 311–323. [Google Scholar] [CrossRef] [PubMed]
- Pompa-García, M.; Camarero, J.J.; Colangelo, M.; González-Cásares, M. Inter and intra-annual links between climate, tree growth and NDVI: Improving the resolution of drought proxies in conifer forests. Int. J. Biometeorol. 2021, 65, 2111–2121. [Google Scholar] [CrossRef] [PubMed]
- Loudermilk, E.L.; O’Brien, J.J.; Goodrick, S.L.; Linn, R.R.; Skowronski, N.S.; Hiers, J.K. Vegetation’s influence on fire behavior goes beyond just being fuel. Fire Ecol. 2022, 18, 9. [Google Scholar] [CrossRef]


Disclaimer/Publisher’s Note: The statements, opinions and data contained in all publications are solely those of the individual author(s) and contributor(s) and not of MDPI and/or the editor(s). MDPI and/or the editor(s) disclaim responsibility for any injury to people or property resulting from any ideas, methods, instructions or products referred to in the content. |
© 2025 by the authors. Licensee MDPI, Basel, Switzerland. This article is an open access article distributed under the terms and conditions of the Creative Commons Attribution (CC BY) license (https://creativecommons.org/licenses/by/4.0/).