Article

Mapping Soil Burn Severity and Crown Scorch Percentage with Sentinel-2 in Seasonally Dry Deciduous Oak and Pine Forests in Western Mexico

by
Oscar Enrique Balcázar Medina
1,2,
Enrique J. Jardel Peláez
2,
Daniel José Vega-Nieva
3,
Adrián Israel Silva-Cardoza
4 and
Ramón Cuevas Guzmán
2,*
1
Doctorado en Ciencias en Biosistemática, Ecología y Manejo de Recursos Naturales y Agrícolas, Departamento de Ecología y Recursos Naturales, Centro Universitario de la Costa Sur, Universidad de Guadalajara, Av. Independencia Nacional 151, Colonia Centro, Autlán de la Grana 48900, Mexico
2
Departamento de Ecología y Recursos Naturales, Centro Universitario de la Costa Sur, Universidad de Guadalajara, Av. Independencia Nacional 151, Colonia Centro, Autlán de la Grana 48900, Mexico
3
Facultad de Ciencias Forestales, Universidad Juárez del Estado de Durango, Río Papaloapan y Blvd. Durango S/N Col. Valle del Sur, Durango 34120, Mexico
4
Centro de Investigación en Ciencias de Información Geoespacial, A.C., C. Contoy 137, Lomas de Padierna, Tlalpan, Mexico City 14240, Mexico
*
Author to whom correspondence should be addressed.
Remote Sens. 2025, 17(13), 2307; https://doi.org/10.3390/rs17132307
Submission received: 15 May 2025 / Revised: 24 June 2025 / Accepted: 2 July 2025 / Published: 5 July 2025

Abstract

There is a need to evaluate Sentinel-2 (S2) fire severity spectral indices (SFSIs) for predicting vegetation and soil burn severity for a variety of ecosystems. We evaluated the performance of 26 SFSIs across three fires in seasonally dry oak–pine forests in central-western Mexico. The SFSIs were derived from composites of S2 multispectral images obtained with Google Earth Engine (GEE), processed using different techniques, for periods of 30, 60 and 90 days. Field verification was conducted through stratified random sampling by severity class on 100 circular plots of 707 m2, where immediate post-fire effects were evaluated for five strata, including the canopy scorch in overstory (OCS)—divided in canopy (CCS) and subcanopy (SCS)—understory (UCS) and soil burn severity (SBS). Best fits were obtained with relative, phenologically corrected indices of 60–90 days. For canopy scorch percentage prediction, the indices RBR3c and RBR5n, using NIR (bands 8 and 8a) and SWIR (band 12), provided the best accuracy (R2 = 0.82). SBS could be best mapped from RBR1c (using 11 and 12 bands) with relatively acceptable precision (R2 = 0.62). Our results support the feasibility to separately map OCS and SBS from S2, in relatively open oak–pine seasonally dry forests, potentially supporting post-fire management planning.

1. Introduction

A detailed assessment of the ecological effects of wildfires is essential for designing and implementing better fire management practices for biodiversity conservation, carbon emission mitigation and the protection of human settlements and natural resources [1,2,3,4,5,6,7].
On a global scale, it is estimated that an average of 774 ± 63 Mha year−1 has been burned in the last two decades [8]. Although a decrease of ca. 24% in the accumulated fire area has been reported during the same period [9,10], the proportion of high severity burned areas has increased [11]. Fire severity is the magnitude of post-fire changes observed in vegetation, forest fuels and soil [12]. It is a critical component of fire regimes, influencing ecosystem recovery and future fire behavior [13].
Assessing fire severity, beyond merely monitoring the number of events and burned areas, is essential for understanding and modeling the first-order effects of wildfires [12,14,15]. These effects also influence landscape patterns [16,17], changes in vegetation cover and plant mortality [18,19,20], soil properties alterations [21,22,23], fuel consumption levels and smoke and greenhouse gases emissions [24,25]. Additionally, fire severity plays a key role in shaping the potential response of forest ecosystems to disturbance [26,27].
Wildfire severity assessment methods have substantially improved with the development of remote sensing and the availability of satellite imagery with higher spatial and temporal resolution. However, several challenges in mapping wildfire severity remain [28,29,30]. Among these challenges, we can highlight: (1) the need to evaluate the potential of satellite imagery to map fire severity by individual strata (soil and vegetation); (2) the comparison of the performance of Sentinel-2 spectral indices for fire severity mapping, including (3) the evaluation of compositing period and phenological correction and (4) the performance of those analyses of remotely sensed fire severity in relatively unexplored ecoregions.

1.1. Evaluating Satellite Imagery to Map Fire Severity by Strata (Soil and Vegetation)

Quantifying the relationships of remote sensing imagery with the different strata and composite field severity indices remains an ongoing challenge in the scientific literature (e.g., [30,31,32]). While field composite burn indices, such as CBI, are the most widely used field approach (e.g., [14,33,34]), there is a growing uncertainty about the biological significance of those composite field indices (e.g., [28,32]). Instead, some authors have proposed to evaluate field effects separately by vegetation and soil strata (e.g., [28,32,35,36,37,38]), to provide a more physical-based understanding of fire impacts and better guide post-fire management decision making. The feasibility of this approach has largely varied between ecosystem types (e.g., [28,32,35,36,37,38]).
In this regard, the ability of medium resolution imagery to capture initial (<3 months) fire impacts—hereafter termed fire severity following [28] or [39]—is well-established for the tree canopy strata (e.g., [29,35]). In contrast, there is more uncertainty about their capacity to quantify fire impacts on the soil—hereafter termed soil burn severity following [12] or [40]. As a result, there is still a knowledge gap about the feasibility of mapping soil burn severity (SBS) from medium resolution imagery (e.g., [31,35,40]), which remains to be evaluated for a large variety of ecoregions under varying conditions of tree density. Furthermore, spectral indices most suited for the SBS evaluation are still the subject of continued research (e.g., [32,38,40]).

1.2. Comparing the Performance of Sentinel-2 Spectral Indices for Fire Severity Mapping

Multiple spectral indices have been developed to quantify fire severity (e.g., [41,42,43]); however, there is still a need to evaluate their accuracy against field-observed fire impacts on vegetation and soil (e.g., [28,40,41,42,43,44]). Landsat indices have been evaluated against field observations of fire severity, mainly in countries such as USA and Canada (e.g., [45,46,47,48,49]) or in Europe (e.g., [31,32,50,51,52,53]). More recently, Sentinel-2 imagery has provided the opportunity to obtain 5-day imagery with improved spatial resolution (10–20 m), with new spectral bands that are being explored to map fire severity (e.g., [51,52,53,54,55,56]).
The selection of the best spectral index to map fire severity from Landsat and, particularly, from the more recent Sentinel-2 satellite is still subject of ongoing research (e.g., [51,52,53,54,55,56]). While several studies (e.g., [31,32,41,42]) have suggested a greater potential of indices such as NBR, based on NIR and SWIR, often outperforming those based on visible bands such as NDVI or SAVI, other studies have found the contrary (e.g., [57,58,59,60]), depending on the ecosystem type evaluated. Furthermore, the potential of Sentinel-2 (S2) red-edge spectrum (bands 5, 6, 7), against NIR and between the latter (bands 8 against 8a) for fire severity mapping is still being evaluated, with contrasting results depending on the evaluated sites (e.g., [41,43,51,52]). Also, indices taking advantage of the two S2 SWIR bands (11 and 12) are being explored for mapping fire perimeters (e.g., [55,61,62]) or fire impacts in soil and vegetation (e.g., [38,40,41]). Finally, more complex indices that incorporate both red edge, NIR and visible S2 bands, such as dBAIS2 [63], are also being tested for burned area (e.g., [64,65]) and fire severity mapping (e.g., [38,41,42,66]). In addition, all of the above-mentioned spectral indices can be either expressed as absolute change between pre- and post-fire images (e.g., dNBR) or as relative change considering their pre-fire values (e.g., RBR [67]). The comparison of these two approaches for mapping fire effects is still subject of ongoing evaluation in the literature (e.g., [32,50,52,68]).

1.3. Evaluating the Role of Compositing Period and Phenological Correction in Mapping Fire Severity

Beyond the selection of spectral indices, image compositing period can influence the accuracy to map fire severity (e.g., [39,41,69]) and perimeters (e.g., [41,55]). The majority of the previous literature has focused on image selection for either initial or extended assessment of fire/burn severity, mainly using paired Landsat images (e.g., [69,70,71]). There are relatively few studies that have evaluated different time assessment periods for fire severity mapping using image composites from cloud-based tools such as Earth Engine (e.g., [48,49]). Furthermore, fewer of them have compared different composite periods to map initial (e.g., 30–90 days) fire severity using Sentinel-2 imagery (e.g., [41,56]).
In addition, many studies have documented that non-fire effects such as plant moisture or phenology cycles can affect spectral indices and, consequently, the ability and transferability of spectral indices to map fire severity and perimeters (e.g., [39,72,73]). In order to minimize those effects, phenological corrections have been proposed, generally by considering the subtraction of the observed mean value of the spectral indices in the unburned area (e.g., [29,47,68]). Some studies have suggested that considering those phenological corrections can enhance the ability of spectral indices to more consistently map field-observed fire severity under varying plant moisture and phenology conditions (e.g., [41,68]). However, the potential of phenological corrections to improve the transferability of fire severity evaluations remain to be evaluated for a large variety of conditions (e.g., [29,41,47]).

1.4. Analyzing Remotely Sensed Fire Severity in Relatively Unexplored Ecoregions

The selected best spectral indexes and optimum compositing periods to map field-observed fire severity can vary largely between ecosystem and geographical areas (e.g., [31,32,49]). Therefore, there is still a large knowledge gap to assess the performance of Sentinel-2 spectral indices in different forest types. Specifically, most of those field evaluations of fire severity have been conducted in boreal and temperate regions (e.g., [74,75,76,77]). Comparatively, there are fewer studies in tropical and subtropical latitudes, where climatic conditions and vegetation types are different [78,79,80]. Nevertheless, those less studied regions accumulate a large fraction of the fire activity globally (e.g., [81]).
In particular, Mexico is a hotspot of fire activity (e.g., [81]), with a large number of both satellite detections (e.g., [82,83,84]) and fire suppression registers (e.g., [85,86,87]). Those occur for a wide diversity of forest ecosystems, ranging from subtropical montane forests, tropical rainforests and seasonally dry and humid forests, to arid shrublands and grasslands [88,89,90]. While the extent of total burned area in Mexico is well known (e.g., [90,91,92]) there is still a large uncertainty about the burn severity, mainly because of the scarcity of field data [41].
Furthermore, to our best knowledge, the very few previous studies evaluating remotely sensed fire severity with field data in Mexico have mainly focused on pine and pine-dominated mixed forests in semiarid to temperate ecosystems [41,93,94]. In contrast, we are not aware of any previous study in Mexico evaluating the performance of Sentinel imagery for predicting fire severity for oak-dominated seasonally dry (subhumid) mixed forests. Those forests cover large areas of central-western Mexico [95] and present specific challenges for mapping fire severity. First, given the deciduous nature of the oak species and the subhumid climate, they can experiment marked changes in vegetation phenology and moisture during the spring dry season and summer precipitation cycles. Secondly, a large fuel heterogeneity, ranging from grasslands to open and medium density forests, characterizes these forests [3]. Finally, this ecosystem type has received considerably less attention in the international literature of remotely sensed fire severity.
Consequently, the goals of the current study were as follows:
  • To evaluate the performance of relative and absolute Sentinel-2 spectral indices, with and without phenological corrections, using different compositing techniques (average, minimum and percentiles) and composite periods (30, 60 and 90 days), to predict field-observed fire severity in the vegetation, soil burn severity and composite field fire severity indices, in seasonally dry deciduous oak–pine forests in Western Mexico.
  • To create fire severity maps for the vegetation and soil strata, and for the best performing field severity index and to evaluate their correspondence against field data and between them.

2. Materials and Methods

2.1. Study Area

La Primavera Forest (LPF, from here on) is located in the center of the state of Jalisco, Mexico, between 20°32′–20°44′N and 103°26′–103°42′W (Figure 1). The LPF is a Wildlife Protection Area (WPA) and also has a declaration as a MAB-UNESCO Biosphere Reserve, covering an area of 30,500 ha [3]. The area, also known as Sierra de la Primavera, is an extrusive igneous mountainous complex that is part of the Trans-Mexican Volcanic Belt; it presents a complex relief formed by volcanic domes, steep mountain slopes, ravines, hills and undulated plains, with an altitudinal range of 1400 to 2270 masl [96].
The vegetation cover consists of mixed forests of Pinus oocarpa, Quercus resinosa and Q. viminea. Among the most common tree species are Q. magnoliifolia, P. devoniana, P. douglasiana, Clethra rosei and Arbutus xalapensis. Dense forests account for 35.4% of the area, while open woodlands differentiated by canopy density 37.2% (>60% for dense woodlands and 30–60% for the open woodlands). Additionally, 8.3% of the area corresponds to savannah-like formations dominated by grasslands with scattered trees and shrubs (tree cover 10–30%) and 17.7% corresponds to induced grasslands and secondary shrublands; the remaining 1.4% is agricultural fields, urbanized areas and infrastructure [3].
The climate is subhumid (potential evapotranspiration to annual precipitation ratio between 1.0 and 1.4), with summer rainfall and a long, 7-month dry season between winter and spring. It varies from warm (mean annual temperature, Mat 18–21 °C) in the lower parts (elevations below 1800 m) to warm-temperate (Mat 15–17 °C) between 1800 and 2270 m elevation [3].
Due to the seasonally dry climate conditions and vegetation type, the LPF ecosystems are prone to frequent (return interval < 30 years), low to mixed severity surface fires, with occasional torching or passive crown fires [3,89].
LPF is one of the last wilderness areas in the metropolitan area of Guadalajara, the second largest urban concentration in Mexico and capital of the state of Jalisco. The proximity to urban areas and agricultural fields contributes to a high frequency of anthropogenic ignitions, which generates strong public pressure to adopt fire suppression measures, a common problem in the forest–urban interface of this and other regions of the world [97]. Between 1998 and 2019, an average of 83 fire events were suppressed annually in the LPF and its surroundings. Of these, 52% burned areas less than 2.5 ha and only 5% affected more than 50 ha [3]. The three wildfires analyzed in this study, which occurred between April and May 2021, burned a total of 10,270.8 ha, equivalent to one-third of the LPF area (Figure 1).

2.2. Field Methods

Field sampling was carried out on 100 circular plots of fixed dimensions (15 m radius, 707 m2 surface). All plots were distributed in a stratified sampling scheme, based on preliminary burn severity and pre-fire NBR [98]. The preliminary fire severity classes, based on the RBRc thresholds from [41], were as follows: low, medium, high and extreme; a fifth category included unburned sites as a control. A total of 20 plots for each of the 5 initial fire severity class (including unburned) were established randomly within homogeneous patches of every initial fire severity class. Sampling was carried out in July 2021, following the methods described in Silva-Cardoza et al. [98].
The coordinates, using Garmin GPSMAP 65 Global Positioning System (GPS), elevation, aspect and slope were recorded for each plot. All trees with a diameter at breast height (DBH, measured at 130 cm from the ground) greater than 7.5 cm were recorded in each plot; the species was determined and the DBH was measured with a diameter tape, and the total height and height to the base of the crown were also measured for every tree. For each tree, the proportion of scorched crown was visually recorded [98,99] in three categories: (1) “green”, not affected by fire; (2) “brown”, dehydrated or dead leaves with color change; and (3) “black”, with charred leaves and branches.
After field inventory, the overstory stratum was divided into the canopy (trees with heights greater than the 75th percentile of the trees in the plot) and subcanopy (trees with heights less than the 75th percentile of the trees in the plot), following [41,99]. For every vegetation strata, crown scorch percentage was estimated as the sum of black and brown fractions [41]. The average plot crown scorch was estimated for the strata overstory (OCS), canopy (CCS), subcanopy (SCS) and understory (UCS).
The understory stratum was considered to include woody plants with a DBH less than 7.5 cm, including individuals of small tree species or in the juvenile stage. The species, total height, height at the beginning of the crown and diameter at the base of the stem were recorded and grouped into categories <2.5, 2.5–5 and 5–7 cm. The same categories as those used for the OCS were used for the UCS [98].
Soil burn severity (SBS) was estimated visually according to the field-based protocol for fire severity temperate forest described by [41,98], an adaptation from Vega et al. [21,100], which proposes five levels of severity associated with modifications of the organic layer and the surface mineral soil: (0) unburned; (1) partially burned litter and duff, unaltered soil surface; (2) charred litter and duff on intact mineral soil; (3) completely consumed organic layer without mineral soil alteration (mineral soil organic matter not consumed; dark ash); (4) organic layer completely consumed; mineral soil structure affected and mineral soil organic matter consumed (white or very light gray ash); and (5) exposed mineral soil, without organic remains, highly altered structure with a predominance of orange to reddish color.
To estimate SBS, three 15 m lines were drawn from the center of the circular plot with azimuths of 0°, 120° and 240°; in each line, three squares of 30 × 30 cm were sampled, equidistant at 5 m, in which the percentage of soil under the conditions described above was recorded [98]. For each square, SBS was estimated as the weighted average of the coverage of each of the five previously described severity. Plot SBS was estimated as the average SBS and scaled from 0–5 to 0–100 to homogenize its units the percentage of fire severity in the vegetation [41].
Finally, using the field variables described above, two composite field severity indexes (FSI) were calculated. Following [41], the indexes represent the average of the burning severity in the vegetation strata and the soil severity, on a scale of 0–100%, where 0 = no burning and 100% = extreme severity, based on the following:
F S I i =   C C S + S C S + U C S + S B S / 4
F S I 2 i =   C C S + S C S + [ U C S + S B S 2 ] / 3
where FSIi = field severity index at the i-th site (%); FSI2i = field severity index 2 at the i-th site (%); CCS, SCS, UCS = canopy, subcanopy and understory crown scorch volume, respectively; SBS = soil burn severity.

2.3. Satellite Composite Images

2.3.1. Sentinel-2 Composite Download

To download Sentinel imagery, the area of occurrence of the three fires was delineated based on the interpolated MODIS and VIIRS hotspot cluster perimeters from the Mexican Forest Fire Danger System SPPIF (https://forestales.ujed.mx/incendios2/, accessed on 14 May 2025). Aggregated hotspot perimeters from SPPIF are obtained using the algorithm of Briones-Herrera et al. [90], which applies a convex hull to MODIS and VIIRS active fires. Historical (2012-date) and near real time MODIS and VIIRS active fires and aggregated perimeters area available in SPPIF; they are transferred in near real time from the antenna of CONABIO (Comisión Nacional para el Conocimiento y Uso de la Biodiversidad) [101].
For each fire, composite multispectral Sentinel-2 (L2A) images were obtained from the cloud-based server Google Earth Engine (GEE) [102,103], based on the fire-specific dates of fire occurrence from the MODIS and VIIRS active fires. For each fire, composites of images from three periods of 30, 60 and 90 days before and after the fire were analyzed. The candidate periods of 30, 60 and 90 days were selected based on previous analyses from the literature aiming at monitoring initial fire impacts (e.g., [39,41,56]). Those studies have generally observed that shorter time periods are preferable to capture the post-fire initial damage in the soil and canopy. Contrarily, after 60–90 days, the ability to quantify fire impacts and to map the fire perimeter has generally been reported to decrease (e.g., [39,41,56]). This lower separability of burned against unburned vegetation with increasing time, particularly after 60–90 days, has been generally attributed to the increasing growth of post-fire regeneration, sometimes even masking the fire perimeter, particularly in areas with rapid recovery of grasses and shrubby species (e.g., [39,41,71]). Within that time window (<3 months), we specifically aimed at evaluating which specific period showed the highest correlation with our field inventory of soil and vegetation damage, which was performed 60 to 90 days after fire, therefore capturing both the initial fire damage and some early post-fire regeneration. Average composites of the full stack of surface reflectance (level 2A) were obtained, considering the SCL and Q60 bands to select the optimal pixels, excluding those affected by clouds, shadows, water or snow.
Once the composites were obtained, the bands were extracted in QGIS 3.28.4 [104], an open-source software that provides tools for spatial data analysis, visualization and processing, enabling the development of spectral indices. The indices were downloaded from GEE based on the code proposed by Parks et al. [68] and Briones-Herrera et al. [105].

2.3.2. Determination of Spectral Fire Severity Indices (SFSI)

Based on the composite bands, twenty-six spectral fire severity indices (SFSI) were evaluated (Table 1), using the three different time periods described in the previous section. For each spectral index, the absolute change (dSI) was calculated as the pre- and post-fire difference in bitemporal images [71]:
dSI = (SI preSI post) ∗ 103
The relative spectral indexes (RSI) [67] were calculated with the following equation:
RSI = dSI/(SI pre + 1.001)
A phenological correction was performed on each differentiated spectral index [67,68], with the following equation:
dSIc = dSIc
where dSIc = phenologically corrected differentiated spectral index and c = constant of the phenological correction, calculated as the average of the dSI, in unburned vegetation.
The phenological constant “c” was calculated by subtracting the average dSI value in a 2 km wide buffer located 5 km outside the fire perimeter, called offset [41]. This same phenological correction was applied to the relative spectral indices using the following equation:
RSIc = dSIc/(SIpre + 1.001)
where RSIc = Relative Spectral Index, dSIc = corrected differenced spectral index and SIpre = pre-fire spectral index of the dSI.
A total of 1274 models were tested, resulting from the combination of the evaluated time windows, for the absolute and relative indices with and without phenological correction.

2.4. Comparison of Spectral Indices and Field Indices

The spectral severity indices (Table 1) were evaluated by simple linear regression against the field severity indices of vegetation strata (OCS, CCS, SCS, UCS, SBS) and composite fire severity indices (FSI1 and FSI2).
The models were fitted using the “lm” library of the RStudio 2024.09.1+394 statistical software [119,120]. The models were evaluated, taking into account the coefficient of determination (R2) and the root mean square error (RSME) [121,122,123].
To identify the spectral index that most accurately represented the fire severity observed in the field, the following criteria were applied: (1) best fit of the regression model with field indices, according to the coefficient of determination (R2) and the RSME; (2) ease of computation of the spectral index, which constitutes the most direct or cost-effective solution for its practical application. Based on the comparison of the 1274 spectral indices evaluated for the average composites, the best selected indices for predicting vegetation, soil and global fire severity, were also further evaluated using the same procedure for the following compositing techniques: AM, AA and MM, where XY represent the pre (X) and post (Y) images for average (A) and minimum (M); and for the 20th, 25th and 33rd percentiles for both pre and post images (p20, p25 and p33). All tested spectral composites were calculated for the three time periods (30, 60 and 90 days) in GEE using the code from Parks et al. [68] and Briones-Herrera et al. [105], including the phenological correction.
The best fitting spectral indices were used to calculate burn severity thresholds to create fire severity maps for the vegetation strata, soil burn severity and for the best performing field severity index. Finally, a concordance analysis was performed between the selected spectral indices and with the field severity indices for the sampling plots using the Kappa concordance index [122].

3. Results

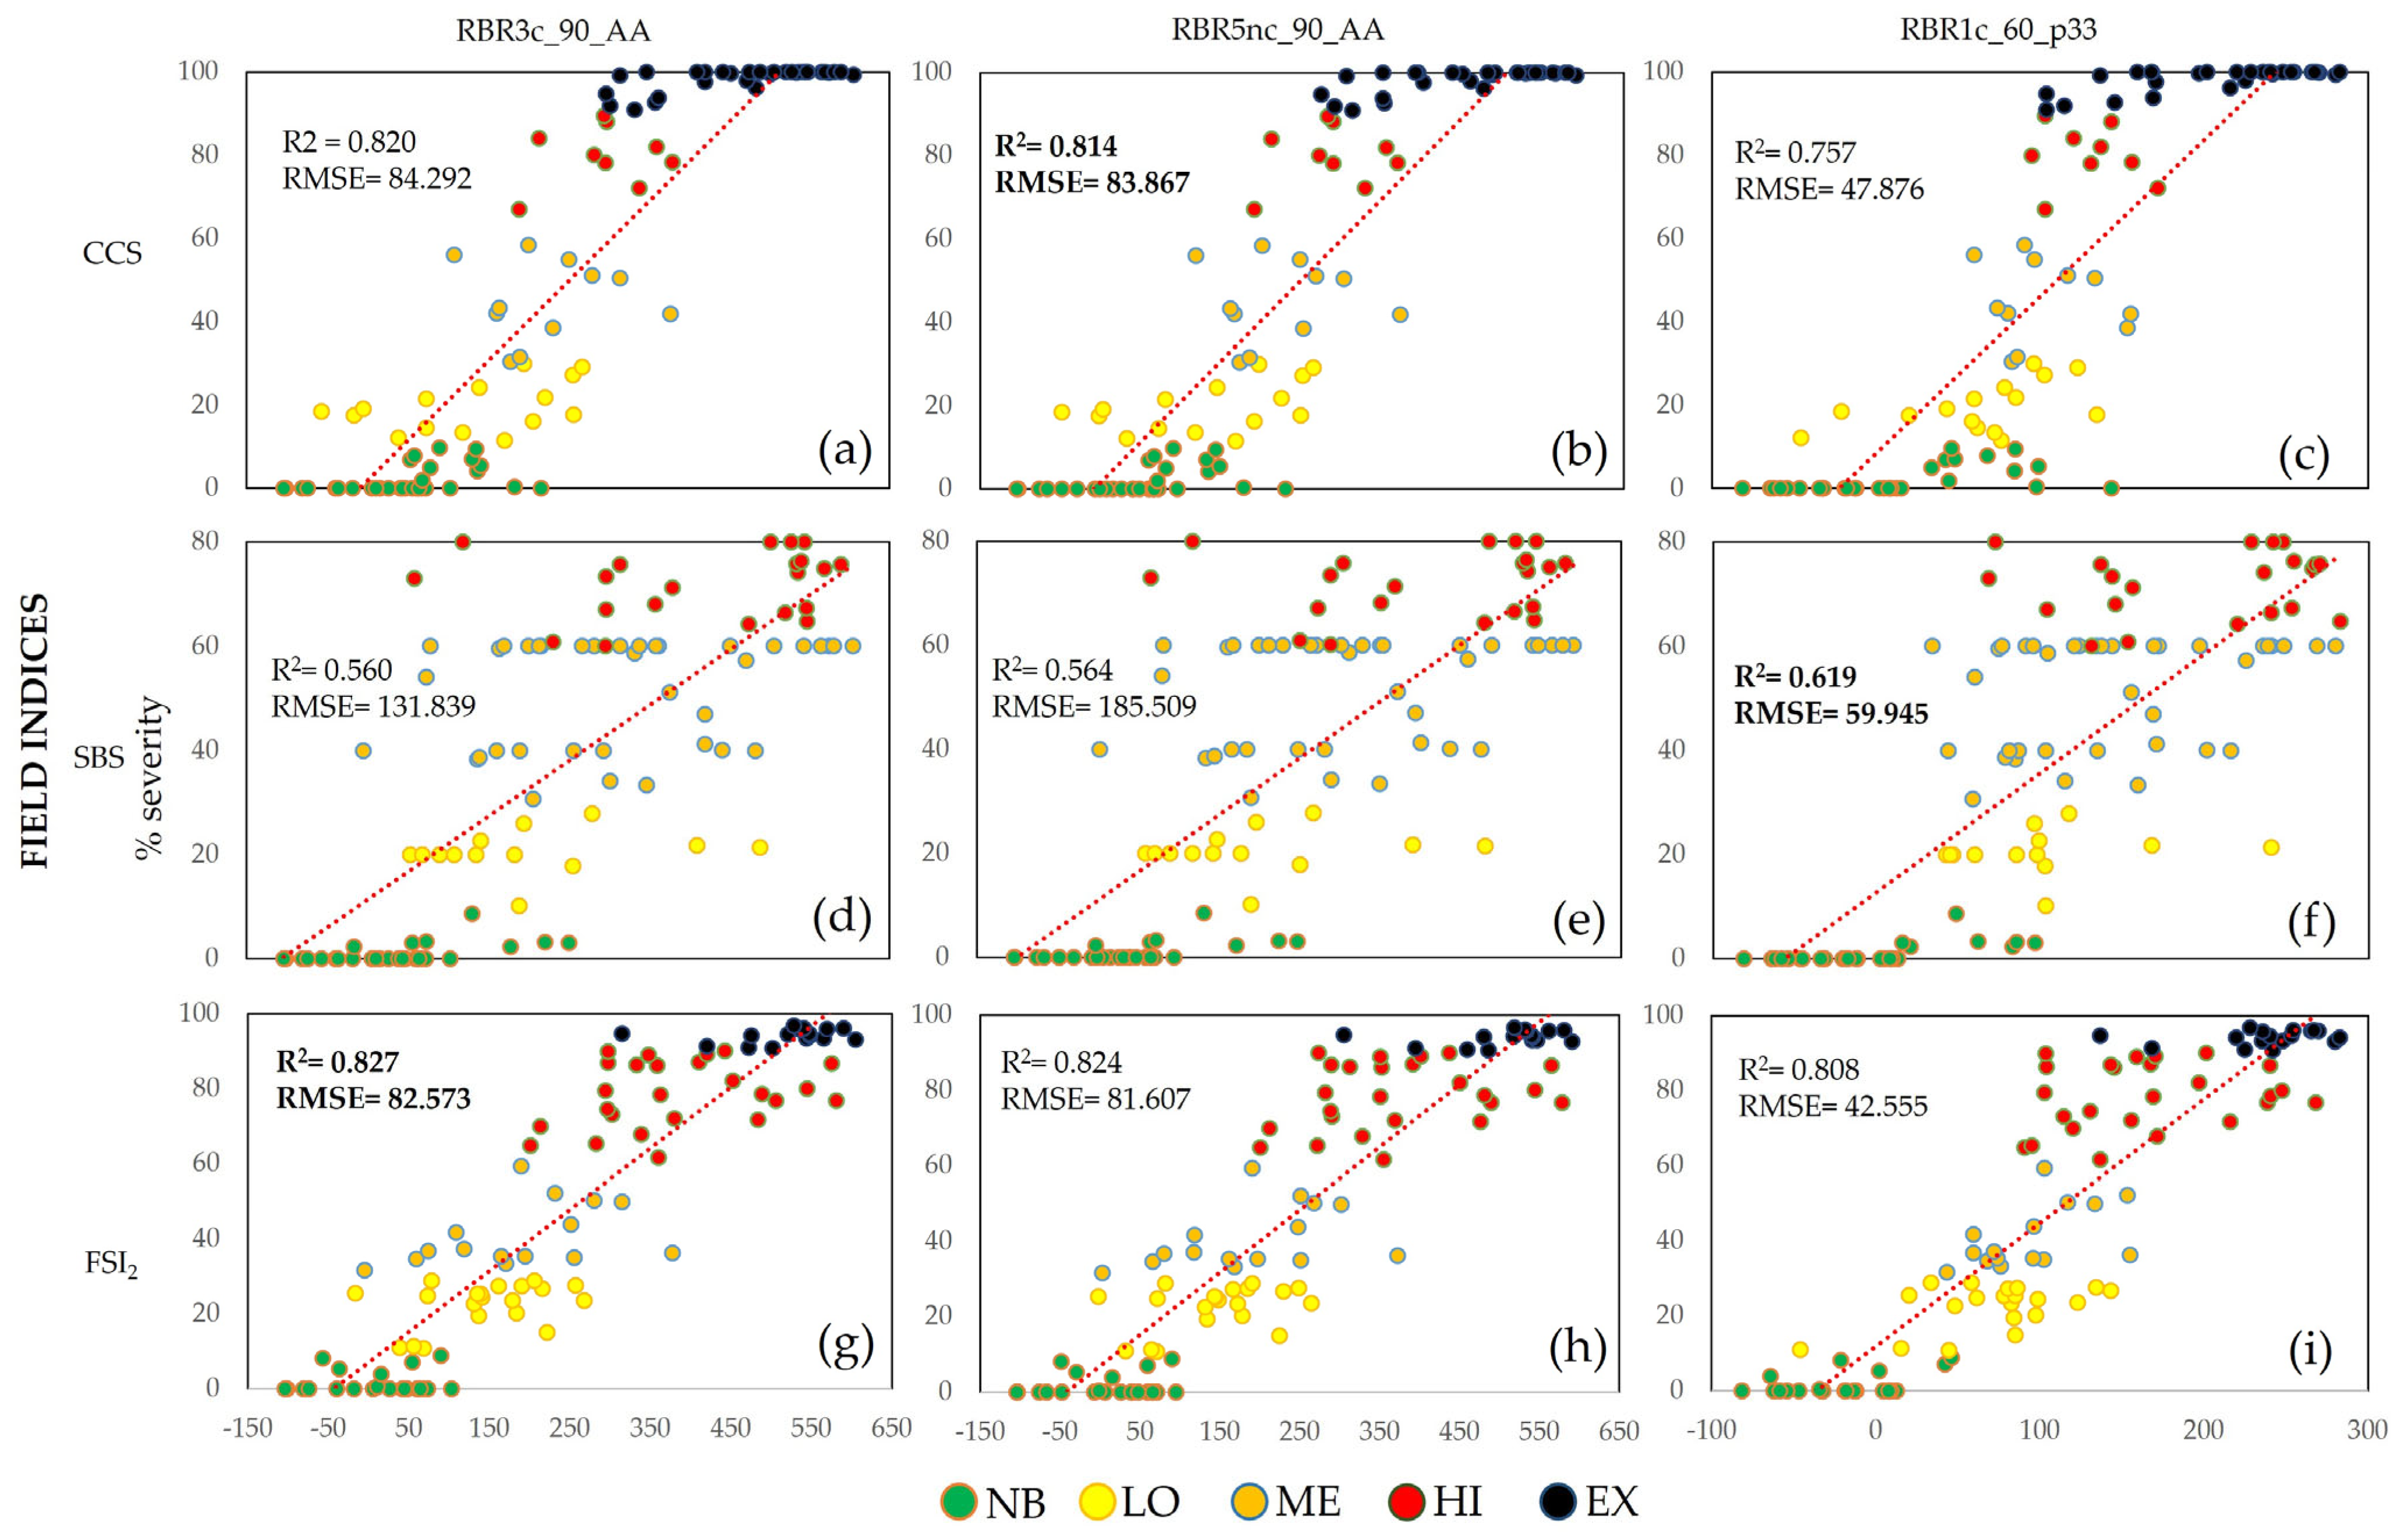
3.1. Relationship Between Spectral and Field Severity Indices

From the 1274 models tested, the best indices for predicting overstory canopy scorch (OCS), soil burn severity (SBS) and field fire severity index (FSI2) are shown in Table 2. All selected best performing indices included the phenological correction, outperforming the indices without phenological correction (Supplementary Table S1). In general, relative indices were the highest ranking for the evaluated strata (Table 2). The highest R2 values were 0.820 and 0.827 for canopy scorch and FSI2 index, respectively (Table 2).
The best predictor of fire effects on the overstory canopy strata (OCS) was the RBR3c_90_AA index, followed by RBR5nc_90_AA. Both indexes are calculated using SWIR band 12 and NIR bands 8 and 8a (Equations (10) and (12), respectively, Table 1). Although in the overstory tree stratum the dBAIS22c_90_p33 index presented the lowest RMSE (49.964) and a similar R2 value to the RBR3c index, it was not selected as the best index for this strata because the latter is simpler to compute (more parsimonious index).
For the canopy and subcanopy, RBR3c_90_AA was also the best performing index, with R2 of 0.80 for both strata (Supplementary Table S1), slightly lower fit than the OCS, so the latter was selected to map the entire tree strata fire severity. In contrast, the SFSIs were poorly matched with the understory scorch (UCS), with the highest R2 value, being 0.295 (Supplementary Table S1).
For soil burn severity (SBS), the spectral index with the best fit (R2 = 0.619, RMSE = 59.945) was RBR1c_60 days_p33 (Table 2), using SWIR bands 11 and 12 (Equation (8), Table 1). Although the percentage of explained variation was relatively lower than that of OCS, SBS is an important ecological indicator, difficult to determine by remote sensing methods due to the effect of vegetation cover. None of the versions of the BAIS2 index showed a good fit with SBS (Supplementary Table S1).
The composite field severity index, FSI2, presented slightly higher R2 values than the individual attribute indices. The spectral index RBR3c_90_AA had the best fit (R2 = 0.827), but the RBR5nc_90_AA index showed a lower RMSE, although a relatively lower R2 = 0.824 (Table 2). The R2 and RMSE values for the first three indices were practically similar (Table 2). Figure 2 compares the regression models of the three spectral indices (RBR3c90_AA, RBR5nc_90_AA and RBR1c_60_p33) that presented the best fit with the field indices OCS, FSI2 and SBS, respectively.

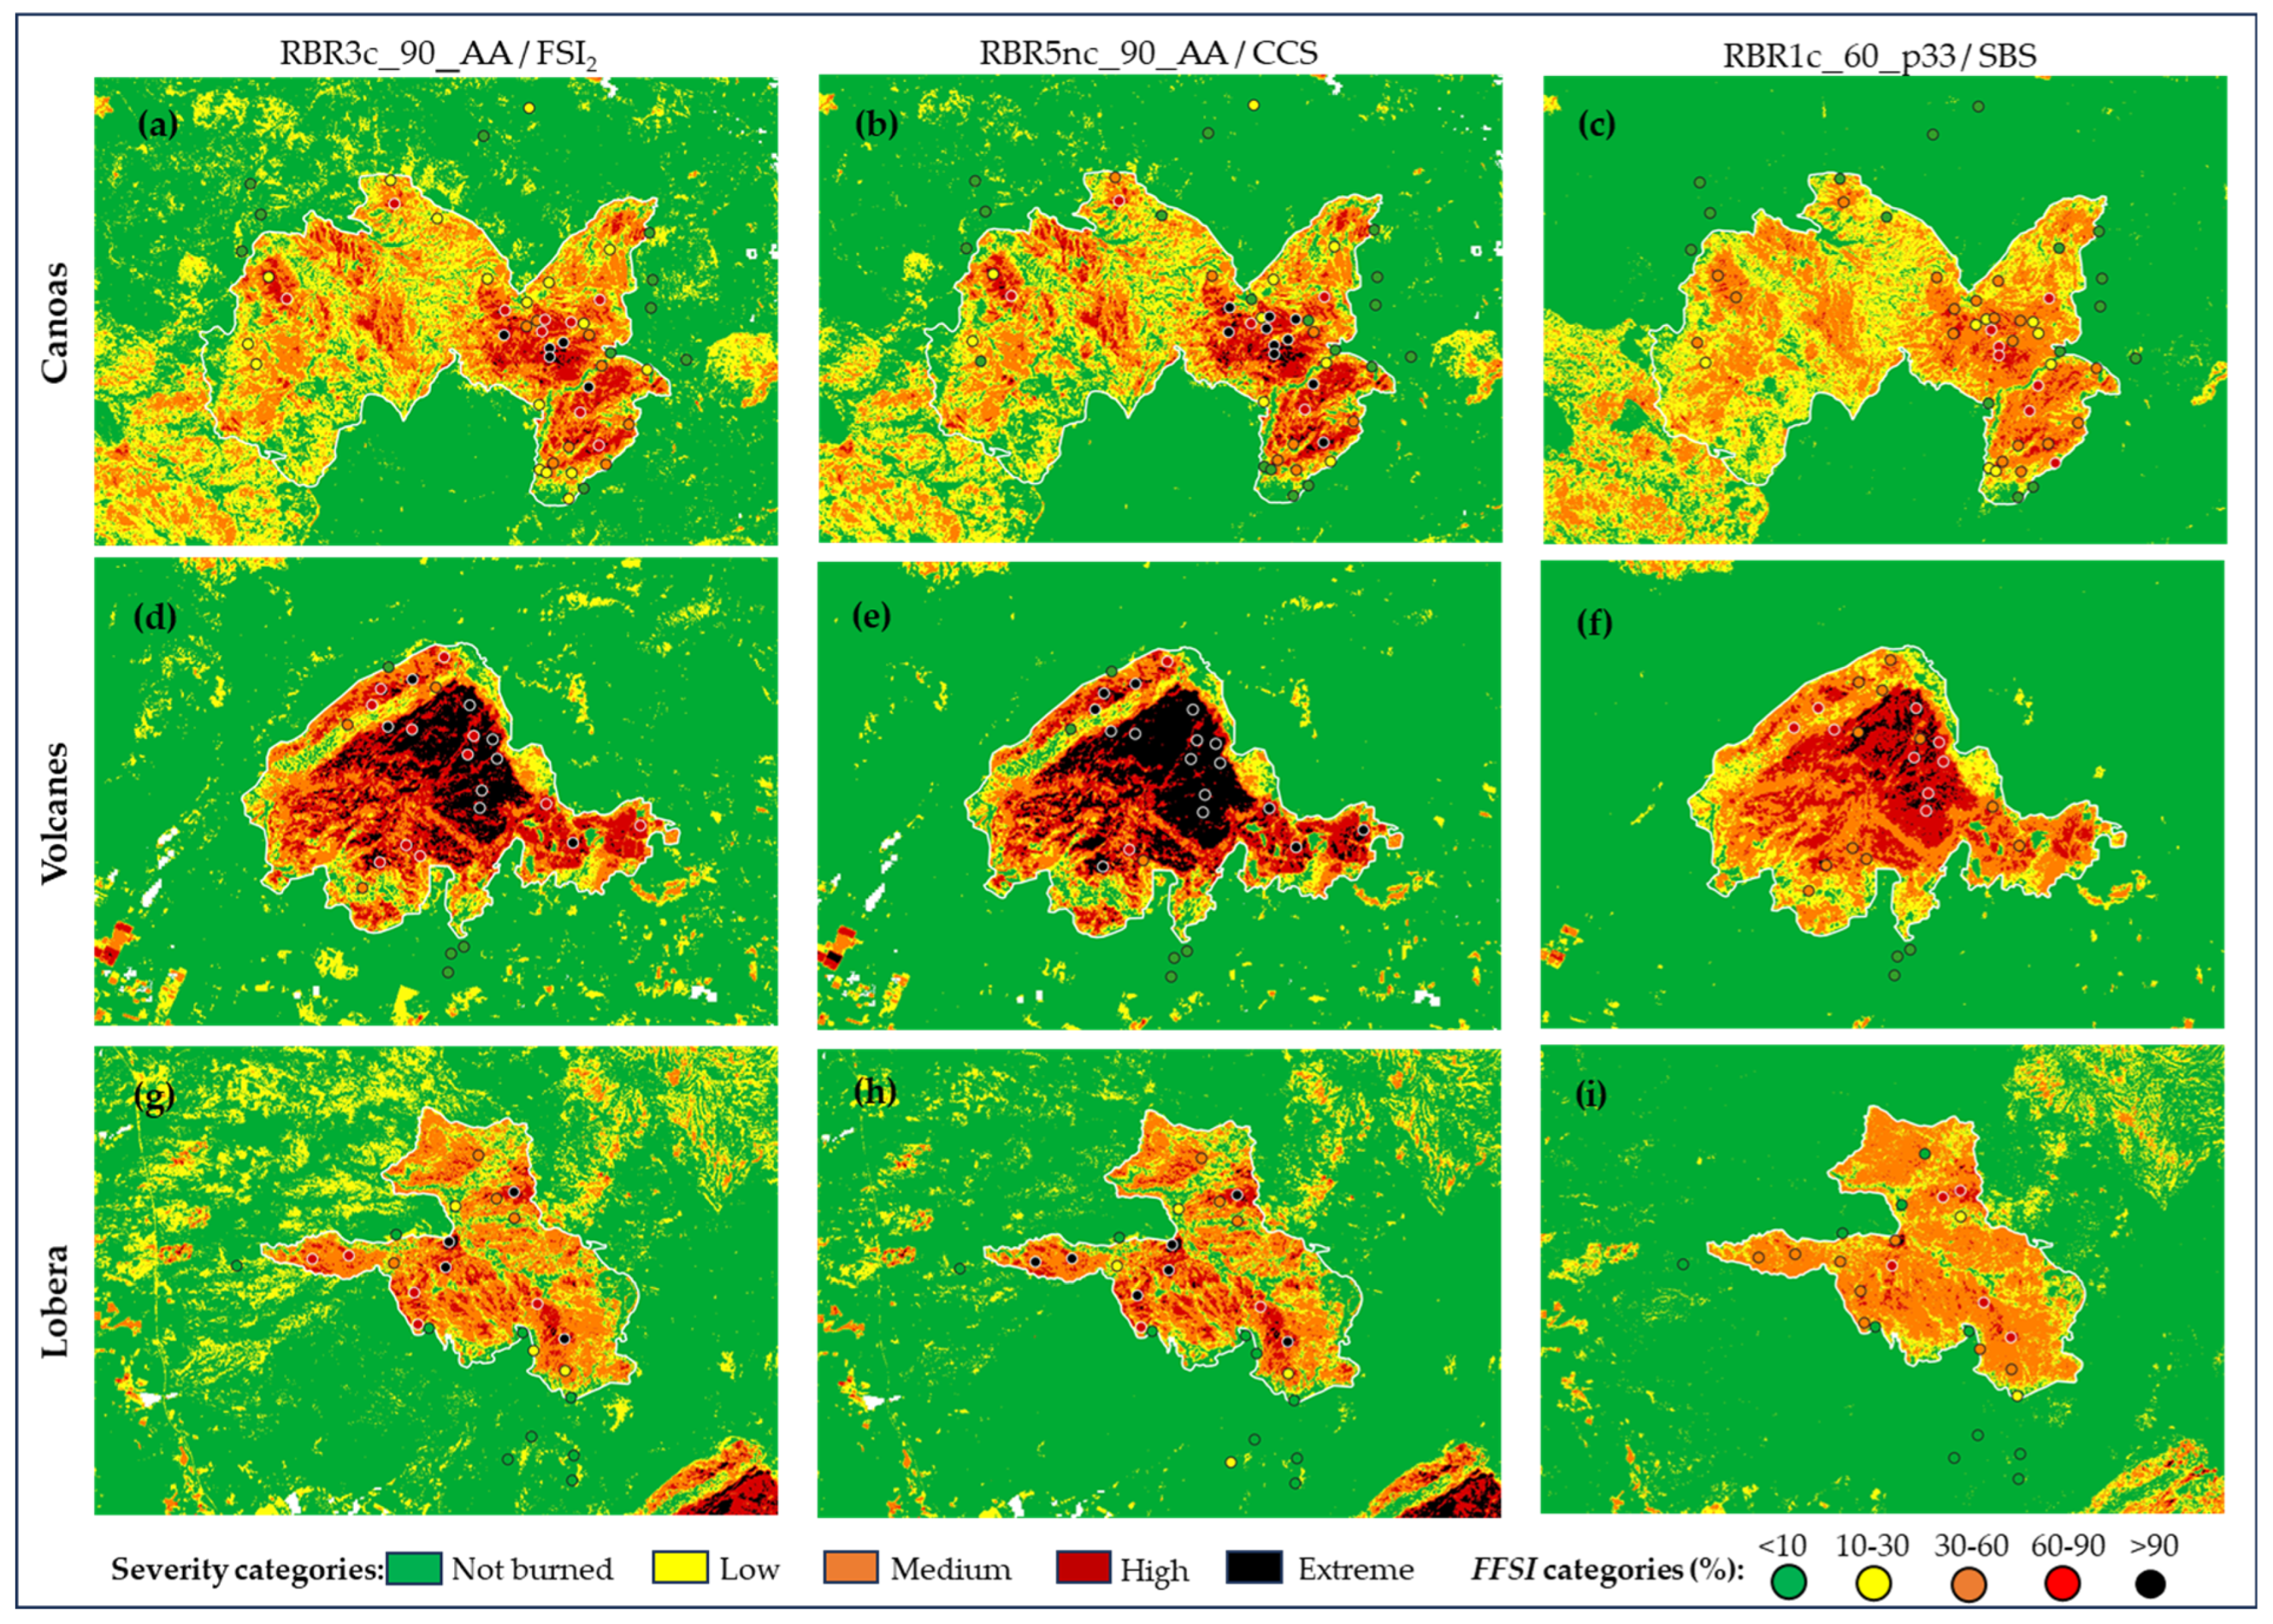
3.2. Mapping Field Fire Severity, Overstory Crown Scorch and Soil Burn Severity

The predicted field fire severity index, overstory crown scorch and soil burn severity maps are shown in Figure 3, based on the selected best fit models for mapping FSI2 (Figure 3a,d,g), OCS (Figure 3b,e,h) and SBS (Figure 3c,f,i) from spectral indices RBR3c_90_AA, RBR5nc_90_AA and RBR1c_60_p33, respectively. Dots represent the field observed values for the FSI2, OCS and SBS.

3.3. Agreement Between Spectral Indices and Field Fire Severity

The agreement between the SFSI and the field indices OCS and FSI2 recorded in the 100 sample plots ranged from fair to substantial (Table 3). FSI2 showed the highest percentage of agreement with the FFSIs, ranging from 58% to 63%, and the Kappa index of agreement values ranged from 0.48 to 0.54 (0.73 to 0.76 when the index was weighted). For SBS, the agreement ranged from fair to moderate (Table 3).

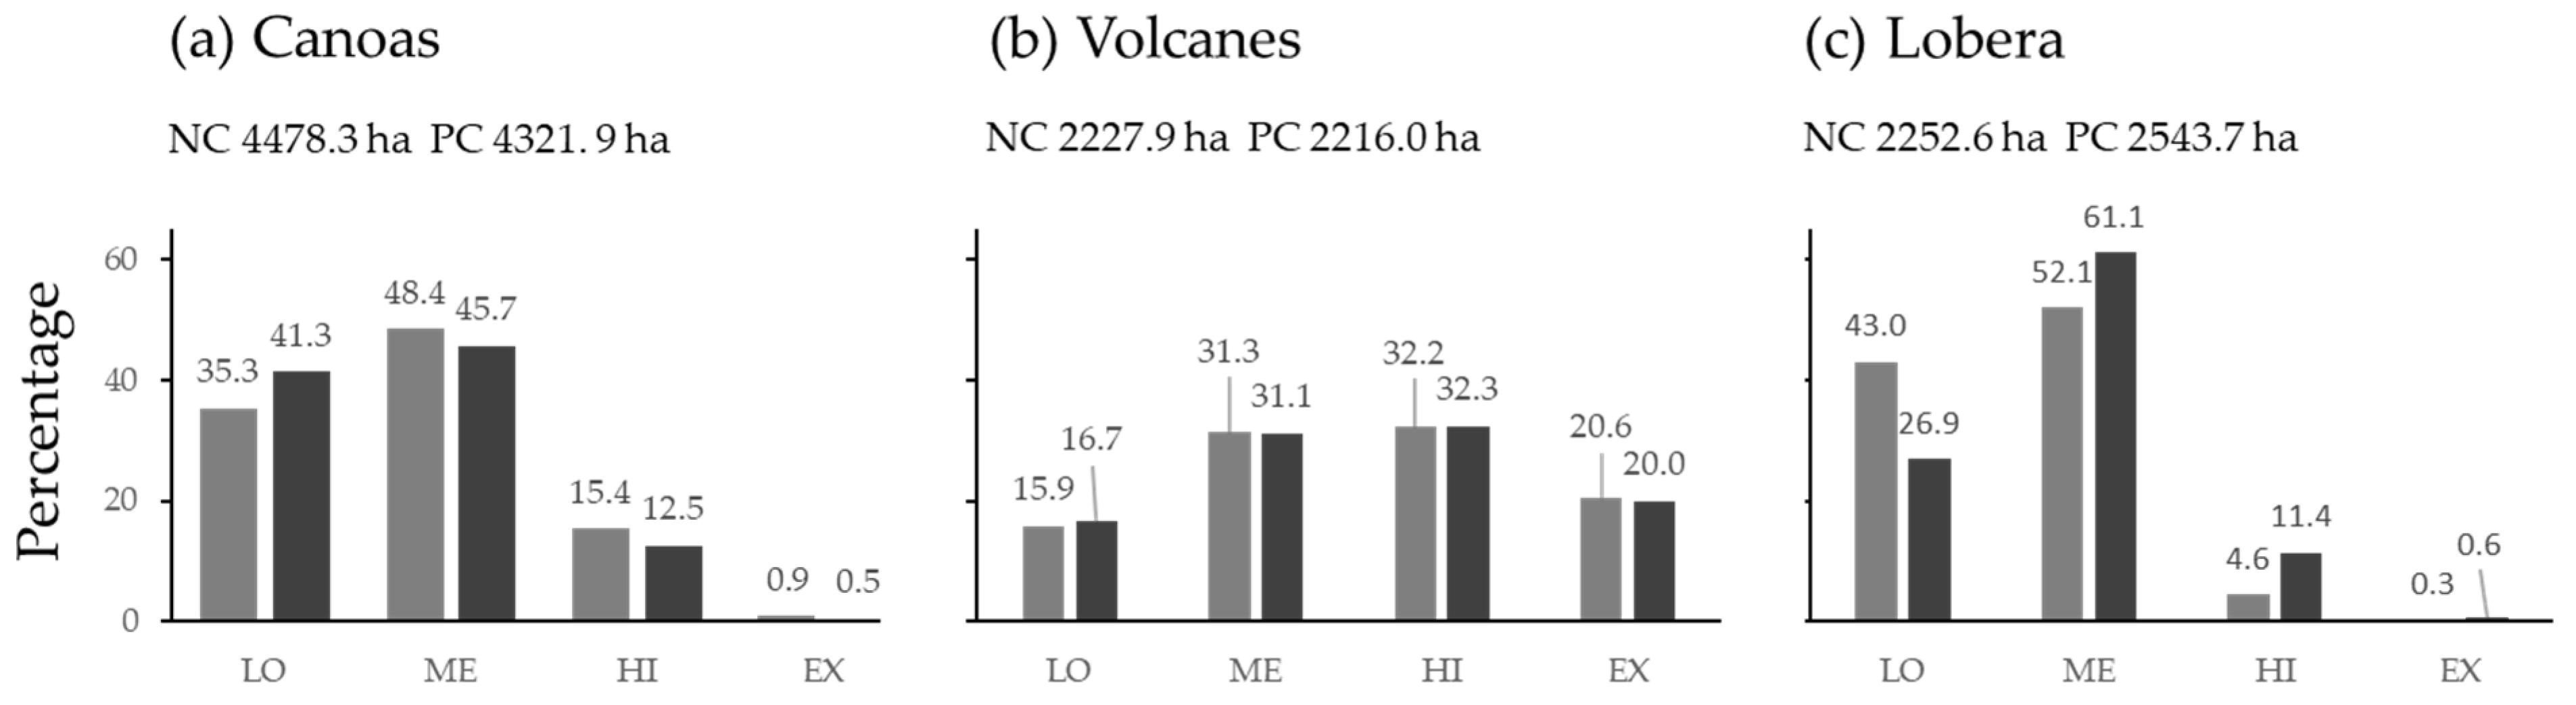
3.4. Agreement Between Predicted Fire Severity Maps

The overall Kappa index of agreement between the predicted fire severity maps based on the three selected spectral indices (Figure 3) was very high (0.87–0.91) between the predicted FSI2 and OCS based on RBR3c and RBR5nc, respectively (Table 4). Lower agreement was observed between these indices and RBR1c (0.64–0.75 against RBR3c and 0.56–0.70 against RBR5nc, Table 4).
The high and extreme severity classes showed the smallest mean agreement (0.42) and the lowest values when comparing the RBR3c and RBR5nc indices with the RBR1c index, but this was not the case for the agreement between RBR3c and RBR5nc, where the values were higher than those for the low and medium classes (Table 4). The maps showed a high accuracy to distinguish between burned and unburned areas (mean Kappa index of 0.91).
Finally, comparing the areas of the maps corresponding to the RBR3_90_AA index with and without phenological correction, it was found that the Canoas and Volcanes fires had a slightly larger total area without correction, and the Lobera fire had a larger area (approximately 300 more has classified as burned) with phenological correction (Figure 4). Differences were also found in the percentages of burned area by severity class, particularly for the Lobera fire (Figure 4c), which occurred towards the end of the dry season, where a larger area (26.9 vs. 43.0%) would be classified as low fire severity when considering the phenological correction.

4. Discussion

The current study evaluated fire severity in vegetation and soil strata for a subhumid deciduous oak and pine forest in Mexico, a type of ecosystem that had comparatively been less explored in the literature. Our results highlight the need to find the most appropriate Sentinel-2 spectral index for each ecosystem type (e.g., [31,32,41,42,46]) and even for each strata (vegetation and soil) (e.g., [31,32,41,52]). Interestingly, different spectral indices were selected for mapping vegetation and soil burn severity, allowing us to map those impacts separately.

4.1. Accuracies in Mapping Field Fire Severity by Strata

For all the evaluated tree strata, the best fit was obtained with RNBR3c (R2 of 0.82, 0.80, 0.80, for OCS, CCS and SCS, respectively—see Supplementary Table S1). The relatively similar performance for the two separated strata (CCS and SCS), compared to the global consideration of OCS supported the selection of the latter to represent the entire overstory damage (Table 2). This might be explained by the relatively homogeneous and continuous crown structure for both strata in our study area [3], that possibly resulted in similar damage levels both in the canopy and subcanopy.
Our observed higher capacity for reflecting the canopy strata fire severity than for UCS and SBS with Sentinel-2 spectral indices (Supplementary Table S1) is consistent with the findings from studies conducted in different geographical areas (e.g., [32,41,52]). The higher correlation with the SFSI obtained by the upper tree canopy stratum, compared to the soil and understory strata, has been corroborated in other research with medium resolution imagery (e.g., [31,32,35,52,69,124,125]). This may be attributed to the limitation of remote sensors in penetrating the upper forest strata (e.g., [31,32,35,41,52,126]). The ability to map the initial damage on tree canopy is relevant for early tree mortality evaluation [18,19,20]. However, mapping OCS alone is not sufficient to prioritize soil protection, since areas with high canopy damage might not have high erosion risk unless also accompanied by a high consumption of organic soil matter and soil structure alteration (high SBS) (e.g., [21,38,40]). In this sense, mapping initial OCS allows us to target areas from the entire fire perimeter, where SBS should be further evaluated to corroborate potential soil erosion risks (e.g., [21,38]). Because it is not uncommon that fire effects on soil might be decoupled from vegetation damage (e.g., [21,32,35]), to guide post-fire management, it is fundamental to also being able to quantify and map SBS, particularly within those areas of full canopy consumption (e.g., [38,40]).
Although, as expected, the soil burn severity correlation with spectral indices was lower than with the overstory strata (R2 of 0.62 and 0.82, respectively), the values of the coefficient of determination can be considered acceptable, particularly for this challenging stratum. Our observed correlations for SBS are relatively similar to those observed by [41] (R2 of 0.68) in open temperate to semiarid pine-dominated forests in North-Western Mexico, or to the observations of [52] (R2 of 0.686 for SBS) or [40] (R2 of 0.55–0.65 for soil physical properties) in pine-dominated forests under Mediterranean conditions in Spain. This might be attributed to the relatively open canopy density of the ecosystems analyzed in this study and in those studies, supporting the notion that SBS might be partially observed in such relatively less dense forests (e.g., [31,40,41]). Contrarily, under wetter climates that result in denser canopies, reported correlations of satellite imagery with SBS from the literature are generally lower. For example, [31] reported higher correlations of SBS with Landsat in drier, more open stands at three locations under Mediterranean and transition climatic gradients (R2 of 0.55, 0.67 and 0.77) than for a wetter, denser Oceanic site (R2 of 0.47). Furthermore, in sites with higher tree density such as boreal forests, the reported ability to map SBS and soil physical properties from medium resolution imagery has been generally much lower (e.g., R2 of <0.3–0.5 [35,126]) than our observations and those from the literature (e.g., [31,40,41,52]) in more open stands, where satellite imagery might be partially capturing the soil post-fire signal.
The R2 values of the composite FSI2 index were higher than those of the individual indices, supporting similar observations by [41] or [70]. This might again suggest that the partial observation of soil strata in low density forests might improve the correlation with spectral indices, although the increase in correlations of FSI2 against OCS was smaller than in [41] study, for the RBR3c and RBR5nc indices selected to map those variables.

4.2. Sentinel-2 Spectral Indices to Map Fire Severity by Strata

4.2.1. Sentinel-2 Spectral Indices to Map Soil Burn Severity

Interestingly, in our study area, RBR1c (based on bands 11 and 12) outperformed RBR3c and RBR5nc (based on bands 8 or 8a and 12) to map soil burn severity (R2 of 0.62 against 0.57, Supplementary Table S1), suggesting that, for this study area, different spectral indices might be preferred to map OCS and SBS separately. This differs from the observations of [41] in NW Mexico, who found a slightly higher correlation for predicting SBS with RBR5nc or RBR3c (R2 of 0.68) than with RBR1c, although they also observed a relatively good accuracy with the latter (R2 of 0.66). Our results might furthermore support observations in other countries where indices based on bands 11 and 12 have shown good capacity to predict SBS [38] and soil physical properties after fire [40]. Furthermore, it might support studies where NBR1 has been found the best index to map burned area [55], sometimes in combination with NBR3 or NBR5n (e.g., [61,62]). This might be related to the capacity of SWIR bands to capture spectral changes caused by increased temperatures, which is commonly used in medium resolution active fire detection (e.g., [127,128]).

4.2.2. Sentinel-2 Spectral Indices to Map Canopy Scorch and Aggregated Fire Severity

Relativized vs. Absolute Indices, Phenological Correction and Composite Period
The best fits for predicting both the overstory crown scorch and the composite field fire severity index were found with relative indices with phenological correction (Table 2 and Supplementary Table S1). The better performance of relative (e.g., RBR) against absolute (e.g., dNBR) spectral indices in our area of study, supports similar previous observations in areas characterized by fuel heterogeneity (e.g., [31,32,41,52,68]).
For phenological correction, its effect was more marked for the Lobera fire (Figure 4), which occurred by the end of the dry season, closer to the start of summer precipitation. For this fire, the observed phenological correction was negative (−63 dNBR units), which implies greening in the unburned area. We therefore speculate that, for this fire, the phenological factor accounted for the observed greening, possibly related to some initial fine fuel buildup after summer precipitation. After correcting for this greening effect, the spectral index more clearly delineated the fire perimeter, resulting in the detection of 300 ha that would have been omitted using burned area thresholds without the consideration of the phenological correction.
Our observed better performance of indices with phenological correction to predict fire severity in areas with open deciduous oak forests and savannas, and complex topography, such as La Primavera Forest, suggest that phenological correction can be especially important for standardizing fire severity assessments. This could mitigate the effects of vegetation change not related to fire, and those caused by plant moisture seasonal patterns and phenological cycles (e.g., [29,41,68]). Such increased performance (gains of up to >0.05 of R2 for most of the spectral indices analyzed using the phenological correction; Supplementary Table S1) supports previous studies reporting similar gains after applying that correction to Landsat (e.g., [68]) or Sentinel [41] composites. These observation seems to confirm its potential to normalize weather and plant phenology effects for fires in different dates (e.g., [41,72,73]).
Regarding the time frame, contrary to studies that have reported some decreases in accuracy for mapping fire severity with increasing period after 30–60 days (e.g., [39,41,56]), we observed a relatively stable correlation of spectral indices with fire severity for all the tested periods (Table 2 and Supplementary Table S1). In general, slightly higher correlations were observed at the 90-day period for canopy and global severity and at 60 days or the SBS. First, this might be explained by the coincidence of those imagery with the field inventory, which was performed 90–60 days after the end of the fires. This seems to support the recommendations to obtain satellite imagery that correspond to the field sampling period (e.g., [39,47]). In this regard, we speculate that it might be possible that the 90-day imagery might have captured some initial tree mortality observed in the coincident time field inventory, resulting in a slightly higher correlation for mapping field observed OCS. Secondly, although we observed some greening, particularly for the Lobera fire, its magnitude, after phenological correction, might be smaller than in other studies (e.g., [39,41]), compared to a stronger and more stable signal of the post-fire canopy damage in this study. On the other hand, the selection of the 60-day interval for the SBS prediction in our study seems to balance both the coincidence with field inventory and the more ephemeral nature of the soil damage. This would reinforce the notion that, for initial SBS monitoring, relatively shorter periods might be preferred to avoid the dilution of the soil signal [41].
Performance of RBR Indices
From the large variety of indices tested, RBRc (using bands 8 or 8a and 12) was confirmed to be the most accurate for prediction of canopy scorch and aggregated fire severity, together with dBAIS2 (Table 2). The RBR index was also selected as the best performing index for predicting canopy and site fire severity in the previous study in NW Mexico by [41] and elsewhere (e.g., [52,67,68]). In general, these results support the frequent use of NBR-based indices (e.g., [33,67,68]), driven by widely documented post-fire NIR decreases and SWIR increases, to monitor fire severity (e.g., [129,130,131,132,133]). NIR drops immediately after fires have been related to combustion damage to leaf mesophyll cells, loss of canopy structure and chlorophyll [129,130,131]. On the other hand, SWIR increases have been related to loss of vegetation moisture, exposure of mineral charred soil and accumulation of char, ash deposition and changes in soil organic matter and mineral composition (e.g., [129,130,131,132,133]).
Unlike studies that reported a higher performance of red edge bands (e.g., [43]), we observed a slightly lower performance of indices based on bands 5–7 compared to RBR based on 8 and 8a, supporting previous observations by [41] in NW Mexico. Regarding selection between the latter two bands, while some studies have reported higher spectral accuracies for NBR calculated with Sentinel-2 band 8a compared with band 8 (e.g., [51]), in our study, very similar accuracies were observed between the RBR3c and RBR5nc (Table 2). Furthermore, maps using those two indices had a mean agreement of 87–91% (Table 4). This suggests that the selection of the band 8 or 8a might be mainly guided by the desired spatial accuracy (20 or 10 m, respectively) of the burn severity and burned area maps (e.g., [54,61]).
Performance of NDVI and SAVI
Our superior performance of NBR compared to NDVI support previous observations that the first SWIR-based index outperforms the latter, based on the Red band, which might be less sensitive to changes in the foliage (e.g., [31,52,134]) or in the soil (e.g., [135]), while other studies have observed the contrary in some locations (e.g., [57,58,59,60,136]), again highlighting the need to evaluate spectral indices by ecosystem type. Specifically, the better performance of NBR than NDVI for determining fire severity in our relatively open seasonally dry deciduous forest supports similar observations for open forests and woodlands (savannas with scattered woody elements) in Australia [42], in sparsely vegetated and grasslands areas in Arizona and New Mexico [137], in oceanic to Mediterranean forests in Spain (e.g., [31,32,52]) and in areas with mid-warm deciduous forests [134].
Regarding SAVI performance, although some studies have suggested that, in areas with sparse vegetation and exposed soil surface, SAVI can outperform NDVI or NBR to predict crown scorch [59] and post-fire vegetation recovery [60], our data showed that NBR was more sensitive than SAVI in discriminating between different levels of severity (Supplementary Table S1), supporting previous observations by [31,52] or [138,139]. The limited performance of SAVI in our study area might be related to the limitations of this index noted by [139], who suggested that SAVI should preferably be used in forests or environments with a single type of vegetation, while other indices can outperform SAVI when vegetation and/or soil are heterogeneous.
Performance of dBAIS2
A good performance was also observed for the index dBAIS2, with similar R2 and even slightly lower RMSE than RBRc to predict OCS (Table 2). These results might support previous observations of a good capacity to distinguish post-fire changes in vegetation using dBAIS2 [140]. Furthermore, some studies have reported a higher burned area separability for dBAIS2 compared to RBR (e.g., [64,65]). Contrarily, other previous studies have found that dBAIS2 was outperformed to predict field burn severity by RBR [66].
In spite of those variations documented in some of the literature, our observed similar performance of RBR and dBAIS2 for canopy and global fire severity prediction support studies that documented that those two indices produce very similar burned area or burn severity maps (e.g., [64,140,141]). For example, Han et al. [141] found a 98% similarity for the burned area obtained using RBR or dBAIS2, and a 96–98% similarity for the burned areas by severity levels using these two indices, which agrees with our observations. In our study, we considered that our data (Table 2) provided no clear evidence for the analyzed fires to support the use of a more complex index such as dBAIS2, (which uses five bands, many of them correlated between them) and, accordingly, we chose to select the more parsimonious index RBRc (based on only two bands) for overstory and site fire severity prediction.
On the other hand, our lower performance of dBAIS2 for SBS prediction (Supplementary Table S1) supports observations by [68], where this index was discarded, in comparison with NBR1, NBR3c and other Sentinel-2 spectral indices, to predict SBS because of a low separability index based on laboratory and field spectral data. Nevertheless, continued evaluation of dBAIS2 and other indices in a wider range of ecosystems should be performed.

4.3. Mapping Canopy Scorch and Soil Burn Severity from Sentinel-2: Management Implications

Our results support that, in areas of relatively low tree density, separated maps for OCS and SBS might be obtained, potentially improving the capacity to guide post-fire management. Regarding composite fire severity indices, our observed high agreement between the predicted OCS and FSI2 (Figure 3) reinforce that, for our study area, the large majority of the spectral variability captured by RBR5cn and RBR3c spectral indexes corresponded to the overstory canopy scorch (Table 2). Consequently, for our study area, it might be preferable to use the predicted OCS map above the composite field index, since OCS is a physical variable that can be more readily used to guide post-fire management decision planning (e.g., [28,32,41]).
The remotely sensed maps of OCS can serve to orient in which areas post-fire mortality effects should not be a concern (low fire severity, with OCS < 30%). In the medium OCS levels (30–60%, shown in orange in Figure 3b,e,h), monitoring for pests might be conducted, given the preference of pests for weakened, but not fully consumed, partially scorched trees (e.g., [142]). In areas of high OCS (>60%, shown in red in Figure 3b,e,h), field inventories should monitor potential tree mortality, which might be generally expected when more than two thirds of the crown is scorched (e.g., [143]). Mortality predictions could be refined based on remotely sensed (LIDAR or field-calibrated satellite) tree dimensions to apply species and tree dimensions-specific mortality models (e.g., [19,143]) which might be later evaluated in extended assessments of tree mortality [144] and post-fire regeneration (e.g., [145,146,147,148]). In this sense, while initial OCS can be an input to mortality forecast models (e.g., [19,143]), those predictions should be corroborate with extended assessments at least 1-year post-fire. Furthermore, forest management actions should consider not only mortality but medium- and long-term recovery several years after fire [145,146,147,148].
Finally, areas of full canopy consumption (extreme OCS, shown in black in Figure 3b,e,h), might be targeted to evaluate potential emergency soil protection measures. Unlike the longer-term forest regeneration evaluation, soil protection measures should be conducted immediately after fire, preferably before the occurrence of the first post-fire precipitation (e.g., [21,100]). For this, the observation of the initial OCS and SBS maps, together with slope, in a GIS system can allow to delineate areas potentially more prone to soil erosion. Within areas of full canopy consumption, areas with high SBS (>3 on a 0–5 scale) and high slopes might be prioritized for the planning of potential soil protection measures (e.g., [40,100]). For our study area, these are mainly located on the central part of the Volcanes fire (Figure 3e,f), where soil erosion hazard was verified in the field and soil protection measures were conducted. Given the limitations of Sentinel-2 to map SBS in denser forests (e.g., [35]), in those cases, predicted OCS maps could be more physically meaningful (e.g., [28,32]) and potentially more useful to orient post-fire management than mapping a predicted composite field severity index (the latter including substrate components that are generally not observed by medium resolution satellites in such denser forests). Such predicted OCS maps could serve to identify areas of full canopy consumption (extreme OCS level). Within those extreme OCS areas, field (e.g., [100,149]) and/or UAV [150] measurements of SBS could be conducted to corroborate the erosion risk, which would help to prioritize areas for emergency soil protection actions (e.g., [100,151]).

4.4. Study Limitations and Future Work

The conclusions from the current study are limited to the ecosystem type (subhumid oak–pine forests of Western Mexico) and evaluation period (initial fire severity assessment in the first 90 days) analyzed. A wider variety of ecosystems should be sampled in future studies to evaluate the transferability of the results and the potential effects of climatic gradients on fire severity determination (e.g., [31,46]). Future studies, with a higher sample size, should perform cross-validation analyses and variations in selected indices and fire severity thresholds between ecosystems.
Although initial soil burn severity and immediate post-fire canopy damage is key for the planning of emergency rehabilitation measures (e.g., [40,100,149]), long-term effects should also be monitored in future studies. In this regard, the extended assessment of tree mortality and vegetation regrowth dynamics (e.g., [145,146,147,148]) should be performed in future studies.
Finally, in spite of the promising results to map SBS from S2 in relatively open forests observed here, remote sensing observation of SBS is inherently challenging not only because of canopy obstruction, but because of the complex spatial heterogeneity generated by fire on the ground. This pyrodiversity (e.g., [152]), with a patch pattern generally smaller in size than the satellite resolution, makes its accurate detection difficult. In this sense, future studies in Mexico will aim at monitoring SBS with UAV multispectral imagery [153] to support finer scale monitoring of strata-specific fire impacts and better guide post-fire management planning.

5. Conclusions

The results of this research allowed to identify the best performing Sentinel-2 spectral indices to map canopy scorch percentage and soil burn severity in a deciduous–pine seasonally dry forest in Western Mexico. The best Sentinel-2 indices for both vegetation, soil and composite field fire severity were relativized indices using a compositing period of 60–90 days, with phenological corrections. In seasonally dry deciduous forests with strong phenological changes during the dry season, the phenological correction can allow for more precise mapping of fire severity, accounting for weather and phenological changes not related to fire.
For overstory canopy scorch percentage (OCS) prediction, the indices RBR3c and RBR5n using NIR (bands 8 and 8a) and SWIR (band 12) provided the best accuracy (R2 = 0.82). Maps using either band 8 or 8a were similar, so that the selection of the NIR band can be guided by the desired spatial resolution (20 or 10 m, respectively). A very high accuracy (kappa > 0.9) was observed in distinguishing burned from unburned areas based on the selected indices. For our study area, the composite field fire severity index and OCS prediction models and maps based on RBR3c and RBR5n were very similar, suggesting a higher utility of mapping OCS instead of a composite index, given its physical meaning, to support post-fire management planning. Areas of medium predicted OCS (30–60%) can be monitored for pests; in areas of high predicted OCS (>60%) tree mortality and post-fire regeneration can be monitored and, finally, areas of extreme (>90%) OCS can be targeted for evaluation of soil erosion hazard and planning potential emergency soil protection actions.
SBS could be mapped from Sentinel-2 imagery with relatively acceptable precision (R2 = 0.62) in our study area, possibly because of relatively open tree canopy. The best index for mapping SBS was RBR1c, based on 11 and 12 bands. Our results support the potential to separately map OCS and SBS, based on different Sentinel-2 spectral indices (RBR3c or 5nc for OCS and RBR1c for SBS), in relatively open oak–pine subhumid forests. Within areas of extreme OCS (full canopy consumption), high slope and high SBS (>3 on a 0–5 scale), soil erosion evaluation and potential emergency soil protections could be prioritized.
Continued evaluation of spectral indices to map strata-specific fire severity in a variety of ecoregions and vegetation types is required, to assess the transferability of the results and potential variations caused by differences in climate, soils and vegetation responses to fire. Furthermore, the potential of UAV for finer scale separated mapping of fire impacts on soil and vegetation should be evaluated in future studies.

Supplementary Materials

The following supporting information can be downloaded at: https://www.mdpi.com/article/10.3390/rs17132307/s1, Table S1. Results of the regression analysis of the average composited spectral severity indices (SFSI) against the field indices (FFSI) OCS (overstory crown scorch %), CCS (canopy crown scorch %), SCS (subcanopy crown scorch %), UCS (understory crown scorch %), SBS (soil burn severity), FSI1 (Field Fire Severity Index 1; Equation (1)); and FSI2 (Field Fire Severity Index 2; Equation (2)); Table S2. Thresholds obtained from the simple linear regression models between the spectral severity indices (SFSI) and the field indices CCS, SBS and FSI2 used in Figure 2; Table S3. Selected thresholds obtained from the simple linear regression models between the spectral severity indices (SFSI) and the field indices CCS, SBS and FSI2 used in Figure 3 to map forecasted CCS, SBS and FSI2.

Author Contributions

O.E.B.M.: field data collection, formal analysis, writing—original draft; E.J.J.P.: formal analysis, writing—original draft; D.J.V.-N.: conceptualization, methodology, writing—review and editing; A.I.S.-C.: methodology, programming, field data collection; R.C.G.: formal analysis, writing—original draft. All authors have read and agreed to the published version of the manuscript.

Funding

Funding for this study was provided by CONAFOR/CONACYT Project “CO-2018-2-A3-S-131553, Reforzamiento al Sistema Nacional de Predicción de Peligro de Incendios Forestales de México para el pronóstico de conglomerados y área quemada (2019-2022)”, for the enhancement of the Forest Fire Danger Prediction System of Mexico to map and forecast active fire perimeters and burned area, funded by the Sectorial Fund for forest research, development and technological innovation “Fondo Sectorial para la investigación, el desarrollo y la innovación tecnológica forestal”. The first author received PRODEP and CONAHCYT scholarships for the development of their doctoral studies.

Data Availability Statement

MODIS and VIIRS active fire data used in the study can be accessed from FIRMS: https://firms.modaps.eosdis.nasa.gov/active_fire/ (accessed on 26 March 2022). Aggregated active fire perimeters for the study period analyzed are publicly available through the Forest Fire Danger Prediction System of Mexico: http://forestales.ujed.mx/incendios2/ (accessed on 14 May 2025). Sentinel-2 single-date L1C images can be freely downloaded from the United States Geological Survey (USGS) Monthly composite indices of Sentinel-2 processing level 2A: bottom-of-atmosphere (GEE dataset ID: ee.ImageCollection (“COPERNICUS/S2_SR”)) imagery can be freely accessed from Google Earth Engine. Field fire severity from this study may be accessed upon request to the authors.

Acknowledgments

We would like to thank the staff of the fire brigades and park rangers of the Decentralized Public Organization Bosque La Primavera for the information and facilities provided to carry out the field work, and C. Aguirre, A. Silva, D. Pérez, J. Hernández, C. Terrones, J. Guerrero, J. Aragón. A. Arreola and F. Guzmán for their support in recording data in the field. We thank CONAFOR personnel for their continued support for the expansion of the Forest Fire Danger System of Mexico, including the validation of Sentinel-2 imagery for mapping burned area and severity.

Conflicts of Interest

The authors declare no conflicts of interest. The funders had no role in the study design, data collection, analysis, or interpretation, writing of the manuscript or the decision to publish the results.

References

  1. Guo, F.; Su, Z.; Wang, G.; Sun, L.; Tigabu, M.; Yang, X.; Hu, H. Understanding fire drivers and relative impacts in different Chinese forest ecosystems. Sci. Total Environ. 2017, 605–606, 411–425. [Google Scholar] [CrossRef] [PubMed]
  2. Ahn, Y.S.; Ryu, S.-R.; Lim, J.; Lee, C.H.; Shin, J.H.; Choi, W.; Lee, B.; Jeong, J.-H.; An, K.W.; Seo, J. Effects of forest fires on forest ecosystems in eastern coastal areas of Korea and an overview of restoration projects. Landsc. Ecol. Eng. 2014, 10, 229–237. [Google Scholar] [CrossRef]
  3. Jardel-Peláez, E.J. Programa de Manejo del Fuego del Bosque La Primavera; Organismo Público Descentralizado Bosque La Primavera—Universidad de Guadalajara: Zapopan, Jalisco, México, 2020; p. 244. Available online: https://bosquelaprimavera.com/manejo-fuego/ (accessed on 10 March 2023).
  4. Kelly, L.T.; Giljohann, K.M.; Duane, A.; Aquilué, N.; Archibald, S.; Batllori, E.; Bennette, A.F.; Buckland, S.T.; Canelles, Q.; Clarke, M.F.; et al. Fire and biodiversity in the Anthropocene. Science 2020, 370, eabb0355. [Google Scholar] [CrossRef]
  5. Sannigrahi, S.; Pilla, F.; Basu, B.; Basu, A.S.; Sarkar, K.; Chakraborti, S.; Joshi, P.K.; Zhang, Q.; Wang, Y.; Bhatt, S.; et al. Examining the effects of forest fire on terrestrial carbon emission and ecosystem production in India using remote sensing approaches. Sci. Total Environ. 2020, 725, 138331. [Google Scholar] [CrossRef]
  6. Zheng, B.; Ciais, P.; Chevallier, F.; Chuvieco, E.; Chen, Y.; Yang, H. Increasing forest fire emissions despite the decline in global burned area. Sci. Adv. 2021, 7, eabh2646. [Google Scholar] [CrossRef]
  7. Ghorbanzadeh, O.; Blaschke, T.; Gholamnia, K.; Aryal, J. Forest fire susceptibility and risk mapping using social/infrastructural vulnerability and environmental variables. Fire 2019, 2, 50. [Google Scholar] [CrossRef]
  8. Chen, Y.; Hall, J.; van Wees, D.; Andela, N.; Hantson, S.; Giglio, L.; van deer Werf, G.R.; Morton, D.C.; Randerson, J.T. Multi-decadal trends and variability in burned area from the fifth version of the Global Fire Emissions Database (GFED5). Earth Syst. Sci. Data. 2023, 15, 5227–5259. [Google Scholar] [CrossRef]
  9. Andela, N.; Morton, D.C.; Giglio, L.; Chen, Y.; van der Werf, G.R.; Kasibhatla, P.S.; Defries, R.S.; Collatz, G.J.; Hantson, S.; Kloster, S.; et al. A human-driven decline in global burned area. Science 2017, 356, 1356–1362. [Google Scholar] [CrossRef] [PubMed]
  10. Zubkova, M.; Humber, M.L.; Giglio, L. Is global burned area declining due to cropland expansion? How much do we know based on remotely sensed data? Int. J. Remote Sens. 2023, 44, 1132–1150. [Google Scholar] [CrossRef]
  11. Fernández-García, V.; Alonso-González, E. Global patterns and dynamics of burned area and burn severity. Remote Sens. 2023, 15, 3401. [Google Scholar] [CrossRef]
  12. Keeley, J.E. Fire intensity, fire severity and burn severity: A brief review and suggested usage. Int. J. Wildland Fire 2009, 18, 116–126. [Google Scholar] [CrossRef]
  13. Agee, J.K. Fire ecology of Pacific Northwest forests; Island Press: Washington, DC, USA, 1993. [Google Scholar]
  14. Key, C.H. Ecological and sampling constraints on defining landscape fire severity. Fire Ecol. 2006, 2, 34–59. [Google Scholar] [CrossRef]
  15. Kasischke, E.S.; Hoy, E.E.; French, N.H.F.; Turetky, M.R. Towards an Operational Use of Remote Sensing in Forest Fire Management. In Proceedings of the 6th International Workshop of the EARSeL Special Interest Group on Forest Fires: Advances in Remote Sensing and GIS Applications in Forest Fire Management; Gitas, I.Z., Carmona-Moreno, C., Eds.; Europan Comision: Thessaloniki, Greece, 2007; pp. 38–56. Available online: https://www.researchgate.net/publication/262004437_Towards_an_Operational_Use_of_Remote_Sensing_in_Forest_Fire_Management (accessed on 12 February 2024).
  16. Estes, B.L.; Knapp, E.E.; Skinner, C.N.; Miller, J.D.; Preisler, H.K. Factors influencing fire severity under moderate burning conditions in the Klamath Mountains, northern California, USA. Ecosphere 2017, 8, e01794. [Google Scholar] [CrossRef]
  17. Taylor, A.H.; Harris, L.B.; Drury, S.A. Drivers of fire severity shift as landscapes transition to an active fire regime, Klamath Mountains, USA. Ecosphere 2021, 12, e03734. [Google Scholar] [CrossRef]
  18. Hood, S.M.; Varner, J.M. Post-fire tree mortality. In Encyclopedia of Wildfires and Wildland-Urban Interface (WUI) Fires; Manzello, S.M., Ed.; Springer: Berlin/Heidelberg, Germany, 2019. [Google Scholar] [CrossRef]
  19. Cansler, C.A.; Hood, S.M.; Varner, J.M.; van Mantgem, P.J.; Agne, M.C.; Andrus, R.A.; Ayres, M.P.; Ayres, B.D.; Bakker, J.D.; Battaglia, M.A.; et al. The fire and tree mortality database, for empirical modeling of individual tree mortality after fire. Sci. Data 2020, 7, 194. [Google Scholar] [CrossRef] [PubMed]
  20. Kwon, S.; Kim, S.; Kim, J.; Kang, W.; Park, K.-H.; Kim, C.-B.; Girona, M.M. Predicting post-fire tree mortality in a temperate pine forest, Korea. Sustainability 2021, 13, 569. [Google Scholar] [CrossRef]
  21. Vega, J.A.; Fontúrbel, T.; Merino, A.; Fernández, C.; Ferreiro, A.; Jiménez, E. Testing the ability of visual indicators of soil burn severity to reflect changes in soil chemical and microbial properties in pine forests and shrubland. Plant Soil. 2013, 369, 73–91. [Google Scholar] [CrossRef]
  22. Zavala, L.; de Celis, R.; Jordán, A. How wildfires affect soil properties. A brief review. Geogr. Res. Lett. 2014, 40, 311–332. [Google Scholar] [CrossRef]
  23. Cadena, D.A.; Flores-Garnica, J.G.; Flores-Rodríguez, A.G.; Lomelí-Zavala, M.E. Efecto de incendios en la vegetación de sotobosque y propiedades químicas de suelo de bosques templados. Agro Product. 2020, 13, 65–72. [Google Scholar] [CrossRef]
  24. Prichard, S.; Larkin, N.; Ottmar, R.; French, N.; Baker, K.; Brown, T.; Clements, C.; Dickinson, M.; Hudak, A.; Kochanski, A.; et al. The fire and smoke model evaluation experiment—A plan for integrated, large fire– atmosphere field campaigns. Atmosphere 2019, 10, 66. [Google Scholar] [CrossRef]
  25. Balde, B.; Vega-Garcia, C.; Gelabert, P.J.; Ameztegui, A.; Rodrigues, M. The relationship between fire severity and burning efficiency for estimating wildfire emissions in Mediterranean forests. J. For. Res. 2023, 34, 1195–1206. [Google Scholar] [CrossRef]
  26. Fernández-Guisuraga, J.M.; Marcos, E.; de Miera, L.E.S.; Ansola, G.; Pinto, R.; Calvo, L. Short-term responses of ecosystem multifunctionality to fire severity are modulated by fire-induced impacts on plant and soil microbial communities. Sci. Total Environ. 2023, 898, 165477. [Google Scholar] [CrossRef]
  27. Santiesteban-Serrano, A.; Rincón, A.; Aponte, C. Does wildfire severity reduce soil multifunctionality in the short-term? A matter of depth. Ecol. Indic. 2025, 175, 113500. [Google Scholar] [CrossRef]
  28. Morgan, P.; Keane, R.E.; Dillon, G.K.; Jain, T.B.; Hudak, A.T.; Karau, E.C.; Sikkink, P.G.; Holden, Z.A.; Strand, E.K. Challenges of assessing fire and burn severity using field measures, remote sensing and modelling. Int. J. Wildland Fire 2014, 23, 1045–1060. [Google Scholar] [CrossRef]
  29. Picotte, J.J.; Bhattarai, K.; Howard, D.; Lecker, J.; Epting, J.; Quayle, B.; Benson, N.; Nelson, K. Changes to the Monitoring Trends in Burn Severity program mapping production procedures and data products. Fire Ecol. 2020, 16, 16. [Google Scholar] [CrossRef]
  30. Han, D.; Di, X.; Yang, G.; Sun, L.; Weng, Y. Quantifying fire severity: A brief review and recommendations for improvement. Ecosyst. Health Sustain. 2021, 7, 1973346. [Google Scholar] [CrossRef]
  31. Fernández-García, V.; Santamarta, M.; Fernández-Manso, A.; Quintano, C.; Marcos, E.; Calvo, L. Burn severity metrics in fire-prone pine ecosystems along a climatic gradient using Landsat imagery. Remote Sens. Environ. 2018, 206, 205–217. [Google Scholar] [CrossRef]
  32. Fernández-Guisuraga, J.M.; Fernandes, P.M.; Marcos, E.; Beltrán-Marcos, D.; Sarricolea, P.; Farris, M.; Calvo, L. Caution is needed across Mediterranean ecosystems when interpreting wall-to-wall fire severity estimates based on spectral indices. For. Ecol. Manag. 2023, 546, 121383. [Google Scholar] [CrossRef]
  33. Key, C.H.; Benson, N.C. Ground measure of severity, the Composite Burn Index; and remote sensing of severity, the Normalized Burn Ratio, FIREMON landscape assessment documents. In FIREMON Fire Effects Monitoring and Inventory SystemI; RMRS-GTR-164; US Department of Agriculture, Forest Service, Rocky Mountain Research Station: Fort Collins, CO, USA, 2006; General Technical Report; pp. LA-1, LA-55. Available online: https://www.researchgate.net/publication/241687027_Landscape_Assessment_Ground_measure_of_severity_the_Composite_Burn_Index_and_Remote_sensing_of_severity_the_Normalized_Burn_Ratio (accessed on 14 November 2024).
  34. De Santis, A.; Chuvieco, E. GeoCBI: A modified version of the Composite Burn Index for the initial assessment of the short-term burn severity from remotely sensed data. Remote Sens. Environ. 2009, 113, 554–562. [Google Scholar] [CrossRef]
  35. French, N.H.; Kasischke, E.S.; Hall, R.J.; Murphy, K.A.; Verbyla, D.L.; Hoy, E.E.; Allen, J.L. Using Landsat data to assess fire and burn severity in the North American boreal forest region: An overview and summary of results. Int. J. Wildland Fire 2008, 17, 443–462. [Google Scholar] [CrossRef]
  36. Lentile, L.B.; Smith, A.M.; Hudak, A.T.; Morgan, P.; Bobbitt, M.J.; Lewis, S.A.; Robichaud, P.R. Remote sensing for prediction of 1-year post-fire ecosystem condition. Int. J. Wildland Fire 2009, 18, 594–608. [Google Scholar] [CrossRef]
  37. McCarley, T.R.; Smith, A.M.; Kolden, C.A.; Kreitler, J. Evaluating the Mid-Infrared Bi-spectral Index for improved assessment of low-severity fire effects in a conifer forest. Int. J. Wildland Fire 2018, 27, 407–412. [Google Scholar] [CrossRef]
  38. Llorens, R.; Sobrino, J.A.; Fernández, C.; Fernández-Alonso, J.M.; Vega, J.A. Soil Burn Severity Assessment Using Sentinel-2 and Radiometric Measurements. Fire 2024, 7, 487. [Google Scholar] [CrossRef]
  39. Veraverbeke, S.; Lhermitte, S.; Verstraeten, W.W.; Goossens, R. The temporal dimension of differenced Normalized Burn Ratio (dNBR) fire/burn severity studies: The case of the large 2007 Peloponnese wildfires in Greece. Remote Sens. Environ. 2010, 114, 2548–2563. [Google Scholar] [CrossRef]
  40. Fernández, C.; Fernández-Alonso, J.M.; Vega, J.A.; Fontúrbel, T.; Llorens, R.; Sobrino, J.A. Exploring the use of spectral indices to assess alterations in soil properties in pine stands affected by crown fire in Spain. Fire Ecol. 2021, 17, 2. [Google Scholar] [CrossRef]
  41. Silva-Cardoza, A.I.; Vega-Nieva, D.J.; Briseño-Reyes, J.; Briones-Herrera, C.I.; López-Serrano, P.M.; Corral-Rivas, J.J.; Parks, S.A.; Holsinger, L.M. Evaluating a new relative phenological correction and the effect of Sentinel-based earth engine compositing approaches to map fire severity and burned area. Remote Sens. 2022, 14, 3122. [Google Scholar] [CrossRef]
  42. Tran, B.; Tanase, M.; Bennett, L.; Aponte, C. Evaluation of spectral indices for assessing fire severity in australian temperate forests. Remote Sens. 2018, 10, 1680. [Google Scholar] [CrossRef]
  43. Fernández-Manso, A.; Fernández-Manso, O.; Quintano, C. SENTINEL-2A red-edge spectral indices suitability for discriminating burn severity. Int. J. Appl. Earth Obs. Geoinf. 2016, 50, 170–175. [Google Scholar] [CrossRef]
  44. Moya, D.; Madrigal, J.; Fontúrbel, T.; Marino, E.; Hernando, C.; Guijarro, M.; de las Heras, J. Fire severity assessments in both the laboratory and the field. Fire Eff. Soil. Prop. 2019, 241, 241–266. [Google Scholar]
  45. Soulard, C.E.; Albano, C.M.; Villarreal, M.L.; Walker, J.J. Continuous 1985–2012 Landsat Monitoring to Assess Fire Effects on Meadows in Yosemite National Park, California. Remote Sens. 2016, 8, 371. [Google Scholar] [CrossRef]
  46. Parks, S.A.; Holsinger, L.M.; Koontz, M.J.; Collins, L.; Whitman, E.; Parisien, M.A.; Loehman, R.A.; Barnes, J.L.; Bourdon, J.F.; Boucher, J.; et al. Giving ecological meaning to satellite-derived fire severity metrics across North American forests. Remote Sens. 2019, 11, 1735. [Google Scholar] [CrossRef]
  47. Picotte, J.J.; Cansler, C.A.; Kolden, C.A.; Lutz, J.A.; Key, C.; Benson, N.C.; Robertson, K.M. Determination of burn severity models ranging from regional to national scales for the conterminous United States. Remote Sens. Environ. 2021, 263, 112569. [Google Scholar] [CrossRef]
  48. Whitman, E.; Parisien, M.A.; Holsinger, L.M.; Park, J.; Parks, S.A. A method for creating a burn severity atlas: An example from Alberta, Canada. Int. J. Wildland Fire 2020, 29, 995–1008. [Google Scholar] [CrossRef]
  49. Holsinger, L.M.; Parks, S.A.; Saperstein, L.B.; Loehman, R.A.; Whitman, E.; Barnes, J.; Parisien, M.A. Improved fire severity mapping in the North American boreal forest using a hybrid composite method. Remote Sens. Ecol. Conserv. 2021, 8, 222–235. [Google Scholar] [CrossRef]
  50. Arellano, S.; Vega, J.A.; Rodríguez y Silva, F.; Fernández, C.; Vega-Nieva, D.; Álvarez-González, J.G.; Ruiz-González, A.D. Validación de los índices de teledetección dNBR y RdNBR para determinar la severidad del fuego en el incendio forestal de Oia-O Rosal (Pontevedra) en 2013. Rev. De. Teledetección 2017, 49, 49–61. [Google Scholar] [CrossRef]
  51. Mallinis, G.; Mitsopoulos, I.; Chrysafi, I. Evaluating and comparing Sentinel 2A and Landsat-8 Operational Land Imager (OLI) spectral indices for estimating fire severity in a Mediterranean pine ecosystem of Greece. GISci. Remote Sens. 2017, 55, 1–18. [Google Scholar] [CrossRef]
  52. García-Llamas, P.; Suárez-Seoane, S.; Fernández-Guisuraga, J.M.; Fernández-García, V.; Fernández-Manso, A.; Quintano, C.; Taboada, A.; Marcos, E.; Calvo, L. Evaluation and comparison of Landsat 8, Sentinel-2 and Deimos-1 remote sensing indices for assessing burn severity in Mediterranean fire-prone ecosystems. Int. J. Appl. Earth Obs. Geoinf. 2019, 80, 137–144. [Google Scholar] [CrossRef]
  53. Navarro, G.; Caballero, I.; Silva, G.; Parra, P.C.; Vázquez, Á.; Caldeira, R. Evaluation of forest fire on Madeira Island using Sentinel-2A MSI imagery. Int. J. Appl. Earth Obs. Geoinf. 2017, 58, 97–106. [Google Scholar] [CrossRef]
  54. Howe, A.A.; Parks, S.A.; Harvey, B.J.; Saberi, S.J.; Lutz, J.A.; Yocom, L.L. Comparing Sentinel-2 and Landsat 8 for burn severity mapping in Western North America. Remote Sens. 2022, 14, 5249. [Google Scholar] [CrossRef]
  55. Sobrino, J.A.; Llorens, R.; Fernández, C.; Fernández-Alonso, J.M.; Vega, J.A. Methodology for burned areas delimitation and fire severity assessment using Sentinel-2 data. A case study of forest fires occurred in Spain between 2018 and 2023. Recent. Adv. Remote Sens. 2024, 1–15. Available online: https://www.recentadvancesin.com/remote-sensing/3020-6448-rars240002/ (accessed on 14 May 2025). [CrossRef]
  56. Llorens, R.; Sobrino, J.A.; Fernández, C.; Fernández-Alonso, J.M.; Vega, J.A. A methodology to estimate forest fires burned areas and burn severity degrees using Sentinel-2 data. Application to the October 2017 fires in the Iberian Peninsula. Int. J. Appl. Earth Obs. Geoinf. 2021, 95, 102243. [Google Scholar] [CrossRef]
  57. Chafer, C.J.; Noonan, M.; Macnaught, E. The post-fire measurement of fire severity and intensity in the Christmas 2001 Sydney wildfires. Int. J. Wildland Fire 2004, 13, 227–240. [Google Scholar] [CrossRef]
  58. Hammill, K.A.; Bradstock, R.A. Remote sensing of fire severity in the Blue Mountains: Influence of vegetation type and inferring fire intensity. Int. J. Wildland Fire 2006, 15, 213–226. [Google Scholar] [CrossRef]
  59. Arnett, J.T.T.R.; Coops, N.C.; Daniels, L.D.; Falls, R.W. Detecting forest damage after a low-severity fire using remote sensing at multiple scales. Int. J. Appl. Earth Obs. Geoinf. 2015, 35, 239–246. [Google Scholar] [CrossRef]
  60. Mahdi, S.A.; Jasim, S.N. Detection of Vegetation Cover Changes from 1988–2022 in the University of Baghdad Campus by Remote Sensing and GIS Techniques (Normalized Difference Vegetation Index (NDVI) and Soil-Adjusted Vegetation Index (SAVI). IOP Conf. Ser.: Earth Environ. Sci. 2023, 1262, 042054. [Google Scholar] [CrossRef]
  61. Roteta, E.; Bastarrika, A.; Franquesa, M.; Chuvieco, E. Landsat and Sentinel-2 based burned area mapping tools in Google Earth Engine. Remote Sens. 2021, 13, 816. [Google Scholar] [CrossRef]
  62. Bastarrika, A.; Rodriguez-Montellano, A.; Roteta, E.; Hantson, S.; Franquesa, M.; Torre, L.; Gonzalez-Ibarzabal, J.; Artano, K.; Martinez-Blanco, P.; Mesanza, A.; et al. An Automatic Procedure for Mapping Burned areas Globally Using Sentinel-2 and VIIRS/MODIS Active Fires in Google Earth Engine. ISPRS J. Photogramm. Remote Sens. 2024, 218, 232–245. [Google Scholar] [CrossRef]
  63. Filipponi, F. BAIS2: Burned Area Index for Sentinel-2. Proceedings 2018, 2, 364. [Google Scholar] [CrossRef]
  64. Merhej, O. Evaluation of several spectral indices to produce post fire maps (Case study: Cedar-Fir Protected Area, Syria). Syr. J. Agric. Res.–SJAR 2023, 10, 284–294. [Google Scholar]
  65. Farhadi, H.; Mokhtarzade, M.; Ebadi, H.; Beirami, B.A. Rapid and automatic burned area detection using Sentinel-2 time-series images in google earth engine cloud platform: A case study over the Andika and Behbahan Regions, Iran. Environ. Monit. Assess. 2022, 194, 369. [Google Scholar] [CrossRef]
  66. Amroussia, M.; Viedma, O.; Achour, H.; Abbes, C. Predicting spatially explicit Composite Burn Index (CBI) from different spectral indices derived from Sentinel 2A: A case of study in Tunisia. Remote Sens. 2023, 15, 335. [Google Scholar] [CrossRef]
  67. Parks, S.A.; Dillon, G.K.; Miller, C. A new metric for quantifying burn severity: The relativized burn ratio. Remote Sens. 2014, 6, 1827–1844. [Google Scholar] [CrossRef]
  68. Parks, S.A.; Holsinger, L.M.; Voss, M.A.; Loehman, R.A.; Robinson, N.P. Mean composite fire severity metrics computed with Google Earth Engine offer improved accuracy and expanded mapping potential. Remote Sens. 2018, 10, 879. [Google Scholar] [CrossRef]
  69. Zhu, Z.; Key, C.; Ohlen, D.; Benson, N. Evaluate Sensitivities of Burn-Severity Mapping Algorithms for Different Ecosystems and Fire Histories in the United States. In Final Report to the Joint Fire Science Program; JFSP 01-1-4-12; Joint Fire Science Program: Boise, ID, USA, 2006; 36p, Available online: https://www.researchgate.net/publication/228988753_Evaluate_Sensitivities_of_Burn-Severity_Mapping_Algorithms_for_Different_Ecosystems_and_Fire_Histories_in_the_United_States (accessed on 18 November 2024).
  70. Allen, J.L.; Sorbel, B. Assessing the differenced Normalized Burn Ratio’s ability to map burn severity in the boreal forest and tundra ecosystems of Alaska’s national parks. Int. J. Wildland Fire 2008, 17, 463–475. [Google Scholar] [CrossRef]
  71. Picotte, J.J.; Robertson, K. Timing constraints on remote sensing of wildland fire burned area in the southeastern US. Remote Sens. 2011, 3, 1680–1690. [Google Scholar] [CrossRef]
  72. Morresi, D.; Marzano, R.; Lingua, E.; Motta, R.; Garbarino, M. Mapping burn severity in the western Italian Alps through phenologically coherent reflectance composites derived from Sentinel-2 imagery. Remote Sens. Environ. 2022, 269, 112800. [Google Scholar] [CrossRef]
  73. Chen, D.; Loboda, T.V.; Hall, J.V. A systematic evaluation of influence of image selection process on remote sensing-based burn severity indices in North American boreal forest and tundra ecosystems. ISPRS J. Photogramm. Remote Sens. 2020, 159, 63–77. [Google Scholar] [CrossRef]
  74. van Bellen, S.; Garneau, M.; Bergeron, Y. Impact of climate change on forest fire severity and consequences for carbon stocks in boreal forest stands of Quebec, Canada: A synthesis. Fire Ecol. 2010, 6, 16–44. [Google Scholar] [CrossRef]
  75. Scott, A.C.; Bowman, D.M.J.S.; Bond, W.J.; Pyne, S.J.; Alexander, M.E. Fire on Earth. An introduction; Wiley Blackwell: Chichester, UK, 2014. [Google Scholar]
  76. Hansen, W.D.; Winslow Krawchuk, M.A.; Trugman, A.T.; Williams, A.P. The dynamic temperate and boreal fire and forest-ecosystem simulator (DYNAFFOREST): Development and evaluation. Environ. Model. Softw. 2022, 156, 105473. [Google Scholar] [CrossRef]
  77. Remy, C.C.; Magne, G.; Stivrins, N.; Aakala, T.; Asselin, H.; Seppä, H.; Luoto, T.; Jasiunas, N.; Ali, A.A. Climatic and vegetational controls of Holocene wildfire regimes in the boreal forest of northern Fennoscandia. J. Ecol. 2023, 111, 845–860. [Google Scholar] [CrossRef]
  78. Trang, P.T. Forest Fire in the Tropical Montane Forests of Northern Vietnam. Ph.D. Thesis, College of Science, Health, Engineering and Education, Murdoch University, Melville, Australia, January 2023. Available online: https://researchportal.murdoch.edu.au/esploro/outputs/doctoral/Forest-fire-in-the-tropical-montane/991005548666607891?institution=61MUN_INST&skipUsageReporting=true&skipUsageReporting=true&recordUsage=false&recordUsage=false#file-0 (accessed on 12 December 2024).
  79. Guo, L.; Li, S.; Wu, Z.; Parsons, R.A.; Lin, S.; Wu, B.; Sun, L. Assessing spatial patterns and drivers of burn severity in subtropical forests in Southern China based on Landsat 8. For. Ecol. Manag. 2022, 524, 120515. [Google Scholar] [CrossRef]
  80. Furlaud, J.; Prior, L.D.; Williamson, G.J.; Bowman, D.M.J.S. Bioclimatic drivers of fire severity across the Australian geographical range of giant Eucalyptus forests. J. Ecol. 2021, 109, 2514–2536. [Google Scholar] [CrossRef]
  81. Chuvieco, E.; Giglio, L.; Justice, C. Global characterization of fire activity: Toward defining fire regimes from Earth observation data. Glob. Change Biol. 2008, 14, 1488–1502. [Google Scholar] [CrossRef]
  82. Zúñiga-Vásquez, J.M.; Cisneros-González, D.; Pompa-García, M.; Rodríguez-Trejo, D.A.; Pérez-Verdín, G. Modelación espacial de incendios forestales en México: Una integración de dos bases de datos. Bosque 2017, 38, 563–574. [Google Scholar] [CrossRef]
  83. Vega-Nieva, D.J.; Nava-Miranda, M.G.; Calleros-Flores, E.; López-Serrano, P.M.; Briseño-Reyes, J.; López-Sánchez, C.; Corral-Rivas, J.J.; Montiel-Antuna, E.; Cruz-Lopez, M.I.; Ressl, R.; et al. Temporal patterns of active fire density and its relationship with a satellite fuel greenness index by vegetation type and region in Mexico during 2003–2014. Fire Ecol. 2019, 15, 28. [Google Scholar] [CrossRef]
  84. Vega-Nieva, D.J.; Briseño-Reyes, J.; Nava-Miranda, M.G.; Calleros-Flores, E.; López-Serrano, P.M.; Corral-Rivas, J.J.; Montiel-Antuna, E.; Cruz-López, M.I.; Cuahutle, M.; Ressl, R.; et al. Developing models to predict the number of fire hotspots from an accumulated fuel dryness index by vegetation type and region in Mexico. Forests 2018, 9, 190. [Google Scholar] [CrossRef]
  85. Briones-Herrera, C.I.; Vega-Nieva, D.J.; Monjarás-Vega, N.A.; Flores-Medina, F.; Lopez-Serrano, P.M.; Corral-Rivas, J.J.; Carrillo-Parra, A.; Pulgarin-Gámiz, M.Á.; Alvarado-Celestino, E.; González-Cabán, A.; et al. Modeling and Mapping Forest Fire Occurrence from Aboveground Carbon Density in Mexico. Forests 2019, 10, 402. [Google Scholar] [CrossRef]
  86. Monjarás-Vega, N.A.; Briones-Herrera, C.I.; Vega-Nieva, D.J.; Calleros-Flores, E.; Corral-Rivas, J.J.; López-Serrano, P.M.; Pompa-García, M.; Rodríguez-Trejo, D.A.; Carrillo-Parra, A.; González-Cabán, A.; et al. Predicting forest fire kernel density at multiple scales with geographically weighted regression in Mexico. Sci. Total. Environ. 2020, 718, 137313. [Google Scholar] [CrossRef]
  87. Vega-Nieva, D.J.; Briseño-Reyes, J.; López-Serrano, P.-M.; Corral-Rivas, J.J.; Pompa-García, M.; Cruz-López, M.I.; Cuahutle, M.; Ressl, R.; Alvarado-Celestino, E.; Burgan, R.E. Autoregressive Forecasting of the Number of Forest Fires Using an Accumulated MODIS-Based Fuel Dryness Index. Forests 2024, 15, 42. [Google Scholar] [CrossRef]
  88. Challenger, A.; Soberón, J. Los ecosistemas terrestres. In Capital Natural de México. Vol. I. Estado de Conservación y Tendencias de Cambio; Soberón, J., Halffter, G., Llorente-Bousquets, J., Eds.; Comisión Nacional para el Conocimiento y Uso de la Biodiversidad, México D.F: Mexico City, Mexico, 2009; pp. 87–108. Available online: https://www.academia.edu/5173175/Los_Ecosistemas_terrestres_de_M%C3%A9xico (accessed on 25 October 2024).
  89. Jardel-Peláez, E.J.; Pérez-Salicrup, D.; Alvarado, E.; Morfín-Ríos, J.E. Principios y criterios para el manejo del fuego en ecosistemas forestales: Guía de Campo; Comisión Nacional Forestal: Zapopan, Jalisco, México, 2014; pp. 1–96. Available online: http://www.conafor.gob.mx:8080/biblioteca/ver.aspx?articulo=727 (accessed on 12 July 2024).
  90. Briones-Herrera, C.I.; Vega-Nieva, D.J.; Monjarás-Vega, N.A.; Briseño-Reyes, J.; López-Serrano, P.M.; Corral-Rivas, J.J.; Alvarado-Celestino, E.; Arellano-Pérez, S.; Álvarez-González, J.G.; Ruiz-González, A.D.; et al. Near real-time automated early mapping of the perimeter of large forest fires from the aggregation of VIIRS and MODIS active fires in Mexico. Remote Sens. 2020, 12, 2061. [Google Scholar] [CrossRef]
  91. Cruz-López, M.I.; Manzo-Delgado, L.d.L.; Aguirre-Gómez, R.; Chuvieco, E.; Equihua-Benítez, J.A. Spatial Distribution of Forest Fire Emissions: A Case Study in Three Mexican Ecoregions. Remote Sens. 2019, 11, 1185. [Google Scholar] [CrossRef]
  92. Manzo-Delgado, L.L.; López-García, J. Spatial and temporal analyses of burned areas 1998, 2003 and 2015 in Montes Azules Biosphere Reserve, Chiapas, Mexico. Bosque 2020, 41, 11–24. [Google Scholar] [CrossRef]
  93. Flores-Rodríguez, A.G.; Flores-Garnica, J.G.; González-Eguiarte, D.R.; Gallegos-Rodríguez, A.; Zarazúa-Villaseñor, P.; Mena-Munguía, S. Comparative analysis of spectral indices to locate and size levels of severity of forest fires. Investig. Geográficas 2021, 106, e60396. [Google Scholar] [CrossRef]
  94. Flores-Garnica, J.G.; Flores-Rodríguez, A.G. Detección de niveles de severidad de incendios forestales a través de imágenes de satélite. In Ciência e Tecnologia para o Desenvolvimento Ambiental, Cultural e Socioeconômico, III ed.; Artemis: Curitiba, Brasil, 2023; pp. 105–114. [Google Scholar] [CrossRef]
  95. Rzedowski, J.; McVaugh, R. La Vegetación de la Nueva Galicia; Contributions from the University of Michigan Herbarium: Ann Arbor, MI, USA, 1966; Volume 9, pp. 1–123. [Google Scholar]
  96. Valdivia, O.L. Caracterización de los procesos geológico-geomorfológicos y clasificación del relieve de la Sierra La Primavera. In Diversidad volcánica y geopatrimonio en la Sierra La Primavera; González, L., Valdivia, L., Gómez, J.H., Eds.; Universidad de Guadalajara: Guadalajara, Jalisco, México, 2018; pp. 43–136. [Google Scholar]
  97. Schug, F.; Bar-Massada, A.; Carlson, A.R.; Cox, H.; Hawbaker, T.J.; Helmers, D.; Hostert, P.; Kaim, D.; Kasraee, N.K.; Martinuzzi, S.; et al. The global wildland–urban interface. Nature 2023, 621, 94–99. [Google Scholar] [CrossRef] [PubMed]
  98. Silva-Cardoza, A.I.; Vega-Nieva, D.J.; López-Serrano, P.M.; Corral-Rivas, J.J.; Briseño-Reyes, J.; Briones-Herrera, C.I.; Loera-Medina, J.C.; Parra-Aguirre, E.; Rodríguez-Trejo, D.A.; Jardel-Peláez, E. Metodología para la evaluación de la severidad de incendios forestales en campo, en ecosistemas de bosque templado de México. Universidad Juárez del Estado de Durango, Universidad Autónoma Chapingo, Universidad de Guadalajara. Tech. Rep. “Reforzamiento al sistema nacional de predicción de peligro de incendios forestales de México para el pronóstico de conglomerados y área quemada” CONAFOR-CONACYT-2018-C02-B-S-131553, México. 2021. Available online: http://forestales.ujed.mx/incendios2/php/publicaciones_documentos/7_3_Silva%20et%20al%2020211201_Metodologia_severidad_v1.pdf (accessed on 14 May 2025).
  99. Varner, J.M.; Hood, S.M.; Aubrey, D.P.; Yedinak, K.; Hiers, J.K.; Jolly, W.M.; Shearman, T.M.; McDaniel, J.K.; O’Brien, J.J.; Rowell, E.M. Tree crown injury from wildland fires: Causes, measurement, and ecological and physiological consequences. New Phytol. 2021, 231, 1676–1685. [Google Scholar] [CrossRef] [PubMed]
  100. Vega, J.A.; Fontúrbel, T.; Fernández, C.; Díaz-Raviña, M.; Carballas, T.; Martín, A.; González-Prieto, S.; Merino, A.; Benito, E. Acciones urgentes contra la erosión en áreas forestales quemadas: Guía para su planificación en Galicia. Galicia, España. Andavira 2013, 1–140. Available online: https://www.researchgate.net/publication/281268369_Acciones_urgentes_contra_la_erosion_en_areas_forestales_quemadas_Guia_para_su_planificacion_en_Galicia (accessed on 14 May 2025).
  101. CONABIO. Comisión Nacional para el Conocimiento de la Biodiversidad. Sistema de Alerta Temprana de Incendios Forestales (SATIF) para México y Centroamérica. 2021. Available online: http://incendios-beta.conabio.gob.mx/ (accessed on 15 July 2021).
  102. Gorelick, N.; Hancher, M.; Dixon, M.; Ilyushchenko, S.; Thau, D.; Moore, R. Google Earth Engine: Planetary-scale geospatial analysis for everyone. Remote Sens. Environ. 2017, 202, 18–27. [Google Scholar] [CrossRef]
  103. Perilla, G.A.; Mas, J.-F. Google Earth Engine (GEE): Una poderosa herramienta que vincula el potencial de los datos masivos y la eficacia del procesamiento en la nube. Investig. Geográficas 2020, 101, e59929. [Google Scholar] [CrossRef]
  104. QGIS Development Team. QGIS Geographic Information System. Open Source Geospatial Foundation Project. 2019. Available online: http://qgis.osgeo.org (accessed on 23 November 2023).
  105. Briones-Herrera, C.I.; Silva-Cardoza, A.I.; Vega-Nieva, D.J.; Briseño-Reyes, J. Manual de usuario de las herramientas de mapeo de área quemada y severidad de incendios forestales a partir de imágenes Sentinel. Tech. Rep. “Reforzamiento al sistema nacional de predicción de peligro de incendios forestales de México para el pronóstico de conglomerados y área quemada” CONAFOR-CONACYT-2018-C02-B-S-131553, México. 2023. Available online: https://forestales.ujed.mx/incendios2/descargas/Manual_AQ_v1_3_20230401_RV4_CB.pdf (accessed on 14 May 2025).
  106. Gitelson, A.A.; Gritz, Y.; Merzlyak, M.N. Relationships between leaf chlorophyll content and spectral reflectance and algorithms for non-destructive chlorophyll assessment in higher plant leaves. J. Plant Physiol. 2003, 160, 271–282. [Google Scholar] [CrossRef]
  107. Wang, Z.; Liu, J.; Li, J.; Zhang, D.D. Multi-Spectral Water Index (MuWI): A Native 10-m Multi-Spectral Water Index for Accurate Water Mapping on Sentinel-2. Remote Sens. 2018, 10, 1643. [Google Scholar] [CrossRef]
  108. Huang, H.; Roy, D.; Boschetti, L.; Zhang, H.; Yan, L.; Kumar, S.; Gomez-Dans, J.; Li, J. Separability analysis of Sentinel-2A multi-spectral instrument (MSI) data for burned area discrimination. Remote Sens. 2016, 8, 873. [Google Scholar] [CrossRef]
  109. Bastarrika, A.; Chuvieco, E.; Martín, M.P. Mapping burned areas from Landsat TM/ETM+ data with a two-phase algorithm: Balancing omission and commission errors. Remote Sens. Environ. 2011, 115, 1003–1012. [Google Scholar] [CrossRef]
  110. Sims, D.A.; Gamon, J.A. Relationships between leaf pigment content and spectral reflectance across a wide range of species, leaf structures and developmental stages. Remote Sens. Environ. 2002, 81, 337–354. [Google Scholar] [CrossRef]
  111. Gitelson, A.; Merzlyak, M.N. Spectral reflectance changes associated with autumn senescence of Aesculus hippocastanum L. and Acer platanoides L. leaves. Spectral features and relation to chlorophyll estimation. J. Plant Physiol. 1994, 143, 286–292. [Google Scholar] [CrossRef]
  112. Barnes, E.M.; Clarke, T.R.; Richards, S.E.; Colaizzi, P.D.; Haberland, J.; Kostrzewski, M.; Waller, P.; Choi, C.; Riley, E.; Thompson, T. Coincident detection of crop water stress, nitrogen status and canopy density using ground based multispectral data. In Proceedings of the Fifth International Conference on Precision Agriculture, Bloomington, MN, USA, 16–19 July 2000; p. 1619. Available online: https://www.researchgate.net/publication/43256762_Coincident_detection_of_crop_water_stress_nitrogen_status_and_canopy_density_using_ground_based_multispectral_data (accessed on 22 June 2024).
  113. Tucker, C.J. Red and photographic infrared linear combinations for monitoring vegetation. Remote Sens. Environ. 1979, 8, 127–150. [Google Scholar] [CrossRef]
  114. Hamada, M.A.; Kanat, Y.; Abiche, A.E. Multi-spectral image segmentation based on the K-means clustering. Int. J. Innov. Technol. Explor. Eng. 2019, 9, 1016–1019. [Google Scholar] [CrossRef]
  115. Huete, A.R. Asoil-adjusted vegetation index (SAVI). Remote Sens. Environ. 1988, 25, 295–309. [Google Scholar] [CrossRef]
  116. Huete, A.R.; Didan, K.; Miura, T.; Rodriguez, E.P.; Gao, X.; Ferreira, L.G. Overview of the radiometric and biophysical performance of the MODIS vegetation indices. Remote Sens. Environ. 2002, 83, 195–213. [Google Scholar] [CrossRef]
  117. Gitelson, A.A.; Merzlyak, M.N. Remote sensing of chlorophyll concentration in higher plant leaves. Adv. Space Res. 1998, 22, 689–692. [Google Scholar] [CrossRef]
  118. ESA (European Space Agency). Sentinel-2: Satelilite description: Resolution and Swath. Available online: https://sentinel.esa.int/web/sentinel/missions/sentinel-2/instrument-payload/resolution-and-swath (accessed on 10 January 2021).
  119. Grömping, U. Using R and RStudio for Data Management, Statistical Analysis and Graphics (2nd Edition). J. Stat.Soft., Book. Rev. 2015, 68, 1–7. [Google Scholar] [CrossRef]
  120. RStudio Team. RStudio: Integrated Development for R; RStudio, Inc.: Boston, MA, USA, 2019; Available online: http://www.rstudio.com (accessed on 11 October 2024).
  121. Ryan, T.P. Modern Regression Methods, 2nd ed.; Wiley-Interscience: Hoboken, NJ, USA, 2008; pp. 1–672. [Google Scholar]
  122. Landis, J.R.; Koch, G.G. The measurement of observer agreement for categorical data. Biometría 1977, 33, 159–174. [Google Scholar] [CrossRef]
  123. Pontius, R.G.; Thontteh, O.; Chen, H. Components of information for multiple resolution comparison between maps that share a real variable. Environ. Ecol. Stat. 2008, 15, 111–142. [Google Scholar] [CrossRef]
  124. Delcourt, C.J.F.; Combee, A.; Izbicki, B.; Mack, M.C.; Maximov, T.; Petrov, R.; Rogers, B.M.; Scholten, R.C.; Shestakova, T.A.; van Wees, D.; et al. Evaluating the differenced normalized burn ratio for assessing fire severity using Sentinel-2 imagery in Northeast Siberian Larch Forests. Remote Sens. 2021, 13, 2311. [Google Scholar] [CrossRef]
  125. Konkathi, P.; Shetty, A. Assessment of burn severity using different fire indices: A case study of Bandipur National Park. In IEEE Recent Advances in Geoscience and Remote Sensing: Technologies, Standards and Applications (TENGARSS); IEEE: Los Alamitos, CA, USA, 2019; pp. 151–154. [Google Scholar] [CrossRef]
  126. Hoy, E.E.; French, N.H.; Turetsky, M.R.; Trigg, S.N.; Kasischke, E.S. Evaluating the potential of Landsat TM/ETM+ imagery for assess.ing fire severity in Alaskan black spruce forests. Int. J. Wildland Fire 2008, 17, 500–514. [Google Scholar] [CrossRef]
  127. Schroeder, W.; Oliva, P.; Giglio, L.; Quayle, B.; Lorenz, E.; Morelli, F. Active fire detection using Landsat-8/OLI data. Remote Sens. Environ. 2016, 185, 210–220. [Google Scholar] [CrossRef]
  128. Hu, X.; Ban, Y.; Nascetti, A. Sentinel-2 MSI data for active fire detection in major fire-prone biomes: A multi-criteria approach. Int. J. Appl. Earth Obs. Geoinf. 2021, 101, 102347. [Google Scholar] [CrossRef]
  129. Oliva, P.; Martin, P.; Chuvieco, E. Burned area mapping with MERIS post-fire image. Int. J. Remote Sens. 2011, 32, 4175–4201. [Google Scholar] [CrossRef]
  130. Pereira, J.M.C. Remote sensing of burned areas in tropical savannas. Int. J. Wildland Fire 2003, 12, 259–270. [Google Scholar] [CrossRef]
  131. Chuvieco, E.; Mouillot, F.; Van der Werf, G.R.; San Miguel, J.; Tanase, M.; Koutsias, N.; García, M.; Yebra, M.; Padilla, M.; Gitas, I.; et al. Historical background and current developments for mapping burned area from satellite Earth observation. Remote Sens. Environ. 2019, 225, 45–64. [Google Scholar] [CrossRef]
  132. van Gerrevink, M.J.; Veraverbeke, S. Evaluating the Near and Mid Infrared Bi-Spectral Space for Assessing Fire Severity and Comparison with the Differenced Normalized Burn Ratio. Remote Sens. 2021, 13, 695. [Google Scholar] [CrossRef]
  133. Smith, A.M.S.; Eitel, J.U.H.; Hudak, A.T. Spectral analysis of charcoal on soils: Implications for wildland fire severity mapping methods. Int. J. Wildland Fire 2010, 19, 976–983. [Google Scholar] [CrossRef]
  134. López, M.J.; Caselles, V. Mapping burns and natural reforestation using thematic mapper data. Geocarto Int. 1991, 6, 31–37. [Google Scholar] [CrossRef]
  135. Sobrino, J.A.; Llorens, R.; Fernández, C.; Fernández-Alonso, J.M.; Vega, J.A. Relationship between Soil Burn Severity in Forest Fires Measured In Situ and through Spectral Indices of Remote Detection. Forests 2019, 10, 457. [Google Scholar] [CrossRef]
  136. Peña, M.A.; Martínez, G. Mapeo del daño en bosques incendiados de Chile central, mediante el modelado de índices espectrales ex-ante y ex-pst. Bosque 2021, 42, 205–215. [Google Scholar] [CrossRef]
  137. Rogan, J.; Yool, S.R. Mapping fire-induced vegetation depletion in the Peloncillo Mountains: Arizona and New Mexico. Int. J. Remote Sens. 2001, 22, 3101–3121. [Google Scholar] [CrossRef]
  138. Nasery, S.; Kalkan, K. Burn area detection and burn severity assessment using Sentinel 2 MSI data: The case of Karabağlar district, İzmir/Turkey. Turk. J. Geosci. 2020, 1, 72–77. [Google Scholar]
  139. Veraverbeke, S.; Gitas, I.; Katagis, T.; Polychronaki, A.; Somers, B.; Goossens, R. Assessing post-fire vegetation recovery using red–near infrared vegetation indices: Accounting for background and vegetation variability. ISPRS J. Photogramm. Remote Sens. 2012, 68, 28–39. [Google Scholar] [CrossRef]
  140. Mancilla-Ruiz, D.; Barrera, F.d.l.; González, S.; Huaico, A. The Effects of a Megafire on Ecosystem Services and the Pace of Landscape Recovery. Land 2021, 10, 1388. [Google Scholar] [CrossRef]
  141. Han, A.; Qing, S.; Bao, Y.; Na, L.; Bao, Y.; Liu, X.; Zhang, J.; Wang, C. Short-term effects of fire severity on vegetation based on Sentinel-2 satellite data. Sustainability 2021, 13, 432. [Google Scholar] [CrossRef]
  142. Vega, J.; Jimenez, E.; Vega, D.; Ortiz, L.; Pérez, J.R. Pinus pinaster Ait. tree mortality following wildfire in Spain. For. Ecol. Manag. 2011, 261, 2232–2242. [Google Scholar] [CrossRef]
  143. Rodríguez Trejo, D.A. Incendios de Vegetación: Su Ecología, Manejo e Historia, 1st ed.; UACH, Semarnat, PPCIF, Conafor, Conanp, PNIP, ANCF, AMPF: Texcoco, Mexico, 2015; Volume 1, pp. 893–1705. [Google Scholar]
  144. Furniss, T.J.; Kane, V.R.; Larson, A.J.; Lutz, J.A. Detecting tree mortality with Landsat-derived spectral indices: Improving ecological accuracy by examining uncertainty. Remote Sens. Environ. 2020, 237, 111497. [Google Scholar] [CrossRef]
  145. Fernández-Guisuraga, J.M.; Suárez-Seoane, S.; Calvo, L. Transferability of vegetation recovery models based on remote sensing across different fire regimes. Appl. Veg. Sci. 2020, 23, 441–451. [Google Scholar] [CrossRef]
  146. González-De Vega, S.; De las Heras, J.; Moya, D. Post-Fire Regeneration and Diversity Response to Burn Severity in Pinus halepensis Mill. Forests. Forests 2018, 9, 299. [Google Scholar] [CrossRef]
  147. Fernández-García, V.; Fulé, P.Z.; Marcos, E.; Calvo, L. The role of fire frequency and severity on the regeneration of Mediterranean serotinous pines under different environmental conditions. For. Ecol. Manag. 2019, 444, 59–68. [Google Scholar] [CrossRef]
  148. Sagra, J.; Ferrandis, P.; Plaza-Alvarez, P.A.; Lucas-Borja, M.E.; González-Romero, J.; Alfaro-Sánchez, R.; De las Heras, J.; Moya, D. Regeneration of Pinus pinaster Aiton after prescribed fires: Response to burn timing and biogeographical seed provenance across a climatic gradient. Sci. Total Environ. 2018, 637–638, 1550–1558. [Google Scholar] [CrossRef]
  149. Parsons, A.; Robichaud, P.R.; Lewis, S.A.; Napper, C.; Clark, J.T. Field guide for mapping post-fire soil burn severity. In General Technical Report, RMRS-GTR-243; US Department of Agriculture, Forest Service, Rocky Mountain Research Station: Fort Collins, CO, USA, 2010; 49p. [Google Scholar] [CrossRef]
  150. Beltrán-Marcos, D.; Suárez-Seoane, S.; Fernández-Guisuraga, J.M.; Fernández-García, V.; Pinto, R.; García-Llamas, P.; Calvo, L. Mapping Soil Burn Severity at Very High Spatial Resolution from Unmanned Aerial Vehicles. Forests 2021, 12, 179. [Google Scholar] [CrossRef]
  151. Girona-García, A.; Cretella, C.; Fernández, C.; Robichaud, P.R.; Vieira, D.C.S.; Keizer, J.J. How Much Does It Cost to Mitigate Soil Erosion after Wildfires? J. Environ. Manag. 2023, 334, 117478. [Google Scholar] [CrossRef]
  152. Jones, G.M.; Tingley, M.W. Pyrodiversity and biodiversity: A history, synthesis, and outlook. Divers. Distrib. 2022, 28, 386–403. [Google Scholar] [CrossRef]
  153. Beltrán-Marcos, D.; Suárez-Seoane, S.; Fernández-Guisuraga, J.M.; Fernández-García, V.; Marcos, E.; Calvo, L. Relevance of UAV and sentinel-2 data fusion for estimating topsoil organic carbon after forest fire. Geoderma 2023, 430, 116290. [Google Scholar] [CrossRef]
Figure 1. Location and boundaries of La Primavera Forest protected area and the polygons of the three 2021 wildfires (Canoas, 1–6 April; Volcanes, 13–15 April; Lobera, 8–9 May). Forest, agricultural and urban cover based on [3].
Remotesensing 17 02307 g001
Figure 2. Regression models between the spectral indices and the selected field severity indices. For all cases p < 0.001. OCS = Percentage of tree scorch (ac); SBS = Weighted percentage of soil burn severity (df); FSI2 = Composite Field Severity Index (gi). Severity level: NB = Unburned; LO = Low; ME = Medium; HI = High; EX = Extreme. The colors of the points correspond to the classification of the sample plots based on the spectral index (NB, unburned <10%; LO, low 10–30%; ME, medium 30–60%; HI, high 60–90%; EX, extreme > 90%). The thresholds for the severity classes are shown in Supplementary Table S2. Values in bold refer to the model with the best fit. The dotted red line indicates the best-fit line.
Remotesensing 17 02307 g002
Figure 3. Severity maps of the Canoas (ac), Volcanes (df) and Lobera (gi) fires with the three SFSI. Predicted FSI2, from RBR3c_90_AA (a,d,g); predicted OCS from RBR5nc_90_AA (b,e,h) and predicted SBS from RBR1c_60_p33 (c,f,i) are shown in comparison to field-observed values for FSI2, OCS and SBS, respectively (shown as dots). Thresholds to spectral indices are available in Supplementary Table S3.
Remotesensing 17 02307 g003
Figure 4. Comparison of the areas and percentage by severity class without phenological correction (NC, light gray bars) and with phenological correction (PC, dark gray bars) with the RBR3_90_AA index and FSI2 field index for the (a) Canoas, (b) Volcanes and (c) Lobera fires of 2021 in La Primavera Forest.
Remotesensing 17 02307 g004
Table 1. Spectral fire severity indices (SFSI) and their techniques evaluated in this work. Equations (Eq) are numbered and the corresponding bibliographic references (Ref) are indicated.
Indexes and Techniques 1EqRef
Burn Area Index for Sentinel-2 (BAIS2)
B A I S 21 = ( 1 ( B 6 B 7 B 8 ) / B 4 ) ( ( B 11 B 8 / B 11 + B 8 ) + 1 )   (7)[41]
B A I S 22 = ( 1 ( B 6 B 7 B 8 ) / B 4 ) ( ( B 12 B 8 / B 12 + B 8 ) + 1 )   (8)[41]
B A I S 23 n = ( 1 ( B 6 B 7 B 8 A ) / B 4 ) ( ( B 11 B 8 A / B 11 + B 8 A ) + 1 )   (9)[41]
B A I S 24 n = ( 1 ( B 6 B 7 B 8 A ) / B 4 ) ( ( B 12 B 8 A / B 12 + B 8 A ) + 1 )   (10)[63]
Chlorophyll Index red-edge (CIre)
CIre = (B7 / B5) − 1(11)[106]
Normalized Burn Ratio (NBR)
NBR 1 = (B11 − B12)/(B11 + B12)(12)[61]
NBR 2 = (B8 − B11)/(B8 + B11)(13)[107]
NBR 3 = (B8 − B12)/(B8 + B12)(14)[108]
NBR 4n = (B8A − B11)/(B8A + B11)(15)[109]
NBR 5n = (B8A − B12)/(B8A + B12)(16)[108]
Normalized Difference Index (NDI)
NDI 1re = (B6 − B5)/(B6 + B5 − 2 ∗ B1)(17)[110]
NDI 2re = (B7 − B5)/(B7 + B5 − 2 ∗ B1)(18)[110]
Normalized Difference Vegetation Index (NDVI)
NDVI 1re = (B6 − B5)/(B6 + B5)(19)[111]
NDVI 2re = (B7 − B5)/(B7 + B5)(20)[112]
NDVI 3 = (B8 − B4)/(B8 + B4)(21)[113]
NDVI 4re = (B8 − B5)/(B8 + B5)(22)[110]
NDVI 5re = (B8 − B7)/(B8 + B7)(23)[43]
NDVI 6n = (B8A − B4)/(B8A + B4)(24)[114]
NDVI 7ren = (B8A − B5)/(B8A + B5)(25)[43]
NDVI 8ren = (B8A − B7)/(B8A + B7)(26)[43]
Soil Adjusted Vegetation Index (SAVI)
SAVI = (B8 − B4)/(B8 + B4 + 0.428) ∗ (1.0 + 0.428)(27)[115]
SAVI n = (B8A − B4)/(B8A + B4 + 0.428) ∗ (1.0 + 0.428)(28)
Enhanced Vegetation Index (EVI)
EVI = 2.5 ∗ (B8 − B4)/((B8 + 6.0 ∗ B4 − 7.5 ∗ B2) + 1.0)(29)[116]
EVI n = 2.5 ∗ (B8A − B4)/((B8A + 6.0 ∗ B4 − 7.5 ∗ B2) + 1.0)(26)
Green Normalized Difference Vegetation Index (GNDVI)
GNDVI = (B8 − B03)/(B8 + B3)(30)[117]
GNDVI n = (B8A − B3)/(B8A + B3)(31)
1 Sentinel-2 MSI spectral bands: B1 = ~443 nm, B3 Green = ~560 nm, B4 Red = ~665 nm; red-edge bands (*re): B5 = ~704 nm, B6 = ~740 nm, B7 = ~783 nm; NIR: B8 = ~833 nm, NIR narrow: (*n): B8A = ~865 nm, SWIR: B11 = ~1613 nm, B12 = ~2202 nm. Spatial resolution bands = 20 m (B1, B4 and B8 were resampled) [118].
Table 2. Results of the regression analysis of spectral severity indices (SFSI) with field-based indices (OCS, SBS and FSI2). The ten SFSIs with the highest R2 values and lowest RMSE are shown in each case.
Percentage of Scorch of the Tree Stratum (OCS)
IndexTCIRβ0β1R2RMSE
RBR3c90AA0.90636.1834.2930.82084.292
RBR5nc90AA0.90237.7984.1920.81483.867
dBAIS22c90p33−0.90121.950−2.4720.81249.964
RBR3c60AA0.90139.5054.0720.81286.653
dBAIS22c90p25−0.89720.291−2.4550.80550.79
RBR5nc60AA0.89739.7834.010.80586.621
RBAIS22c90p33−0.89725.006−2.8330.80458.695
dBAIS24nc90p33−0.89621.173−2.4300.80450.442
dBAIS22c60p33−0.89615.550−2.4750.80351.44
dBAIS22c90p20−0.89412.146−2.4090.79950.68
Burned Soil Severity Index (SBS)
RBR1c60p330.7875.1112.7100.61959.945
RBR1c60p200.7868.0702.7810.61861.645
RBR1c90AA0.78535.5152.5380.61756.457
dNBR1c30p330.78314.3933.6540.61481.783
RBR1c30p330.78411.7672.8550.61463.834
dNBR1c60p200.78310.0953.6320.61481.339
RBR1c90p250.784−3.6212.7180.61460.752
RBR1c60AA0.78435.1252.6170.61458.493
dNBR1c60p330.7836.3993.5230.61378.978
RBR1c60p250.7836.6052.7400.61361.453
Field Severity Index (FSI2)
RBR3c90AA0.916.3055.080.82782.573
RBR3c60AA0.9088.9325.1010.82483.907
RBR5nc90AA0.9088.34.960.82481.607
RBR5nc60AA0.9059.534.9910.81983.366
RBR5nc30p250.904−30.3375.4880.81792.513
RBR5nc30p330.904−28.4555.4650.81692.248
RBR5nc30p200.903−28.9525.470.81592.672
RBR3c30AA0.90314.7784.8710.81582.658
RBR3c30p250.902−29.0375.5260.81494.087
RBR3c60p330.902−50.2565.5350.81394.498
T, time window (days); CI, image composite production techniques; β0, intercept and β1, slope of linear regression curves; R2, coefficient of determination; RMSE, root mean square error. The letter “c” in the index corresponds to phenologically corrected models. Values in bold refer to the model with the spectral indices that best fit the field indices with the criteria of high R2 and lowest RMSE.
Table 3. Agreement between the spectral indices RBR3c_90_AA, RBR5nc_90_AA and RBR1c_60_p33 and the field severity indices (FFSI) OCS, SBS and FSI2 for the sampling plots (%A, percentage of agreement; KIA: Kappa index; KIAw, weighted Kappa index).
FFSIRBR3cRBR5ncRBR1c
%AKIAKIAw%AKIAKIAw%AKIAKIAw
CCA60.000.490.7759.000.470.7660.000.490.72
SBS48.000.320.5351.000.360.5549.000.330.57
FSI258.000.480.7358.000.490.7463.000.540.76
Table 4. Kappa index of agreement between the severity maps generated with the spectral indices RBR3c_90_AA (FSI2), RBR5nc_90_AA (OCS) and RBR1c_60_p33 (SBS) for the three fires of 2021 in the La Primavera Forest (C, Canoas; V, Volcanes; L, Lobera).
SeverityRBR3c vs. RBR5ncRBR3c vs. RBR1cRBR5nc vs. RBR1cMean Kappa
CVLCVLCVL
Not burned1.001.001.000.870.950.870.800.910.820.91
Low0.780.780.800.650.600.430.670.620.390.64
Medium0.810.790.840.670.670.880.710.680.890.77
High0.920.690.950.240.350.220.170.110.150.42
Extreme1.001.001.000.040.220.240.020.150.140.42
Overall Kappa0.880.870.910.700.640.750.670.560.700.74
Disclaimer/Publisher’s Note: The statements, opinions and data contained in all publications are solely those of the individual author(s) and contributor(s) and not of MDPI and/or the editor(s). MDPI and/or the editor(s) disclaim responsibility for any injury to people or property resulting from any ideas, methods, instructions or products referred to in the content.

